Article

Potential of Remote Sensing for the Analysis of Mineralization in Geological Studies

1
Laboratory LPHEAG, Faculty of Sciences Semlalia, Cadi Ayyad University, Bd. My Abdellah, P.O. 2390, Marrakech 40000, Morocco
2
Department of Earth Sciences, Faculty of Science and Technology, Cadi Ayyad University, P.O. 549, Av. Abdelkarim Elkhattabi, Gueliz, Marrakech 40000, Morocco
*
Author to whom correspondence should be addressed.
Geomatics 2025, 5(3), 40; https://doi.org/10.3390/geomatics5030040
Submission received: 28 June 2025 / Revised: 17 August 2025 / Accepted: 25 August 2025 / Published: 1 September 2025

Abstract

Multispectral remote sensing offers powerful capabilities for mineral exploration, particularly in regions with complex geological settings. This study investigates the mineralization potential of the Tidili region in Morocco, located between the South Atlasic and Anti-Atlas Major Faults, using Advanced Spaceborne Thermal Emission and Reflection Radiometer (ASTER) imagery to extract hydrothermal alteration zones. Key techniques include band ratio analysis and Principal Components Analysis (PCA), supported by the Crósta method, to identify spectral anomalies associated with alteration minerals such as Alunite, Kaolinite, and Illite. To validate the remote sensing results, field-based geological mapping and mineralogical analysis using X-ray diffraction (XRD) were conducted. The integration of satellite data with ground-truth and laboratory results confirmed the presence of argillic and phyllic alteration patterns consistent with porphyry-style mineralization. This integrated approach reveals spatial correlations between alteration zones and structural features linked to Pan-African and Hercynian deformation events. The findings demonstrate the effectiveness of combining multispectral remote sensing images analysis with field validation to improve mineral targeting, and the proposed methodology provides a transferable framework for exploration in similar tectonic environments.

1. Introduction

Multispectral remote sensing is widely used in mineral exploration due to its ability to detect hydrothermal alteration, lithological changes, and structural features indicative of mineralization [1,2]. Techniques such as band ratio analysis and Principal Components Analysis (PCA) have proven effective in identifying surface mineralogical variations associated with ore deposits [3,4,5]. However, while PCA can map the relative spatial distribution of alteration minerals, it does not fully overcome the limitations of remote sensing in terms of spatial and mineralogical precision. In structurally complex terrains, differentiating mineralized from non-mineralized zones still requires integration with higher-resolution methods such as field validation, petrographic studies, and XRD analysis [6].
In recent years, several studies have demonstrated the potential of integrating remote sensing with ground-based geological and geochemical methods to enhance exploration accuracy [7,8,9,10]. Despite this, many remote sensing studies remain limited to image-based interpretations without field or laboratory validation, leading to uncertainty in anomaly classification and mineral targeting [11,12].
The Tidili region of Morocco, located between the South Atlasic and Anti-Atlas Major Faults, presents a geologically favorable environment for mineralization due to its proximity to Pan-African and Hercynian structural zones and the presence of diverse lithologies. Yet, the region remains underexplored, with little integration between satellite-based mapping and ground-truthing.
This study addresses that gap by applying an integrated exploration approach combining ASTER-based multispectral remote sensing images analysis (including band ratios, PCA, and the Crósta technique) with geological field mapping and X-ray diffraction (XRD) validation. The objective is to identify hydrothermal alteration zones, validate their mineralogical composition, and assess their spatial relationship to regional tectonic structures.
The proposed methodology aims to improve the reliability of alteration mapping in complex terrains and to develop a systematic workflow applicable to similar mineralized provinces. Therefore, this study contributes to bridging the methodological divide between remote sensing and ground validation in mineral exploration.

2. Materials and Methods

2.1. Geological Background

The study area is located in a region between Marrakech and Ouarzazate, to the south of the High Atlas Mountains (see Figure 1), and it is defined based on the geological map of the Douar-çour region at a scale of 1/50,000.
Figure 1 represents the geographic situation of the sector being sampled and studied. Additionally, a three-dimensional representation was produced, allowing for easy observation of the region’s topography. To the northwest of the Tidili region, the Ouzellarh promontory is located, while to the southeast, cretaceous carbonate formations rise above the volcano–sedimentary formations of the Ouarzazate supergroup.
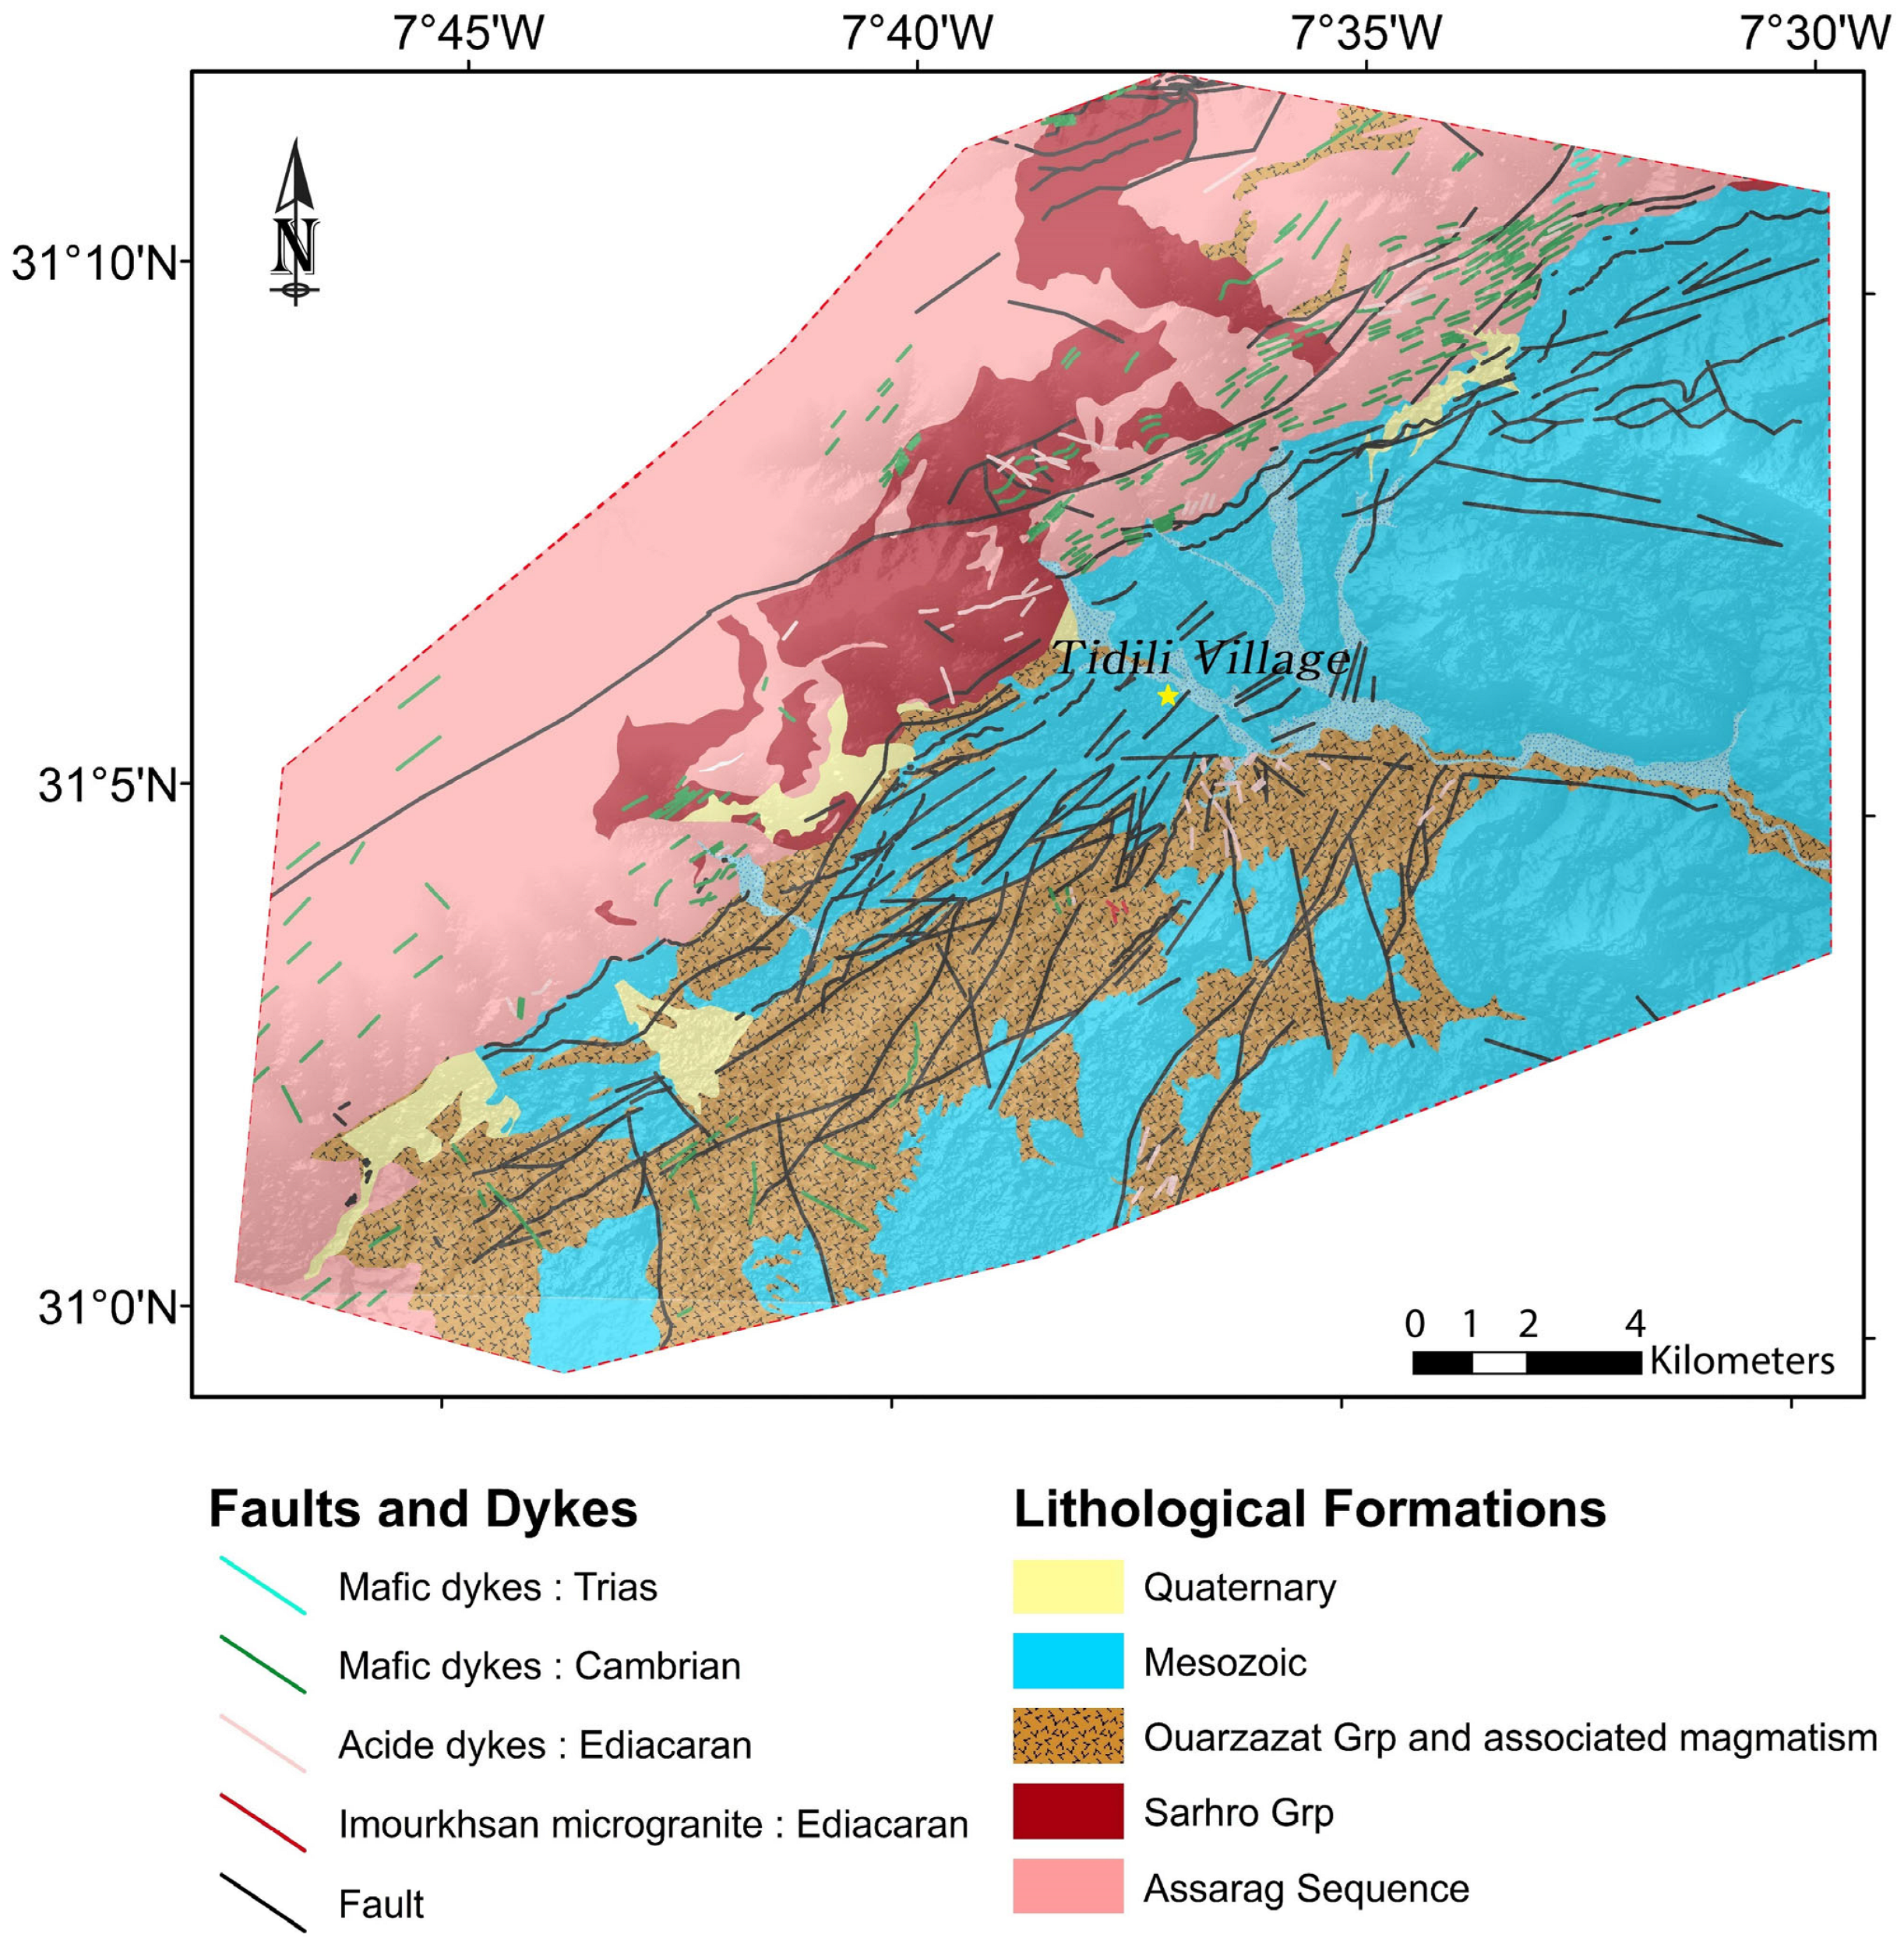
The Tidili region comprises a Precambrian section of the Anti-Atlas situated on the southern slope of the Marrakech High Atlas. Geologically, this area is positioned between two distinct domains: the northern section features Ediacaran granitoids, representing the High Atlasic domain (Ouzellarh), while the southern part belongs to the Anti-Atlasic region defined by the Siroua massif. These two terrains are divided by the South Atlasic fault network, creating a depression where Triassic sedimentary and/or volcanic formations have been deposited at its base (see Figure 2). In this context, the Siroua Massif consists of a Cryogenian-age basement overlain by late Ediacaran and Proterozoic to Meso-Cenozoic cover. The majority of formations found in the Siroua district exhibit an arc tholeiitic character due to Ediacaran and Late Proterozoic volcanic activity, resulting from a subduction belt associated with the establishment of the Pan-African ophiolites in Siroua. This magmatism is associated with tectonic phases ranging from collisional to extensional processes [14,15,16,17].
The Siroua massif, marking the northern margin of the Anti-Atlas, is bounded to the south by the major Anti-Atlas fault and is overlain by the large Cenozoic volcano of Siroua. This structure delineates two different structural domains that developed during the Pan-African orogeny: a stable southwestern zone corresponding to the West African craton and a mobile northeastern Anti-Atlasic zone [15,19,20]. Additionally, the Ouzellarh promontory and the Siroua massif also play a crucial role in separating the Cenozoic Ouarzazate Basin to the northeast and the Souss Basin to the southwest, which extends to the Atlantic Ocean. Due to their similar elevation, some geologists propose integrating them into a single geological feature called the “Ouzellarh-Siroua Promontory” [21]. The stratigraphic and structural analysis of the Triassic basins in the Tidili basin reveals a Proterozoic–Paleozoic horst separating two half-grabens. ENE–WSW and NNE–SSW fault systems dominate the area, with synsedimentary normal faulting contributing to the asymmetry and subsidence of the basin [22].
Due to its specific location on the border of the High Atlas and Anti-Atlas, this region has undergone a complex geodynamic evolution, spanning from the Neoproterozoic era to the Alpine events. This multiphase history has led to the formation of ores that intersect both temporally and spatially. Known for its favorable geological conditions for precious and base metal deposits (including Hydrothermal Mineralization, Volcanogenic Massive Sulfide (VMS) Deposits, Iron Oxide–Copper–Gold (IOCG) Deposits), this area is regarded as one of the most promising metallogenic regions in the country.

2.2. Remote Sensing Data Processing

This study utilized ASTER imagery, offering unique advantages in spectral and spatial resolution. With 14 spectral bands and resolutions from 15 m (visible and near-infrared) to 90 m (thermal), it is used for advanced mineralogical mapping. A geological map at a scale of 1:50,000 was incorporated to complement and validate remote sensing data.
Preprocessing steps were implemented to ensure data reliability and accuracy. These included resolution merging and enhancement algorithms to improve spatial and spectral resolution, along with atmospheric correction and radiometric calibration to minimize interference and standardize reflectance values. All datasets were georeferenced and aligned to the World Geodetic System 1984 coordinate reference system to ensure consistency and quality for spectral analysis.

2.3. Geological Fieldwork

During field missions, numerous samples were collected, with nine representative samples selected for XRD analysis to better understand the mineralogical composition. XRD (X-ray diffraction) was used to identify crystalline phases in solid materials by passing X-rays through the sample. The selection of samples was strategically based on the zonation of hydrothermal alterations identified through remote sensing. This ensured coverage of the entire study area and representation of all observed alteration types, capturing the mineralogical diversity and structural variations in the Tidili region. The integration of remote sensing results with field observations guided the targeted sampling strategy to ensure accurate mineralogical analysis.

2.4. Geochemical Analysis

This study primarily relies on geological and remote sensing methods, with statistical techniques applied to enhance rigor. Uncertainty quantification methods were used to validate spectral data, including calculating confidence intervals for band ratio results and assessing variability. Statistical controls in XRD analysis were implemented by comparing results from replicate samples for consistency. Additionally, Principal Components Analysis (PCA) was utilized to reduce data dimensionality and quantify relationships between spectral bands and mineral indicators.

2.5. Crósta Method

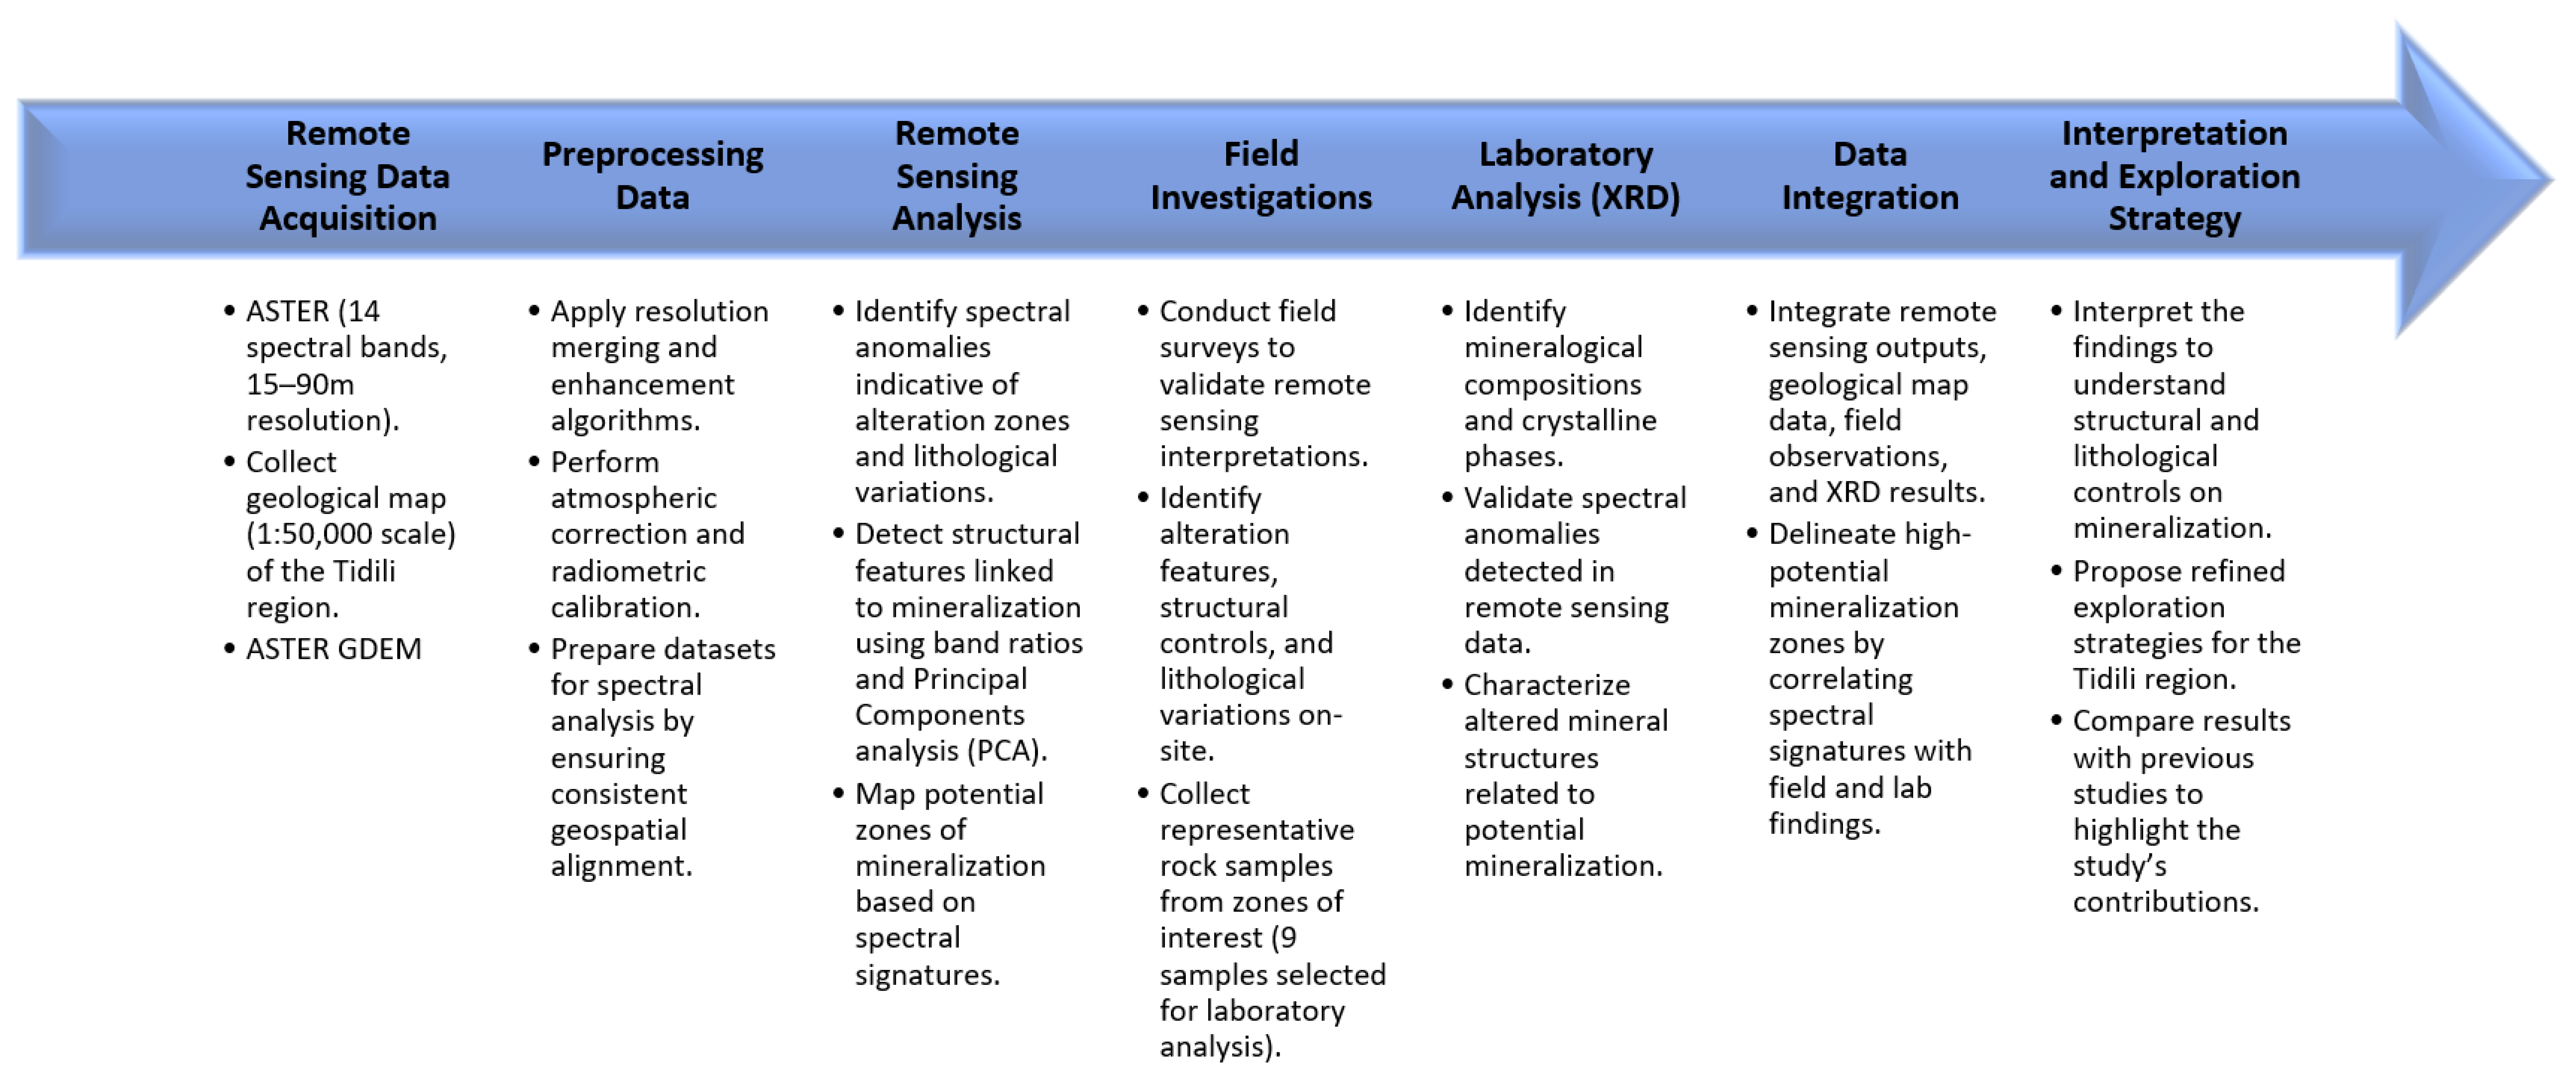
The Crósta technique, first introduced by [23], is a widely used method in remote sensing for detecting hydrothermal alteration minerals associated with mineral deposits. It is based on Principal Components Analysis (PCA) applied selectively to specific spectral bands that are sensitive to alteration minerals, particularly those exhibiting absorption features in the shortwave infrared (SWIR) region. By isolating these bands, the method enhances subtle spectral variations linked to clays and hydroxyl-bearing minerals such as Alunite, Kaolinite, and Illite. The resulting Principal Components images reveal areas of anomalous spectral behavior, allowing efficient mapping of alteration zones and potential mineralization targets. The Crósta method is especially valuable in arid and semi-arid environments, where surface exposures are optimal for remote sensing analysis. An overview of the integrated methodological workflow used in this study is illustrated in Figure 3, summarizing the remote sensing, field, and laboratory techniques employed.

3. Case Study

3.1. Image Ratios

To detect key minerals or mineral groups in hydrothermal alteration systems, specific band ratios from multispectral satellite data are calculated. These ratios help spatially localize alteration zones and, when combined with age and overlap data, offer temporal insights [24]. Key minerals such as iron oxides and clay minerals are identified using these ratios. For instance, ASTER ratios like 4/2, 4/5, and 5/7 [25] highlight iron oxides and clay minerals, while the 6/4 ratio is effective for detecting hydrothermal alteration zones [1,4,5]. These ratios are selected based on the specific reflectance or absorption properties of the minerals being targeted, ensuring accurate identification and mapping of alteration zones.

3.1.1. Ferrous Silicates and Weathering Minerals

The ratios presented do not allow for a clear discrimination of alteration minerals (such as clays) due to the lack of a distinct band in the SWIR region for Landsat 9 and Sentinel-2. In Figure 4, bands 1, 2, 3, 4, 5, 6, and 7 of Landsat 9 correspond respectively to bands 1, 2, 3, 4, 8, 11, and 12 of Sentinel-2. It is therefore observed that the four minerals exhibit the same behavior in bands 6 and 7 of Landsat 9.
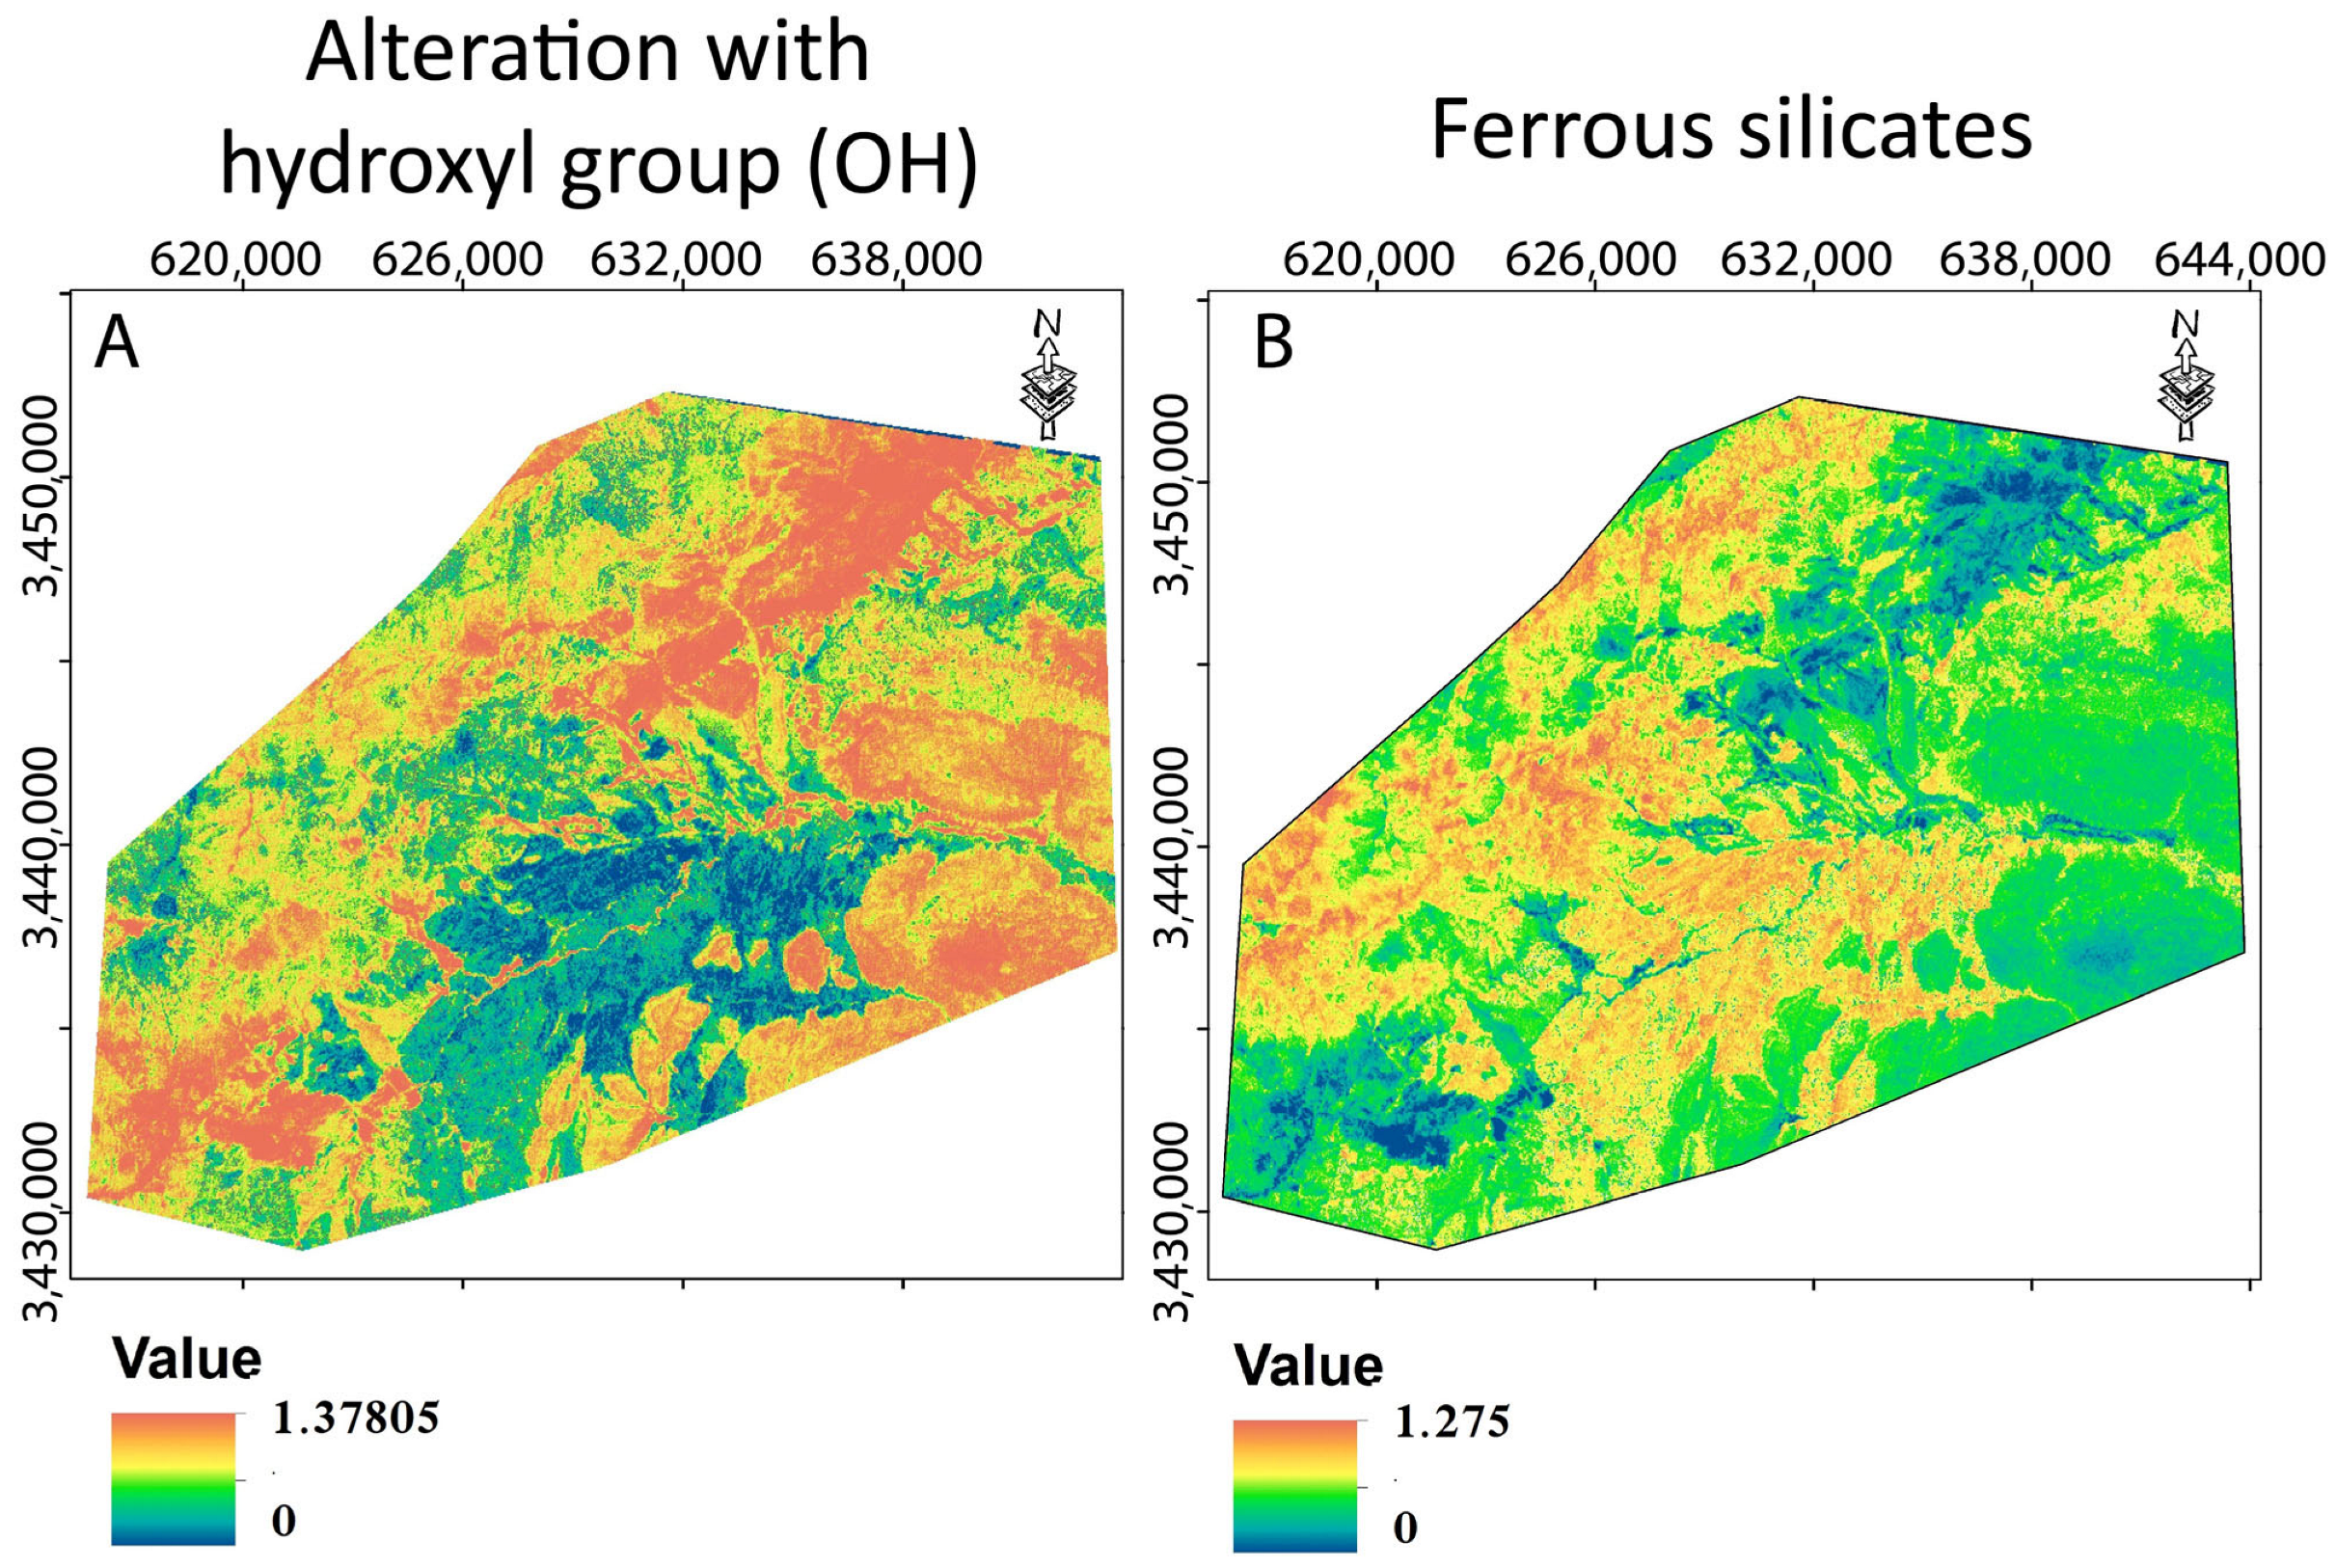
The ratios in Figure 5 highlight altered zones and distinguish them from weakly altered volcanic rocks. Intense hydrothermal alteration follows a southwest–northeast trend along the valley’s northern flank, with a strong presence of alteration minerals near the rhyolitic intrusion in both the southeast and northwest. This alteration within the volcano–sedimentary formations is marked by a high concentration of clay minerals and a lower presence of ferrous silicates compared to the surrounding unaltered formations.

3.1.2. Gossans, Lithocap, and All Oxides

The ratios presented in Figure 6 are designed to identify areas rich in iron oxides, known as gossans. Gossans are characterized by a high iron content resulting from the alteration of initially present sulphides in the rock. Their location can help identify old mineralization that may not be altered at depth. In the context of a multispectral study alone, it can be challenging to differentiate genuine gossans from iron oxide-enriched rocks formed by other processes without thorough field studies and geochemical analysis.

3.1.3. Composite Colored Ratios

Colored ratio composites provide a detailed sectoral analysis by simultaneously mapping multiple factors and identifying areas of overlap.
By utilizing spectral band ratios, these composites enhance visualization, distinguishing alteration zones, mineral concentrations, and topographic variations through specific color assignments. This multi-factor mapping approach improves the interpretation of geological relationships, offering a clearer understanding of key features relevant to mineral exploration.
  • Minerals with the AlOH group, advanced clay alteration
Minerals containing the AlOH group, such as Sericite (Muscovite), Kaolinite, Dickite, Pyrophyllite, and Alunite, serve as key indicators of advanced argillic alteration in copper porphyry systems. Their presence signifies significant hydrothermal alteration, aiding in the delineation of potential mineralized zones.
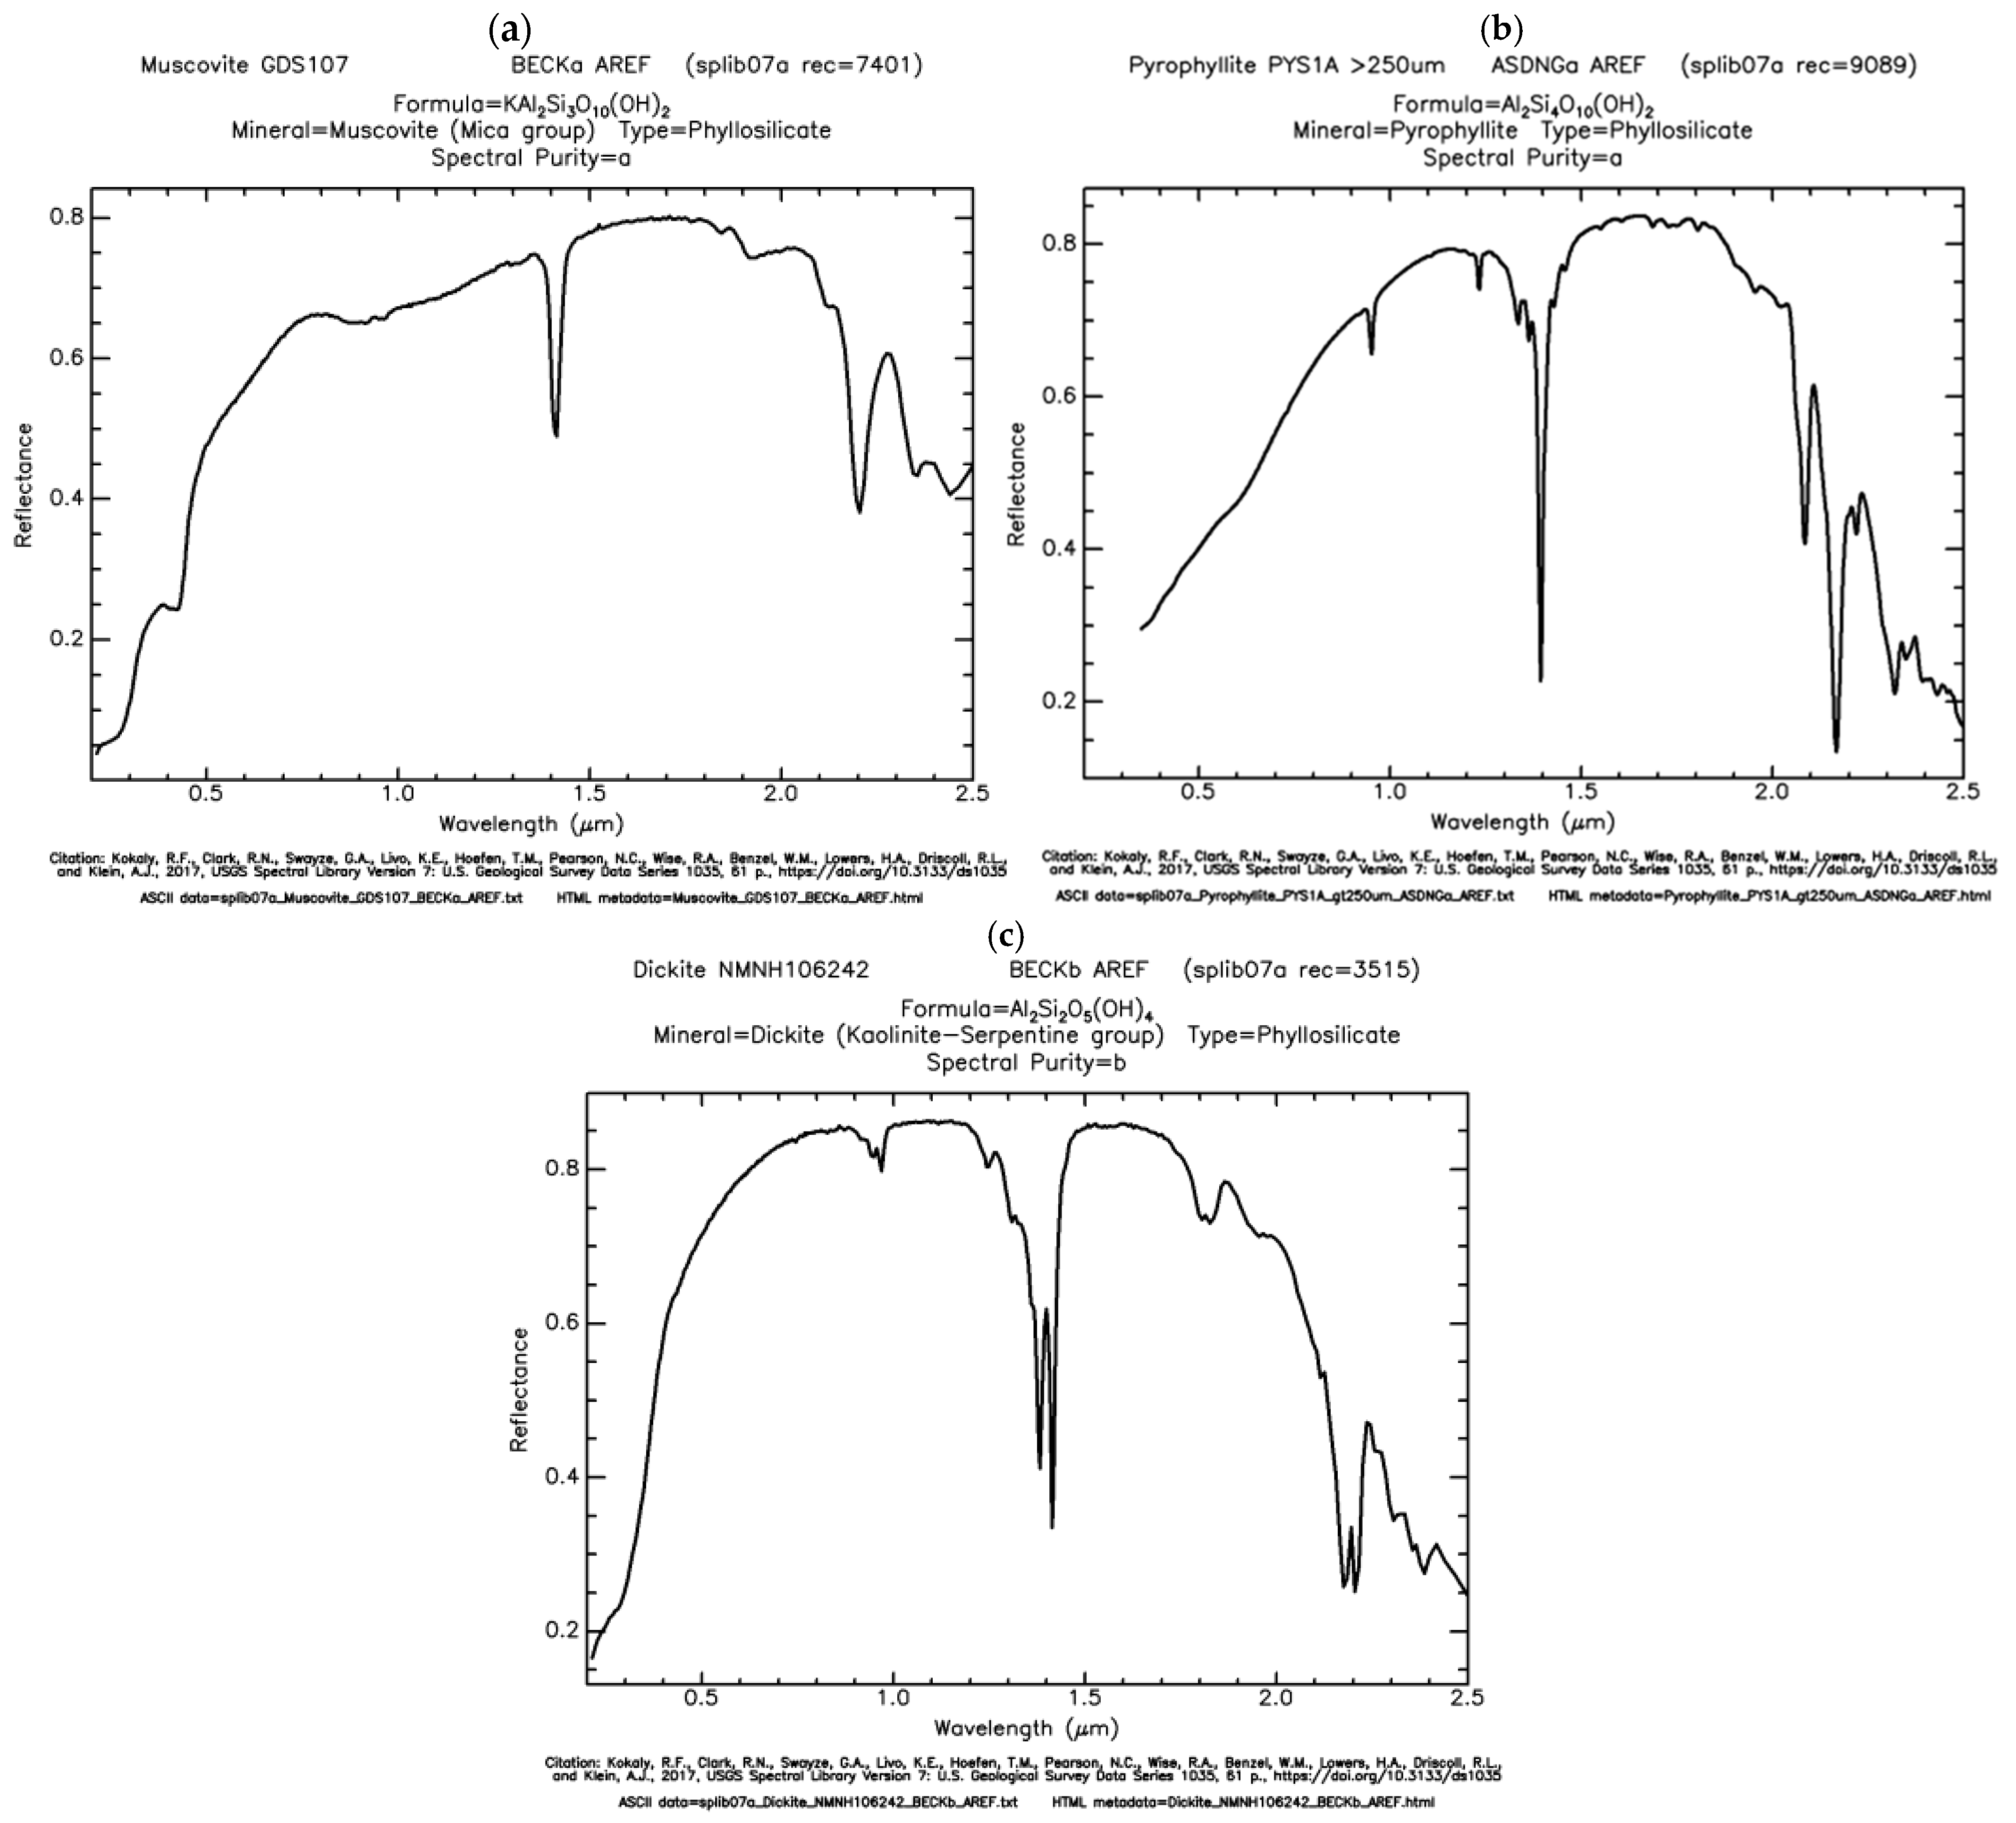
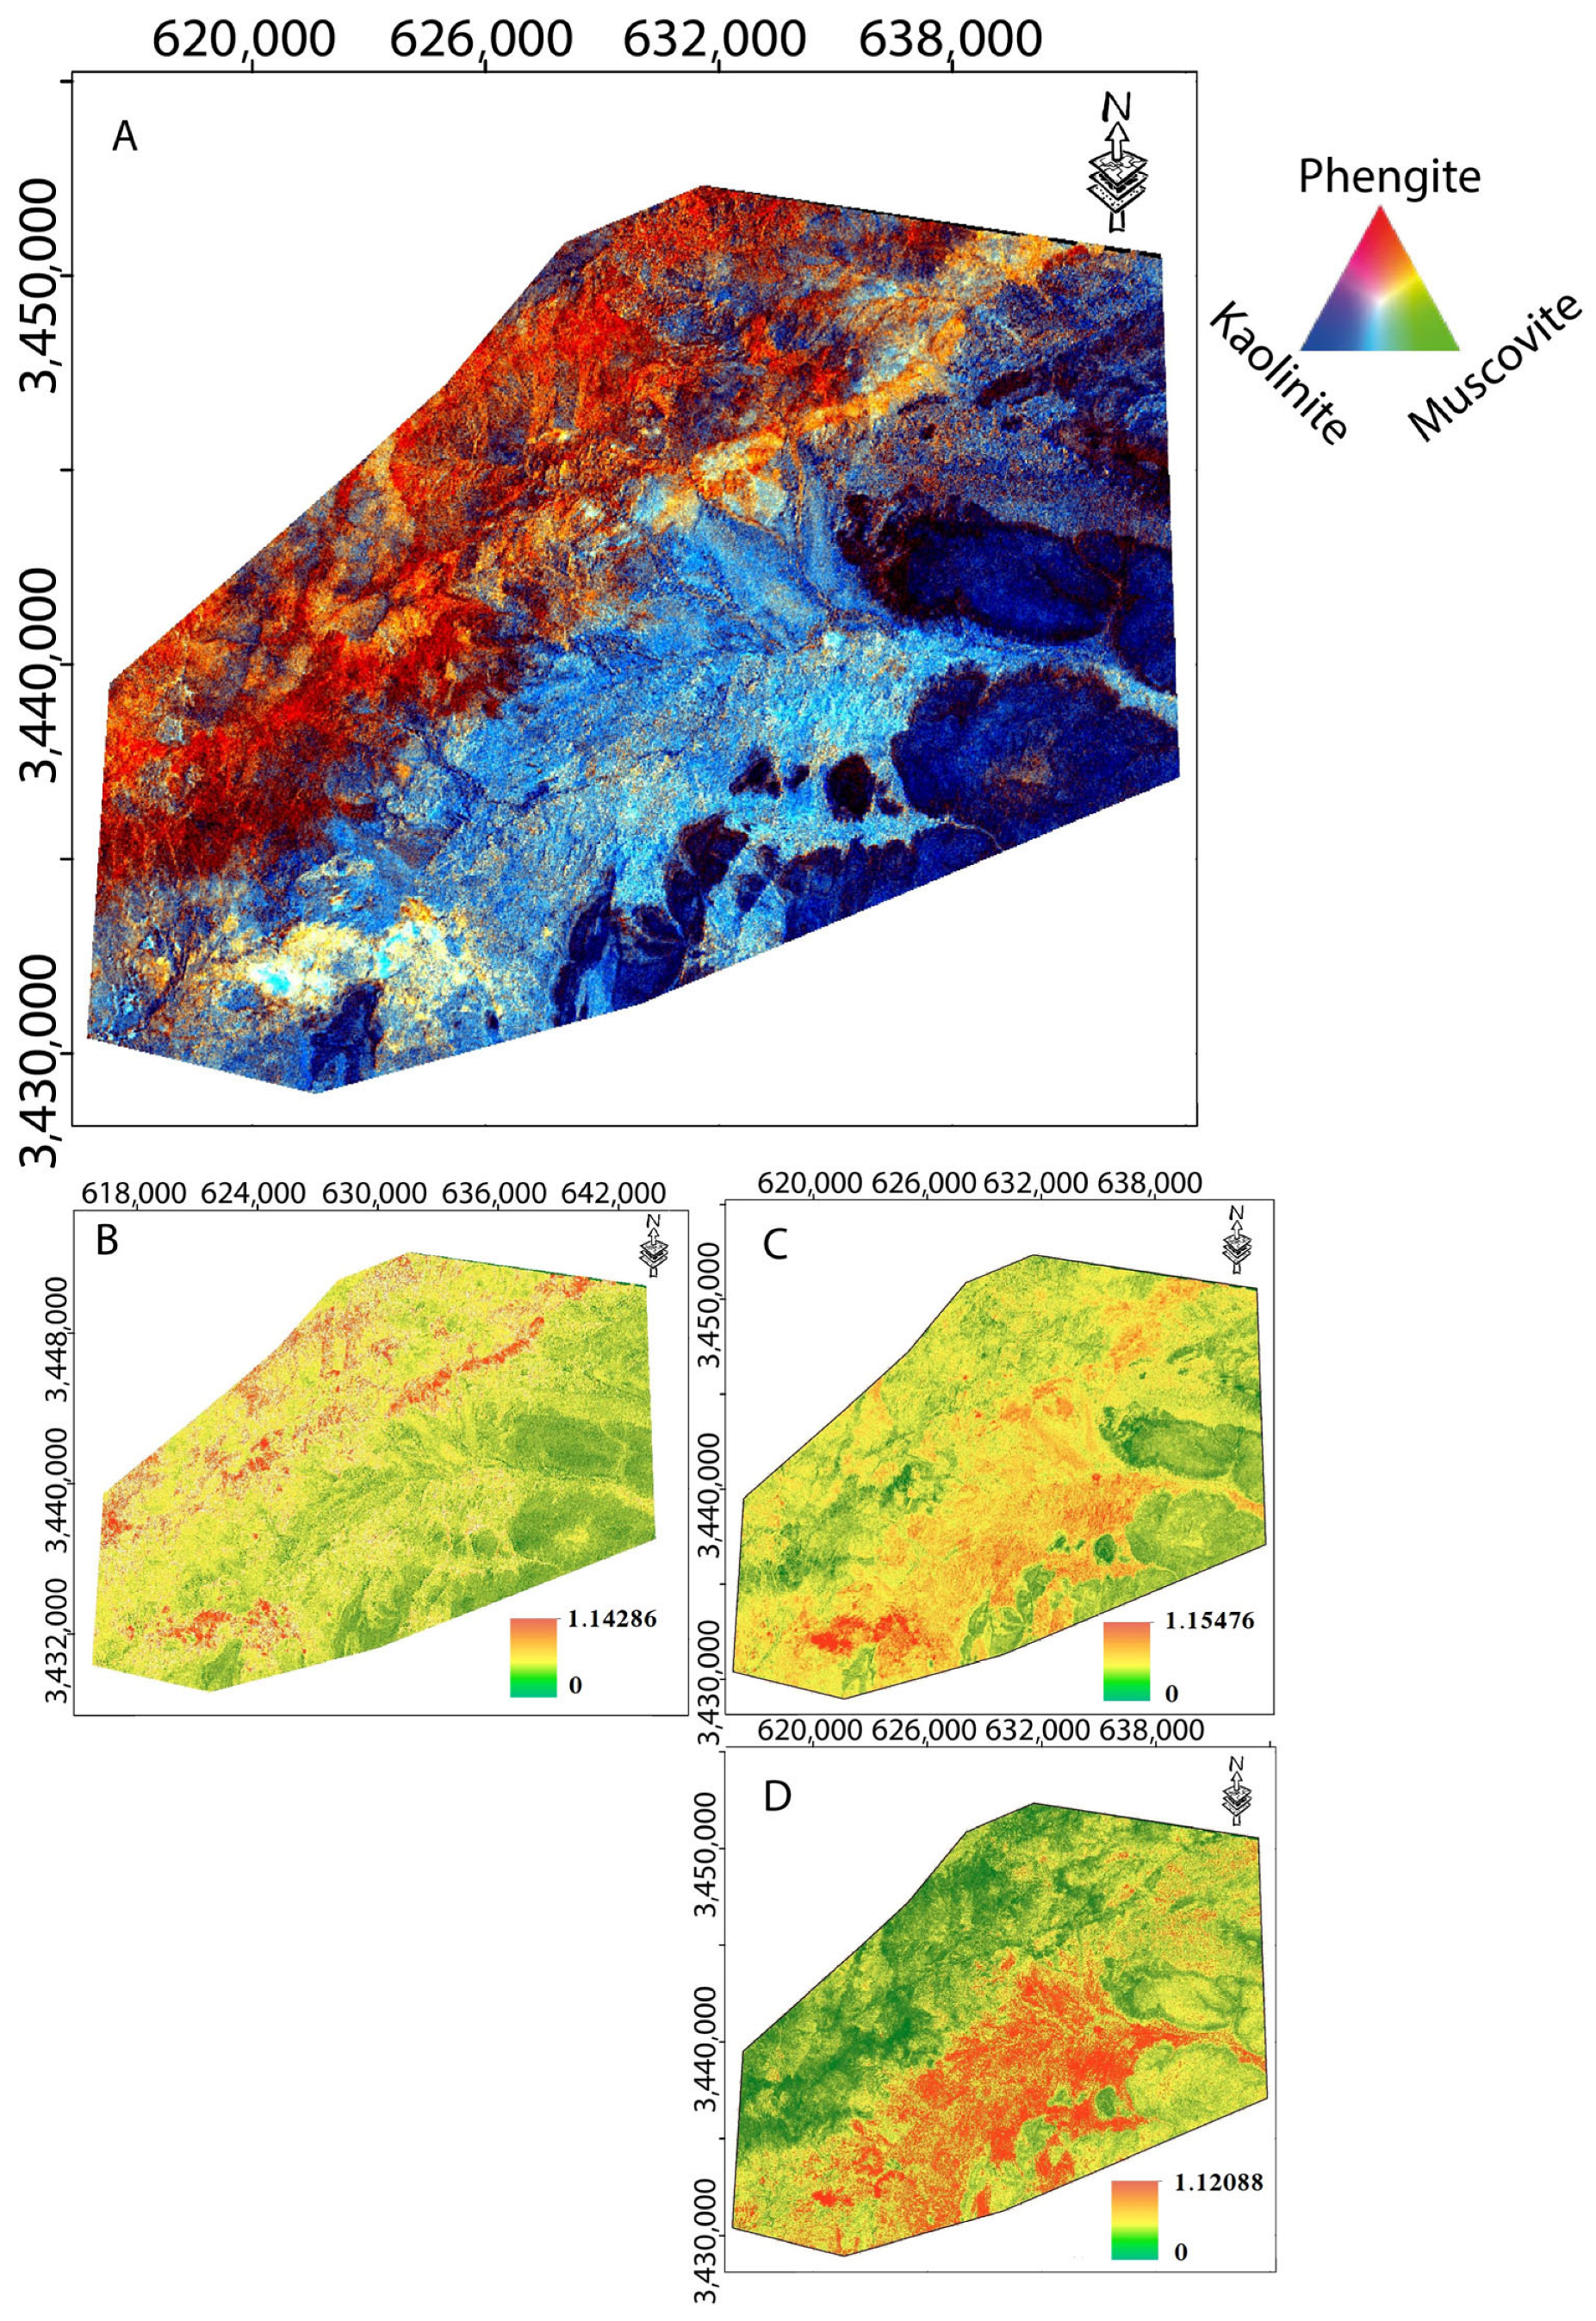
However, in basic multispectral studies, these minerals often appear grouped due to their similar reflectance spectra (Figure 7). To address this, the color composite in Figure 8 incorporates:
-
5/6 ratio for Phengite (Iron- and Magnesium-rich Muscovite)
-
7/6 ratio for Muscovite
-
7/5 ratio for Kaolinite
Light yellow-orange areas on the composite indicate advanced argillic alteration target zones, particularly clustered around the rhyolitic intrusion in the southwest, suggesting hydrothermal activity. This visualization technique enhances multispectral data interpretation, facilitating the identification of potential copper mineralization zones.
  • Gossan, alterations, and “unaltered” rocks
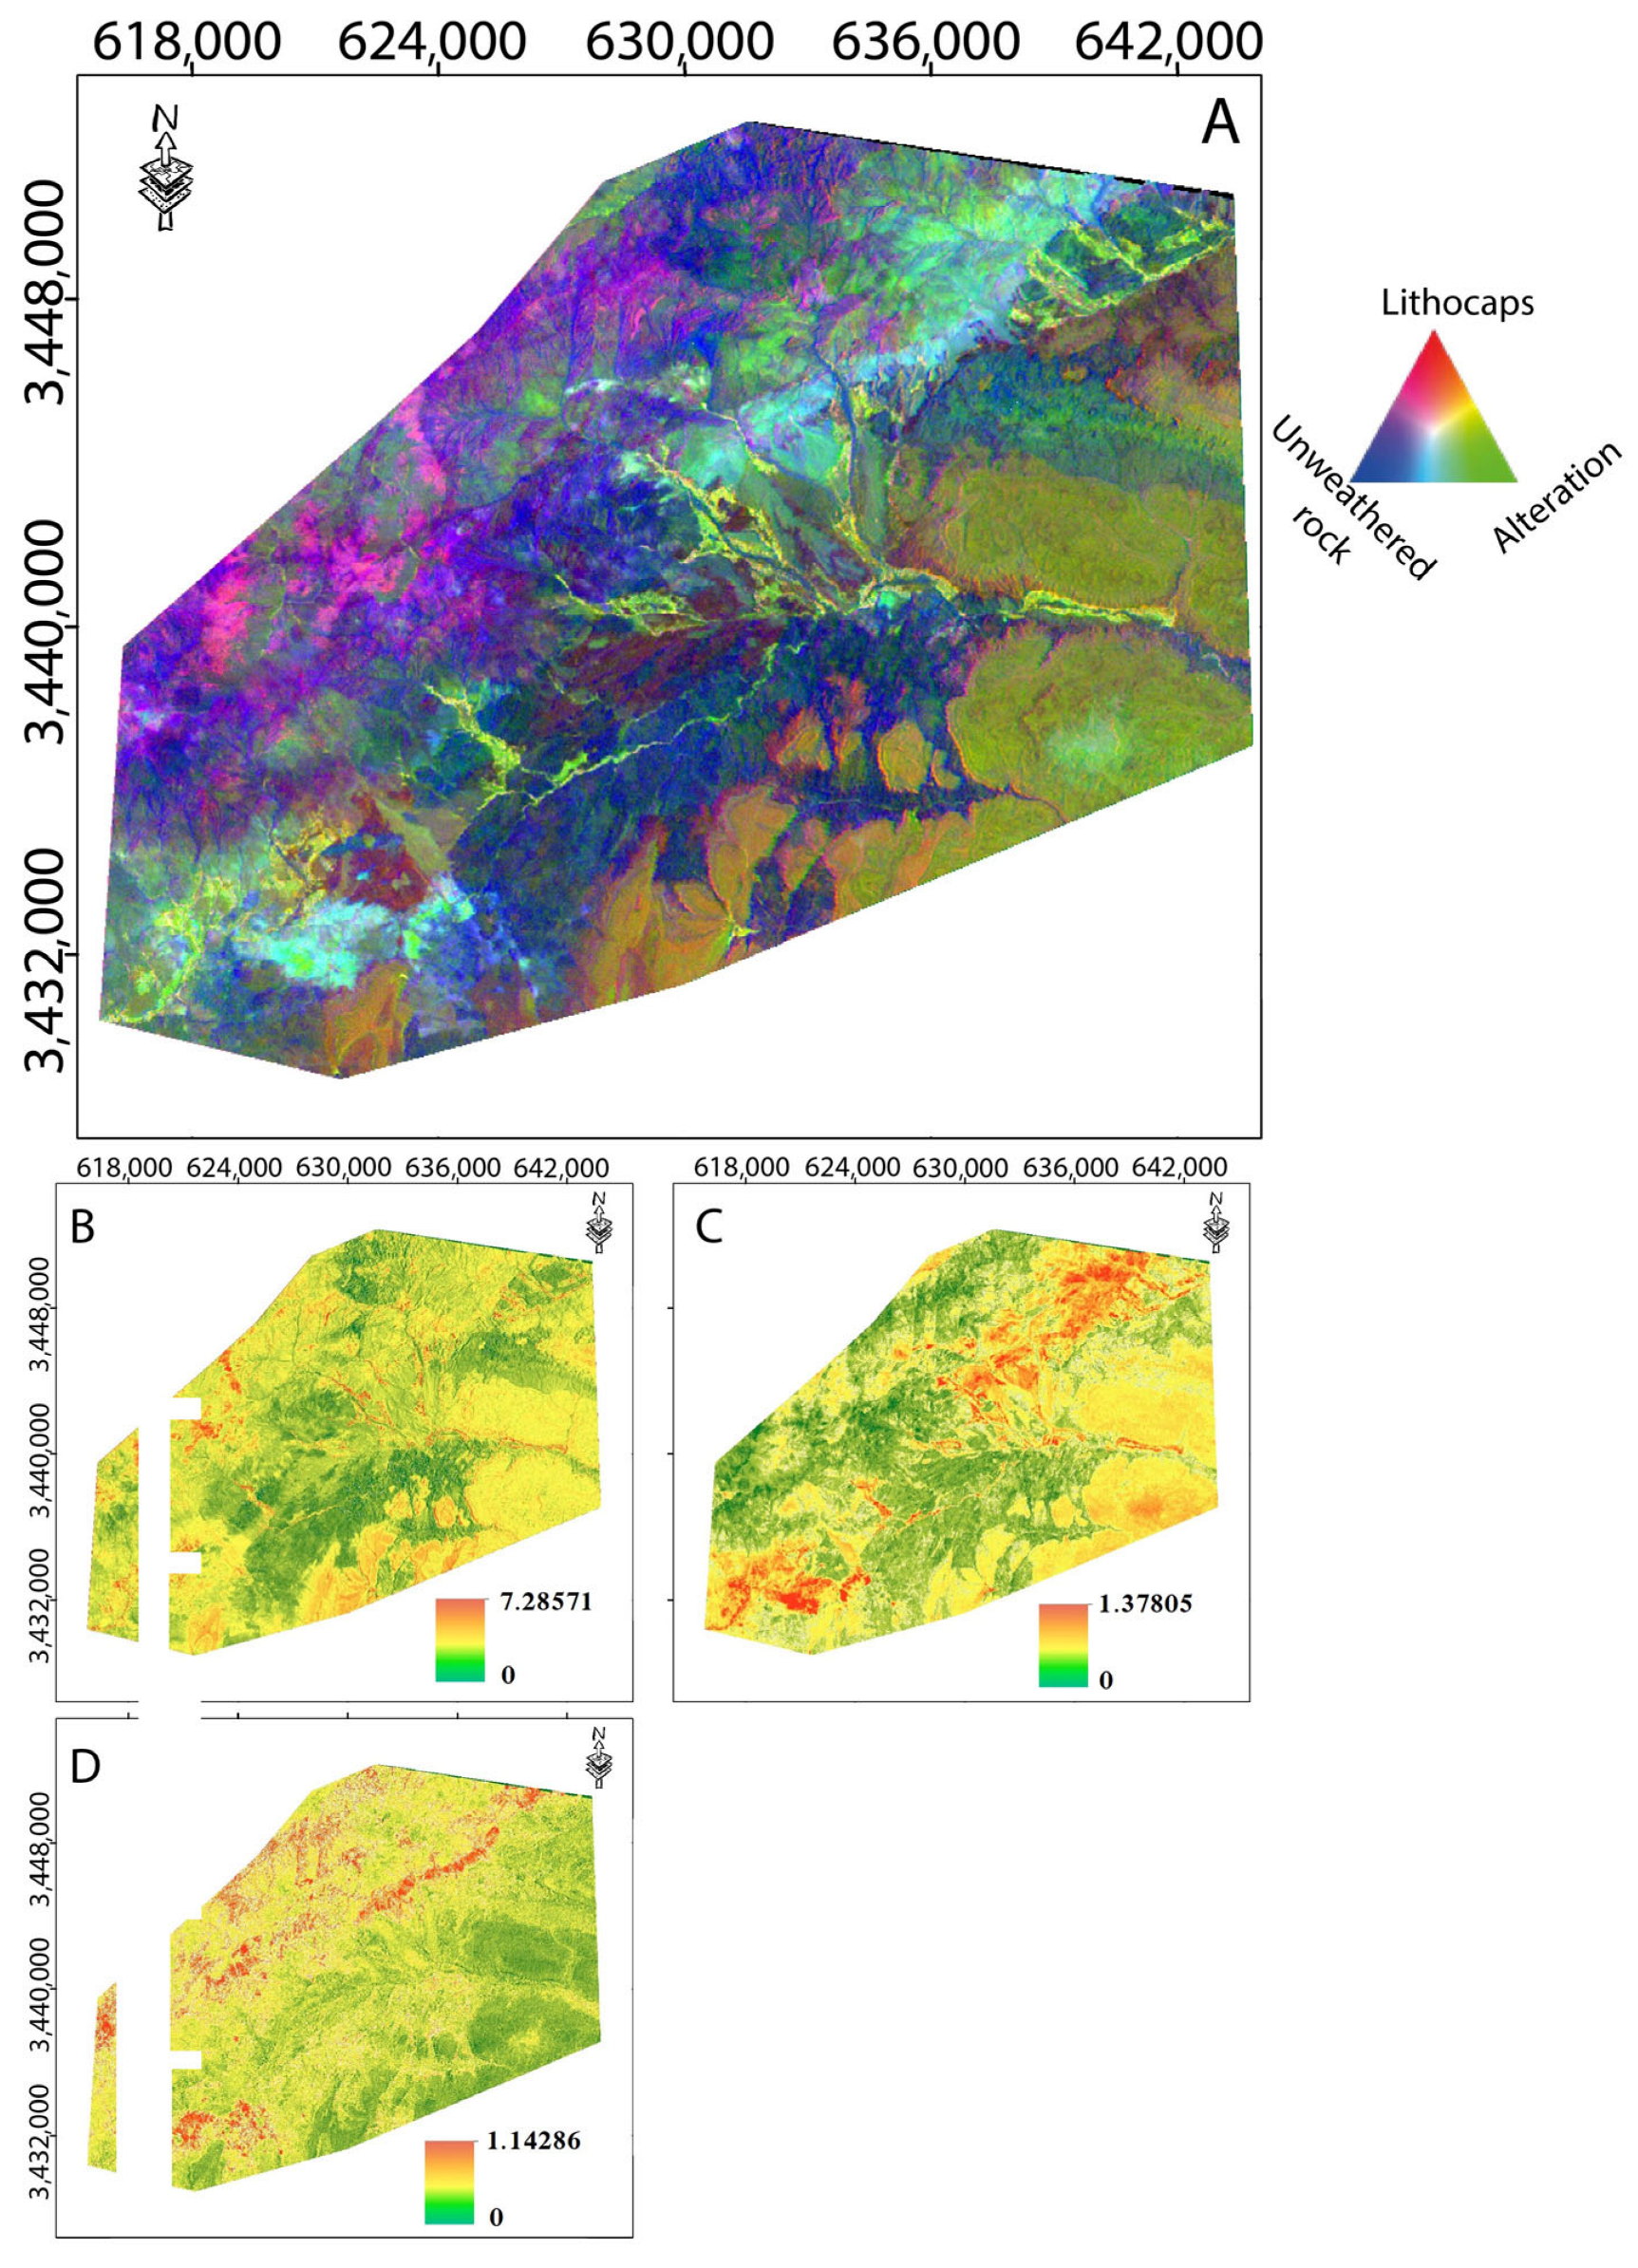
Figure 9 highlights zoning between the lithocap, alteration zones, and less altered host rock, aiding in system orientation analysis. The RGB composite represents gossan, alterations, and unaltered rock, revealing a spatial organization of these domains.
In the north, near the pluton, purplish to bluish hues indicate proximity to gossan and healthy rocks. Moving along the northern valley flank, an alteration zone emerges but is disrupted by younger Triassic formations. Gossan zones, particularly in the Ouzellarh promontory, correlate with iron oxide presence, suggesting sulfide alteration.
These findings provide insights into the region’s geological dynamics, especially within copper porphyry systems. The spatial relationship between gossan, alteration, and iron oxide zones aids in identifying mineralization potential and guiding future exploration efforts.
  • Porphyry
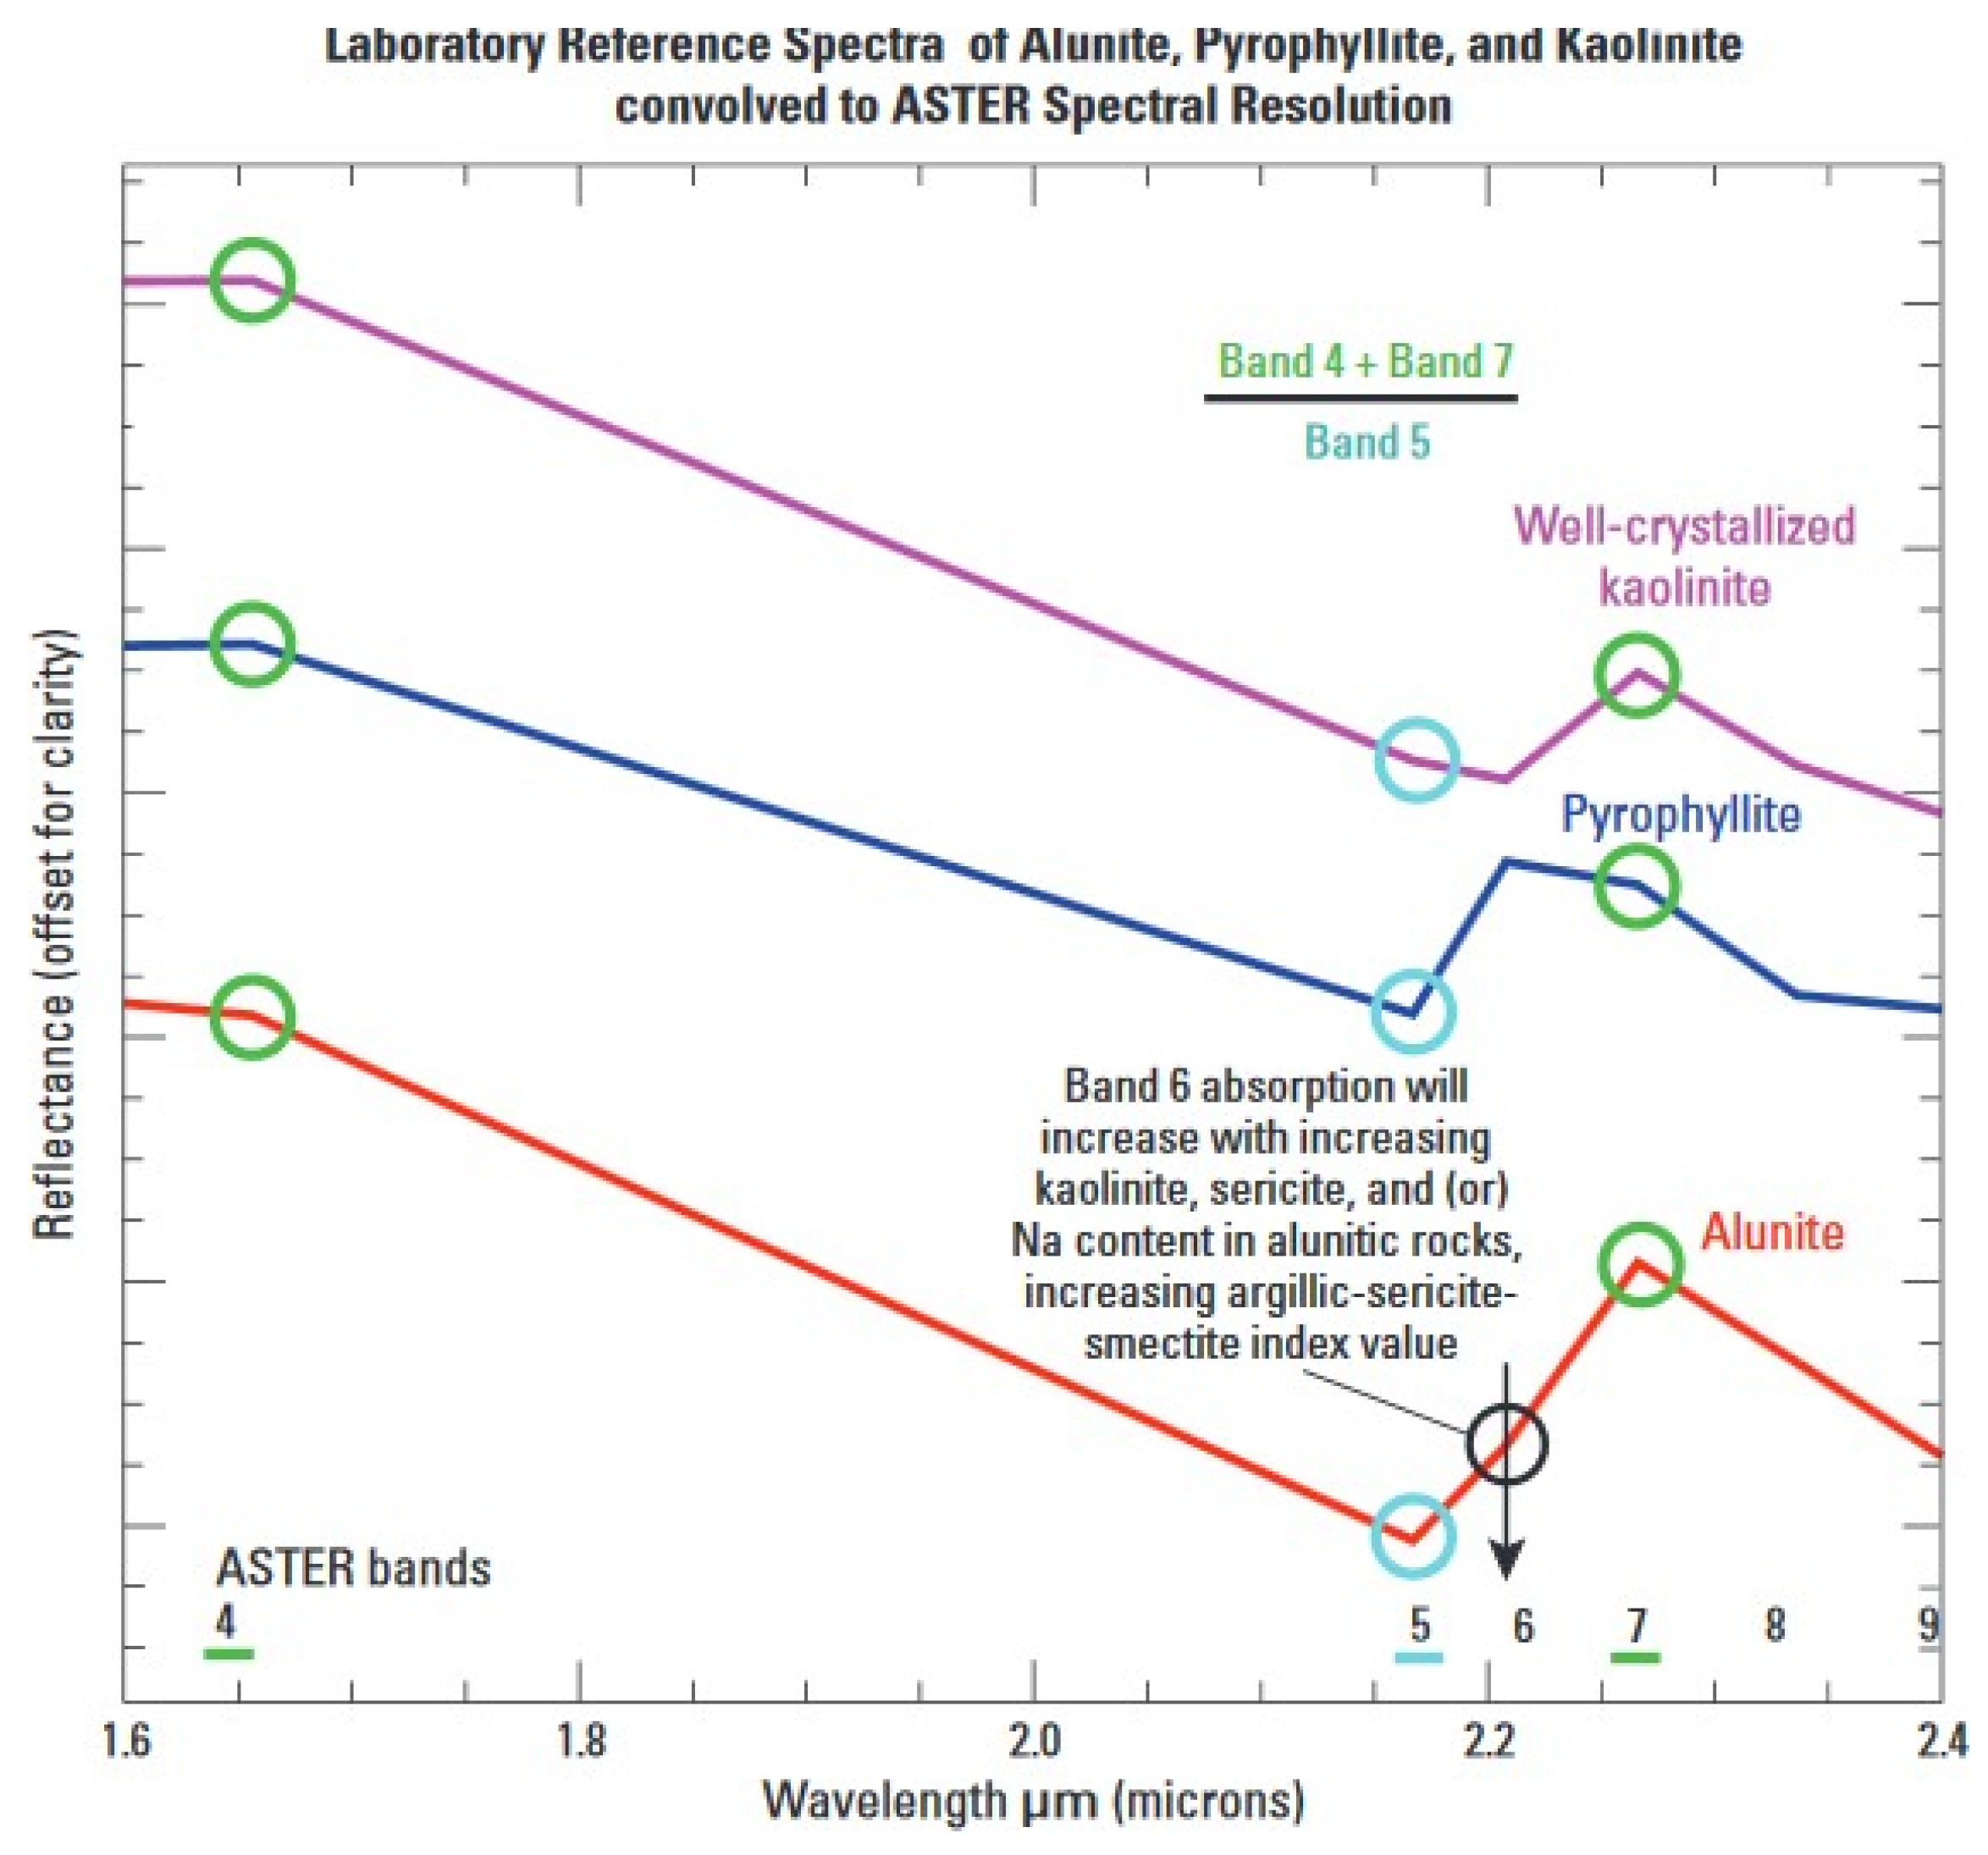
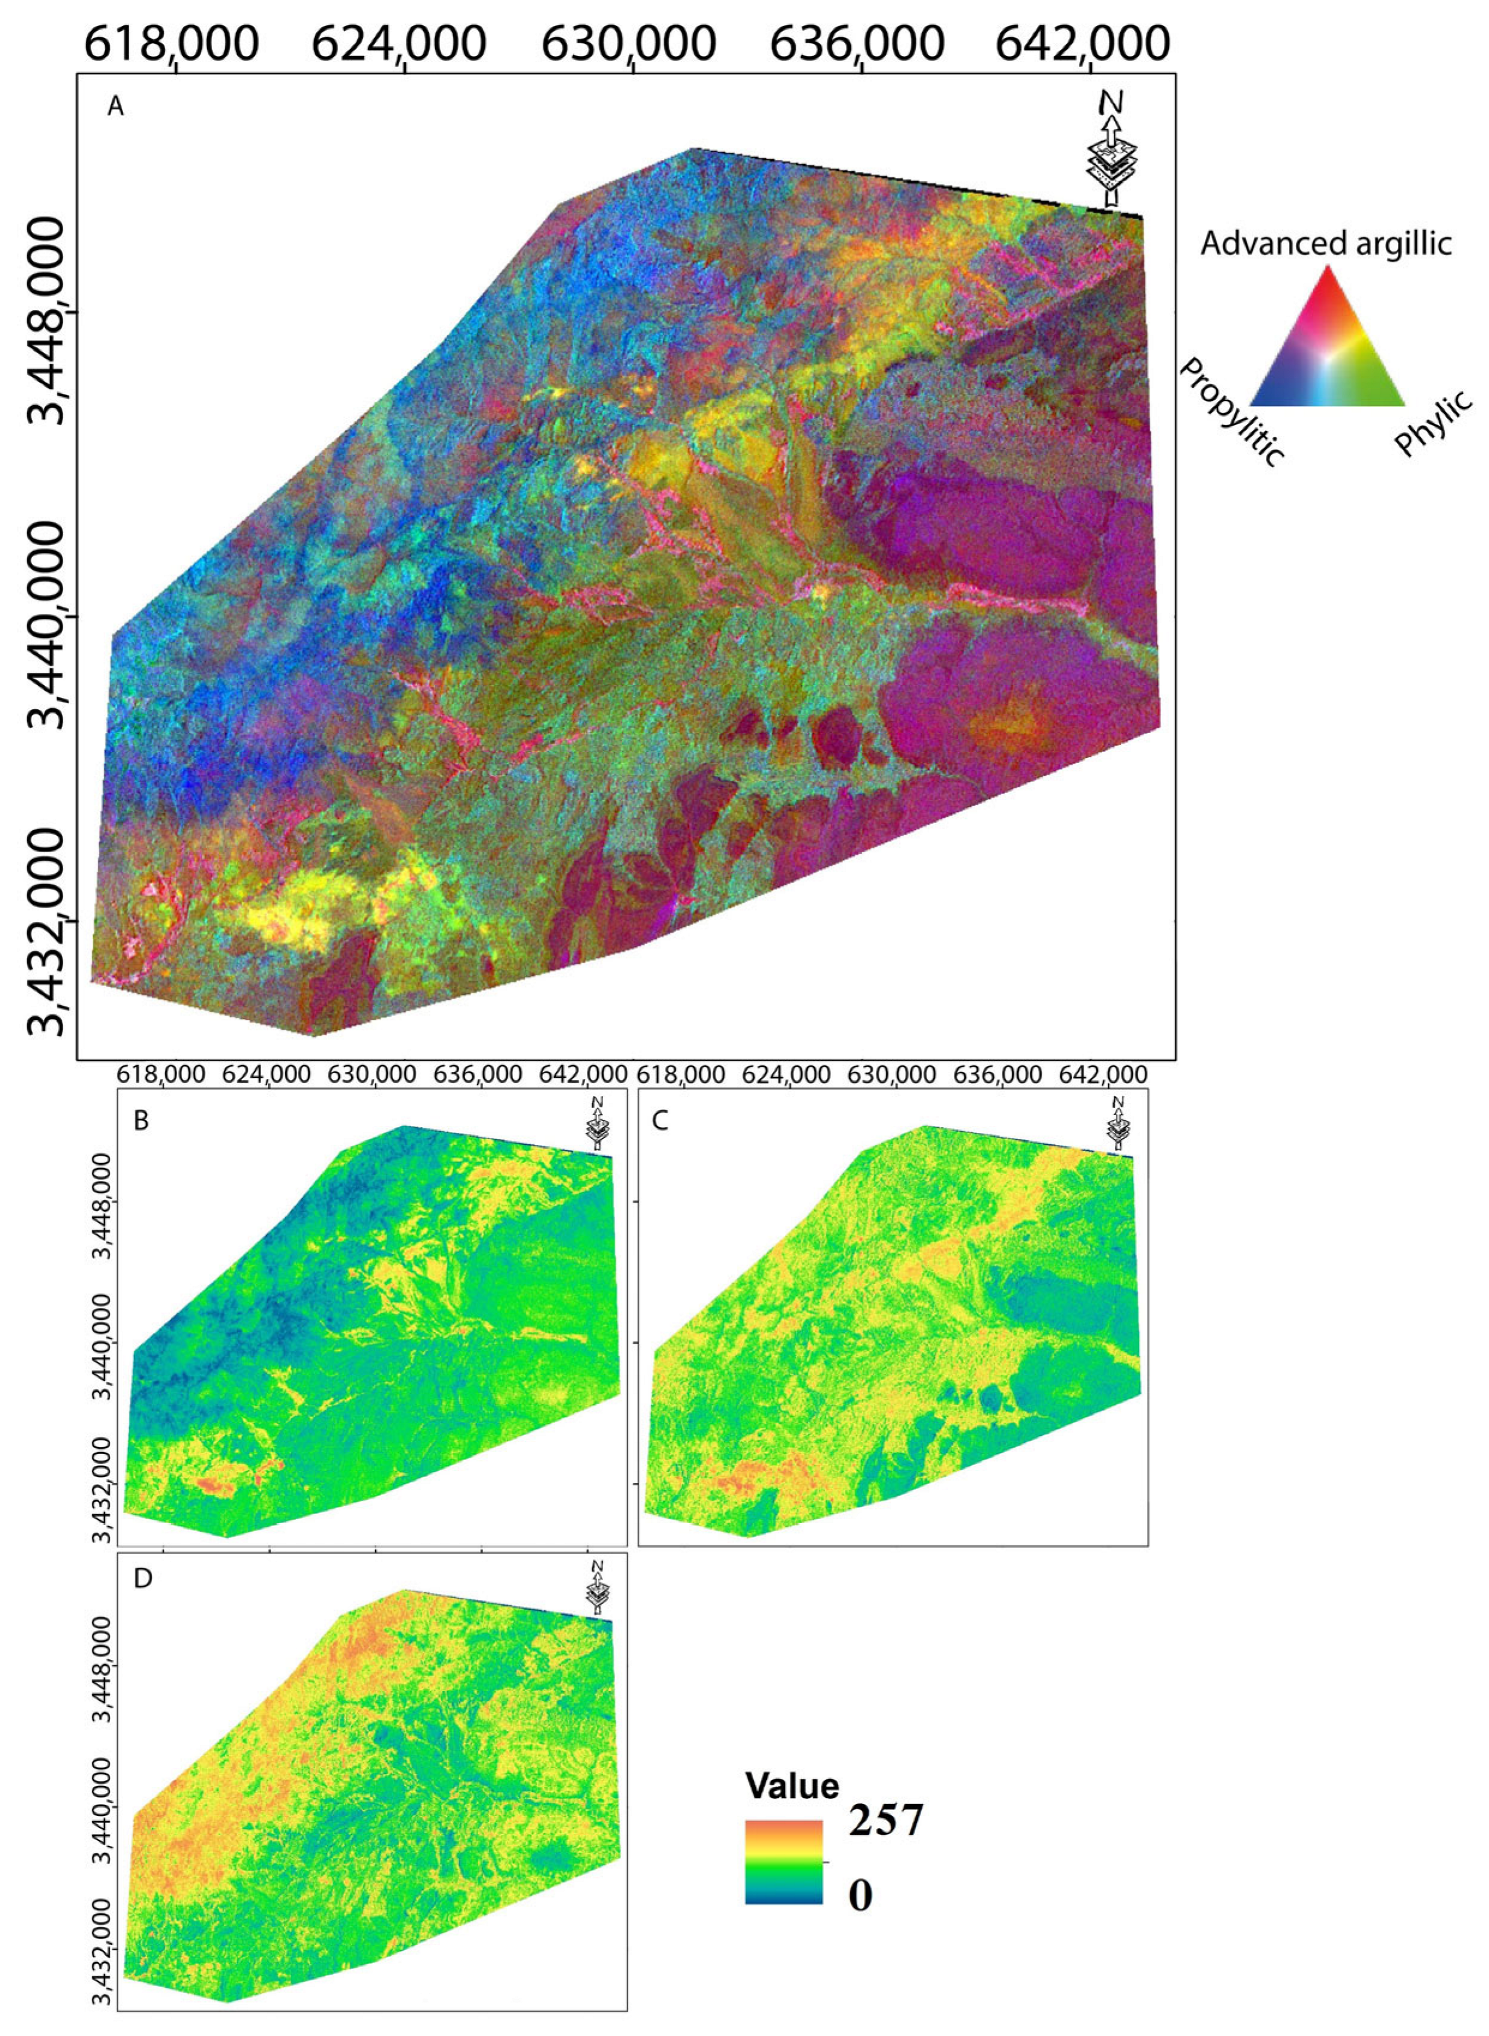
From ratios in Figure 10, The color composite in Figure 11 were generated, delineateing key alteration zones in copper porphyry systems:
A.
Advanced argillic alteration: Highlighted by the (4 + 7)/5 ratio, emphasizing clays such as Kaolinite, Dickite, and Pyrophyllite.
B.
Phyllic (Chlorite–Sericite) alteration: Identified using the (5 + 7)/6 ratio, revealing Sericite/Muscovite, Illite, and Smectite.
C.
Propylitic alteration: Mapped with the (7 + 9)/8 ratio, indicating carbonates, Chlorite, and Epidote.
By integrating these ratios, the composite map effectively visualizes alteration zonation, providing critical insights into geological processes and copper mineralization potential.
Figure 11 illustrates an advanced argillic alteration zone extending into the valley, with surrounding phyllic alteration (green) in the southwest overlapping with propylitic alteration (blue), creating a cyan hue. These visualizations enable the mapping of alteration zones, with different ratio combinations and stretch parameters, enhancing their distinct characteristics. This approach is essential for identifying areas with potential copper mineralization.

3.2. Ground-Truth Verification

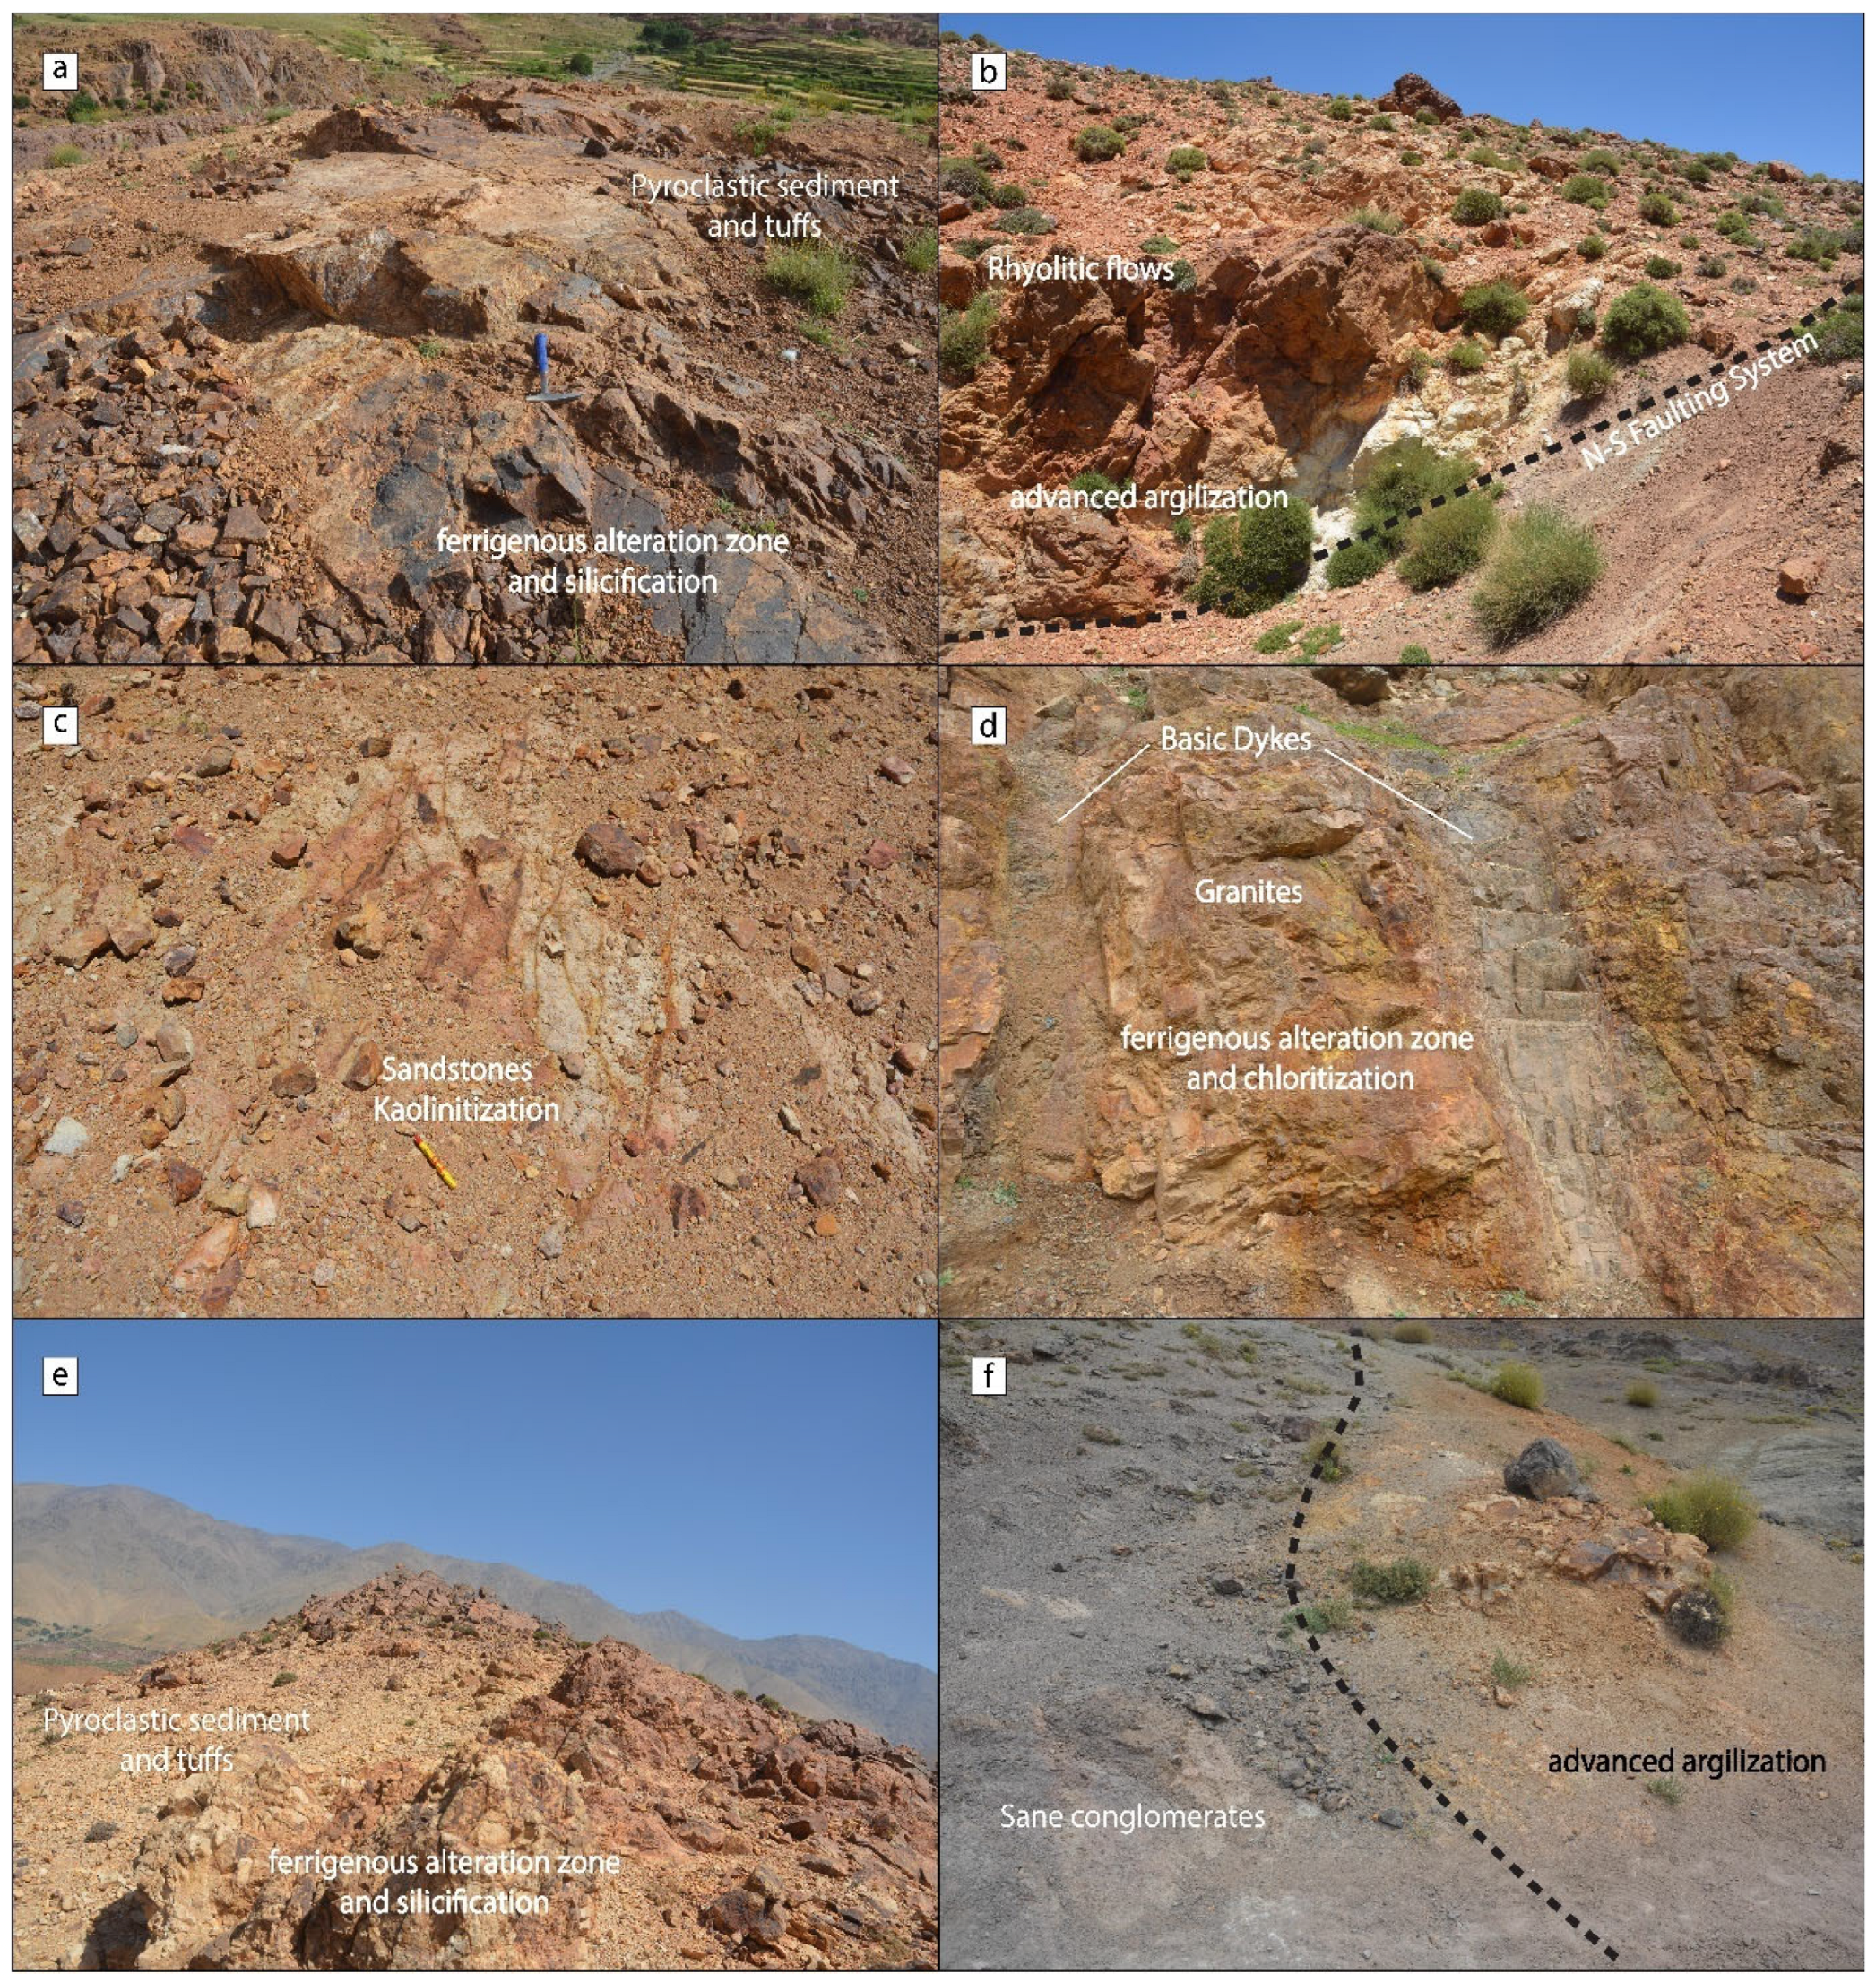
Fieldwork validation was conducted to confirm the results from remote sensing and structural analysis. Field stations were visited to validate key geological features, and the verified locations are shown in Figure 12 for comparison with remote data. Multispectral remote sensing images analysis confirmed the presence of minerals identified by other methods, such as hyperspectral mapping, petrographic observations, and X-ray diffraction [28,29]. This consistency strengthens the validity of the findings and provides a comprehensive view of the mineralogy of the region [30]. Minerals such as chlorite, sericite, Kaolinite, Smectite, Dickite, Albite, and epidote in the alteration zones confirm significant hydrothermal alteration, while Quartz veins in rhyolite indicate potential mineralization [31].
The identification of argillic alteration zones (Kaolinite) and iron oxides (Figure 13e) aligns with alterations found in copper porphyry systems [32,33], suggesting potential copper mineralization. Multispectral remote sensing images analysis has been vital in confirming these results and offering a complementary method for mineralogical characterization [34]. However, despite rhyolites intersecting with andesites, no small-scale spatial relationship has been established between the two sectors, making it challenging to link the studied alteration zone with the regional mineralization. Further spatial–temporal studies are needed to determine if these alterations are connected to the same mineralizing event [35].
Rhyolites in both sectors display a similar color (pink-white to ochre) (Figure 13b), while andesites show a greenish hue. The mineralized structures are related to various orogenies but inherited from Pan-African structures [36,37]. The area is marked by numerous faults, including the South Atlasic fault system and the Anti-Atlas major fault, which favor the circulation of hydrothermal fluids and emplacement of infracambrian dykes [38].
The multispectral survey identified advanced argillic alteration zones concentrated in the valley within the volcanic formations of the Ouarzazate Supergroup (Figure 13b,f), located south of the South Atlasic fault. This boundary marks the division between Precambrian volcano–sedimentary formations and granitic plutons. Alteration patterns include phyllic alteration southeast of the valley and propylitic alteration northwest, with advanced clay alteration in the valley surrounded by these other alterations [30,39,40].

3.3. Geochemistry Validation

After examining the diffractograms (Figure 14, Table 1), a correlation between XRD and petrographic observations was noted. However, there were discrepancies: some minerals detected in thin sections were not identified in the diffractograms, and vice versa. Despite this, combining both techniques provides a more comprehensive overview of the minerals present in the rocks.
In rhyolites, Muscovite, indicating sericitization, was widespread, while feldspars such as Albite and orthoclase were found in some samples. The flow texture of the rhyolite lacked feldspars entirely. Andesites showed mineral diversity, with Albite and orthoclase detected, though orthoclase was not confirmed in all thin section analyses. Muscovite was identified in one sample but not in another, suggesting differentiated sericitization.
The altered andesites, alteration veins, and volcanic breccia contained a variety of clays, such as Dickite (2m1) in samples Li68 and Li154, Pyrophyllite in Li169, and Illite in Li130.
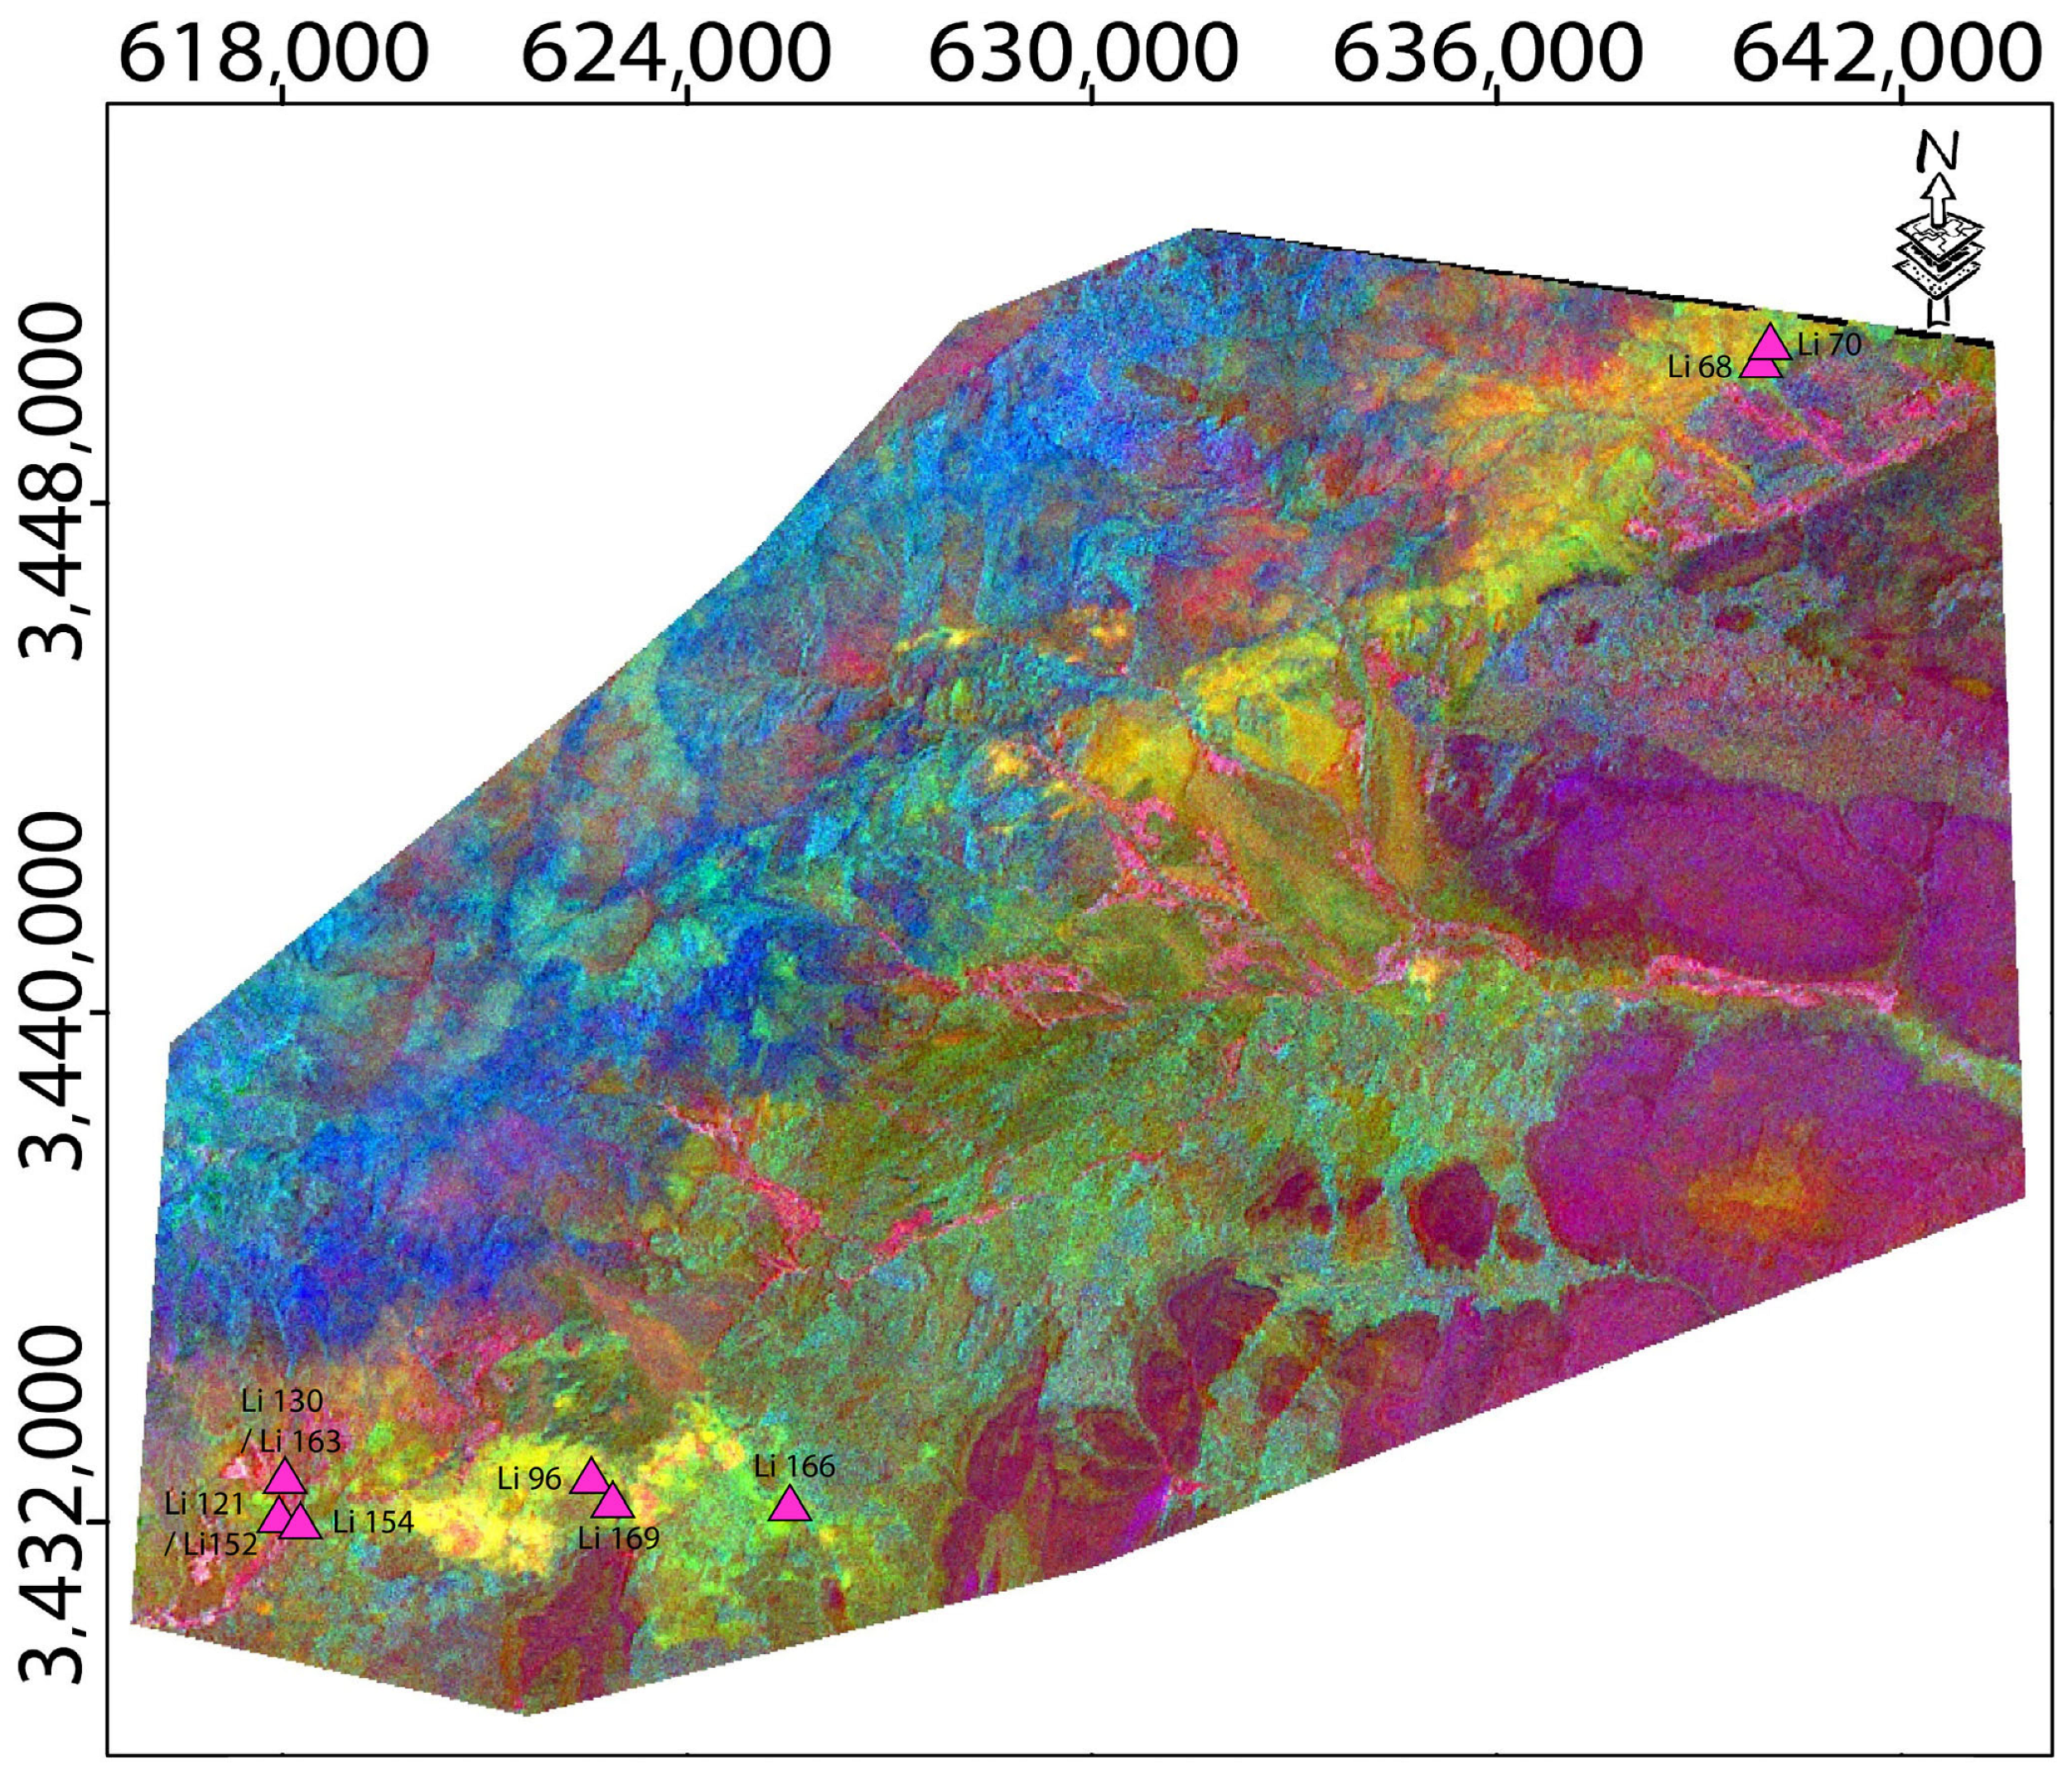
X-ray diffraction results (Figure 14) confirmed the presence of Quartz, Albite, and orthoclase in all samples. Other minerals, such as Dickite and Pyrophyllite, appeared as less intense peaks. Figure 15 illustrates the locations of the field samples collected for XRD analysis, superimposed on the ASTER RGB color composite. The sampling sites were strategically chosen from zones showing distinct mineralogical patterns that correspond to alteration signatures identified in the multispectral remote sensing analysis. This integration allows validation of remotely detected mineralogical anomalies with ground-truth laboratory results.

3.4. Principal Components Analysis: Crósta Method

The Crósta method [40] utilizes ASTER image analysis to enhance the spatial distribution of hydrothermal alteration minerals. This method identifies minerals based on their unique reflectance and absorption characteristics across different spectral bands. For example, Kaolinite shows high reflectance in bands 4 and 7 and high absorption in bands 1 and 6. Similarly, Alunite and Illite exhibit distinctive spectral patterns, as summarized in Table 2. In standard PCA, the largest eigenvalues typically occur in PC1 and PC2, representing overall scene variance dominated by illumination and albedo effects. However, in mineral-targeted PCA, the alteration signal often appears in higher-order components, after background variance is removed.
Applying Principal Components Analysis (PCA), the Crósta method transforms correlated ASTER bands (1, 4, 6, 7) into uncorrelated components (PCA1, PCA4, PCA6, PCA7), enabling efficient mineral mapping. Kaolinite, for instance, shows a significant difference in eigenvalues in PCA7, which is the difference in values 0.78487 and −0.61549 (Table 3). Originally introduced in [40], this approach remains a powerful tool in mineral exploration, geological characterization, and remote sensing. Data for alteration minerals is extracted to Table 4.
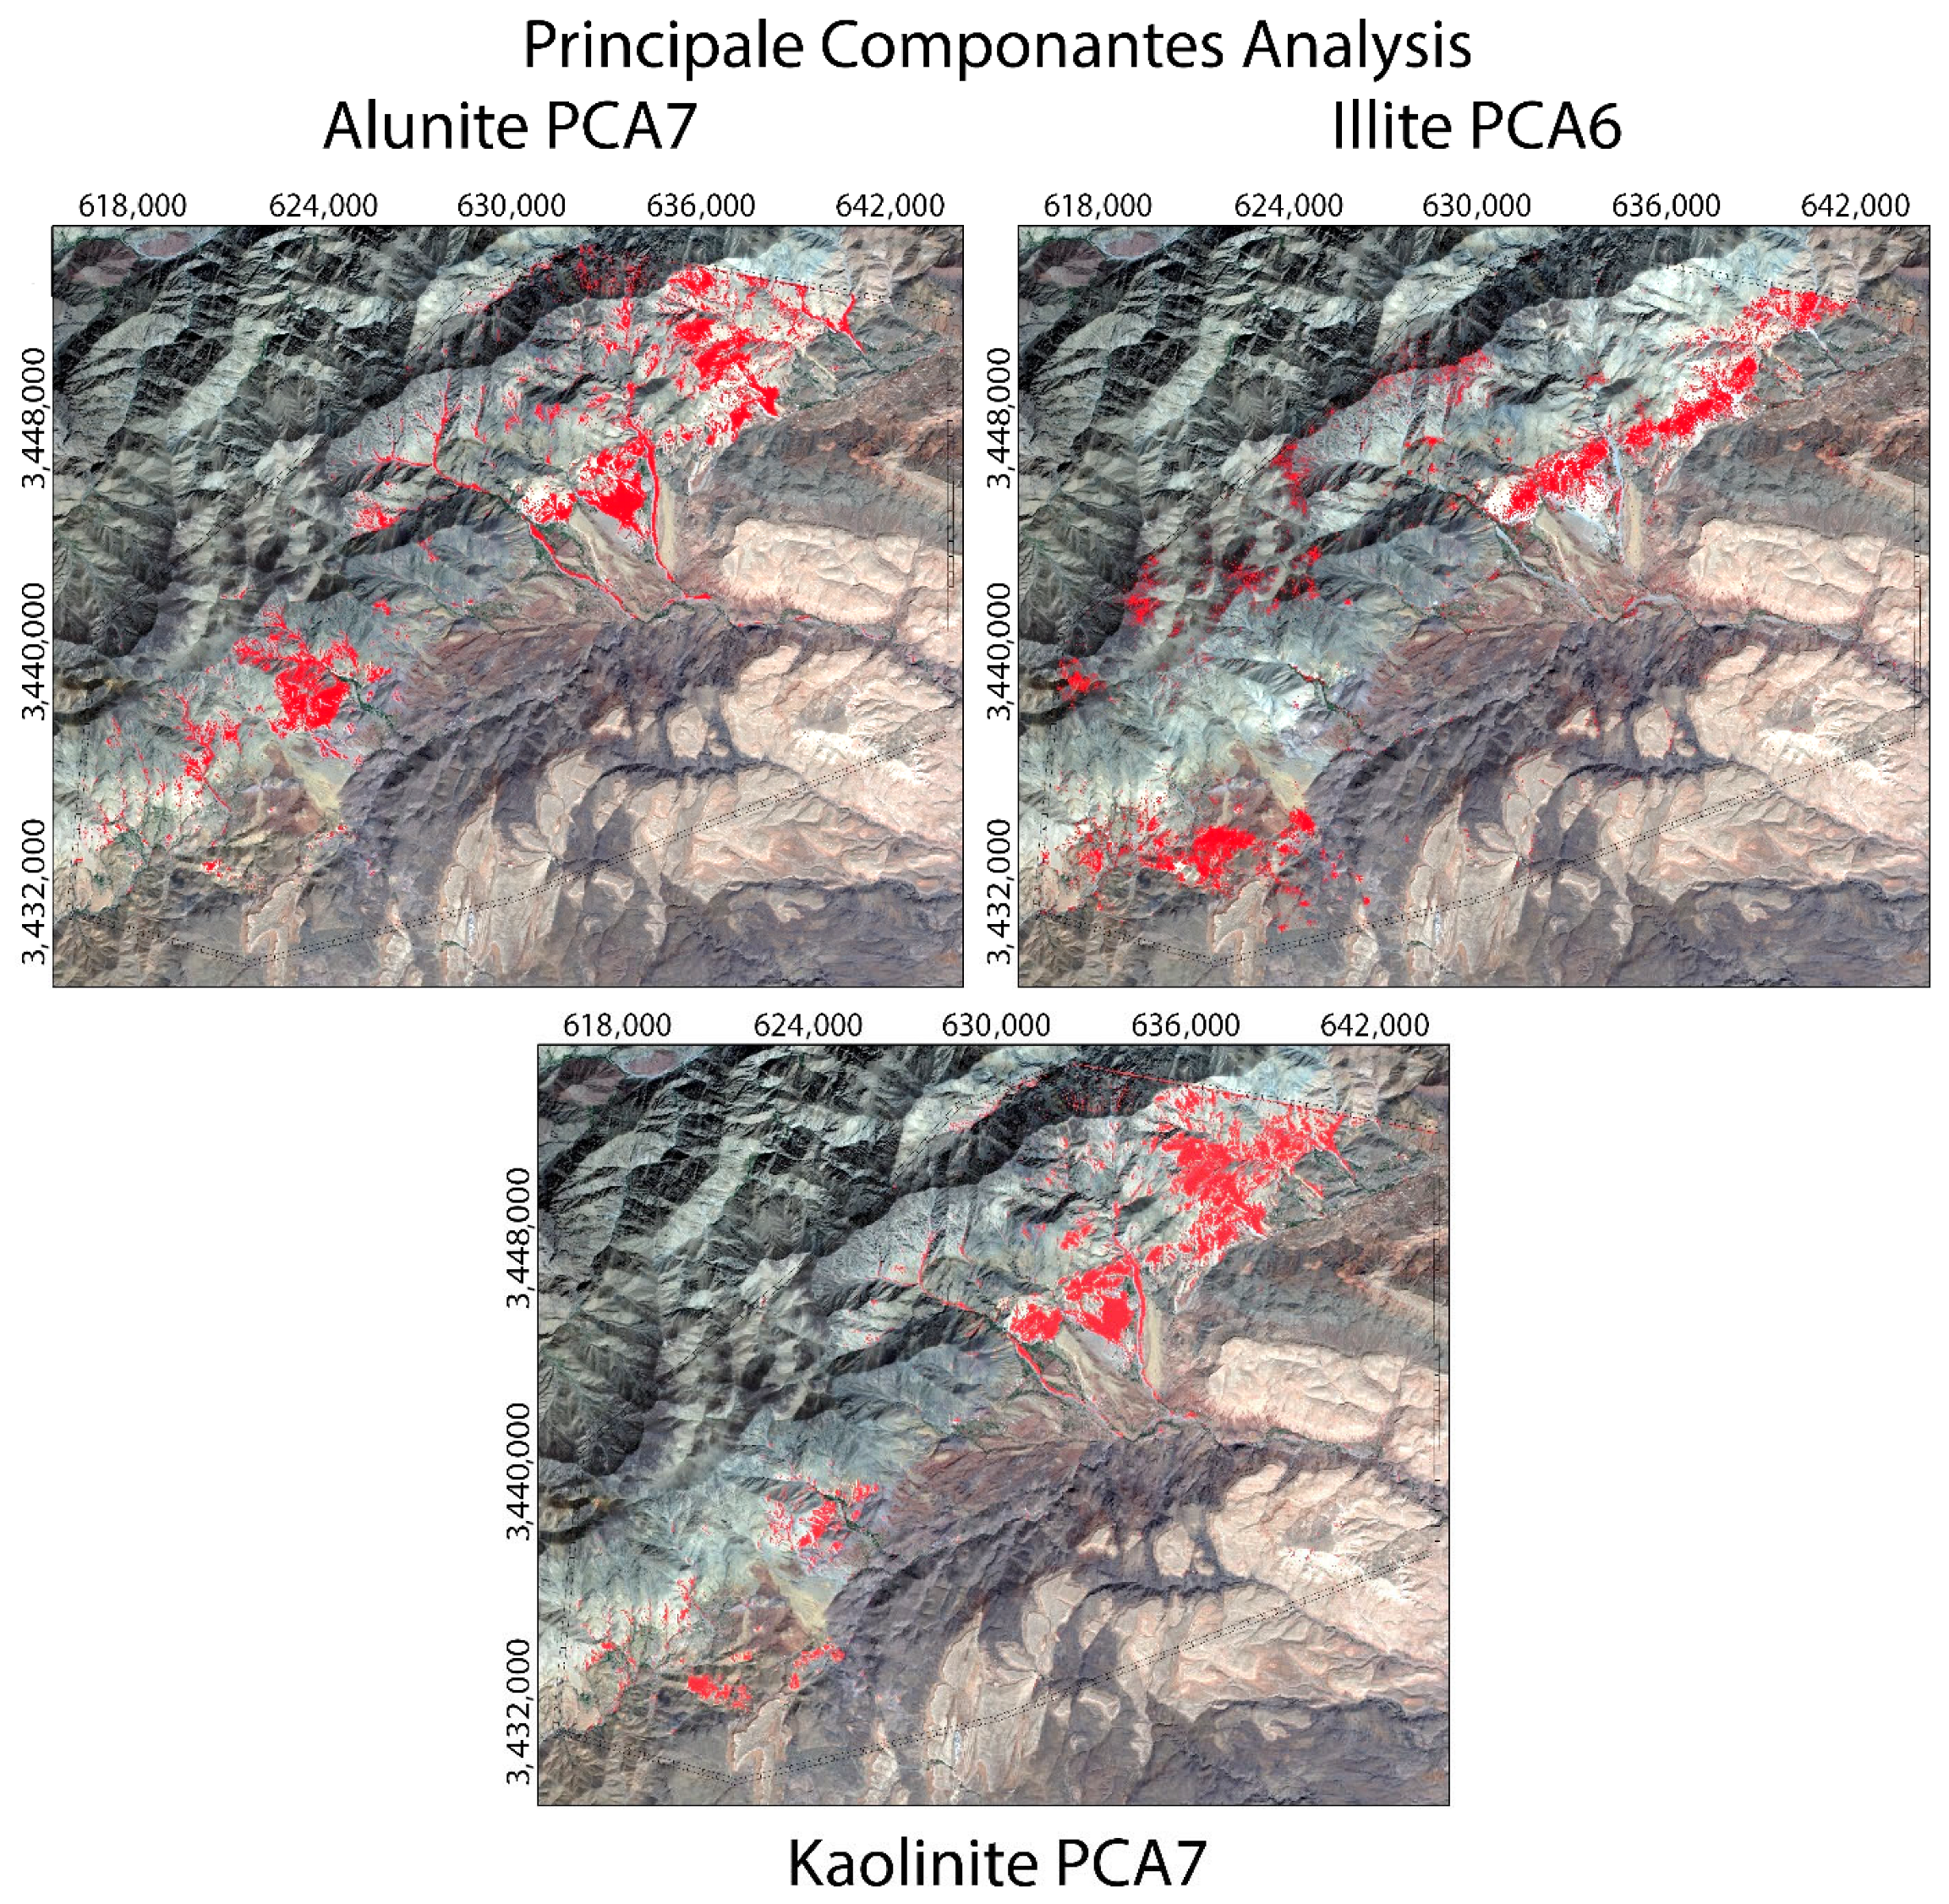
Figure 16 presents the results of Principal Component Analysis (PCA) using Crósta’s technique, reclassified to emphasize high-reflectance values and displayed as an RGB composite. The derived images delineate the spatial distribution of Alunite, Illite, and Kaolinite across the study area. Alunite is predominantly concentrated within advanced argillic alteration zones, whereas Illite forms a peripheral halo around Alunite-rich domains, reflecting a zonal alteration pattern. Kaolinite exhibits partial overlap with Alunite but extends more broadly, particularly within the northern valley and along debris cones.
These findings, compiled into a composite band (Figure 12), establish a solid foundation for mineralogical characterization, supporting mining exploration and geological process analysis [41].

3.5. Uncertainty in Mineral Identification

Mineral identification using remote sensing and geochemical methods is subject to uncertainty due to factors such as instrumental limitations, spectral mixing, geological complexity, and environmental conditions. Spectral mixing occurs when the reflectance recorded in a single pixel represents a combination of multiple surface materials, as minerals like Kaolinite, Sericite, and Illite have similar absorption features in the shortwave infrared (SWIR) range, which can lead to misclassification. Techniques like Principal Components Analysis (PCA) and Spectral Angle Mapper (SAM) improve differentiation (Table 5), but their effectiveness still depends on sensor quality [41].
Laboratory validation methods like X-ray diffraction (XRD) and petrography are crucial for confirming remote sensing results, though they too have limitations, such as sampling biases and post-extraction alterations. In regions like Tidili, structural complexities further contribute to uncertainty, as multiple orogenies complicate the attribution of alteration patterns to specific mineralizing events. Geophysical techniques, such as magnetics and resistivity mapping, help distinguish structurally controlled mineralization from background lithological variations.
Errors in X-ray diffraction (XRD) analysis were evaluated by estimating uncertainties in crystallite size calculations using the Scherrer equation. The primary sources of error included instrumental error, peak broadening uncertainties, and variations in peak position (Δ2θ). Instrumental error remained within the expected precision limits of the XRD equipment, while peak broadening errors were assessed through variations in the full width at half maximum (FWHM). Minor deviations in peak position were also considered to ensure they did not significantly impact crystallite size estimations. Since wavelength error is generally negligible, the focus was placed on these dominant factors to quantify uncertainty in mineral identification. These steps ensured a reliable interpretation of the XRD data [42]. Table 6 summarizes the data for sample Li70.
D = k λ β cos θ
Δ D D = Δ λ λ 2 + Δ β β 2 + Δ θ tan θ θ 2
where:
Δλ is the error in wavelength (usually negligible).
Δβ is the error in peak broadening
Δθ is the error in peak position
Table 6. XRD Error Estimation and Uncertainty Analysis for sample Li70.
Peakk Postion (2θ)FWHM(β)SizeStandard Error
21.070510.1251964.52088.21 x 10-4
26.84990.1232666.23631.55 x 10-4
36.752380.1262866.26460.00211
39.672860.1143973.80110.00245
40.49440.1224669.11820.00515
42.651160.1278266.69460.00338
45.991940.1299766.37490.00548
50.333910.1343665.30290.00153
60.136050.1592957.60560.00257
68.274790.6313415.19680.01125

3.6. Interpretations

The multispectral study reveals a southwest–northeast zonation linked to deformation events from the Pan-African orogeny (~663 ± 13 Ma) and the Hercynian orogeny (330–290 Ma). This trend exposes Neoproterozoic rocks as “windows” beneath Triassic deposits. Alteration is observed along this trend, affecting Ouarzazate volcanic rocks in the south and rhyolitic domes in the southeast, while plutonic rocks show less alteration.
Multispectral remote sensing images analysis indicates alteration patterns typical of copper porphyry systems, with advanced argillic alteration zones displaying Alunite and Pyrophyllite at the core, encircled by Sericite, Chlorite, and Kaolinite. However, confirming these relationships requires extensive field validation to assess whether these alterations are part of a broader mineralizing event.
While multispectral techniques are valuable for mineral identification, they must be supplemented by fieldwork and laboratory methods such as sampling, petrography, geochemistry, and X-ray diffraction for accurate validation and a deeper geological understanding.

4. Results and Discussion

4.1. Mineralogical Alteration Zones and Their Implications

Multispectral remote sensing combined with XRD analysis revealed three main alteration types in the Tidili region: advanced argillic, phyllic, and propylitic. ASTER band ratios (e.g., 4/2, 4/5, and 5/7) effectively identified clay-rich zones, while PCA-enhanced Crósta analysis allowed spatial refinement of mineral distributions. Key alteration minerals (Alunite, Kaolinite, Sericite, and Pyrophyllite) are consistent with known porphyry copper systems [32,43].
These alteration zones, especially the dominance of Kaolinite and Alunite in the advanced argillic facies, suggest the presence of hydrothermal fluids with acidic composition, possibly linked to shallow magmatic intrusions. This pattern has been similarly observed in porphyry copper deposits in the Anti-Atlas and Central Andes [8,43,44,45].
The PCA results show that Alunite is concentrated in advanced argillic zones, Illite occurs as a peripheral halo, and Kaolinite extends more broadly into northern valleys and debris cones. This hydrothermal zonation mirrors patterns typical of porphyry and epithermal systems [32,43], indicating a genetic link between alteration facies and potential mineralization. In Tidili, the structural inheritance of Pan-African and Hercynian orogenies likely reactivated fault corridors, enabling fluid flow and controlling alteration distribution [13,44]. Such tectono-magmatic conditions are consistent with porphyry- and epithermal-style systems documented elsewhere in Morocco, including Imiter, Bou Azzer, and Imini [15,45], highlighting the regional exploration significance of the observed alteration zoning.

4.2. Structural Control and Geological Context

The Tidili region’s structural framework—controlled by Pan-African and Hercynian deformation events—appears to have played a significant role in fluid migration and mineral deposition. The presence of intersecting NE-SW and NW-SE faults aligns with the localization of hydrothermal alteration halos. This observation supports previous models highlighting structural intersections as preferential fluid conduits in Moroccan porphyry systems [21,26,33,38].
Zonation patterns revealed through remote sensing follow concentric models of hydrothermal alteration: propylitic margins grading into phyllic and argillic cores. This spatial configuration is characteristic of porphyry-style mineralization [32,33,39], reinforcing the inferred genetic model.
The hydrothermal alteration patterns observed are strongly influenced by the structural framework of the Tidili region. The present configuration is the result of multiple tectonic events, notably the Pan-African, Hercynian, and Alpine orogenies, which produced four dominant fault orientations: N–S, NE–SW, E–W, and NNW–SSE. Among these, the NE–SW and E–W systems (e.g., the Tawyalt–Agandiy and Imini faults) acted as major conduits for hydrothermal fluids, controlling both alteration zonation and mineral deposition [37]. The highest fracture densities occur in the Precambrian basement and Triassic formations, enhancing permeability and fluid circulation. This structural control explains the close spatial relationship between alteration halos and fault traces, highlighting the role of tectonic reactivation in localizing mineralization in the region.

4.3. Validation Through Ground Truthing and XRD Analysis

Ground mapping and XRD data confirmed the presence of Muscovite, Albite, and quartz in altered zones. These minerals align with remote sensing predictions, particularly in phyllic and argillic alteration environments. Sericitization and chloritization—common in phyllic zones—were evident both visually in the field and mineralogically through XRD.
The sample locations (Figure 15) illustrate a strong consistency between remotely detected mineral assemblages and laboratory-confirmed mineralogy, reducing uncertainty and strengthening the reliability of ASTER-derived mineral maps. Unlike previous studies in similar terrains (e.g., [1,2,3,4,5,6,11,46]), this validation step confirms that remotely sensed alteration anomalies are not false positives but reflect true mineralogical changes.

4.4. Comparison with Other Regions and Methodological Value

The remote sensing–XRD integration employed in this study is consistent with approaches in Peru, Iran, and the Anti-Atlas, where field-laboratory confirmation significantly improved exploration accuracy [21,47,48]. However, unlike many of those studies, this work also emphasizes spatial structural relationships, essential in fault-controlled mineralization systems.
The value of using PCA within the Crósta method is especially evident in separating overlapping spectral responses of Kaolinite and Illite, which are difficult to distinguish using band ratios alone. This refinement provides a more reliable alteration map, especially in geologically complex terrains.

4.5. Limitations and Future Perspectives

Although the integrated approach produced reliable results, several limitations remain. First, spectral confusion among clay minerals, particularly in zones with mixed alteration, limited the precision of mineral discrimination. Second, ASTER’s moderate spatial resolution (15–30 m) may not adequately capture narrow or discontinuous alteration features. Third, the limited number of field samples constrains the extrapolation of mineralogical results across the entire study area.
To improve the robustness of future studies, several enhancements are recommended. The use of hyperspectral imaging could enable finer discrimination of overlapping spectral signatures. Complementary geochemical assays would help quantify elemental concentrations and verify ore potential. Additionally, isotopic and fluid inclusion studies would offer insights into the evolution of hydrothermal systems and help better constrain the timing and source of mineralizing fluids.

5. Conclusions

The multispectral investigation of the Tidili region reveals significant hydrothermal alteration zones indicative of copper porphyry mineralization. Key alteration minerals (Kaolinite, Alunite, Sericite, and Chlorite) were mapped using the Crósta method, band ratio analysis, and Principal Components Analysis. These findings highlight the effectiveness of remote sensing in delineating mineralized zones in complex geological settings.
While remote sensing provides valuable preliminary insights, limitations such as vegetation cover, water bodies, and spectral interference can affect accuracy. Challenges like spectral overlaps in clay minerals and iron oxides necessitate integration with field validation and geophysical methods. Future work should focus on geochemical sampling, petrography, and targeted drilling to confirm findings and assess economic viability.
This study enhances mineral exploration methodologies and deepens understanding of the Tidili region’s geological evolution and resource potential.

Author Contributions

Conceptualization, I.-E.L. and H.A.; methodology, I.-E.L., H.A. and H.I.; software, I.-E.L. and N.E.B.; validation, H.A. and H.I.; formal analysis, I.-E.L., H.A. and H.I.; investigation, I.-E.L. and H.A.; resources, I.-E.L., H.A., H.I. and N.E.B.; data curation, I.-E.L.; writing—original draft preparation, I.-E.L.; writing—review and editing, I.-E.L., H.A. and H.I.; visualization, I.-E.L., H.A. and H.I.; supervision, H.A. and H.I.; project administration, H.A. and H.I. All authors have read and agreed to the published version of the manuscript.

Funding

This research received no external funding.

Conflicts of Interest

The authors declare no conflicts of interest.

References

  1. Sabins, F.F. Remote sensing for mineral exploration. Ore Geol. Rev. 1999, 14, 157–183. [Google Scholar] [CrossRef]
  2. Möller, T.; Williams-Jones, A. Multispectral and hyperspectral remote sensing for mineral exploration. J. Geochem. Explor. 2018, 188, 129–145. [Google Scholar]
  3. Hewson, R.D.; Cudahy, T.J.; Jones, M.H.; Thomas, M. An integrated approach to mineral exploration using hyperspectral and multispectral remote sensing. Int. J. Remote Sens. 2005, 26, 3333–3350. [Google Scholar]
  4. Van der Meer, F.D.; de Jong, S.M. Remote sensing and digital image analysis for mineral exploration. Geol. Soc. Lond. Spec. Publ. 2001, 190, 17–33. [Google Scholar]
  5. Pour, A.B.; Hashim, M.; Hong, J.K. Integration of ASTER and Landsat ETM+ data for the detection of iron mineralization in a tropical region: A case study of Central Eastern Goldfields, Australia. Ore Geol. Rev. 2013, 53, 487–500. [Google Scholar]
  6. Abrams, M.J.; Kahle, A.B.; Palluconi, F.D.; Schieldge, J.P. Geologic mapping using thermal images. Remote Sens. Environ. 1984, 16, 13–33. [Google Scholar] [CrossRef]
  7. Rowan, L.C.; Mars, J.C. Lithologic mapping in the Mountain Pass, California area using ASTER data. Remote Sens. Environ. 2003, 84, 350–366. [Google Scholar] [CrossRef]
  8. Di Tommaso, I.; Rubinstein, N. Hydrothermal alteration mapping using ASTER data in the Infiernillo porphyry deposit, Argentina. Ore Geol. Rev. 2007, 32, 275–290. [Google Scholar] [CrossRef]
  9. Bedini, E. Mineral mapping in the Kap Simpson complex, central East Greenland, using HyMap and ASTER remote sensing data. Adv. Space Res. 2011, 47, 60–73. [Google Scholar] [CrossRef]
  10. Abdelsalam, M.G.; Stern, R.J.; Berhane, W.G. Mapping Precambrian structures in the Sahara using multispectral remote sensing: The Neoproterozoic collision zone in eastern Sahara. Tectonophysics 2000, 326, 1–24. [Google Scholar]
  11. Choukrad, J.; Ait Ali, A.; Si Mhamdi, H.; Ouahzizi, Y.; El Moutaouakkil, N.; Saoud, N.; Charroud, M. Contribution of Landsat 8 OLI imagery to mapping of lithological series and lineaments: Implications for Pb-Zn mineralization exploration in the Boudahar Massif, Eastern High Atlas, Morocco. Estud. Geológicos 2023, 79, e159. [Google Scholar] [CrossRef]
  12. Elbakhouch, N.; Ibouh, H.; Touil, A.; Chafiki, D. Structural and mineralogical mapping using multispectral satellite data (Aster, Landsat 8 OLI, and Sentinel 2B) combined with field work in the Western High Atlas, Morocco. Geologos 2024, 30, 119–136. [Google Scholar] [CrossRef]
  13. Michard, A.; Ibouh, H.; Charrière, A. Syncline-topped anticlinal ridges from the High Atlas: A Moroccan conundrum, and inspiring structures from the Syrian Arc, Israel. Terra Nova 2011, 23, 314–323. [Google Scholar] [CrossRef]
  14. Chabane, A.; El Boukhari, A.; Rocci, G.; Tane, J.L. Découverte d’un magmatisme d’affinité boninitique d’arc associé à l’ophiolite panafricaine de Khzama (Massif du Siroua, Anti-Atlas marocain). Comptes Rendus de l′Académie des Sciences 1991, 313, 1301–1304. [Google Scholar]
  15. Admou, H. Structuration de la paléo-suture ophiolitique panafricaine de Bou Azzer-Siroua (Anti-Atlas central, Maroc). Ph.D. Thesis, Université Cadi Ayyad, Marrakech, Morocco, 2000. [Google Scholar]
  16. Huch, K.M. Die panafrikanische Khzama Geosutur im zentralen Anti-Atlas, Marokko. Ph.D. Thesis, Freie University, Berlin, Germany, 1988. [Google Scholar]
  17. Rehdorf, K. Geologische und geochemische Aspekte von Vorlandgesteinen eines panafrikanischen Subduktionskomplexes nordöstlich des Jbel Sirwa (Anti-Atlas, Südmarokko); Schelzky & Jeep: Berlin, Germany, 1988. [Google Scholar]
  18. Chevallier, L.P.; Thomas, R.J.; Gresse, P.G.; Macey, P.H.; Martini, E.J.; Harmer, R.E.; Armstrong, R.A.; Eglington, B.M. Geological Map of Morocco at 1:50,000 “Douar Cour Sheet” and Explanatory Note (in French and English); Notes et Mémoires du Service Géologique du Maroc; Ministry of Energy, Mines and Environment: Rabat, Morocco, 2001; 175p. [Google Scholar]
  19. Choubert, G. Essai de mise au point du problème des “ignimbrites”. Bull. Volcanol. 1963, 25, 123–140. [Google Scholar] [CrossRef]
  20. Thomas, R.J.; Fekkak, A.; Ennih, N.; Errami, E.; Loughlin, S.C.; Gresse, P.G.; Liégeois, J.P. A new lithostratigraphic framework for the Anti-Atlas orogen, Morocco. J. Afr. Earth Sci. 2004, 39, 217–226. [Google Scholar] [CrossRef]
  21. Toummite, A.; Ikenne, M.; Beraaouz, E.H. Geothermobarometry of Askaoun Pluton in Ouzellarh-Sirwa Promontory (Central Anti-Atlas; Morocco). Open J. Geol. 2012, 2, 136–147. [Google Scholar] [CrossRef]
  22. El Arabi, E.H.; Ferrandini, J.; Essamoud, R. Triassic stratigraphy and structural evolution of a rift basin: The Eç Çour basin, High Atlas of Marrakech, Morocco. J. Afr. Earth Sci. 2003, 36, 29–39. [Google Scholar] [CrossRef]
  23. Crósta, A.P.; Moore, J.M. Enhancement of Landsat TM imagery for residual soil mapping in SW Minas Gerais State, Brazil. In Seventh Thematic Conference on Exploration Geology; Environmental Research Institute of Michigan: Ann Arbor, MI, USA, 1989; pp. 1173–1187. [Google Scholar]
  24. Ali, S.; Li, H.; Ali, A.; Hassan, J.I. Lithological discrimination of Khyber Range using remote sensing and machine learning algorithms. Appl. Sci. 2024, 14, 5064. [Google Scholar] [CrossRef]
  25. Velosky, J.C.; Stern, R.J.; Johnson, P.R. Geological control of massive sulfide mineralization in the Neoproterozoic Wadi Bidah shear zone, southwestern Saudi Arabia, inferences from orbital remote sensing and field studies. Precambrian Res. 2003, 123, 235–247. [Google Scholar] [CrossRef]
  26. Ennih, N.; Liégeois, J.P. The boundaries of the West African craton, with special reference to the basement of the Moroccan metacratonic Anti-Atlas belt. Geol. Soc. Lond. 2008, 297, 1–17. [Google Scholar] [CrossRef]
  27. Rockwell, B.W. Automated Mapping of Mineral Groups and Green Vegetation from Landsat Thematic Mapper Imagery with an Example from the San Juan Mountains, Colorado: U.S. Geological Survey Scientific Investigations Map 3252; USGS: Reston, VA, USA, 2013. [Google Scholar] [CrossRef]
  28. Rojas, J.; Fernández, P.; Barrios, M. Characterization of mineral resources using multispectral and hyperspectral imagery. Remote Sens. Appl. Soc. Environ. 2019, 14, 234–245. [Google Scholar]
  29. Rivas, C.; Delgado, J.; Castillo, L. Hyperspectral mapping in mineral exploration: Techniques and results. Geochem. Explor. 2021, 219, 106773. [Google Scholar]
  30. Doll, A.; Müller, R.; Stewart, B.; McDonald, J. A comprehensive review of mineral characterization techniques. Minerals 2020, 10, 977. [Google Scholar]
  31. Davis, G.; Thompson, R.; Evans, M.; Collins, D. Mineralization indicators in volcanic rocks: Case studies and implications. Econ. Geol. 2017, 112, 877–892. [Google Scholar]
  32. Hedenquist, J.W.; Richards, J.P. The influence of hydrothermal alteration on mineral exploration. Soc. Econ. Geol. Spec. Publ. 1999, 7, 67–83. [Google Scholar]
  33. Pichavant, M.; Moret, L.; Bastoul, A. Porphyry systems and their mineralization potential. Minerals 2018, 8, 354. [Google Scholar]
  34. García-Santos, A.; Farias, A.P.; Mendonça, C.A.; Souza, R. Integration of remote sensing and geochemical techniques for mineral exploration. Geochem. Explor. Environ. Anal. 2016, 16, 45–60. [Google Scholar]
  35. Harris, M.; Smith, J. Satellite imagery for mineral exploration: Methods and applications. Int. J. Appl. Earth Obs. Geoinf. 2020, 88, 102072. [Google Scholar]
  36. Khalafallah, A.; Omar, F.; Bendaoud, A. Structural geology and mineralization of the High Atlas Mountains. J. Struct. Geol. 2021, 143, 104267. [Google Scholar]
  37. Lerhris, I.E.; Admou, H.; Alansari, A.; Ibouh, H.; Mouttaqi, A.; Chaib, M.; Admou, S. Mapping and Structural Analysis of Geological Fractures of the Tidili Region, Morocco, Related to South Atlas Fault Zone Using Remote Sensing on Landsat 9 OLI Imagery. Iraqi Geol. J. 2025, 58, 50–72. [Google Scholar] [CrossRef]
  38. Cottam, M.A.; Atkinson, N.; Collins, A.S.; Cox, J. Tectonic influences on mineralization in the Anti-Atlas Mountains. Geol. Soc. Am. Bull. 2016, 128, 345–357. [Google Scholar]
  39. Benouar, D.; Mourabit, A.; Abdellatif, M. Geological and geochemical studies in the Ouarzazate region, Morocco. J. Afr. Earth Sci. 2017, 132, 123–135. [Google Scholar]
  40. Crósta, A.P.; De Souza Filho, C.R.; Azevedo, F.; Brodie, C. Targeting key alteration minerals in epithermal deposits in Patagonia, Argentina, using ASTER imagery and Principal Components analysis. Int. J. Remote Sens. 2003, 24, 4233–4240. [Google Scholar] [CrossRef]
  41. Inoh, H.; Tayebi, M.; Rajji, A. A comparative analysis of lineaments extracted from Landsat 8 OLI & ASTER-GDEM data, Talmakent Area, Western High Atlas, Morocco. Iraqi Geol. J. 2023, 56, 303–315. [Google Scholar] [CrossRef]
  42. Scherrer, P. Bestimmung der inneren Struktur und der Größe von Kolloidteilchen mittels Röntgenstrahlen. Nachrichten von der Gesellschaft der Wissenschaften zu Göttingen, Mathematisch-Physikalische Klasse 1918, 1918, 98–100. [Google Scholar]
  43. Sillitoe, R.H. Porphyry copper systems. Econ. Geol. 2010, 105, 3–41. [Google Scholar] [CrossRef]
  44. Atif, Y.; Soulaimani, A.; Ait lamqadem, A.; Pour, A.B.; Pradhan, B.; Nouamane, E.A.; Abdelali, K.; Muslim, A.M.; Hossain, M.S. Identifying hydrothermally altered rocks using ASTER satellite imageries in Eastern Anti-Atlas of Morocco: A case study from Imiter silver mine. Int. J. Image Data Fusion 2022, 13, 337–361. [Google Scholar] [CrossRef]
  45. Camus, F. The Andean Porphyry Systems. In Super Porphyry Copper & Gold Deposits: A Global Perspective; Porter, T.M., Ed.; PGC Publishing: Adelaide, Australia, 2005; Volume 1, pp. 45–63. [Google Scholar]
  46. O’Connor, J.; Roberts, N.; Cook, G. Applications of XRD in geological studies. Clays Clay Min. 2020, 68, 211–220. [Google Scholar]
  47. Carrino, T.A.; Crósta, A.P.; Toledo, C.L.B.; Silva, A.M. Hyperspectral remote sensing applied to mineral exploration in southern Peru: A multiple data integration approach in the Chapi Chiara gold prospect. Int. J. Appl. Earth Obs. Geoinf. 2018, 64, 287–300. [Google Scholar] [CrossRef]
  48. Ramazani, M.; Safari, H.O.; Shamanian, G.H. Integration of ASTER-based remote sensing with petrographic studies, XRD analysis, and field surveying as a multidisciplinary approach for prospecting Cu mineralization in the Taft-Dehshir region, Iran. J. Appl. Remote Sens. 2022, 16, 014508. [Google Scholar] [CrossRef]
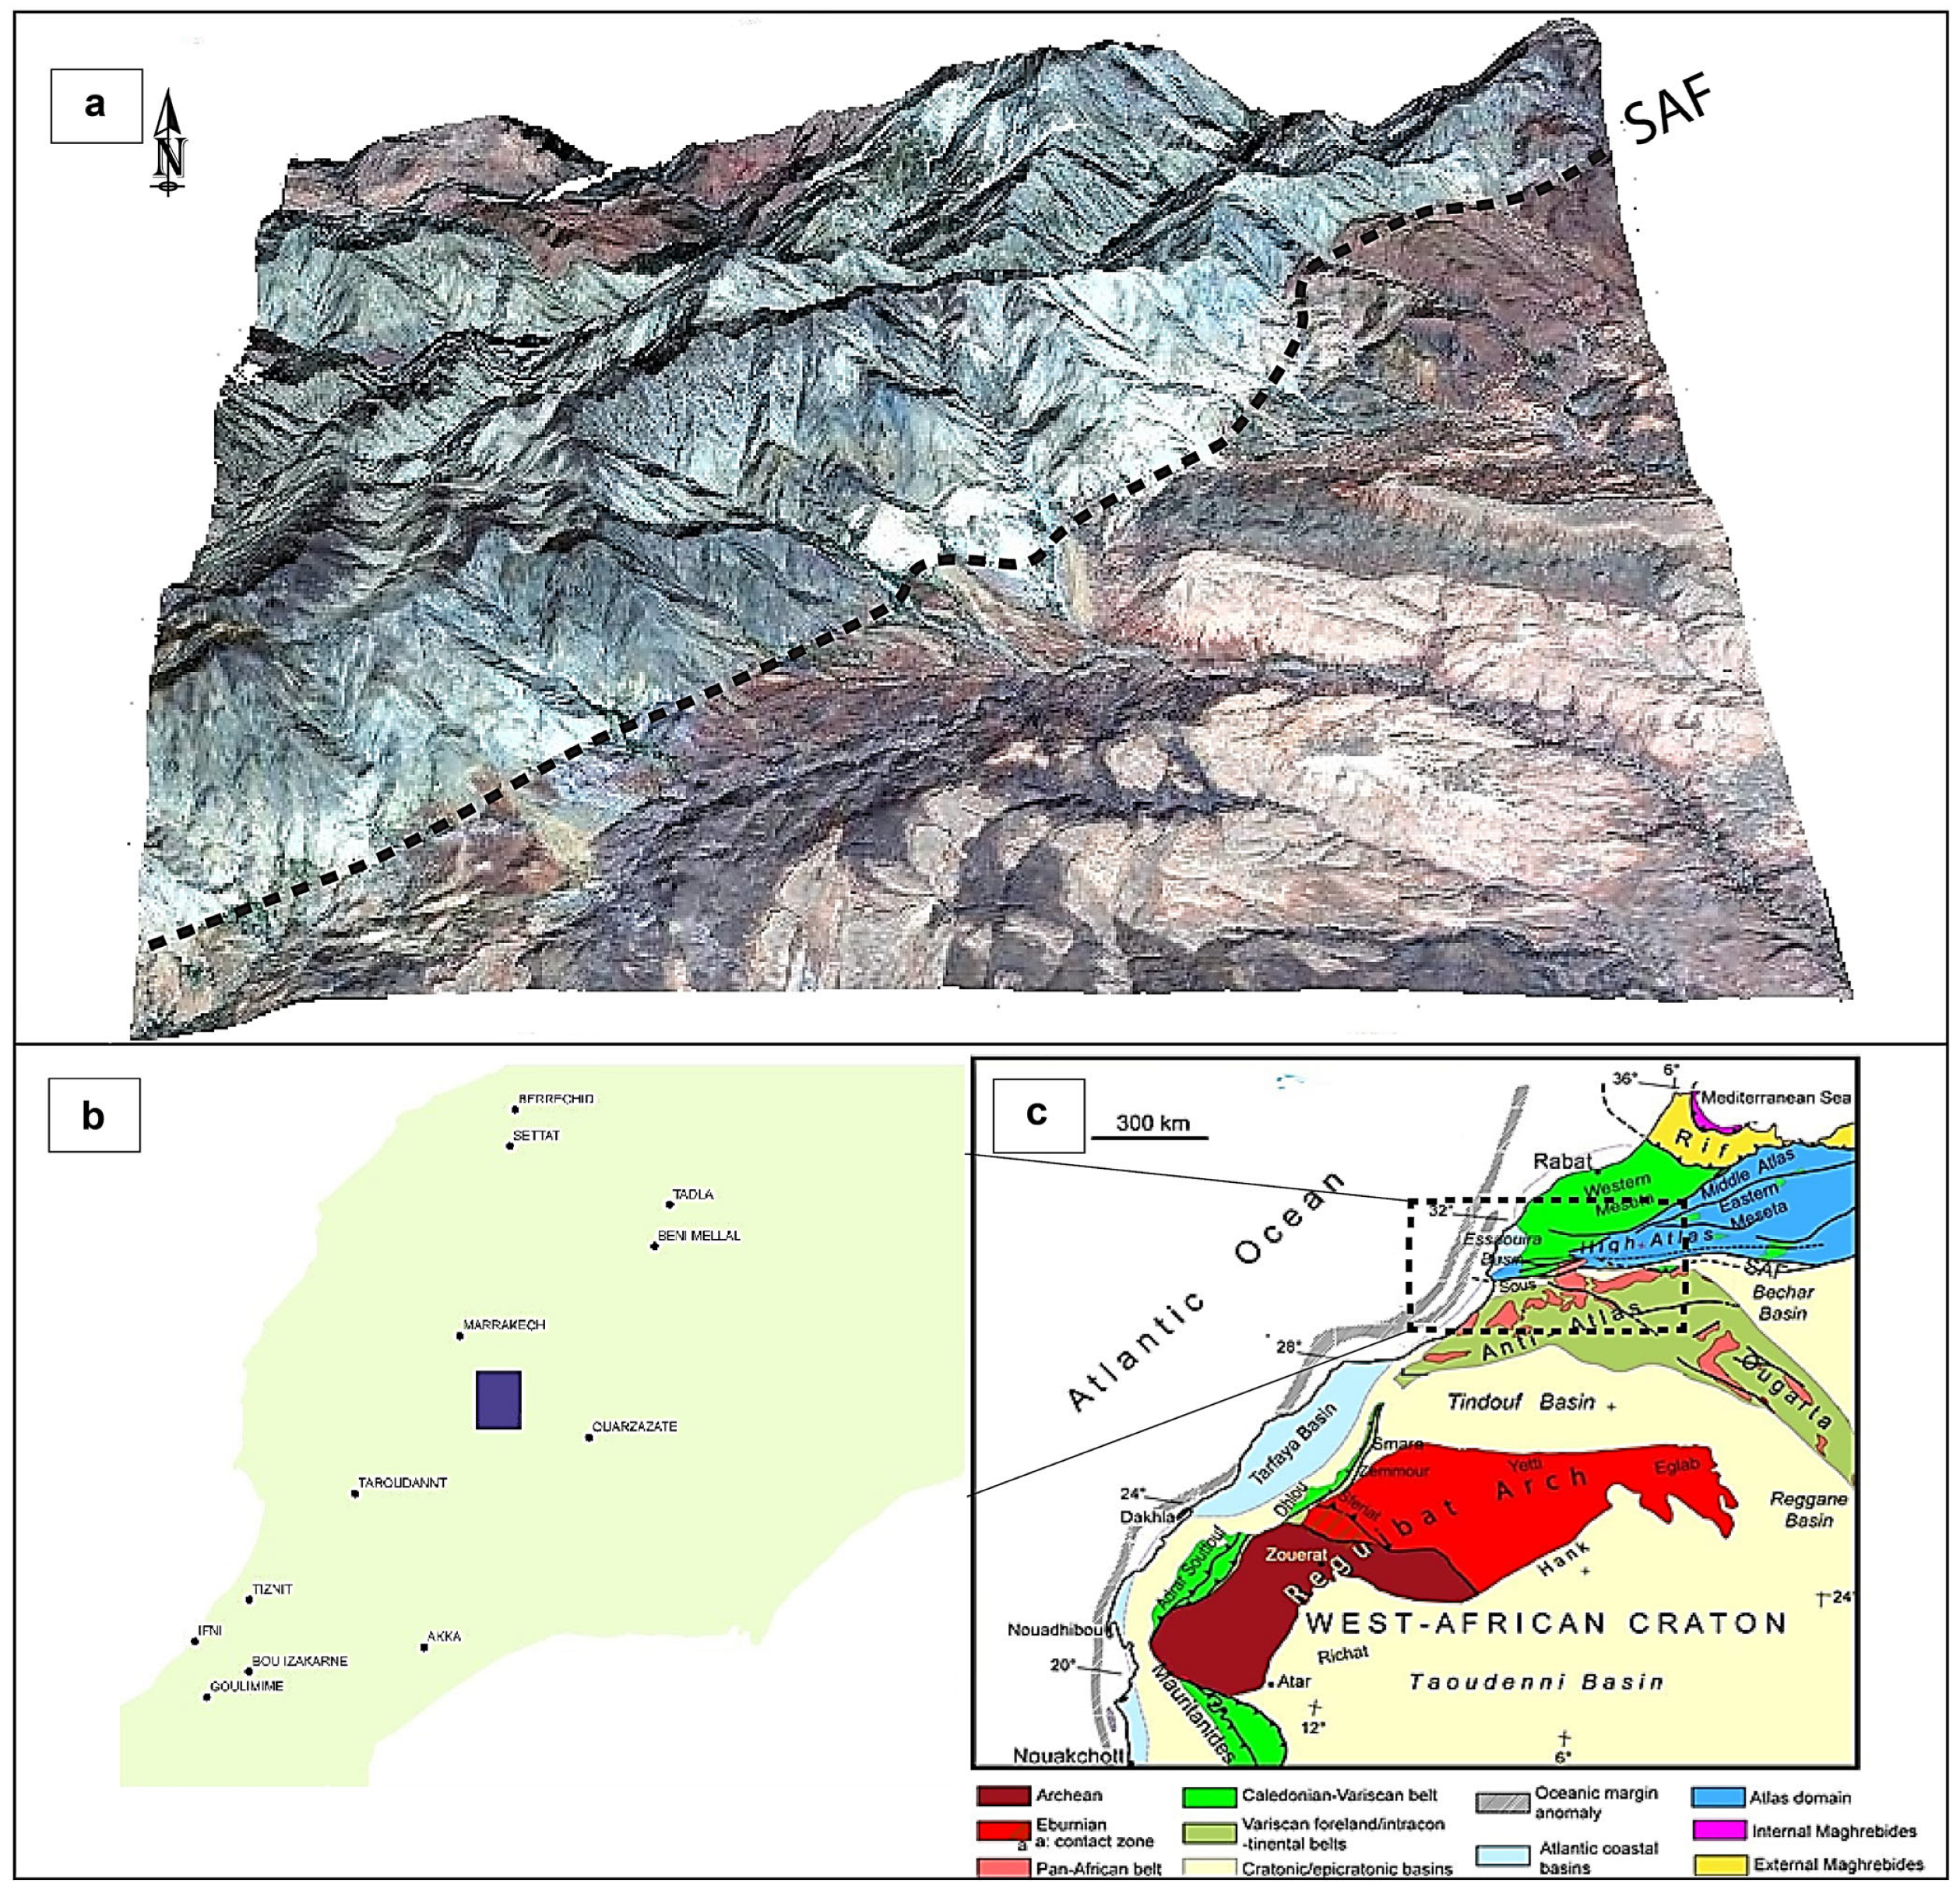
Figure 1. (a) Three-dimensional view of the Tidili region on Sentinel-2, the south Atlasic fault (SAF) is very distinctive in the image, (b) position of the study area within Morocco, (c) structural domains of Morocco in [13].
Geomatics 05 00040 g001
Figure 2. Simplified geological map of the area redrawn after [18].
Geomatics 05 00040 g002
Figure 3. Flowsheet of the methodology adopted in the present study.
Geomatics 05 00040 g003
Figure 4. Distribution of the ASTER band set according to wavelength.
Geomatics 05 00040 g004
Figure 5. Band ratios presenting hydroxyl group alteration and ferrous silicates. (A) ratio 4/7 ASTER; (B) ratio 5/4 ASTER.
Geomatics 05 00040 g005
Figure 6. Ratios for gossans 4/2 ASTER.
Geomatics 05 00040 g006
Figure 7. (a) Muscovite reflectance spectrum. (b) Pyrophyllite reflectance spectrum, from the USGS spectral library. (c) Reflectance spectrum of Dickite, from the USGS spectral library. Adapted from [1,26].
Geomatics 05 00040 g007
Figure 8. (A) ASTER RGB color composite of ratios: (B) 5/6, (C) 7/6, and (D) 7/5.
Geomatics 05 00040 g008
Figure 9. (A) ASTER RGB color composite of ratios: (B) 4/2, (C) 4/5, (D) 5/6.
Geomatics 05 00040 g009
Figure 10. Spectra of advanced clay alteration minerals, according to [27].
Geomatics 05 00040 g010
Figure 11. (A) ASTER RGB colored composite of ratios: (B) (4 + 7)/5, (C) (5 + 7)/6, and (D) (7 + 9)/8.
Geomatics 05 00040 g011
Figure 12. A composite displaying abundance images of Kaolinite, Illite, and Alunite (extracted by the Crósta method) in RGB is superimposed onto a Sentinel RGB image (Band 321). The position and direction of the pictures taken from the field are marked.
Geomatics 05 00040 g012
Figure 13. Field photographs depicting hydrothermal alterations include: (a) Alteration characterized by silicification in pyroclastic sediments; (b) Rhyolitic flows exhibiting advanced argilization, particularly notable near faulting systems; (c) Sandstones displaying kaolinization; (d) Granites undergoing chloritization; (e) Silicification observed in pyroclastic sediments and tuffs; (f) Advanced argilization marked on conglomerates.
Geomatics 05 00040 g013
Figure 14. X-Ray Diffraction Analysis of Rock Samples; Abbreviations noted in Table 1.
Geomatics 05 00040 g014
Figure 15. Locations of XRD samples plotted on the ASTER RGB color composite of ratios: (4 + 7)/5; (5 + 7)/6, and (7 + 9)/8.
Geomatics 05 00040 g015
Figure 16. PCA-derived mineral distribution using Crósta’s technique.
Geomatics 05 00040 g016
Table 1. Identified Minerals from Detailed X-Ray Diffraction Analysis.
Quartz
(Q)
Albite
(A)
Orthose
(O)
Anorthite
(An)
Muscovite
(M)
Illite
(I)
Kaolinite
(K)
Dickite
(D)
Pyrophyllite
(P)
Alunite
(Al)
Li 68XXXX X
Li 70XXXXX
Li 96XXXXX
Li 121XXXXX
Li 130XXX X
Li 152XXX X X
Li 154XXX X X X
Li 163XXX X
Li 169XXX X
Table 2. Reflectance and absorption patterns of hydrothermal alteration minerals in aster bands according to [40].
Alteration minerals
AluniteIlliteKaolinite
Aster bands111
334
556
767
Table 3. Eigenvector analysis conducted on ASTER bands 1, 4, 6, and 7 (Kaolinite).
PCA1PCA4PCA6PCA7
Band 10.171640.899310.40073−0.03449
Band 40.616260.21623−0.75465−0.06300
Band 60.57611−0.324640.42882−0.61549
Band 70.50879−0.197700.293310.78487
Table 4. Data extracted from PCA for each mineral.
KaoliniteAluniteIllite
Band 1−0.61549−0.677620.73073
Band 20.784870.72294−0.66351
Table 5. Correlation Matrix of the ASTER bands.
Layer1234567891011121314
110.99280.981740.960510.966830.965440.966970.967190.970680.956530.956270.956390.957240.95721
20.992810.978910.967480.971770.971840.973340.974120.975090.938120.937930.937740.938530.93796
30.981740.9789110.972390.971020.97090.97060.968640.968680.9460.947060.947740.947850.94707
40.960510.967480.9723910.996310.995810.994060.990560.986440.922820.924180.924870.924650.92342
50.966830.971770.971020.9963110.998660.99670.994970.993010.932780.933750.934310.934440.93346
60.965440.971840.97090.995810.9986610.997230.996380.994650.930960.931840.932390.93220.93109
70.966970.973340.97060.994060.99670.9972310.997760.99440.935310.935980.936470.936630.93556
80.967190.974120.968640.990560.994970.996380.9977610.997080.933960.934220.93460.934850.9338
90.970680.975090.968680.986440.993010.994650.99440.9970810.940040.939810.940010.940370.93971
100.956530.938120.9460.922820.932780.930960.935310.933960.9400410.999840.999720.999490.99933
110.956270.937930.947060.924180.933750.931840.935980.934220.939810.9998410.999920.999690.99947
120.956390.937740.947740.924870.934310.932390.936470.93460.940010.999720.9999210.999680.99946
130.957240.938530.947850.924650.934440.93220.936630.934850.940370.999490.999690.9996810.99993
140.957210.937960.947070.923420.933460.931090.935560.93380.939710.999330.999470.999460.999931
Disclaimer/Publisher’s Note: The statements, opinions and data contained in all publications are solely those of the individual author(s) and contributor(s) and not of MDPI and/or the editor(s). MDPI and/or the editor(s) disclaim responsibility for any injury to people or property resulting from any ideas, methods, instructions or products referred to in the content.