1. Introduction
The field of railways has a very long history. Currently, the greatest interest is focused on high-speed railways (e.g., [
1,
2,
3,
4,
5]). Numerous studies are also conducted on rolling stock and its maintenance (e.g., [
6,
7,
8,
9]). In the field of railway superstructure, the issue of interactions between the system rail vehicle—railway track is being developed on a large scale (e.g., [
10,
11,
12,
13,
14,
15]).
When it comes to track geometry, numerous simplifying assumptions have been introduced into design methodology over the decades. This was primarily due to limited computational capabilities. Progress in this field in the second half of the 20th century radically changed this situation and led to the development of computational algorithms that strictly correspond to a specific geometric situation. Currently, the development of design documentation in the field of railways is carried out using commercial computer software [
16,
17].
At the same time, for some time now one can get the impression that conducting research on the methodology of designing track geometric layouts is of lesser importance. Work in this field is, of course, conducted [
18,
19,
20,
21], but its scope is often limited to specific issues, such as transition curves [
22,
23,
24,
25] or railway turnouts [
26,
27,
28,
29].
Although high-speed railways are currently attracting the most attention, traditional railways, which were most often built in the 19th century, still dominate in terms of length. They are still in operation today, one may get the impression that they are disappearing from the field of research interest, and yet they should be modernized, adapting them to contemporary requirements. This remark applies especially to railway lines running in difficult terrain conditions (e.g., in mountainous terrain), which often feature such specific geometrical arrangements as compound curves and reverse curves. Improving the quality of these lines, leading to an increase in travel speed, requires appropriate modernization activities.
This article is a continuation of the study [
30] and deals with the issue of designing modifications of compound curves, i.e., geometric systems consisting of two successive circular arches of different radii, directed in the same direction and directly connected to each other. Compound curves are currently used on tram lines. They were used on railways until the middle of the last century; then they were basically not made there anymore. However, those built earlier still exist on many railway lines, creating specific operational problems caused by the rapid changes in curvature that occur on them. They were also less affected by the progress in computational technology that occurred later. From a scientific point of view, the interest in the discussed problem is limited, and selected practical aspects of the issue are rather exposed [
31].
In relation to railway lines, the first step is to be able to recreate (i.e., model) the existing geometric layout with compound curves, so that it is then possible to correct the horizontal ordinates in the area where the circular arches connect. For this purpose, it was necessary to develop an effective method for designing such a layout, which, however, by definition, will not be used to determine the coordinates of a new compound curve, but to model the existing layout with a view to its later modification.
In [
30], an analytical method of modeling compound curves on railway lines was presented. In this method, individual elements of the discussed geometric systems are described using mathematical equations [
32]. Its final effect is a set of horizontal coordinates in the appropriate global system (in Poland—in relation to flat coordinates—it is the national spatial reference system PL-2000 [
33]). The actual design is carried out in the appropriate local Cartesian coordinate system, which is based on symmetrically set neighboring main directions of the route. In order to obtain such a setting of main directions, an appropriate transformation (i.e., shift and rotation) of the global system must be performed. The origin of the local coordinate system is located at the point of intersection of both main directions, whose Cartesian coordinates in the global system are known.
2. Compound Curve Modeling Procedure
Design activities carried out in the global rectangular coordinate system, i.e., creating a polygon of the main directions of the route and determining the mathematical equations of these directions, the coordinates of their intersection points (i.e., the main points
W) and the angles of return, were presented in [
30]. This work also explains the method of creating a local coordinate system for a given area of changing the route direction, which consists of shifting the origin of the global system to the point of intersection of two adjacent main directions (i.e., the point with coordinates
YW,
XW), and then rotating the shifted system by such an angle
β as to obtain a symmetrical setting of the main directions in the local coordinate system
x,
y.
It should be noted that the setting of the main directions of the route in the PL-2000 system can be very diverse. However, after the transformation to the local coordinate system, there are only two possibilities for the location of the designed geometric system: under the x axis, with negative ordinates and the convexity of the curvilinear elements directed upwards, and above the x axis, with positive ordinates and the convexity of the curvilinear elements directed downwards. Therefore, when determining the appropriate calculation algorithms, two possible cases had to be taken into account:
Case I—for a geometric system located below the W vertex and resulting negative ordinates, and
Case II—for a geometric system located above the W vertex and resulting positive ordinates.
In [
30], when determining the formulas for the coordinates of characteristic points in the local coordinate system, both possible cases were taken into account. The design of the geometric system is carried out in several stages.
In order to be able to operate in the local coordinate system, it is necessary to first perform an auxiliary procedure, the purpose of which is to determine the basic calculation quantities. These quantities concern the regions of the geometric system connecting the ends of the extreme straight segments (i.e., the beginnings of the transition curves) with the connection point of both circular arcs. This refers to the lengths of the projections of both transition curves and circular arcs on the horizontal and vertical axis. The determined coordinates of the connection point of the circular arcs with each other are of key importance from the point of view of further actions.
Based on the above-mentioned calculation values, the connection of both existing horizontal arcs is carried out, first realized in the appropriate auxiliary system and then transferred to the local system. In [
30] a set of formulas for the coordinates of characteristic points and formulas for determining the coordinates of the geometric system between these points is presented.
As a result of the design procedure, an appropriate geometric system is obtained in the local coordinate system.
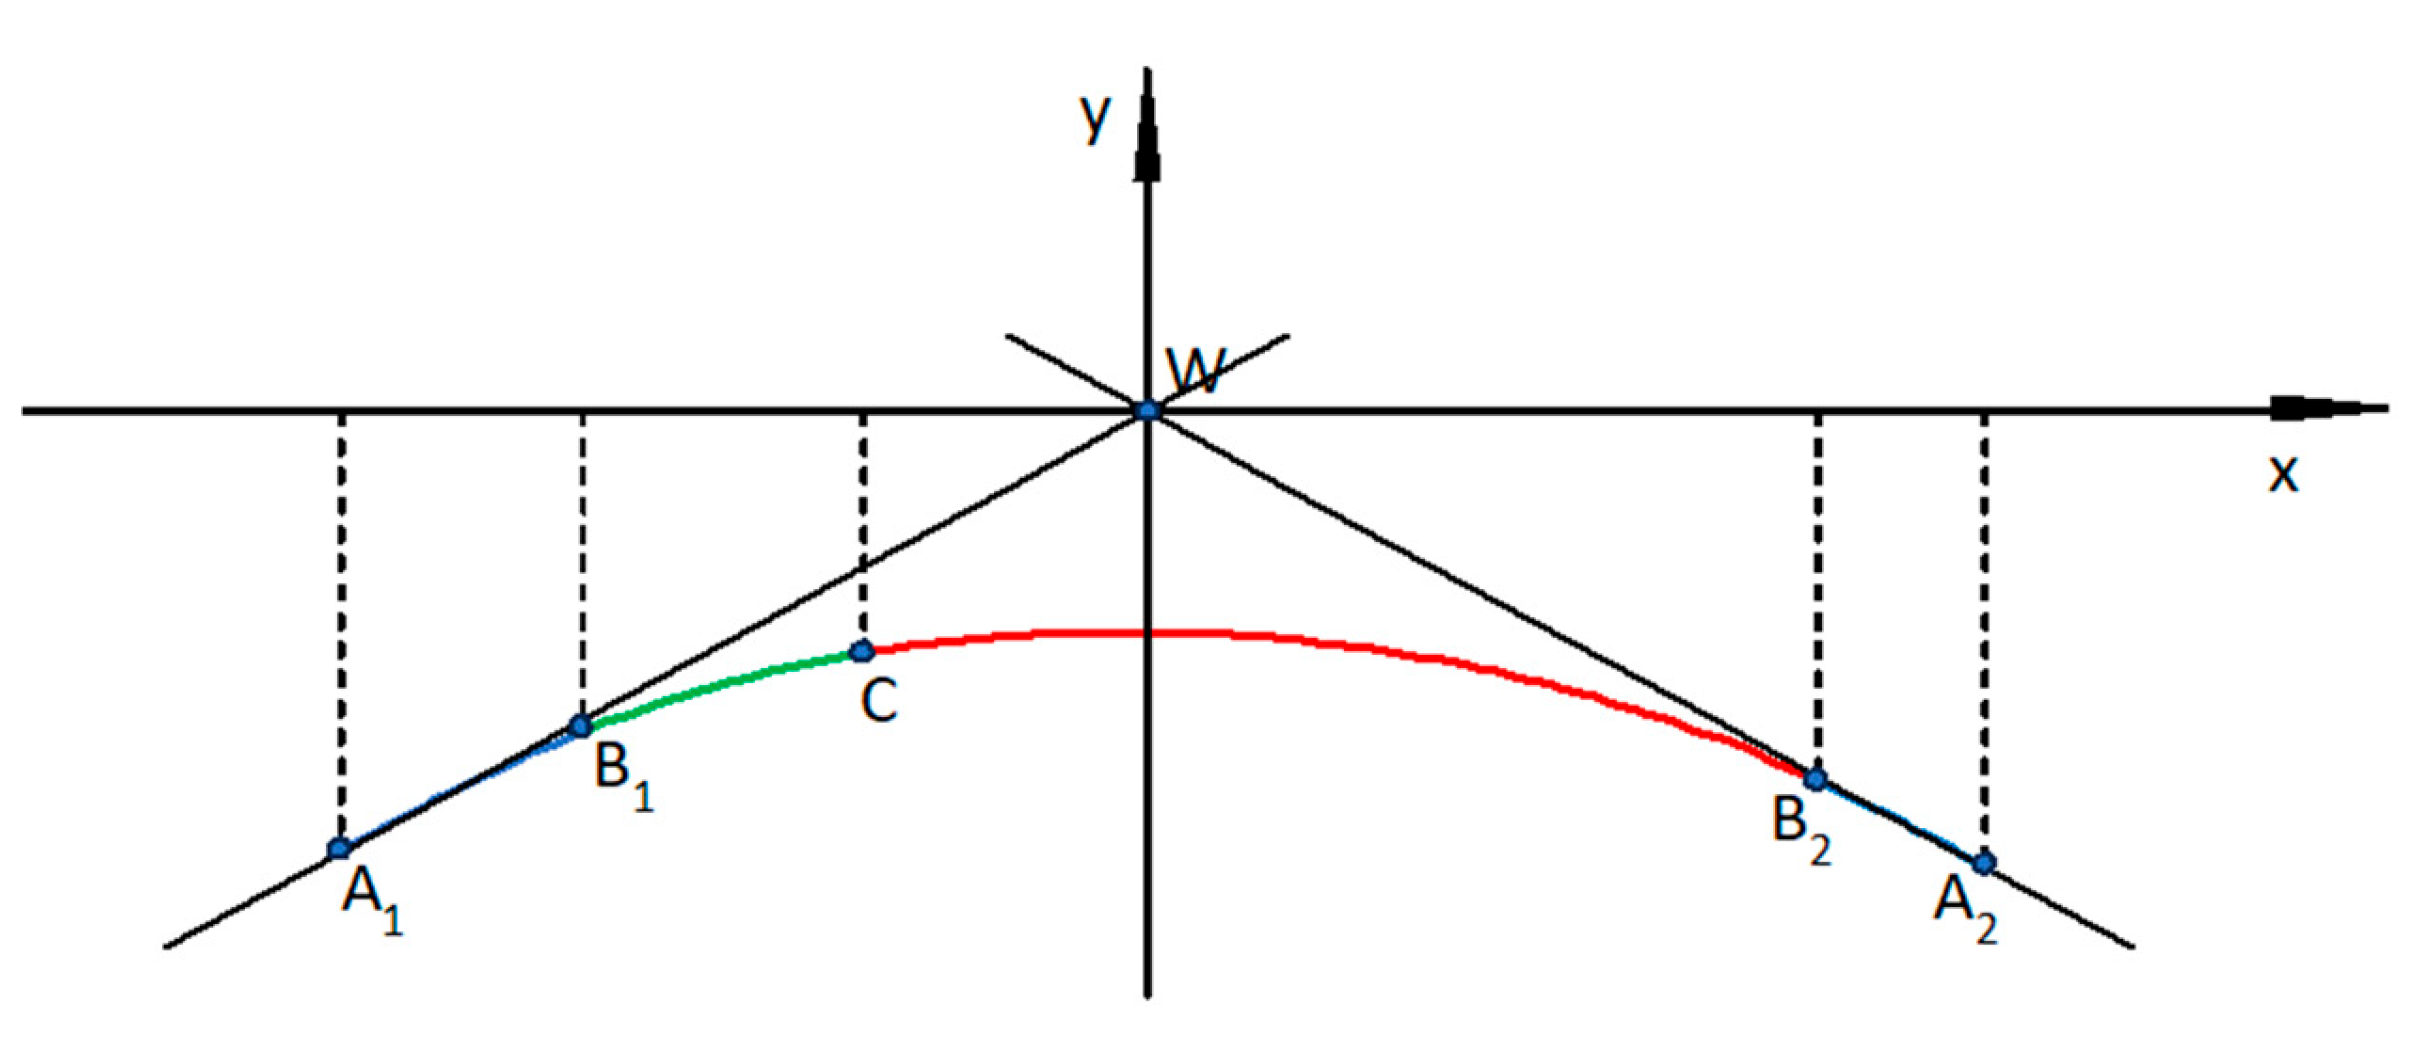
Figure 1 shows an example of such a system, in this case located under the
x axis. In this figure, the first circular arc
B1C is marked in green, the second circular arc
CB2 in red, and the transition curves
A1B1 and
A2B2 in blue.
The designations of the characteristic points are as follows:
A1—assumed beginning of the geometric system (beginning of the first transition curve),
B1—end of the first transition curve,
C—designated connection of both circular arcs,
B2—end of the second transition curve,
A2—end of the geometric system (beginning of the second transition curve). In this situation, between points
A1 and
B1 in
Figure 1 there is a transition curve
TC1, and between points
A2 and
B2 there is a transition curve
TC2. These curves are related—respectively—to circular arcs
CA1 (between points
B1 and
C) and
CA2 (between points
C and
B2).
Finally, the obtained solution is transferred to the PL-2000 system using the transformation formulas given in [
34].
3. Method of Modifying the Compound Curve
3.1. The Idea of Solving the Given Problem
The modification of the compound curve consists of eliminating the direct connection of both horizontal arches by introducing an appropriate transition curve between them. It is marked as curve
TC3 and will be located in the area of the connection of both circular arches (i.e., point
C). The minimum length of this curve should meet the applicable kinematic conditions. After adopting the length
l3, the coordinates of the extreme points of the transition curve (i.e., points
P1 and
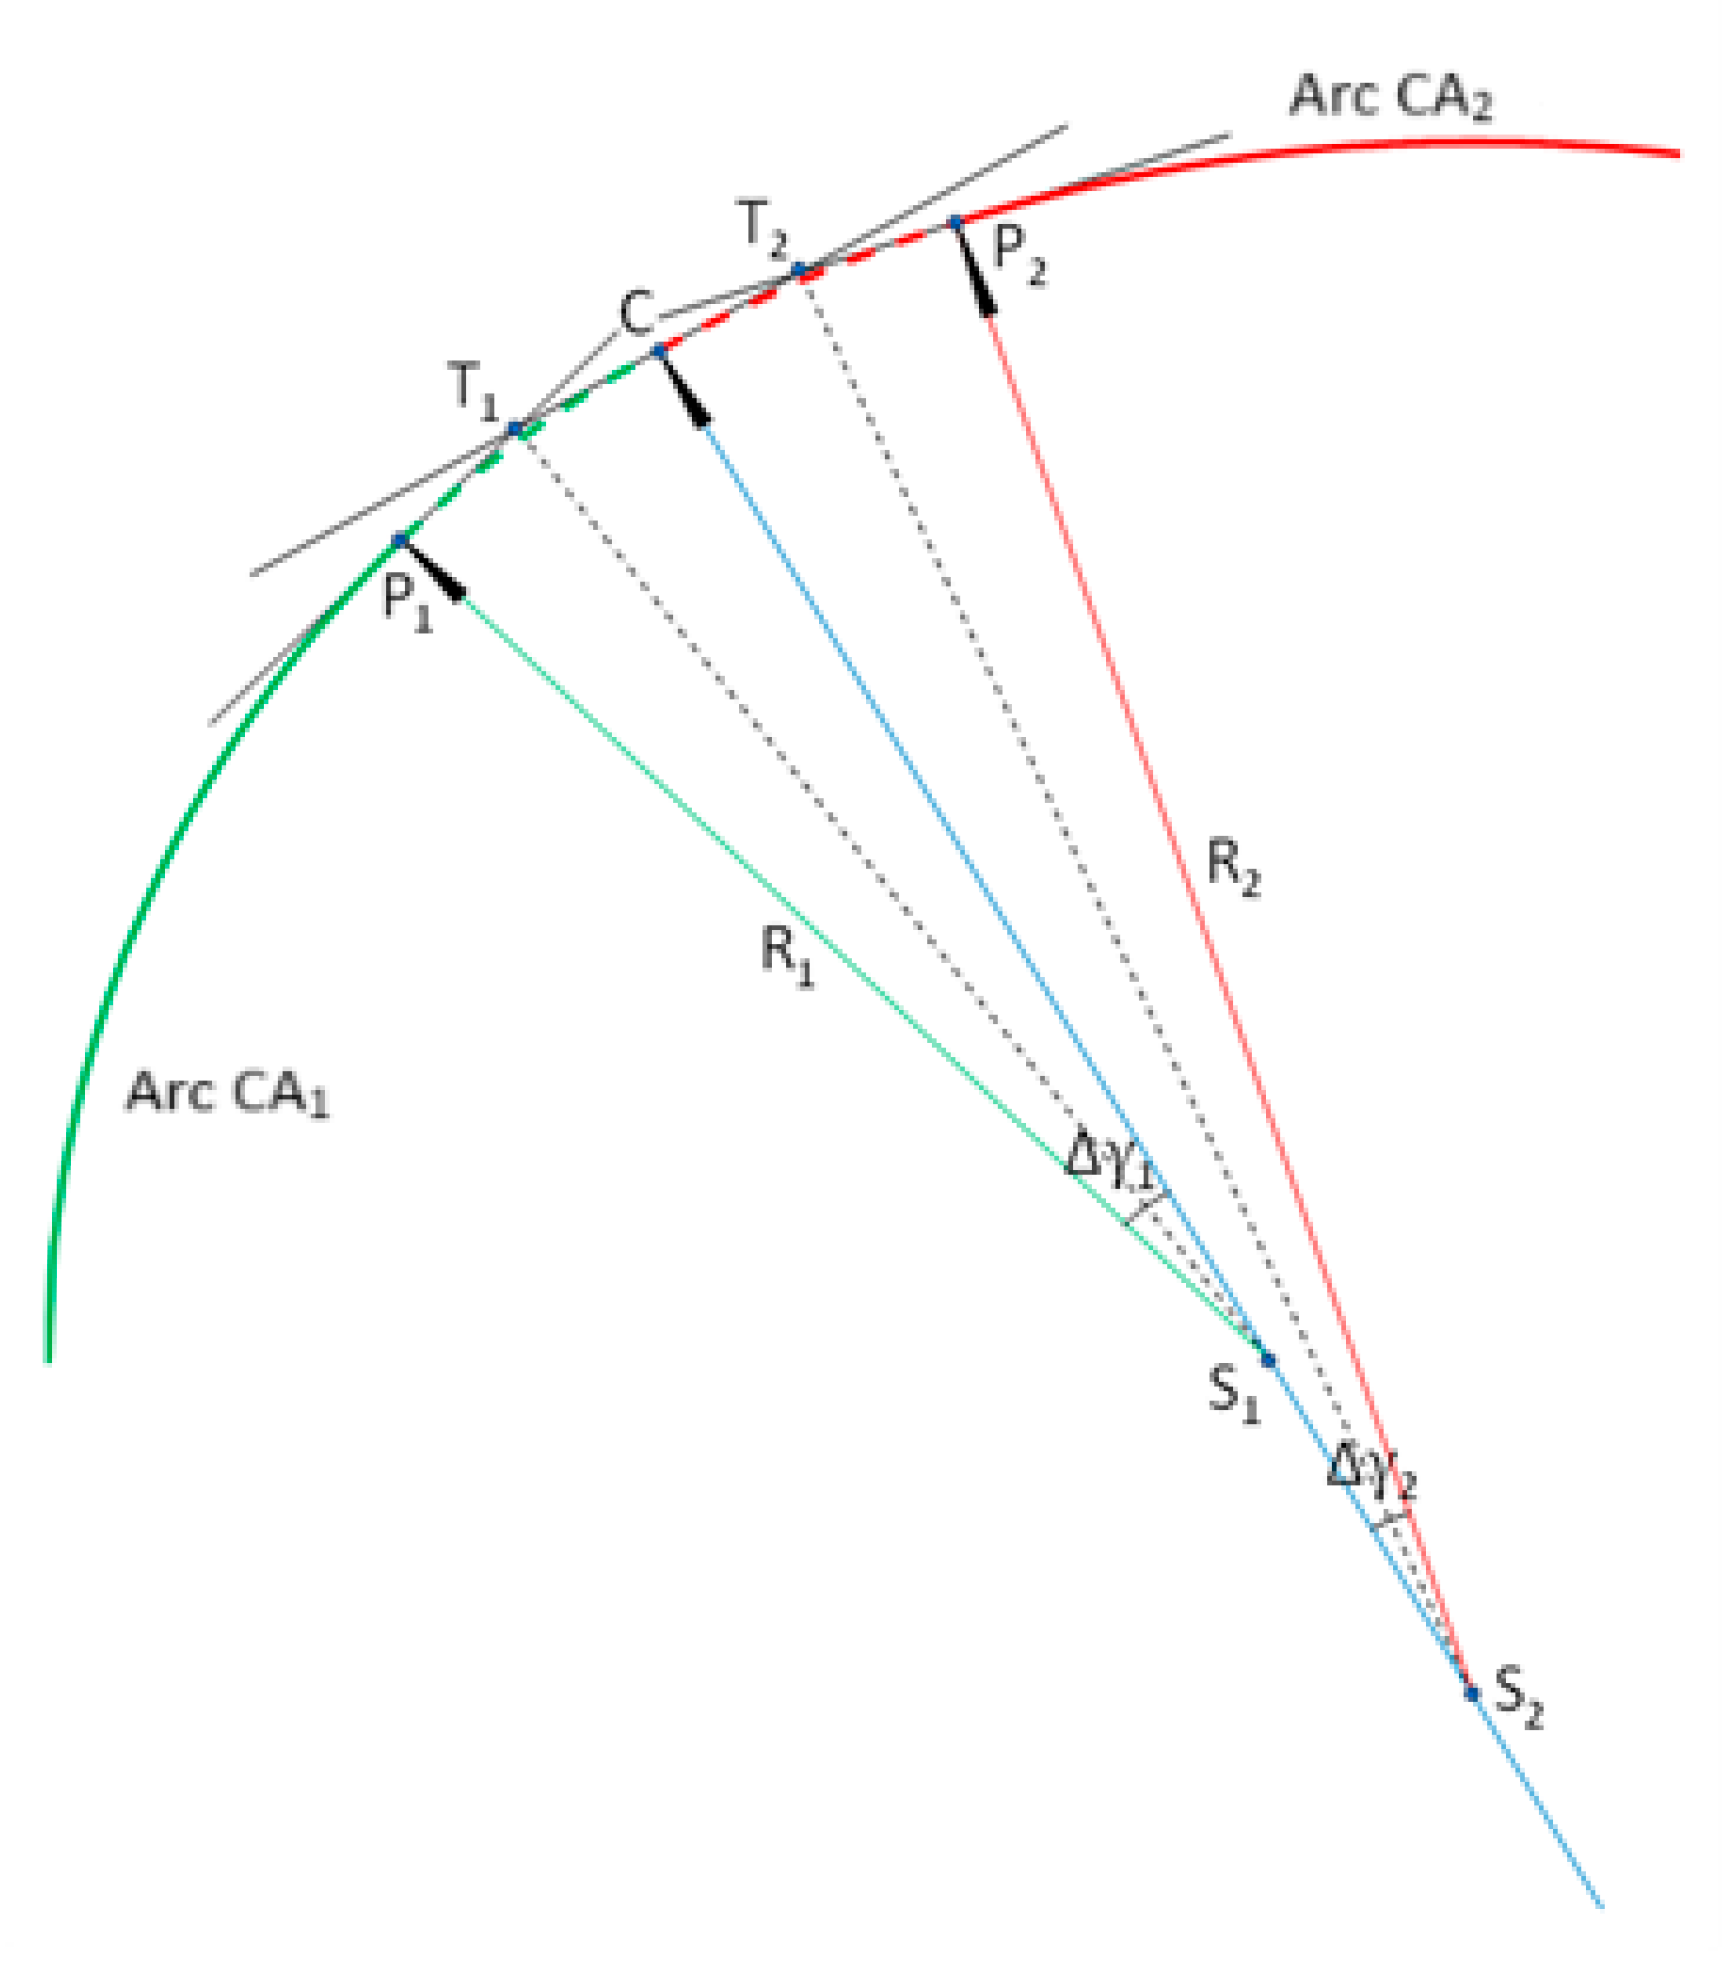
P2) should be determined (
Figure 2).
The starting point P1 is located on the arc CA1, at a distance of l3/2 from point C. The ending point P2 is located on the arc CA2, at the same distance from point C. Unfortunately, at this stage we do not yet know the equation of the transition curve, so when determining the coordinates of points P1 and P2 we must assume that the lengths l3/2 also apply to the contacting segments of horizontal arcs (which are deleted). In the next stage, in the vacant space, between points P1 and P2, we should insert the curve TC3, determining its form based on the appropriate differential equations (when the required boundary conditions are met).
3.2. Determination of the Position of the Extreme Points of the Transition Curve TC3
To determine the coordinates of points
P1 and
P2, we must first determine the coordinates of the centers of both connected circular arcs in the local coordinate system. This is done using the knowledge of the calculation parameters of point
C—the abscissa
xC, the ordinate
yC and the inclination of the tangent
sC [
30]. The centers of both arcs (points
S1 and
S2)) lie on the line perpendicular to the tangent at point
C, at distances
R1 and
R2 from this point (
Figure 2). The corresponding formulas are presented in
Table 1. In the formulas for the abscissa values, the sign of the inclination of the tangent
sC plays an important role.
When determining the position of point
P1, the central angle
plays a decisive role. It is for this point
and for point
P2These angles are shown in
Figure 2 for Case I, with
sC > 0. The values of the angles Δ
γ1 and Δ
γ2 directly result in the slopes of the tangent at points
P1 and
P2. For Case I, they are
and for Case II
When determining the coordinates of points
P1 and
P2, the sign of the inclination of the tangent at point
C plays an important role. Knowing the coordinates of this point and the coordinates of the centers of both circular arcs, the coordinates of points
T1 and
T2 are first determined (
Figure 2). After determining them, it is possible to determine formulas for the coordinates of the beginning and end of the transition curve. They have the same form for Case I and Case II. A list of these formulas is provided in
Table 2.
The equation of the linear curvature
κ(
l) on the
TC3 transition curve would be:
and the parametric equations of the curve were described by the formulas given in [
35]:
However, there is a serious problem: we know the Cartesian coordinates of the connected points, but we do not know the transition curve corresponding to the length
l3, because the coordinates of points
P1 and
P2 were determined along a circular arc. Moreover, the parametric equations of the curve, determined in the manner given in [
35], would not take into account the conditions of tangency at the initial and final points, which plays a key role in the case under consideration. Therefore, the problem should be solved by omitting the equation of the curvature
κ(
l), determining the coordinates
y(
x) of the transition curve directly. Since the curvature
κ(
l) will not constitute the initial basis, the adopted procedure may in some situations result in certain disturbances in the obtained curvature graph.
4. Determination of the TC3 Transition Curve
The introduction of a transition curve aims to smoothly connect adjacent geometric elements, which in this case are two congruent circular arcs with radii R1 and R2. The goal here is not only to ensure continuity of the connection but also to achieve a smooth change in curvature (ideally, it should be monotonic along the entire length of the curve). From the perspective of rail vehicle dynamics, the shape of the transition curve (i.e., the class of the function describing the curvature) and its length (the generated dynamic interactions decrease with increasing curve length) play a significant role.
The transition curve sought connects points
P1 and
P2, whose coordinates are defined by the formulas given in
Table 2. The values of the tangent slope at these points are also known, determined using Formulas (3) and (4) or (5) and (6). In order to simplify the procedure of determining the transition curve, an auxiliary coordinate system
,
was introduced, in which
,
. Additional symbols were also added:
and
; this means that
and
. The effects of using the determined equations of the transition curve will be analyzed in detail in the presented test geometric system. Inserting the transition curve into the local coordinate system
x,
y consists of taking into account the relations:
,
.
4.1. Transition Curve Determined Without Taking into Account Curvature Conditions
The elementary form of the transition curve (denoted as curve
TC(
a)) satisfies the following conditions:
and the adopted differential equation
The general solution of the differential problem (7), (8) is a third-degree polynomial
where
The general formula for the curvature of the determined curve is as follows:
where
4.2. Transition Curve with Simplified Curvature Conditions
Boundary conditions (7) do not include the curvature values at points
P1 and
P2. In order to take into account the curvature of the track axis to some extent, the approximate formula was used
used in the past, among others, when determining the equations of transition curves on railway lines [
36]. This allowed the extension of conditions (7) to the following form:
where
κP1 = 1/
R1,
κP2 = 1/
R2. In a given situation, the differential equation should be assumed
The solution of the differential problem (12), (13) is a fifth-degree polynomial (denoted as the curve
TC(
b))
where
To determine the curvature, use formula (10), inserting the values of the derivatives
4.3. Transition Curve with Strict Curvature Conditions
As it turns out, it is possible to use a strict formula for curvature in the considered design task. Based on formula (10), we can write that
At points
P1 and
P2 the values of
and
are known, which allows us to formulate strict conditions for the curvature. This leads to the correction of conditions (12); they take the form
where
After solving the differential problem (13), (15), the general form of the transition curve (marked as the
TC(
c) curve) is obtained, written by Equation (14), where
The curvature of the TC(c) curve is determined in a similar way as for the TC(b) curve.
5. Test Geometric System
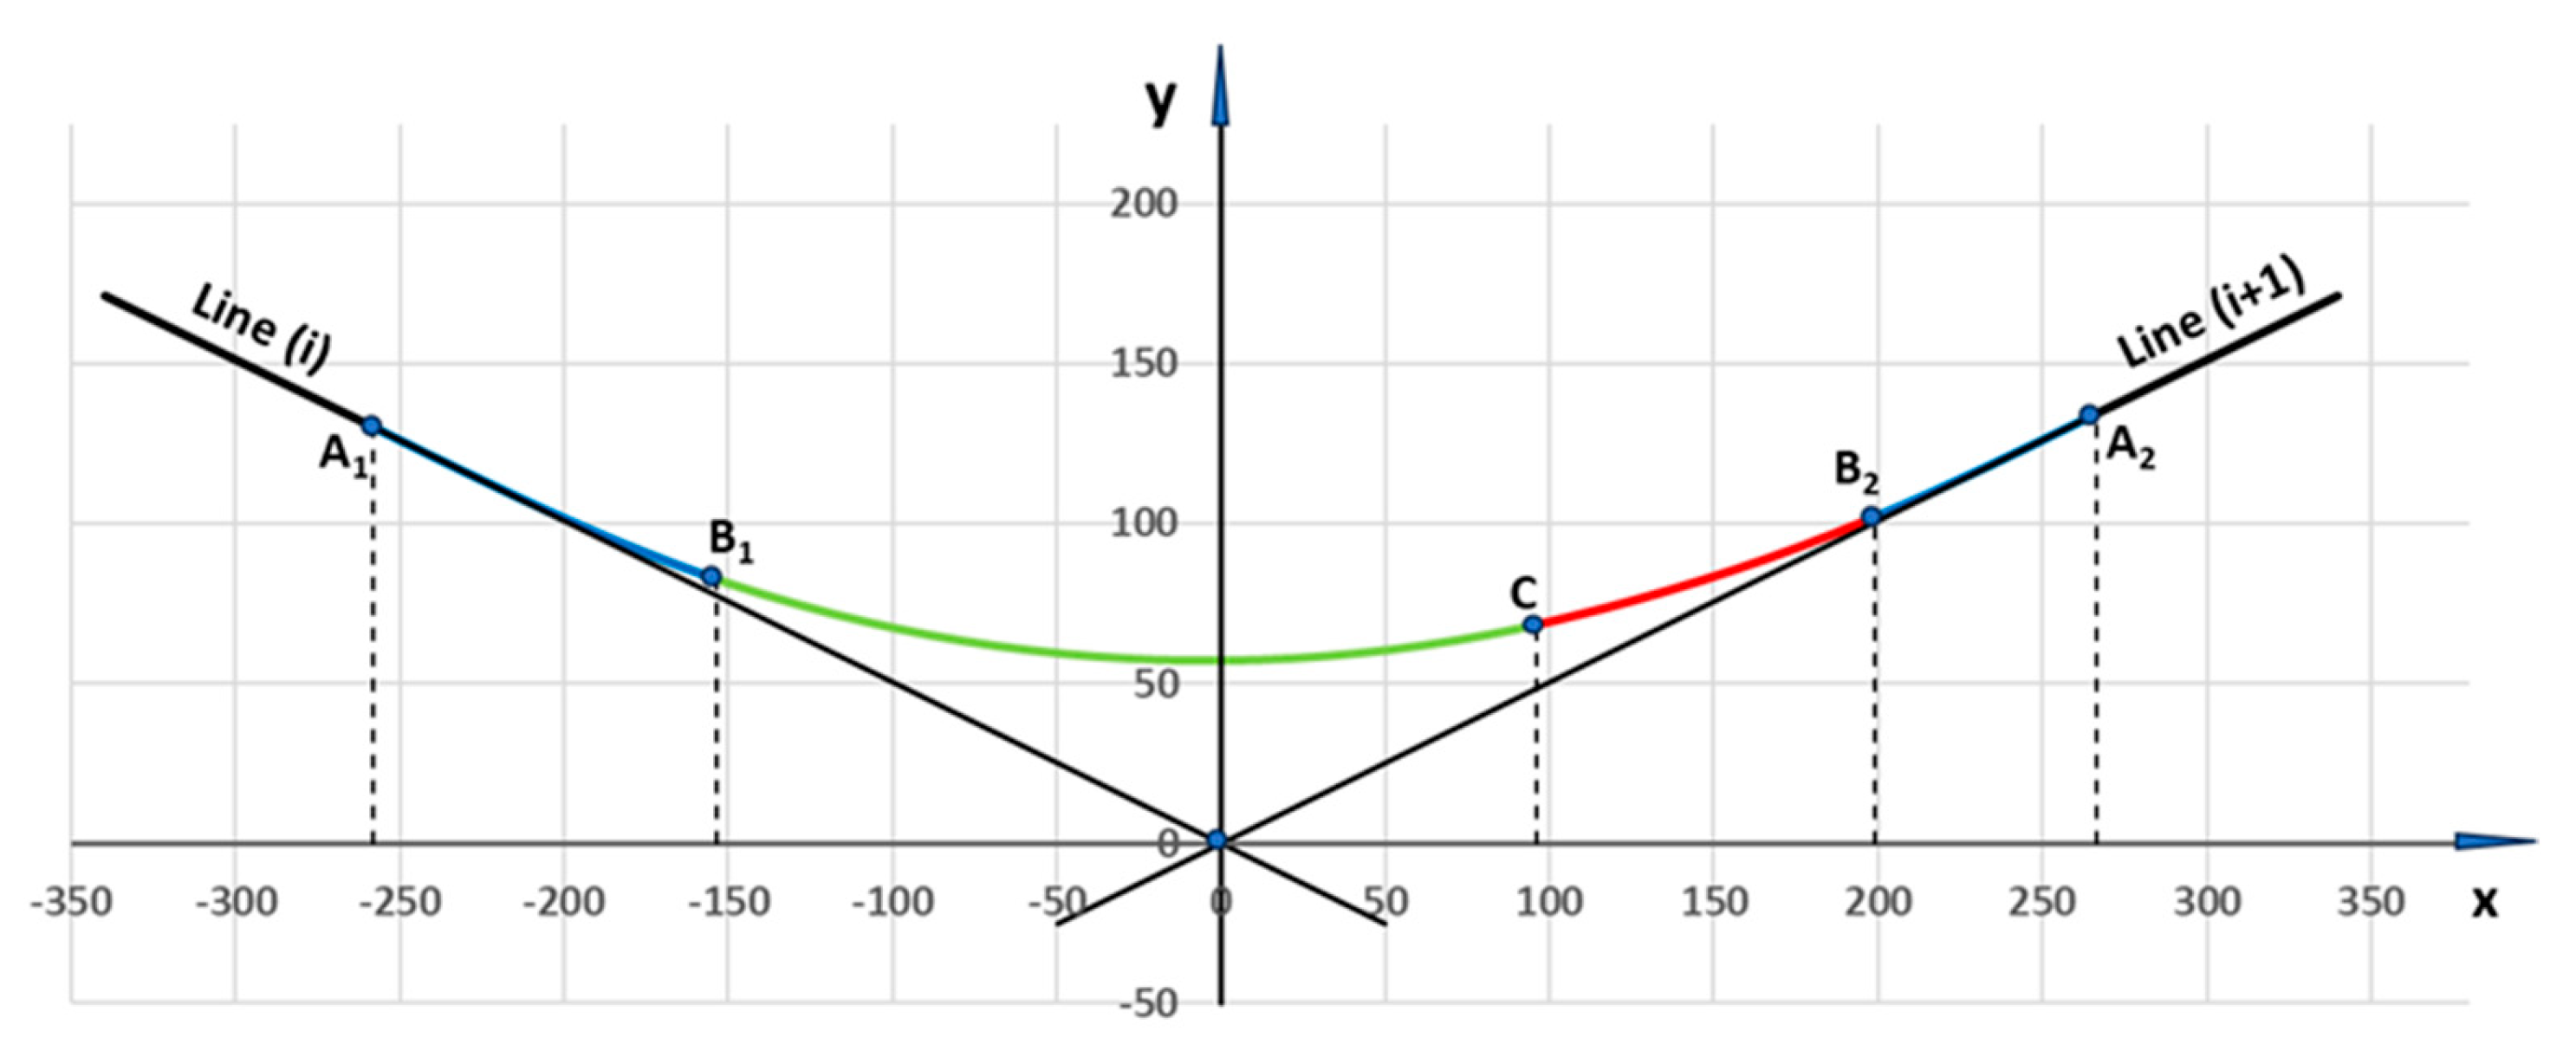
The method of modifying the compound curve will be presented for the test geometric system shown in
Figure 3. The assumed speed of trains on this system is
V = 90 km/h. The compound curve is formed by two circular arches: the
CA1 arch with radius
R1 = 450 m and the
CA2 arch with radius
R2 = 600 m, together with the appropriate transition curves in the form of a clothoid: the
TC1 curve with length
l1 = 115 m and the
TC2 curve with length
l2 = 75 m. The coordinates of the centers of the existing circular arches are:
xS1 = −3.941 m,
yS1 = 507.321 m (for the
CA1 arch) and
xS2 = −37.362 m,
yS2 = 653.550 m (for the
CA2 arch). In a given situation, the modeled geometric system is located above the
x axis (i.e., it is included in Case II).
Table 3 presents the parameter values of characteristic points.
The modification of the compound curve will concern the route area located before point
C (in arc
CA1) and after point
C (in arc
CA2). Therefore, it will be important to know the equations of both circular arcs. Arc
CA1, for which
, is described by the equation
while the arc
CA2, for which
, is described by the equation
The transition curves with lengths
l3 = 40 m, 60 m, 80 m and 100 m will be subjected to a detailed analysis. Focusing on geometric aspects, dynamic effects, which decrease with increasing curve length, were not considered. The focus was on assessing the appropriate horizontal ordinates, or more precisely, the differences between these ordinates and the original state. This is related to the issue of feasibility, i.e., the accuracy of the corrected geometric layout.
Table 4 gives the coordinates and tangent values of the corresponding points
P1 and
P2.
6. General Assessment of the Situation
In order to make a general assessment of the obtained solutions, the determined ordinates of the transition curves
TC(
a),
TC(
b) and
TC(
c) with length
l3 = 60 m were considered. As it turns out, on an uncontaminated scale the corresponding graphs basically coincide; moreover, this also applied to the removed sections of both circular arcs. Therefore, there is only one possibility to assess the situation: comparing the relative differences of the horizontal ordinates, with respect to the original state.
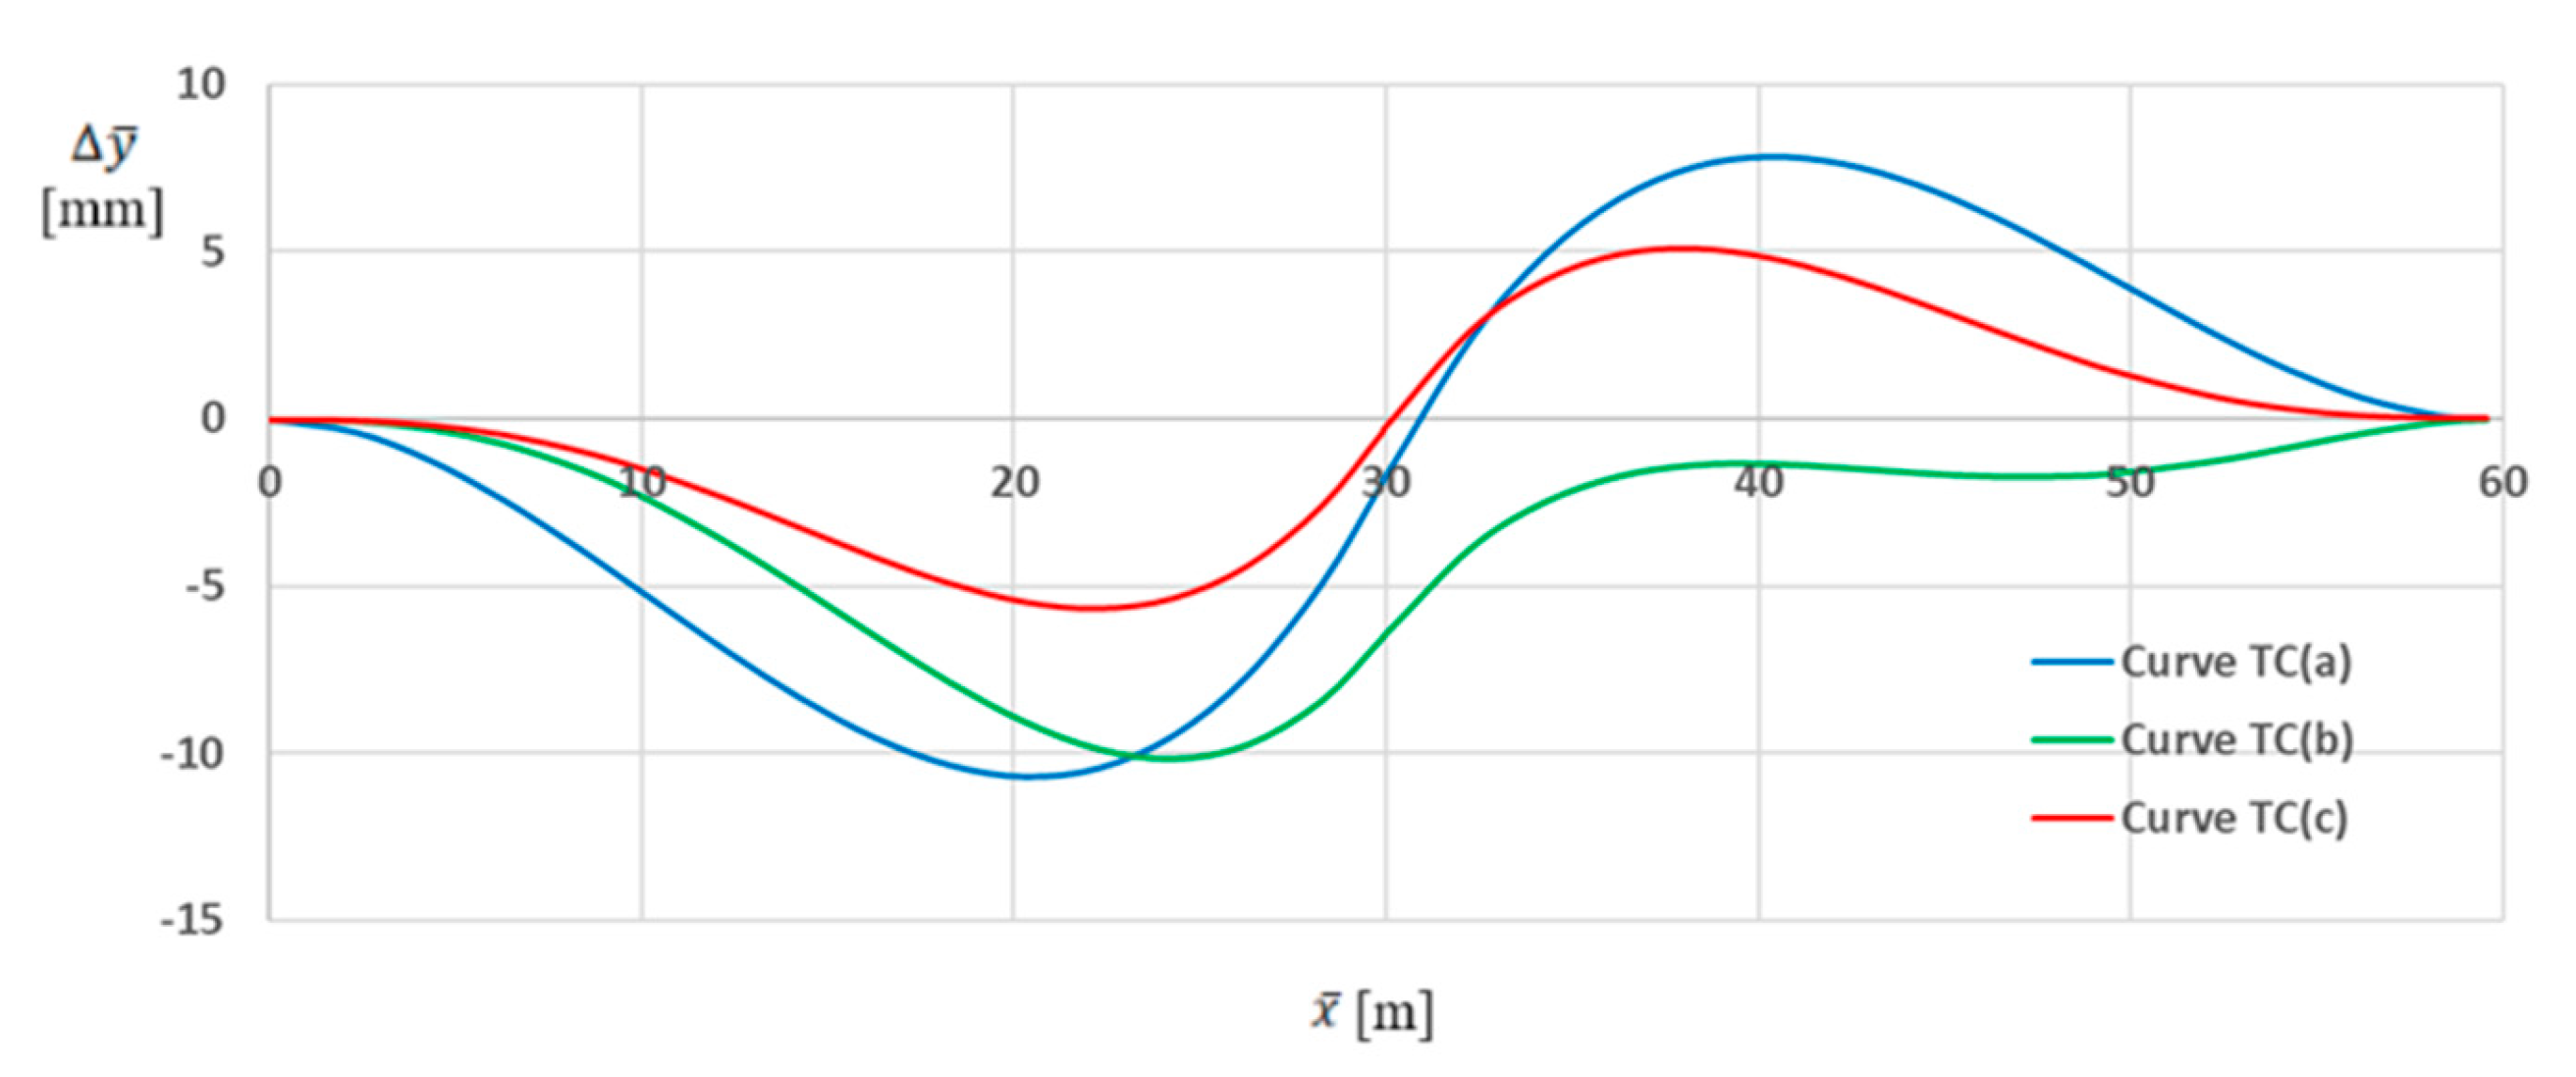
Figure 4 shows the graphs
for the considered transition curves.
As can be seen, the values
for
l3 = 60 m are small, although their nature for the individual transition curves is different. The
TC(
a) curve deviates the most from the original shape in this situation (the difference is bilateral, in the range of
mm). For the
TC(
b) curve, the difference is unilateral and reaches the order of 10 mm, while for the
TC(
c) curve, it is bilateral and in the range of
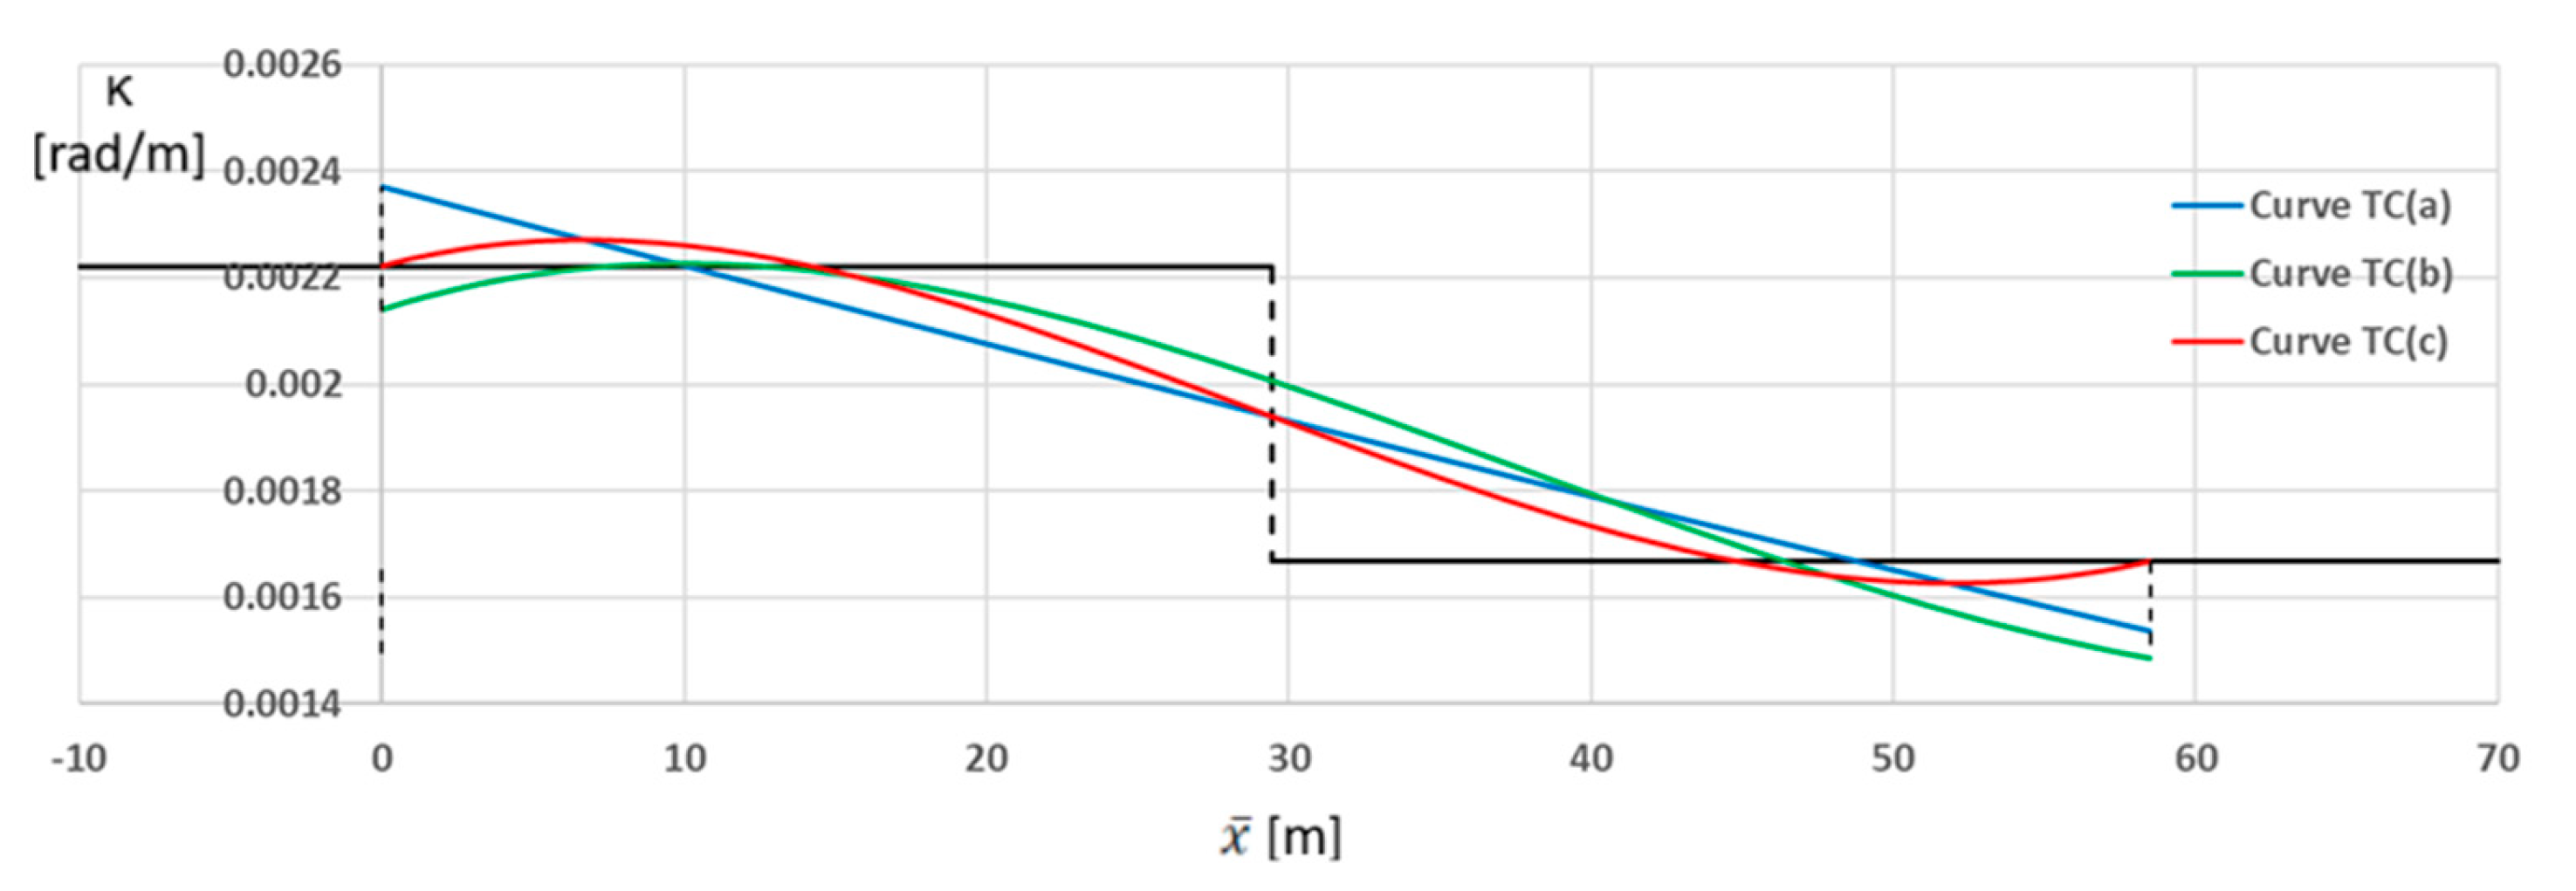
mm. However, it would be difficult to draw final conclusions on this basis without checking the curvature that occurs. The corresponding graphs
are shown in
Figure 5. The black horizontal lines indicate the values of the constant curvature on the
CA1 arc (left side) and the
CA2 arc (right side).
The graphs in
Figure 5 show that the matter is more complicated. Transition curves provide a change in curvature at the connection of circular arcs, but this does not always happen smoothly. The abrupt changes in curvature in the initial and/or final regions question the usefulness of using some transition curves. This will be discussed in detail for individual curves.
7. Determination of the Curvature Occurring
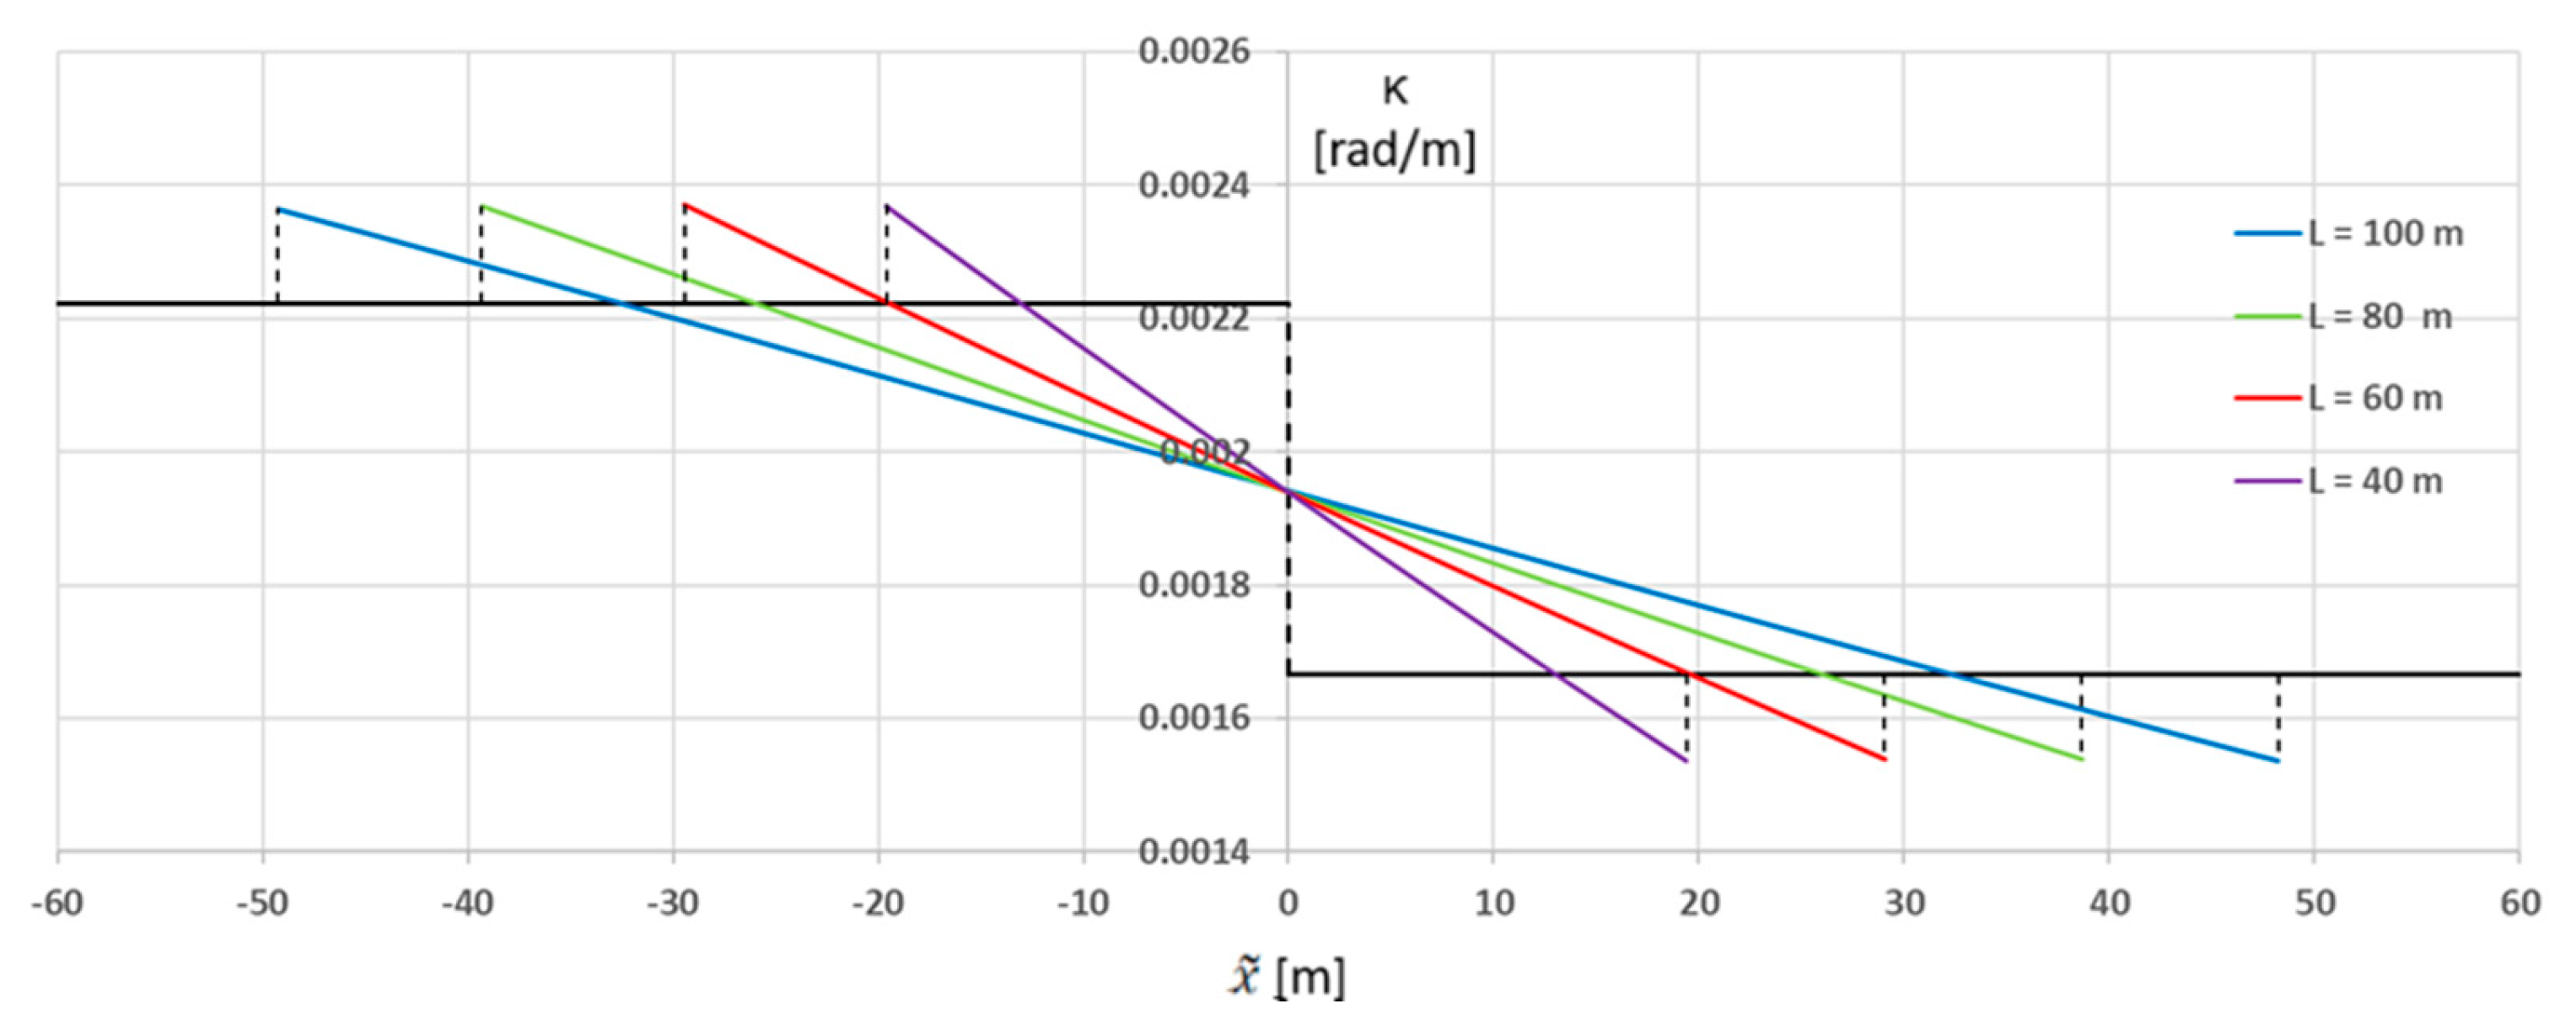
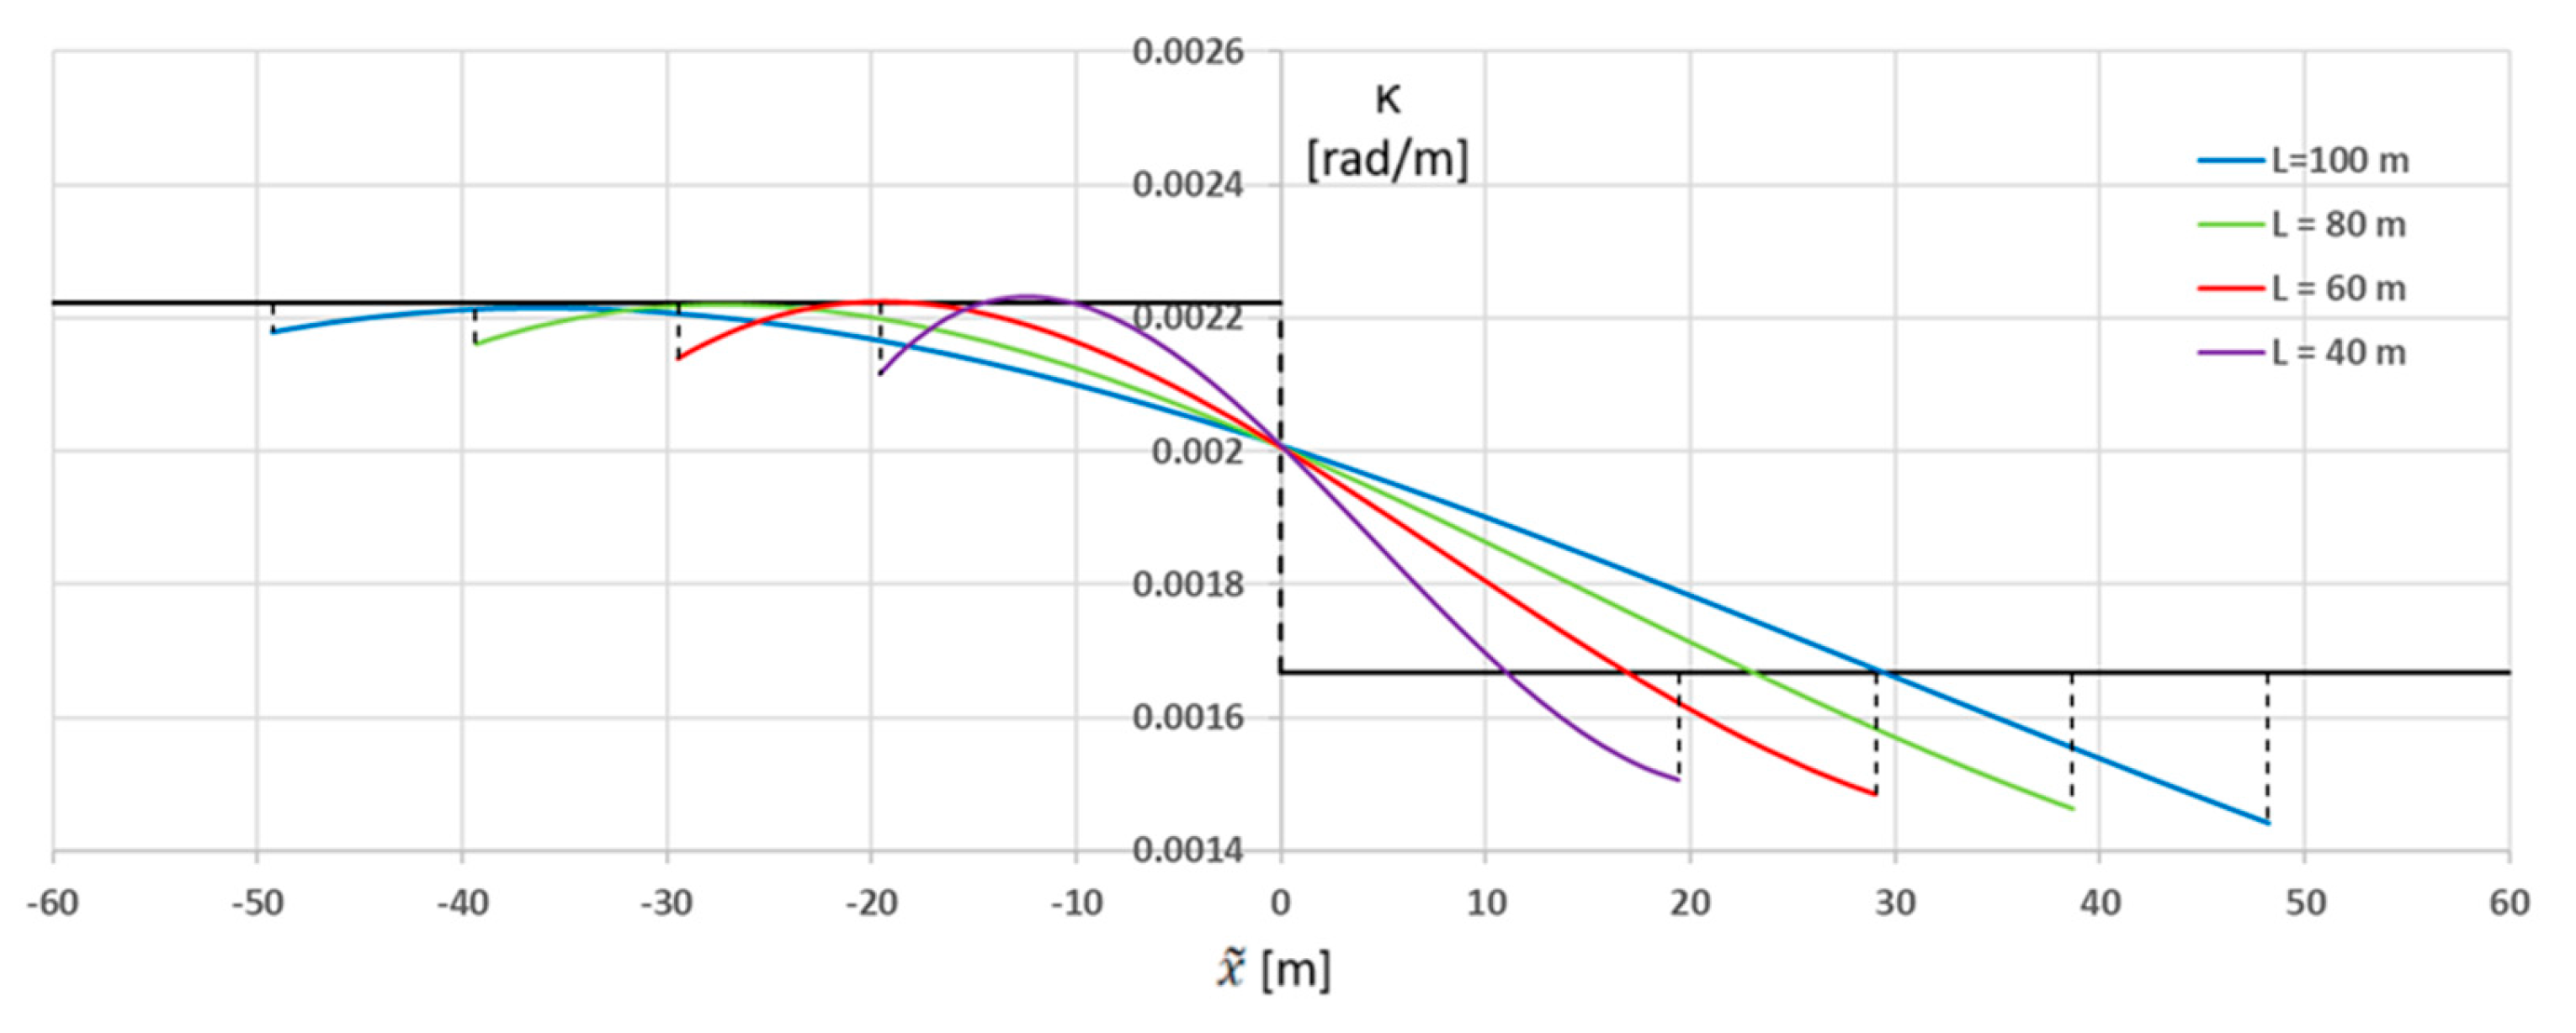
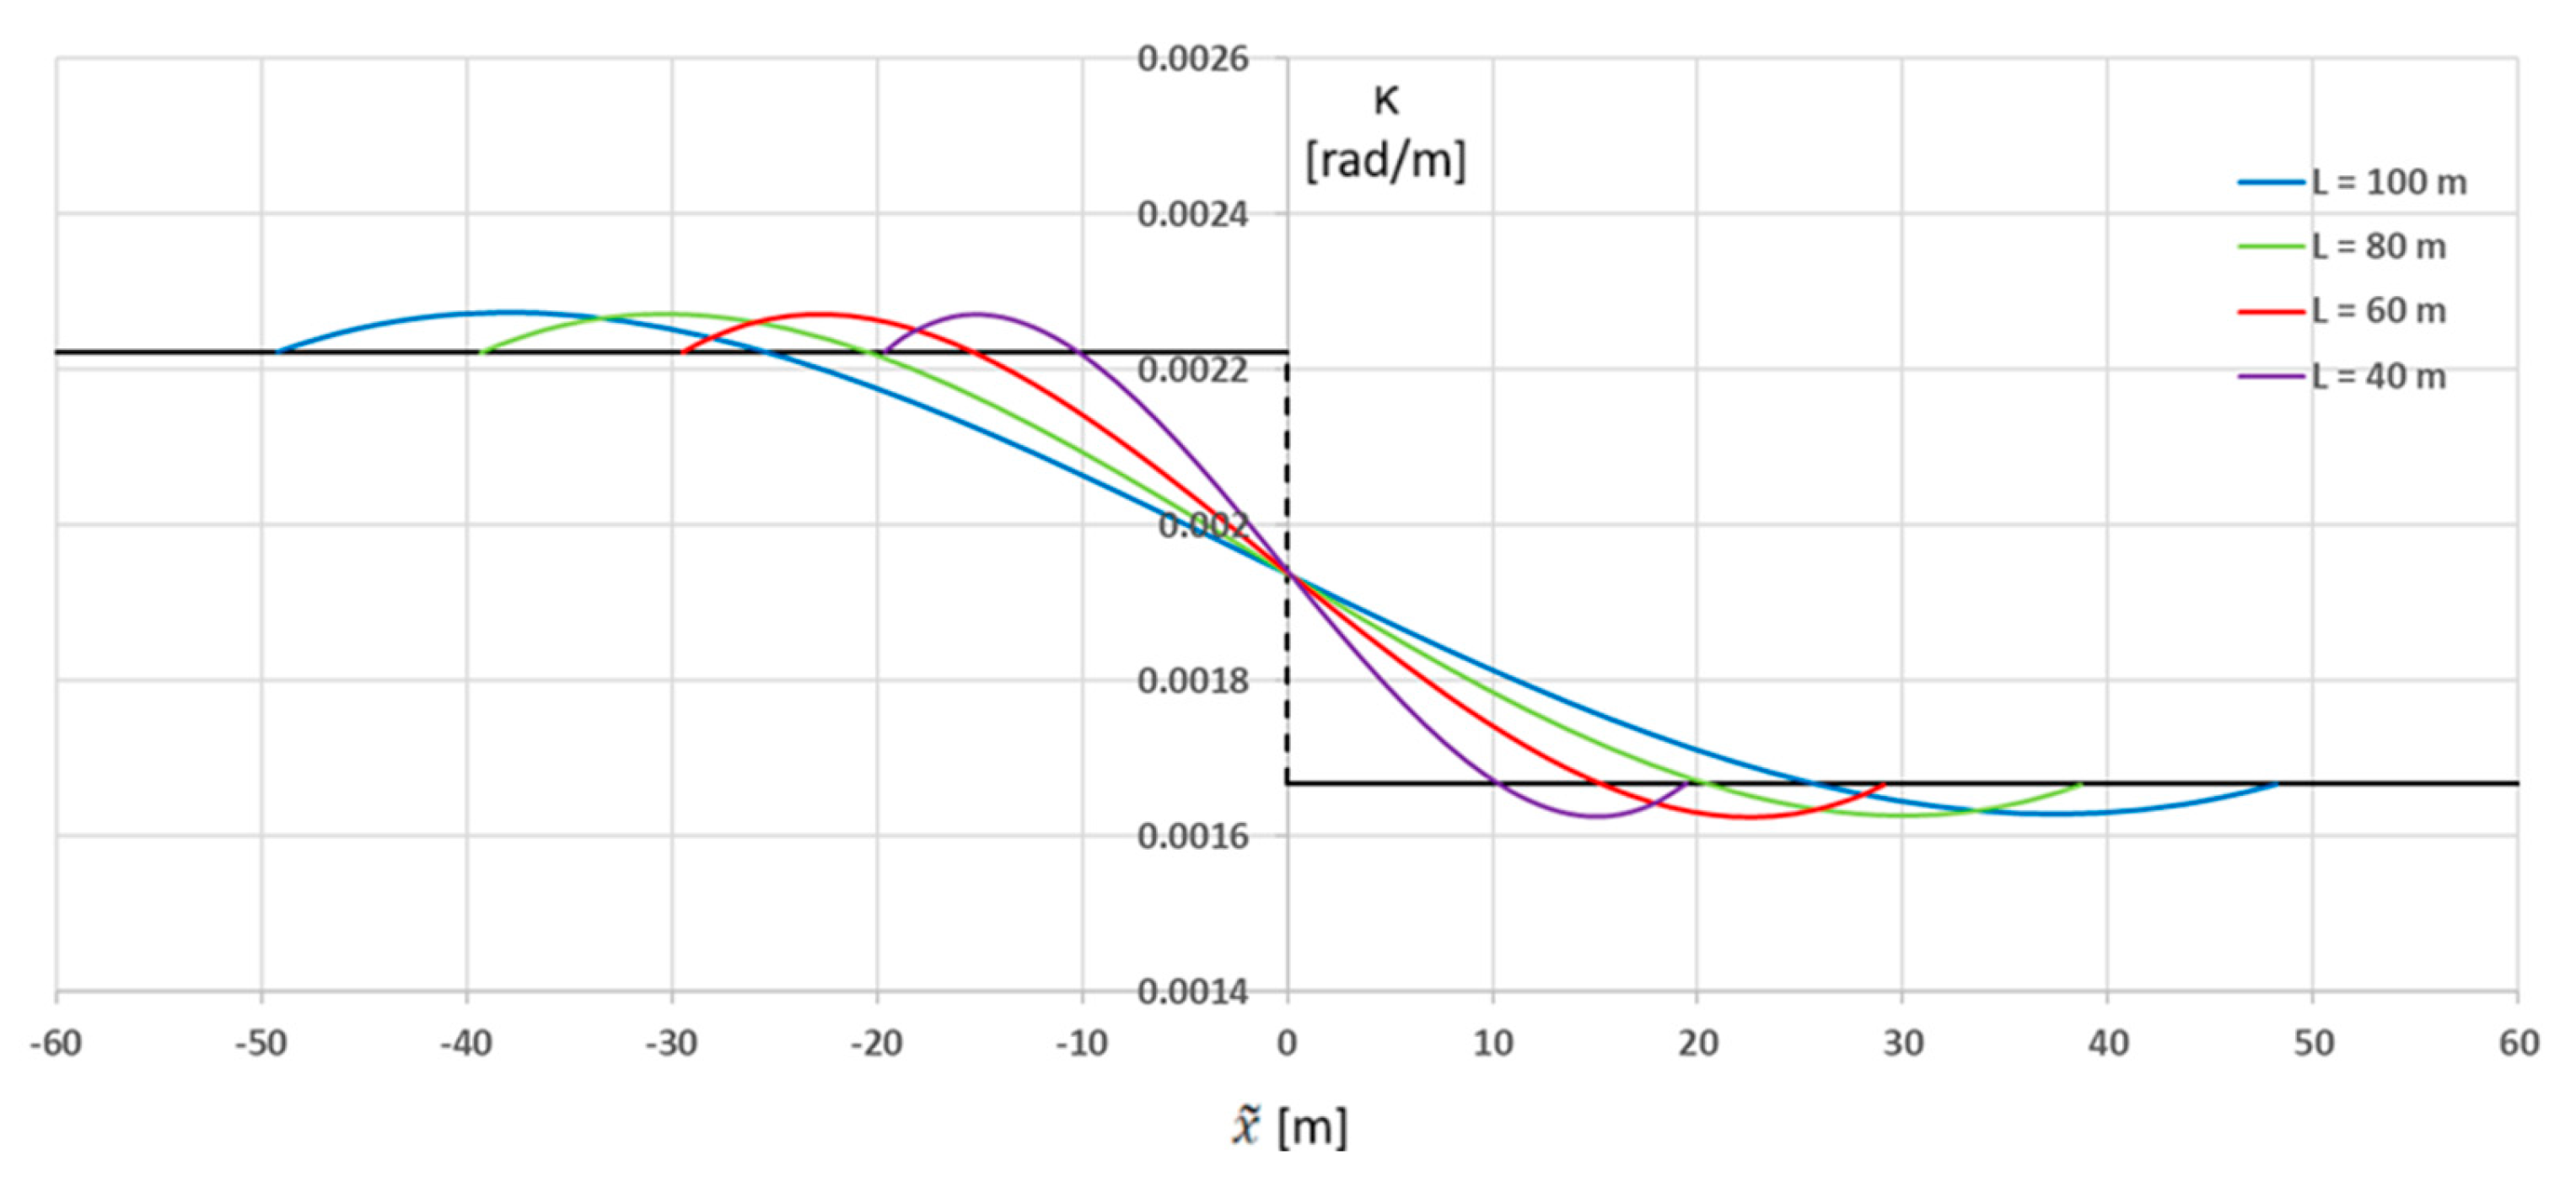
For the considered transition curves, the curvature values were determined using Formula (10), assuming the lengths of these curves given in
Table 4. The corresponding collective curvature graphs (for curves
TC(
a),
TC(
b) and
TC(
c)) are presented in
Figure 6,
Figure 7 and
Figure 8. The abscissa of the original connection point of both arcs (i.e., point C) was assumed as zero there. This means that in these figures the abscissa values are
. In the above figures, the black horizontal lines indicate the values of the constant curvature on the
CA1 arc and the
CA2 arc (as in
Figure 5).
The graphs
for the
TC(
a) transition curve shown in
Figure 6 are linear. There are abrupt changes in curvature at the start and end points. It is true that the extension of the curve smooths the transition between the circular arcs, but in this solution the original one abrupt change in curvature is replaced by two smaller ones (i.e., the problem still remains). It is therefore doubtful that the
TC(
a) curve can be recommended for practical use.
The graphs
for the
TC(
b) transition curve in
Figure 7 are non-linear. However, they can hardly be considered more advantageous than the analogous graphs shown in
Figure 6. The change in curvature along the length is more abrupt here than for the
TC(
a) curve. The abrupt changes in the initial region are smaller, while in the final region they are more pronounced. This can be easily explained by using the approximate Formula (11) for the
TC(
b) curve, which shows that the condition
is valid along its entire length. Since the
sP1 values for the transition curves in
Figure 7 were much smaller than the
sP2 values, the influence of the simplifying assumption was more evident at the final point. In specific situations, due to the more abrupt change in curvature along the length, the
TC(
b) curve may be less advantageous than the
TC(
a) curve and then it also could not be recommended for practical use.
The graphs
for the
TC(
c) transition curve shown in
Figure 8 are—like the graphs in
Figure 7—non-linear. However, they differ significantly from the graphs shown in
Figure 6 and
Figure 7 in that they do not show any abrupt changes in curvature, while its changes along the length are much milder. There can be no doubt that the
TC(
c) curve should be recommended as the most advantageous solution to the problem. All that needs to be checked is the practical possibilities of implementing this curve related to the values of the horizontal ordinates. They cannot be too small in relation to the occurring implementation error.
8. Horizontal Ordinates of the Recommended Transition Curve
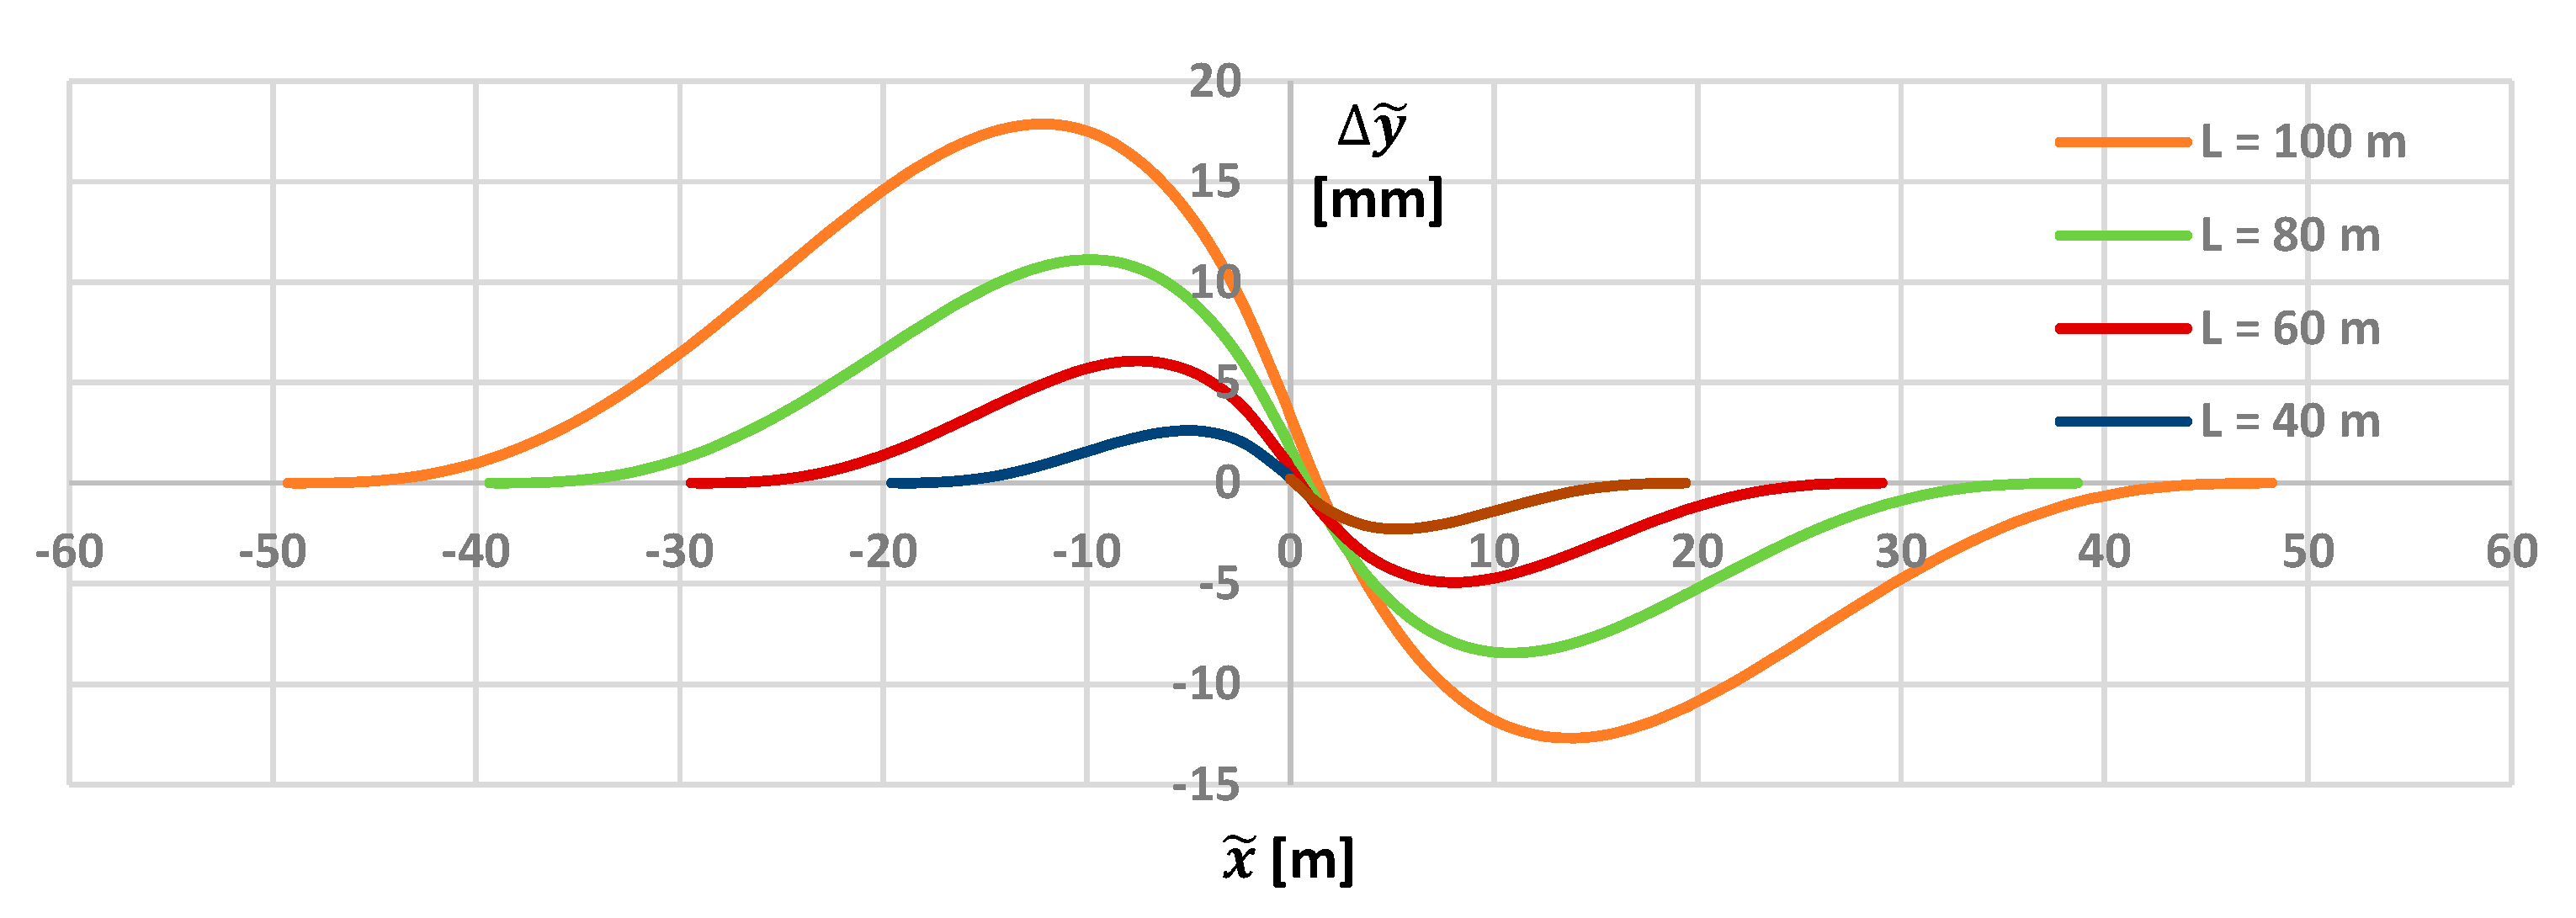
Figure 9 shows graphs of relative differences in the horizontal ordinates of the
TC(
c) transition curve with respect to the original state, for the assumed different curve lengths. Similarly to Chapter 7, the abscissa of the original connection point of both arcs (i.e., point
C) was assumed as zero in these graphs.
The graphs
in
Figure 9 indicate the regular nature of the required deviations of the geometric system from the original state. At the same time, these differences are very small: in the given case for
L = 100 m they do not even reach 20 mm, and for
L = 80 m they only slightly exceed 10 mm. This may indicate a certain problem related to the accuracy of the corrected system. In order to limit the effects of a possible error in this area, the lengths of the transition curves should be adjusted to specific situations and the use of too short curves should be avoided. It seems that for the situation shown in
Figure 9, the length of the transition curve should not be less than 80 m.
Of course, each geometrical system should be considered individually. There is no doubt, however, that the presented method is universal and allows to modify each compound curve, eliminating the disturbance caused by a sudden change in curvature in the area of direct connection of two horizontal circular arcs of different radii.
9. Conclusions
Although currently the main interest is focused on high-speed railways, traditional lines, whose layout was most often created in the 19th century, still dominate in terms of length. The latter are still in use today, but one may get the impression that they are disappearing from the field of research interest, and yet they should be modernized and adapted to contemporary requirements. This applies especially to railway lines running in difficult terrain conditions (e.g., in mountainous terrain), which often have specific geometric layouts, such as compound curves and reverse curves.
This article refers to the analytical method of modeling compound curves on railway lines, which was presented in [
30]. This method—in principle—was to serve to create the basis for subsequent modification of the existing geometric system, consisting in correcting the horizontal ordinates in the area of connection of both circular arches. This analytical approach highlights the innovative nature of the presented research and allows for the consideration of detailed issues that are difficult to address traditionally. The issue of practical application of the presented method is limited to computational issues (the given formulas for determining Cartesian coordinates can be directly applied to determine the appropriate geometric system).
The modification of the compound curve consists of eliminating the direct connection of both horizontal arches by introducing an appropriate transition curve between them. After determining the position of the extreme points of this curve (resulting from the assumed length of the curve), the appropriate mathematical equations are determined by solving the appropriate differential problem. The article presents three possibilities of connecting the occurring circular arches, guided by the criterion of the degree to which the nature of the curvature of a given curve is taken into account. The transition curve determined without taking into account the conditions concerning the curvature, the transition curve taking into account simplified conditions concerning the curvature and the transition curve taking into account strict conditions concerning the curvature were considered. A detailed analysis of the obtained solutions was carried out using the developed test geometric system.
On the transition curve determined without taking into account the conditions concerning curvature (with linear curvature), abrupt changes in curvature were found at the initial and final points. Although the extension of the curve softens the transition between the circular arcs, in this solution the originally occurring one abrupt change in curvature (at the point of connection of the circular arcs) is replaced by two smaller ones. The situation is similar, although to a slightly smaller extent of disturbances, for the transition curve taking into account simplified conditions concerning curvature, created after introducing the appropriate simplifying assumption (still used on the railway). It should therefore be recognized that these curves do not solve the problem and therefore cannot be recommended for practical use.
The third transition curve under consideration, with non-linear curvature, determined in a strict manner, maintains the continuity of the curvature along its entire length. It does not have abrupt changes in curvature in the extreme regions, and the changes along the length are much milder than in the case of the two previously discussed curves. In order to avoid difficulties in its practical implementation related to the values of horizontal ordinates (which differ little from the original state), the lengths of the transition curves should be adjusted to specific situations and the use of curves that are too short should be avoided. The point here is to limit the impact of the implementation error. There can be no doubt that this curve should be recommended as the most advantageous solution to the problem.
The detailed calculations performed are based on regulations applicable in Poland. However, similar operating conditions prevail in other countries in this respect. Railway lines containing compound curves are characterized by relatively low train speeds, and similar permissible values for kinematic parameters apply to their design. Therefore, the presented method is universal, and the obtained results may be useful internationally.
