Abstract
Individual tree crown detection (ITCD) and tree species classification are critical for forest inventory, species-specific monitoring, and ecological studies. However, accurately detecting tree crowns and identifying species in structurally complex forests with overlapping canopies remains challenging. This study was conducted in a complex mixed conifer–broadleaf forest in northern Japan, aiming to improve ITCD and species classification by employing two machine learning models and different combinations of metrics derived from very high-resolution (2.5 cm) UAV red–green–blue (RGB) and multispectral (MS) imagery. We first enhanced ITCD by integrating different combinations of metrics into multiresolution segmentation (MRS) and DeepForest (DF) models. ITCD accuracy was evaluated across dominant forest types and tree density classes. Next, nine tree species were classified using the ITCD outputs from both MRS and DF approaches, applying Random Forest and DF models, respectively. Incorporating structural, textural, and spectral metrics improved MRS-based ITCD, achieving F-scores of 0.44–0.58. The DF model, which used only structural and spectral metrics, achieved higher F-scores of 0.62–0.79. For species classification, the Random Forest model achieved a Kappa value of 0.81, while the DF model attained a higher Kappa value of 0.91. These findings demonstrate the effectiveness of integrating UAV-derived metrics and advanced modeling approaches for accurate ITCD and species classification in heterogeneous forest environments. The proposed methodology offers a scalable and cost-efficient solution for detailed forest monitoring and species-level assessment.
1. Introduction
Mixed conifer–broadleaf forests (MCBFs) exhibit high structural and compositional complexity [1,2], making accurate individual tree crown detection (ITCD) and species classification critical for forest inventory, biodiversity conservation, selective harvesting, species-specific monitoring, and precision forest management [3,4,5]. Since many structural attributes are derived from individual tree crowns, precise ITCD is a prerequisite for reliable forest parameter estimation [6,7]. Moreover, species-level classification supports detailed mapping, enabling sustainable forest management [3,8].
Conventional field-based ITCD approaches are labor-intensive and impractical at large scale, especially in complex forests. Remote sensing technologies such as satellite imagery, manned and unmanned aerial vehicle-based light detection and ranging (LiDAR), red–green–blue (RGB), multispectral (MS), hyperspectral data, and terrestrial laser scanning (TLS) offer scalable solutions for ITCD and tree species classification [9,10,11,12,13], and many studies have been conducted [14]. Among these, unmanned aerial vehicles (UAVs) provide very high spatial resolution (<10 cm), cloud-free imagery with flexible acquisition [3,15], capturing detailed canopy information, even at leaf-level features [16,17,18,19] essential for accurate ITCD and species classification [20].
However, the existing methods face limitations in complex forests. Traditional algorithms such as region growing, clustering, and edge-based methods [7,21,22] often fall short in complex forest environments [16]. Multiresolution segmentation (MRS), an object-based method, has been effective in mixed forests due to its adjustable parameters [3]. For example, using UAV-derived MS imagery and digital aerial photogrammetric (DAP) point clouds, MRS achieved an F-score of 0.83 in subtropical forests [3]. Species classification using Random Forest (RF) with MRS and MS imagery yielded a Kappa of 0.72 for four deciduous species [23]. Recent advances in machine learning (ML) and deep learning (DL) have further improved tree detection and species classification through high-level feature extraction [24,25,26]. In a complex mixed conifer–broadleaf forest (MCBF), methods such as bounding-box detection using YOLOv8 (you look only once) on RGB imagery and LiDAR data have been applied [27]; however, these approaches are limited in delineating precise crown boundaries. While UAV LiDAR alone has achieved reasonable accuracy in temperate forests (F-score = 0.73) [28], it underperforms in broadleaf forests due to overlapping and multi-layered canopies [29]. In subtropical forests, integrating LiDAR and hyperspectral imagery with RF modeling achieved ITCD F-scores of 0.83 and species classification Kappa of 0.85 [30]. DeepForest (DF) is a recently developed convolutional neural network (CNN)-rooted DL model used for ITCD [31], achieving an F1 score of 0.52 in temperate deciduous forests [27] and up to 0.69 when combining RGB and MS imagery in MCBF with RF classification [18]. More advanced DL models, such as Mask R-CNN and Faster R-CNN, can delineate irregular crown shapes but are reported to struggle in complex forests with overlapping canopies [16,32,33]. The StarDist model, based on the U-Net architecture, has outperformed Mask R-CNN in complex forests, achieving an F1 score of 0.88 [16]. An F1 score of 0.57 temperate deciduous forest [27] and 0.64–0.74 in tropical forest [34] was achieved using Detectree2, which is based on Mask R-CNN, to accurately recognize the irregular edges of individual tree crowns. Among DL models for species classification, EfficientNet is particularly suited to very high-resolution imagery due to its ability to capture fine-grained features [35,36,37]. For instance, EfficientNet-B7 effectively classified 56 tree species in temperate forests [38], highlighting its potential for detailed species-level classification in complex forest environments.
Accurate ITCD in structurally complex forests remains challenging due to forked tree crowns with overlapping canopies, variability in tree architecture, and tree density [16,27]. Integrating multisource UAV data comprising different combinations of metrics, such as structural, textural, and spectral, has been shown to improve ITCD and species classification in complex environments [3,39]. UAV platforms offer the integration of different sensors that can be able to derive RGB and MS imagery [4,18]. This ability provides the capture of more spectral information to classify the species with high accuracy [30]. Improved watershed-spectral-texture-controlled normalized cut (WST-Ncut) is proposed to achieve ITCD and species classification in subtropical broadleaf forests using UAV LiDAR, RGB, and hyperspectral imagery [40]. Incorporating textural features into the model improved the tree species classification using very high-resolution UAV MS imagery [8] and RGB imagery [41]. Integration of RGB and MS imagery with different combinations of metrics improves the tree species classification [3]. Combining textural and spectral metrics improved the tree species classification [8,42,43,44]. While previous studies demonstrated the benefits of structural and spectral data for crown detection, particularly in dense and diverse stands, most focused on simpler forest types with limited species diversity [23]. Research on complex, mixed-species forests is growing, but results vary depending on forest heterogeneity, study methods, and lack of consideration for factors such as tree density and dominant stand types. Additionally, few studies integrate different combinations of metrics for these purposes [18,40].
To address these challenges, this study aims to improve ITCD and tree species classification in a complex MCBF in northern Japan by employing two machine learning models (MRS and DF) with different combinations of metrics derived from very high-resolution UAV imagery. In this study, a different combination of metrics denotes the use of structural, textural, and spectral metrics either individually or in any two- or three-way combinations. Specifically, we address the following two research questions: (1) Can ITCD be improved in a complex MCBF using two machine learning models with different combinations of metrics derived from UAV imagery? (2) Can tree species classification be improved using two machine learning models with different combinations of metrics derived from UAV imagery? Our approach differs from previous work by exploring various model combinations and parameter settings to optimize crown detection and species classification across stand types and density categories, thereby identifying the most effective strategies for complex MCBFs using machine learning models and different combinations of metrics derived from both very high-resolution UAV RGB and MS imagery. By addressing the challenges posed by greater complexity, species diversity, and forked tree crowns with overlapping canopies, the research seeks to evaluate whether employing machine learning models and incorporating different combinations of metrics enhances the accuracy of both ITCD and species classification at the individual tree level.
2. Materials and Methods
2.1. Study Site
This study was conducted in the University of Tokyo Hokkaido Forest (UTHF), located in Furano City, Hokkaido, northern Japan (43°10′–20′ N, 142°18′–40′ E; elevation: 190–1459 m asl; Figure 1). The extent of the UTHF is 22,708 ha, characterizing uneven-aged MCBF that lies between temperate and boreal forests [45,46]. Building upon our previous work [4], which used manual ITCD to estimate forest structural parameters and identity conifers, Japanese oak, and other broadleaf species, this study focuses on automated ITCD and species classification of nine tree species. We selected sub-compartment 68E as the study site due to its structural complexity and species diversity, representative of complex MCBF conditions. Dominant coniferous species are Todo fir (Abies sachalinensis), red spruce (Picea glehnii), and Yezo spruce (P. jezoensis). Dominant broadleaf species are Japanese oak (Quercus crispula), Japanese linden (Tilia japonica), Monarch birch (Betula maximowicziana), painted maple (Acer pictum), castor aralia (Kalopanax septemlobus), Manchurian ash (Fraxinus mandshurica), and Taxus cuspidate [4,46]. The study site covers approximately 31 ha, with elevation ranging from 425 to 500 m asl. Based on five 50 m × 50 m inventory plots (UTHF, 2020), the mean tree density is 562 stems ha−1 (DBH ≥ 5 cm) (range: 460–656 stems ha−1) [4]. The forest floor is densely covered by dwarf bamboo species Sasa kurilensis and S. senanensis. Climatic data from 2001 to 2008 show an average annual temperature of 6.4 °C and total annual precipitation of 1297 mm at 230 m elevation. Snow typically accumulates from November to April, reaching depths of up to 1 m [46,47].
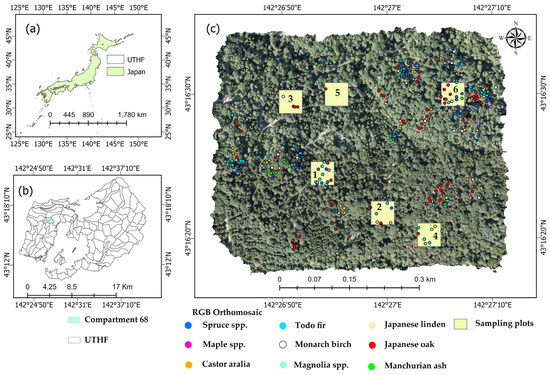
Figure 1.
The study area map: (a) location of the UTHF in Japan; (b) location of the forest compartment 68 in the UTHF; (c) tree spatial positions (n = 255) of field-measured tree species and sampling plots (n = 6) for evaluating individual tree crown detection, visualized in the UAV RGB orthomosaic with plot numbers (1–6).
2.2. Collection of Field Data
A total of 255 individual trees representing nine species were measured in February 2023 (Figure 1c). Tree spatial positions were recorded using a dual-frequency real-time kinematic (RTK) GNSS receiver (DG-PRO1RWS, BizStation Corp., Matsumoto, Japan) and used to manually identify corresponding crowns in UAV imagery. Tree height (H) measurements focused on conifers, as leaf-off conditions enhanced treetop visibility. The H was measured three times using a Vertex III hypsometer (Haglöf Sweden AB, Långsele, Sweden), and the average was recorded. The H measurement validated the UAV-derived canopy height model (CHM), which showed high agreement with field measurements (R2 = 0.86, RMSE = 2.15 m), as reported in our previous study [4]. The diameter at breast height (DBH) was measured at 1.3 m using a diameter tape.
2.3. Collection of UAV Imagery
Detailed UAV specifications, flight parameters, and sensor information are provided in Table S1. RGB imagery was captured using a DJI Matrice 300 RTK (DJI, Shenzhen, China) during the leaf-on period (14 September and 7 October 2022) and the leaf-off period (8 November 2022). Additionally, simultaneous RGB and MS imagery were acquired on 27 October 2023 using a DJI Mavic 3 MS RTK (DJI, Shenzhen, China). The RGB imagery of 14 September 2022 and MS imagery of 27 October 2023 were used for our previous work on individual tree parameter estimation [4]. For this study, the RGB imagery of 14 September 2022 was primarily used for manual and automated ITCD and tree species classification and generation of the CHM. Based on prior findings [4], crown areas showed no significant difference between 14 September 2022 and 7 October 2022; thus, imagery from 7 October was also included in species classification assessments to examine the accuracy influenced by prominent color changes in some tree species. Tree species detection is influenced by seasonal phenological changes, as distinct leaf color variations during this period enhance spectral reflectance differences among species [39,48]. MS imagery collected on 27 October 2023 was used for both ITCD and species classification. The leaf-off RGB imagery (8 November 2022) and other seasonal datasets were used exclusively for visual interpretation to support species identification (Figure S1). All UAV flights were conducted under clear, sunny conditions to minimize shadow effects [17].
2.4. Data Analysis
2.4.1. Processing UAV Images
Figure 2 outlines the workflow for ITCD and species classification. UAV imagery was processed by UTHF staff using Agisoft Metashape v1.8.4 (Agisoft LLC, St. Petersburg, Russia) and Pix4Dmapper v4.8.0 (Pix4D SA, Lausanne, Switzerland). Sensor correction, camera calibration, and reflectance panel calibration were conducted using the respective software. The original orthomosaics spatial resolution of RGB imagery (0.8 cm) and MS imagery (0.2 cm) were resampled to 2.5 cm using ArcGIS Pro v2.8 (ESRI, Redlands, CA, USA) to meet the input requirements of DF Scanner v1.4.0 (DeepForest Technologies Co., Ltd., Kyoto, Japan). All input layers, including the CHM, were maintained to this resolution for spatial consistency. The CHM was generated by subtracting a digital terrain model (DTM), derived from existing airborne light detection and ranging (LiDAR) data (Teledyne Technologies, Thousand Oaks, CA, USA), from the UAV-based digital surface model (DSM), thereby reducing canopy occlusion effects. Further details of the LiDAR data processing are available in our previous studies [4,49].
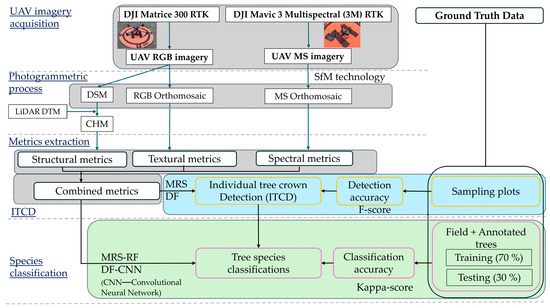
Figure 2.
The workflow of the individual tree crown detection and species classification. UAV—unmanned aerial vehicle; RGB—red–green–blue; MS—multispectral; RF—random forest; DF—DeepForest; DSM—digital surface model; LiDAR DTM—light detection and ranging digital terrain model; SfM—structure from motion; CHM—canopy height model; MRS—multiresolution segmentation; CNN—convolutional neural network; ITCD—individual tree crown detection.
2.4.2. Extraction of Metrics
A set of metrics were extracted from UAV imagery for ITCD and species classification. A visual representation of these metrics within a sample plot is shown in Figure S2. Structural metrics derived from the CHM capture height variations that aid both ITCD and species classification [50]. Textural metrics were extracted from the near-infrared (NIR) band of the MS imagery, and this was consistent with the previous study [18]. Textural metrics describe spatial tree crown patterns and are essential for species classification [43,51]. Textural features were computed using the gray level co-occurrence matrix (GLCM) [52,53] via the r.texture algorithm in QGIS v3.28 with a 3 m × 3 m moving window. The derived textural metrics included angular second moment (ASM), variance (Var), sum of variance (SV), difference variance (DV), contrast (Cont), entropy (Entr), difference entropy (DE), sum of entropy (SE), correlation (Corr), information measures of correlation (MOC), inverse difference moment (IDM), and sum of average (SA). Spectral metrics were extracted from both RGB and MS imagery. RGB bands (red, green, and blue) and MS bands (red, green, red edge (RE), and NIR) were used. Normalized difference vegetation index (NDVI), green NDVI (GNDVI), leaf chlorophyll index (LCI), and normalized difference red edge index (NDRE) were computed from MS imagery [54]. Species differentiation relies on variations in canopy spectral reflectance, making spectral metrics critical for ITCD and classification [55,56,57]. Additionally, Sobel edge detection metrics were computed from RGB imagery using the Sobel filter algorithm to further enhance ITCD [32].
2.4.3. Detection of Individual Tree Crowns
Manual Individual Tree Crown Detection
Six 50 m × 50 m sampling plots were established for ITCD, with three located in conifer-dominated mixed forests (CDM) and three in broadleaf-dominated forests (BDM) (Figure 1c). Very high-resolution RGB orthomosaics (0.8 cm) and CHM were used for manual ITCD to generate reference tree crowns [16]. In broadleaf forests, forked tree crowns with overlapping canopies are common; thus, leaf-off imagery was used to improve the individual tree crowns [4]. Based on the number of manually detected tree crowns, sampling plots were categorized into high-density (HD), medium-density (MD), and low-density (LD) plots (Table 1). These manually detected crowns served as reference data for evaluating automated ITCD performance. Due to canopy occlusion, only crowns visible from above were included for ITCD [16]. To validate the manual ITCD, we compared the crown count with field inventory data. To ensure alignment with visible crowns in UAV imagery, we applied thresholds for H and DBH. Using five 50 m × 50 m inventory plots from the UTHF, a DBH threshold of DBH ≥ 23 cm was determined based on the allometric equations relating H and DBH in MCBF [4], using CHM maximum values for H, and estimating DBH (Table S2). At this threshold, the mean tree density was 208 stems ha−1. Manual ITCD counts exceeded this value, confirming sufficient crown capture (Table 1). Furthermore, field-measured tree H for 255 trees ranged from 19.82 to 32.87 m [4]. Accordingly, a CHM height threshold of ≥10 m was applied during manual ITCD to ensure that only clearly visible trees were included.

Table 1.
Reference tree crowns based on dominant forest type and density for individual tree crown detection.
Multiresolution Individual Tree Crown Detection
Table 2 presents five combination models of multiresolution segmentation (MRS) for ITCD using different input layers. MRS is a bottom-up region-merging algorithm commonly applied in object-based image analysis (OBIA), starting from individual pixels and merging them iteratively into larger segments based on spectral and spatial heterogeneity [58]. Segmentation was conducted using eCognition Developer v10.3 (Trimble Inc., Sunnyvale, CA, USA). Four key parameters were used in MRS: layer weight, scale, shape/color, and compactness/smoothness [59]. Parameter selection was based on previous studies and iterative trial-and-error, accounting for the structural complexity of the study area. Equal weight was assigned to all input layers to give balanced importance to all input layers. Shape and compactness were set to 0.7 and 0.9, respectively. A scale value of 230 was selected as optimal based on a visual assessment of segmentation quality, and the merging process continued until this threshold was met. For MRS ITCD, combination models 1, 2, 3, 4, and 5 that have different combinations of metrics were performed. Among the combination models, models 1 and 2 represent commonly used approaches. We introduced models 3, 4, and 5 by incorporating additional layers to improve ITCD. The number of layers progressively increased from model 1 to model 5 to enhance ITCD performance. Different combinations of metrics, comprising structural (CHM), spectral (RGB, MS, NDVI, GNDVI, NDRE, LCI), and textural (ASM, MOC, ENT, Sobel) metrics, were used.
Table 2.
The combination models with different layers for MRS individual tree crown detection.
DeepForest Individual Tree Crown Detection
The ITCD was conducted using DF Scanner Pro v.1.4.0. (DeepForest Technologies Co., Ltd., Kyoto, Japan), which utilizes primary input layers. Therefore, combination model 2 in Table 2, which has different combinations of metrics (comprising structural (CHM) and spectral (RGB) metrics), was performed. Two ITCD methods were applied. The first method detects treetops as seed points from the CHM and subsequently segments tree crowns based on these points; this approach is specifically tailored for coniferous species. This process involves three main steps: (1) masking CHM values below 2 m to remove ground features, (2) detecting treetops using a smoothing level of 2 m and 3 m with a tree spacing of 1.2 m, and (3) segmenting crowns using the masked CHM, original CHM, RGB orthomosaic, and detected treetops. The second method treats the canopy as multilayered and directly detects forked tree crowns, making it more suitable for broadleaf species. This approach requires setting thresholds for mean and minimum crown polygon sizes. Based on trial and error, mean crown sizes of 150 m2 and 170 m2 and minimum crown size of 20 m2 were tested. Given the mixed-species composition of the study area, both methods were applied to the CDM and BDM plots to determine the most suitable approach for the entire study area.
2.4.4. Classification of Tree Species
Manual Tree Crown Detection for Tree Species Classification
Table 3 summarizes the individual tree crowns used for classifying nine tree species, including 248 field-measured trees and 492 visually annotated crowns, totaling 700 reference crowns. Additionally, 110 gaps, representing roads, dwarf bamboo, and lower shrub areas, were manually identified (Figure S3). Other tree species present in the study area occurred at very low densities, averaging only 9 stems ha−1 (2 stems per plot) compared to 208 stems ha−1 for the nine selected species (DBH ≥ 23 cm). Due to their limited occurrence, these species were excluded from the classification. Species identification was enhanced using field photographs and multi-season very high-resolution UAV imagery (Figure S2). When species exhibited similar crown features in leaf-on RGB imagery, leaf-off imagery was used to distinguish them based on stem color and branching patterns. For example, Monarch birch and Japanese oak were distinguished by branch color—white for Monarch birch and brown for Japanese oak. Tree crowns of P. jezoensis and P. glehnii were indistinguishable in UAV imagery and were grouped as Spruce spp. Similarly, Magnolia obovata and M. kobus were grouped as Magnolia spp. Due to the presence of subspecies within Acer pictum, this species was grouped under Maple spp.
Table 3.
Manual ITCD of field-measured and -annotated individual trees for tree species classification.
Multiresolution Tree Species Classification
The RF classification model was applied for tree species classification based on MRS in eCognition Developer. Tree crowns detected using the best combination model across the CDM and BDM plots (Section Multiresolution Individual Tree Crown Detection, Table 2) were used as input. RF classification model is widely applied in remote sensing studies for tree species classification [9,47,60] due to its ability to handle high-dimensional data with a small number of observations. Image objects derived from MRS were classified into 9 tree species (Table 3). The data were stratified by species and split into training (70%) and testing (30%) sets to ensure a proportional representation of each class. Model accuracy was reported based on the testing set. Through trial and error, the active variable (mtry), minimum sample count, and maximum number tree number (ntree) were set to 10, 2, and 500, respectively. Other parameters such as use surrogate (No), maximum categories (16), depth (2), forest accuracy (0.01), and termination criteria type (both) were set as default settings. The final classified vector layer was exported using the export vector layer algorithm, and tree species maps were generated in QGIS based on the output shapefile.
DeepForest Tree Species Classification
Tree species classification was conducted using the DF Scanner software through three main steps: training data creation, model training, and species classification using the built-in artificial intelligence (AI) tool. Manually detected and labeled individual tree crowns (Table 3) were used to create training data on the UAV RGB orthomosaic, generating image folders, with each species stored in separate subfolders in.jpg format. Tree species annotation was performed manually through visual interpretation of very high-resolution imagery guided by the spatial positions of field-measured trees. Seasonal imagery of leaf-on (14 September 2022, 7 October 2022, and 27 October 2023) and leaf-off periods (8 November 2022) was used for species identification for reference tree crown preparation (Table S1 and Figure S1). The reference tree crowns (field-measured and annotated) were saved as polygon vector files. The UAV leaf-on imagery collected on 7 October 2022 was then imported into the DF Scanner and clipped to the reference crown polygons for tree species classification, as detailed in Table 3. Each tree crown image was tiled into 224 × 224 pixels to support model training by DF Scanner. The data were split into training (70%) and testing (30%) sets, with accuracy reported for the test data. The dataset split was identical to that used in the MRS tree species classification. Model training was employed default EfficientNet-B1 convolutional neural network (CNN) in DF Scanner. To manage computational demands from high-resolution UAV imagery (2.5 cm), 30 epochs, a batch size of 16, and a learning rate of 0.01 were used. The trained model was saved in dfmodel format. For species classification, the trained model was applied using three inputs: the RGB orthomosaic, tree crowns detected through DF ITCD (Section DeepForest Individual Tree Crown Detection), and the trained model. The final output was a polygon vector (.shp) containing the classified tree species.
2.4.5. Accuracy Assessment
Tree Crown Detection Accuracy
The accuracy of MRS and DF ITCD was evaluated using F-score values derived from comparison with reference tree crowns. The F-score, the harmonic mean of precision and recall, was computed using true positive (TP), false positive (FP), and false negative (FN) (Figure S4) [61]. Crown overlap between detected and reference trees was assessed using the intersection over union (IOU), with a 50% IOU threshold—appropriate for highly complex forests and consistent with previous studies [16,27,33]. TP is the number of correctly detected tree crowns. FP is the number of incorrectly detected tree crowns that do not exist in the field. FN is the number of trees that were not detected. A higher value of FP results in over-detection of individual tree crowns resembling the commission error. In contrast, a higher value of FN leads to under-detection of tree crowns resembling the omission error. An F-score closer to 1 reflects better ITCD performance, indicating a good balance between precision and recall [16,21].
Recall = TP/(TP + FN)
Precision = TP/(TP + FP)
F-score = 2 × (Precision × Recall)/(Precision + Recall)
Tree Species Classification Accuracy
The accuracy of tree species classification using MRS-RF and DF-CNN models was evaluated using Cohen’s Kappa statistics [47,62]. Kappa measures the agreement between predicted and actual classification, adjusting for chance, and is particularly suitable for multi-class classification tasks. Evaluation metrics included producer accuracy (PA) and user accuracy (UA), Hellden’s measure, Short’s measure, overall accuracy (OA), and Kappa values. PA indicates how well reference tree species are correctly classified (low PA reflects omission errors), while UA indicates how many classified species are actually correct (low UA reflects commission errors). Hellden provides an average measure of classification quality, and Short offers a stricter evaluation by emphasizing agreement between PA and UA. OA is an overall proportion of correct classification across all species. Correct classification of a species reflects a high PA (good producer), while misclassification of other species into that class results in a low UA (weak user). Species not assigned to any class result in omission errors (Figure S5).
PA = Correctly classified tree species/Total actual trees species in class
UA = Correctly classified tree species/Total predicted tree species in class
Hellden = (PA + UA)/2
Short = PA × UA
OA = Total correct/total samples (across all classes)
Kappa per Class = Agreement adjusted for chance
Kappa = Agreement beyond chance across all classes
3. Results
3.1. The Individual Tree Crown Detection
3.1.1. Multiresolution Individual Tree Crown Detection
Table 4 shows the accuracy results of MRS-based ITCD in CDM and BDM plots (detailed results in Tables S3 and S4). In the CDM plots, the highest F-score (0.54) was observed in the HD plot using combination model 5. For the medium-density (MD) and low-density (LD) plots, combination model 3 performed best, with F-scores of 0.51 and 0.46, respectively. A similar trend was observed in the BDM plots: the HD plot had the highest F-score (0.58) with combination model 5, while the MD and LD plots showed the best performance using the combination models 2, 3, 4, and 5, with high F-scores of 0.49 and 0.44, respectively. Overall, combination models 3 and 5 consistency yielded the best performance across all plots and were thus selected for MRS-RF tree species classification in Section 3.2.1.
Table 4.
The accuracy value of MRS individual tree crown detection in CDM and BDM plots.
3.1.2. DeepForest Individual Tree Crown Detection
Table 5 summarizes the DF ITCD accuracy across CDM and BDM plots (detailed results in Tables S5 and S6). In CDM plots, the highest accuracy (F-score = 0.79) was achieved in the MD plot using the treetop method with a 2 m smoothing level, followed by LD plots (F-score = 0.73). The HD plot showed the lowest performance (F-score = 0.65). In BDM plots, DF achieved its highest accuracy (F-score = 0.74) in the HD plot using the treetop method with a 2 m smoothing level. The MD and LD plots recorded slightly lower F-scores of 0.64 and 0.62, respectively. Across all density classes, the treetop method consistently outperformed the multilayer method. Therefore, tree crowns detected using the treetop method were selected for the DF-CNN tree species classification described in Section 3.2.2.
Table 5.
The accuracy value of DF individual tree crown detection in CDM and BDM plots.
3.1.3. Visualization of MRS and DF Individual Tree Crown Detection
Figure 3, Figure 4 and Figure 5 show the visual comparison of ITCD results from MRS and DF alongside reference tree crowns in HD, MD, and LD plots, respectively. Across the sampling plots, both MRS and DF produced similar visualizations of ITCD. However, the MRS algorithm tended to misclassify gaps as tree crowns, while DF’s masking approach effectively minimized this issue. DF also showed a higher degree of overlap with reference conifer tree crowns compared to MRS. Overall, MRS ITCD and DF ITCD accurately detected the reference tree crowns in the complex MCBF.
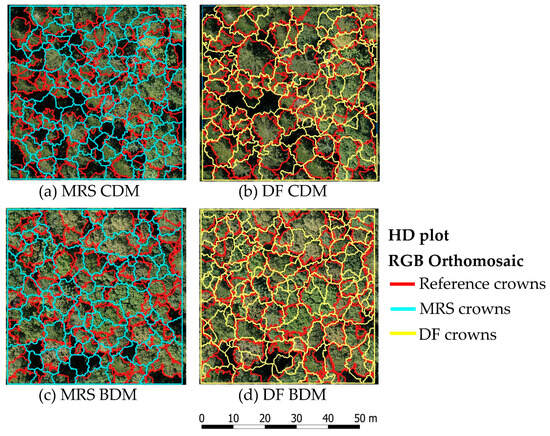
Figure 3.
The individual tree crown detection of MRS and DF in HD plot. (a) MRS in CDM plot; (b) DF in CDM plot; (c) MRS in BDM plot; (d) DF in BDM plot.
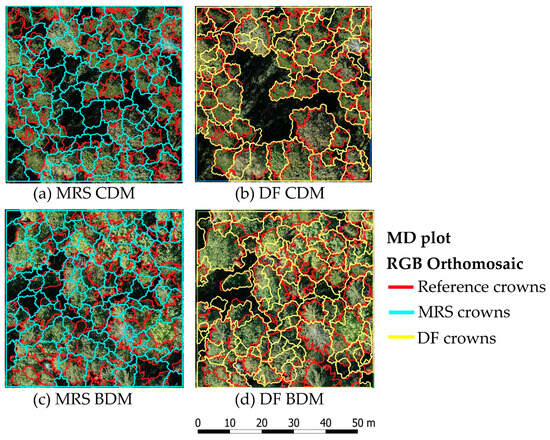
Figure 4.
The individual tree crown detection of MRS and DF in MD plot. (a) MRS in CDM plot; (b) DF in CDM plot; (c) MRS in BDM plot; (d) DF in BDM plot.
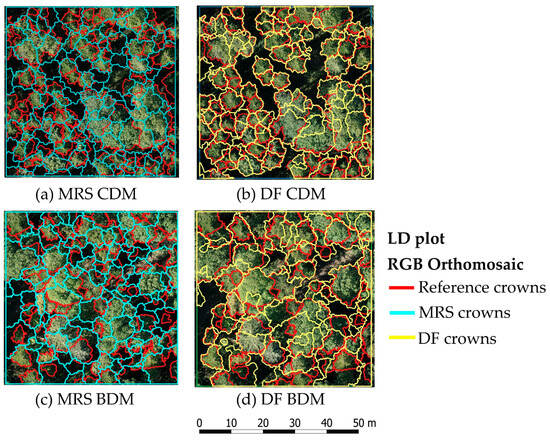
Figure 5.
The individual tree crown detection of MRS and DF in LD plot. (a) MRS in CDM plot; (b) DF in CDM plot; (c) MRS in BDM plot; (d) DF in BDM plot.
3.2. Tree Species Classification
3.2.1. MRS-RF Tree Species Classification
Table 6 shows the tree species classification accuracy of the MRS-RF model for the testing data (Table S7 shows the MRS-RF accuracy for all the data). Combination model 5 (Section 3.1.1, Table 4), which achieved the highest ITCD accuracy, was used for tree species classification. The model demonstrated strong performance, with Kappa and OA values of 0.81 and 0.84, respectively. Todo fir, Japanese oak, and Spruce spp. achieved the highest Kappa per class values, indicating reliable classification. In contrast, Manchurian ash and Maple spp. showed low Kappa per class (0.45 and 0.34), indicating poor classification performance. Low Short and Kappa scores for these species further confirm weak model performance. Table 7 shows the confusion matrix for MRS-RF tree species classification for testing data (Table S8 shows the MRS-RF confusion matrix for whole data). Japanese oak was frequently confused with Manchurian ash, Maple spp., and Magnolia spp., resulting in higher commission errors. Gaps in the study area were predicted with perfect PA and UA (value = 1).
Table 6.
The Kappa statistics of tree species classification using MRS-RF model for testing data.
Table 7.
The confusion matrix of tree species classification using MRS-RF model for testing data.
3.2.2. DF-CNN Tree Species Classification
Table 8 presents the Kappa statistics of DF-CNN tree species classification for the testing data (Table S9 shows the DF-CNN accuracy for all the data). Treetop-based ITCD with a 2 m smoothing level (Section 3.1.2., Table 5) provided optimal results and was used for DF-CNN tree species classification. The model achieved the highest accuracy, with the Kappa and OA values of 0.91 and 0.92, respectively, indicating superior performance. Japanese oak, Spruce spp., and Todo fir were classified with higher PA (0.96), indicating less misclassification. Maple spp. had the lowest PA (0.67) and Kappa per class (0.61), reflecting difficulty in identifying all instances. Table 9 shows the confusion matrix of DF-CNN tree species classification for testing data (Table S10 shows the DF-CNN confusion matrix for whole data). Most species showed minimal confusion, with the highest confusion observed between Japanese oak and Maple spp.
Table 8.
The Kappa statistics of tree species classification using DF-CNN model for testing data.
Table 9.
The confusion matrix of tree species classification using DF-CNN model for testing data.
3.2.3. Visual Display of MRS-RF and DF-CNN Tree Species Classification
Figure 6, Figure 7 and Figure 8 display the MRS-RF and DF-CNN tree species classification alongside reference tree species crowns in HD, MD, and LD plots of both CDM and BDM plots, respectively. Tree species classification of MRS-RF and DF-CNN was highly matched with the reference tree crowns in CDM plots compared to BDM plots in all density classes.
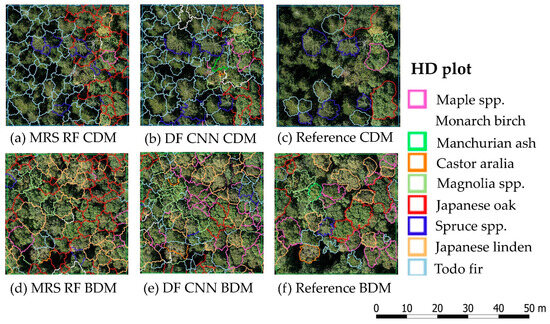
Figure 6.
The results of MRS-RF and DF-CNN tree species classification with the reference tree species crowns in CDM and BDM plots for the HD plots. (a,d)—MRS RF species prediction in CDM and BDM plots, respectively; (b,e)—DF-CNN species prediction in CDM and BDM plots, respectively; (c,f)—reference tree species crowns in CDM and BDM, respectively.
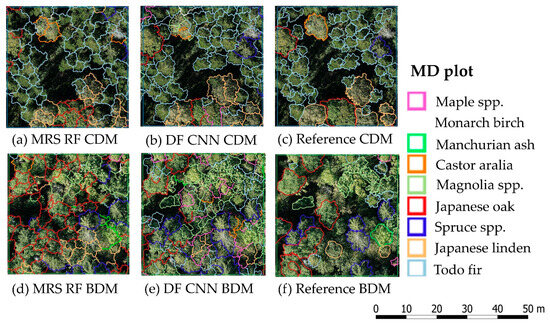
Figure 7.
The results of MRS-RF and DF-CNN tree species classification with the reference tree species crowns in CDM and BDM plots for the MD plots. (a,d)—MRS RF species prediction in CDM and BDM plots, respectively; (b,e)—DF-CNN species prediction in CDM and BDM plots, respectively; (c,f)—reference tree species crowns in CDM and BDM, respectively.
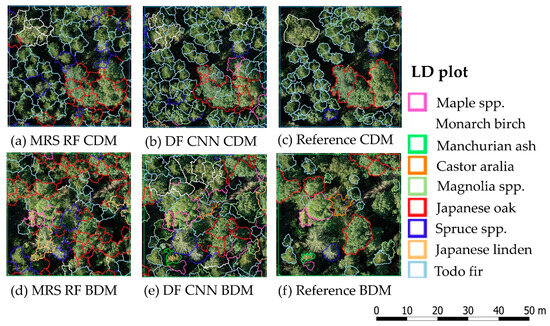
Figure 8.
The results of MRS-RF and DF-CNN tree species classification with the reference tree species crowns in CDM and BDM plots for the LD plots. (a,d)—MRS RF species prediction in CDM and BDM plots, respectively; (b,e)—DF-CNN species prediction in CDM and BDM plots, respectively; (c,f)—reference tree species crowns in CDM and BDM, respectively.
3.2.4. Mapping of MRS-RF and DF-CNN Tree Species in the Study Area
Figure 9 displays the tree species classification map of MRS-RF and DF-CNN models. Both models showed similar predictions of tree species classification. However, MRS-RF (Figure 9a) notably overpredicted Japanese oak, misclassifying species such as Manchurian ash, Maple spp., and Japanese linden as Japanese oak, consistent with Table 7 (confusion matrix). In contrast, DF-CNN prediction (Figure 9b) showed fewer misclassifications, consistent with Table 9 (confusion matrix). The gaps were accurately predicted by both MRS-RF and DF-CNN; however, for mapping in this study area, only tree species were displayed, with gaps excluded.
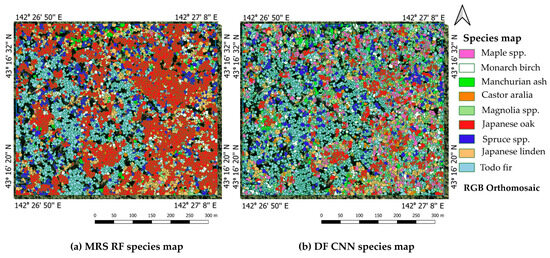
Figure 9.
The tree species classification map in the study area: (a) MRS-RF tree species classification map using MRS ITCD; (b) DF-CNN tree species classification map using DF ITCD.
4. Discussion
4.1. Individual Tree Crown Detection
In the MRS ITCD approach, combination models 3 and 5 demonstrated strong performance across all sampling plots in the complex MCBF. These models integrated different combinations of metrics, comprising structural, textural, and spectral, from different layers, enhancing feature extraction and improving ITCD accuracy. In particular, the highest accuracy was observed in HD plots of both CDM and BDM, revealing that more features are necessary for ITCD in complex dense forests. In contrast, for LD and MD areas, fewer layers (e.g., RGB, CHM, and MS) were sufficient, reducing the time and computational demands. Models using only RGB and CHM layers in MRS showed lower ITCD accuracy, likely due to the forked tree crowns with larger sizes of broadleaf species, and this was consistent with previous studies [18,47].
The DF ITCD method using treetop detection outperformed the multilayer approach across all forest types and density classes. This model was integrated into different combinations of metrics, comprising structural and spectral metrics only. These findings highlight better performances of adaptability and robustness of the DL model even with only two metrics combinations to varying canopy structures. Smoothing level had a notable impact: a 2 m threshold performed better in dense plots (HD in both CDM and BDM) due to tighter crown spacing and smaller gaps between treetops, consistent with previous findings [16], while a 3 m threshold was more effective in MD and LD plots, where wider crown spacing facilitated clearer treetop identification. The treetop-based ITCD approach utilizing marker-controlled watershed segmentation achieved high detection by minimizing crown over-detection [7,63]. DL-based marker-controlled watershed segmentation using CNN and U-Net enables the accurate detection of individual tree crowns in the complex forest [64,65].
Compared to MRS, the DF consistently achieved higher F-scores (0.62–0.79), demonstrating superior performance in ITCD. This can be attributed to its data-driven, pixel-level learning, which reduces over- and under-tree crown detection errors. While prior work reported in temperate deciduous forests reported a lower F- score of 0.52 using DF [33], our results align more closely with Miraki et al. [21], who achieved F-scores of 0.79 for HD and 0.67 for LD sites in a broadleaf forest, though their study used a region-growing algorithm in less complex environments. Other studies have also shown high ITCD accuracy (F1 score = 0.88) in the complex forest using advanced DL models: StarDist (based on star-convex polygon extraction by U-Net) [16]. In a mixed forest, relatively higher ITCD accuracy (F-score = 0.86) was reported using Mask R-CNN due to less density (100 stems ha−1) and coarser resolutions (0.5 m) [66]. DF-based ITCD is potentially cost-effective, as it relies on just two input layers: RGB imagery and CHM.
Despite improvements in ITCD using the MRS method, it consistently over-segmented individual tree crowns, leading to over-detection. As a result, the method produced lower F-scores due to increased commission errors. Although masking functions were applied in DF to exclude gaps for accuracy improvement, MRS lacks this capability. However, incorporating different combinations of metrics, comprising structural, textural, and spectral metrics, improved MRS performance, indicating its potential as an effective alternative when DF is unavailable. In subtropical forests, integrating structural, textural, and spectral metrics provided higher accuracy for ITCD (F-score = 0.91) using UAV LiDAR hyperspectral; this was due to less complexity of the study area, which is characterized as single-layered, and there are few small trees [40]. Despite its superior performance, the DF-based ITCD method remains sensitive to crown shape variability, particularly in trees with forked crowns and overlapping canopies.
4.2. Individual Tree Species Classification
In this study, the MRS-RF model achieved relatively high classification accuracy (Kappa = 0.81), primarily due to the use of combination model 5, which incorporated structural, textural, and spectral metrics. The diverse and robust layers in these different combinations of metrics effectively captured fine-scale features of individual tree crowns, enabling accurate species classification in this heterogeneous forest environment. Coniferous species such as Spruce spp. (Kappa = 0.90) and Todo fir (Kappa = 0.97) were classified with high accuracy, attributed to their distinct crown shapes and unique spectral reflectance. Among the broadleaf species, some were often misclassified as Japanese oak, revealing a slightly weak user. This could be attributed to the inability of the RF classifier to effectively differentiate these species from Japanese oak. This limitation is likely due to low-level feature extraction and the similarity in tree crown shape, canopy structure, and, particularly, spectral reflectance among these species. In a subtropical forest, eight tree species were classified using the RF model with MRS features, achieving a Kappa value of 0.83, which was slightly higher than our study. Incorporating textural metrics and structural metrics alongside spectral metrics improved the tree species classification accuracy using the MRS-RF model [3], further supporting the effectiveness of incorporating different combinations of metrics. In a temperate forest, four deciduous tree species were classified using the MRS-RF model, achieving a Kappa value of 0.72 through the integration of structural and spectral metrics [23]. In a previous study, four tree species (Monarch birch, Castor aralia, Japanese oak, Conifer, and other broadleaf species) were classified with lower accuracy (Kappa value of 0.53–0.66) using MRS-RF in other forest two compartments in the same study area [47]. Their study utilized metrics derived solely from RGB imagery without integration of MS data. Another study in MCBF and MRS-RF classification provided relatively high accuracy (Kappa = 0.77) for eight tree species classes using different combinations of metrics, comprising structural, textural, and spectral [18]; this value was lower than our results, likely due to fewer input layers and greater site complexity. In a subtropical forest, integrating different combinations of metrics, comprising structural, textural, and spectral metrics, provided comparable accuracy for RF tree species classification (Kappa = 0.91) using UAV LiDAR, hyperspectral, and RGB imagery, though the site was less complex [40]. A comparable accuracy (Kappa = 0.90) was also achieved in an MCBF for seven tree species classes using object-based CNN applied to MRS [17].
The DF-CNN model achieved high species classification accuracy (Kappa = 0.93), with minimal inter-species confusion (class-wise Kappa > 0.85), largely due to the precise individual tree crowns and an effective DL model. EfficientNet-B1, employed for this study, efficiently balances network depth, width, and resolution through compound scaling, achieving superior accuracy with lower computational demands compared to older CNN models such as visual geometry group (VGG) or ResNet. Its ability to capture subtle differences in leaf texture, shadow, and crown shape makes it well-suited for classification tasks using very high-resolution UAV imagery (2.5 cm) [35,36,37]. DL model leveraged both structural (CHM) and spectral features for species-level classification [17]. In an MCBF forest, relatively lower accuracy (F-score: 0.75–0.86) was obtained for tree species classification using aerial RGB imagery and Faster R-CNN, likely due to the lower spatial resolution (10 cm) and limited use of combined metrics [5]. In MCBF, ResNet152 CNN classified seven tree species with high accuracy (Kappa = 0.91) using RGB imagery captured during the green leaf season [17]. In the same study area, Mask R-CNN achieved an F-score of 0.73 for six species using UAV RGB imagery [67]. In a study, 56 tree species across three sites were classified with an overall accuracy of 0.47 using UAV RGB imagery and EfficientNet-B7 [38], likely due to the spectral similarity and overlapping characteristics among many species.
To further validate our tree species classification results, we compared them with a previous study [46] conducted in the same forest sub-compartment (68E), which used the ResNet101 model and focused solely on Japanese oak species. They reported a high OA and F1 score of 0.90 and 0.80, respectively, aligning closely with our results. Both studies showed similar spatial distribution patterns for Japanese oak. However, while both CNN models exhibited some misclassification, ResNet101 frequently misclassified conifer species Manchurian ash and Magnolia spp. as Japanese oak. In contrast, the EfficientNet-B1 model reduced such errors, enhancing overall classification accuracy by better distinguishing visually similar species. Additionally, our model classified a broader range of species, including both conifers and broadleaf species, demonstrating its ability to capture species-specific characteristics. Nonetheless, Maple spp. was commonly misclassified, likely due to its spectral similarity with multiple other species [14,17] and overlapping textural features [38]. Visual inspection of leaf-off imagery revealed distinct differences in stem and branch color between Maple spp. and Japanese oak, confirming their separability in the field and suggesting that incorporating leaf-off or multi-seasonal imagery could improve classification accuracy. Despite the strong performance of the DF-CNN model, slightly reduced accuracy was observed in BDM plots, primarily for species with irregular crown shapes, where segmentation inaccuracies likely affected classification results.
4.3. Management Aspect
We accurately detected individual tree crowns (F-score = 0.79) and classified tree species (Kappa = 0.93) in the complex MCBF. These results enable the estimation of structural properties such as crown area, tree height, basal area, DBH, carbon stock, and volume at the individual tree scale [4,47]. This capability supports species-specific management and selection harvesting, contributing to sustainable forest management practices. For example, Japanese oak is a highly valued timber species primarily used for whisky barrel production [4,45,46,47]. Accurate identification of conifers and broadleaf species, particularly distinguishing Todo fir and Spruce spp., is essential for determining dominant forest types and supporting stand classification. In addition to Japanese oak, other high-valued timber species were classified, such as Monarch birch, Manchurian ash, Japanese linden, Castor aralia, and Maple spp. [45,47]. Mapping their spatial distribution helps identify economically important trees for targeted management. Magnolia spp. is not considered a high-value timber species; it has bioactive constituents with medicinal properties [68] and is used for landscape decoration. Consequently, forest managers can consider replacing Magnolia spp. with high-value timber species to optimize forest utility and economic returns or retaining them for biodiversity conservation and ecological purposes.
5. Conclusions
In this study, we proposed MRS and DF models and different combinations of metrics derived from very high-resolution UAV imagery to improve the ITCD and species classification in complex MCBF. Our findings reveal that ITCD and classification performance varied significantly depending on the methods used, machine learning models, different combinations of metrics, forest type, and tree density.
In the MRS-based ITCD, among the five tested combination models with different layers, our proposed combination models (3, 4, and 5) relatively yielded the highest accuracy (F-scores: 0.37–0.58) across the forest types (CDM and BDM) and tree density (HD, MD, and LD), suggesting that integrating different combinations of metrics, comprising structural, textural, and spectral metrics, improves segmentation robustness in dense and heterogeneous conditions. In contrast, DF-based-ITCD yielded the highest accuracy (F-score: 0.53–0.79) with the different combinations of metrics, comprising structural and spectral metrics across the forest types and tree density, particularly when using the treetop detection method. These findings suggest the DF model robustness is integrated only with structural and spectral metrics. For tree species classification, the MRS-RF model using ITCD results from combination model 5 achieved high accuracy (Kappa = 0.81), highlighting the effectiveness of structural, textural, and spectral metrics derived from UAV RGB and MS imagery. Compared to the MRS-RF, DF-CNN yielded superior accuracy (Kappa = 0.91) with structural and spectral metrics, demonstrating model robustness, high-level feature extractions, and reduced misclassification.
The outcomes of this study have practical implications for forest management in structurally complex forests. Accurate ITCD and species identification are crucial for implementing precision forestry practices, including species-specific inventories, growth monitoring, biodiversity assessment, and selective harvesting. By leveraging very high-resolution UAV imagery and advanced tree crown detection techniques, forest managers can generate detailed tree species maps in complex forests. This contributes to better-informed silvicultural interventions, particularly in ecosystems where conventional ground-based surveys are logistically challenging and resource-intensive.
Despite improvements in ITCD and species classification, this study has some limitations. RGB and MS data were used for both ITCD and classification, while seasonal imagery aided manual species identification. Future work should explore integrating seasonal data into model training to further enhance classification performance. Additionally, applying the trained models to diverse forest types and geographic regions could improve scalability. For the MRS analysis, UAV RGB and MS imageries were acquired using separate UAV platforms, increasing data acquisition costs. In contrast, the DF approach used a single RGB acquisition, reducing such costs. Nevertheless, the use of modern UAV platforms capable of carrying multiple sensors can address this cost issue in future MRS applications. In the MRS model, achieving higher accuracy required different combinations of metrics, including structural, textural, and spectral metrics, increasing the computational burden. The use of different software tools also presented constraints: while eCognition allowed the integration of multiple data layers in the MRS workflow, DF Scanner was limited to only two layers. As a result, combination models using three or more data layers could not be implemented with DF due to software limitations. However, the DF model still performed well using just two layers—structural and spectral—highlighting its efficiency. These findings indicate that DF Scanner offers a cost-effective and operationally simpler alternative for forestry applications, requiring fewer data inputs and less expert knowledge. A further limitation was the small number of field sampling plots—only three each for the CDM and BDM forest types, with a single plot per density category. In addition, some tree species were excluded due to insufficient sample sizes. Expanding plot coverage, incorporating data augmentation, and employing more advanced deep learning models could improve the classification of underrepresented species. In this study, training data were created manually, and subsequent processes were carried out within the software based on selected parameters and model configurations. As all steps were handled internally, no data augmentation techniques were applied to address the class imbalance in tree species classification, which represents a limitation of the approach. Further, manually delineated tree crowns were used as reference data for individual tree crown detection and species annotation due to the lack of sufficient field-measured data, which represents a study limitation. Future studies could address this by integrating more extensive field-based measurements for accurate crown mapping to reduce subjectivity and improve reference data quality. Finally, ITCD remains a challenge for large broadleaf trees with forked crowns, which future studies should aim to address.
Supplementary Materials
The following supporting information can be downloaded at https://www.mdpi.com/article/10.3390/geomatics5030032/s1, Figure S1: The tree species identification using visual observation high-resolution UAV imagery. For accurate identification of tree species, imagery collected from different seasons and leaf-off imagery were used. Species with similar crown colors were accurately identified using leave fall imagery by observing stem patterns, colors, and branches; Figure S2: The illustration of structural, textural, and spectral metrics in a plot with RGB and MS orthomosaics and edge detection algorithm derived from UAV imagery; Figure S3: Manul tree species classification map using manual ITCD in the study area; Figure S4: The illustration of TP, FP, and FN with correct, over-, and under-detection of individual tree crowns. When FN increases, it leads to omission errors; similarly, when FP increases, it leads to commission errors; Figure S5: The illustration of correctly classified and incorrectly classified tree species as an example for oak species; Table S1: Flight parameters and specifications for RGB and MS Imagery collections using DJI Matric 300 RTK and DJI Mavic 3M RTK in leaf-on and leaf-off seasons; Table S2: The DBH estimation using the H-DBH model for the evaluation of manually detected trees; Table S3: The accuracy value of MRS individual tree crown detection in CDM plots; Table S4: The accuracy value of MRS individual tree crown detection in BDM plots; Table S5: The accuracy value of DF individual tree crown detection in CDM plots; Table S6: The accuracy value of DF individual tree crown detection in BDM plots; Table S7: The Kappa statistics of tree species classification using the MRS-RF model for whole data; Table S8: The confusion matrix of tree species classification using the MRS-RF model for whole data; Table S9: The Kappa statistics of tree species classification using the DF-CNN model for whole data; Table S10: The confusion matrix of tree species classification using the DF-CNN model for whole data.
Author Contributions
Writing original draft for the manuscript, software handling, methodology, formal analysis, data curation, conceptualization, J.K.; writing—review and editing, resources, supervision, validations, project administration, T.O.; writing—review and editing, S.T.; writing—review and editing, T.H. All authors have read and agreed to the published version of the manuscript.
Funding
The research was conducted as part of a collaborative project between Suntory Spirits Ltd., Kitanihon Lumber Co., Ltd., and UTHF, along with the project for co-creation of a regenerative, recycling-oriented future society through the creation of new value from trees and plants in collaboration with Sumitomo Forestry Co., Ltd. JURO KAWACHI DONATION FUND, a collaborative research fund between UTHF and Oji Forest & Products Co., Ltd. and JSPS KAKENHI (Grant Number 16H04946), was used for airborne LiDAR data collection at UTHF. The Japan International Cooperation Agency partly supported a Ph.D. program (JICA/JFY 2022) under the SDGs Global Leader Program (Grant Number D2203516-202006551-J011).
Institutional Review Board Statement
Not applicable.
Informed Consent Statement
Not applicable.
Data Availability Statement
The data used in this study belong to the University of Tokyo Hokkaido Forest. The field and UAV data are not publicly available due to forest management practices and site sensitivity. Nonetheless, these datasets can be provided by the corresponding author upon request and with appropriate justification.
Acknowledgments
We would like to sincerely thank the technical staff of the UTHF—Kenji Fukushi, Eiichi Nobu, Mutsuki Hirama, Yuji Nakagawa, and Akio Oshima—for their great support during field and UAV data collection. Great thanks to Nyo Me Htun for assisting with field data collection and providing results of detected Japanese oak tree crowns using a deep learning algorithm for comparisons. We used ChatGPT-4 (OpenAI, San Francisco, CA, USA) only for the assistance of English editing.
Conflicts of Interest
The authors declare no conflicts of interest.
References
- Du, X.; Lei, X.; He, X.; Lan, J.; Guo, H.; Xu, Q. Ecosystem Service Multifunctionality of Mixed Conifer-Broad-Leaved Forests under Climate Change and Forest Management Based on Matrix Growth Modelling. For. Ecosyst. 2024, 11, 100231. [Google Scholar] [CrossRef]
- Grotti, M.; Chianucci, F.; Puletti, N.; Fardusi, M.J.; Castaldi, C.; Corona, P. Spatio-Temporal Variability in Structure and Diversity in a Semi-Natural Mixed Oak-Hornbeam Floodplain Forest. Ecol. Indic. 2019, 104, 576–587. [Google Scholar] [CrossRef]
- Xu, Z.; Shen, X.; Cao, L.; Coops, N.C.; Goodbody, T.R.H.; Zhong, T.; Zhao, W.; Sun, Q.; Ba, S.; Zhang, Z.; et al. Tree Species Classification Using UAS-Based Digital Aerial Photogrammetry Point Clouds and Multispectral Imageries in Subtropical Natural Forests. Int. J. Appl. Earth Obs. Geoinf. 2020, 92, 102173. [Google Scholar] [CrossRef]
- Karthigesu, J.; Owari, T.; Tsuyuki, S.; Hiroshima, T. Improving the Individual Tree Parameters Estimation of a Complex Mixed Conifer—Broadleaf Forest Using a Combination of Structural, Textural, and Spectral Metrics Derived from Unmanned Aerial Vehicle RGB and Multispectral Imagery. Geomatics 2025, 5, 12. [Google Scholar] [CrossRef]
- Beloiu, M.; Heinzmann, L.; Rehush, N.; Gessler, A.; Griess, V.C. Individual Tree-Crown Detection and Species Identification in Heterogeneous Forests Using Aerial RGB Imagery and Deep Learning. Remote Sens. 2023, 15, 1463. [Google Scholar] [CrossRef]
- Bai, Y.; Walsworth, N.; Roddan, B.; Hill, D.A.; Broersma, K.; Thompson, D. Quantifying Tree Cover in the Forest–Grassland Ecotone of British Columbia Using Crown Delineation and Pattern Detection. For. Ecol. Manag. 2005, 212, 92–100. [Google Scholar] [CrossRef]
- Dalponte, M.; Frizzera, L.; Ørka, H.O.; Gobakken, T.; Næsset, E.; Gianelle, D. Predicting Stem Diameters and Aboveground Biomass of Individual Trees Using Remote Sensing Data. Ecol. Indic. 2018, 85, 367–376. [Google Scholar] [CrossRef]
- Gini, R.; Sona, G.; Ronchetti, G.; Passoni, D.; Pinto, L. Improving Tree Species Classification Using UAS Multispectral Images and Texture Measures. ISPRS Int. J. Geoinf. 2018, 7, 315. [Google Scholar] [CrossRef]
- Immitzer, M.; Atzberger, C.; Koukal, T. Tree Species Classification with Random Forest Using Very High Spatial Resolution 8-Band WorldView-2 Satellite Data. Remote Sens. 2012, 4, 2661–2693. [Google Scholar] [CrossRef]
- Allen, M.J.; Grieve, S.W.D.; Owen, H.J.F.; Lines, E.R. Tree Species Classification from Complex Laser Scanning Data in Mediterranean Forests Using Deep Learning. Methods Ecol. Evol. 2023, 14, 1657–1667. [Google Scholar] [CrossRef]
- Terryn, L.; Calders, K.; Disney, M.; Origo, N.; Malhi, Y.; Newnham, G.; Raumonen, P.; Kerblom, M.Å.; Verbeeck, H. Tree Species Classification Using Structural Features Derived from Terrestrial Laser Scanning. ISPRS J. Photogramm. Remote Sens. 2020, 168, 170–181. [Google Scholar] [CrossRef]
- Chen, Q.; Luo, H.; Cheng, Y.; Xie, M.; Nan, D. An Individual Tree Detection and Segmentation Method from TLS and MLS Point Clouds Based on Improved Seed Points. Forests 2024, 15, 1083. [Google Scholar] [CrossRef]
- Ballanti, L.; Blesius, L.; Hines, E.; Kruse, B. Tree Species Classification Using Hyperspectral Imagery: A Comparison of Two Classifiers. Remote Sens. 2016, 8, 445. [Google Scholar] [CrossRef]
- Fassnacht, F.E.; Latifi, H.; Stereńczak, K.; Modzelewska, A.; Lefsky, M.; Waser, L.T.; Straub, C.; Ghosh, A. Review of Studies on Tree Species Classification from Remotely Sensed Data. Remote Sens. Environ. 2016, 186, 64–87. [Google Scholar] [CrossRef]
- Dainelli, R.; Toscano, P.; Di Gennaro, S.F.; Matese, A. Recent Advances in Unmanned Aerial Vehicles Forest Remote Sensing—A Systematic Review. Part II: Research Applications. Forests 2021, 12, 397. [Google Scholar] [CrossRef]
- Tong, F.; Zhang, Y. Individual Tree Crown Delineation in High Resolution Aerial RGB Imagery Using StarDist-Based Model. Remote Sens. Environ. 2025, 319, 114618. [Google Scholar] [CrossRef]
- Onishi, M.; Ise, T. Explainable Identification and Mapping of Trees Using UAV RGB Image and Deep Learning. Sci. Rep. 2021, 11, 903. [Google Scholar] [CrossRef]
- Sivanandam, P.; Lucieer, A. Tree Detection and Species Classification in a Mixed Species Forest Using Unoccupied Aircraft System (UAS) RGB and Multispectral Imagery. Remote Sens. 2022, 14, 4963. [Google Scholar] [CrossRef]
- Ferreira, M.P.; Wagner, F.H.; Aragão, L.E.O.C.; Shimabukuro, Y.E.; de Souza Filho, C.R. Tree Species Classification in Tropical Forests Using Visible to Shortwave Infrared WorldView-3 Images and Texture Analysis. ISPRS J. Photogramm. Remote Sens. 2019, 149, 119–131. [Google Scholar] [CrossRef]
- Komárek, J.; Klápště, P.; Hrach, K.; Klouček, T. The Potential of Widespread UAV Cameras in the Identification of Conifers and the Delineation of Their Crowns. Forests 2022, 13, 710. [Google Scholar] [CrossRef]
- Miraki, M.; Sohrabi, H.; Fatehi, P.; Kneubuehler, M. Individual Tree Crown Delineation from High-Resolution UAV Images in Broadleaf Forest. Ecol. Inf. 2021, 61, 101207. [Google Scholar] [CrossRef]
- Ke, Y.; Quackenbush, L.J. A Review of Methods for Automatic Individual Tree-Crown Detection and Delineation from Passive Remote Sensing. Int. J. Remote Sens. 2011, 32, 4725–4747. [Google Scholar] [CrossRef]
- Franklin, S.E.; Ahmed, O.S. Deciduous Tree Species Classification Using Object-Based Analysis and Machine Learning with Unmanned Aerial Vehicle Multispectral Data. Int. J. Remote Sens. 2018, 39, 5236–5245. [Google Scholar] [CrossRef]
- Chen, C.; Jing, L.; Li, H.; Tang, Y.; Chen, F. Individual Tree Species Identification Based on a Combination of Deep Learning and Traditional Features. Remote Sens. 2023, 15, 2301. [Google Scholar] [CrossRef]
- Marrs, J.; Ni-Meister, W. Machine Learning Techniques for Tree Species Classification Using Co-Registered LiDAR and Hyperspectral Data. Remote Sens. 2019, 11, 819. [Google Scholar] [CrossRef]
- Zhang, C.; Xia, K.; Feng, H.; Yang, Y.; Du, X. Tree Species Classification Using Deep Learning and RGB Optical Images Obtained by an Unmanned Aerial Vehicle. J. For. Res. 2021, 32, 1879–1888. [Google Scholar] [CrossRef]
- Zhong, H.; Zhang, Z.; Liu, H.; Wu, J.; Lin, W. Individual Tree Species Identification for Complex Coniferous and Broad-Leaved Mixed Forests Based on Deep Learning Combined with UAV LiDAR Data and RGB Images. Forests 2024, 15, 293. [Google Scholar] [CrossRef]
- Fraser, B.T.; Congalton, R.G.; Ducey, M.J. Quantifying the Accuracy of UAS-Lidar Individual Tree Detection Methods Across Height and Diameter at Breast Height Sizes in Complex Temperate Forests. Remote Sens. 2025, 17, 1010. [Google Scholar] [CrossRef]
- Yang, Q.; Su, Y.; Jin, S.; Kelly, M.; Hu, T.; Ma, Q.; Li, Y.; Song, S.; Zhang, J.; Xu, G.; et al. The Influence of Vegetation Characteristics on Individual Tree Segmentation Methods with Airborne LiDAR Data. Remote Sens. 2019, 11, 2880. [Google Scholar] [CrossRef]
- Shen, X.; Cao, L. Tree-Species Classification in Subtropical Forests Using Airborne Hyperspectral and LiDAR Data. Remote Sens. 2017, 9, 1180. [Google Scholar] [CrossRef]
- Weinstein, B.G.; Marconi, S.; Aubry-Kientz, M.; Vincent, G.; Senyondo, H.; White, E.P. DeepForest: A Python Package for RGB Deep Learning Tree Crown Delineation. Methods Ecol. Evol. 2020, 11, 1743–1751. [Google Scholar] [CrossRef]
- Li, Y.; Chai, G.; Wang, Y.; Lei, L.; Zhang, X. ACE R-CNN: An Attention Complementary and Edge Detection-Based Instance Segmentation Algorithm for Individual Tree Species Identification Using UAV RGB Images and LiDAR Data. Remote Sens. 2022, 14, 3035. [Google Scholar] [CrossRef]
- Gan, Y.; Wang, Q.; Iio, A. Tree Crown Detection and Delineation in a Temperate Deciduous Forest from UAV RGB Imagery Using Deep Learning Approaches: Effects of Spatial Resolution and Species Characteristics. Remote Sens. 2023, 15, 778. [Google Scholar] [CrossRef]
- Ball, J.G.C.; Hickman, S.H.M.; Jackson, T.D.; Koay, X.J.; Hirst, J.; Jay, W.; Archer, M.; Aubry-Kientz, M.; Vincent, G.; Coomes, D.A. Accurate Delineation of Individual Tree Crowns in Tropical Forests from Aerial RGB Imagery Using Mask R-CNN. Remote Sens. Ecol. Conserv. 2023, 9, 641–655. [Google Scholar] [CrossRef]
- Nigam, S.; Jain, R.; Singh, V.K.; Marwaha, S.; Arora, A.; Jain, S. EfficientNet Architecture and Attention Mechanism-Based Wheat Disease Identification Model. Procedia Comput. Sci. 2024, 235, 383–393. [Google Scholar] [CrossRef]
- Krishna Adithya, V.; Williams, B.M.; Czanner, S.; Kavitha, S.; Friedman, D.S.; Willoughby, C.E.; Venkatesh, R.; Czanner, G. EffUnet-SpaGen: An Efficient and Spatial Generative Approach to Glaucoma Detection. J. Imaging 2021, 7, 92. [Google Scholar] [CrossRef]
- Teo, K.K.; Noor, N.F.B.M.; Palaiahnakote, S.; Ayub, M.N. Bin An Efficientnet-Based Model for Classification of Oil Palm, Coconut and Banana Trees in Drone Images. Smart Agric. Technol. 2025, 10, 100748. [Google Scholar] [CrossRef]
- Onishi, M.; Watanabe, S.; Nakashima, T.; Ise, T. Practicality and Robustness of Tree Species Identification Using UAV RGB Image and Deep Learning in Temperate Forest in Japan. Remote Sens. 2022, 14, 1710. [Google Scholar] [CrossRef]
- Avtar, R.; Chen, X.; Fu, J.; Alsulamy, S.; Supe, H.; Pulpadan, Y.A.; Louw, A.S.; Tatsuro, N. Tree Species Classification by Multi-Season Collected UAV Imagery in a Mixed Cool-Temperate Mountain Forest. Remote Sens. 2024, 16, 4060. [Google Scholar] [CrossRef]
- Qin, H.; Zhou, W.; Yao, Y.; Wang, W. Individual Tree Segmentation and Tree Species Classification in Subtropical Broadleaf Forests Using UAV-Based LiDAR, Hyperspectral, and Ultrahigh-Resolution RGB Data. Remote Sens. Environ. 2022, 280, 113143. [Google Scholar] [CrossRef]
- Wang, X.; Wang, Y.; Zhou, C.; Yin, L.; Feng, X. Urban Forest Monitoring Based on Multiple Features at the Single Tree Scale by UAV. Urban For. Urban Green. 2021, 58, 126958. [Google Scholar] [CrossRef]
- Dian, Y.; Li, Z.; Pang, Y. Spectral and Texture Features Combined for Forest Tree Species Classification with Airborne Hyperspectral Imagery. J. Indian Soc. Remote Sens. 2015, 43, 101–107. [Google Scholar] [CrossRef]
- Abdollahnejad, A.; Panagiotidis, D. Tree Species Classification and Health Status Assessment for a Mixed Broadleaf-Conifer Forest with UAS Multispectral Imaging. Remote Sens. 2020, 12, 3722. [Google Scholar] [CrossRef]
- Jiang, M.; Kong, J.; Zhang, Z.; Hu, J.; Qin, Y.; Shang, K.; Zhao, M.; Zhang, J. Seeing Trees from Drones: The Role of Leaf Phenology Transition in Mapping Species Distribution in Species-Rich Montane Forests. Forests 2023, 14, 908. [Google Scholar] [CrossRef]
- Moe, K.T.; Owari, T. Sustainability of High-Value Timber Species in Mixed Conifer–Broadleaf Forest Managed under Selection System in Northern Japan. Forests 2020, 11, 484. [Google Scholar] [CrossRef]
- Htun, N.M.; Owari, T.; Tsuyuki, S.; Hiroshima, T. Mapping the Distribution of High-Value Broadleaf Tree Crowns through Unmanned Aerial Vehicle Image Analysis Using Deep Learning. Algorithms 2024, 17, 84. [Google Scholar] [CrossRef]
- Moe, K.T.; Owari, T.; Furuya, N.; Hiroshima, T.; Morimoto, J. Application of UAV Photogrammetry with LiDAR Data to Facilitate the Estimation of Tree Locations and DBH Values for High-Value Timber Species in Northern Japanese Mixed-Wood Forests. Remote Sens. 2020, 12, 2865. [Google Scholar] [CrossRef]
- Liang, X.; Chen, J.; Gong, W.; Puttonen, E.; Wang, Y. Influence of Data and Methods on High-Resolution Imagery-Based Tree Species Recognition Considering Phenology: The Case of Temperate Forests. Remote Sens. Environ. 2025, 323, 114654. [Google Scholar] [CrossRef]
- Karthigesu, J.; Owari, T.; Tsuyuki, S.; Hiroshima, T. Improving the Estimation of Structural Parameters of a Mixed Conifer–Broadleaf Forest Using Structural, Textural, and Spectral Metrics Derived from Unmanned Aerial Vehicle Red Green Blue (RGB) Imagery. Remote Sens. 2024, 16, 1783. [Google Scholar] [CrossRef]
- Li, J.; Hu, B.; Noland, T.L. Classification of Tree Species Based on Structural Features Derived from High Density LiDAR Data. Agric. For. Meteorol. 2013, 171–172, 104–114. [Google Scholar] [CrossRef]
- Apostol, B.; Petrila, M.; Lorenţ, A.; Ciceu, A.; Gancz, V.; Badea, O. Species Discrimination and Individual Tree Detection for Predicting Main Dendrometric Characteristics in Mixed Temperate Forests by Use of Airborne Laser Scanning and Ultra-High-Resolution Imagery. Sci. Total Environ. 2020, 698, 134074. [Google Scholar] [CrossRef] [PubMed]
- Haralick, R.M. Statistical and Structural Approaches to Texture. Proc. IEEE 1979, 67, 786–804. [Google Scholar] [CrossRef]
- Haralick, R.M.; Shanmugam, K.; Dinstein, I. Textural Features for Image Classification. IEEE Trans. Syst. Man Cybern. 1973, SMC-3, 610–621. [Google Scholar] [CrossRef]
- Gallardo-Salazar, J.L.; Pompa-García, M. Detecting Individual Tree Attributes and Multispectral Indices Using Unmanned Aerial Vehicles: Applications in a Pine Clonal Orchard. Remote Sens. 2020, 12, 4144. [Google Scholar] [CrossRef]
- Deepak, M.; Keski-Saari, S.; Fauch, L.; Granlund, L.; Oksanen, E.; Keinänen, M. Leaf Canopy Layers Affect Spectral Reflectance in Silver Birch. Remote Sens. 2019, 11, 2884. [Google Scholar] [CrossRef]
- Sapes, G.; Lapadat, C.; Schweiger, A.K.; Juzwik, J.; Montgomery, R.; Gholizadeh, H.; Townsend, P.A.; Gamon, J.A.; Cavender-Bares, J. Canopy Spectral Reflectance Detects Oak Wilt at the Landscape Scale Using Phylogenetic Discrimination. Remote Sens. Environ. 2022, 273, 112961. [Google Scholar] [CrossRef]
- Hastings, J.H.; Ollinger, S.V.; Ouimette, A.P.; Sanders-DeMott, R.; Palace, M.W.; Ducey, M.J.; Sullivan, F.B.; Basler, D.; Orwig, D.A. Tree Species Traits Determine the Success of LiDAR-Based Crown Mapping in a Mixed Temperate Forest. Remote Sens. 2020, 12, 309. [Google Scholar] [CrossRef]
- Blaschke, T. Object Based Image Analysis for Remote Sensing. ISPRS J. Photogramm. Remote Sens. 2010, 65, 2–16. [Google Scholar] [CrossRef]
- Benz, U.C.; Hofmann, P.; Willhauck, G.; Lingenfelder, I.; Heynen, M. Multi-Resolution, Object-Oriented Fuzzy Analysis of Remote Sensing Data for GIS-Ready Information. ISPRS J. Photogramm. Remote Sens. 2004, 58, 239–258. [Google Scholar] [CrossRef]
- Miyoshi, G.T.; Imai, N.N.; Garcia Tommaselli, A.M.; Antunes de Moraes, M.V.; Honkavaara, E. Evaluation of Hyperspectral Multitemporal Information to Improve Tree Species Identification in the Highly Diverse Atlantic Forest. Remote Sens. 2020, 12, 244. [Google Scholar] [CrossRef]
- Yin, D.; Wang, L. How to Assess the Accuracy of the Individual Tree-Based Forest Inventory Derived from Remotely Sensed Data: A Review. Int. J. Remote Sens. 2016, 37, 4521–4553. [Google Scholar] [CrossRef]
- Cohen, J.A. A Coeffient of Agreement for Nominal Scales. Educ. Psychol. Meas. 1960, 20, 37–46. [Google Scholar] [CrossRef]
- Nuijten, R.J.G.; Coops, N.C.; Goodbody, T.R.H.; Pelletier, G. Examining the Multi-Seasonal Consistency of Individual Tree Segmentation on Deciduous Stands Using Digital Aerial Photogrammetry (DAP) and Unmanned Aerial Systems (UAS). Remote Sens. 2019, 11, 739. [Google Scholar] [CrossRef]
- Lassalle, G.; Ferreira, M.P.; La Rosa, L.E.C.; de Souza Filho, C.R. Deep Learning-Based Individual Tree Crown Delineation in Mangrove Forests Using Very-High-Resolution Satellite Imagery. ISPRS J. Photogramm. Remote Sens. 2022, 189, 220–235. [Google Scholar] [CrossRef]
- Freudenberg, M.; Magdon, P.; Nölke, N. Individual Tree Crown Delineation in High-Resolution Remote Sensing Images Based on U-Net. Neural Comput. Appl. 2022, 34, 22197–22207. [Google Scholar] [CrossRef]
- Braga, J.R.; Peripato, V.; Dalagnol, R.; Ferreira, M.; Tarabalka, Y.; Aragão, L.E.; de Campos Velho, H.; Shiguemori, E.H.; Wagner, F.H. Tree Crown Delineation Algorithm Based on a Convolutional Neural Network. Remote Sens. 2020, 12, 1288. [Google Scholar] [CrossRef]
- Yoshii, T.; Lin, C.; Tatsuhara, S.; Suzuki, S.; Hiroshima, T. Tree Species Mapping of a Hemiboreal Mixed Forest Using Mask R-CNN. In Proceedings of the IGARSS 2022—2022 IEEE International Geoscience and Remote Sensing Symposium, Kuala Lumpur, Malaysia, 17 July 2022; pp. 6228–6231. [Google Scholar]
- Rai, M.; Rai, A.; Yokosaka, T.; Mori, T.; Nakabayashi, R.; Nakamura, M.; Suzuki, H.; Saito, K.; Yamazaki, M. Multi-Omics Analysis Decodes Biosynthesis of Specialized Metabolites Constituting the Therapeutic Terrains of Magnolia obovata. Int. J. Mol. Sci. 2025, 26, 1068. [Google Scholar] [CrossRef]
Disclaimer/Publisher’s Note: The statements, opinions and data contained in all publications are solely those of the individual author(s) and contributor(s) and not of MDPI and/or the editor(s). MDPI and/or the editor(s) disclaim responsibility for any injury to people or property resulting from any ideas, methods, instructions or products referred to in the content. |
© 2025 by the authors. Licensee MDPI, Basel, Switzerland. This article is an open access article distributed under the terms and conditions of the Creative Commons Attribution (CC BY) license (https://creativecommons.org/licenses/by/4.0/).