Abstract
In an era of intense urban development and climate extremes, green infrastructure (GI) has become crucial for creating sustainable, livable, and resilient cities. However, the efficacy of GI is frequently undermined by haphazard implementation and resource misallocation that disregards appropriate spatial scales. This study develops a geographic information system (GIS)-based critical area detection model (CADM) to identify priority areas for the strategic placement of GI, incorporating four main indices—spatial form, green cover, gray cover, and land use change—and utilizing the digital elevation model (DEM), normalized difference vegetation index (NDVI), urban density index (UDI), and up-to-date land use data. By employing the developed method, the study successfully locates priority zones for GI implementation in Saitama City, Japan, effectively pinpointing areas that require immediate attention. This approach not only guarantees efficient resource allocation and maximizes the multifunctional benefits of GI but also highlights the importance of a flexible, all-encompassing GI network to address urbanization and environmental challenges. The findings offer policymakers a powerful tool with which to optimize GI placement, enhancing urban resilience and supporting sustainable development.
1. Introduction
Urban environs, characterized by their heterogeneity, are often subject to numerous disturbances. Constant development pressure and intensive human activities, as well as the impacts of climate extremes and associated damage, are the prominent disturbances [1,2,3]. The importance of mitigating the environmental consequences of urbanization is increasing with the demand for livable, sustainable, and robust urban spaces [4,5]. This evolving demand holds much promise for a positive attitude transformation towards the integration of natural elements within urban landscapes [6,7]. In particular, the concept of “green infrastructure” (GI) is gaining prominence in this realm, as seen by its increasing popularity in recent years [8,9]. The GI concept specifically attempts to address emerging urban challenges by advancing environmental preservation, urban development, and disaster management towards seamless and sustainable solutions [9,10]. Scholars argue that GI plays a crucial role in futuristic urban development, attracting people through appropriate placemaking, ensuring potential catalysts for businesses, and safeguarding environmental benefits [2,11]. In recent years, urban areas worldwide have progressively acknowledged the implementation of GI as a strategic approach to achieving innovative planning objectives [9,12].
At the same time, the haphazard implementation of GI comes with manifold issues and lacks flexibility in addressing complex urban landscapes and requirements [5,7]. The provision of GI facilitation in urban environments poses significant challenges due to the trade-offs involved in relation to the high demand for urban utilities [13,14]. If you do not choose and place GI optimally, it might not work as well and might cost more. In cities, space is limited, so finding the best places or arrangements for GI to make it work better is important [15]. The majority of GI implementation failures stem from a lack of comprehension of the various spatial scales, ranging from the elemental or microscale to the macroscale, at which urban settings adopt GI [16,17,18].
Strategic integration and networking of the GI elements in the cityscape is necessary to mitigate the debated disadvantages [16,19]. In order to successfully implement such networks, it is crucial to examine the urban environment in a comprehensive manner [13,20,21]. Gaining a deep understanding of the patterns, drivers, and impacts of urbanization, as well as the spatiotemporal changes in an urban landscape, is crucial. Such insights can effectively inform the development and optimization of GI [22]. This understanding is vital for recognizing regions that are experiencing substantial changes [16,23]. Urban planners can pinpoint the areas that require immediate attention for GI implementation while balancing urbanization with sustainability aspects through careful analysis of such trends [13,24,25]. This will help combat the adverse impacts caused by rapidly ongoing spatial changes, including, but not limited to, habitat fragmentation, depletion of green spaces, and heightened surface runoff [13,26].
The main goal of GI should be to improve the characteristics of urban landscapes by turning important spatial elements into multifunctional GI components and taking into account the best spatial scale [5,27]. Because of this, it is important that when planning and implementing GI for the future, the focus shifts to strategic GI networking across all possible spatial scales, with the long-term health and resilience of urban landscapes being the top priorities [1,28]. Spatially prioritizing GI implementation is often debated and seen as highly complex [29,30]. Table 1 presents a detailed comparison of the commonly used geographic information systems (GIS)-based methods for this purpose. By pointing out the limitations of these current approaches, Table 1 serves as an important tool with which to demonstrate the research gap that our study addresses.

Table 1.
A matrix comparing the current methods employed to allocate green infrastructure (GI) in a spatial manner.
The existing methods are better suited for GI placement on a micro-to-medium scale in an urban fabric. The limitations of these existing approaches (Table 1) in GI networking highlight the need for improved spatial prioritization techniques on a broader spatial scale. At the overall cityscape or macroscale, it is essential to utilize a technique that determines the specific areas where these micro- to medium-scale assessments should be concentrated. This can ensure the logical positioning of GI in a comprehensive manner, enabling a sophisticated network that is adaptable and affirmative in terms of resource allocation and maximization of benefits.
In light of this context, we aim to address the following research question: How can we evaluate the potential distribution of GI components in existing urban settings to efficiently prioritize regions for future GI improvement and upkeep? Accordingly, the primary objective of this study is to develop a method that can facilitate regional urban planning with rational GI placement based on strategic GI networking. More specifically, we advance the current research on GI by developing an assessment method with two key components:
- (i)
- The assessment of the potential distribution of GI elements in the current urban environment;
- (ii)
- Identification of areas where future efforts should be focused to improve and/or maintain urban GI assets.
The method being offered utilizes an evaluation framework, spatially presented as a GIS model, which can serve as a foundation for developing models applicable to any given urban landscape. It will serve as an initiation tool for policymakers aiming to utilize GI networking to support resilient, sustainable, and futuristic urban planning.
2. Materials and Methods
2.1. The Research Concept
The development of this suggested evaluation framework relies on the hypothesis that the strategic placement of GI affects its effectiveness [15,42]. This hypothesis is from the theoretical standpoint of “the GI networking approach”, which is based on ecological principles and systems thinking [19]. This approach views the urban landscape as an interconnected web of natural and built components, where the health of one element affects the overall well-being of the system [43,44]. Incorporating this theoretical approach in the proposed method involved customizing “the critical area detection concept”. In this theoretical framework, GIS technology plays a pivotal role in spatial modeling and analysis [45]. Critical area detection using GIS technology is a framework based on spatial data to identify and prioritize areas of significance or vulnerability within a given geographical region [46,47]. This theoretical perspective emphasizes the importance of using GIS as a tool for informed decision-making, enabling policymakers, environmentalists, and planners to prioritize resources and implement targeted interventions in areas identified as critical [48].
2.2. Study Area
We selected Saitama City, Japan, as the case study area (Figure 1). Currently, 1.3 million individuals inhabit the region, which spans 217.4 km2. During the Edo period, this region served as a vital route connecting Edo and Kyoto, and it prospered as a post town. Post towns were essential for the efficient transportation of mail and goods, thus playing a crucial role in improving communication and trade networks throughout Japan. These towns played a vital role in enabling transportation and communication along significant routes. Currently, this area remains a crucial transportation hub for East Japan, contributing to the rapid growth of urban development in recent times. Saitama City actively protects and uses its vast farmlands, parks, and waterfront areas as landscape resources, despite the strong pressure for rapid urbanization. Apart from conventional paddy farming, the city is seeing the rise of several new green features, such as Sakura tree lines along waterways and cutting-edge experimental fields like sunflower parks and moringa plantations. Given the evident rapid urbanization of the region, it is crucial to evaluate this city using the developed framework in order to prioritize critical regions for further GI interventions.
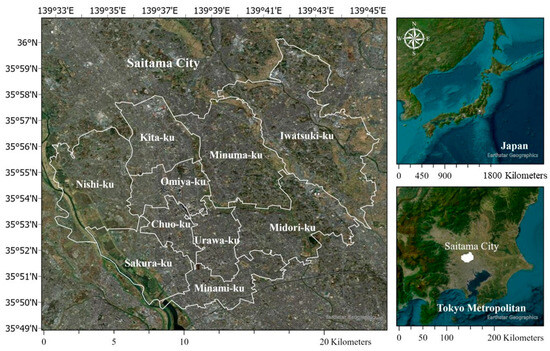
Figure 1.
Location of Saitama city, Japan.
2.3. Methodology
To achieve the first objective, we used GIS to develop spatial models for four different indices: spatial form, represented by a digital elevation model (DEM); green cover, measured by the normalized difference vegetation index (NDVI); gray cover, quantified by the urban density index (UDI); and land use/land cover (LU/LC). Table 2 presents the pertinent concepts and variables associated with submodels. To achieve the second objective, we developed a spatial model for detecting critical areas. The first step was reclassifying the raster outputs of four submodels in GIS. Reclassifying is a versatile method that enables analysts to tailor raster datasets to the specific needs of their analyses, making the data more understandable and compatible for various applications [49]. Next, by incorporating a composite distribution of these four submodels, we implemented a critical area detection model (CADM) on a grid with a cell size of 1 km2. We then divided the city into priority zones and identified the crucial regions that required GI networking improvements. We conducted all analyses using the ArcGIS Pro 3.0.2 platform.

Table 2.
Description of variables and data sources of submodels.
2.3.1. Preparation Steps of the CADM
This section provides an explanation of each submodel’s results, the reclassification outputs, and the categorization of its criteria. We employed an analytic hierarchy process (AHP) to assess the relative significance of each criterion considered in our research. We initiated the process with a brainstorming session, guided by a comprehensive literature review. During the session, we assessed each criterion and submodel by making pairwise comparisons. This comparative analysis enabled us to assign scores that accurately represent their relative significance, with the goal of addressing the specific requirements and difficulties associated with the placement of GI. We subsequently utilized the scores to calculate normalized weights, enabling a systematic and unbiased approach to decision-making. We assigned weights ranging from 1 to 10 to the class values to incorporate them into our model, with a score of 10 indicating the highest level of importance for potential GI elements. The scaling process was critical in determining the relative importance of the attributes that have the greatest impact on GI implementation effectiveness. We allocated an “effect weight” ranging from 0 to 100 to each submodel based on the purpose of the submodel as specified in Table 2. In our analysis, the weighting system we use reflects the relative importance of each GI characteristic. This approach ensures that the evaluation and planning process prioritizes the most important elements and ensures that each submodel has a significant impact on the final result, reflecting its importance in achieving the desired outcome.
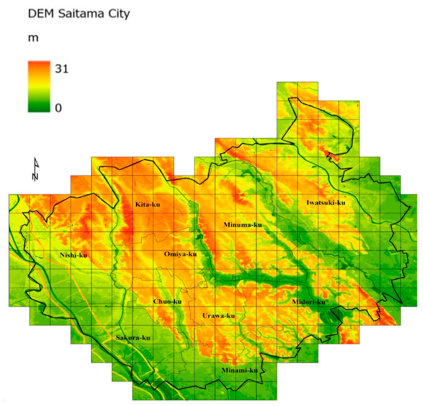
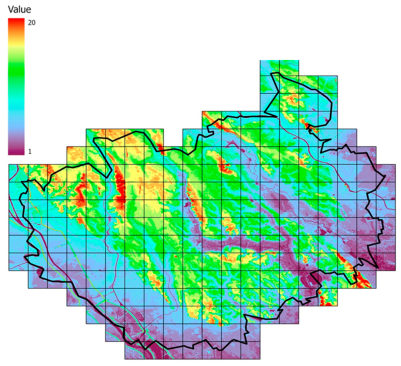
The spatial form model (Aa, Table 3) defines the city as having a physical structure consisting of lowlands and plateaus. These areas are mainly located at elevations below 20 m. Reclassifying the spatial form model (Ab, Table 3) reveals extensive areas suited for riparian flood plains, depicted in shades of blue to purple.

Table 3.
Spatial form (DEM) submodel; outputs and reclassification.
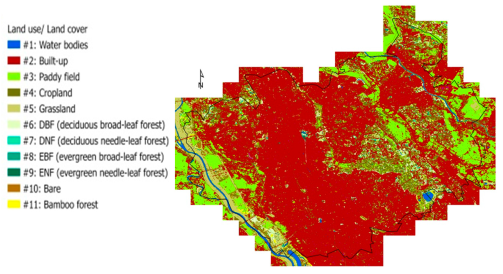
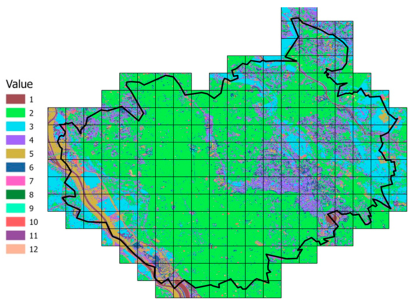
Examining the LU/LC model (Ba, Table 4) reveals a notable disparity between the topography and utilization of low-lying lands. Specifically, more than 80% of the land aligns with the classification of built-up land, as clearly shown in the reclassification (Bb, Table 4).

Table 4.
LU/LC submodel; outputs and reclassification.
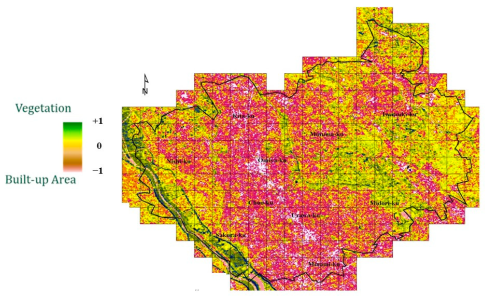
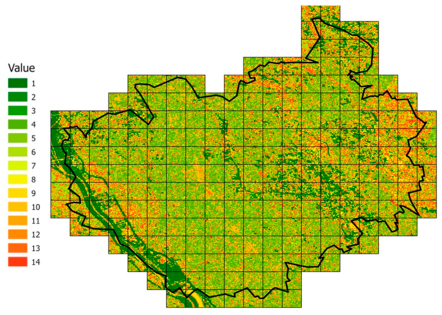
Upon the reclassification of the results derived from the computation of NDVI for the summer of 2021 (Ca, Table 5), microscale green elements in the urban center become clear (Cb, Table 5).

Table 5.
NDVI submodel; outputs and reclassification.
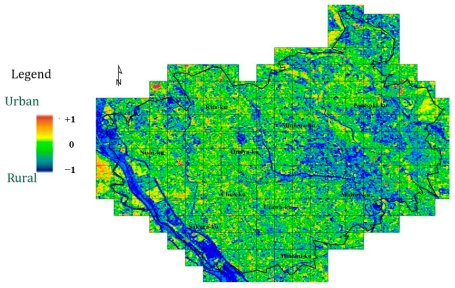
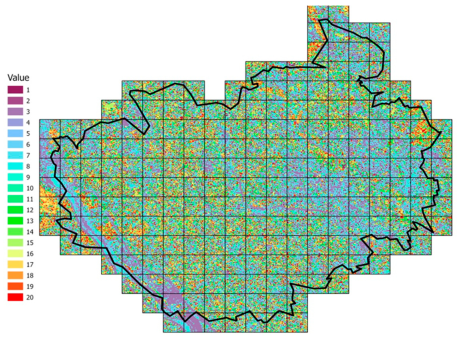
The obtained UDI values indicate a significantly contrasting narrative (Da, Table 6). In this expansive and progressive metropolis, an intricate interplay exists between urban and natural aspects (Db, Table 6).

Table 6.
UDI submodel; outputs and reclassification.
2.3.2. Procedure of Priority Zonation
We established the zoning framework by quantifying the number of pixels displaying GI priority characteristics (GIPC) within each designated cell, which led to the creation of the CADM. The delineation of these zones depends on the proportion of GIPC coverage within a specific cell. We organized the zoning in the following way: Zone 1 consists of cells with more than 70% coverage of GIPCs (global Internet protocol circuits); Zone 2 consists of cells that have GIPC coverage ranging from 70% to 50%; Zone 3 consists of cells with GIPC coverage ranging from 50% to 30%; Zone 4 consists of cells with GIPC coverage ranging from 30% to 20%; Zone 5 consists of cells with GIPC coverage ranging from 20% to 10%; and Zone 6 consists of cells with GIPC coverage below 10%. Studies in urban ecology often discover threshold effects, which occur when certain levels of green cover significantly influence ecological and social outcomes [5,17]. We came up with the GI prioritization thresholds in this study by looking at real-world studies that tested the effectiveness of different levels of GI elements [55,56,57]. By setting these specific thresholds, it was feasible to apply these findings in a practical and efficient manner within the GIS framework. This step was crucial for integrating our zoning approach seamlessly with standard urban development practices, making the thresholds both scientifically robust and practically viable.
2.4. Conceptual Diagram
We have incorporated a conceptual diagram (Figure 2) of the overall methodology to enhance the clarity and comprehension of our research design and the implemented procedures. This diagram ensures that the methodology is transparent and comprehensible by visually articulating the steps involved in our analysis. We aim for this study to be replicable by any individual who has required skills in GIS analysis and expertise in this particular field of research. If the individual in question has access to the same dataset and analytical tools as those we have described and strictly follows the outlined protocols, they should be able to replicate our analysis and achieve comparable results. This reproducibility capacity highlights the robustness of our research and ensures that other experts in the field can independently verify our findings.
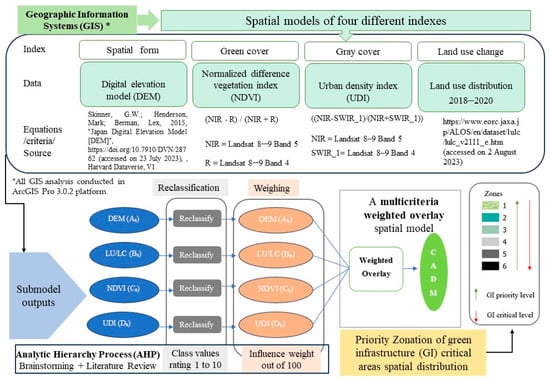
Figure 2.
Procedure of deriving the critical area detection model (CADM).
3. Results
The CADM developed (Figure 3) assigns pixel values on a scale of 1 to 10. A rating of 10 designates areas with potential GI priority zones, whereas a rating of 1 identifies GI critical zones requiring interventions in GI multifunctionality for sustainable change.
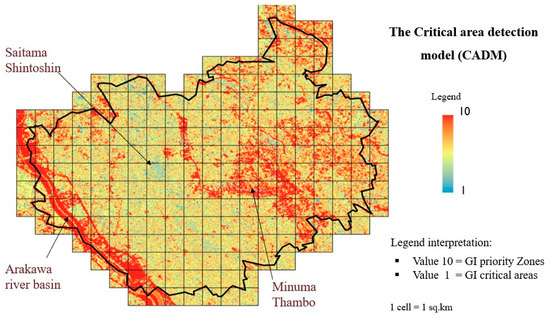
Figure 3.
The spatial distribution map of the critical area detection model (CADM) results.
We distinguish between the terms “GI priority zones” and “GI critical zones,” each representing different urban areas with specific needs and potential concerning GI. GI priority zones are defined as areas that already possess a higher level of available GI elements. These zones are characterized by established green spaces that contribute significantly to the urban ecosystem’s health and resilience. The management and protection of these areas are crucial, as they often serve as vital hubs for biodiversity, recreational activities, and environmental regulation within the urban landscape. The focus in these zones is on maintaining and enhancing the quality and functionality of the existing GI elements to ensure they continue to deliver their full range of ecosystem services. On the other hand, we identify GI critical zones as areas that may have a lower level of existing GI elements, indicating the need for significant interventions. The strategy for these areas involves intensive GI enhancement and implementation efforts aimed at establishing new GI elements. Additionally, networking GI is essential in these zones to create an interconnected system that effectively contributes to urban sustainability and resilience.
The model has demonstrated notable efficiency in identifying and discerning two outstanding GI priority zones (Figure 3), namely, the Arakawa River basin and the Minuma Tambo region (the Japanese word “Tambo” refers to a paddy field area). Critically, it is imperative to underscore that the collective spatial coverage of these two delineated zones constitutes a mere 27% of the overall land area. The GI critical areas contain a substantial 73% of the landmass, which is an important finding. This highlights the necessity for an increased focus on the comprehensive identification and assessment of GI-critical areas, given their high percentage in the total land area. The GI priority zonation procedure serves this particular purpose. Figure 4 displays the results of the GI priority zonation, ranked from most important (1) to least important (6) for each of the GIPC threshold percentages. This sorting clearly visualizes the potential distribution of GI networks in a granular formation.
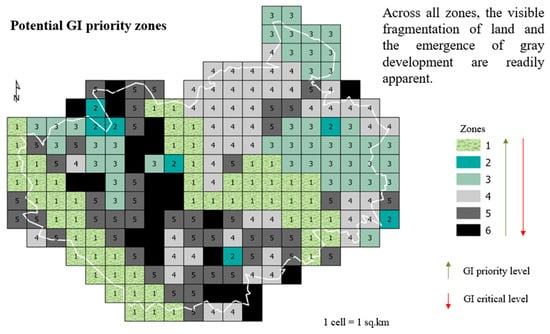
Figure 4.
Priority zonation of green infrastructure (GI) critical areas spatial distribution.
The CADM in Figure 3 and the GI spatial distribution priority zonation in Figure 4 show a pattern that puts urban development ahead of green spaces in this important urban landscape. The visual analysis suggests a notable imbalance, with built-up areas and infrastructure exerting a prevalent effect, potentially overshadowing the existing green spaces.
4. Discussion
4.1. GI Priority Zones and Prospects of Rational GI Placement
The identified zones show a gradient from green, symbolizing rural or natural areas, to gray, indicative of urban landscapes. This concept mirrors the spatial fabric found in specific regions. Figure 5 provides a visual representation with examples of urban cells in each of the zones, elucidating their distinctive spatial characteristics. Zone 1, which clearly represents the Arakawa River basin and Minuma Tambo regions, stands out as a unique representation. These regions exhibit spatial clusters characterized by relatively larger-scale GI elements, setting them apart from the more urbanized elements found in other zones. Of particular note is the fact that the three zones with the lowest level of GI priority (Zones 4–6) collectively cover 54% of the entire landscape. Notably, in these zones, there is an observable trend of land fragmentation and the advancement of gray development, indicating the highest GI critical level [11]. This trend underscores the urgent need for strategic interventions to counteract the potential adverse effects of urbanization on green spaces, ensuring a more balanced and sustainable green–gray continuum [58]. Land fragmentation is not only inherent in the GI critical zones; it is also emerging even in the GI priority zones, as demonstrated by carefully examining the urban cells.
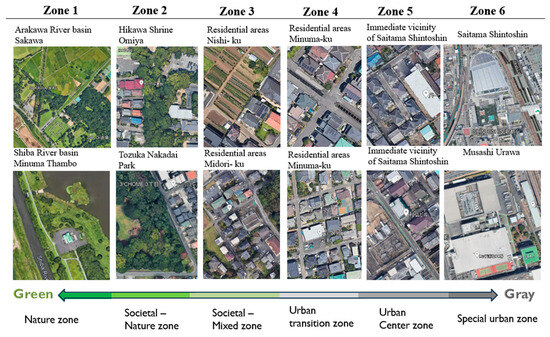
Figure 5.
Sample urban cells representing the delineated GI priority zones.
4.2. Facilitation towards Promoting GI Adoption in Saitama City
The results of the CADM and Saitama City’s current landscape city planning policy (Figure 6), particularly in the Arakawa River basin region, clearly demonstrate the importance of policy implementation in ensuring the smart and sustainable use of landscape resources. In comparison, the high-priority zones of the CADM significantly overlap with important areas such as the Arakawa River basin and Minuma Thambo. However, the Minuma Tambo region is noticeably shrinking and fragmented, whereas critical areas that require attention are expanding, signaling a concerning situation despite the provisions available in the regulations. Therefore, the findings critically indicate the invaluable presence of potential GI elements within Saitama City, which, however, are undergoing discernible fragmentation. Given this observation, the city should strategically plan for the re-establishment of lost spatial links [59,60]. This proactive approach aligns with a comprehensive plan to intricately network the GI within the urban landscape, contributing significantly to the enhancement of city development [3]. By prioritizing the restoration and integration of these fragmented elements, the city can optimize its GI availability, fostering environmental resilience, biodiversity, and overall sustainability [58]. Such a concerted effort not only addresses the immediate challenges of fragmentation but also positions Saitama City for a more holistic and harmonious urban development trajectory.
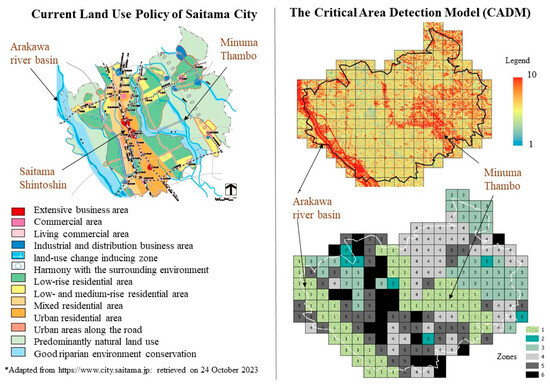
Figure 6.
Comparison of Saitama City’s current land use policy with the results.
By looking at the differences in space between urban cells, this study proves its main idea, showing that strategically placing GI has a big impact on how well it works. The observed spatial patterns support the idea that a thoughtful placement of GI elements is crucial for shaping the urban landscape. This confirmation highlights the need for targeted interventions in specific zones to optimize the benefits of GI and promote overall urban sustainability. The study’s findings highlight the importance of addressing spatial dynamics between urban development and GI, which necessitates strategic interventions to ensure harmonious coexistence in the urban fabric. The visual cues provided serve as a guide for policymakers and planners, emphasizing the importance of integrating green elements effectively to balance and enhance urban environments while mitigating potential adverse impacts of gray development.
The CADM offers a more detailed and evidence-based method, precisely identifying particular areas that demand immediate focus and efficient distribution of resources. Accordingly, the developed method ensures greater efficiency and effectiveness in regional urban planning and resource allocation by simultaneously evaluating the existing distribution of GI and identifying the areas that require immediate attention. Therefore, this study’s methodology provides a robust and dependable response to the research question, providing a useful tool with which urban planners and environmental managers can improve the placement and maintenance of GI in urban settings. This also contributes to the overarching objective of establishing urban environments that are more sustainable, resilient, and livable. By incorporating CADM into regional urban planning, the efficiency of GI network implementation can be reinforced by giving priority to crucial areas, where specific or targeted analysis can be further conducted based on zonal characteristics. Specific zone-based execution of detail-oriented models can be facilitated as the medium to micro level urban scales. This involves aspects such as the integration of a co-benefits assessment framework, focusing on ecosystem services, etc. [60], through both scientific and spatially operational approaches. This, in turn, will maximize the returns of GI-multifunctionality-based co-benefits on the critical and priority sequence. Therefore, the aim of the next phase of this research is to systematically integrate functional characteristics into the prioritization framework. This integration will address urban fabrics from medium to micro scales in the prioritized zones. By doing so, we aim to contribute to a more holistic and effective approach to GI planning in urban settings.
5. Conclusions
The method presented in this paper holds promise for establishing and monitoring a GI network within the macro scale cityscape, which can facilitate a robust and comprehensive approach to prioritizing GI implementation in an urban environment. This study highlights the importance of strategically incorporating GI into regional urban planning. The developed method is crucial as it helps to maximize resource allocation and ensure that GI is implemented in the areas where it is most needed. Through a macro-scale analysis, this approach allows for a thorough grasp of urban landscapes, making it easier to implement specific interventions at smaller spatial scales. This is essential for addressing the negative impacts of fast urbanization and strengthening urban resilience. However, it is important to note that there are potential limitations. These include the study’s dependence on the quality of available spatial data and the fact that future/proposed urban developments or environmental changes are not incorporated. Despite these potential limitations, the application of this method to Saitama City, Japan, showcases its practicality by pinpointing high-priority areas like the Arakawa River basin and Minuma Tambo region, while delineating critical areas which require immediate attention. This approach emphasizes the importance of having interconnected GI networks that can adjust to the ever-changing urban environment. By focusing on these important areas, urban planners and policy makers can create specific strategies that maximize the multifunctionality GI, supporting sustainable urban development.
Author Contributions
H.M.M.S.D.H.: Conceptualization, Methodology, Review, Analysis, Data curation, Visualization, Writing—original draft; T.F.: Conceptualization, Methodology, Analysis, Resources, Supervision, Writing—review and editing; M.D.H.J.S.: Conceptualization, Methodology, Supervision. All authors have read and agreed to the published version of the manuscript.
Funding
This study was partially supported by a 2023 research grant from the Strategic Research Area for Sustainable Development in East Asia (SRASDEA), Saitama University.
Institutional Review Board Statement
Not applicable.
Informed Consent Statement
Not applicable.
Data Availability Statement
The original contributions presented in the study are included in the article, further inquiries can be directed to the corresponding author.
Acknowledgments
We received various advice related to green infrastructure policy from the Minuma Farm Policy Promotion Division.
Conflicts of Interest
The authors declare no conflicts of interest. The funders had no role in the design of the study; in the collection, analyses, or interpretation of data; in the writing of the manuscript; or in the decision to publish the results.
References
- Lee, D.K.; Song, Y. Special issue: Urban green infrastructure and the ecological functions. Landsc. Ecol. Eng. 2019, 15, 241–243. [Google Scholar] [CrossRef]
- Azouz, M.; Salem, D. Urban resilience and stormwater management: Lessons learnt from New Cairo, Egypt. Ain Shams Eng. J. 2023, 14, 102117. [Google Scholar] [CrossRef]
- Zhang, X.; Wang, X.; Zhang, C.; Zhai, J. Development of a cross-scale landscape infrastructure network guided by the new Jiangnan watertown urbanism: A case study of the ecological green integration demonstration zone in the Yangtze River Delta, China. Ecol. Indic. 2022, 143, 109317. [Google Scholar] [CrossRef]
- Lourdes, K.T.; Hamel, P.; Gibbins, C.N.; Sanusi, R.; Azhar, B.; Lechner, A.M. Planning for green infrastructure using multiple urban ecosystem service models and multicriteria analysis. Landsc. Urban Plan. 2022, 226, 104500. [Google Scholar] [CrossRef]
- Guan, J.; Wang, R.; Van Berkel, D.; Liang, Z. How spatial patterns affect urban green space equity at different equity levels: A Bayesian quantile regression approach. Landsc. Urban Plan. 2023, 233, 104709. [Google Scholar] [CrossRef]
- Ruan, T.; Xu, Y.; Jones, L.; Boeing, W.J.; Calfapietra, C. Green infrastructure sustains the food-energy-water-habitat nexus. Sustain Cities Soc. 2023, 98, 104845. [Google Scholar] [CrossRef]
- Lampinen, J.; García-Antúnez, O.; Lechner, A.M.; Stahl Olafsson, A.; Gulsrud, N.M.; Raymond, C.M. Mapping public support for urban green infrastructure policies across the biodiversity-climate-society-nexus. Landsc. Urban Plan. 2023, 239, 104856. [Google Scholar] [CrossRef]
- Herath, H.M.M.S.D.; Fujino, T.; Senavirathna, M.D.H.J. A Review of Emerging Scientific Discussions on Green Infrastructure (GI)-Prospects towards Effective Use of Urban Flood Plains. Sustainability 2023, 15, 1227. [Google Scholar] [CrossRef]
- Grabowski, Z.J.; McPhearson, T.; Pickett, S.T.A. Transforming US urban green infrastructure planning to address equity. Landsc. Urban Plan. 2023, 229, 104591. [Google Scholar] [CrossRef]
- Štrbac, S.; Kašanin-Grubin, M.; Pezo, L.; Stojić, N.; Lončar, B.; Ćurčić, L.; Pucarević, M. Green Infrastructure Designed through Nature-Based Solutions for Sustainable Urban Development. Int. J. Environ. Res. Public Health 2023, 20, 1102. [Google Scholar] [CrossRef]
- Bajić, L.; Vasiljević, N.; Čavlović, D.; Radić, B.; Gavrilović, S. A Green Infrastructure Planning Approach: Improving Territorial Cohesion through Urban-Rural Landscape in Vojvodina, Serbia. Land 2022, 11, 1550. [Google Scholar] [CrossRef]
- Starczewski, T.; Rogatka, K.; Kukulska-Kozieł, A.; Noszczyk, T.; Cegielska, K. Urban green resilience: Experience from post-industrial cities in Poland. Geosci. Front. 2023, 14, 101560. [Google Scholar] [CrossRef]
- Parton, L.C. Measuring the effects of public land use change: An analysis of greenways in Raleigh, North Carolina. Land Use Policy 2023, 131, 106689. [Google Scholar] [CrossRef]
- Conley, G.; McDonald, R.I.; Nodine, T.; Chapman, T.; Holland, C.; Hawkins, C.; Beck, N. Assessing the influence of urban greenness and green stormwater infrastructure on hydrology from satellite remote sensing. Sci. Total Environ. 2022, 817, 152723. [Google Scholar] [CrossRef] [PubMed]
- Yang, B.; Lee, D. Urban green space arrangement for an optimal landscape planning strategy for runoff reduction. Land 2021, 10, 897. [Google Scholar] [CrossRef]
- Xiu, N.; Ignatieva, M.; van den Bosch, C.K.; Zhang, S. Applying a socio-ecological green network framework to Xi’an City, China. Landsc. Ecol. Eng. 2020, 16, 135–150. [Google Scholar] [CrossRef]
- Goodspeed, R.; Liu, R.; Gounaridis, D.; Lizundia, C.; Newell, J. A regional spatial planning model for multifunctional green infrastructure. Environ. Plan. B Urban Anal. City Sci. 2022, 49, 815–833. [Google Scholar] [CrossRef]
- Tansar, H.; Duan, H.-F.; Mark, O. A multi-objective decision-making framework for implementing green-grey infrastructures to enhance urban drainage system resilience. J. Hydrol. 2023, 620, 129381. [Google Scholar] [CrossRef]
- Marsoner, T.; Vigl, L.E.; Vigl, E. Tools for Developing Green Infrastructure Networks; Eurac Research: Bozen, Italy, 2020; pp. 1–50. [Google Scholar]
- Long, X.; Lin, H.; An, X.; Chen, S.; Qi, S.; Zhang, M. Evaluation and analysis of ecosystem service value based on land use/cover change in Dongting Lake wetland. Ecol. Indic. 2022, 136, 108619. [Google Scholar] [CrossRef]
- Naboureh, A.; Bian, J.; Lei, G.; Li, A. A review of land use/land cover change mapping in the China-Central Asia-West Asia economic corridor countries. Big Earth Data 2021, 5, 237–257. [Google Scholar] [CrossRef]
- Ma, X.; Zhu, J.; Zhang, H.; Yan, W.; Zhao, C. Trade-offs and synergies in ecosystem service values of inland lake wetlands in Central Asia under land use/cover change: A case study on Ebinur Lake, China. Glob. Ecol. Conserv. 2020, 24, e01253. [Google Scholar] [CrossRef]
- Inkoom, J.N.; Frank, S.; Fürst, C. Challenges and opportunities of ecosystem service integration into land use planning in West Africa—An implementation framework. Int. J. Biodivers. Sci. Ecosyst. Serv. Manag. 2017, 13, 67–81. [Google Scholar] [CrossRef]
- Chen, L.; Ma, Y. Current and future characteristics of land use based on intensity analysis and PLUS model: A case study of Foshan city, China. SN Appl. Sci. 2023, 5, 83. [Google Scholar] [CrossRef]
- Natuhara, Y. Green infrastructure: Innovative use of indigenous ecosystems and knowledge. Landsc. Ecol. Eng. 2018, 14, 187–192. [Google Scholar] [CrossRef]
- Wagner, M.; Wentz, E.A.; Stuhlmacher, M. Quantifying oil palm expansion in Southeast Asia from 2000 to 2015: A data fusion approach. J. Land Use Sci. 2022, 17, 26–46. [Google Scholar] [CrossRef]
- Yujie, R.; Tang, X.; Fan, T.; Kang, D. Does the spatial pattern of urban blue–green space at city-level affects its cooling efficiency? Evidence from Yangtze River Economic Belt, China. Landsc. Ecol. Eng. 2023, 19, 363–379. [Google Scholar] [CrossRef]
- Caparrós Martínez, J.L.; Milán García, J.; Rueda López, N.; de Pablo Valenciano, J. Mapping green infrastructure and socioeconomic indicators as a public management tool: The case of the municipalities of Andalusia (Spain). Environ. Sci. Eur. 2020, 32, 144. [Google Scholar] [CrossRef]
- Chen, X.; Xu, L.; Zhu, R.; Ma, Q.; Shi, Y.; Lu, Z. Changes and Characteristics of Green Infrastructure Network Based on Spatio-Temporal Priority. Land 2022, 11, 901. [Google Scholar] [CrossRef]
- Pan, H.; Page, J.; Shi, R.; Cong, C.; Cai, Z.; Barthel, S.; Thollander, P.; Colding, J.; Kalantari, Z. Contribution of prioritized urban nature-based solutions allocation to carbon neutrality. Nat. Clim. Chang. 2023, 13, 862–870. [Google Scholar] [CrossRef]
- Kang, S.; Kim, J.O. Morphological analysis of green infrastructure in the Seoul metropolitan area, South Korea. Landsc. Ecol. Eng. 2015, 11, 259–268. [Google Scholar] [CrossRef]
- Huang, Y.; Lin, T.; Zhang, G.; Zhu, Y.; Zeng, Z.; Ye, H. Spatial patterns of urban green space and its actual utilization status in China based on big data analysis. Big Earth Data 2021, 5, 391–409. [Google Scholar] [CrossRef]
- Kuller, M.; Bach, P.M.; Roberts, S.; Browne, D.; Deletic, A. A planning-support tool for spatial suitability assessment of green urban stormwater infrastructure. Science of the Total Environment 2019, 686, 856–868. [Google Scholar] [CrossRef] [PubMed]
- Neupane, D.; Kwon, Y.; Risch, T.S.; Johnson, R.L. Changes in habitat suitability over a two decade period before and after Asian elephant recolonization. Glob. Ecol. Conserv. 2020, 22, e01023. [Google Scholar] [CrossRef]
- Llobera, M. Extending GIS-based visual analysis: The concept of visualscapes. Int. J. Geogr. Inf. Sci. 2003, 17, 25–48. [Google Scholar] [CrossRef]
- Zhao, J.; Chen, H.; Liang, Q.; Xia, X.; Xu, J.; Hoey, T.; Barrett, B.; Renaud, F.G.; Bosher, L.; Zhou, X. Large-scale flood risk assessment under different development strategies: The Luanhe River Basin in China. Sustain. Sci. 2021, 17, 1365–1384. [Google Scholar] [CrossRef]
- Alves, A.; Gersonius, B.; Sanchez, A.; Vojinovic, Z.; Kapelan, Z. Multi-criteria Approach for Selection of Green and Grey Infrastructure to Reduce Flood Risk and Increase CO-benefits. Water Resour. Manag. 2018, 32, 2505–2522. [Google Scholar] [CrossRef]
- Kopeva, A.; Ivanova, O.; Khrapko, O. Green infrastructure in high-rise residential development on steep slopes in city of Vladivostok. E3S Web Conf. 2018, 33, 01004. [Google Scholar] [CrossRef]
- Wang, F.; Chen, J.; Tong, S.; Zheng, X.; Ji, X. Construction and Optimization of Green Infrastructure Network Based on Space Syntax: A Case Study of Suining County, Jiangsu Province. Sustainability 2022, 14, 7732. [Google Scholar] [CrossRef]
- Wang, R.; Derdouri, A.; Murayama, Y. Spatiotemporal simulation of future land use/cover change scenarios in the Tokyo metropolitan area. Sustainability 2018, 10, 2056. [Google Scholar] [CrossRef]
- Ma, J.; Weng, B.; Bi, W.; Yan, D.; Li, M.; Xu, T.; Wang, L.; Wang, L. The Characteristics of Climate Change and Adaptability Assessment of Migratory Bird Habitats in Wolonghu Wetlands. Wetlands 2019, 39, 415–427. [Google Scholar] [CrossRef]
- Kabisch, N.; Korn, H.; Stadler, J.; Bonn, A. Theory and Practice of Urban Sustainability Transitions Natureebased Solutions to Climate Change Adaptation in Urban Areas; Springer Nature: Cham, Switzerland, 2017. [Google Scholar]
- Deely, J.; Hynes, S.; Barquín, J.; Burgess, D.; Finney, G.; Silió, A.; Álvarez-Martínez, J.M.; Bailly, D.; Ballé-Béganton, J. Barrier identification framework for the implementation of blue and green infrastructures. Land Use Policy 2020, 99, 105108. [Google Scholar] [CrossRef]
- Phillips, A.; da Schio, N.; Canters, F.; Khan, A.Z. “A living street and not just green”: Exploring public preferences and concerns regarding nature-based solution implementation in urban streetscapes. Urban For. Urban Green. 2023, 86, 128034. [Google Scholar] [CrossRef]
- Hassan, I.; Javed, M.A.; Asif, M.; Luqman, M.; Ahmad, S.R.; Ahmad, A.; Akhtar, S.; Hussain, B. Weighted overlay based land suitability analysis of agriculture land in Azad Jammu and Kashmir using GIS and AHP. Pak. J. Agric. Sci. 2020, 57, 1509–1519. [Google Scholar]
- Dano, U.L.; Abubakar, I.R.; AlShihri, F.S.; Ahmed, S.M.S.; Alrawaf, T.I.; Alshammari, M.S. A multi-criteria assessment of climate change impacts on urban sustainability in Dammam Metropolitan Area, Saudi Arabia. Ain Shams Eng. J. 2023, 14, 102062. [Google Scholar] [CrossRef]
- Brom, P.; Engemann, K.; Breed, C.; Pasgaard, M.; Onaolapo, T.; Svenning, J.C. A Decision Support Tool for Green Infrastructure Planning in the Face of Rapid Urbanization. Land 2023, 12, 415. [Google Scholar] [CrossRef]
- De Vito, L.; Staddon, C.; Zuniga-Teran, A.A.; Gerlak, A.K.; Schoeman, Y.; Hart, A.; Booth, G. Aligning green infrastructure to sustainable development: A geographical contribution to an ongoing debate. Area 2022, 54, 242–251. [Google Scholar] [CrossRef]
- Alfieri, J.G.; Niyogi, D.; LeMone, M.A.; Chen, F.; Fall, S. A simple reclassification method for correcting uncertainty in land use/land cover data sets used with land surface models. In Atmospheric and Oceanic: Mesoscale Processes; Birkhäuser: Basel, Switzerland, 2007. [Google Scholar]
- Okolie, C.J.; Smit, J.L. A systematic review and meta-analysis of Digital elevation model (DEM) fusion: Pre-processing, methods and applications. ISPRS J. Photogramm. Remote Sens. 2022, 188, 1–29. [Google Scholar] [CrossRef]
- Konadu, D.D.; Fosu, C.; Yanful, E.K. Digital Elevation Models and GIS for Watershed Modelling and Flood Prediction-A Case Study of Accra Ghana. In Appropriate Technologies for Environmental Protection in the Developing World: Selected Papers from ERTEP 2007, July 17–19 2007, Ghana, Africa; Springer: Dordrecht, The Netherland, 2009; pp. 325–332. [Google Scholar]
- Lebrasseur, R. Mapping Green Infrastructure Based on Multifunctional Ecosystem Services: A Sustainable Planning Framework for Utah’s Wasatch Front. Sustainability 2022, 14, 825. [Google Scholar] [CrossRef]
- Gelata, F.T.; Jiqin, H.; Gemeda, S.C.; Asefa, B.W. Application of GIS using NDVI and LST estimation to measure climate variability-induced drought risk assessment in Ethiopia. J. Water Clim. Change 2023, 14, 2479–2489. [Google Scholar] [CrossRef]
- Esri. “Landsat Explorer”. ArcGIS Living Atlas. Available online: https://livingatlas2.arcgis.com/landsatexplorer/ (accessed on 6 June 2023).
- Aryal, J.; Sitaula, C.; Aryal, S. NDVI Threshold-Based Urban Green Space Mapping from Sentinel-2A at the Local Governmental Area (LGA) Level of Victoria, Australia. Land 2022, 11, 351. [Google Scholar] [CrossRef]
- Amiot, C.; Santos, C.C.; Arvor, D.; Bellón, B.; Fritz, H.; Harmange, C.; Holland, J.D.; Melo, I.; Metzger, J.P.; Renaud, P.C.; et al. The scale of effect depends on operational definition of forest cover—Evidence from terrestrial mammals of the Brazilian savanna. Landsc. Ecol. 2021, 36, 973–987. [Google Scholar] [CrossRef]
- Lwin, K.K.; Ota, T.; Shimizu, K.; Mizoue, N. Assessing the Importance of Tree Cover Threshold for Forest Cover Mapping Derived from Global Forest Cover in Myanmar. Forests 2019, 10, 1062. [Google Scholar] [CrossRef]
- Navarrete-Hernandez, P.; Laffan, K. The impact of small-scale green infrastructure on the affective wellbeing associated with urban sites. Sci Rep. 2023, 13, 9687. [Google Scholar] [CrossRef] [PubMed]
- Hettiarachchi, M.; Morrison, T.H.; McAlpine, C. Power, politics and policy in the appropriation of urban wetlands: The critical case of Sri Lanka. J. Peasant. Stud. 2019, 46, 729–746. [Google Scholar] [CrossRef]
- Kvamsås, H. Co-benefits and conflicts in alternative stormwater planning: Blue versus green infrastructure? Environ. Policy Gov. 2023, 33, 232–244. [Google Scholar] [CrossRef]
Disclaimer/Publisher’s Note: The statements, opinions and data contained in all publications are solely those of the individual author(s) and contributor(s) and not of MDPI and/or the editor(s). MDPI and/or the editor(s) disclaim responsibility for any injury to people or property resulting from any ideas, methods, instructions or products referred to in the content. |
© 2024 by the authors. Licensee MDPI, Basel, Switzerland. This article is an open access article distributed under the terms and conditions of the Creative Commons Attribution (CC BY) license (https://creativecommons.org/licenses/by/4.0/).
