Article

Modelling the Impact of Temperature under Climate Change Scenarios on Native and Invasive Vascular Vegetation on the Antarctic Peninsula and Surrounding Islands

1
Yeates School of Graduate Studies, Toronto Metropolitan University, Toronto, ON M5B 2K3, Canada
2
Department of Geography and Environmental Studies, Toronto Metropolitan University, Toronto, ON M5B 2K3, Canada
*
Author to whom correspondence should be addressed.
Geomatics 2022, 2(4), 390-414; https://doi.org/10.3390/geomatics2040022
Submission received: 19 August 2022 / Revised: 15 September 2022 / Accepted: 20 September 2022 / Published: 23 September 2022

Abstract

:
There are only two species of native vascular plants found on the Antarctic Peninsula and the surrounding islands, Deschampsia Antarctica, and Colobanthus quitensis. Poa annua, a successful invasive species, poses a threat to D. antarctica and C. quitensis. This region may experience extreme changes in biodiversity due to climate change over the next 100 years. This study explores the relationship between vascular vegetation and changing temperature on the Antarctic Peninsula and uses a systems modelling approach to account for three climate change scenarios over a 100-year period. The results of this study indicate that (1) D. antarctica, C. quitensis, and P. annua will likely be impacted by temperature increases, and greater temperature increases will facilitate more rapid species expansion, (2) in all scenarios D. antarctica species occurrences increase to higher values compared to C. quitensis and P. annua, suggesting that D. antarctica populations may be more successful at expanding into newly forming ice-free areas, (3) C. quitensis may be more vulnerable to the spread of P. annua than D. antarctica if less extreme warming occurs, and (4) C. quitensis relative growth rate is capable of reaching higher values than D. antarctica and P. annua, but only under extreme warming conditions.

1. Introduction

Climate change is projected to impact biodiversity across the globe, and the Antarctic Peninsula is an area that will experience potentially extreme changes in biodiversity due to climate change. As the global temperature is rising, the Antarctic Peninsula is experiencing ice melting which will create large ice-free areas for vegetation to expand. However, how vegetation will expand into these newly forming ice-free areas is largely unknown, and one of the questions being asked is; will native or invasive species be more successful in populating these ice-free areas [1]?
Although ice loss caused by climate change is expected to occur more prominently with marine ice than terrestrial ice, terrestrial ice loss and the thinning and recession of glaciers is still expected to accelerate over the next 100 years [2,3,4]. The Intergovernmental Panel on Climate Change’s (IPCC) 2013 report projects that global surface temperature will increase by 1.6 °C to 5.0 °C by the end of the 21st century, with an average increase of 2.6 °C [5]. Additionally, the United States National Oceanic and Atmospheric Administration 2012 report shows that the global average temperature could rise by 1.1 °C to 5.4 °C by 2100 [6]. Native terrestrial vegetation found on the Antarctic Peninsula has already responded to warming climactic conditions by rapidly expanding their populations and it is projected that both native and non-native vegetation will colonize newly forming ice-free areas as warming occurs throughout the next century [7].
There are only two species of native vascular plants that occur on the Antarctic Peninsula and the surrounding islands, Deschampsia Antarctica and Colobanthus quitensis [8]. D. antarctica is commonly known as Antarctic hairgrass and it is a light green grass that forms meadows. C. quitensis is commonly known as Antarctic pearlwort, it is also light green, and is a mat-forming plant that grows low to the ground. Both D. antarctica and C. quitensis are flowering plants and they are the only flowering plants native to the continent of Antarctica [9]. The invasive vascular plant species that has become the most widespread on the Antarctic Peninsula and the surrounding islands is Poa annua. P. annua is commonly known as annual bluegrass, it is a small, annual, flowering grass, and it is considered one of the world’s most aggressive weeds [10]. P. annua is presently competing with D. antarctica and C. quitensis to continue establishing communities as the continent warms and the extent of ice-free areas increases. The continued spread of P. annua throughout the Antarctic Peninsula may result in decreased expansion of D. antarctica and C. quitensis [11].
D. antarctica and C. quitensis have been shown to expand at different rates based on several geophysical factors. A 2011 study showed that habitat has a greater impact on the abundance of these vascular plants than altitude; the abundance of D. antarctica is greater in flat areas; in established populations, there is a greater abundance of D. antarctica than C. quitensis; and the abundance of C. quitensis is equal to or greater than D. antarctica in recently colonized areas [12].
There are several studies that have examined the impacts of climate change on native vegetation on the Antarctic Peninsula, including how increased precipitation will impact vegetation distribution [13]; how the combination of increasing temperature and soil nutrient availability will impact vegetation distribution [14]; and how native and invasive vascular plants may actually have positive interactions and help facilitate each other’s growth and spread into new territory [15]. This study seeks to build off of previous work and add a contribution by combining systems modelling and geographic information system (GIS) approaches with georeferenced vegetation occurrence data and surface temperature data to measure how vegetation occurrence increase rates may change under different temperature increase scenarios.
There are several types of models that have been used to better understand the potential impacts of climate change on vegetation, including gap models (for understanding species change and interaction), biochemical models (for understanding nutrient cycles), dynamic vegetation models (for understanding changes in vegetation properties), and statistical species distribution models (SDM’s) (for understanding the range of climactic or environmental conditions where specific species can occur) [16,17,18,19]. Species distribution modelling, also called environmental or bioclimatic niche modelling requires the use of GIScience (geographic information science) and is often used for spatial prediction [20]. Distribution modeling determines a correlation between species occurrence data and the environmental conditions found at the site of each point of occurrence data [21]. However, the result of species distribution models shows the diversity and distribution of the species being measured through the occurrence data, not how the existing species will respond to changing environmental conditions [20].
Vensim is a simulation software that can be used for several different types of model creation [22]. It is widely used to model system dynamics and the relationship between the different components of the system [23]. Vensim was initially designed for economic modelling [24,25], however, it is now being used in climate change studies to model the impact of climate change on groundwater aquifer assessment [26], water resource management [27], and changes in the Lake Victoria basin ecosystem [28]. Although Vensim is not a spatial modelling software it can be used to make predictive models of separate regions and incorporate temporal data [29].
This study has developed a method that uses some aspects of species distribution modelling (determining the correlational relationship between vegetation occurrence data and environmental conditions—surface temperature in a GIS) and uses Vensim to model the components of the system (species of vegetation and changes in temperature during the growing season). Vensim is also used to alter the temperature data to account for three climate change scenarios: highest projected increase in global surface temperature (5.0 °C), lowest projected increase in global surface temperature (1.6 °C), and no change in global surface temperature (0.0 °C). The purpose of this study is to show the relationship between vascular vegetation species occurrences in the Antarctic Peninsula and changing surface temperature. This study uses GIS and predictive modelling to show how the native species D. antarctica and C. quitensis and the invasive species P. annua may respond to increasing surface temperatures.
The Antarctic is one of the last remaining wilderness areas and is protected under several protection treaties and heritage statuses. The threat of invasive species and environmental changes associated with climate change are considered the most prominent challenges with maintaining conservation of this area [14]. This study aims to provide a contribution by developing a novel model that will measure the impacts of temperature increase under climate change scenarios on native and invasive vascular vegetation species. With advancement in georeferenced vegetation data this model can also be adapted for future studies to explore native and invasive vegetation species responds to climate change scenarios.

2. Materials and Methods

A methodological workflow diagram (Figure 1) is included to below to outline the processes described in the materials and methods section and to highlight where different types of software were used in the analysis.
Data were collected from four sources; the Global Biodiversity Information Facility; a study conducted by Molina-Montenegro and others (2012) entitled Occurrence of the Non-Native Annual Bluegrass on the Antarctic Mainland and Its Negative Effects on Native Plants; a study conducted by Chewedorzewska and others (2015) entitled Poa annua L. in the maritime Antarctic: an overview; and NASA Earth Observations. The data table below (Table 1) outlines the characteristics of the data used in this study.
The Global Biodiversity Information Facility is a database that complies georeferenced vegetation occurrence data. The dataset collected for this study contained vascular vegetation occurrence data for D. antarctica, C. quitensis and P. annua and included the scientific name of the vegetation, the date the vegetation occurrence was recorded, the longitude and latitude coordinates of the vegetation occurrences, and the kingdom, phylum, class, order, family, genus, and species of each vegetation occurrence [30]. The studies conducted by Molina-Montenegro and others (2012), Chewedorzewska and others (2015) included the longitude and latitude coordinates for additional observations of P. annua [11,31].
Table 1. Description of Data Characteristics.
Data TypeDateResolutionSourceAdditional Information
Article2007–2008
2008–2009
Chwedorzewska et al., 2014 [31]The vegetation was recorded with spatial coordinates and included in the article. The coordinates were used to convert the vegetation record into a point shapefile.
Article2007–2008
2009–2010
Molina-Montenegro et al., 2012 [11]The vegetation was recorded with spatial coordinates and included in the article. The coordinates were used to convert the vegetation record into a point shapefile.
Human observation records2000–2022 Global Biodiversity Information Facility [30]Human Observation vegetation records were compiled by the Global Biodiversity Information Facility from various datasets. The coordinates included in the dataset were used to convert the vegetation record into a point shapefile.
GeoTIFF2000–20221 km × 1 kmNASA Earth Observations [32]The GeoTIFF shows the daytime temperature of the land.
GeoTIFF2000–20221 km × 1 kmNASA Earth Observations [32]The GeoTIFF shows the nighttime temperature of the land.
GeoTIFF2000–20221 km × 1 kmNASA Earth Observations [32]The GeoTIFF shows if the daytime surface temperature on the top 1 mm of land is warmer or colder than the average land surface temperature between 2000 and 2010.
GeoTIFF2000–20221 km × 1 kmNASA Earth Observations [32]The GeoTIFF shows if the nighttime surface temperature on the top 1 mm of land is warmer or colder than the average land surface temperature between 2000 and 2010.
NASA Earth Observations is a website that contains global atmosphere, energy, land, life, and ocean data that can be downloaded as GeoTIFF raster images. The dataset collected for this study included Land Surface Temperature [Day]; Land Surface Temperature [Night]; Land Surface Temperature Anomaly [Day] and Land Surface Anomaly [Night]. The Land Surface Temperature [Day and Night] contains raster images which show the temperature on the top 1 mm of land. Land Surface Temperature Anomaly [Day and Night] show land surface temperature anomalies (i.e., if the surface temperature on the top 1 mm of land is warmer or colder than the average land surface temperature between 2000 and 2010). This dataset contains raster images for both Land Surface Temperature [Day and Night] and Land Surface Temperature Anomaly [Day and Night] as monthly images between the years 2000 and 2022 with 1 km × 1 km pixel resolution [32].
The dataset from the Global Biodiversity Information Facility was cleaned so that only occurrences of D. antarctica, C. quitensis, and P. annua that were recorded between the years 2000 and 2022 were included. Additionally, the georeferenced P. annua data from Molina-Montenegro and others (2012) and Chwedorzewska and others (2015) were added. This allowed for a spreadsheet with; the date the vegetation occurrence was recorded; the longitude and latitude coordinates of the vegetation occurrences; and the kingdom, phylum, class, order, family, genus, and species of each vegetation occurrence.
The spreadsheet was added as a delimited text layer to QGIS (an open-source geographic information system application) and saved as a vector point shapefile layer. Locations of the vegetation occurrences for D. antarctica, C. quitensis, and P. annua are shown in Figure 2 In order to connect the vegetation occurrence data to the land surface temperature data, the raster layers for Land Surface Temperature [Day], Land Surface Temperature [Night], Land Surface Temperature Anomaly [Day], and Land Surface Anomaly [Night] were also added as layers to QGIS. In order to account for the time difference associated with each vegetation occurrence, separate monthly raster layers were added. Each raster layer showed the Land Surface Temperature [Day], Land Surface Temperature [Night], Land Surface Temperature Anomaly [Day], and Land Surface Anomaly [Night] data as it temporally corresponded with the vegetation occurrence data (i.e., for a vegetation occurrence that was recorded in January 2004 the raster layers showing data from January 2004 were added).
To add the raster pixel values associated with each piece of vegetation occurrence data to the attribute table of the vector shapefile, the Geo Algorithm ‘add raster values to point’ was used. This algorithm adds the land surface pixel value that is spatially correlated with each vegetation occurrence point to the attribute table of the vector shapefile. Once this step was complete the attribute table contained four additional columns with Land Surface Temperature [Day], Land Surface Temperature [Night], Land Surface Temperature Anomaly [Day], and Land Surface Anomaly [Night] data as it corresponded spatially and temporally to each vegetation occurrence. The vector point attribute table was exported from QGIS as a spreadsheet.
To convert the raster pixel values to temperature values (in degree Celsius) the following formulas were used:
S u r f a c e   T e m p e r a t u r e = x 3.64 + 25
where x is the surface temperature raster cell value, 3.64 is the surface temperature pixel value range representing change in 1 °C, and −25 is the lowest temperature value (in °C) and lowest pixel value (0).
T e m p e r a t u r e   A n o m a l y = y 127 10.625
where y is the temperature anomaly raster cell value, 10.625 is the temperature anomaly raster cell value range representing change in 1 °C, and 127 is the raster cell value representing no change in temperature anomaly. To determine the day and night surface temperature and surface temperature anomaly values that would be input into the model for each species, the day and night surface temperature, and day and night surface anomaly temperature averages were calculated for each species. All GIS analysis and map creation was completed in QGIS [33].
Vensim was used to create a model that would show how increasing the temperature by 1.6 °C and 5.0 °C would impact; the day and night surface anomaly temperatures and the average day and night temperatures that corresponded with each species of vegetation; and how these increasing temperature values would impact the rate of vegetation expansion [23]. The slopes for increasing temperatures of 1.6 °C and 5.0 °C over a 100-year period (between the years 2022 and 2122) were used to define the slope for the ramp equations used in the Vensim parameters ‘D. antarctica Temperature Increase Rate’, ‘C. quitensis Temperature Increase Rate’ and ‘P. annua Temperature Increase Rate’.
The Vensim model was run under three different scenarios; (1) ‘D. antarctica Temperature Increase Rate’, ‘C. quitensis Temperature Increase Rate’, and ‘P. annua Temperature Increase Rate’ parameters were set to reflect a 1.6 °C temperature increase between the years 2022–2122; (2) ‘D. antarctica Temperature Increase Rate’, ‘C. quitensis Temperature Increase Rate’, and ‘P. annua Temperature Increase Rate’ parameters were set to reflect a 5.0 °C temperature increase between the years 2022–2122; and ‘D. antarctica Temperature Increase Rate’, ‘C. quitensis Temperature Increase Rate’, and ‘P. annua Temperature Increase Rate’ parameters were removed to reflect no temperature increase between the years 2022–2122.
The state variable equation for each species, which describe the relative growth rate of the species, was adapted from a polynome developed by van der Heide et al. (2006) [34]. The polynome developed by van der Heide et al. (2006) states that:
R T = c T T T m i n T m a x T
where R is the relative growth rate, T is the ruling temperature (in degree Celsius), c is an empirical scaling constant, Tmin is the minimum temperature threshold, and Tmax is the maximum temperature threshold. In this study the polynome was adapted to:
R T = c T T T m i n T m a x T
where R(T) is the relative growth rate of each species, c is the empirical scaling constant, T is the ruling temperature (in degree Celsius) for each species, Tmin is the minimum temperature value (in degree Celsius) recorded for each species, and Tmax is the maximum temperature that each species is capable of germination. The empirical scaling constant was set to 1 × 10⁻⁵, and this value was selected to mimic the empirical scaling constants used by der Heide et al. (2006) who’s empirical scaling constants ranged from 6.24 × 10⁻⁵ to 2.56 × 10⁻⁵. A smaller scaling value was selected for this study because, due to the low temperatures and limited ice-free space, the Antarctic vegetation populations would likely not be capable of expanding at a rate faster than or equal to the aquatic vegetation analysed in the der Heide et al. (2006) study. Additionally, the value of 1 × 10⁻⁵ was selected because the dataset included in this study is not large enough to extrapolate total vegetation population increase. Rather, the goal of this study is to explore the interactions of the theoretical relative growth rates of the different species based on identified and preferred temperature ranges. The ruling temperature is defined in the Descriptive Model Equations D. antarctica, C. quitensis, and P. annua Temperature for each species. The maximum germination temperatures for each species were collected from studies by Kellmann-sopya and Giewanowska (2015) and Carroll and others (2021) [35,36]. The polynome developed by van der Heide et al. (2006) assumed that Tmin would be ≥0, however, due to the cold temperatures found on the Antarctic peninsula, several temperature values were <0. To address this, the land surface, recorded minimum temperatures and maximum germination temperature values used in in this model were all shifted up by 25-degree Celsius. The original temperature values and the shifted model temperature values are described in Appendix A.
The state variable equations, descriptive model equations (Land Surface Temperature Anomaly Day and Land Surface Temperature Anomaly Night for D. antarctica, C. quitensis and P. annua; Temperature increase rate for D. antarctica, C. quitensis and P. annua; Ruling Temperature for D. antarctica, C. quitensis and P. annua; and Species Occurrence Growth for D. antarctica, C. quitensis and P. annua); model parameter definitions used for the state variable equations and descriptive model equations (Table 2.); and the descriptive values of model parameters (describing the remaining model parameters) (Appendix A) describe the interactions of the model parameters. A heuristic diagram of the model (Figure 3) has also been included. This diagram shows the connections of the state variable equations and descriptive model equations for each species of vegetation The Vensim model constructed for this study is included in the Supplementary Materials. All of the figures showing the results of the model simulations were generated with the results of the Vensim model in R [37].
State Variable Equations:
x ρ = c ρ ρ D T m i n D T m a x ρ
ζ ι   = c ι   ι C T m i n C T m a x ι
κ υ = c υ υ P T m i n P T m a x υ
where x , ζ , and κ are the relative growth rates for D. antarctica, C. quitensis, and P. annua; ρ , ι , and υ are the ruling temperatures for D. antarctica, C. quitensis, and P. annua; c is the empirical scaling constant (set to 1 × 10⁻⁵); DTmin is the minimum recorded temperature for D. antarctica; DTmax is the maximum germination temperature for D. antarctica; CTmin is the minimum recorded temperature for C. quitensis; CTmax is the maximum germination temperature for C. quitensis; PTmin is the minimum recorded temperature for P. annua; and PTmax is the maximum germination temperature for P. annua.
Descriptive Model Equations D. antarctica, C. quitensis and P. annua Occurrence Growth:
β = x ρ d
ψ = ζ ι q
  ϕ = κ υ p
where β , ψ , and ϕ represent the occurrence growth for D. antarctica, C. quitensis, and P. annua; x , ζ and κ are the relative growth rates for D. antarctica, C. quitensis, and P. annua; ρ , ι , and υ are the ruling temperatures for D. antarctica, C. quitensis, and P. annua; d, q, and p are the number of D. antarctica, C. quitensis, and P. annua occurrences.
Descriptive Model Equations D. antarctica, C. quitensis and P. annua Ruling Temperature:
ρ = ε + D A v g T e m p D + η + D A v g T e m p N ) 2 + γ t
ι = ϱ + C A v g T e m p D + σ + C A v g T e m p N 2 + α t
υ = ω + P A v g T e m p D + ς + P A v g T e m p N 2 + δ t
where ρ , ι , and υ are the ruling temperatures for D. antarctica, C. quitensis, and P. annua; ε , ϱ , and ω are the Land Surface Temperature Anomaly Day temperatures for D. antarctica, C. quitensis. Additionally, P. annua; η , σ , and ς are the Land Surface Temperature Anomaly Day temperatures for D. antarctica, C. quitensis and P. annua; D A v g T e m p D is the average daytime temperature of all D. antarctica occurrences; D A v g T e m p N is the average nighttime temperature of all D. antarctica occurrences; C A v g T e m p D is the average daytime temperature of all C. quitensis occurrences; C A v g T e m p N is the average nighttime temperature of all C. quitensis occurrences; P A v g T e m p D is the average daytime temperature of all P. annua occurrences; P A v g T e m p N is the average nighttime temperature of all P. annua occurrences; γ , α , and δ are the temperature increase rates for D. antarctica, C. quitensis, and P. annua; and t is time in years. The average day and nighttime temperatures were included to represent the day to night fluctuation in temperature and the surface anomaly temperatures were included to represent fluctuations in temperature anomalies.
Descriptive Model Equations D. antarctica, C. quitensis and P. annua Land Surface Temperature Anomaly (Day and Night):
ε = RANDOM   UNIFROM   λ Min ,   λ Max ,   λ Seed
η = RANDOM   UNIFROM   μ Min ,   μ Max ,   μ Seed
ϱ = RANDOM   UNIFROM   ο Min ,   ο Max ,   ο Seed
σ = RANDOM   UNIFROM   ϵ Min ,   ϵ Max ,   ϵ Seed
ω = RANDOM   UNIFROM   φ Min ,   φ Max ,   φ Seed
ς = RANDOM   UNIFROM   ϕ Min ,   ϕ Max ,   ϕ Seed
where ε , ϱ , and ω are the Land Surface Temperature Anomaly Day temperatures for D. antarctica, C. quitensis, and P. annua; η , σ , and ς are the Land Surface Temperature Anomaly Night temperatures for D. antarctica, C. quitensis, and P. annua; λ Min , μ Min , and ο Min are the Land Surface Temperature Anomaly Day Minimum values for D. antarctica, C. quitensis, and P. annua; ϵ Min , φ Min , and ϕ Min are the Land Surface Temperature Anomaly Night Minimum values for D. antarctica, C. quitensis, and P. annua; λ Max , μ Max , and ο Max are the Land Surface Temperature Anomaly Day Maximum values for D. antarctica, C. quitensis, and P. annua; ϵ Max , φ Max , and ϕ Max are the Land Surface Temperature Anomaly Night Maximum values for D. antarctica, C. quitensis, and P. annua; and, λ Seed , μ Seed , ο Seed ,   ϵ Seed , and ϕ Seed represent a seed value for set to 10.
In Vensim the RANDOM UNIFORM function produces a uniform distribution between the minimum and maximum values specified in the function, and the seed value is used to initialize the stream of the numbers produced in the distribution. The descriptive model equations for D. antarctica, C. quitensis, and P. annua Land Surface Temperature Anomaly (Day and Night) can also be described with the mathematical uniform distribution formula included below. The RANDOM UNIFORM function was included to mimic variability in surface temperature anomalies.
f x = 1 b a   f o r   a x b
where a is the lowest value of x and b is the highest value of x.
Descriptive Model Equations D. antarctica, C. quitensis and P. annua Temperature Change:
γ = RAMP   τ 1 ,   2022 ,   2122
OR
γ = RAMP   τ 2 ,   2022 ,   2122
α = RAMP   τ 1 ,   2022 ,   2122
OR
α = RAMP   τ 2 ,   2022 ,   2122
δ = RAMP   τ 2 ,   2022 ,   2122
OR
δ = RAMP   τ 2 ,   2022 ,   2122
where γ , α , and δ are the temperature increase rates for D. antarctica, C. quitensis, and P. annua; τ 1 is the temperature increase rate used in the 1.6 °C temperature increase simulation (0.016); and τ 2 is the temperature increase rate used in the 5.0 °C temperature increase simulation (0.05).
In Vensim the RAMP function returns values along the specified slope until the end time, where 0 is returned at the start time. The descriptive model equations for D. antarctica, C. quitensis and P. annua Temperature Change can also be described with the mathematical continuous time ramp formula included below.
r t =   { 1   f o r   t   0   0   f o r   t < 0
where r(t) is the rate of increase and t is time.

3. Results

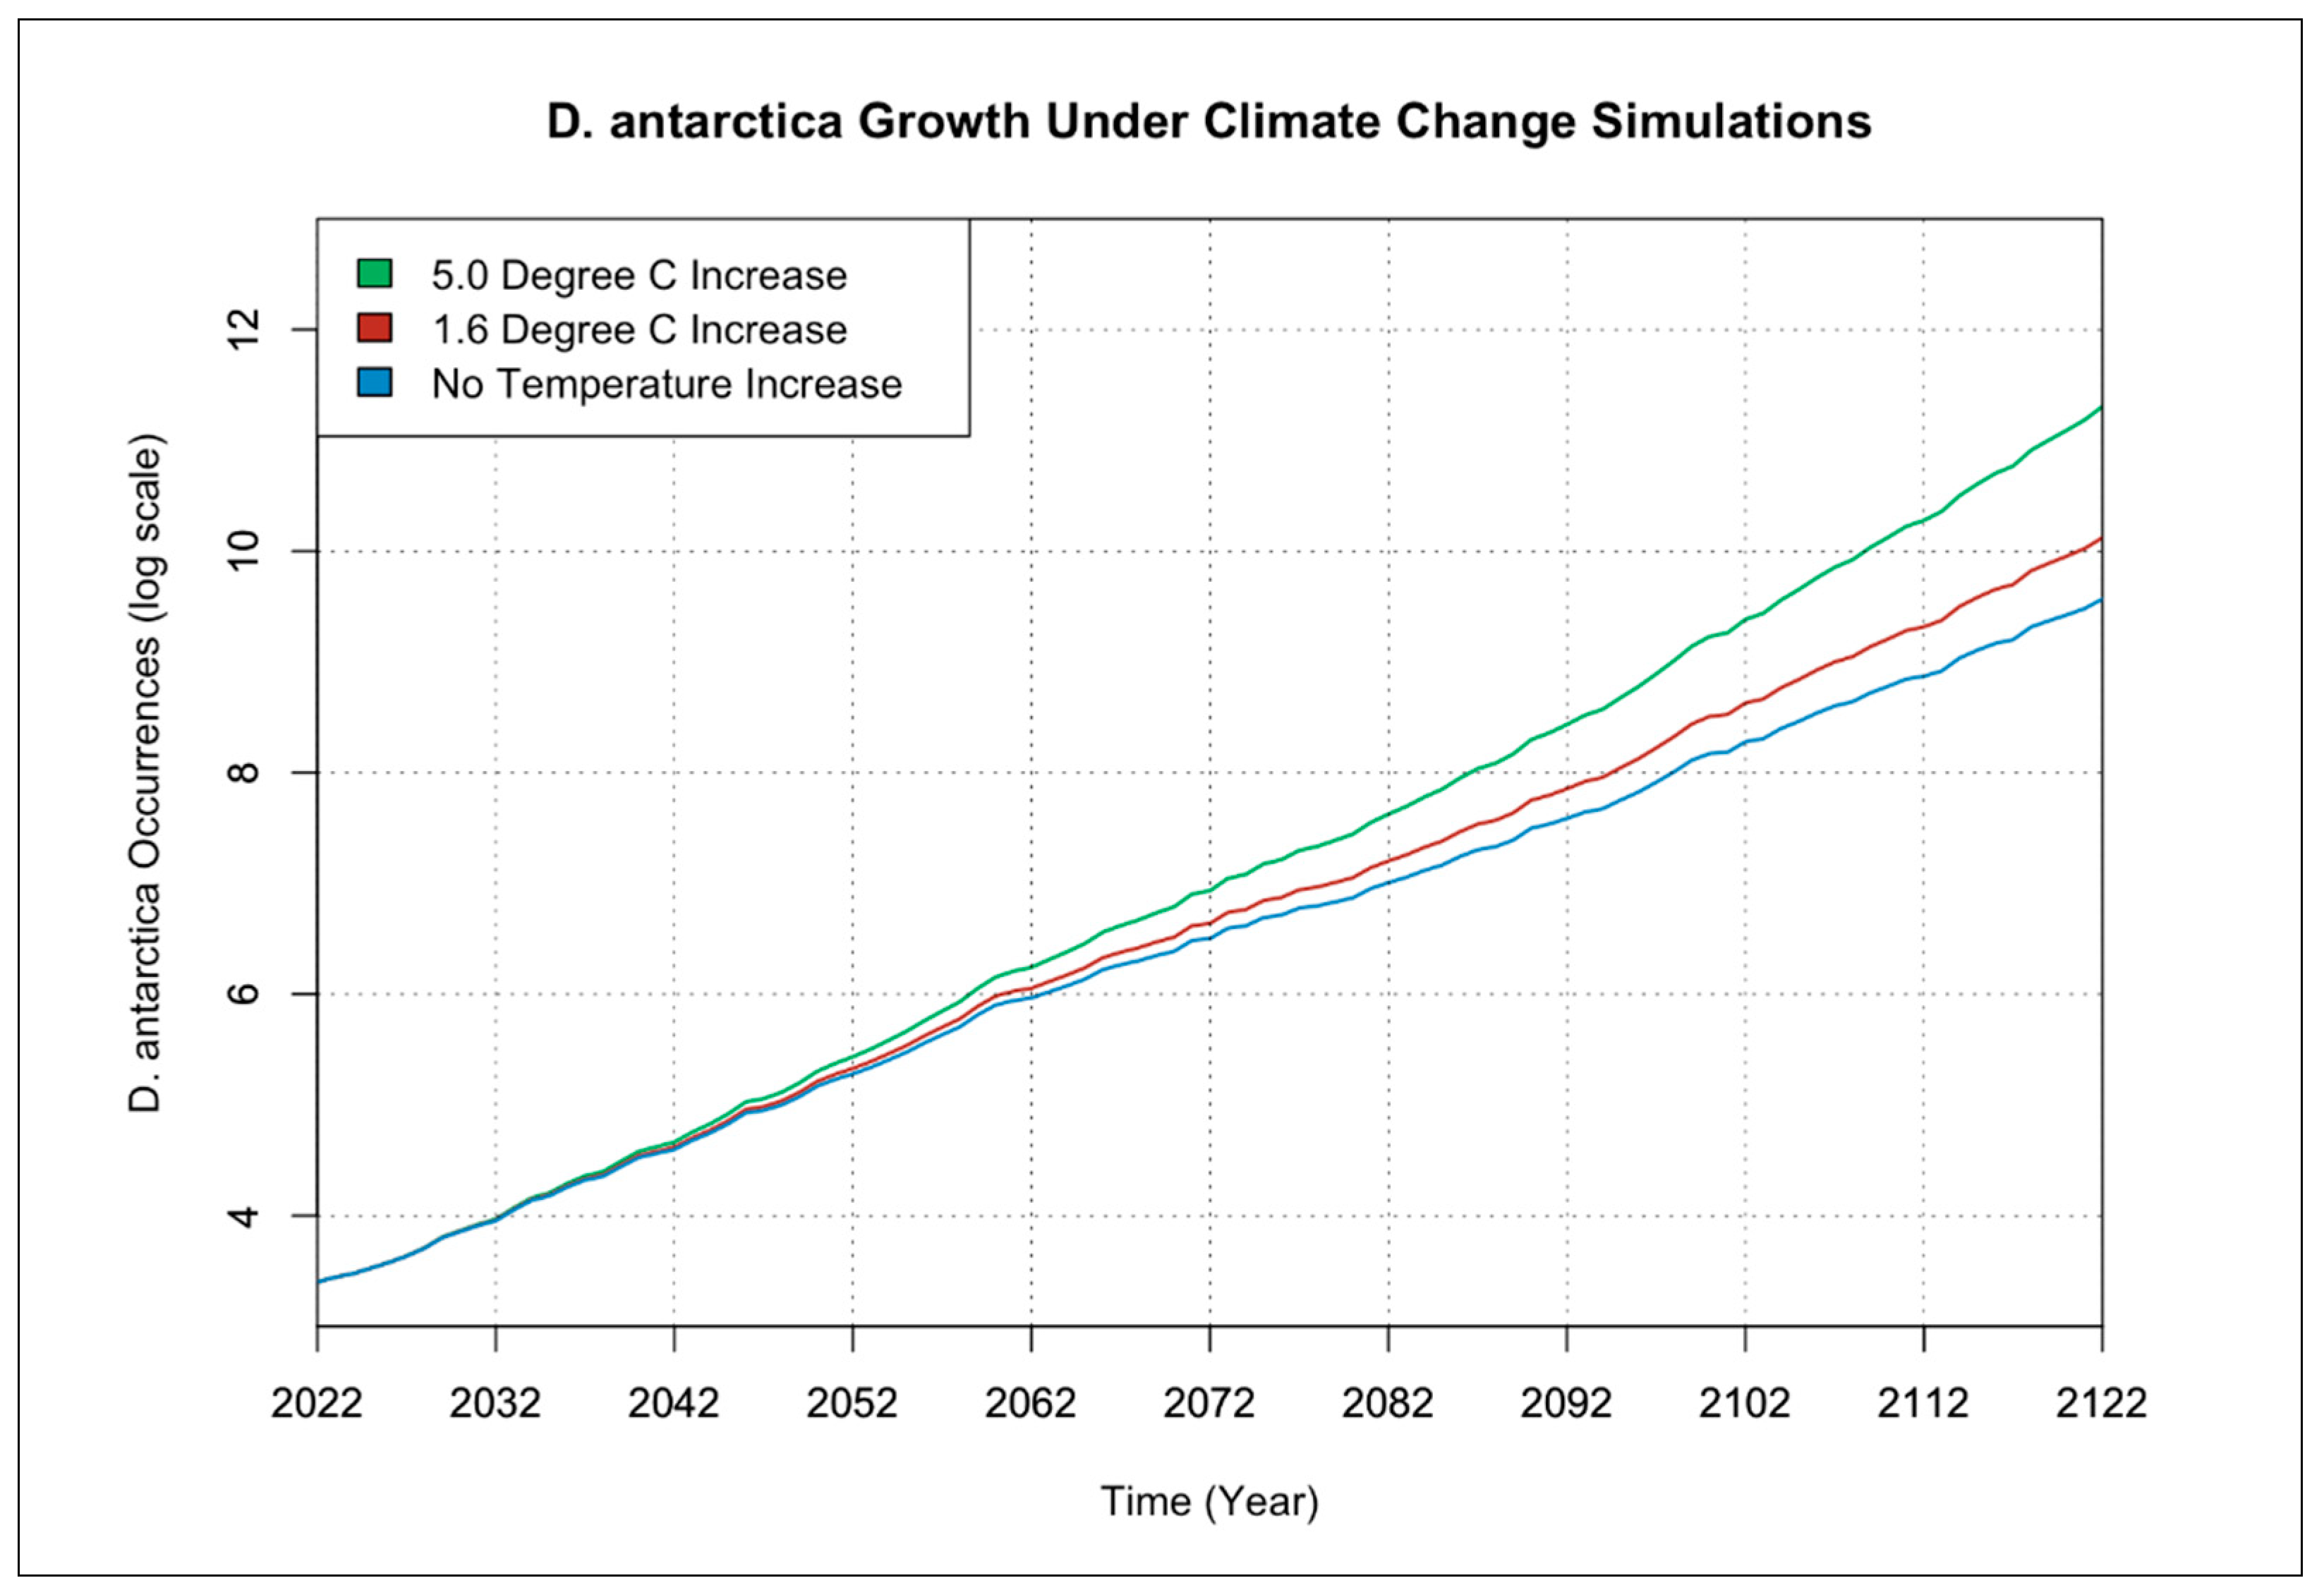
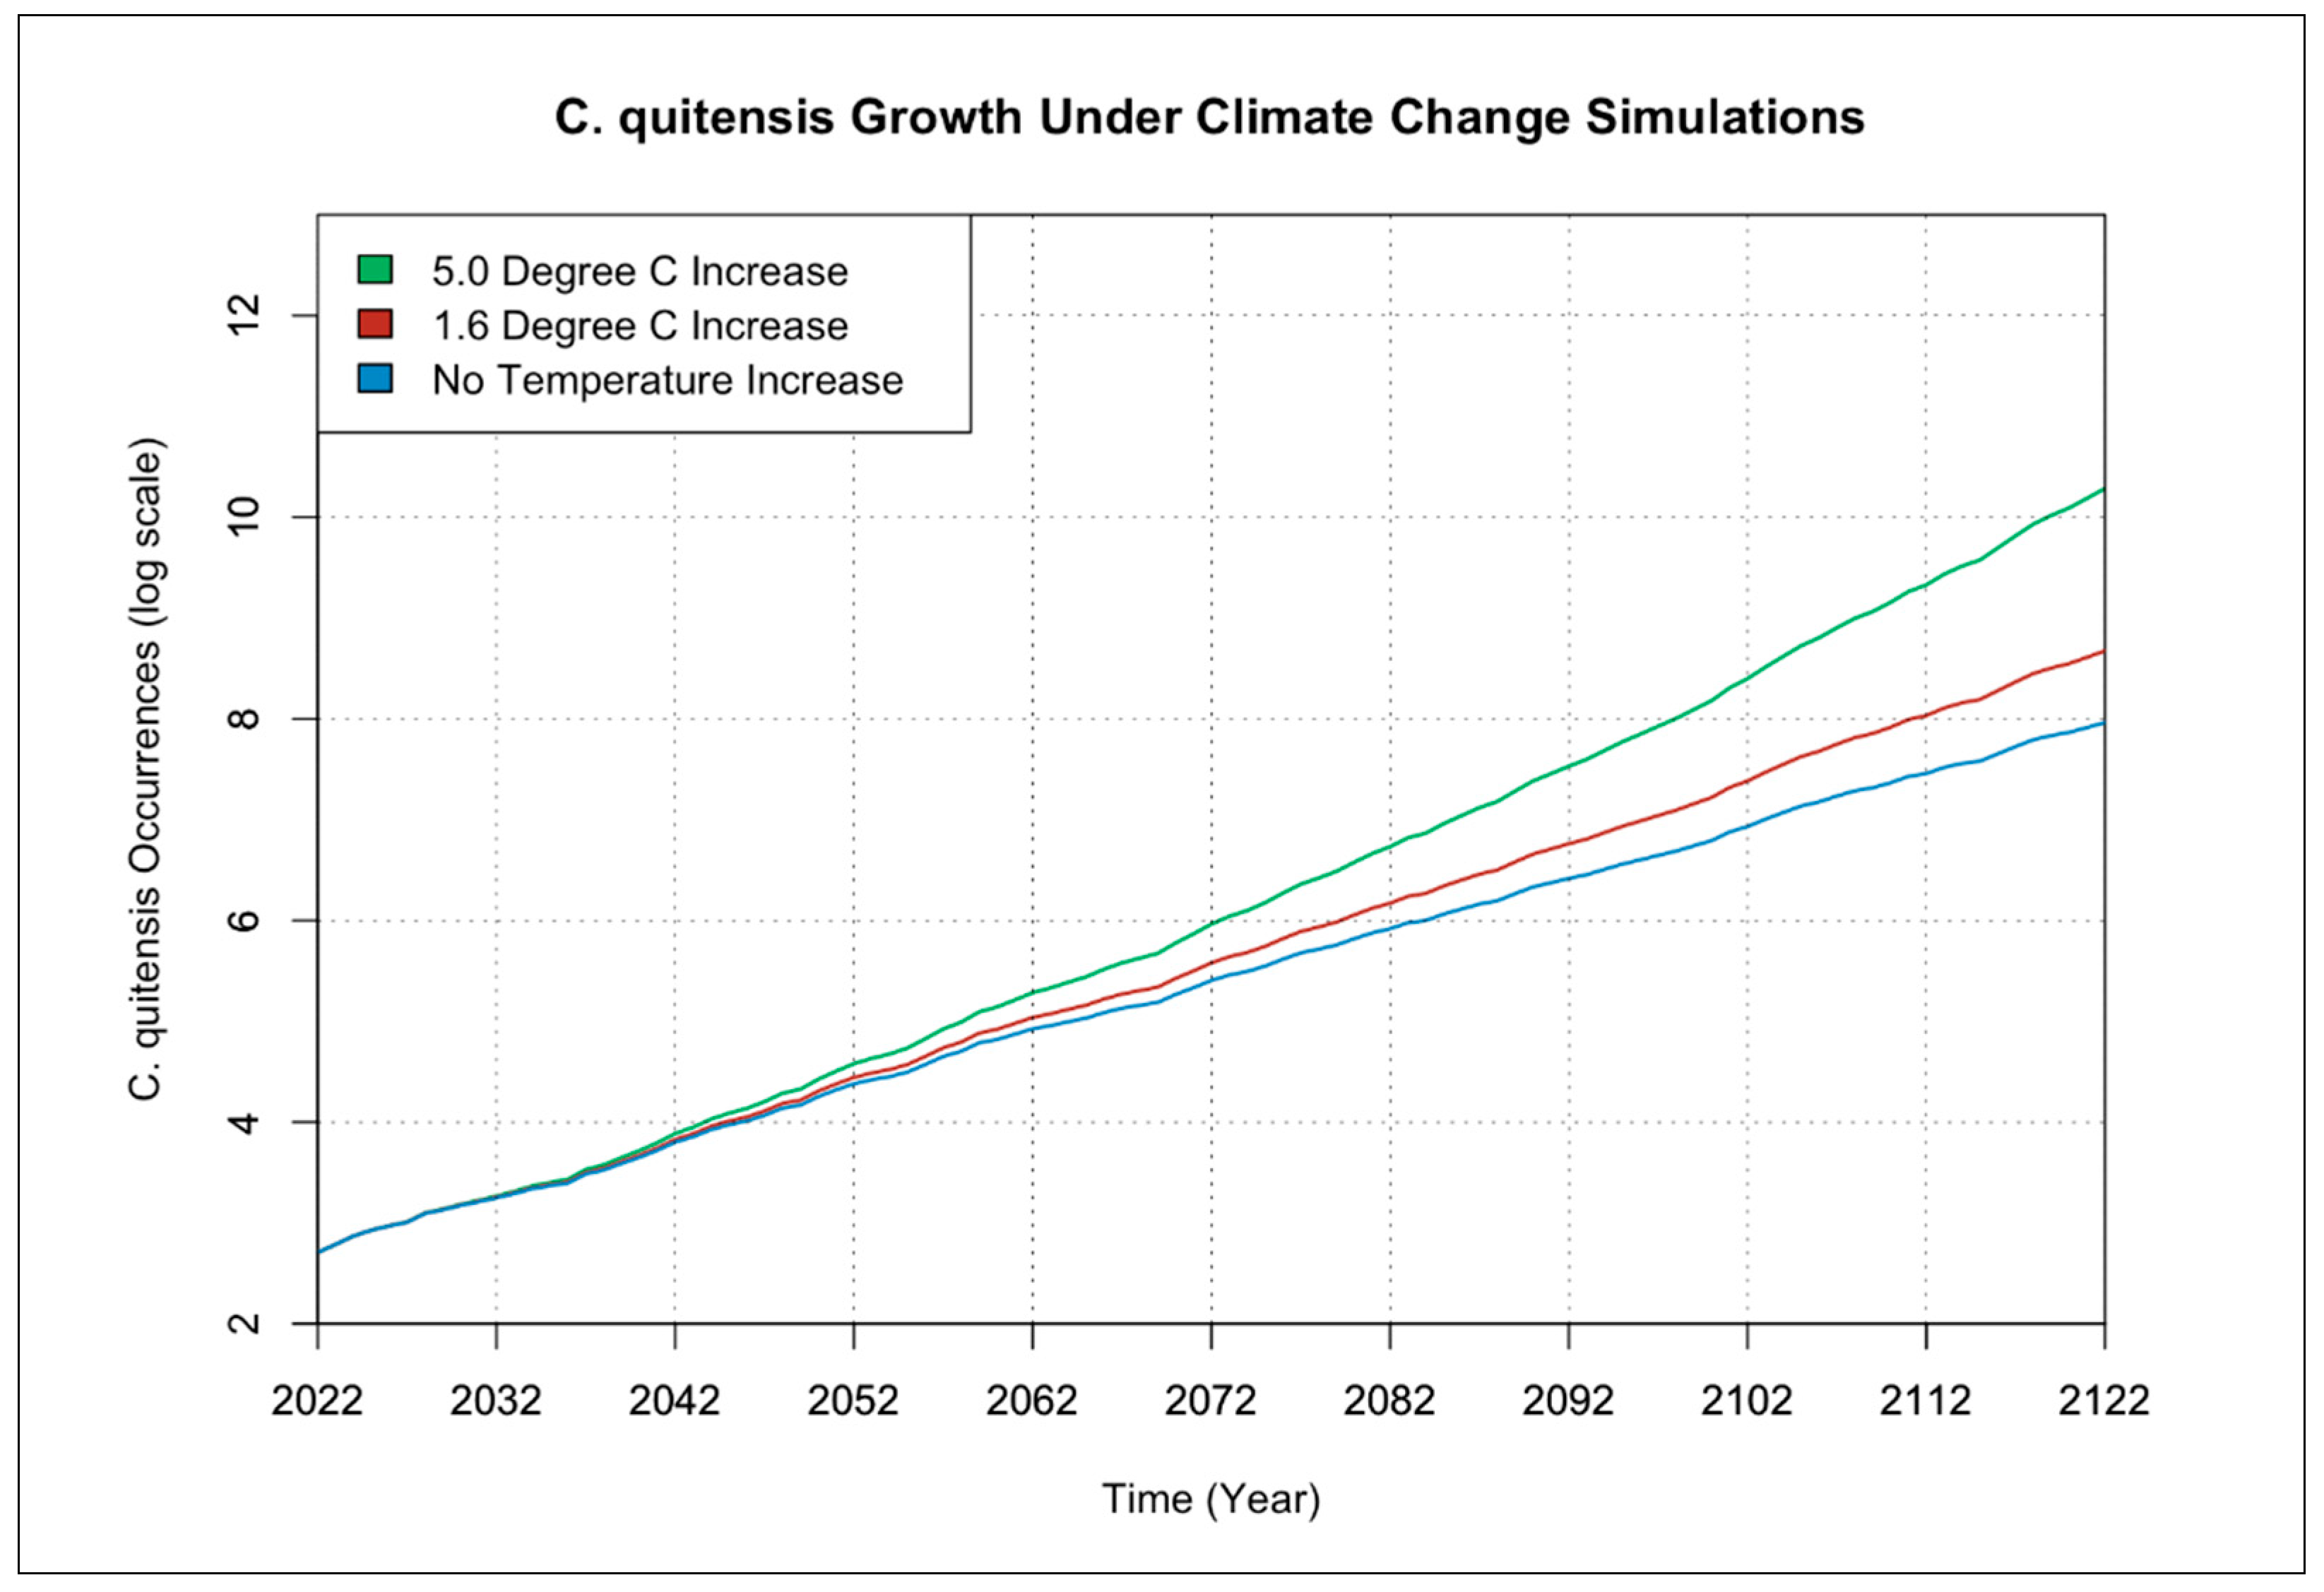
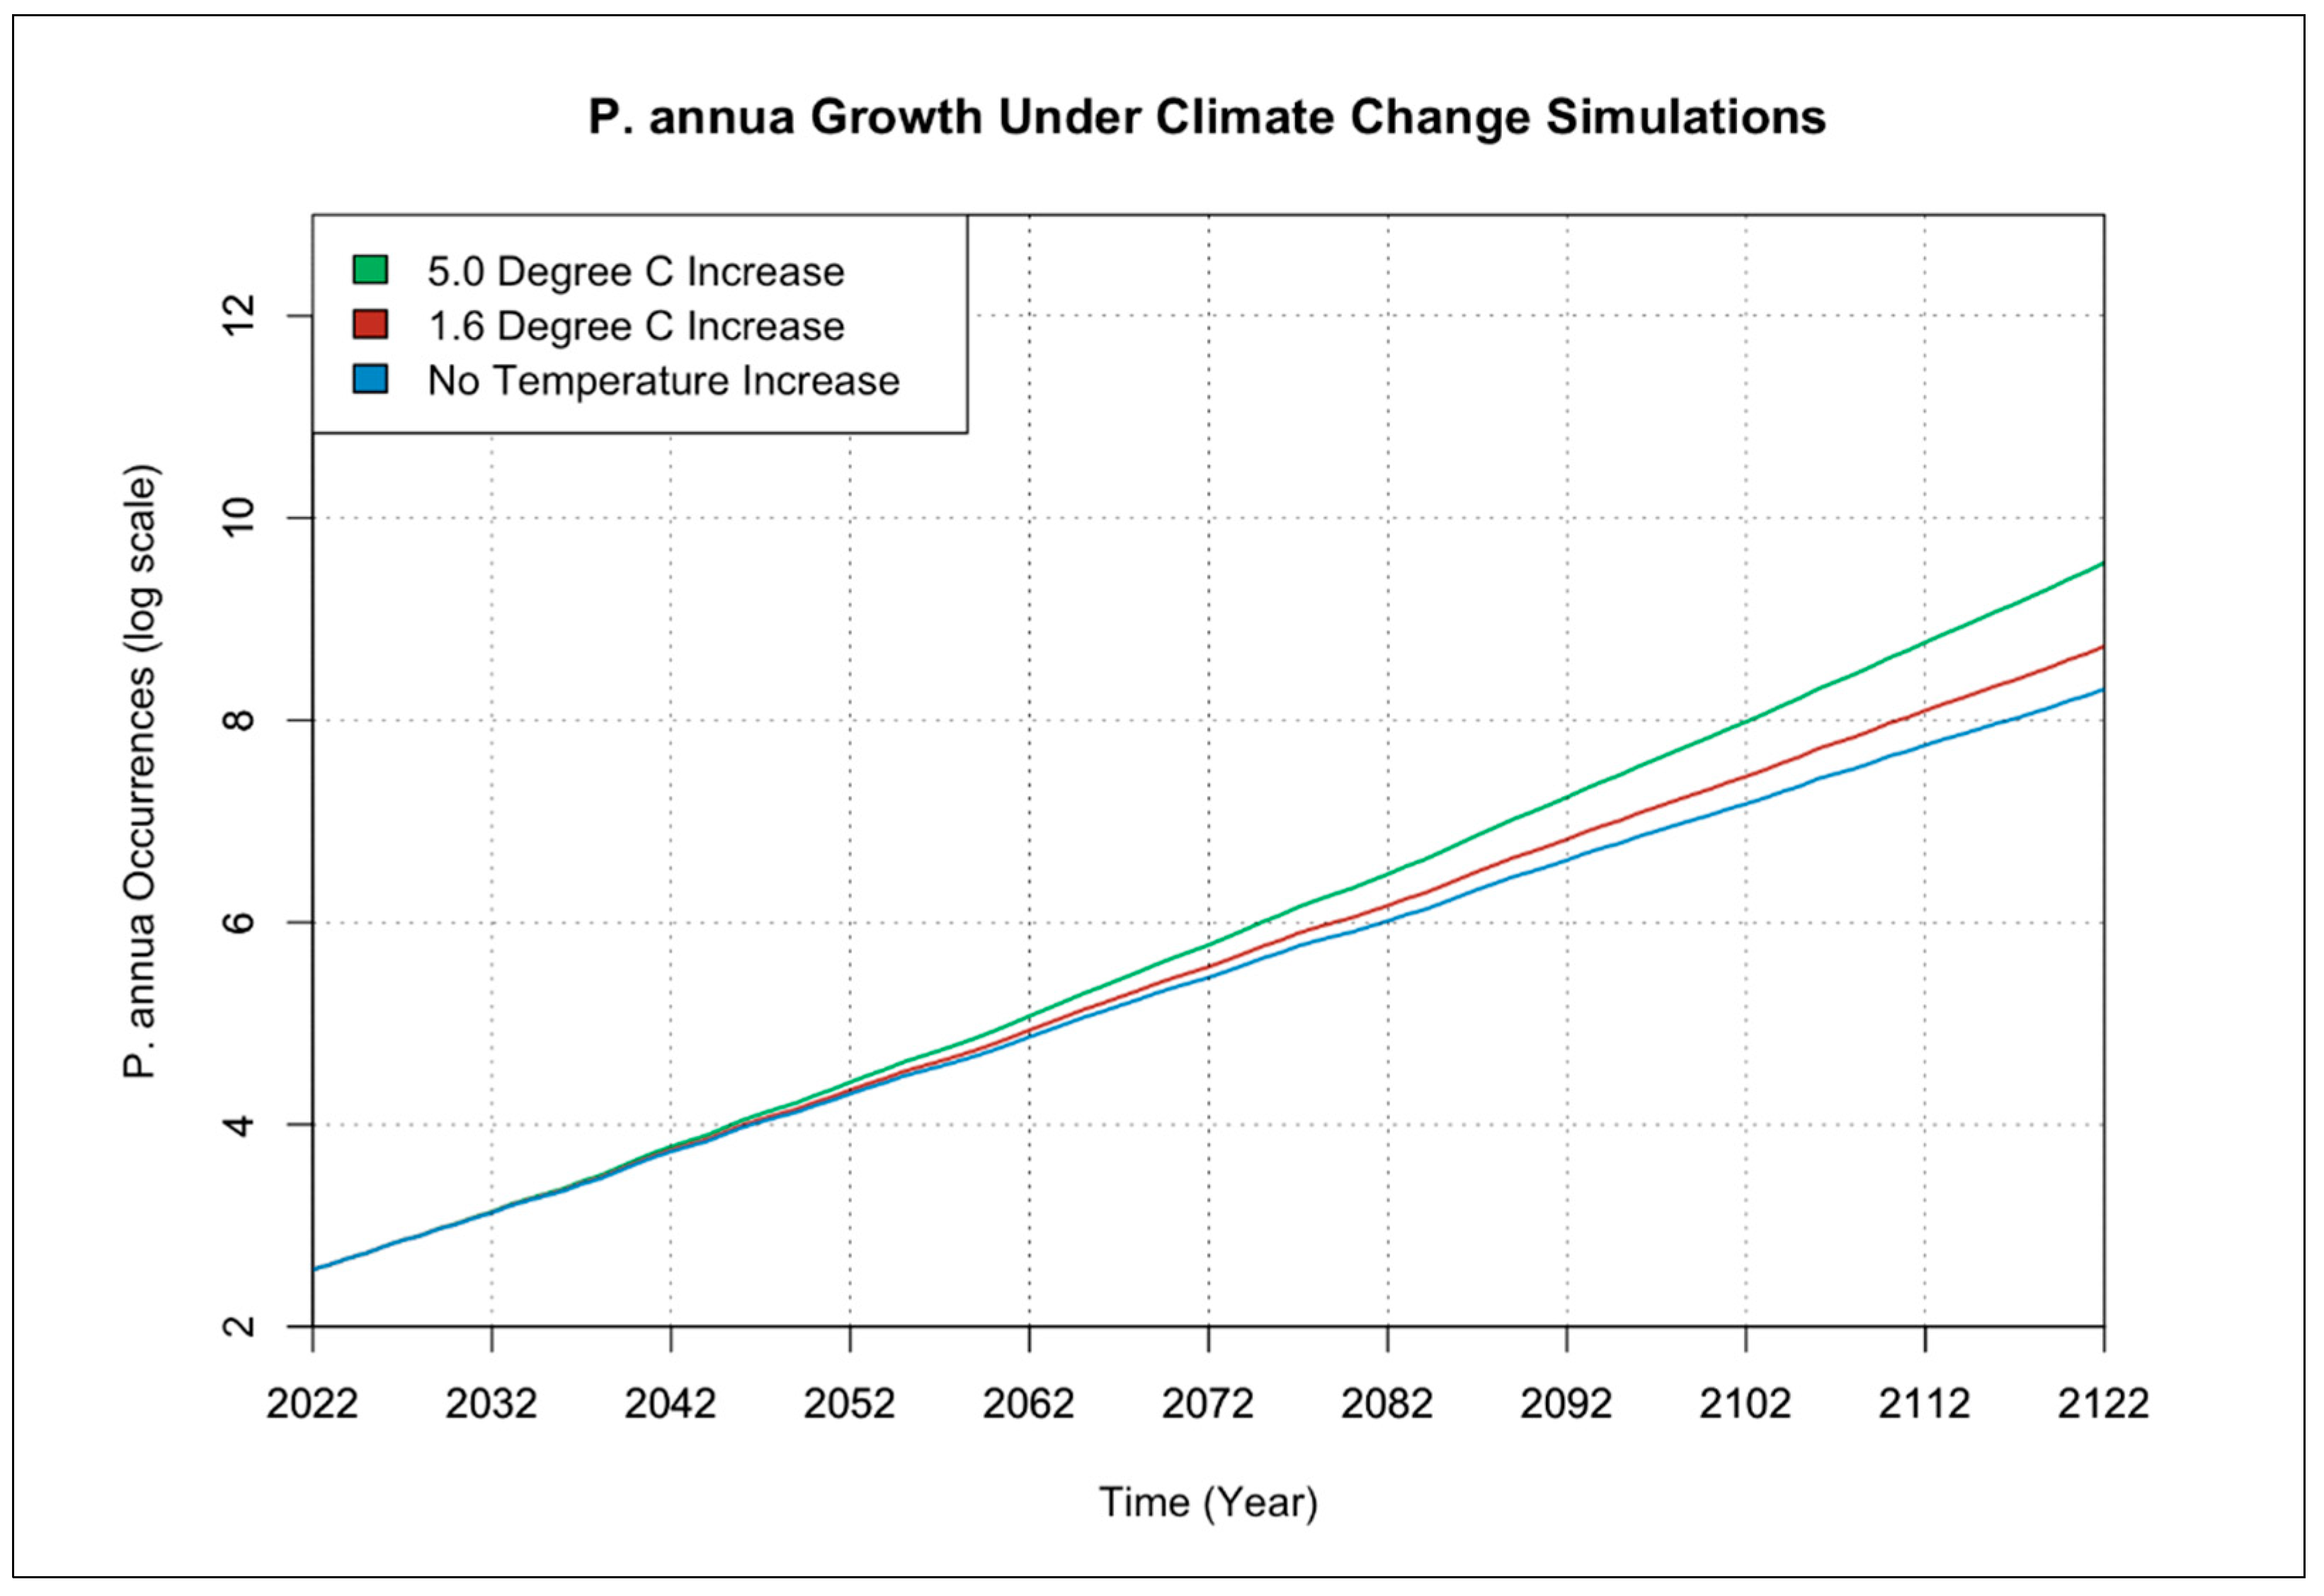
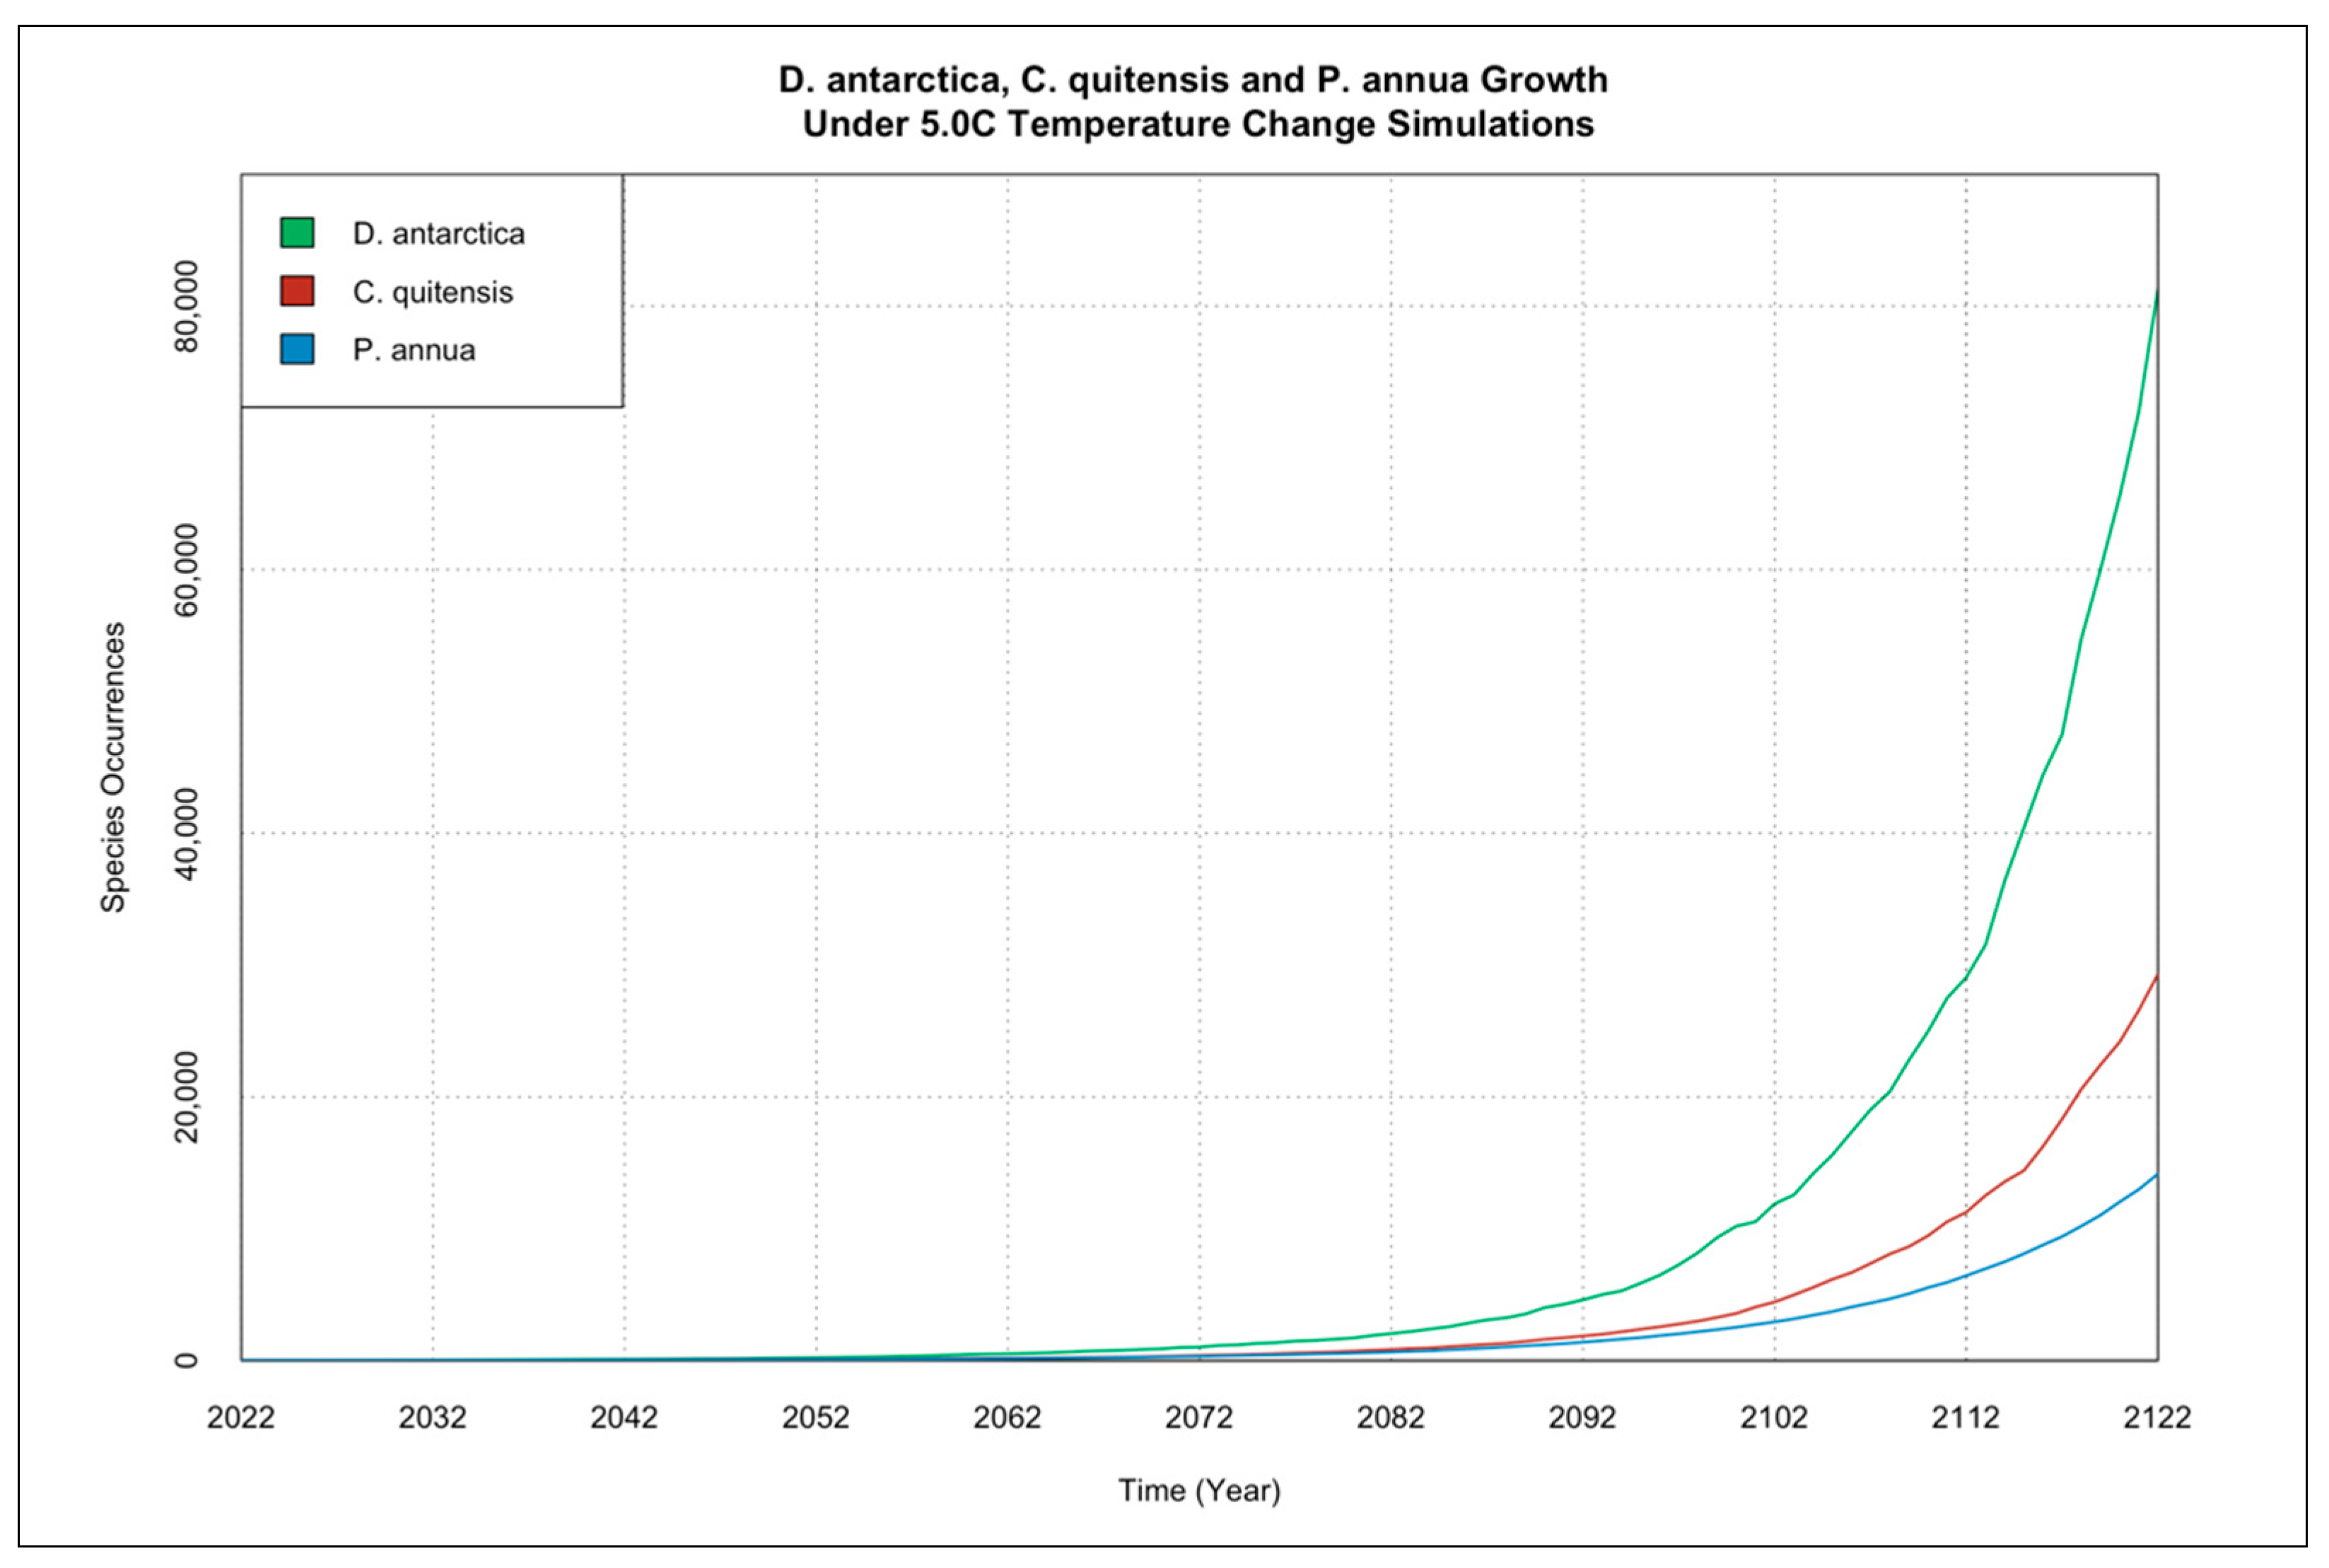
3.1. Individual Species Occurrence Increase under Climate Change Scenarios

The results of the model simulations show an additive increase of all species occurrences over time, and also show that, although all three species increase their occurrence numbers between the years 2022 and 2122, the rates of their occurrence increases are impacted by different temperature scenarios.
Figure 4, Figure 5 and Figure 6 show individual species occurrence increase under three climate change scenarios (0.0 °C increase, 1.6 °C increase, and 5.0 °C increase). The occurrence increase values in these figures are shown in a log scale so that the variation between temperature change simulations is visualized more clearly. All three species have higher occurrence growth rates under the higher temperature increase simulations. This result is not surprising as the maximum germination temperature (i.e., the maximum temperature threshold) for all three species is significantly higher than temperatures occurring in the Antarctic peninsula, even under the 5.0 °C warming simulation.
Figure 4 shows the occurrence increase of D. antarctica under the three climate change scenarios, no temperature change, minimum temperature change of 1.6 °C, and maximum temperature change of 5.0 °C. The highest occurrence values that D. antarctica reaches in each simulation are 14,293.9 (no temperature change simulation), 24,857.3 (1.6 °C increase simulation), and 81,253.8 (5.0 °C increase simulation). The 5.0 °C increase simulation shows a more substantial increase in D. antarctica occurrence increases compared to the 1.6 °C increase and no temperature change simulations. In all three simulations the D. antarctica occurrences remain relatively low until the 2060s–2070s.
Figure 5 shows the occurrence increase of C. quitensis under the three climate change scenarios no temperature change, minimum temperature change of 1.6 °C, and maximum temperature change of 5.0 °C. The highest occurrence values that C. quitensis reaches in each simulation are 2875.89 (no temperature change simulation), 5856.09 (1.6 °C increase simulation), and 29,311.2 (5.0 °C increase simulation). Like D. antarctica, the 5.0 °C increase simulation shows a more substantial increase in C. quitensis occurrence increases compared to the 1.6 °C increase and no temperature change simulations. In all three simulations the C. quitensis occurrences remain relatively low until the 2060s–2070s.
Figure 6 shows the occurrence increase of P. annua under the three climate change scenarios no temperature change, minimum temperature change of 1.6 °C, and maximum temperature change of 5.0 °C. The highest occurrence values that P. annua reaches in each simulation are 4056.81 (no temperature change simulation), 6194.26 (1.6 °C increase simulation), and 14,159.7 (5.0 °C increase simulation). Like D. antarctica and C. quitensis, the 5.0 °C increase simulation shows a more substantial increase in P. annua occurrence increases compared to the 1.6 °C increase and no temperature change simulations. In all three simulations the C. quitensis occurrences remain relatively low until the 2050s–2060s.

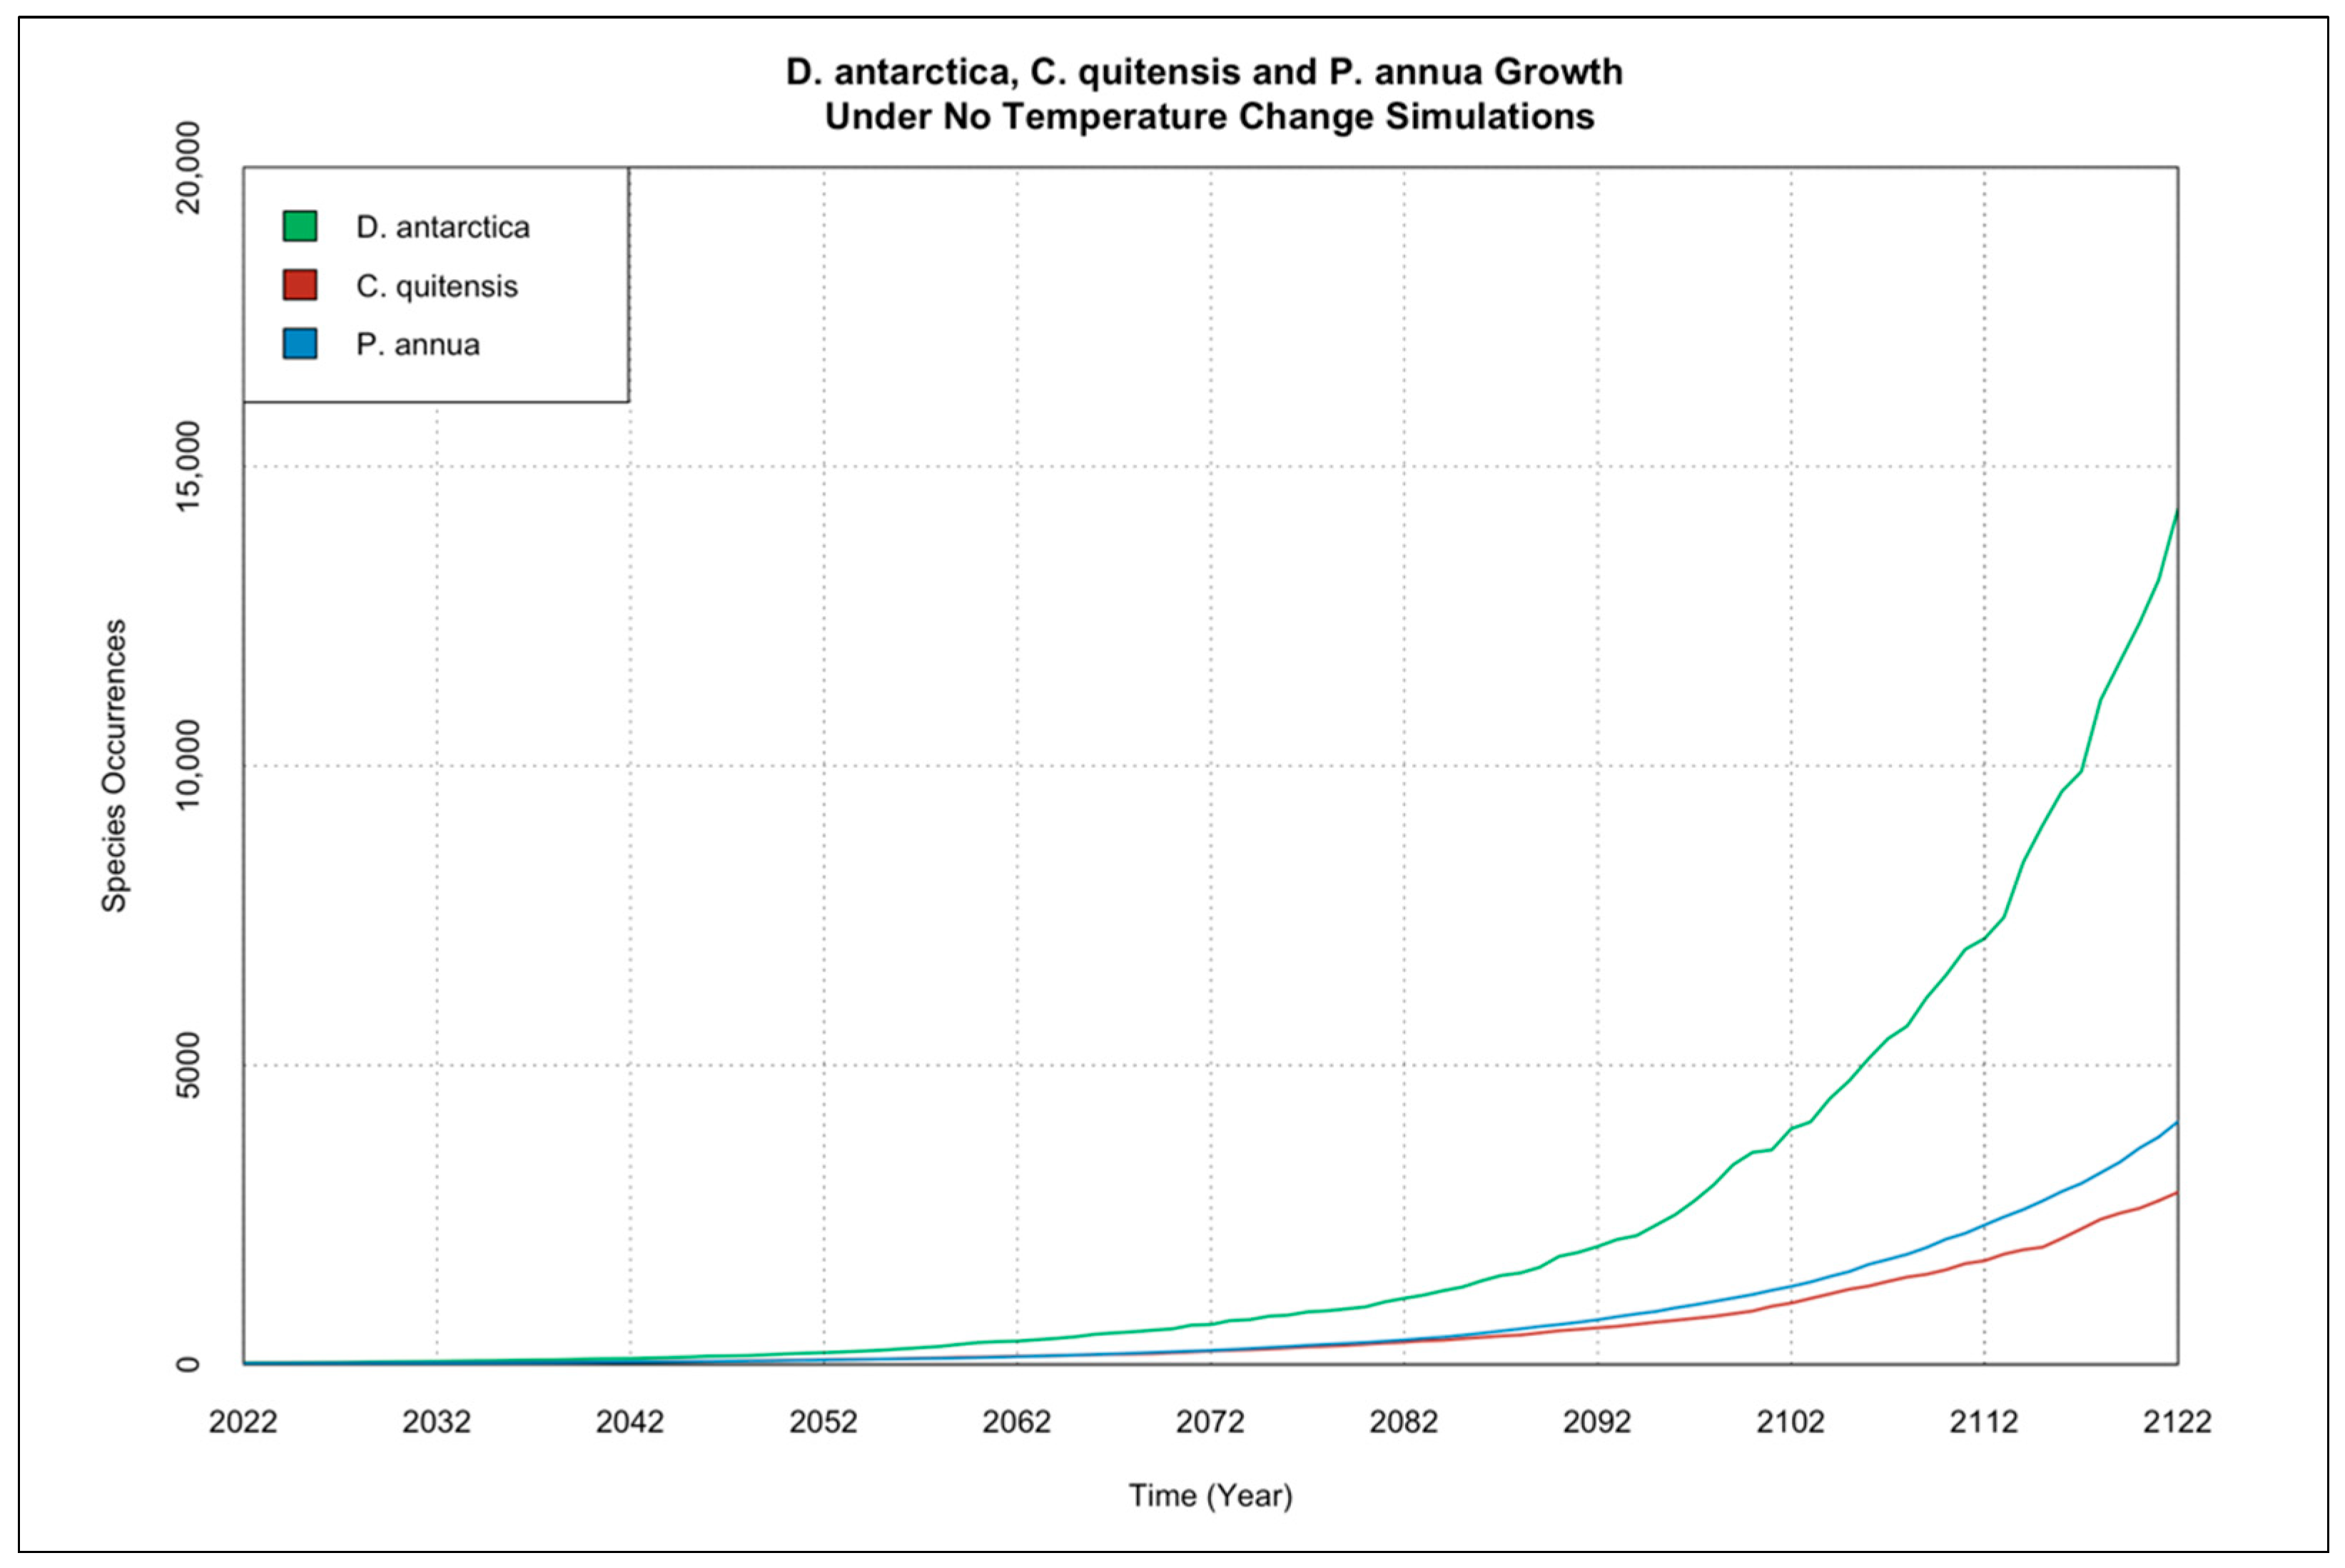
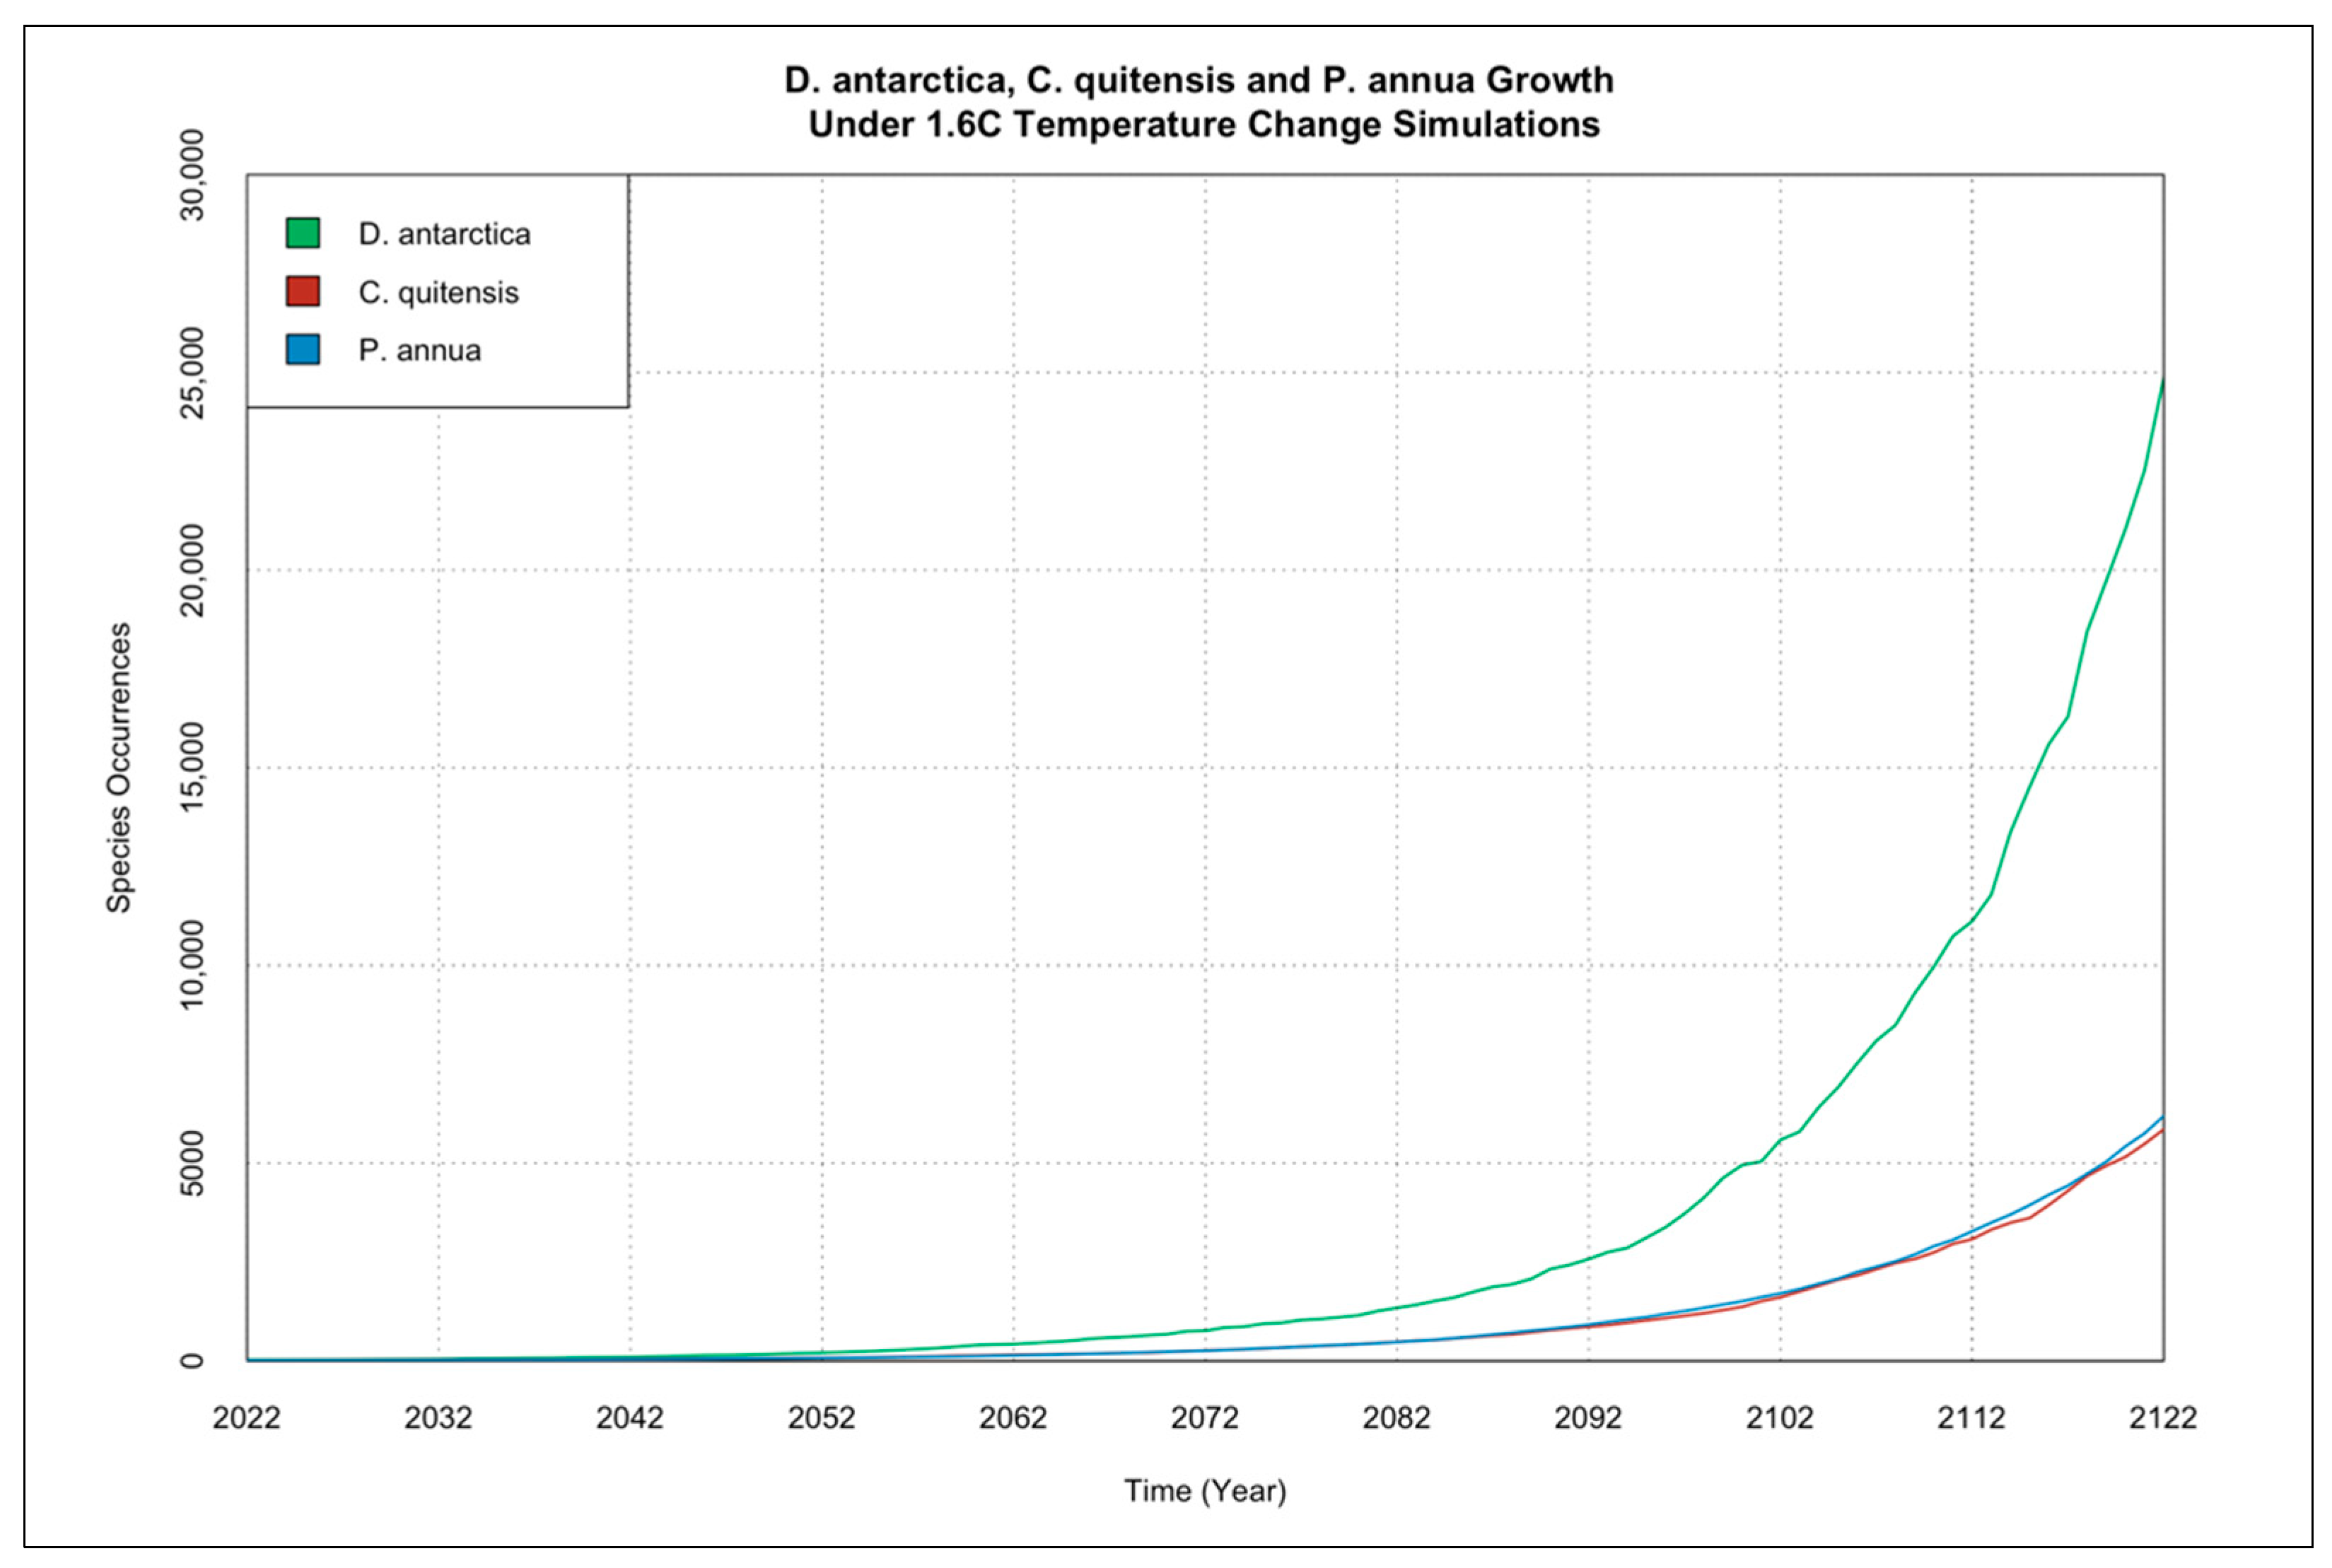
3.2. Interactions of Species Occurrence Increase under Climate Change Scenarios

Figure 7, Figure 8 and Figure 9 show the interactions of the species occurrence increase under three climate change scenarios (0.0 °C increase, 1.6 °C increase, and 5.0 °C increase). Unlike Figure 4, Figure 5 and Figure 6, these figures show the actual occurrence increase values, rather than the log scale. Figure 7 shows the comparison of D. antarctica, C. quitensis, and P. annua occurrences under the no temperature change simulation. In this simulation D. antarctica consistently has the highest numbers of occurrences compared to C. quitensis and P. annua. Figure 8 shows the comparison of D. antarctica, C. quitensis, and P. annua occurrences under the minimum temperature change of 1.6 °C simulation. In this simulation D. antarctica, again, consistently has the highest numbers of occurrences compared to C. quitensis and P. annua. The C. quitensis and P. annua occurrences oscillate over time, and by the end of the simulation P. annua has marginally higher number of species occurrences than C. quitensis. Figure 9 shows the comparison of D. antarctica, C. quitensis, and P. annua occurrences under the maximum temperature change of 5.0 °C simulation. Like the previous simulations, D. antarctica fairly consistently has higher numbers of occurrences compared to C. quitensis and P. annua. The C. quitensis and P. annua occurrence values are fairly similar until 2077, and from 2077 onwards C. quitensis has higher occurrences compared to P. annua.

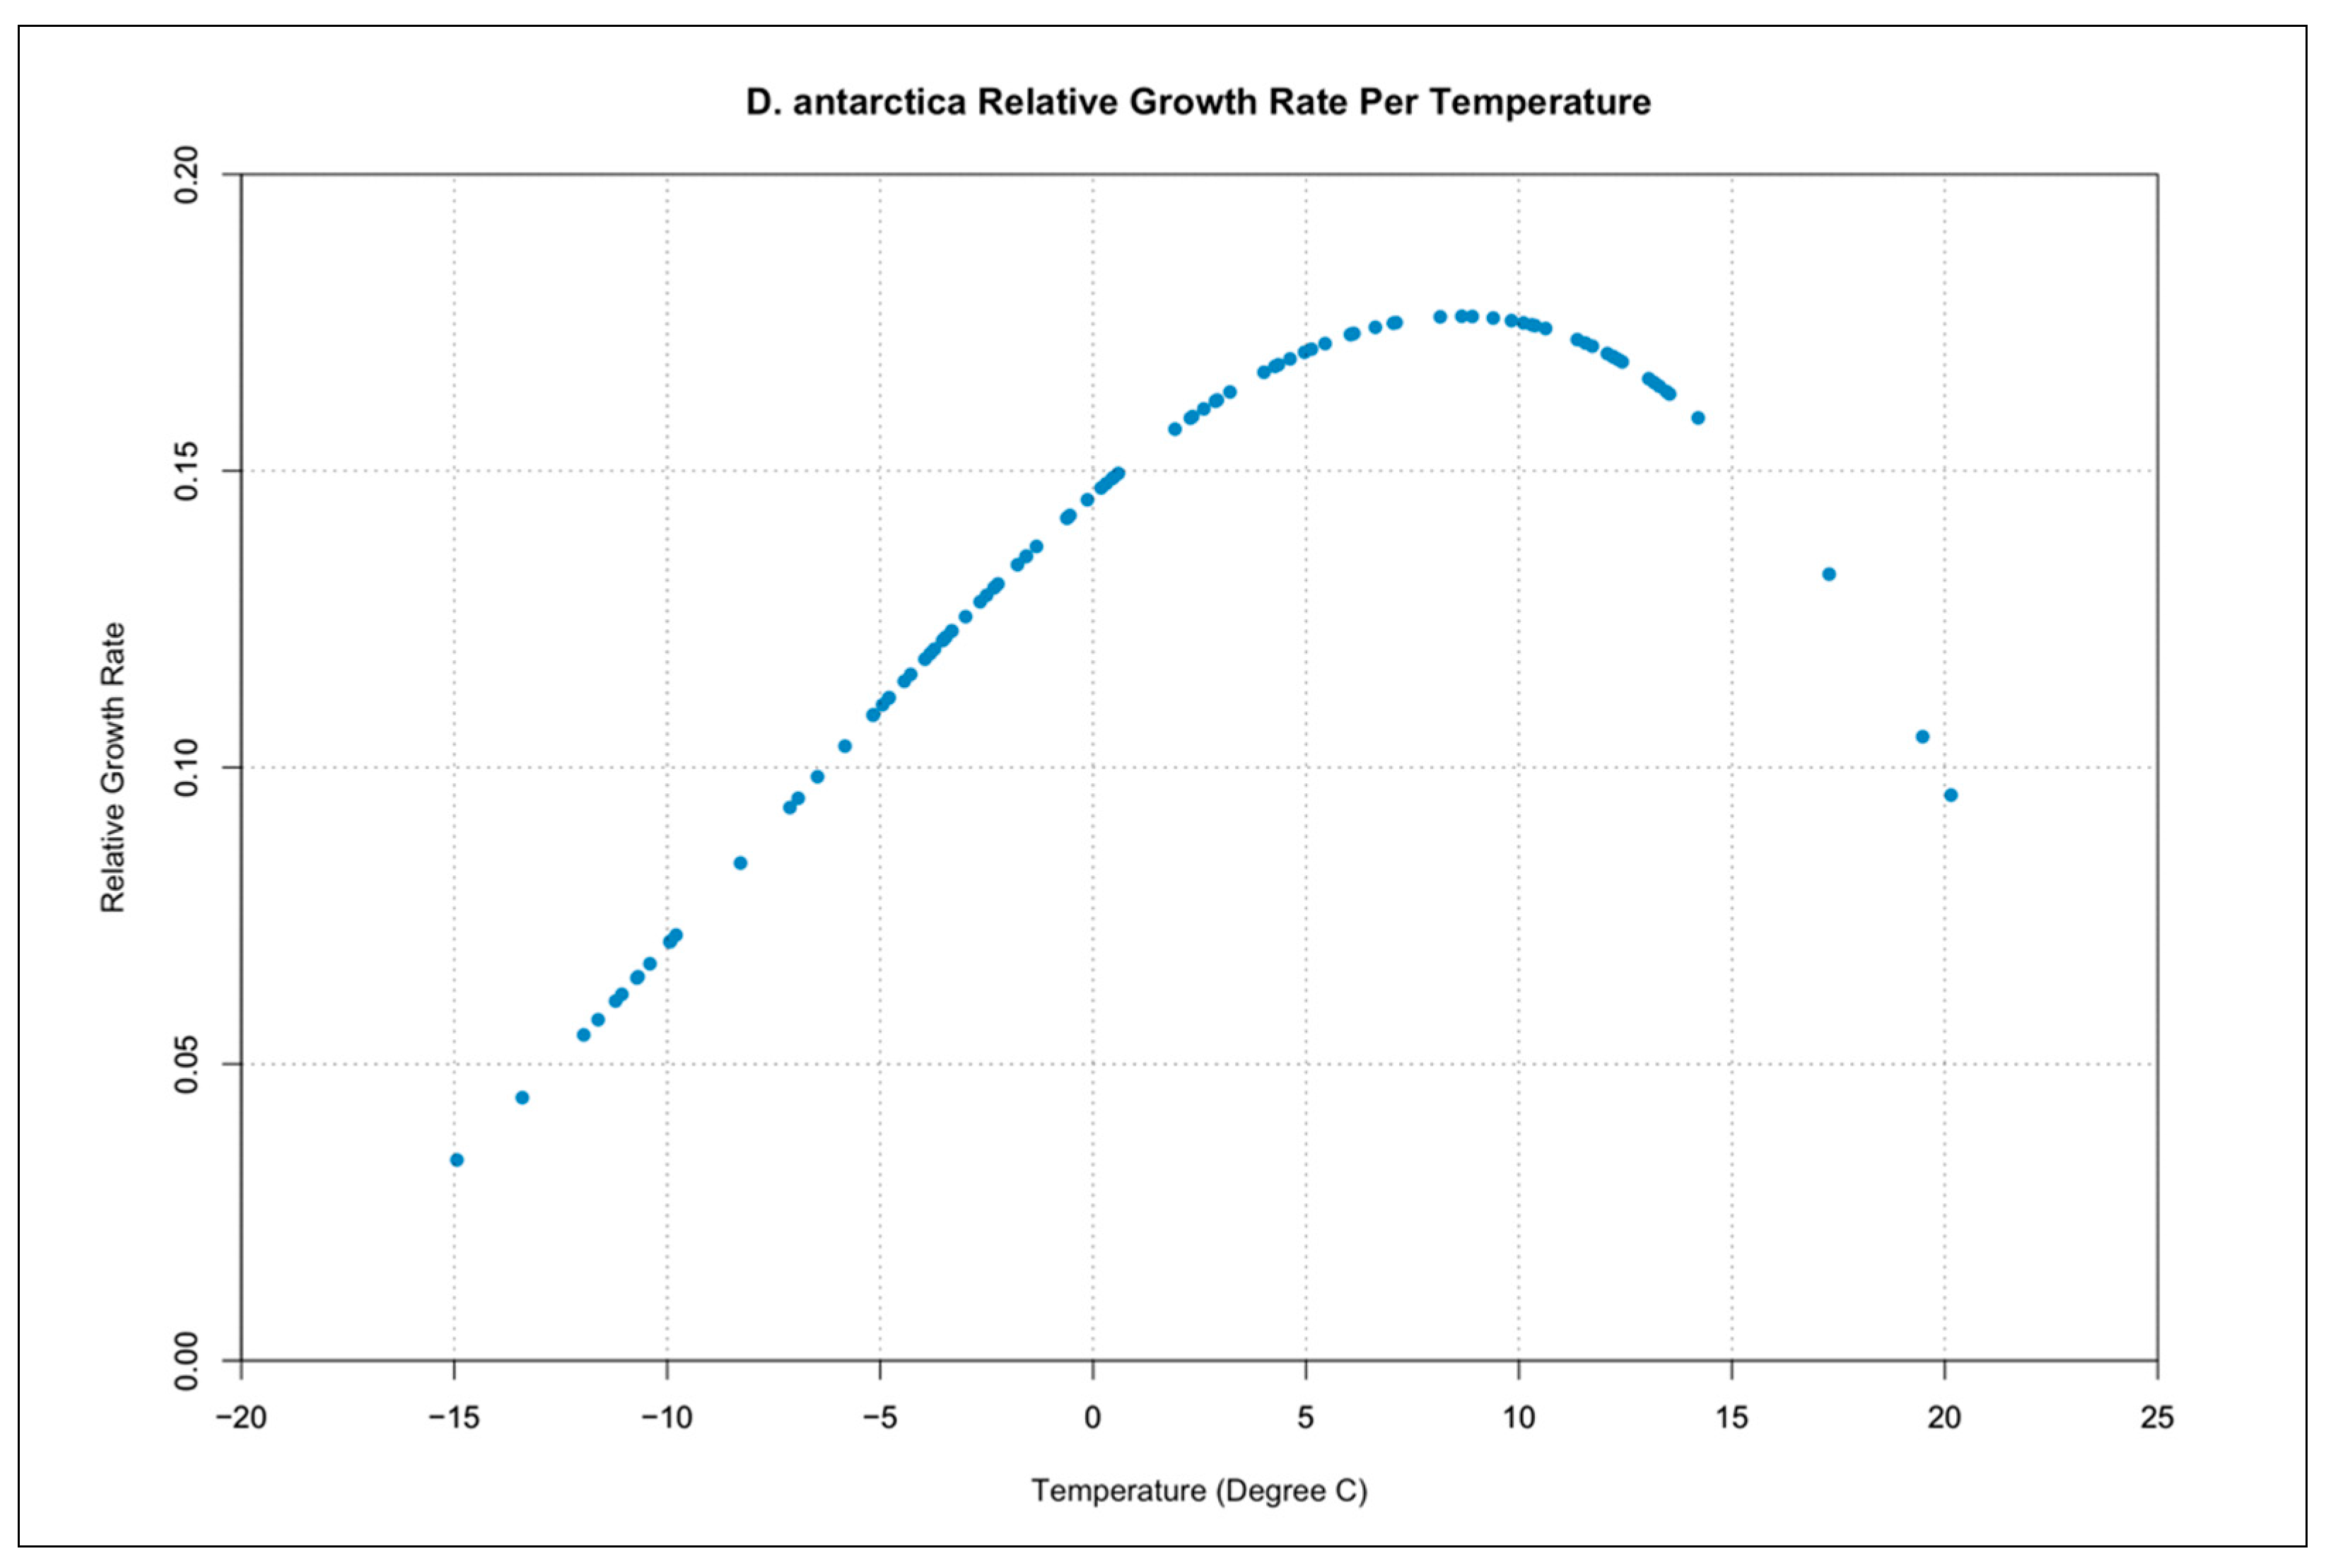
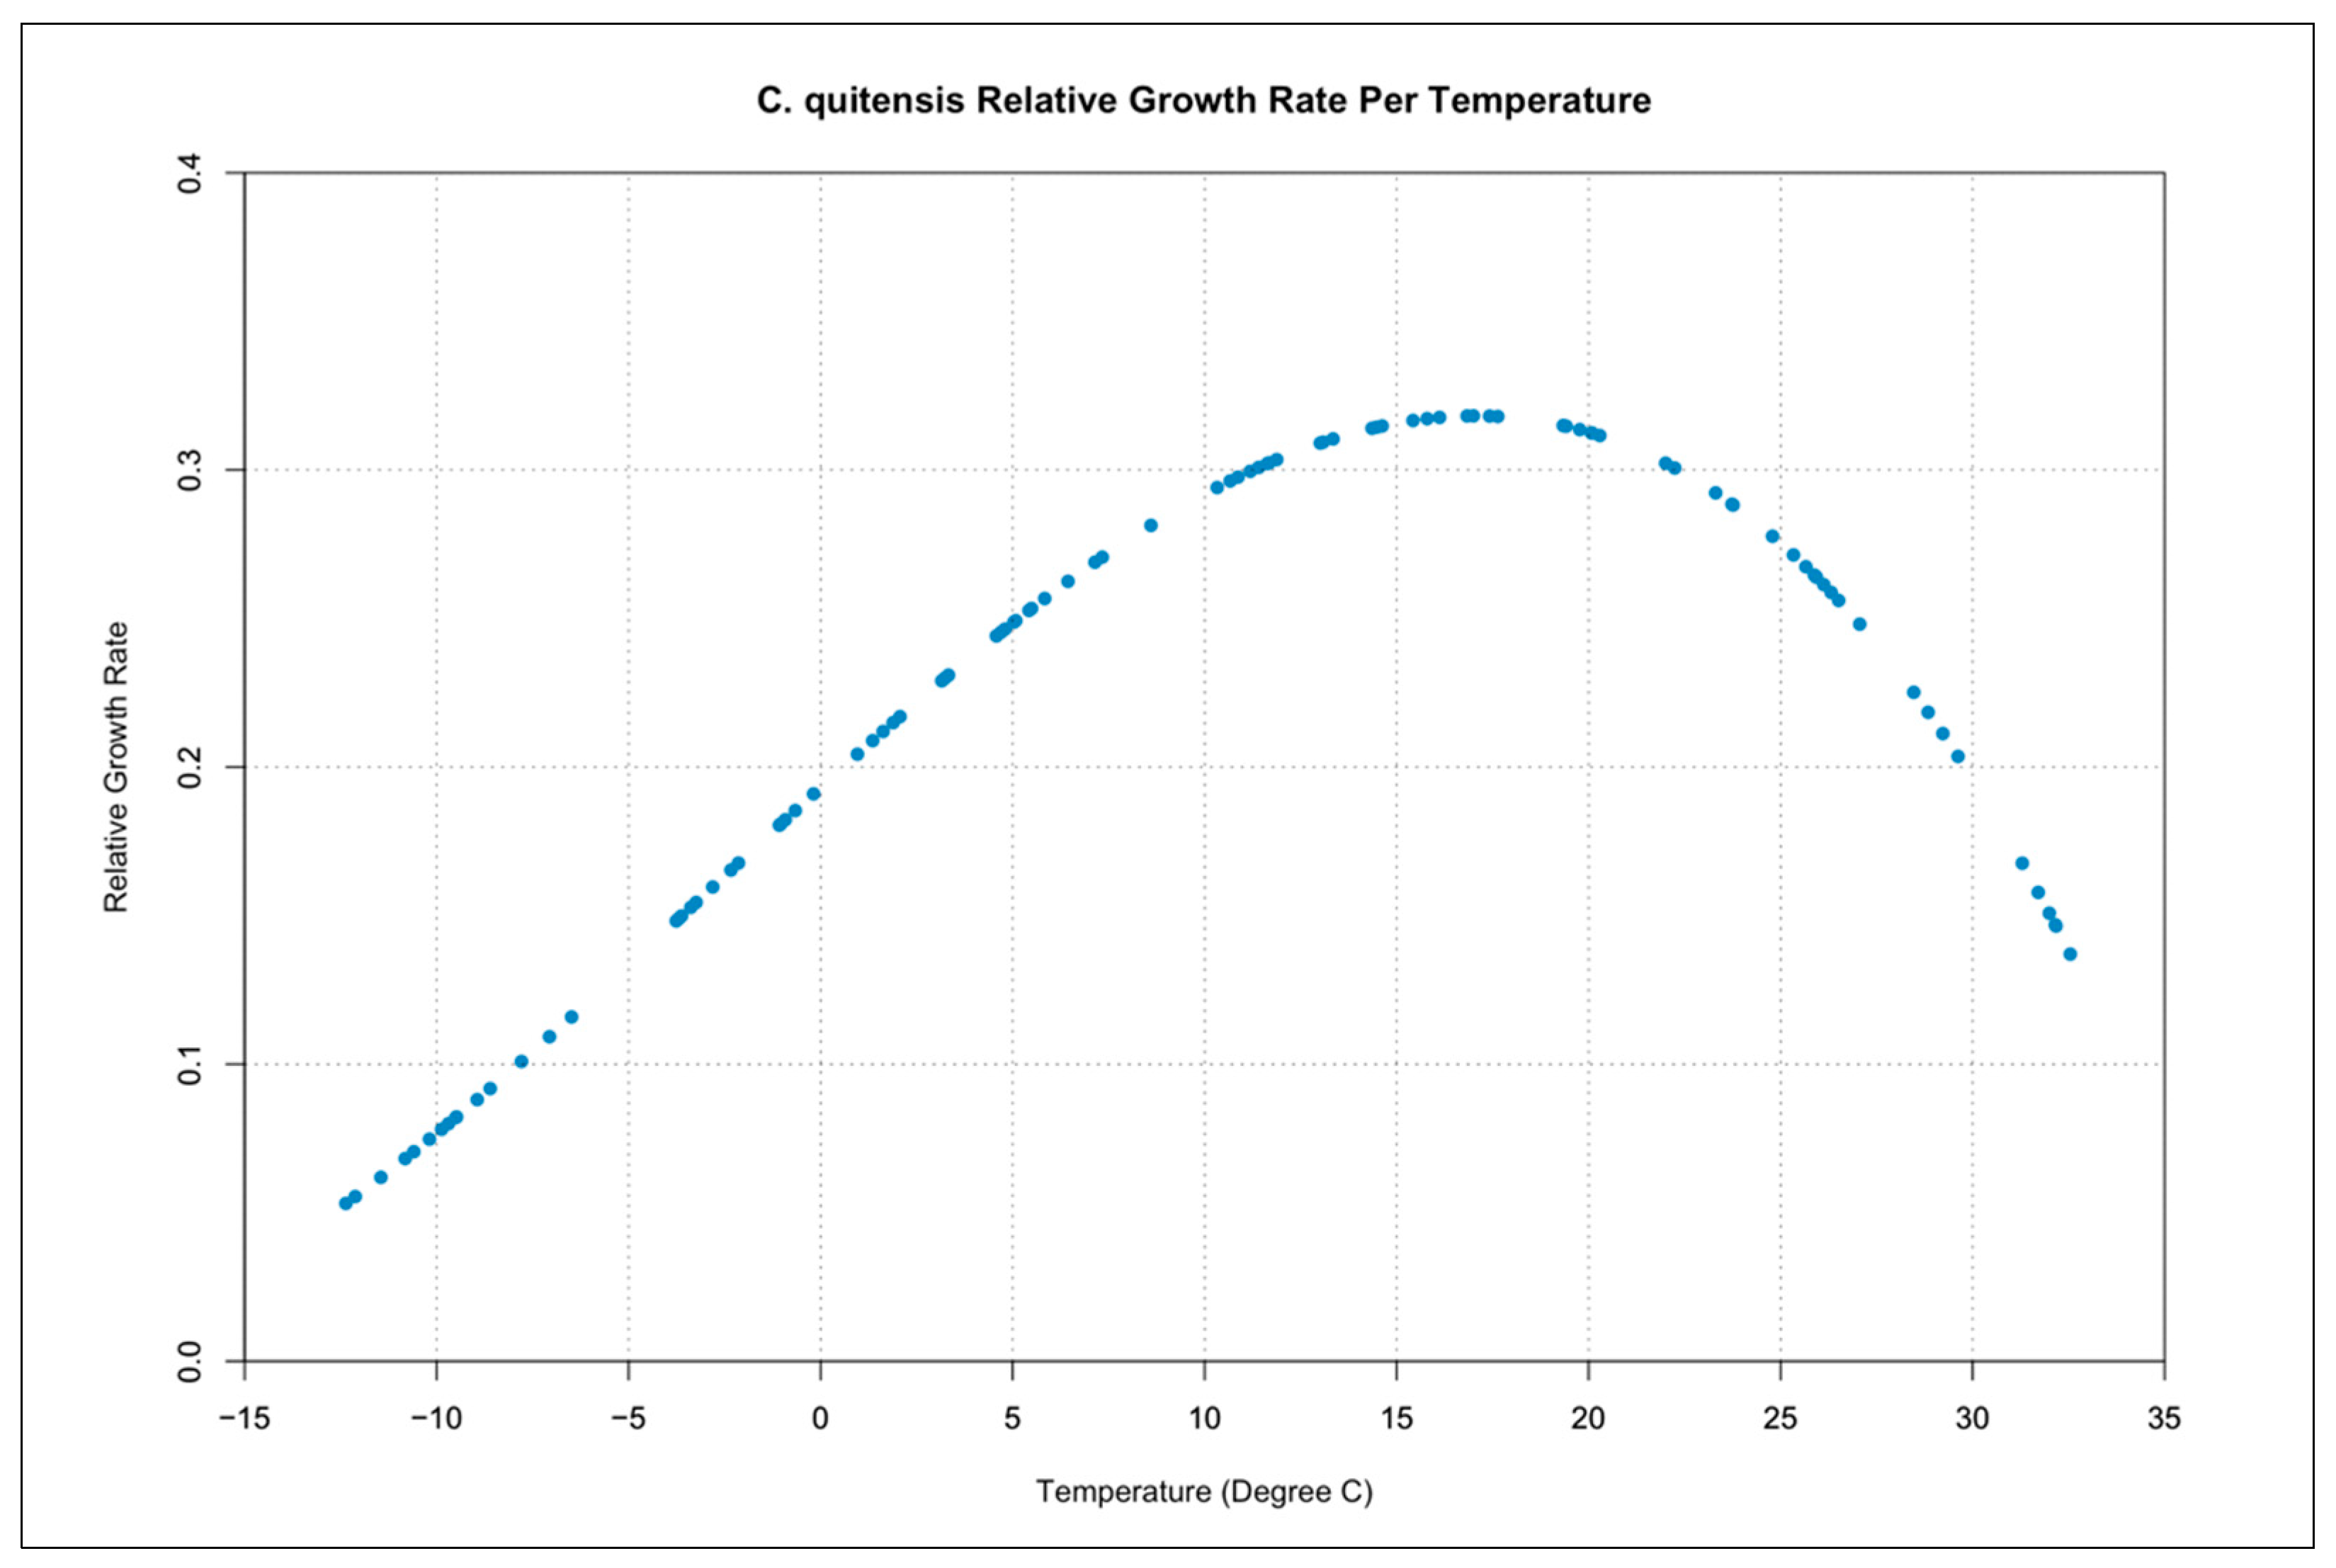
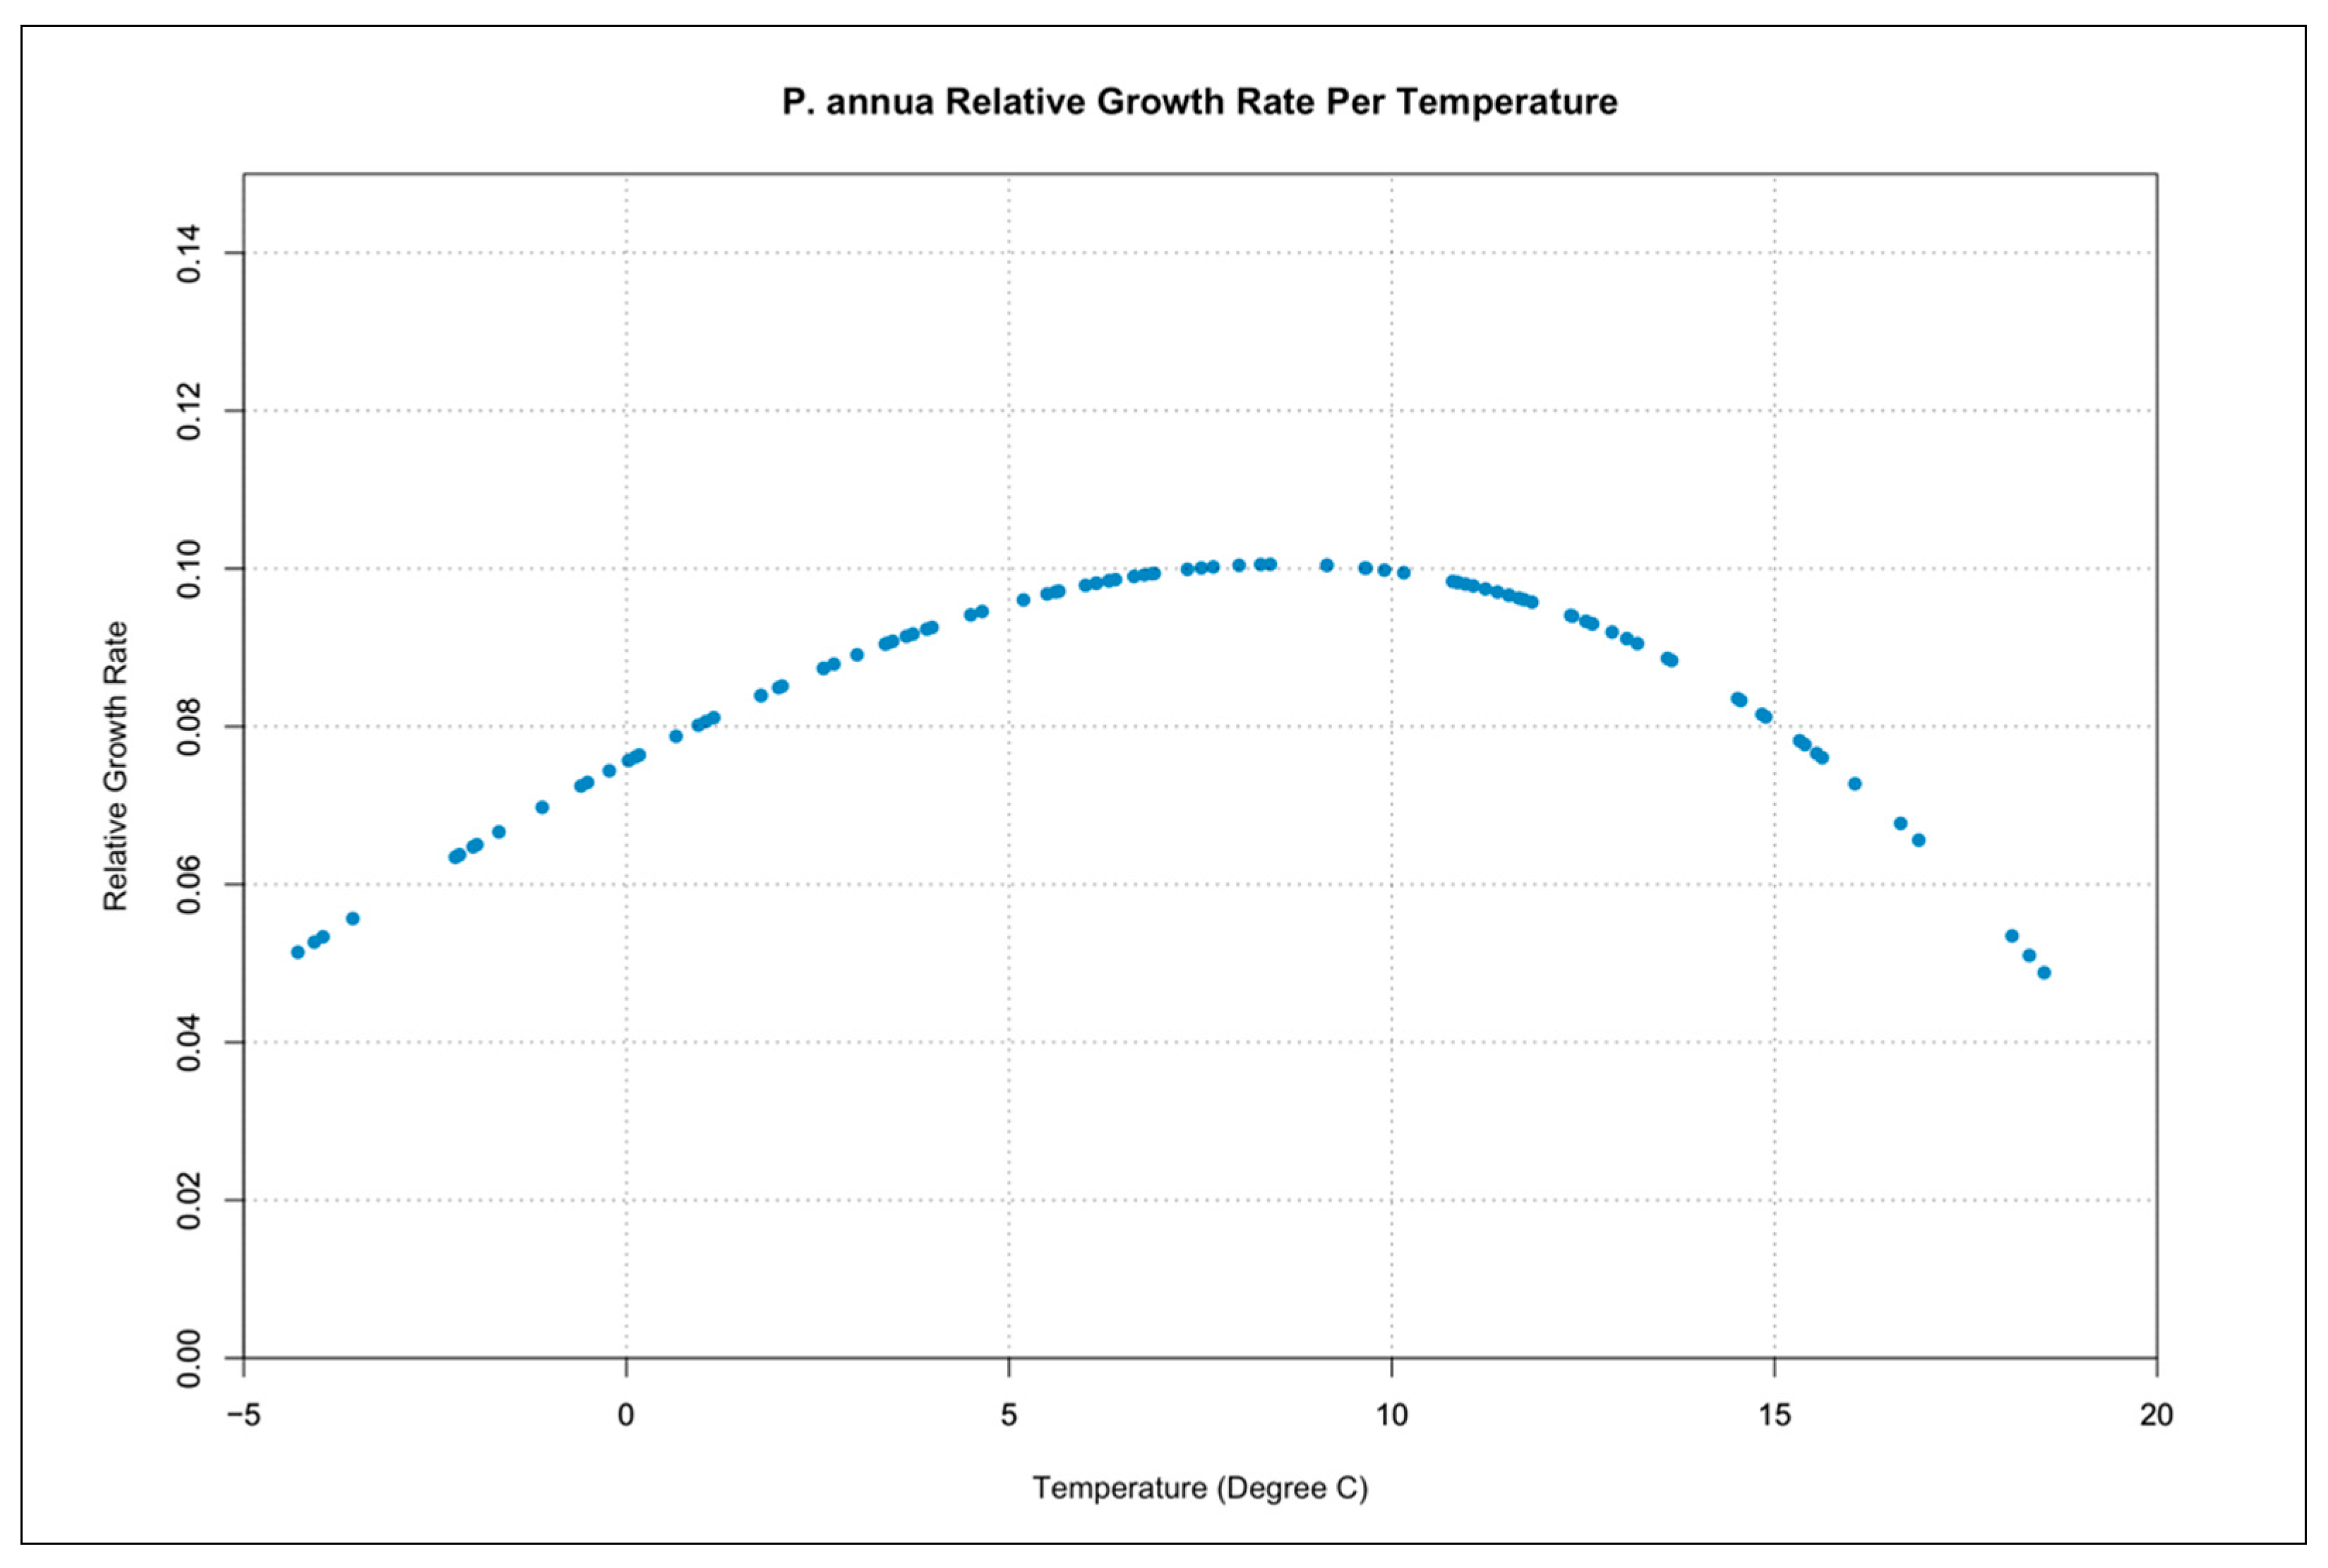
3.3. Relative Growth Rate per Temperature Curves

Figure 10, Figure 11 and Figure 12 show the relative growth rate per temperature curves of D. antarctica, C. quitensis, and P. annua based on the dataset included in this study. The relative growth rates are described in the state variable equations which were adapted from the polynome developed by van der Heide et al. (2006). These figures show the optimal temperature for all three species and were created by plotting the model simulated relative growth rates over the temperature. It should be noted that the temperature increase RAMP values included in the 0.0 °C increase, 1.6 °C increase, and 5.0 °C increase simulations were not high enough to produce the growth curves shown in these figures. To produce these figures the model was run again with under a 20 °C increase simulation. This was done to illustrate the full theoretical relative growth rate per temperature curves, not to suggest that a 20 °C surface temperature increase over a 100-year period is a plausible reality.
Figure 10 shows the relative growth rate per temperature for D. antarctica, which illustrates that the relative growth rate of D. antarctica increases from −15 °C to 8 °C where it reaches the optimal relative growth rate of 0.179 at a temperature of 8 °C. From 9 °C to 21 °C the optimal relative growth rate temperature declines. Figure 11 shows the relative growth rate per temperature for C. quitensis, which illustrates that the relative growth rate of C. quitensis increases from −13 °C to 18 °C where it reaches the optimal relative growth rate of 0.32 at a temperature of 18 °C. From 19 °C to 33 °C the optimal relative growth rate temperature declines. Figure 12 shows the relative growth rate per temperature for P. annua, which illustrates that the relative growth rate of P. annua increases from −5 °C to 8 °C where it reaches the optimal relative growth rate of 0.101 at a temperature of 8 °C. From 9 °C to 19 °C the optimal relative growth rate temperature declines. An important finding illustrated in these figures is that P. annua has a lower relative growth rate peak compared to D. antarctica and C. quitensis. Additionally, this peak is reached at a lower temperature than the C. quitensis peak and the same temperature as the D. antarctica peak. This indicates that more extreme warming in the Antarctic Peninsula and surrounding islands could give D. antarctica and C. quitensis an advantage over P. annua.

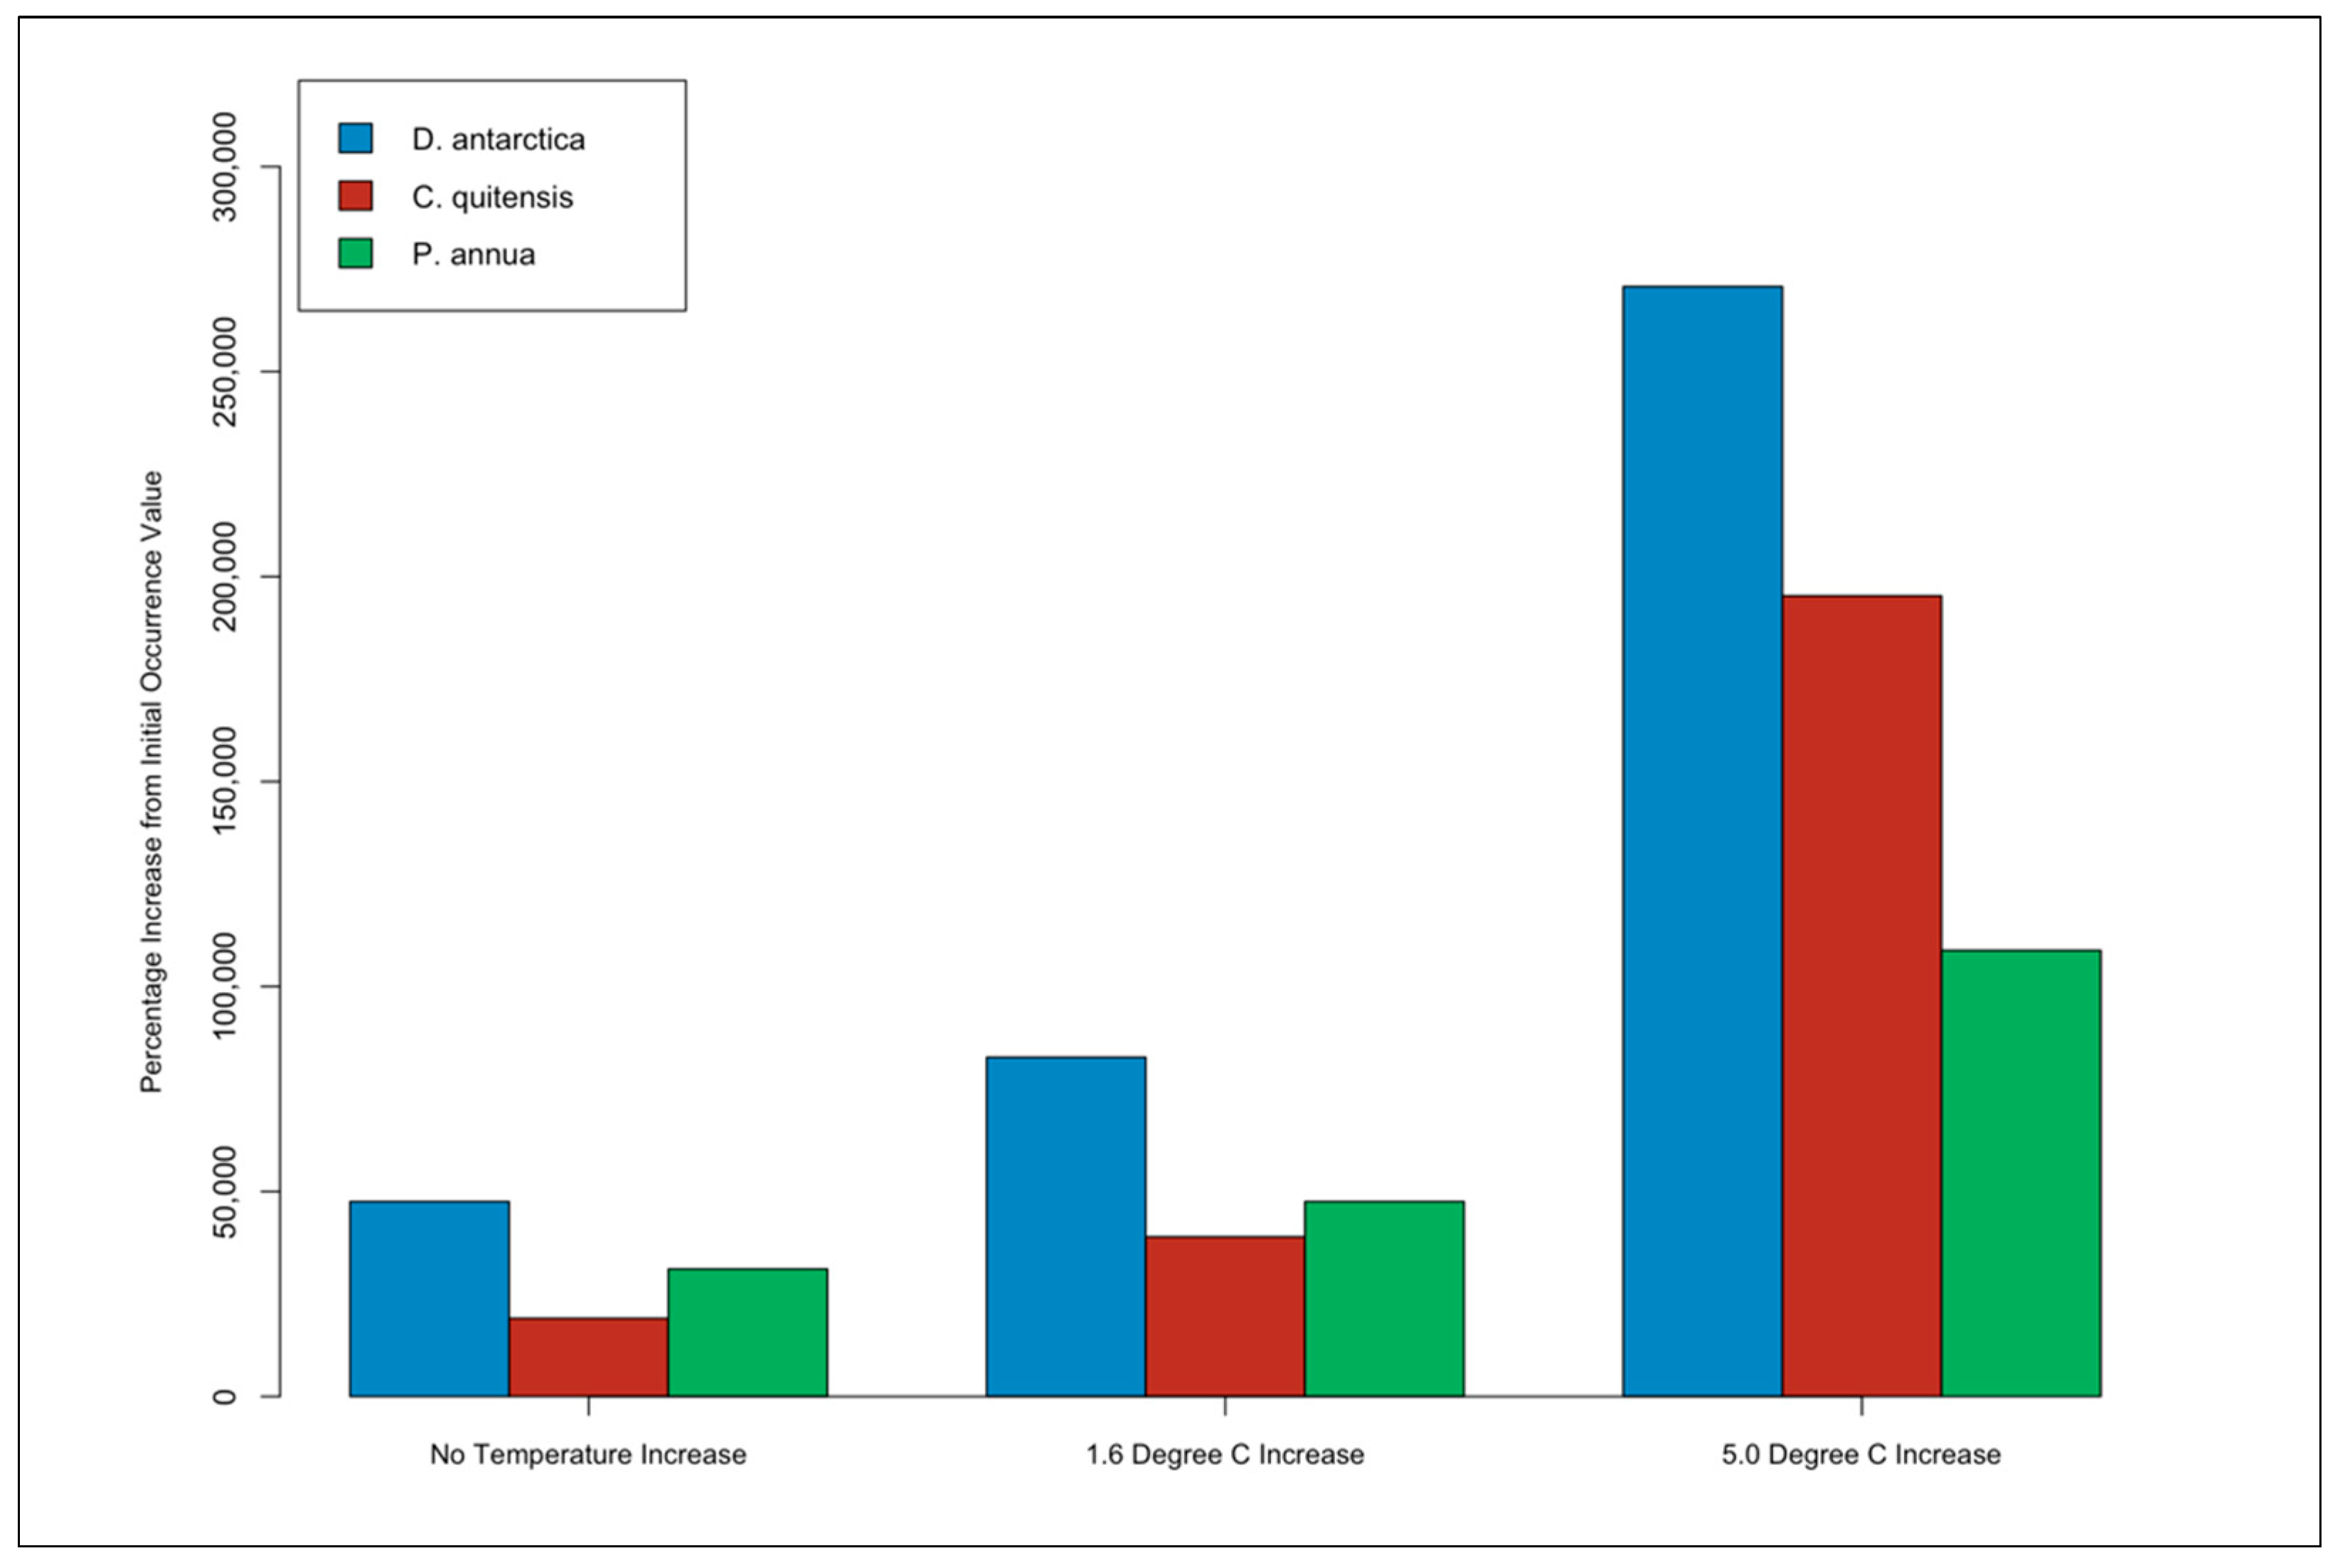
3.4. Species Occurrence Percentage Increase

Figure 13 shows the percentage increase of species occurrences from initial occurrence values to the highest occurrence value for each simulation. This figure was included because the initial occurrence values included in the model for each vegetation species were based on real world georeferenced recordings of each species and were therefore not the same. The D. antarctica, C. quitensis, and P. annua occurrence values were 30, 15, and 13, respectively. This figure shows that in all three simulations D. antarctica occurrences increase to higher values than P. annua and C. quitensis, relative to the initial number of species occurrences. In the no temperature change and 1.6 °C increase simulations P. annua occurrences increase to higher values than C. quitensis, and in the 5.0 °C increase simulation C. quitensis occurrences increase to higher values than P. annua.

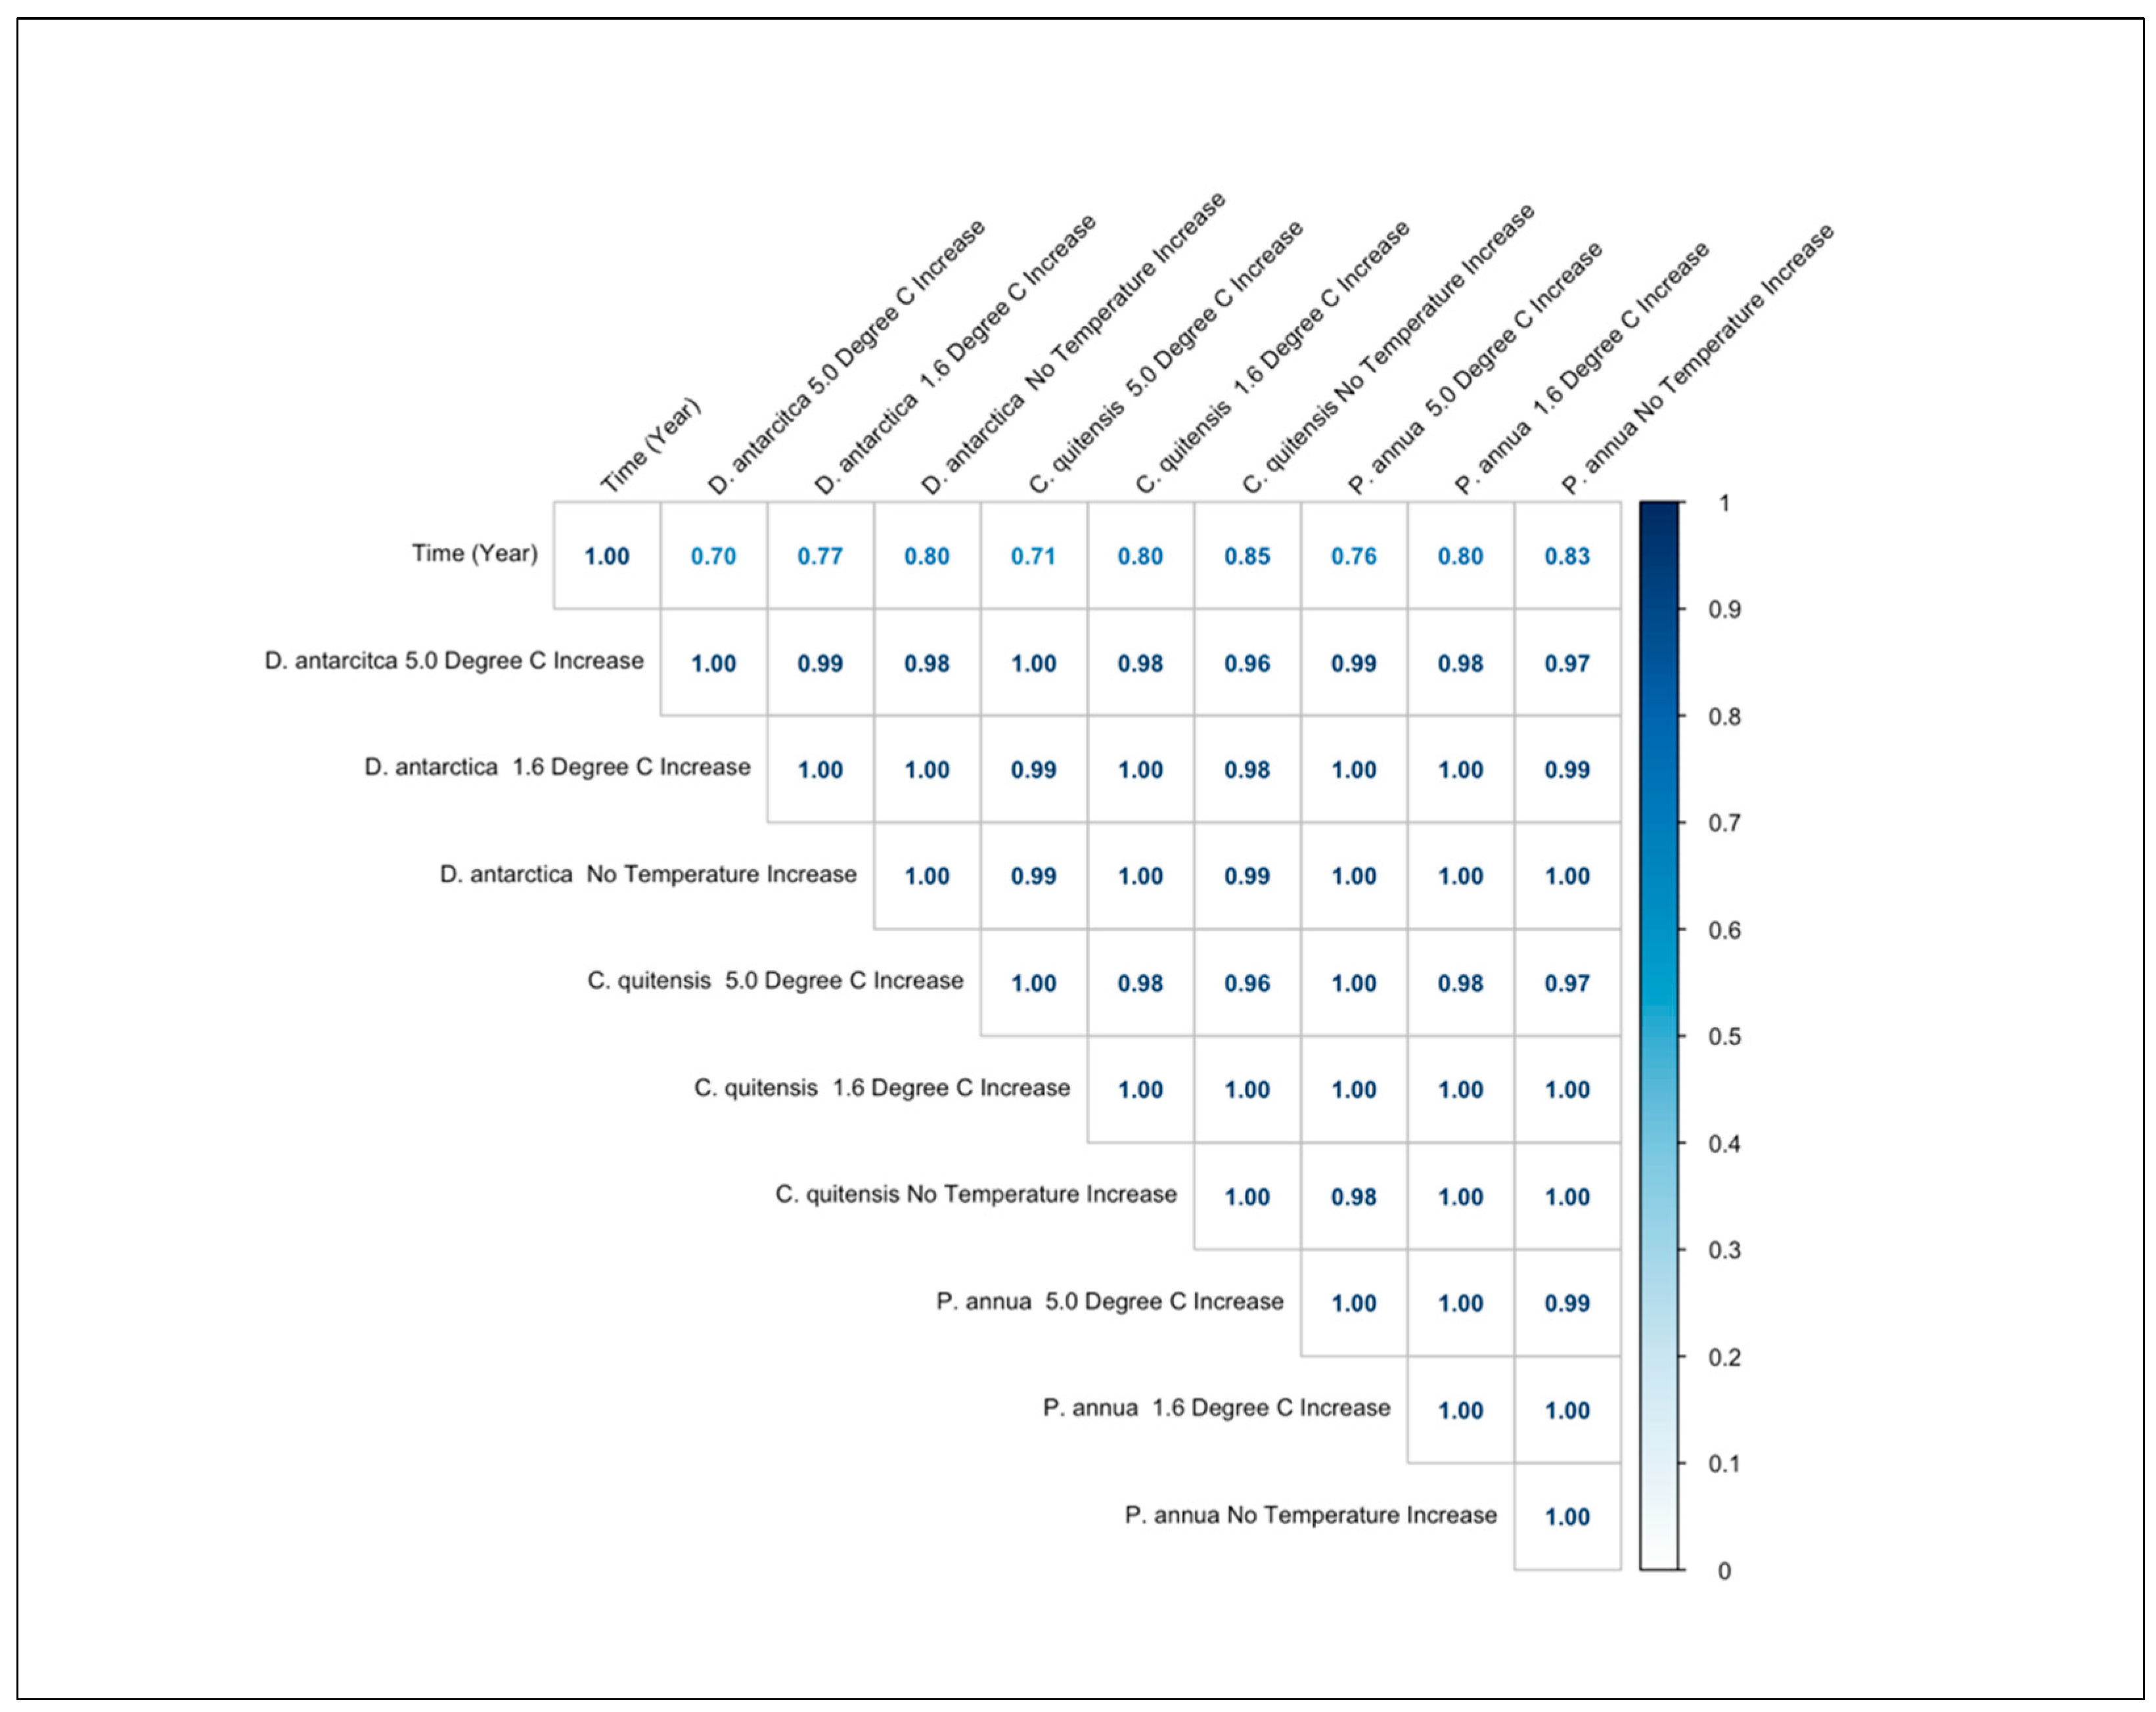
3.5. Correlation Coefficients of the Species Occurrence Values

Figure 14 shows the correlation coefficients between all of the species’ occurrence values throughout each of the climate change simulations. This figure has been included to verify the correlations between the variables and it shows that there is a strong positive correlation between all of the species occurrence variables in each simulation. Additionally, there is a fairly strong positive correlation between all of the species’ occurrence values over time.

4. Discussion

The results of this study show four important findings; (1) D. antarctica, C. quitensis, and P. annua are presently capable of living in extreme environments with low temperatures during the growing seasons, and the number of their occurrences will likely increase with warming temperatures; (2) in all scenarios D. antarctica species occurrences increase to higher values compared to C. quitensis and P. annua, suggesting that D. antarctica populations may be more successful at expanding into newly forming ice-free areas, (3) C. quitensis may be more vulnerable to the spread of P. annua than D. antarctica if less extreme warming occurs, and (4) C. quitensis relative growth rate is capable of reaching higher values than D. antarctica and P. annua, but only under extreme warming conditions.
D. antarctica and C. quitensis are the only vascular plants found on the Antarctic Peninsula and surrounding islands that are native to the continent [8]. The introduction of invasive species is connected to the movement of humans to this region, and the introduction of the invasive vascular plant species P. annua is posing a threat to the native vascular vegetation [38]. The authors of a 2015 study argue that appropriate management of invasive species in Antarctica requires evidence that the invasive species pose a threat to native species [39]. Additionally, authors of a 2017 study argue that based on the current spread of P. annua, the eradication of this invasive species is still a realistic goal [40].
Climate change is increasingly impacting the Antarctic Peninsula and improving the success of invasive vegetation species colonizing new areas [41]. Additionally, the increasing temperatures associated with climate change are causing accelerated widespread melting of terrestrial ice, allowing for newly formed ice-free areas for vegetation to colonize [2,3,4]. The expansion of D. antarctica and C. quitensis has recently accelerated and this acceleration is likely linked to warming air in the summer months [42].
The results of this study show that different climate change scenarios have the potential to impact the occurrence increase rate of the species D. antarctica, C. quitensis and P. annua. Species occurrences increased in all three simulations, with generally, higher occurrence increase values in the warmer temperature simulations. The simulation with no temperature increase led to comparatively higher occurrence values of D. antarctica and comparatively lower values of C. quitensis. The simulation with 1.6 °C increase led to comparatively higher occurrence values of D. antarctica and oscillating C. quitensis and P. annua values throughout the simulation, with higher values of P. annua by the end of the simulation. The simulation with 5.0 °C increase, led to comparatively higher occurrence values of D. antarctica and comparatively lower values of P. annua. Relative to the initial number of species occurrences, D. antarctica occurrences increase to higher values compared to C. quitensis and P. annua in all three simulations, and P. annua occurrences increase to higher values compared to C. quitensis in the no temperature change and 1.6 °C increase simulations. These finding align with the results of a study by Singh and others (2018) who use several studies [43,44,45] to argue that D. antarctica increases species abundance at much faster rates (25-fold increase) compared to C. quitensis (5-fold increase) over a 26-year period [46]. The results of all three model simulations indicate that D. antarctica may be more successful at populating new areas and/or maintaining populations under a variety of climate change scenarios.
The relative growth rate per temperature figures show that C. quitensis reaches a higher optimal relative growth rate than D. antarctica and P. annua, and this higher relative growth rate is reached at a warmer temperature. This result is consistent with findings of a 2017 study, which showed that warmer temperatures had a positive influence on the germination rates of C. quitensis and that the propagation of C. quitensis would increase with climate change [47]. This study result suggests that C. quitensis could be highly successful under extreme climate change warming and could become capable of populating newly forming ice free areas more quickly than D. antarctica and P. annua in this scenario. Warming temperatures, coupled with increased water availability, affect the growth C. quitensis by increasing the number of leaves produced by the plant which increases net photosynthesis [48]. More extreme warming will also facilitate the release of more liquid water from ice and snow, allowing for C. quitensis to achieve high relative growth rates [49].
The results of this study indicate that the vascular vegetation in this region will likely respond to increasing temperatures associated with climate change with accelerated population spreading into newly forming ice-free areas as climate change scenarios become more extreme. The competition between P. annua and native species like D. antarctica and C. quitensis will also likely be more pronounced in newly forming ice-free areas as warming temperatures associated with climate change progress. There is evidence that recorded changes in vegetation cover in the Antarctic peninsula have been more pronounced in areas with low vegetation cover. This is because vegetation is more easily able to move into, and colonize these areas compared to locations with established vegetation cover [50]. The results of this study also suggest that P. annua populations may be able to increase at faster rates than C. quitensis in no warming and less extreme warming simulations if the initial numbers of both species in a local area are similar. This is a concerning finding as it indicates that communities of P. annua may be able to out compete C. quitensis as the extent of ice-free areas increases. This problem may be exacerbated under the more realistic 1.6 °C warming (compared to the no temperature increase) due to the increased extent of ice-free areas. Additionally, although P. annua occurrences do not increase as rapidly in the 5.0 °C warming scenario, this species is still capable of occupying significant space that could otherwise be occupied by native plants.
Vegetation in the Antarctic peninsula will need to adapt to the complex changes associated with climate change. Warming temperatures may facilitate faster colonization of non-native species, vegetation population expansion, increasing biomass, vegetation diversity and changes in ecosystem structures [46]. P. annua has the potential to threaten D. antarctica and C. quitensis populations; the seeds of P. annua have been shown to germinate at least as rapidly as D. antarctica and C. quitensis and can survive the winter in the maritime Antarctic [51]. It has also been shown that P. annua is able to grow in natural conditions on at least one island in the maritime Antarctic, Signy Island [52,53]. Another challenge that D. antarctica and C. quitensis may face with increasing temperatures is increasing vulnerability to freezing temperatures. These native species are currently well adapted to the extreme cold temperatures found along the Antarctic peninsula. However, it has been demonstrated that under warming scenarios, these plants experienced varying degrees of freezing damage when exposed to freezing temperature events during their growing season. It is suggested that the vulnerability to freezing damage will be heightened with increasing ambient temperatures [54].
This study has identified some limitations and important new research avenues. First, vegetation occurrence points do not represent entire populations of the vascular plant species in this study. Second, this study has only measured vascular vegetation response to increasing temperatures at a regional level and did not include other variables that may influence species occurrence increases or decreases such as water availability, soil composition and UVB (ultraviolet type B) radiation. It is recommended that as more data becomes available, future studies build on this model to increase the model complexity and explore additional climate change driven variables that impact vegetation variation, for example, water availability and hydrologic connectivity [55], and changes in soil composition [56]. Third, the empirical scaling constant used in the relative growth rate equation was set to 1 × 10⁻⁵. This value does not necessarily represent a real-world relative growth rate scaling constant that could be applied to D. antarctica, C. quitensis and P. annua population growth. As previously mentioned, this value was selected to mimic the empirical scaling constants used by der Heide et al. (2006). A smaller scaling value was selected due to the low temperatures and ice-free areas which would limit the expansion of the Antarctic vegetation. Additionally, the same empirical scaling constant was set for all three species because the goal of this study was to explore the interactions of the different species relative growth rates based on identified and preferred temperature ranges. Finally, the relative growth rate per temperature curves are based on a real-world sample dataset used in this study. Due to the cold temperatures found on the Antarctic Peninsula, this dataset may not provide a completely accurate depiction of the optimal growth temperatures for D. antarctica, C. quitensis and P. annua. These species may show different optimal growth temperatures in a lab setting. The purpose of including the growth rate per temperature curves was not to define the optimal growth temperatures for these species, but rather to show the interactions between the species theoretical optimal temperatures. As ice melt continues new landscapes will be uncovered and it will be important to understand how these new landscapes will be occupied by vegetation communities. Temperature will be an important component of vegetation expansion and this factor should be included in future studies. The predictions presented in this study could be further refined by applying the by der Heide et al. (2006) polynome to vegetation in a lab setting.

5. Conclusions

Climate change is already impacting vegetation communities in the Antarctic Peninsula and surrounding islands, and projected temperature increase associated with climate change has the potential to alter the communities of vascular vegetation in this region. As terrestrial ice is melting at an accelerated rate, vegetation is moving into these newly forming ice-free areas and the likelihood of invasive species being more successful than native vegetation in colonizing these areas is largely unknown [1].
The only vascular plants that are native to the Antarctic Peninsula and surrounding islands are D. antarctica and C. quitensis [8] and the expansion of P. annua in this region will likely impact the species abundance of D. antarctica and C. quitensis. As the region warms and ice-free areas become more abundant, D. antarctica and C. quitensis will be competing directly with P. annua to colonize the newly forming ice free [11].
The purpose of this study was to use GIS and systems modelling to explore the relationship between vascular vegetation species occurrences and changing temperature in the Antarctic Peninsula, and to use a systems modelling approach to account for the impacts of three climate change scenarios on vascular vegetation occurrences over a 100-year period. The results of this study indicate that D. antarctica, C. quitensis and P. annua species occurrences have the potential to be impacted by temperature change associated with climate change, and that more extreme temperature increases will have a more profound impact on the increase in species occurrences. In all scenarios D. antarctica occurrences increase to higher values compared to C. quitensis and P. annua. C. quitensis may be more vulnerable to the spread of P. annua than D. antarctica if no warming or moderate warming occurs. Finally, C. quitensis’ relative growth rate is capable of reaching higher values than D. antarctica and P. annua, but only under extreme warming conditions.
Efforts to (1) eradicate the existing species of P. annua, and (2) prevent the introduction of additional P. annua specimens are imperative for ensuring the success of the native species D. antarctica and C. quitensis. The Antarctic is one of the last remaining parts of the earth that is considered a true wilderness area and it is vital that this area be protected from the impacts of both invasive species and climate change [14].

Supplementary Materials

The following supporting information can be downloaded at: https://www.mdpi.com/article/10.3390/geomatics2040022/s1, The model used in this study was developed in Vensim (Vensim, 2015). The Vensim mdl file has been included as a supplementary file. Figure 4, Figure 5, Figure 6, Figure 7, Figure 8, Figure 9, Figure 10, Figure 11, Figure 12, Figure 13 and Figure 14 were generated with the results of the Vensim model in R (R Core Team, 2020). Map production and GIS analysis was completed in QGIS 3.14 (QGIS.org, 2019).

Author Contributions

Conceptualization, E.P.; methodology, E.P. and C.W.; software, E.P. and C.W.; validation, E.P. and C.W.; formal analysis, E.P. and C.W.; investigation, E.P.; resources, E.P. and C.W.; data curation, E.P.; writing—original draft preparation, E.P.; writing—review and editing, E.P., C.W. and E.V.; visualization, E.P.; supervision, C.W. and E.V.; project administration, E.P. and C.W.; funding acquisition, not applicable. All authors have read and agreed to the published version of the manuscript.

Funding

This research received no external funding.

Institutional Review Board Statement

Not applicable.

Informed Consent Statement

Not applicable.

Data Availability Statement

The Global Biodiversity Information Facility dataset is compiled by the Global Biodiversity Information Facility (GBIF), the dataset used in this study was refined from GBIF by filtering vegetation on the Antarctic Peninsula and surrounding islands with the geometry filter. The dataset can be retrieved from https://www.gbif.org/ (accessed on 25 May 2022), the DOI for the retrieved dataset is https://doi.org/10.15468/dl.pcmgrn (accessed on 25 May 2022). Additional Poa annua georeferenced observations were retrieved from studies conducted by Molina-Montenegro and others (2012) and Chewedorzewska and others (2015). The Molina-Montenegro and others (2012) study can be retrieved from https://doi.org/10.1111/j.1523-1739.2012.01865.x (accessed on 27 May 2022). The Chewedorzewska and others (2015) study can be retrieved from https://doi.org/10.1017/S0032247414000916 (accessed on 27 May 2022). The NASA Earth Observations Land Surface Temperature (Day and Night) and Land Surface Temperature Anomaly (Day and Night) datasets are produced by NASA (National Aeronautics and Space Administration). The datasets can be retrieved from https://neo.gsfc.nasa.gov/ (accessed on 25 May 2022).

Conflicts of Interest

The authors declare no conflict of interest.

Appendix A. Descriptive Values of Model Parameters

DescriptionSymbolModel ValueOriginal Temperature ValuesUnits
D. antarcticaAverage Temperature DayDAvgTempD15.944−9.006Degree Celsius
D. antarcticaAverage Temperature NightDAvgTempN12.972−12.028Degree Celsius
C. quitensisAverage Temperature DayCAvgTempD19.211−5.789Degree Celsius
C. quitensisAverage Temperature NightCAvgTempN5.336−19.664Degree Celsius
P. annuaAverage Temperature DayPAvgTempD25.8730.873Degree Celsius
P. annuaAverage Temperature NightPAvgTempN17.224−7.776Degree Celsius
D. antarcticaMinimum Recorded TemperatureDTmin1.648−23.352Degree Celsius
D. antarcticaMaximum Germination TemperatureDTmax50.00025.000Degree Celsius
C. quitensisMinimum Recorded TemperatureCTmin4.121−20.879Degree Celsius
C. quitensisMaximum Germination TemperatureCTmax65.00037.000Degree Celsius
P. annuaMinimum Recorded TemperaturePTmin11.264−13.736Degree Celsius
P. annuaMaximum Germination TemperaturePTmax67.00022.000Degree Celsius
D. antarcticaOccurrence Initial Value D θ 30 Species Occurrences
C. quitensisOccurrence Initial Value C θ 15 Species Occurrences
P. annuaOccurrence Initial Value P θ 13 Species Occurrences
D. antarcticaLand Surface Temperature Anomaly Day Minimum λ Min −11.388 Degree Celsius
D. antarcticaLand Surface Temperature Anomaly Day Maximum λ Max 6.400 Degree Celsius
D. antarcticaLand Surface Temperature Anomaly Day Seed λ Seed 10
D. antarcticaLand Surface Temperature Anomaly Night Minimum μ Min −6.024 Degree Celsius
D. antarcticaLand Surface Temperature Anomaly Night Maximum μ Max 8.941 Degree Celsius
D. antarcticaLand Surface Temperature Anomaly Night Seed μ Seed 10
C. quitensisLand Surface Temperature Anomaly Day Minimum ο Min −4.424 Degree Celsius
C. quitensisLand Surface Temperature Anomaly Day Maximum ο Max 6.588 Degree Celsius
C. quitensisLand Surface Temperature Anomaly Day Seed ο Seed 10
C. quitensisLand Surface Temperature Anomaly Night Minimum ϵ Min −3.012 Degree Celsius
C. quitensisLand Surface Temperature Anomaly Night Maximum ϵ Max 3.388 Degree Celsius
C. quitensisLand Surface Temperature Anomaly Night Seed ϵ Seed 10
P. annuaLand Surface Temperature Anomaly Day Minimum φ Min −2.447 Degree Celsius
P. annuaLand Surface Temperature Anomaly Day Maximum φ Max 6.871 Degree Celsius
P. annuaLand Surface Temperature Anomaly Day Seed φ Seed 10
P. annuaLand Surface Temperature Anomaly Night Minimum ϕ Min −2.353 Degree Celsius
P. annuaLand Surface Temperature Anomaly Night Maximum ϕ Max 0.753 Degree Celsius
P. annuaLand Surface Temperature Anomaly Night Seed ϕ Seed 10
Empirical Scaling Constantc1 × 10−5
Temperature Increase Rate 1 τ 1 0.016 Temperature
/Year
Temperature Increase Rate 2 τ 2 0.05 Temperature/Year
Timet Year

References

  1. Lee, J.R.; Raymond, B.; Bracegirdle, T.J.; Chades, I.; Fuller, R.A.; Shaw, J.D.; Terauds, A. Climate changes drives expansion of Antarctic ice-free habitat. Nature 2017, 547, 49–57. [Google Scholar] [CrossRef] [PubMed]
  2. Wouters, B.; Martin-Español, A.; Helm, V.; Flament, T.; van Wessem, J.M.; Ligtenberg, S.R.M.; van der Broeke, M.R.; Bamber, J.L. Dynamic thinning of glaciers on the Southern Antarctic Peninsula. Science 2015, 348, 899–903. [Google Scholar] [CrossRef] [PubMed]
  3. Shepherd, A.; Ivins, E.; Rignot, E.; Smith, B.; Van Den Broeke, M.; Velicogna, I.; Whitehouse, P.; Briggs, K.; Joughin, I.; Krinner, G.; et al. Mass balance of the Antarctic Ice Sheet from 1992 to 2017. Nature. 2018, 558, 219–222. [Google Scholar] [CrossRef]
  4. Rignot, E.; Mouginot, J.; Scheuchl, B.; van den Broeke, M.; van Wessem, M.J.; Morlighem, M. Four decades of Antarctic Ice Sheet mass balance from 1979–2017. Proc. Natl. Acad. Sci. USA 2019, 116, 1095–1103. [Google Scholar] [CrossRef]
  5. The Intergovernmental Panel on Climate Change. Available online: http://www.ipcc.ch (accessed on 18 August 2022).
  6. National Oceanic and Atmospheric Administration. Available online: https://www.climate.gov/news-features/understanding-climate/climate-change-global-temperature-projections (accessed on 14 September 2022).
  7. Siegert, M.; Atkinson, A.; Banwell, A.; Brandon, M.; Convey, P.; Davies, B.; Downie, R.; Edwards, T.; Hubbard, B.; Marshall, G.; et al. The Antarctic Peninsula under 1.5 °C global warming scenario. Front. Environ. Sci. 2019, 7, 1–7. [Google Scholar] [CrossRef]
  8. Torres-Diaz, C.; Gallardo-Cerda, J.; Lavin, P.; Oses, R.; Carrasco-Urra, F.; Atala, C.; Acuna-Rodriguez, I.S.; Convey, P.; Monina-Montenegro, M.A. Biological interactions and simulated climate change modulates the ecophysiological performance of Colobanthus quitensis in the Antarctic ecosystem. PLoS ONE 2016, 1, e0164844. [Google Scholar] [CrossRef]
  9. British Antarctic Survey Natural Environmental Research Council. Available online: https://www.bas.ac.uk/about/antarctica/wildlife/plants/ (accessed on 15 September 2022).
  10. The Center for Agriculture and Bioscience International Invasive Species Compendium. Available online: https://www.cabi.org/isc/datasheet/42485 (accessed on 15 September 2022).
  11. Molina-Montenegro, M.A.; Carrasco-Urra, F.; Rodrigo, C.; Convey, P.; Valladares, F.; Gianoli, E. Occurrence of the non-native annual bluegrass on the Antarctic mainland and its negative effects on native plants. Conserv. Biol. 2012, 26, 717–723. [Google Scholar] [CrossRef]
  12. Vera, M.L. Colonization and demographic structure of Deschampsia antarctica and Colobanthus quitensis along an altitudinal gradient on Living- ston Island, South Shetland Islands, Antarctica. Polar Res. 2011, 1, 1–10. [Google Scholar] [CrossRef]
  13. Cavieres, L.A.; Sanhueza, A.K.; Torres-Mellado, G.; Casanova-Katny, A. Competition between native Antarctic vascular plants and invasive Poa annua changes with temperature and soil nitrogen availability. Biol. Invasions. 2018, 20, 1597–1610. [Google Scholar] [CrossRef]
  14. Molina-Montenegro, M.A.; Bergstrom, D.M.; Chewedorzewska, D.M.; Katerzyna, J.; Convey, P.; Chown, S.L. Increasing impacts by Antarctica’s most widespread invasive plant species as result of direct competition with native vascular plants. NeoBiota. 2019, 51, 19–40. [Google Scholar] [CrossRef]
  15. Atala, C.; Pertierra, L.R.; Aragon, P.; Carrasco-Urra, F.; Lavin, P.; Gallardo-Cerda, J.; Ricote-Martinezm, N.; Torres-Diaz, C.; Molina-Montenegro, M.A. Positive interactions among native and invasive vascular plants in Antarctica: Assessing the “nurse effect” at different spatial scales. Biol. Invasions. 2019, 21, 2819–2836. [Google Scholar] [CrossRef]
  16. Scheiter, S.; Higgins, S.I. Impacts of climate change on the vegetation of Africa: An adaptive dynamic vegetation modelling approach. Glob. Change Biol. 2009, 15, 2224–2246. [Google Scholar] [CrossRef]
  17. Goufan, S. Potential impacts of climate change on mixed broadleaved-Korean pine forest stand: A gap model approach. Clim. Change. 1996, 34, 263–268. [Google Scholar] [CrossRef]
  18. Georgio, V.; Renzo, M. An improved species distribution model for Scots pine and downy oak under future climate change in the NW Italian Alps. Ann. For. Sci. 2014, 72, 321–334. [Google Scholar] [CrossRef]
  19. Kerns, B.; Peterson, D.W. An Overview of Vegetation Models for Climate Change Impacts. Available online: www.fs.usda.gov/ccrc/topics/overview-vegetation-models (accessed on 5 May 2022).
  20. Franklin, J. Species distribution models in conservation biogeography: Developments and challenges. Divers. Distrib. 2013, 19, 1217–1223. [Google Scholar] [CrossRef]
  21. De Souza Muñoz, M.E.; De Giovanni, R.; De Siqueira, M.F.; Sutton, T.; Brewer, P.; Pereira, R.S.; Canhos, D.A.L.; Canhos, V.P. openModeller: A generic approach to species’ potential distribution modelling. Geoinformatica 2011, 15, 111–135. [Google Scholar] [CrossRef]
  22. Vensim. Available online: https://vensim.com/ (accessed on 7 November 2019).
  23. Abadi, L.S.K.; Shamsai, A.; Goharnejad, H. An analysis of the sustainability of basin water resources using Vensim model. KSCE J. Civ. Eng. 2015, 19, 1941–1949. [Google Scholar] [CrossRef]
  24. Krupanidhi, S.; Sai, N.M.; Leung, H.; Kineman, J.J. The leaf as a sustainable and renewable system. Syst. Res. Behav. Sci. 2017, 34, 564–576. [Google Scholar] [CrossRef]
  25. Maani, K. Decision-making for climate change adaptation: A systems thinking approach. Natl. Clim. Change Adapt. Res. Facil. Gold Coast 2013, 66. [Google Scholar]
  26. Sardo, M.S.; Jalalkamaali, N. A system dynamic approach for reservoir impact assessment on groundwater aquifer considering climate change scenario. Groundw. Sustain. Dev. 2022, 17, 100754. [Google Scholar] [CrossRef]
  27. Carrera-Villacrés, D.V.; Quinteros-Carabelí, J.A.; Gómez, A.J.; Solano, E.M.; Llumiquinga, G.E.; Burgos, C.A. Dynamic model for the management of water resource and water aptitude for irrigation of the Togllahuayco gorge in the Guangopolo micro-basin. In Proceedings of the 5th International Conference of Water Resource and Environment (WRE 2019), Macao, China, 16–19 July 2019; IOP Publishing Ltd: Bristol, England, 2019. [Google Scholar] [CrossRef]
  28. Odadaa, E.O.; Ochola, W.O.; Olago, D.O. Understanding future ecosystem changes in Lake Victoria basin using participatory local scenarios. Afr. J. Ecol. 2009, 47, 147–153. [Google Scholar] [CrossRef]
  29. Roriz, P.A.C.; Yanai, A.M.; Fearnside, P.M. Deforestation and carbon loss in Southwest Amazonia: Impact of Brazil’s revised forest code. Environ. Manag. 2017, 60, 367–382. [Google Scholar] [CrossRef]
  30. Global Biodiversity Information Facility. Free and Open Access to Biodiversity Data. Available online: https://www.gbif.org/ (accessed on 25 May 2022). [CrossRef]
  31. Chwedorzewska, K.J.; Gielwaanowska, I.; Olech, M.; Molina-Montenegro, M.A.; Wódkiewicz, M.; Galera, H. Poa annua in the maritime Antarctic: An overview. Polar Rec. 2014, 51, 637–643. [Google Scholar] [CrossRef]
  32. NASA Earth Observations (NEO). Available online: https://neo.gsfc.nasa.gov/ (accessed on 25 May 2022).
  33. Quantum GIS. Available online: https://www.qgis.org (accessed on 19 June 2020).
  34. van der Heide, T.; Roijackers, R.M.M.; van Nes, E.H.; Peeters, T.H.M. A simple equation for describing the temperature dependent growth of free-floating macrophytes. Aquat. Bot. 2006, 84, 171–175. [Google Scholar] [CrossRef]
  35. Kellmann-sopya, W.; Giewanowska, I. Germination capacity of five polar Caryophyllaceae and Poaceae species under different temperature conditions. Polar Biol. 2015, 38, 1753–1765. [Google Scholar] [CrossRef]
  36. Carroll, D.E.; Brosnan, J.T.; Trigiano, R.T.; Horvath, B.J.; Shekoofa, A.; Mueller, T.C. Current understanding of the Poa annua life cycle. Crop Sci. 2021, 61, 1527–1537. [Google Scholar] [CrossRef]
  37. The R Project for Statistical Computing. Available online: https://www.R-project.org/ (accessed on 23 June 2020).
  38. Molina-Montenegro, M.A.; Pertierra, L.R.; Razeto-Barry, P.; Diaz, J.; Finot, V.L.; Torres-Diaz, C. A recolonization record of the invasive Poa annua in Paradise Bay, Antarctic Peninsula: Modeling of the potential spreading risk. Polar Biol. 2015, 38, 1091–1096. [Google Scholar] [CrossRef]
  39. Hughes, K.A.; Pertierra, L.R.; Molina-Montenegro, M.A.; Convey, P. Biological invasions in terrestrial Antarctica: What is the current status and can we respond? Biodivers. Conserv. 2015, 24, 1031–1055. [Google Scholar] [CrossRef]
  40. Galera, H.; Wódkiewicz, M.; Czyż, E.; Łapiński, S.; Elzbieta, M.; Pasik, M.; Rajner, M.; Bylina, P.; Chwedorzewska, K.J. First step to eradication of Poa annua L. from Point Thomas Oiasis (King George Island, South Shetlands, Antarctica). Polar Biol. 2017, 40, 939–945. [Google Scholar] [CrossRef] [Green Version]
  41. Frenot, Y.; Chown, S.L.; Whinam, J.; Selkirk, P.M.; Convey, P.; Skotnicki, M.; Bergstrom, D.M. Biological invasions in the Antarctic: Extent, impacts and implications. Biol. Rev. 2005, 80, 45–72. [Google Scholar] [CrossRef]
  42. Cannone, N.; Malfasi, F.; Favero-longo, S.E.; Guglielmin, M. Acceleration of climate warming and plant dynamics in Antarctica. Curr. Biol. 2022, 32, 1599–1606. [Google Scholar] [CrossRef] [PubMed]
  43. Fowbert, J.A.; Smith, R.I.L. Rapid population increase in native vascular plants in the Argentine Island, Antarctic Peninsula. Arct. Antarct. Alp. Res. 1994, 26, 290–296. [Google Scholar] [CrossRef]
  44. Smith, R.I.L. Signy Island as a paradigm of biological and environmental change in Antarctic terrestrial ecosystems. In Antarctic Ecosystems; Kerry, K.R., Hempel, G., Eds.; Springer: Berlin/Heidelberg, Germany, 1990; pp. 32–50. [Google Scholar] [CrossRef]
  45. Smith, R.I.L. Vascular plants as bioindicators of regional warming in Antarctica. Oecologia 1994, 99, 322–328. [Google Scholar] [CrossRef] [PubMed]
  46. Singh, J.; Singh, R.P.; Khare, R. Influence of climate change on Antarctic flora. Polar Sci. 2018, 18, 94–101. [Google Scholar] [CrossRef]
  47. Sanhueza, C.; Vallejos, V.; Cavieres, L.A.; Saez, P.; Bravo, L.A.; Corcuera, L.J. Growing temperature affects seed germination of the antarctic plant Colobanthus quitensis (Kunth) Bartl (Caryophyllaceae). Polar Biol. 2017, 40, 449–455. [Google Scholar] [CrossRef]
  48. Fuentes-Lilo, E.; Cuba-Diaz, M.; Rifo, S. Morfo-physiological response of Colobanthus quitensis and Juncus bufonius under different simulations of climate change. Polar Sci. 2017, 11, 11–18. [Google Scholar] [CrossRef]
  49. Convey, P.; Peck, L.S. Antarctic environmental change and biological responses. Sci. Adv. 2019, 5, eaaz0888. [Google Scholar] [CrossRef]
  50. Cannone, N.; Guglielmin, M.; Malfasi, F.; Hubberten, H.W.; Wagner, F. Rapid soil and vegetation changes at regional scale in continental Antarctica. Geoderma 2021, 394, 115017. [Google Scholar] [CrossRef]
  51. Wódkiewicz, M.; Chwedorzewska, K.J.; Bednarek, P.T.; Znór, A.; Androsiuk, P.; Galera, H. How much of the invader’s genetic variability can slip between our fingers? A case study of secondary dispersal of Poa annua on King George Island (Antarctica). Ecol. Evol. 2017, 8, 592–600. [Google Scholar] [CrossRef]
  52. Duffy, G.A.; Lee, J.R. Ice-free area expansion compounds the non-native species threat to Antarctic terrestrial biodiversity. Biol. Conserv. 2019, 232, 253–257. [Google Scholar] [CrossRef]
  53. Maalfasi, F.; Convey, P.; Zaccara, S.; Cannone, N. Establishment and eradication of an alien plant species in Antarctica: Poa annua at Signy Island. Biodivers. Conserv. 2019, 29, 173–186. [Google Scholar] [CrossRef]
  54. Sierra-Almeida, A.; Cavieres, L.A.; Bravo, L.A. Warmer temperatures affect the in situ freezing resistance of the Antarctic vascular plants. Front. Plant. Sci. 2018, 9, 1456. [Google Scholar] [CrossRef] [PubMed]
  55. Gooseff, M.N.; Wlostowski, A.; McKnight, D.M.; Jaros, C. Hydrologic connectivity and implications for ecosystem processes—Lessons from naked watersheds. Geomorphology 2017, 277, 63–71. [Google Scholar] [CrossRef]
  56. Prietzel, J.; Prater, I.; Hurtarte, L.C.C.; Hrbáček, F.; Klysubun, W.; Mueller, C.W. Site conditions and vegetation determine phosphorus and sulfer speciation in soils of Antarctica. Geochim. Cosmoshim. Acta 2019, 246, 339–362. [Google Scholar] [CrossRef]
Figure 1. Methodology Workflow Diagram.
Geomatics 02 00022 g001
Figure 2. Vegetation Occurrence Points of D. antarctica, C. quitensis and P. annua.
Geomatics 02 00022 g002
Figure 3. Model Diagram.
Geomatics 02 00022 g003
Figure 4. D. antarctica Occurrences Under No Temperature Increase, 1.6 °C Temperature Increase and 5.0 °C Temperature Increase Simulations (2022–2122).
Geomatics 02 00022 g004
Figure 5. C. quitensis Occurrences Under No Temperature Increase, 1.6 °C Temperature Increase and 5.0 °C Temperature Increase Simulations (2022–2122).
Geomatics 02 00022 g005
Figure 6. P. annua Occurrences Under No Temperature Increase, 1.6 °C Temperature Increase and 5.0 °C Temperature Increase Simulations (2022–2122).
Geomatics 02 00022 g006
Figure 7. D. antarctica, C. quitensis and P. annua Occurrences under No Temperature Change Simulation.
Geomatics 02 00022 g007
Figure 8. D. antarctica, C. quitensis and P. annua Occurrences under 1.6 °C Temperature Change Simulation.
Geomatics 02 00022 g008
Figure 9. D. antarctica, C. quitensis and P. annua Occurrences under 5.0 °C Temperature Change Simulation.
Geomatics 02 00022 g009
Figure 10. D. antarctica Relative Growth Rate Per Temperature.
Geomatics 02 00022 g010
Figure 11. C. quitensis Relative Growth Rate Per Temperature.
Geomatics 02 00022 g011
Figure 12. P. annua Relative Growth Rate Per Temperature.
Geomatics 02 00022 g012
Figure 13. D. antarctica, C. quitensis and P. annua Percentage Increases from Initial Occurrence Value.
Geomatics 02 00022 g013
Figure 14. D. antarctica, C. quitensis and P. annua Occurrence Value Correlation Coefficients.
Geomatics 02 00022 g014
Table 2. Model Parameter Definitions Used in the State Variable Equations and Descriptive Model Equations.
SymbolDescriptionUnits
xD. antarctica Relative Growth RateGrowth/year
ζ C. quitensis Relative Growth RateGrowth/year
κ P. annua Relative Growth RateGrowth/year
β D. antarctica Occurrence GrowthSpecies Occurrences
ψ C. quitensis Occurrence GrowthSpecies Occurrences
ϕ P. annua Occurrence GrowthSpecies Occurrences
dD. antarctica OccurrencesSpecies Occurrences
qC. quitensis OccurrencesSpecies Occurrences
pP. annua OccurrencesSpecies Occurrences
ε D. antarctica Land Surface Temperature Anomaly DayDegree Celsius
η D. antarctica Land Surface Temperature Anomaly NightDegree Celsius
ϱ C. quitensis Land Surface Temperature Anomaly DayDegree Celsius
σ C. quitensis Land Surface Temperature Anomaly NightDegree Celsius
ω P. annua Land Surface Temperature Anomaly DayDegree Celsius
ς P. annua Land Surface Temperature Anomaly NightDegree Celsius
γ D. antarctica Temperature Increase RateTemperature/Year
α C. quitensis Temperature Increase RateTemperature/Year
δ P. annua Temperature Increase RateTemperature/Year
ρ D. antarctica Ruling TemperatureDegree Celsius
ι C. quitensis Ruling TemperatureDegree Celsius
υ P. annua Ruling TemperatureDegree Celsius
Publisher’s Note: MDPI stays neutral with regard to jurisdictional claims in published maps and institutional affiliations.

