Abstract
This study compared physical activity (PA) intensity during leisure and recreation between youth with chronic pain with and without (overweight, obesity) healthy weight. Thirty youth with chronic pain, 11–19 years old, completed the Children’s Assessment of Participation and Enjoyment (CAPE), Functional Disability Inventory (FDI), and a Demographic and Participation Questionnaire. Metabolic equivalent of task (MET) values for CAPE activities were estimated. Youth in both groups reported moderate perceived disability in physical functioning due to pain and mostly participated in leisure and recreation at a low PA intensity. Mann–Whitney U and t-tests indicated that the number of activities performed at high, moderate, and low MET intensity levels did not differ between the two groups (p > 0.05). Perceived disability in physical functioning due to pain was not related to PA intensity (p > 0.05). Youth reported that pain, anxiety/stress, and not having time limited their PA intensity. The findings suggest that multiple factors are potential barriers to PA participation and intensity during leisure and recreation activities. Engagement with youth is encouraged to identify preferred PA at moderate to high intensity and integrate them into interventions and daily routines to promote a physically active lifestyle and reduce disability in physical functioning due to pain.
1. Introduction
Chronic pain is a health condition experienced by 20–44% of children and adolescents [1,2] with a higher prevalence in females [3,4]. Chronic pain is defined as pain experienced for more than 3 months. Chronic pain in youth is considered a moderately prevalent cause of functional disability [5]. When chronic pain persists or reoccurs in youth, it may cause physical and or emotional disability that impacts performance of daily activities, attendance at school, and quality of life [6,7,8]. Youth with chronic pain experience decreased participation in school and physical activities, impacting their quality of life and overall health [9] and are at increased risk of developing obesity [10].
Substantial evidence suggests that childhood obesity is associated with decreased physical function and body function impairments, suggesting that it is a disabling condition [11,12]. Obesity and limited physical activity intensity are risk factors associated with chronic health conditions, musculoskeletal impairments, and reduced quality of life [9]. Youth with obesity are at greater risk for cardiovascular disease, insulin resistance, type II diabetes, fatty liver disease, sleep apnea, osteoarthritis, psychosocial disorders, and severity of disability [1,2,13,14,15]. Participation in moderate to vigorous physical activity is a strong predictor for metabolic health in adolescents who are overweight/obese [16].
Decreased physical activity is associated with both chronic pain and obesity. The co-occurrence of these conditions perpetuates functional disability [12]. Santos et al. [9] found that higher Body Mass Index (BMI) was related to more perceived limitations in daily function due to pain when reported by parents but not when reported by youth with chronic pain. In a retrospective study of 118 youth (ages 8 to 18 years) with chronic pain, BMI was predictive of limitations in vigorous physical activity [10]. Being overweight/obese correlated with lower levels of youth participation in vigorous physical activity; furthermore, when controlling for sex and age, pain intensity and BMI explained 15% of the variance in parent reports and 22% of variance in youth reports of activity limitations [17]. Children with both chronic pain and obesity were six times more likely to experience impaired physical functioning compared to their peers with typical development [15,18].
A conceptual model by Van der Ploeg et al. [19] to promote physical activity for people with a disability advocates an interdisciplinary and biopsychosocial approach based on the premise that people with disabilities are less physically active than the general population and that physically active lifestyles are important for overall health and well-being. Van der Ploeg et al. [19] propose that a person’s health condition influences physical activity level and intensity, which are integral to maintaining health status and mobility status across the three domains (body functions and structure, activity, participation) of the International Classification of Functioning, Disability and Health (ICF) [20]. In the ICF, disability is an overarching term for impairments in body functions and structures, activity limitations, and participation restrictions that shift emphasis from people’s disabilities to their level of health [20]. Furthermore, Van der Ploeg et al. [19] state that environmental facilitators and barriers, social influences, and a person’s intention and attitudes toward physical activity are among the contextual factors of the ICF model that are determinants of health and well-being.
The model by Van der Ploeg et al. [19] was used as the basis for development of a conceptual framework to illustrate the purpose of this study (Figure 1). Intervention by healthcare professionals to reduce the disabling effects of chronic pain and obesity and promote a physically active lifestyle is conceptualized as the intersection of an individual’s health condition (chronic pain, weight category), physical functioning (disability in physical functioning due to pain), and physical activity participation (frequency, intensity, type, enjoyment). The model specifies the clinical measures used in this study to evaluate components of health, functioning, and physical activity. Rehabilitation and healthcare professionals collaborate with youth, families, and other professionals to determine the impact of the youth’s disability conditions and identify resources and/or design appropriate, tailored PA experiences (types and intensity) to result in improved health status and healthy behaviors. The optimal approach is interprofessional and individualized and may include physicians, physical therapists, psychologists, and pharmacists to develop an appropriate plan of care. An interprofessional approach is consistent with the guideline on management of chronic pain in children by the World Health Organization [21].
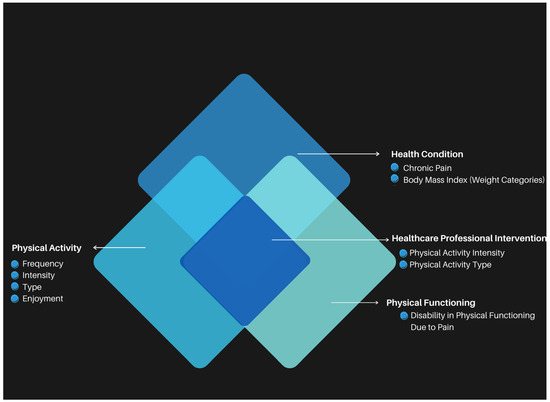
Figure 1.
Conceptual framework for study adapted from Van der Ploeg et al. [19]. Health professionals collaborate with youth with chronic pain, families, and other professionals at the intersection of health condition, physical functioning, and physical activity participation to promote a physically active lifestyle.
The aims of this preliminary study were as follows: (1) Examine the frequency that youth with chronic pain and either healthy or unhealthy (overweight, obesity) weight participated in leisure and recreational activities at high, moderate, and low physical activity intensity in the past 4 months, as measured by metabolic equivalent of task (MET) level. (2) Examine the relationship between perceived disability in physical functioning due to pain and physical activity intensity. (3) Describe activities that youth with chronic pain enjoy performing for leisure and recreation and their perceptions of what limits them from performing these activities. The hypothesis was that youth with chronic pain and healthy weight would participate in more leisure and recreational activities at high and moderate MET levels while youth with chronic pain and unhealthy weight would participate in more activities at low MET levels. The results may inform healthcare professionals to engage youth to identify preferred physical activities of moderate to high intensity and integrate them into interventions and daily routines to promote a physically active lifestyle.
2. Materials and Methods
2.1. Design
An observational study using a cross-sectional, two group design. Participants completed the Children’s Assessment of Participation and Enjoyment (CAPE) [22], Functional Disability Inventory [23], a Demographic and Participation Questionnaire, and rated their pain. The assessor measured height and weight to calculate BMI and determined metabolic equivalents of CAPE activities. Participants were grouped by weight status, healthy weight or obese, overweight, for data analysis.
2.2. Participants
The participants were a convenience sample of 30 children and adolescents 11–19 years of age (referred to as youth) with chronic pain who attended physical therapy or the physician pain clinic at The Children’s Institute of Pittsburgh (Pittsburgh, PA, USA). Youth were eligible if they had a diagnosis of chronic pain and either healthy weight or unhealthy weight. Based on the definitions used by the World Health Organization [24], healthy weight was defined as less than one standard deviation above the median when compared to age and gender norms. Unhealthy weight includes overweight and obesity. Overweight is defined as a BMI-for-age greater than 1 standard deviation above the World Health Organization Growth Reference median [24]. Obesity is defined as a BMI-for-age greater than 2 standard deviations above the World Health Organization Growth Reference median [24]. The exclusion criteria were being underweight or having a neurodevelopmental condition such as cerebral palsy, traumatic brain injury, spinal cord injury, or Down Syndrome. Youth with chronic pain were identified by review of physician and physical therapy appointments, chart reviews, and word of mouth among physical and occupational therapists.
This was a preliminary feasibility study performed to address the aims and evaluate the appropriateness of the physical therapy clinic to implement the study. A sample of convenience was used with a target sample size of 40 youth (20 per group) based on the active patient list in the clinic and because no published evidence was found to calculate sample size. Forty youth receiving services at The Children’s Institute of Pittsburgh met the eligibility criteria. All were invited and 30 consented to participate.
The study was approved by the Institutional Review Board at Drexel University. Informed consent was obtained for participants 18 years of age and older. Participants younger than 18 provided informed assent, and parents provided informed consent. Participant characteristics and background information are included in Table 1 and Table 2. The participants included 24 females and 6 males. Race and ethnicity were reported as White (n = 23, 76.7%), Hispanic/Latino (n = 1, 3.3%), Black/African American (n = 4, 13.3%), and mixed race (n = 2, 6.7%). Further, 13 of the participants had normal or healthy weight and 17 of the participants had unhealthy weight. Of the participants with unhealthy weight, 5 were overweight and 12 were obese. Additionally, 7 of the 12 participants who were obese had a BMI greater than 3 standard deviations above the median compared to age and gender norms.

Table 1.
Descriptive statistics of youth with chronic pain grouped by weight status.
Table 2.
Participant health status and health behaviors.
2.3. Measures
Children’s Assessment of Participation and Enjoyment (CAPE): The CAPE is a 55-item self-report measure of participation in recreation and leisure activities outside of school during the past 4 months by children and youth 6–21 years old [22]. Items are grouped into five skill types: recreational, active–physical, social, skill-based, and self-improvement. Five dimensions of participation are scored: diversity (whether the activity was performed), intensity (how often the activity was performed), where the activity was performed, with whom the activity was performed, and enjoyment [22]. The validity and reliability of the CAPE have been established. The consistency between the self-report version and interview-assisted version is high (0.82 to 0.99) for intensity, and moderate (0.47 to 0.78) for enjoyment [25]. Construct validity was demonstrated by factor analysis [25]. Intra-class correlation coefficients for test–retest reliability varied from 0.67 to 0.86 for diversity and intensity scores, suggesting adequate reliability [25].
Metabolic Equivalents of CAPE Activities: Metabolic equivalent of task (MET), the ratio of oxygen consumption (VO2) during activity divided by resting metabolic rate (resting VO2), indicates the amount of energy the body uses above resting level when performing an activity [26]. The World Health Organization defines <3 METs as low intensity, 3–6 METs as moderate intensity, and >6 METs as high intensity [26].
A MET level was assigned to each item on the CAPE using the Compendium of Physical Activities [27]. The Compendium of Physical Activities was created from studies of adults that measured energy cost during a variety of physical activities at different intensities. All 55 items on the CAPE are represented in the Compendium. This contrasts with the Youth Compendium of Physical Activities [28], where only 22 CAPE items are represented. When comparing the 22 CAPE items included in both compendiums, only 6 had MET levels of different intensity. Three of the activities on the Compendium of Physical Activities were one intensity level higher when compared to the Youth Compendium of Physical Activities and three were one intensity level lower.
The first author (J.B.) assigned a MET equivalent to each CAPE item based on the activity in the Compendium that most closely matched the description of the activity on the CAPE. A second physical therapist, masked to the primary investigator’s scores, independently assigned a MET equivalent to each item. When there was a disagreement, a third physical therapist assigned a MET equivalent. This occurred for 21 items. If two out of three therapists agreed on the MET equivalent, that number was assigned to the item. If none of the therapists agreed, the average MET equivalent was assigned to the item. An average MET equivalent was determined for 18 of the 21 items. Table 3 lists the MET equivalent and intensity level (high, moderate, low) for each item on the CAPE.
Table 3.
MET equivalent and intensity level of CAPE items.
Functional Disability Inventory (FDI): The FDI is a 15-item self-report inventory that measures perceived disability in physical functioning due to pain in the last few days [23,29,30,31]. Examples of items include being up all day without a nap or rest, walking the length of a football field, running the length of a football field, doing something with a friend such as playing a game, doing chores, and participating in a physical education class. For each item, youth rate their ability to participate on a five-point ordinal scale: no trouble (score of 0), some trouble (score of 1), a little trouble (score of 2), a lot of trouble (score of 3), or impossible (score of 4). Good internal consistency was established for the FDI [31]. Walker and Green [23] reported moderate to good construct validity (r = 0.71, p < 0.001) between child and parent reports on the FDI and other measures of impairment. Claar and Walker [31] reported fair validity between the child and parent report scores on the FDI. Predictive validity of the FDI was fair to moderate for pain, school impairment, and depressive symptoms [31]. Kashikar-Zuck et al. [30] established an empirically derived classification system for interpreting FDI scores. A score ≤ 12 represents no to minimal perceived disability in physical functioning (can function despite pain), a score of 13–29 represents moderate perceived disability in physical functioning (greater levels of impairment, depressive symptoms, and pain intensity), and a score ≥ 30 represents severe perceived disability in physical functioning (patients who express high levels of pain and depression).
Body Mass Index (BMI): Two height measurements were taken, and the average was recorded to the closest 1/8th inch (0.31 cm) and weight was recorded to the nearest 0.2 pound (0.09 kg) as per the height and weight measurement training manual [32]. Scales were calibrated monthly. BMI was calculated using the Children’s Hospital of Philadelphia Research Institute pediatric Z-score calculator. The BMI for each participant was compared to norms for age and gender (World Health Organization) [33]. A BMI greater than one standard deviation above the median is considered overweight. A BMI greater than two standard deviations above the median is considered obese.
Pain: A Numerical Rating Scale (NRS) between 0 and 10 was used to assess pain. On this scale, 0 equals “no pain at all” and 10 equals the “worst pain ever possible” [34]. The NRS is a valid measure for assessing pain in children with chronic pain [35]. Youth rated their pain on the day they completed the study measures.
Demographic and Participation Questionnaire: A questionnaire completed by the youth was developed to obtain demographic data, information on medications, current and previous therapies, how many days per week participants engage in physical activity, whether participants eat a healthy well-balanced diet, and how often over the last two weeks participants have been bothered by feeling nervous, anxious, or on edge. Additionally, participants were asked to list the top three activities they enjoy doing outside of school and the top three things that limit them from doing the activities they enjoy.
2.4. Preliminary Work
The acceptability and feasibility of the study measures were piloted with three females, ages 12, 15, and 18 years old, with chronic pain as a standard of care in clinical practice. One patient had a healthy weight, one was overweight, and one was obese. All three adolescents attended a regular education program. All measures were completed following the standardized procedures. Based on questions about CAPE and FDI items and comments about the measures, the following decisions on study procedures were made: (a) provide a quiet environment and proper seating to minimize distractions, (b) inform participants of the estimated time it will take to complete the measures, (c) review the first two items of the CAPE and FDI. If a participant is having difficulty selecting responses, complete the CAPE and FDI by interview; the assessor will read each question and response option. (d) Review each measure after completion to make sure there are no unintentional missing responses or errors.
2.5. Procedure
The first author, a physical therapist with 9 years of experience providing services to youth with chronic pain and experienced in administration of all measures, performed data collection. Parents were welcome to be present throughout data collection. The total time for data collection varied from 30 to 45 min, including the time to obtain informed consent.
Height and weight were measured in a private evaluation room with shoes and extra clothing (jackets, hats) removed. To measure height using a stadiometer, participants stood with their backs to the wall and looking straight ahead. To record weight, participants stepped onto the scale and stood with their hands by their sides.
Participants self-reported their responses for the CAPE, FDI, pain rating scale, and completed the Demographic and Participation Questionnaire. A script was developed to standardize instructions for completion of the CAPE and FDI. Participants were informed that there was no time limit to complete the assessments. When present, parents were cued to allow their youth to answer to the best of their ability rather than answering on their behalf. The first author was available to answer questions and asked each participant at least once if they required assistance. For the CAPE, participants were provided with the specific month that was 4 months before data collection to diminish recall bias and make the CAPE instructions more concrete. Participants were encouraged to ask for examples if they were unsure about an activity.
Many youths asked their parents for information to complete the Demographic and Participation Questionnaire. Most often participants had questions regarding their medications, especially younger participants. If the parent was not in the room, participants completed the measures independently. Participants were instructed to record the gender they identified with on the questionnaire, not the gender assigned at birth. All participants completed the CAPE by themselves with two exceptions. One participant completed the CAPE and FDI by interview due to the participant’s inability to follow directions and one parent recorded responses due to the participant’s illegible handwriting.
2.6. Statistical Analysis
Descriptive statistics were computed for all variables. CAPE activities were grouped for analysis by low, moderate, and high MET intensity levels. CAPE scores for how often an activity was performed in the past 4 months were converted from an ordinal to interval scale (Table 4). Data were analyzed to determine if the assumptions of a normal distribution (Shapiro–Wilk test) and homogeneity of variance (Levene’s Test for Equality of Variance) were met. The assumptions were met for the number of moderate and low intensity level activities performed (p > 0.05); therefore, differences between youth with healthy weight and youth with unhealthy weight were analyzed using t-tests for independent samples. Neither assumption was met for the number of high intensity level activities performed (p < 0.05), and there were three extreme outliers; therefore, the non-parametric Mann–Whitney U test was used.
Table 4.
Children’s Assessment of Participation and Enjoyment (CAPE): Conversion of ordinal scores for how often an activity was performed in the past 4 months to interval scores.
A partial correlation was computed to determine the relationship between perceived disability in physical functioning due to pain (FDI scores) and the number of activities of high, moderate, and low intensity performed in the past 4 months by youth with chronic pain, controlling for BMI. A partial correlation was also computed to determine the relationship between FDI scores and pain ratings by youth, controlling for BMI. The activities youth most often reported they were interested in doing and their perceived limitations in doing these activities are described. Chi Square tests were computed to determine if the proportion of youth who indicated they enjoyed high MET activities and the proportion who indicated they enjoyed low MET activities differed between youth with healthy weight and youth with unhealthy weight. The alpha level for all analyses was 0.05.
3. Results
Descriptive statistics for frequency of CAPE activities of high, moderate, and low MET intensity levels performed by youth with and without healthy weight are presented in Table 5. Overall, 77% of activities performed by youth with healthy weight and 76% of activities performed by youth with unhealthy weight in the past 4 months were at low MET levels.
Table 5.
Number of high, moderate, and low MET leisure and recreation activities performed in the past 4 months.
3.1. High-Intensity Activities
Activities classified as high intensity were performed in the past 4 months a mean of 46.3 (SD 81.9) times by youth with healthy weight compared with a mean of 14.7 (SD 16.9) times by youth with unhealthy weight. The number of high-intensity activities performed in the past 4 months varied from 0 to 44 among all participants except for three extreme outliers in the healthy weight group. Among youth with healthy weight, one youth reported performing 290 high-intensity activities (including dancing daily), one youth reported performing 120 high-intensity activities (track and field, team sports, bicycling/in-line skating/skateboarding, snow sports between 2 and 3 times a month and 1 time a day or more), and one youth reported performing 80 high intensity activities (dancing and bicycling/in-line skating/skateboarding 2–3 times per week). The median number of activities of high intensity was 10 for youth with healthy weight and 5 for youth who with unhealthy weight. For the Mann–Whitney U test, the difference between youth with healthy weight (mean rank = 17.1) and youth with unhealthy weight (mean rank = 14.3) was not significant (U = 89.5, p = 0.38).
3.2. Moderate-Intensity Activities
Activities classified as having moderate intensity levels were performed a mean of 17.7 (SD 8.9) times by youth in the healthy weight group compared with a mean of 22.9 (SD 11.9) times by youth with unhealthy weight. One youth with unhealthy weight reported performing 8 different activities from 1 time in the past 4 months to 1 time a day or more (total of 41 times). The mean difference between groups was not significant (t(28) = −1.3, p = 0.10).
3.3. Low-Intensity Activities
Activities classified as low intensity were performed a mean of 964.1 (SD 314.4) times by youth with unhealthy weight compared with 898.5 (SD 283.1) times by youth with healthy weight, a difference that was not significant (t(28) = −0.591 p = 0.28).
3.4. Perceived Disability in Physical Functioning Due to Pain
The mean FDI score for the entire sample was 23.1 (SD 10.6) (moderate perceived disability in physical functioning due to pain). The mean FDI score was 19.8 (SD 10.6) for youth with healthy weight and 25.6 (SD 9.6) for youth with unhealthy weight indicating, on average, moderate perceived disability in physical functioning due to pain for both groups. Further, 9 participants reported severe perceived disability in physical functioning due to pain (FDI ≥ 30), 14 reported moderate perceived disability in physical functioning due to pain (FDI = 13–29), and 7 reported minimal to no perceived disability in physical functioning due to pain (FDI ≤ 12). The partial correlation between FDI scores and pain ratings was 0.68 (p < 0.001), indicating that participants’ ratings of disability in physical functioning due to pain in the last few days were related to their pain ratings the day the assessments were completed.
3.5. Relationship Between FDI Scores and Physical Activity Intensity
The partial correlations between FDI total scores and the number of activities of high (r(27) = −0.13, p = 0.49), moderate (r(27) = −0.28, p = 0.15), and low (r(27) = −0.02, p = 0.91) intensity performed in the past 4 months controlling for BMI were not significant.
3.6. Activity Preferences and Perceived Limitations
On the Demographic and Participation Questionnaire, youth reported 38 different activities they enjoyed. Five or more participants reported enjoying reading (8), art (6), spending time with friends (6), and playing a musical instrument (5). The most frequently reported activities have low MET levels, except for playing a musical instrument in a marching band, an activity with a moderate MET level [36]. One participant enjoyed playing bass guitar. According to Ainsworth et al. [36], guitar playing while sitting is 2.5 METs (low-MET activity), while playing in standing is 3.0 METs (moderate-MET activity). Each of the three participants who performed 80 or more high-intensity activities in the past 4 months on the CAPE reported on the questionnaire that they enjoyed moderate to high MET level activities outside of school, like bike riding, dance, and roller blading. This differed from some of their peers who reported enjoying more low-MET activities, such as playing video games, participating in arts and crafts, and music activities.
Youth reported that the most frequent factors that limited them from participating in physical activities were pain, fatigue, and stress/anxiety (Table 6). Twenty-six participants reported pain (often in multiple areas) and ten reported fatigue as a barrier to physical activity. More youth with healthy weight reported that they enjoyed participating in moderate-to-high-intensity activities outside of school (76.9%) compared to youth with unhealthy weight (47.1%), a difference that was not significant (χ2 = 2.74, p = 0.10). A greater proportion of youth with unhealthy weight reported enjoying more low-intensity physical activities (94.1%) compared to youth with healthy weight (46.2%) (χ2 = 8.67, p < 0.01).
Table 6.
Participant enjoyment and limitations for physical activity.
4. Discussion
The hypothesis that among youth with chronic pain, those with healthy weight would participate in more leisure and recreational activities at high and moderate MET levels compared with youth with unhealthy weight was not supported. Among the 13 youth with healthy weight, there were 3 extreme outliers who participated in 80, 120, and 290 high MET level activities in the past 4 months. This suggests some youth with chronic pain and healthy weight regularly participate in high MET level activities. There was no relationship between perceived disability in physical functioning due to pain and number of activities at low, moderate, and high MET levels performed in the past 4 months after controlling for BMI. Further, 77% of activities performed by youth with healthy weight and 76% of activities performed by youth with unhealthy weight were at low MET levels, indicating that youth with chronic pain chose mostly sedentary or low energy activities regardless of weight classification. Additionally, on average, youth perceived moderate disability in physical function due to pain regardless of weight classification. This finding suggests that youth with chronic pain may avoid activities at moderate or high MET intensity level due to concerns that activity will exacerbate pain and disability irrespective of their weight classification.
The finding that children with chronic pain report moderate perceived disability in physical activity due to pain aligns with previous research [9,13]. In a retrospective study of youth with chronic pain, those with higher BMI demonstrated greater functional disability at 3 month follow-up [12]. In the current study, 76% of activities performed by youth with unhealthy weight in the past 4 months were at low MET levels and only 47% of youth with unhealthy weight reported that they enjoy moderate-to-high-intensity physical activities outside of school. This suggests that efforts to increase the intensity of physical activity may be most challenging in youth with chronic pain and unhealthy weight.
The findings support previous research that pain, anxiety, and stress are barriers to physical activity intensity in individuals with chronic pain and obesity [18,37]. A recent study by Gremillion et al. [18] found that pain is perceived by youth with chronic pain and obesity as the primary barrier to physical activity and not weight. In the present study, 43% of the participants reported that they were bothered by feeling nervous, anxious, or on edge more than 3 days a week. Feeling nervous, anxious, or on edge are emotions that might fluctuate day to day and may influence perceptions of pain, fatigue, and participation in physical activity [37]. Not having time was also reported as a barrier by youth in the present study.
4.1. Implications for Practice
As illustrated in the figure, healthcare professionals are encouraged to work jointly with youth with chronic pain, their families, and other community and health professionals at the intersection of health condition, physical functioning, and physical activity to promote a physically active lifestyle. This includes identifying preferred leisure and recreation activities of moderate and high MET intensity levels, building on personal and environmental strengths, and identifying solutions to modifiable barriers to participation. Considerations include incrementally increasing physical activity intensity while managing pain, improving conditioning, and promoting mastery motivation and self-esteem. The findings that 12 (40%) youth reported taking medication for anxiety/depression and 23 (76.7%) reported that in the past two weeks they were bothered by feeling nervous, anxious, or on edge several days to almost every day supports an interprofessional approach that addresses mental health concerns.
Guiding questions on activity routines and preferences are recommended when screening or examining youth and designing interventions to address modifiable personal and environmental factors to promote health and function. Responses on the questionnaire reinforce the importance of considering activities that youth enjoy performing or are interested in trying and their capacity to participate in these activities despite fluctuating pain. Personal and environmental factors are determinants of frequency, intensity, and type of physical activity and may influence participation in activities of moderate to high MET intensity levels to promote health and fitness routines.
An important consideration is whether activities youth identify that they enjoy or want to try can be performed at a high enough intensity to impact physical function and health. In the authors’ experience, leisure and recreation activities of moderate MET intensity levels initially may be more sustainable than activities of high intensity for youth with chronic pain who predominately engage in leisure and recreation activities of low intensity. Sustaining moderate or high physical activity intensity to impact physical and emotional health is challenging. It may be beneficial for therapists to use the CAPE to identify activities youth enjoy and integrate them into moderate-to-high MET level activities such as walking on the treadmill while reading or alternating a preferred task with a non-preferred task. Adherence may improve when activities are incorporated into daily routines.
4.2. Limitations and Recommendations for Further Research
Post hoc analysis using G*Power 3.1 [38] indicated the study had low statistical power (0.44). The post hoc effect size was 0.57 for the difference in the number of high-intensity level activities performed by youth with healthy weight compared with youth with unhealthy weight. For an effect size of 0.57, power of 0.80, and alpha of 0.05, a sample size of 78 participants (39 per group) is required. Although the prevalence of chronic pain is higher in females [3,4], the percentage of females in this study (75%) most likely over represents the population prevalence. While the number of high, moderate, and low MET activities performed in the past 4 months provided a measure of physical activity intensity, the duration of the activities were performed was not measured. How long an activity is performed for is an important consideration for estimating potential health benefits and should be addressed in future research. The high percentage of participants who reported that they were bothered by feeling nervous, anxious, or on edge during the past two weeks supports the need for research to explore how anxiety impacts the willingness of youth with chronic pain to participate in activities at moderate to high MET levels.
Classifying CAPE items by MET levels provides a clinically feasible method to estimate the physical activity intensity of leisure and recreational activities. Accelerometers have been used to measure physical activity intensity in youth [10]; however, accelerometers are not always available to clinicians and adherence to wearing an accelerometer might be difficult to monitor and coordinate in youth. Although accelerometers may provide objective estimates of physical activity intensity, there are no data about what the youth performed during that physical activity. The CAPE with MET values, therefore, may be a reasonable alternative that engages youth in selecting moderate- or high-MET-level activities that they would like to do.
A recommendation for further research is a clinical trial to determine whether leisure and recreational activities of moderate to high MET intensity levels that are adapted to the interests and preferences of youth increase adherence, reduce perceived disability in physical functioning due to pain, and improve health outcomes.
5. Conclusions
Youth with chronic pain predominately participated in leisure and recreation of low physical activity intensity regardless of weight classification. The significant relationship between ratings of pain on the day of assessment and FDI scores supports the finding that, on average, youth perceived moderate disability in physical functioning due to pain. Although, on average, youth reported moderate perceived disability in physical functioning due to pain, there was no relationship between perceived disability in physical functioning due to pain and physical activity intensity. Youth reported that pain, stress/anxiety, and not having time were barriers to physical activity at moderate or high intensity during leisure and recreation. Healthcare professionals are encouraged to tailor physical activity interventions to youths’ interests, progress physical activity intensity interventions by increasing physical activity intensity as able, address modifiable barriers, and encourage the performance of leisure and the recreation of moderate or high MET activity levels to promote a more physically active lifestyle to reduce disability in physical functioning due to pain.
Author Contributions
Conceptualization, J.B., R.J.P., M.E.O. and K.S.; Methodology, J.B., R.J.P., M.E.O. and K.S.; Formal Analysis, J.B. and R.J.P.; Investigation, J.B.; Resources, J.B. and K.S.; Data Curation, J.B. and R.J.P.; Writing—Original Draft Preparation, R.J.P. and J.B.; Writing—Review and Editing, R.J.P., J.B., M.E.O. and K.S.; Visualization, R.J.P. and J.B.; Supervision, R.J.P., M.E.O. and K.S.; Project Administration, R.J.P. and J.B. All authors have read and agreed to the published version of the manuscript.
Funding
This research has received no external funding.
Institutional Review Board Statement
The study was conducted according to the guidelines of the Declaration of Helsinki and approved by the Institutional Review Board of Drexel University (IRB ID 1810006692, 20 December 2018).
Informed Consent Statement
Informed consent was obtained from all participants involved in the study.
Data Availability Statement
The raw data supporting the conclusions of this article will be made available by the authors on request.
Acknowledgments
Special regards to Katherine Concilus, Amy O’Donnell, and Mikayla Chryst Brown who volunteered to assist in various aspects of the project. Additional appreciation is extended to the administration at The Children’s Institute of Pittsburgh who supported the endeavors of this research.
Conflicts of Interest
The authors declare no conflicts of interest.
Disability Language/Terminology Positionality Statement
The authorship team is composed of pediatric physical therapists and health researchers with clinical and academic expertise in pediatric rehabilitation, chronic pain, and disability. We are committed to using inclusive and respectful language that aligns with the preferences of the populations we serve and study. In this manuscript, we use person-first language in accordance with best practices and guidance from the American Physical Therapy Association. Regarding terminology related to body size, we adopt the World Health Organization’s classification and use the term “healthy weight” and “unhealthy weight” as a reference category in contrast to “overweight” or “obesity,” which are clinical descriptors based on established BMI-for-age percentiles. We recognize that language about weight can be stigmatizing, and we have taken care to use neutral, person-centered language throughout the manuscript. We also adopt the social model of disability as a guiding framework, recognizing that disability is shaped not only by health conditions but also by environmental and social barriers. We are grateful to the children and families who participated in this study and acknowledge their insights, perspectives, and lived experiences. We affirm our commitment to treating all participants with dignity, fairness, autonomy, and respect throughout the research process.
Abbreviations
The following abbreviations are used in this manuscript:
| CAPE | Children’s Assessment of Participation and Enjoyment |
| FDI | Functional Disability Inventory |
| MET | Metabolic Equivalent of Task |
| BMI | Body Mass Index |
| ICF | International Classification of Functioning, Disability and Health |
| NRS | Numerical Rating Scale |
References
- Landry, B.W.; Fischer, P.R.; Driscoll, S.W.; Koch, K.M.; Harbeck-Weber, C.; Mack, K.J.; Wilder, R.T.; Bauer, B.A.; Brandenburg, J.E. Managing chronic pain in children and adolescents: A clinical review. PMR 2015, 7, S295–S315. [Google Scholar] [CrossRef]
- Yamato, T.P.; Kamper, S.J.; O’Connell, N.E.; Michaleff, Z.A.; Fisher, E.; Viana Silva, P.; Williams, C.M. Physical activity and education about physical activity for chronic musculoskeletal pain in children and adolescents. Cochrane Database Syst. Rev. 2023, 7, CD013527. [Google Scholar] [CrossRef]
- Wager, J.; Brown, D.; Kupitz, A.; Rosenthal, N.; Zernikow, B. Prevalence and associated psychosocial and health factors of chronic pain in adolescents: Differences by sex and age. Eur. J. Pain 2020, 24, 761–772. [Google Scholar] [CrossRef]
- Chambers, C.T.; Dol, J.; Tutelman, P.R.; Langley, C.L.; Parker, J.A.; Cormier, B.T.; Macfarlane, G.J.; Jones, G.T.; Chapman, D.; Proudfoot, N.; et al. The prevalence of chronic pain in children and adolescents: A systematic review update and meta-analysis. Pain 2024, 165, 2215–2234. [Google Scholar] [CrossRef] [PubMed]
- Collins, A.B. Chronic pain in children: Interdisciplinary management. Pediatr. Clin. N. Am. 2023, 70, 575–588. [Google Scholar] [CrossRef] [PubMed]
- Zernikow, B.; Wager, J.; Hechler, T.; Hasan, C.; Rohr, U.; Dobe, M.; Meyer, A.; Hübner-Möhler, B.; Wamsler, C.; Blankenburg, M. Characteristics of highly impaired children with severe chronic pain: A 5-year retrospective study on 2249 pediatric pain patients. BMC Pediatr. 2012, 12, 54. [Google Scholar] [CrossRef]
- Wilson, A.C.; Palermo, T.M. Physical activity and function in adolescents with chronic pain: A controlled study using actigraphy. J. Pain 2012, 13, 121–130. [Google Scholar] [CrossRef]
- Celedon, X.; Amari, A.; Ward, C.M.; Prestwich, S.; Slifer, K.J. Children and Adolescents with Chronic Pain and Functional Disability: Use of a Behavioral Rehabilitation Approach. Curr. Phys. Med. Rehabil. Rep. 2014, 2, 86–92. [Google Scholar] [CrossRef]
- Santos, M.; Murtaugh, T.; Pantaleao, A.; Zempsky, W.T.; Guite, J.W. Chronic pain and obesity within a pediatric interdisciplinary pain clinic setting: A preliminary examination of current relationships and future directions. Clin. J. Pain 2017, 33, 738–745. [Google Scholar] [CrossRef] [PubMed]
- Wilson, A.C.; Samuelson, B.; Palermo, T.M. Obesity in children and adolescents with chronic pain: Associations with pain and activity limitations. Clin. J. Pain 2010, 26, 705–711. [Google Scholar] [CrossRef]
- Tsiros, M.D.; Tian, E.J.; Shultz, S.P.; Olds, T.; Hills, A.P.; Duff, J.; Kumar, S. Obesity, the new childhood disability? An umbrella review on the association between adiposity and physical function. Obes. Rev. 2020, 21, e13121. [Google Scholar] [CrossRef] [PubMed]
- Stoner, A.M.; Jastrowski Mano, K.E.; Weisman, S.J.; Hainsworth, K.R. Obesity impedes functional improvement in youth with chronic pain: An initial investigation. Eur. J. Pain 2017, 21, 1495–1504. [Google Scholar] [CrossRef]
- Mittal, M.; Jain, V. Management of obesity and its complications in children and adolescents. Indian J. Pediatr. 2021, 88, 1222–1234. [Google Scholar] [CrossRef]
- Hong, I.; Coker-Bolt, P.; Anderson, K.R.; Lee, D.; Velozo, C.A. Relationship between physical activity and overweight and obesity in children: Findings from the 2012 national health and nutrition examination survey national youth fitness survey. Am. J. Occup. Ther. 2016, 70, 7005180060p1–7005180060p8. [Google Scholar] [CrossRef]
- Hainsworth, K.R.; Gremillion, M.L.; Davies, W.H.; Stolzman, S.C.; Weisman, S.J. Obesity in youth with chronic pain: Giving it the seriousness it deserves. Pain Med. 2021, 22, 1243–1245. [Google Scholar] [CrossRef] [PubMed]
- Stolzman, S.C.; Skelton, J.; Harkins, A.; Bement, M.H. Does weight status impact metabolic health in adolescents when controlling for physical fitness? Pediatr. Phys. Ther. 2019, 31, 134–140. [Google Scholar] [CrossRef] [PubMed]
- Wittmeier, K.D.; Mollard, R.C.; Kriellaars, D.J. Physical activity intensity and risk of overweight and adiposity in children. Obesity 2008, 16, 415–420. [Google Scholar] [CrossRef]
- Gremillion, M.L.; Lang, A.C.; Everhard, S.A.; Davies, W.H.; Stolzman, S.C.; Weisman, S.J.; Hainsworth, K.R. Effects of weight and pain on physical activity: Insights from the lived experiences of youth with co-occurring chronic pain and obesity. Child. Obes. 2022, 18, 301–308. [Google Scholar] [CrossRef]
- Van der Ploeg, H.P.; Van der Beek, A.J.; Van der Woude, L.H.; van Mechelen, W. Physical activity for people with a disability. Sports Med. 2004, 34, 639–649. [Google Scholar] [CrossRef] [PubMed]
- World Health Organization. ICF: International Classification of Functioning, Disability and Health; World Health Organization: Geneva, Switzerland, 2002; Available online: https://www.who.int/standards/classifications/international-classification-of-functioning-disability-and-health (accessed on 6 May 2025).
- World Health Organization. Guidelines on the Management of Chronic Pain in Children; World Health Organization: Geneva, Switzerland, 2020; Available online: https://www.who.int/publications/i/item/9789240017870 (accessed on 6 May 2025).
- King, G.A.; Law, A.; King, S.; Hurley, P.; Rosenbaum, P.; Hanna, S.; Kertoy, M.; Young, N. Children’s Assessment of Participation and Enjoyment (CAPE) and Preferences for Activities of Children (PAC); PsychCorp: San Antonio, TX, USA, 2004. [Google Scholar]
- Walker, L.S.; Greene, J.W. The functional disability inventory: Measuring a neglected dimension of child health status. J. Pediatr. Psychol. 1991, 16, 39–58. [Google Scholar] [CrossRef]
- World Health Organization. Obesity and Overweight. 2024. Available online: https://www.who.int/news-room/fact-sheets/detail/obesity-and-overweight (accessed on 6 May 2025).
- Imms, C.; Froude, E.; Adair, B.; Shields, N. A descriptive study of the participation of children and adolescents in activities outside school. BMC Pediatr. 2016, 16, 84. [Google Scholar] [CrossRef]
- The World Health Organization. World Health Organization. Guidelines on Physical Activity and Sedentary Behaviour; The World Health Organization: Geneva, Switzerland, 2020; Available online: https://www.who.int/publications/i/item/9789240015128 (accessed on 6 May 2025).
- Ainsworth, B.E.; Haskell, W.L.; Herrmann, S.D.; Meckes, N.; Bassett, D.R., Jr.; Tudor-Locke, C.; Greer, J.L.; Vezina, J.; Whitt-Glover, M.C.; Leon, A.S. Compendium of Physical Activities: A second update of codes and MET values. Med. Sci. Sports Exerc. 2011, 43, 1575–1581. [Google Scholar] [CrossRef] [PubMed]
- Butte, N.F.; Watson, K.B.; Ridley, K.; Zakeri, I.F.; Mcmurray, R.G.; Pfeiffer, K.A.; Crouter, S.E.; Herrmann, S.D.; Bassett, D.R.; Long, A.; et al. A youth compendium of physical activities: Activity codes and metabolic intensities. Med. Sci. Sports Exerc. 2018, 50, 246. [Google Scholar] [CrossRef]
- Stahlschmidt, L.; Friedrich, Y.; Zernikow, B.; Wager, J. Assessment of pain-related disability in pediatric chronic pain: A comparison of the functional disability inventory and the pediatric pain disability index. Clin. J. Pain 2018, 34, 1173–1179. [Google Scholar] [CrossRef]
- Kashikar-Zuck, S.; Flowers, S.R.; Claar, R.L.; Guite, J.W.; Logan, D.E.; Lynch-Jordan, A.M.; Palermo, T.M.; Wilson, A.C. Clinical utility and validity of the Functional Disability Inventory among a multicenter sample of youth with chronic pain. Pain 2011, 152, 1600–1616. [Google Scholar] [CrossRef]
- Claar, R.L.; Walker, L.S. Functional assessment of pediatric pain patients: Psychometric properties of the functional disability inventory. Pain 2006, 121, 77–84. [Google Scholar] [CrossRef]
- BMI Task Force. A Training Manual for Height and Weight Assessments. Arkansas Center for Health Improvement. 2010. Available online: https://achi.net/library/bmi-height-weight-manual/ (accessed on 6 May 2025).
- World Health Organization. WHO Growth Reference Data. BMI-for-Age (5–19 Years). Available online: https://www.who.int/tools/growth-reference-data-for-5to19-years/indicators/bmi-for-age (accessed on 6 May 2025).
- Haefeli, M.; Elfering, A. Pain assessment. Eur. Spine J. 2006, 15, S17–S24. [Google Scholar] [CrossRef]
- Ruskin, D.; Lalloo, C.; Amaria, K.; Stinson, J.N.; Kewley, E.; Campbell, F.; Brown, S.C.; Jeavons, M.; A McGrath, P. Assessing pain intensity in children with chronic pain: Convergent and discriminant validity of the 0 to 10 numerical rating scale in clinical practice. Pain Res. Manag. 2014, 19, 141–148. [Google Scholar] [CrossRef]
- Ainsworth, B.E.; Haskell, W.L.; Whitt, M.C.; Irwin, M.L.; Swartz, A.M.; Strath, S.J.; O’Brien, W.L.; Bassett, D.R., Jr.; Schmitz, K.H.; Emplaincourt, P.O. Compendium of physical activities: An update of activity codes and MET intensities. Med. Sci. Sports Exerc. 2000, 32, S498–S504. [Google Scholar] [CrossRef] [PubMed]
- Hainsworth, K.R.; Davies, W.H.; Khan, K.A.; Weisman, S.J. Co-occurring chronic pain and obesity in children and adolescents: The impact on health-related quality of life. Clin. J. Pain 2009, 25, 715–721. [Google Scholar] [CrossRef] [PubMed]
- Faul, F.; Erdfelder, E.; Lang, A.G.; Buchner, A. G*Power 3: A flexible statistical power analysis program for the social, behavioral, and biomedical sciences. Behav. Res. Methods 2007, 39, 175–191. [Google Scholar] [CrossRef] [PubMed]
Disclaimer/Publisher’s Note: The statements, opinions and data contained in all publications are solely those of the individual author(s) and contributor(s) and not of MDPI and/or the editor(s). MDPI and/or the editor(s) disclaim responsibility for any injury to people or property resulting from any ideas, methods, instructions or products referred to in the content. |
© 2025 by the authors. Licensee MDPI, Basel, Switzerland. This article is an open access article distributed under the terms and conditions of the Creative Commons Attribution (CC BY) license (https://creativecommons.org/licenses/by/4.0/).