Article

Multiple-Stakeholder Perspectives on Accessibility Data and the Use of Socio-Technical Tools to Improve Sidewalk Accessibility

1
Department of Disability and Human Development, University of Illinois-Chicago, Chicago, IL 60608, USA
2
Easterseals, Chicago, IL 60604, USA
3
Occupational Therapy Department, University of Illinois-Chicago, Chicago, IL 60608, USA
4
Paul G. Allen School of Computer Science & Engineering, University of Washington, Seattle, WA 98195, USA
*
Author to whom correspondence should be addressed.
Disabilities 2023, 3(4), 621-638; https://doi.org/10.3390/disabilities3040040
Submission received: 17 October 2023 / Revised: 16 November 2023 / Accepted: 21 November 2023 / Published: 28 November 2023
(This article belongs to the Special Issue Mobility, Access, and Participation for Disabled People)

Abstract

:
For people with disabilities, accessible pedestrian infrastructure can support independence, mobility, and improved quality of life. Yet, most pedestrian infrastructure presents barriers that impede movement. A major challenge for cities to improve pedestrian accessibility is the lack of reliable data on sidewalk accessibility. Little is known about the type of data needed for cities, as well as how different stakeholders perceive and use sidewalk data. Therefore, this study seeks to explore the perceptions of multiple stakeholders on the use, gathering, and application of sidewalk accessibility data. We conducted a series of workshops with 51 participants, including people with disabilities, caregivers, Americans with Disabilities Act (ADA) coordinators, and urban planners, to discuss sidewalk accessibility data and data collection tools. We used the socio-technological tool Project Sidewalk as an example. Participants identified various uses for the accessibility data such as route planning, barrier removal plans, and advocacy, and discussed issues of usability, trust, access, and accessibility of the data and tools. Our findings contribute to a better understanding of important factors that impact the use and application of accessibility data and how to implement accessibility data collection initiatives that utilize socio-technological approaches such as crowdsourcing.

1. Introduction

Over one billion people—about 15% of the world’s population—live with some form of disability [1]. This proportion is increasing due to a rise in chronic health conditions, trends in population aging, and longer life expectancies among people with a disability [1]. Within the United States, 61 million adults (1 in 4 individuals) report at least one disability [2] that impacts their physical mobility, sensory functions, and/or cognitive abilities. Most individuals will experience one if not multiple disabilities in their lifetime, whether it be permanent or temporary. There have been ongoing efforts to improve the inclusion of individuals with disabilities in society, including through changing the built environment to make it more accessible. However, individuals with disabilities continue to be limited in their ability to be active and engaged members of their communities due to structural inequalities [3].

1.1. Disability and Accessibility in the Urban Setting

According to the social model of disability, barriers in an individual’s social and built environments are the main cause of disablement, limiting an individual’s ability to navigate, access, and participate in communities [4]. Barriers in the built environment can consist of human-made pedestrian features (e.g., sidewalks, curb ramps, crosswalks, and pedestrian signals), features of the natural landscape (e.g., hills and groundcover), climate and weather conditions (e.g., snow, rain, heat, and air quality), and the systems and services meant to manage those conditions (e.g., snow removal services) [5,6]. Barriers in the built environment, such as missing or broken lighting, a lack of building/public transportation security, and limited access to public gathering spaces, can also impact livability and an individual’s sense of public safety [5,6,7,8,9]. The social stigma of disability and social barriers such as the attitude and knowledge of others in the community further limit access to space and social participation [10,11]. These barriers work in combination to disable individuals with impairments and make mobility and participation in communities more difficult than for people without impairments. Disability scholars and activists have called on municipal planners and architects to develop more inclusive designs that do not differentially disable some people more than others [12,13]. However, decision makers and urban planners sometimes lack the necessary knowledge about accessibility and how it impacts the lived experience of people with disabilities to create inclusive changes in the environment [10,14].
Removing barriers and designing inclusive pedestrian infrastructure can provide numerous benefits to individuals with disabilities including better access to employment, healthcare, and social participation [6]. To facilitate barrier removal, several countries have adopted antidiscrimination and accessibility policies. For instance, the Americans with Disabilities Act (ADA) was passed in 1990, requiring that public infrastructure—including sidewalks and street crossings—be accessible [15]. Yet, more than 30 years later, municipalities have struggled to meet accessibility requirements, with many municipal streets, sidewalks, and businesses remaining inaccessible [16,17,18,19]. Most communities lack a plan for removing pedestrian infrastructure barriers [16]. The issue for those communities is not only the lack of accessible infrastructure but also the lack of information about what barriers need to be removed and where they are located [20]. For instance, communities often lack reliable data on where sidewalks exist and about their level of accessibility [21]. This lack of data directly limits both planning for and the removal of pedestrian barriers [22].

1.2. Accessibility Data

There is a growing body of research dedicated to developing and evaluating various methods for collecting municipal accessibility data. As described by Hamraie [12], accessibility data collection approaches can be categorized into those that are centered around the perspectives of people with disabilities and those that are focused on gathering large amounts of data on compliance, typically by professionals. Disability-centered approaches often seek to document the lived experience of people with disabilities travelling in municipalities and describe the impact of the environmental barriers of their lives [6,8,23]. While they typically use qualitative methods, they also sometimes incorporate quantitative measures as well, such as GPS tracking or objective auditing tools [23,24]. In contrast, compliance-driven methods are predominantly quantitative, which relates to the large-scale nature of sidewalk networks in municipalities, and are conducted by professionals. Efforts to collect compliance data use on-the-ground auditing (e.g., walk audit using measuring tools), remote auditing (e.g., through Google Street View) [25,26], or automated auditing through computer vision, computer learning (AI), and socio-technological approaches such as crowdsourcing [20,27,28]. Because of the vast amount of infrastructure to audit, on-the-ground auditing is time and labor intensive [29]. Remote and automated methods for data collection may help address these capacity limitations but open new issues around data validation, management, and openness [30]. Indeed, Froehlich and colleagues [30] describe how data collection and data management of accessibility information are two of the biggest challenges facing municipalities and stakeholders seeking to improve the accessibility of municipalities using remote and automated methods.
While numerous studies have explored approaches, methods, and tools for collecting accessibility data [20,25,26,27,28], few studies have explored if and how such data are used in practice or how they would be used by key stakeholders, including urban and transportation planners, accessibility specialists such as ADA coordinators, disability advocacy organizations, and people with disabilities and their caregivers. As such, we lack an understanding of what makes accessibility data useful and how different uses are considered in the design of data and the implementation of data collection efforts. In the first US-focused study of its kind, Saha and colleagues [31] conducted interviews with five stakeholder groups across three US municipalities, including policy makers, transit employees, disability advocates, and people with mobility disabilities. Interview participants were asked about their current perspectives on and methods for determining urban accessibility, along with their reactions to sidewalk accessibility visualization tools. They identified monetary, social, and technological barriers to collecting and analyzing data on urban accessibility and translating those findings into infrastructure development. They also highlighted how specific socio-political tensions impeded progress, including conflicting priorities amongst stakeholders, unclear responsibility, conflicting regulations, a lack of public interest, and a lack of government transparency and accountability [31].
In addition to a lack of data on the accessibility of pedestrian infrastructure, planning efforts have historically failed to consider the needs of people with disabilities and the potential improvements required to make urban spaces and pedestrian infrastructure accessible [8,31,32]. This includes a failure to include the perspectives of people with disabilities in the planning process [16,19,22] as well as in the data collection of accessibility information and participatory mapping efforts [12,33]. Formally including people with disabilities in the planning process has several benefits: people with disabilities provide insights gained from their everyday lived experiences of traveling through municipalities via sidewalks and transit networks, which can help validate collected data with methods such as remote or automated auditing [8,31,32]. People with disabilities can also offer a better understanding of how the pedestrian environment—even one that is ADA-compliant—might still be inaccessible, unsafe, or unwelcoming [12] or might be inconvenient for efficient travel [34].
The purpose of this study was to examine various stakeholders’ perceptions and needs on the use, gathering, and application of sidewalks accessibility data. In addition, we aimed to understand better how stakeholders could use remote and automated socio-technical tools to assess the accessibility of sidewalks. A better understanding of these perspectives and how they align and differ can provide crucial insights for cities to effectively address the lack of data and limited planning for sidewalk accessibility improvements.

2. Materials and Methods

This research was part of a larger study entitled {redacted for review}, which included different components such as the following: (1) community workshops on accessibility data; (2) data validation of an AI/crowdsourcing tool, i.e., Project Sidewalk; (3) the deployment of Project Sidewalk in the Chicago area to collect data on the accessibility of pedestrian infrastructure; and (4) the evaluation of this deployment. The Chicago area was chosen for this study because of prior work showing how there was a lack of accessibility data in the region [35]. An advisory committee was created which leveraged existing partnerships with organizations interested in improving data availability and the accessibility of pedestrian infrastructure in the Chicago area. Committee members included representatives from regional planning and transportation agencies, disability advocacy organizations, travel training organizations, Mayors and Managers associations, and individuals with disabilities.
This paper focuses on the first component of the study: the community workshop. We used a cross-sectional approach to conduct a series of iterative community workshops, conducted with various stakeholders. Workshops are a methodology where a group of people learn, acquire new knowledge, and innovate in relation to a domain-specific issue [36]: in this case, sidewalk accessibility data and the use of socio-technical tools. We used the Project Sidewalk tool as a tool exemplar to help people reflect on the possibilities of use and application of sidewalk accessibility data. A description of Project Sidewalk is provided in the next section. The study was approved by the University Ethics committee [blinded for review].

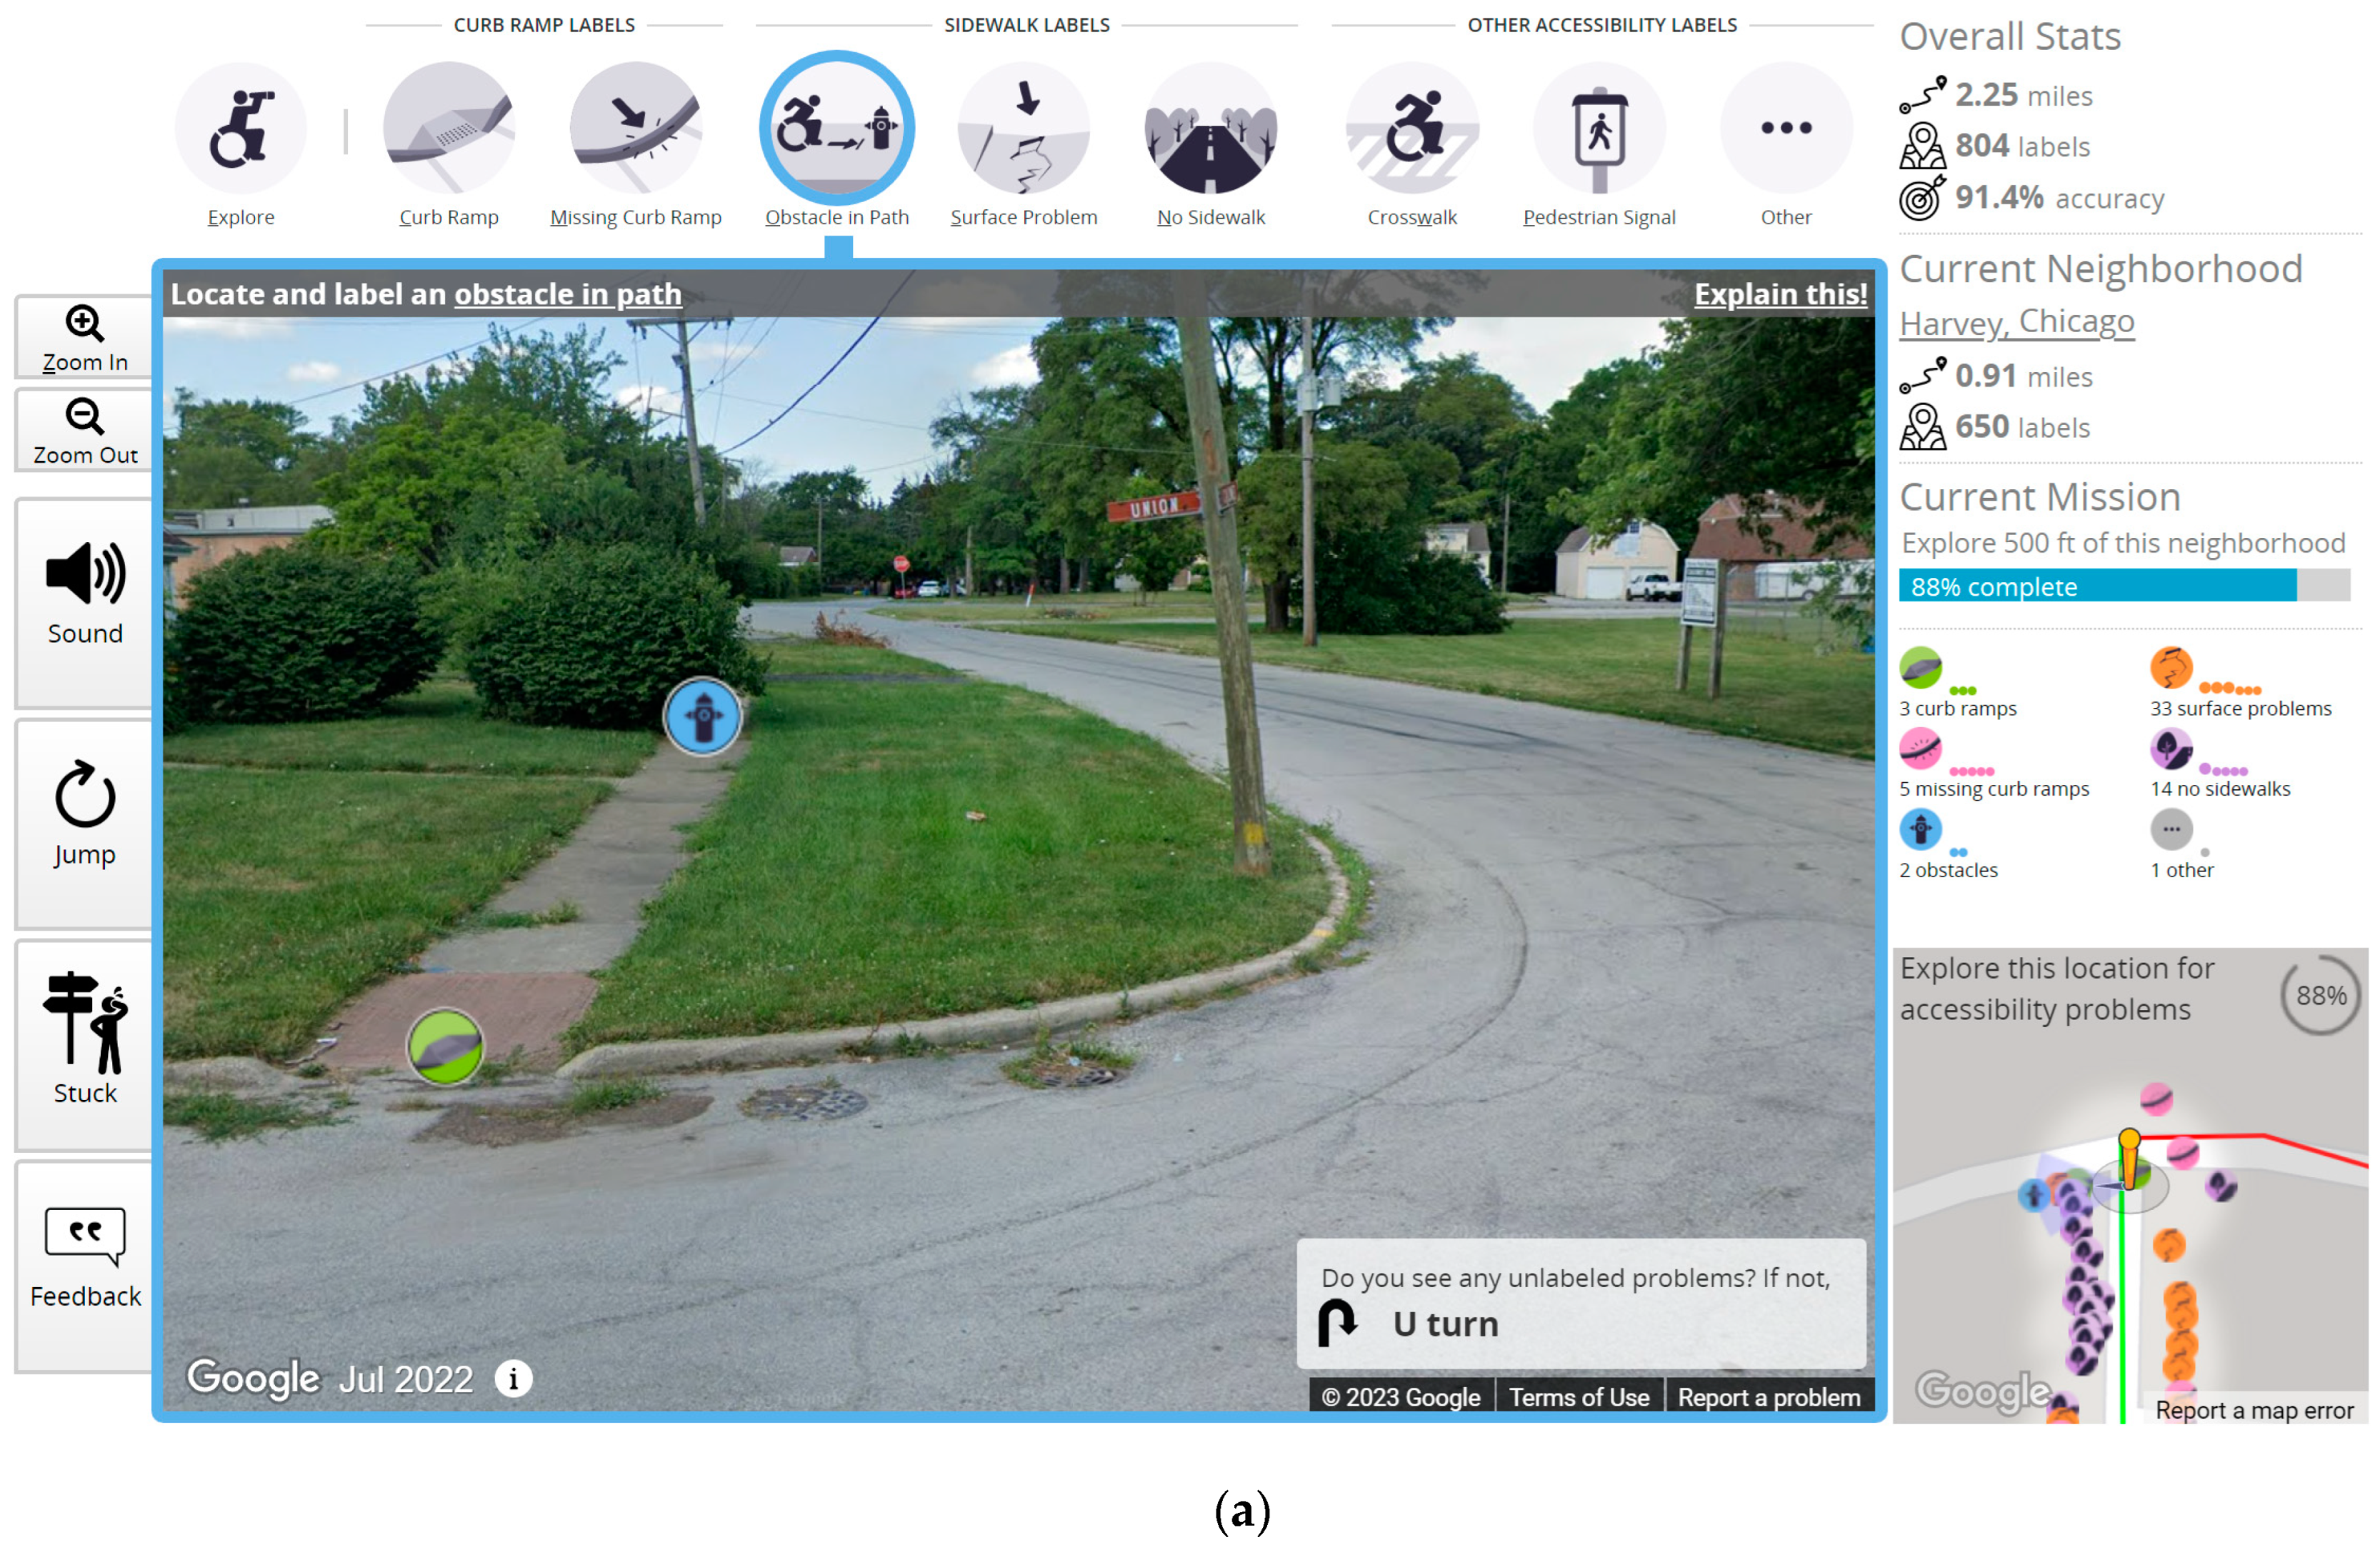
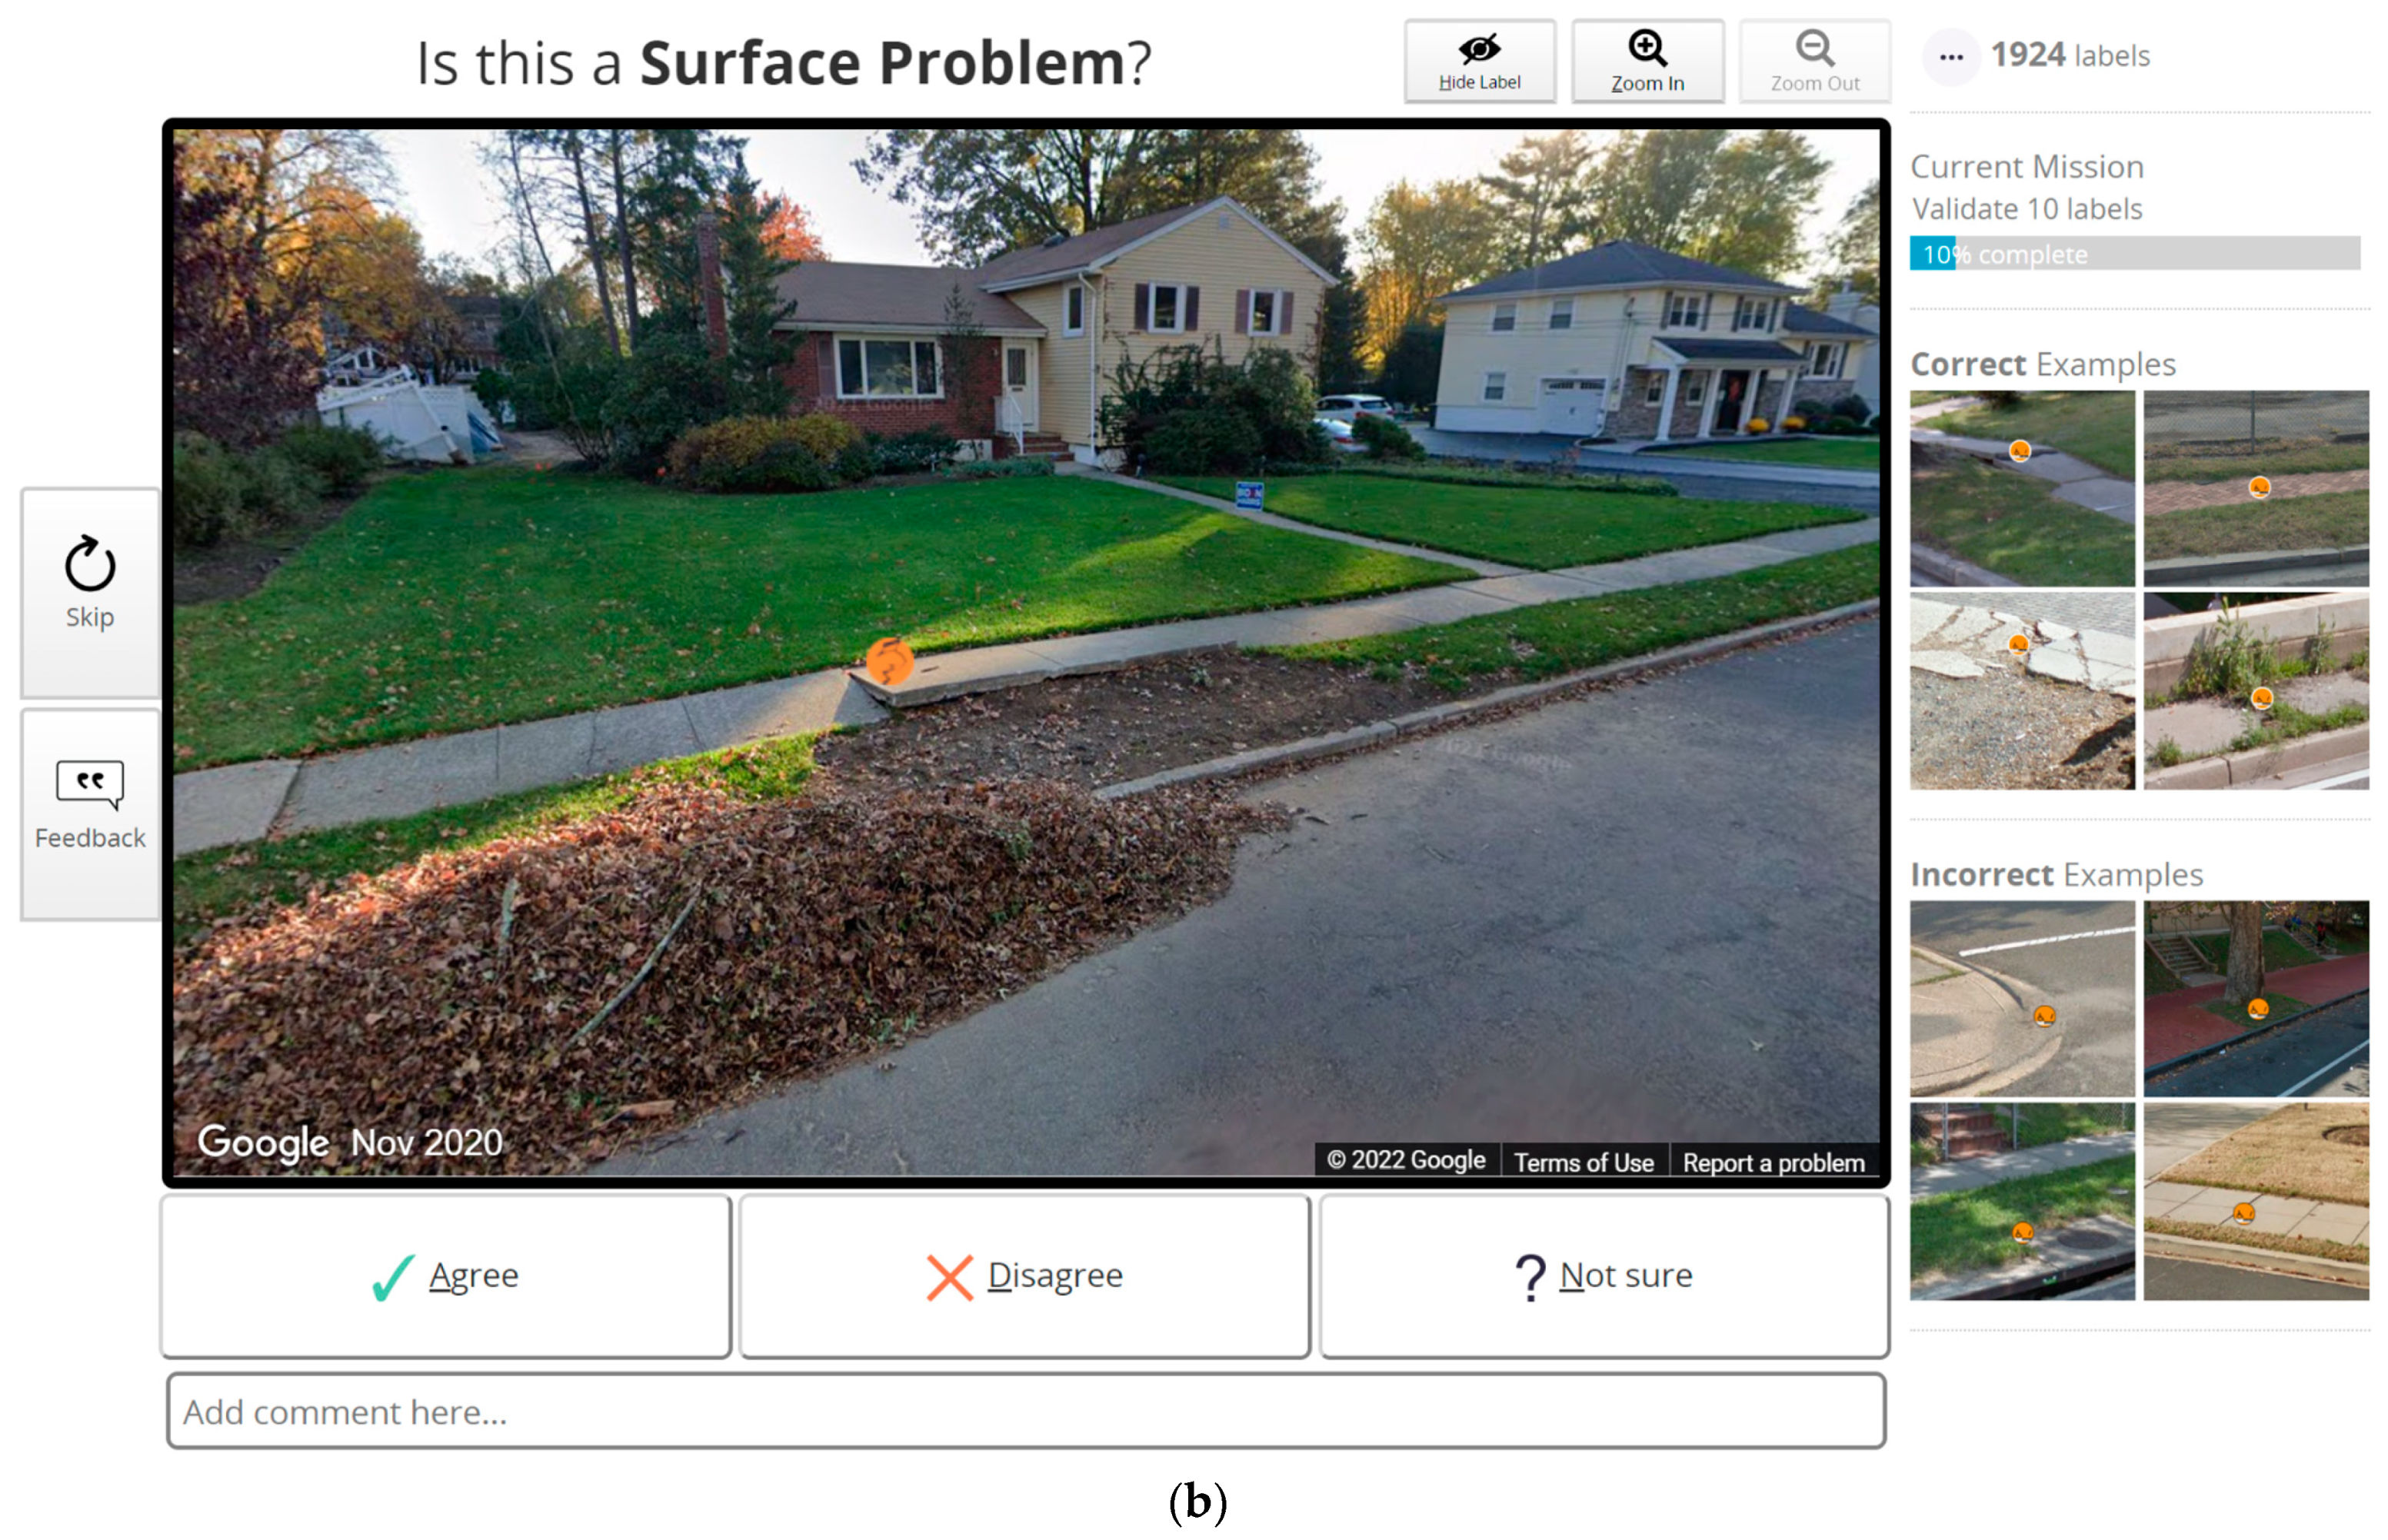
2.1. Project Sidewalk

Project Sidewalk is an open-source crowdsourcing tool that enables online users to remotely label sidewalks and identify accessibility problems via virtually traveling through streetscape imagery drawn from Google Street View [37]. The tool represents a socio-technological approach to data collection, leveraging human/social factors to solve accessibility problems beyond what existing technologies alone are able to address [38]. During auditing missions, users place labels on pedestrian features and accessibility barriers that exist along the sidewalk network (Figure 1a). Users are asked to locate and assess seven different built environment elements—curb ramps, missing curb ramps, obstacles, surface problems, crosswalks, pedestrian signals, and missing sidewalks. Labeling is a three-step process involving categorizing an element, rating its severity according to the element’s overall accessibility, and selecting applicable descriptive tags.
Users also validate existing labels based on perceived correctness. During these validation missions, users determine whether or not a label was correctly used in identifying a sidewalk feature or problem (see Figure 1b). The validated data are used to build machine-learning models for semi-automatically finding and assessing built environment accessibility features, thus being a faster alternative to traditional on-the-ground data collection methods [27].

2.2. Workshops Participants

A purposeful sample of participants were recruited from four stakeholder groups from the Chicago area: (1) people with mobility limitations, (2) people with visual limitations, (3) caregivers, and (4) ADA coordinators and urban planners. Potential participants were eligible if they could read and understand English and were 18 years of age or older. Additionally, people with disabilities and caregivers had to self-identify as having a mobility or visual limitations, be able to leave home, and have experience moving about on sidewalks or assisting a person with a disability that they care for as a caregiver. Participants with disabilities and caregivers were compensated for their participation in the workshops.
An email invitation was shared with the advisory committee members, who shared it with their networks. The email invitation was also shared with several organizations representing people with disabilities, or urban planners and ADA coordinators. Interested participants contacted a research assistant. The participants who agreed to participate in the study provided verbal consent before the workshops.

2.3. Data Collection

We conducted nine workshops in two phases in Spring and Summer 2022. The workshops were sequential, with the second phase building on the first. The workshops were facilitated by the first and second authors [blinded for review], with the support of the project coordinator and a research assistant. The facilitators were researchers with expertise in qualitative and community-based research, accessibility and urban planning, social participation, and who have been working with individuals with disabilities for more than a decade. One of the facilitators has also been active in accessibility research in the Chicago area for multiple years and knew some of the participants. The research assistant and project coordinator were master students in urban planning and public affairs when we conducted the workshops.

2.3.1. First Series of Workshops

We conducted the first workshop phase with each group of stakeholders separately to ensure that all participants were able to contribute meaningfully despite power, resource, and decision-making differentials [39]. The team conducted a total of seven workshops for a total of 51 individuals (see Figure 2): two groups with 12 people with mobility limitations, two groups with 14 people visual limitations, one group with 9 caregivers, and two groups with 16 ADA coordinators and urban planners. The themes discussed during the workshop were the same across the different groups of stakeholders, with some variations in the way the questions were asked to fit the experiences of each group. The workshops were divided into two parts. In the first part, we focused on exploring the perceptions around information and data on accessibility (e.g., What does information on accessibility of municipalities mean to you? Where do you go for accessibility information?) and on the usage and relevance of accessibility tools for them (e.g., What are your perspectives on using technology, such as crowdsourced data and AI, for gathering accessibility data? What are challenges in using these technologies?). The second part of the workshop started with a brief presentation of Project Sidewalk—its goal, general functioning, and labels—followed by questions regarding the tool and its possible usage (e.g., features liked or less liked, how it could be used by different stakeholders, etc.).
We asked the participants for their preferences between an in-person and online meeting, and they all preferred to meet online. Therefore, the workshops were conducted using the Zoom platform (Zoom Meetings, 5.11.1; Zoom Video Communications, Inc., San Jose, CA, USA) [40] and lasted two hours. Problems with internet connections have been reported as an issue with Zoom interviews [41]. However, we only had one participant with a connectivity issue, and we were able to reschedule them to another group. Some of our participants connected via phone. The workshops were audio- and video-recorded. During the workshop, the team also used a variety of interactive tools such Zoom whiteboards for people to share their thoughts in writing, survey polls, and large group video discussions. The participants also used the chat to share their perspectives. The chats were saved and downloaded for analysis. After the first workshop, participants completed a demographics questionnaire adapted for each sub-group; participants with mobility disabilities and who are blind and have low vision received the same demographic questionnaire.

2.3.2. Second Series of Workshops

We invited participants from the first workshop to attend a second workshop that combined the different groups of stakeholders together. We held two workshops for a total of 21 participants, including 6 people with mobility disabilities, 5 blind and low-vision individuals, 4 caregivers, and 6 ADA coordinators and urban planners. We tried to balance between participant types to ensure representation from each stakeholder group.
The second workshop phase was organized around the main themes that resulted from the first workshop analysis. Focusing on these themes allowed us to further understand how the different stakeholder groups perceived and would use accessibility data and Project Sidewalk. We also wanted the different stakeholders to hear each other’s perspectives from the first series of workshops and build on the themes that previously emerged in separate groups. We started by sharing the results of the first workshops and asked for participant feedback, as a form of member checking. Then, we used a series of scenarios to delve into each of the three main types of uses identified (see Section 3), and for each scenario, we discussed the main themes identified in the first series of workshops. The second workshops were also conducted online via Zoom and were approximately two hours. The same facilitators led the workshops with the help of the project coordinator. We reviewed the content of the second workshops to see if new content emerged and added it to our analysis of the first workshop. Section 3 below covers content from both workshops.

2.3.3. Data Analysis

Workshop audio recordings were transcribed, and the transcripts of the group discussion were analyzed following a series of steps. First, the two facilitators coded separately each of the seven groups using inductive analysis, also known as conventional content analysis [42]. In this approach, codes are defined during the analysis and derived directly from the data [42], in our case, the discourse of the participants during the workshops. Then, they merged their coding and discussed which codes to keep via consensus and to avoid redundancies. Then, the research team with expertise in qualitative and participatory research approaches, accessibility, and community involvement reviewed the codes and grouped them into subthemes and larger topics. These were used to structure the discussion with the participants in the second workshop. To improve the credibility of the research, all the authors discussed their perspectives and came to an agreement about each theme.

3. Results

3.1. Participants

Among the 51 participants that participated in the first workshop, 36 completed the demographic questionnaire. Table 1 presents a summary of their demographic characteristics. The ages of the surveyed participants ranged from 18 to 79. The majority of participants with disabilities (mobility and visual) and caregivers lived in denser urban areas (n = 17, 60.8%). Participants with disabilities (mobility and visual) and caregivers had a mix of employment statuses. Most ADA coordinators and urban planners (n = 6, 75%) were working for agencies that served local and regional areas, and all the ADA coordinators and urban planners worked full time. They had various experiences with ADA transition planning, accessibility data inventory, and crowdsourcing tools. The majority of participants with mobility limitations used power wheelchairs (n = 7, 63.4%). Amongst participants with visual limitations, the majority of respondents (n = 9, 90%) used a white cane. For their primary mode of transportation, riding as a passenger was the most used option for individuals with mobility limitations (n = 7, 63.4%) and public transportation (bus or train) for those with visual limitations (n = 4, 40%). All participants with mobility limitations described how they used Google Maps, while the majority of respondents who had visual limitations (n = 6, 60%) indicated that they used specific apps designed for people with visual impairments to travel in their communities (See Table 1).

3.1.1. Perspectives on Accessibility Data, Crowdsourcing, and AI Tools

The discussions during the first round of workshops covered a variety of topics including information (data) on the accessibility of sidewalk and pedestrian infrastructure in general, technology, crowdsourcing and AI tools, as well as Project Sidewalk. While the different topics we identified were sometimes addressed by all groups of participants (people with mobility or visual limitations, caregivers, and ADA coordinators and urban planners), other topics were reported by only some of the groups. For clarity and consistency, we will present the perspectives pertaining to accessibility data and socio-technological tools in general first; then, we will specify elements that specifically concern Project Sidewalk, and, if applicable, we will highlight the variations between the groups. The topics discussed are presented in Table 2.

3.1.2. Usage of Accessibility Data and Tools

During the workshops, the participants discussed elements related to the purpose of accessibility data and socio-technological tools such as Project Sidewalk. It emerged from the exchanges that the participants were perceiving the purpose of accessibility data differently depending on their needs and their experiences within the pedestrian environment. For instance, participants with disabilities (mobility and visual limitations) and caregivers talked about how having information about the accessibility of sidewalks could be used to plan their travel and to help choose the easiest and safest routes. One participant with a mobility limitation commented that it was “very important to have information on accessibility for cities […] for freedom. It will give you better planning […] If you have this information on accessibility, you know you can actually get to this place”. Participants with disabilities envisioned that information about the accessibility of the sidewalk would help them know better what to expect during their travel. Being able to manage their expectations could also increase their feeling of security.
In contrast, the groups of ADA coordinators and urban planners explained that accessibility data could be used to develop barrier removal plans in municipalities, and how data collected through tools such as Project Sidewalk could support that effort. They reported how accessibility data gathered through crowdsourcing and AI tools could assist in identifying areas where pedestrian infrastructure was in the worst condition and support the prioritization of barrier removal and improvement. This was especially relevant when discussed in relation to municipal budgets; as one participant in the ADA coordinator and urban planner group commented, they wanted to know how to “get the most bang for my buck” when it came to allocating a “limited budget” to sidewalk improvements.
All the groups also talked about how collecting accessibility information could be used by people with disabilities to advocate for accessibility improvement and raise awareness amongst elected officials and professionals about accessibility issues. One caregiver explained how having access to accessibility data could impact policies: “I think the data could also be used at the legislative level, like across the board with funding, you know getting more funding if we can say, you know, X city has sidewalks, and this needs to be done. So, I feel like the data collected could be used in a transformative way to make positive changes for the community”. The participants also felt that having a clear picture of the current conditions of accessibility could also make municipalities and the general public recognize the multiple barriers that people with disabilities encounter in their daily life.
People with disabilities also explained how they were currently using socio-technological tools such as smart phone apps or Google Maps to plan their route more effectively, especially the participants with visual limitations. However, they explained how many of the current tools did not really include information on the accessibility of the pedestrian infrastructure such as the condition of the sidewalks, presence of curb ramps, etc. Those tools mostly focus on barriers inside buildings and public facilities or public transportation. They perceived that Project Sidewalk was unique in that sense. They wished that Project Sidewalk could be used while they were navigating their environment in real time, which the tool is currently not designed for. The ADA coordinators were mentioning that the type of socio-technological tools currently used to gather data about accessibility issues were mainly crowdsourcing systems such as a non-emergency information reporting system that would receive complaints from citizens via phone or city apps.

3.1.3. Management and Collection of Accessibility Data

One area where all the groups overlapped in their discussion was the importance of considering the management and sharing of information and data on accessibility. Participants felt that accessibility data should be centralized with other kinds of related information such as transit or road safety data. The centralization of data would increase availability and accessibility for all users. It would allow people with disabilities and caregivers who needed to access information on the accessibility of sidewalks to find it in the same place where they would find other useful information for their travels. As a participant with visual limitations commented in reference to planning a trip, if they have to “dig” for accessibility data, “then chances are I’m not going to that town because it’s not presenting as an accessible place”. For the ADA coordinators and urban planners, centralization also meant that the accessibility data gathered, with Project Sidewalk for instance, would be integrated with other databases that municipalities currently have to track their pedestrian infrastructure, roads, or other municipal assets, for instance, connecting data with existing inventories of municipal data focusing on walkability or safety. Overall, participants from all groups wanted to avoid the creation of yet another data collection platform that would be difficult to find and access, or that would become a burden for municipalities to manage.
Related to the management of data, the participants also talked about having the right amount of data to be useful for them, which was perceived as a challenge. Indeed, determining what constitutes the “right” amount of data is not a clear task, with ADA coordinators and urban planners asking, “When do we have enough data to make a good decision?” The participants suggested starting through collecting accessibility data on priority areas such as places near transit or other highly used locations.
Another element discussed concerned who was responsible for collecting the information in the tools. Most of the participants from all the groups agreed that people with disabilities should be involved in collecting the accessibility data, because they are the most impacted by accessibility planning. They were also seen as those having the lived experience of navigating the pedestrian infrastructure. However, some caregivers were concerned that putting the responsibility entirely on individuals with disabilities would increase their burden, as they already shoulder the bulk of accessibility advocacy efforts. One caregiver said, “once it took us more or less nine months just to have the city put five extra seconds on the stop light. It was multiple visits to the [city official] and it was just very exhausting, so being an advocate for the community it’s very challenging, time consuming, and sometimes discouraging…” Therefore, participants with disabilities and caregivers felt that it would be important to compensate people with disabilities for their involvement in collecting accessible data when using tools like Project Sidewalk. Some participants across the groups suggested that it was the municipalities who should be mainly responsible for collecting the information on the pedestrian infrastructure accessibility, while still working with people with disabilities as paid consultants and collaborators.

3.1.4. Accuracy/Trust of Data and Tools

One topic that was largely discussed during the first workshops was the accuracy of the accessibility data that are gathered with socio-technological tools, especially those that use automated or semi-automated approaches, i.e., AI. This was a key issue for people with mobility disabilities who explained how hard it was to find accurate information on accessibility in most of the resources they were using. A common element that came out across groups was the importance of having access to updated data on accessibility. However, what ‘accurate up-to-date’ meant was discussed in different ways by the various groups. People with disabilities (mobility and visual limitations) and caregivers defined accuracy as data that had been verified or could be verified in real time by people with disabilities. They suggested having a feature in accessibility data collection tools, such as Project Sidewalk, that would allow them to upload photos or add comments to provide real-time information on the conditions of the sidewalks. For ADA coordinators and urban planners, accuracy rather meant having ground truth data. For instance, ADA coordinators and urban planners saw data from Project Sidewalk as a good starting point for helping them knowing which areas to prioritize for barriers removal, but they would need to further verify and survey the infrastructure on the ground with physical measurements. In the second workshop, participants added that to be relevant, up-to-date data had to be specific, timely, and be gathered in all seasons to reflect the temporary barriers affecting the accessibility of pedestrian infrastructure.
Additionally, participants from all groups talked about how the accuracy of data was impacted by who collected and assessed the accessibility data. Most participants thought the data would be the most accurate if they were collected by people with disabilities; their lived experience of the environment was a “guarantee” of the improved accuracy of the data. One participant with mobility limitations stated specifically that they “would trust something a lot more if I knew people with disabilities are actually involved in it”. Most socio-technological tools such as Project Sidewalk do not currently collect user demographic information, including any indication of whether a user lives with a disability or not. The participants with mobility and visual limitations suggested adding this information about the users to improve the accuracy of the data. The participants also felt that the accuracy of the data increased when many people were using it. Some participants across the groups mentioned that the validation feature of Project Sidewalk, which allows users to validate the accuracy of the labels placed by other users according to label type, increased the perceived accuracy of the data.
Regarding trust in the data and tools, participants also pointed out the limitations of crowdsourcing and AI for accessibility data. For instance, they talked about the fact that Project Sidewalk relies on Google Street View [37], which sometimes uses outdated imagery and thus does not reflect accurately the current state of the pedestrian infrastructure. Moreover, some people with mobility and visual limitations worried that not all neighborhoods would be included in the data collected, especially low-income and racialized communities. One participant with visual limitations mentioned that it was important to focus on “the neighborhoods and communities in our city that historically are underserved […] to bring equal or equitable access and awareness of the sidewalk pathways in those neighborhoods”. Participants said that it was really important to assess those communities because they often are less accessible for people with disabilities. For the ADA coordinators and urban planners, a limitation was related to the potential of legal liability in using crowdsourced data in formal planning efforts. They expressed concerns that collected data would be unable to hold up against criticisms of quality and accuracy. However, some ADA coordinators and urban planners mentioned that there was similar issue with the quality of data collected with other type of specialized tools such as LiDAR (a method to remotely assess the earth’s surface using light). One urban planner noted, “It’s data, right? Data is dirty, everyone on this call knows that data is dirty. I think as long as the limitations and benefits of the data are understood, it could be another data set that is used to help prioritize location for further review”. Despite these concerns, many participants from all groups explained how having data on accessibility was still improving the data which were currently available.

3.1.5. Access and Accessibility of Data and Tools

The last topic was around the access and accessibility of the data and tools themselves. Participants with disabilities expressed how, to be able to hold their promise, the technology would need to be accessible for people with disabilities. All the groups of participants discussed the importance of “physical” access issues such as having a proper computer or smart phone to use socio-technological tools. Access was also related to the financial aspect of having a cell phone plan with enough data roaming to navigate the internet or use a mobile application while moving about in the community. Many people with disabilities receive financial support through disability benefits, which are not enough for a phone, cell plan, or internet plan with unlimited access. Participants with mobility and visual limitations and caregivers also raised concerns about technological literacy, i.e., the ability to use, manage, understand, and evaluate technology [43] that limits access to tools. They reported that not all people with disabilities have the necessary knowledge to use their computer, internet, or other mobile devices to collect accessibility data, which could represent a barrier to using the tools.
Participants with mobility and visual limitations and caregivers also highlighted the accessibility of the data collecting tools themselves as another potential barrier. They explained that those tools are not always created with people with disabilities in mind, especially individuals with more severe limitations. One caregiver, commenting on the accessibility of Project Sidewalk, noted that it was “not really created with the mindset of other people in mind, and how they think. So, it is good, it is helpful, but there needs to be some more thought put into it from the development and designer perspective”. Project Sidewalk specifically has been developed as a visual analysis tool, which was not accessible for people who were blind and with low vision. The participants with visual limitations suggested different ways that the accessibility data could still be shared with them, such as using image description or including the data collected with Project Sidewalk in navigation apps that they already using.
Finally, the groups of ADA coordinators and urban planners also discussed issues with accessing the data themselves. For instance, some participants mentioned how in some cases, technologically derived accessibility data were expensive, because the technology used to collect them was costly or because those data were owned by entities that would share them at a high price. This is why some ADA coordinators and urban planners argued that it was important to have publicly available data on accessibility, such as those provided by Project Sidewalk.

3.1.6. Second Phase of Workshops

The second series of workshops brought together the participants from all the stakeholder groups to further discuss the main themes from the first set of workshops. The main findings about these workshops we want to highlight is how multi-stakeholder dialogue not only confirmed the themes from the first workshop but created opportunities for participants to share their insights from their unique perspectives with other stakeholders. For instance, members of the ADA coordinator and urban planners group directly sought feedback from the participants with disabilities and their caregivers about how best to undertake the data collection and data sharing processes regarding accessibility. Participants with disabilities highlighted the need for a better understanding of what municipalities were currently doing to address accessibility issues and what information they could share about current sidewalk conditions, affirming the importance of communication between municipalities and their citizens. These exchanges also spoke to the need to create spaces where urban planners, ADA coordinators, people with disabilities, and caregivers could come together to learn from each other. The participants suggested that planners should be creative in the ways those spaces of communication would be developed, such as using an online platform or having meetings in community spaces such as libraries, community centers, or schools.

4. Discussion

Previous research has documented the lack of data on pedestrian infrastructure accessibility and how such missing data limit municipalities’ progress towards barrier removal for people with disabilities [16,21,30]. This unique study examined various stakeholders’ perceptions on the use, gathering and application of sidewalks accessibility data. In addition, we aimed to understand better how stakeholders could use remote and automated socio-technical tools to assess the accessibility of sidewalks.
Participants in our workshops shared different potential purposes of use for accessibility data which varied depending on the groups. While people with disabilities saw opportunities for better capacity to plan travel routes that were accessible, ADA coordinators and urban planners identified opportunities for developing barrier removal plans. These findings speak to the concept of the ‘personal relevance’ of data [44], which posits that people will look and make sense of data from their own needs and experience. Saha and colleagues [31] found similar findings when investigating how individuals with disabilities make sense of sidewalk accessibility visualizations. This suggests the importance of having different groups share their perspectives, as it would not spontaneously occur for people. This sharing and exchange has been shown to increase the recognition of the importance of knowledge sharing [45] and thus of considering others’ perspectives. This was obvious in the second series of workshops, where the different groups of stakeholders really used that opportunity to share their lived experiences and expertise with each other. Integrating multiple perspectives, including people with disabilities’ experiences, has been suggested to allow for a better understanding of accessibility issues [46] and a better implementation of barrier removal planning [47,48].
Interestingly, all groups identified how accessibility data can be used for advocacy to municipal officials. This shared insight illustrates how the different groups perceived a critical need for the continued education of elected officials and policy makers on the reality of accessibility barriers in pedestrian infrastructure. The value of accessibility data for advocacy is well explained in Hamraie’s work [12] that highlighted the limitations of data and maps developed only for compliance to the ADA or other objective criteria. Hamraie’s critique of compliance mapping leads us to ask how well do accessibility data collection approaches enable conversations around access and inclusion? From our findings, it also opens questions of how tensions surrounding accessibility data can be discussed openly to gain a better understanding of which data creation approaches, forms of participation, and data characteristics align with each use of accessibility data? This finding reaffirms the importance of the engagement process that is part of the requirements for the development and implementation of the ADA transition plan in the US [49].
Across the participant groups, there were several issues around accuracy and trust in the data collected with automated and semi-automated methods including crowdsourcing: how up-to-date it was, who was collecting it, how it was collected. These all related to tensions on the quality of data that comes through crowdsourcing methods that were previously identified in research [31,50]. In a study by Saha and colleagues [31], people with disabilities described a lack of trust in information collected by people without disabilities, as well as a need for trust between stakeholders that the data would be used to make concrete changes. Previous research has also reported how trust in the data was a critical challenge to the adoption of crowdsourced data by governments that place greater value on authoritative data [50]. The ADA coordinators and urban planners in this research also had the same mistrust in using crowdsourced data in official planning documentation. Khan and Johnson [51] developed a valuable framework for considering the adoption of crowdsourcing that sought to establish the co-production of crowdsourced data with citizens and governments. Aligning perspectives on trust and the quality of the data are a key part of that framework.
We also found all the participants valued the concept of in-person validation of accessibility data, but there was a difference in the meaning of ground verification, which was also found by Saha et al. [31]. This finding suggests two important lessons regarding perceptions of accessibility data: (1) multiple stakeholders understand the discrepancies between on-site vs. remote data collection, and (2) stakeholders have different meanings for what is considered accessible. This presents important conflicts for tools like Project Sidewalk that solely rest on remote, crowdsourced data. Some of the issues with remote, crowdsourced data have to do with the availability of current Google Street View imagery used for remote auditing [37], which was identified by the study participants as a factor that would make them not trust the data. The participants suggested adding features allowing people to add a comment or a photo to validate in real time if the identified issue is still present. Other new directions for remote auditing tools, like Project Sidewalk, could include attempts to support additional data collection from users in the field. Such efforts have had some success in attracting users to add field-audited information, such as the AccessNow or Wheelmap data collection tools that involve the crowdsourced auditing of public venues. However, wide-spread use of AccessNow and similar crowdsourcing systems has been limited, and both are subject to the same challenge of how to get participants to engage with the system [37].
Another important finding related to access and the accessibility of data and tools was the value placed on centralized and publicly available data on pedestrian infrastructure accessibility. Across stakeholder groups, open data was described as a critical attribute because much existing data on accessibility is not freely available and is either held by private entities or behind Freedom of Information Act request walls in governments. It is critical to recognize here the socio-political contexts that shape the current state of accessibility data, specifically the ADA. Khan and Johnson [51] explain how open data policies are a valuable facilitator of the adoption of crowdsourcing data. There are requirements for local governments to post their grievance policies, the names of ADA coordinators, and their ADA transition plan [49], but there are no policies to make ADA data openly accessible. The open data challenge is well situated in discussions on digital civics, i.e., the ways that data and tools can enable democracy and civic engagement [52,53]. While these digital civics systems might, as promised, help democratize access to policy discussions and policy making, they may also unintentionally exclude people as well (e.g., Project Sidewalk is not a tool that can be used by blind and low-vision users) [12,54]. More research is needed to understand who currently has access to those policy processes, or how people are really impacting decisions when participating in citizen communities around accessibility.
Participants with disabilities in our study identified how applications like Project Sidewalk that use visual analyses of images are inaccessible to individuals with visual limitations. The accessibility of technology in general has been and continues to be a major hurdle for people with disabilities as much technology is not designed with individuals with disabilities in mind [55]. Yet, this challenge should not be a roadblock. Developing alternative modes of data collection that feed into the same system had high importance for participants with disabilities. These contributions could function like complaints in helping to prioritize which pedestrian barriers get fixed first, as Eisenberg et al. [16] found that citizen complaints were a top-ranked criterium for ADA transition plans. Similarly, there are numerous ways to disseminate the resulting data and maps in formats accessible to people who are blind and low-vision that could be implemented in Project Sidewalk and other similar applications [56].
Our workshop findings provide many direct recommendations for projects and initiatives seeking to improve sidewalk accessibility and undertake data collection. The recommendations relate to both how products like Project Sidewalk are designed and also how such tools are implemented in cities. Design-specific recommendations have to do with accessibility alternatives for people who are blind or low-vision, with additional design mechanisms for ensuring accuracy and up-to-date information. Implementation considerations have a lot to do with the relationships between individuals or organizations and local governments and include fostering an open data access framework, using data to facilitate open discussion and the engagement of people with disabilities, and taking steps to facilitate trust in the data and how they are communicated with the community. We plan to use these guidelines and develop an implementation framework for improving sidewalk accessibility data collection and analysis.

Limitations

This study took place in one region in the US, which could represent a limitation. While planning development and policy implementation look different throughout US municipalities, we believe these findings could still benefit most local governments seeking to meet similar accessibility requirements. Some of the findings can also be applied in an international context, where many local governments are choosing to use AI and other technological tools in their urban planning. The workshops were conducted using the virtual meeting platform Zoom. This allowed us to respond to the accessibility and scheduling needs of participants. However, some participants were not able to fully engage in workshop discussions due to technology barriers and screen fatigue. Furthermore, despite our best efforts to address power dynamics between participants, it is still possible that some felt they could not freely express their perspective. Less-active participants were encouraged to engage with the discussion via the Zoom chat function if they preferred not to speak, and facilitators made sure to directly ask participants questions, which may have helped to allow the voices of the participants to be heard.

5. Conclusions

This study focused on the perceptions of the use, gathering, and application of accessibility data and socio-technical tools to assess and plan for accessible sidewalks, drawing from a diverse group of users including people with disabilities, caregivers, and ADA coordinators and urban planners. Through group discussions, we identified critical dimensions of accessibility that varied among the groups, suggesting a need to contextualize accessibility data collection within local community engagement efforts so as to establish trust in the data themselves and in what local governments will do with them. There was agreement among stakeholders that such data has a strong utility in advocacy with decision makers. Our findings also discussed the need for sidewalk data collection initiatives to consider approaches to data centralization, the development of multi-approaches for validation, and the importance of transparency and engagement in the data collection and sharing process. Future research is needed to evaluate these recommended approaches, with cities and communities implementing tools like Project Sidewalk to better understand the feasibility, practicality, and effectiveness of these approaches in developing crowd-sourced accessibility data that are trustworthy, openly accessible, and lead to change in city infrastructure.

Author Contributions

The authors confirm contribution to the paper as follows: study conception and design: Y.E., D.L., J.E.F., J.S. and J.M.H.; data collection: D.L., Y.E. and D.S.; analysis and interpretation of results: Y.E., D.L., J.E.F., D.S., J.S. and J.M.H.; draft manuscript preparation: D.L., Y.E. and D.S. All authors have read and agreed to the published version of the manuscript.

Funding

This project was funded by a National Science Foundation grant as part of their Smart and Connected Communities program (award #2125087).

Institutional Review Board Statement

The study was conducted in accordance with the Declaration of Helsinki and approved by the Ethics Committee of the University of Illinois (# 2021-1356, 3 January 2022).

Informed Consent Statement

Informed consent was obtained from all subjects involved in the study.

Data Availability Statement

The data presented in this study are available on request from the authors.

Acknowledgments

We thank all our participants for their time and their insights. Thank you to Sierra Berquist, and our partners at Access Living, AIM Center for Independent Living, Chicago Metropolitan Agency for Planning, Metropolitan Mayors Caucus, Metropolitan Planning Council, Progress Center for Independent Living, and the Regional Transportation Authority, who assisted with workshop design and participant recruitment.

Conflicts of Interest

J.S. is affiliated with Easterseal. The authors declare no conflict of interest.

References

  1. World Health Organization. World Report on Disability. Available online: http://www.who.int/disabilities/world_report/2011/report.pdf (accessed on 22 November 2022).
  2. Okoro, C.A.; Hollis, N.D.; Cyrus, A.C.; Griffin-Blake, S. Prevalence of Disabilities and Health Care Access by Disability Status and Type Among Adults—United States. Morb. Mortal. Wkly. Rep. 2018, 67, 882–887. [Google Scholar] [CrossRef] [PubMed]
  3. Lid, I.M.; Solvang, P.K. (Dis) ability and the experience of accessibility in the urban environment. ALTER—Eur. J. Disabil. Res./Rev. Eur. Rech. Handicap 2016, 10, 181–194. [Google Scholar] [CrossRef]
  4. Shakespeare, T. The Social Model of Disability. In The Disability Studies Reader, 2nd ed.; Lennard, J.D., Ed.; Routledge: Abingdon, Oxfordshire, UK, 2006; pp. 197–204. ISBN 978-0-4159-5334-4. [Google Scholar]
  5. Bigonnesse, C.; Mahmood, A.; Chaudhury, H.; Mortenson, W.B.; Miller, W.C.; Martin Ginis, K.A. The role of neighborhood physical environment on mobility and social participation among people using mobility assistive technology. Disabil. Soc. 2018, 33, 866–893. [Google Scholar] [CrossRef]
  6. Omura, J.D.; Hyde, E.T.; Whitfield, G.P.; Hollis, N.D.; Fulton, J.E.; Carlson, S.A. Differences in perceived neighborhood environmental supports and barriers for walking between US adults with and without a disability. Prev. Med. 2020, 134, 106065. [Google Scholar] [CrossRef] [PubMed]
  7. Barclay, L.; McDonald, R.; Lentin, P.; Bourke-Taylor, H. Facilitators and barriers to social and community participation following spinal cord injury. Aust. Occup. Ther. J. 2016, 63, 19–28. [Google Scholar] [CrossRef] [PubMed]
  8. Labbé, D.; Mahmood, A.; Seetharaman, K.; Miller, W.C.; Mortenson, W.B. Creating inclusive and healthy communities for all: A photovoice approach with adults with mobility limitations. Soc. Sci. Med. Qual. Methods 2022, 2, 100173. [Google Scholar] [CrossRef]
  9. Rosenberg, D.E.; Huang, D.L.; Simonovich, S.D.; Belza, B. Outdoor built environment barriers and facilitators to activity among midlife and older adults with mobility disabilities. Gerontologist 2012, 53, 268–279. [Google Scholar] [CrossRef]
  10. Warner, G.; Desrosiers, J.; Packer, T.; Stadnyk, R. Factors affecting ability and satisfaction with social roles in persons with neurological conditions: The importance of mobility and stigma. Br. J. Occup. Ther. 2018, 81, 207–217. [Google Scholar] [CrossRef]
  11. Levasseur, M.; Généreux, M.; Bruneau, J.F.; Vanasse, A.; Chabot, É.; Beaulac, C.; Bédard, M.M. Importance of proximity to resources, social support, transportation and neighborhood security for mobility and social participation in older adults: Results from a scoping study. BMC Public Health 2015, 15, 503. [Google Scholar] [CrossRef]
  12. Hamraie, A. Mapping Access: Digital Humanities, Disability Justice, and Sociospatial Practice. Am. Q. 2018, 70, 455–482. [Google Scholar] [CrossRef]
  13. Imrie, R.; Luck, R. Designing inclusive environments: Rehabilitating the body and the relevance of universal design. Disabil. Rehabil. 2014, 36, 1315–1319. [Google Scholar] [CrossRef] [PubMed]
  14. Milligan, N.V.; Nieuwenhuijsen, E.R.; Grawi, C.L. Using a participatory action strategic approach to enhance accessibility and participation in arts and cultural events: Results of four focus groups. Disabil. Health J. 2014, 7, 105–113. [Google Scholar] [CrossRef] [PubMed]
  15. Americans with Disabilities Act of 1990 (1990). 42 U.S.C. §§ 12131–12134. Available online: https://www.ada.gov/law-and-regs/ada/ (accessed on 2 October 2023).
  16. Eisenberg, Y.; Heider, A.; Gould, R.; Jones, R. Are communities in the United States planning for pedestrians with disabilities? Findings from a systematic evaluation of local government barrier removal plans. Cities 2020, 102, 102720. [Google Scholar] [CrossRef]
  17. Ferleger, D. Planning for Access: Sidewalks and the Americans with Disabilities Act. Plan. Environ. Law 2012, 64, 3–8. [Google Scholar] [CrossRef]
  18. National Council on Disability. The Impact of the Americans with Disabilities Act: Assessing the Progress toward Achieving the Goals of the ADA. Available online: https://www.aucd.org/docs/ADA%20Impact%20Report.pdf (accessed on 2 October 2023).
  19. Stafford, L.; Baldwin, C. Planning Walkable Neighborhoods: Are We Overlooking Diversity in Abilities and Ages? J. Plan. Lit. 2018, 33, 17–30. [Google Scholar] [CrossRef]
  20. Ai, C.; Tsai, Y. Automated Sidewalk Assessment Method for Americans with Disabilities Act Compliance Using Three-Dimensional Mobile Lidar. Transp. Res. Rec. J. Transp. Res. Board 2016, 2542, 25–32. [Google Scholar] [CrossRef]
  21. Deitz, S.; Lobben, A.; Alferez, A. Squeaky wheels: Missing data, disability, and power in the smart city. Big Data Soc. 2021, 8. [Google Scholar] [CrossRef]
  22. Levine, K.; Karner, A. Approaching accessibility: Four opportunities to address the needs of disabled people in transportation planning in the United States. Transp. Policy 2023, 131, 66–74. [Google Scholar] [CrossRef]
  23. Mahmood, A.; O’Dea, E.; Bigonnesse, C.; Labbé, D.; Mahal, T.; Qureshi, M.; Mortenson, W.B. Stakeholders Walkability/Wheelability Audit in Neighbourhoods (SWAN): User-led audit and photographic documentation in Canada. Disabil. Soc. 2020, 35, 902–925. [Google Scholar] [CrossRef]
  24. Prescott, M.; Miller, W.C.; Routhier, F.; Mortenson, W.B. Factors affecting the activity spaces of people who use mobility devices to get around the community. Health Place 2020, 64, 102375. [Google Scholar] [CrossRef]
  25. Eisenberg, Y.; Hofstra, A.; Berquist, S.; Gould, R.; Jones, R. Barrier-removal plans and pedestrian infrastructure equity for people with disabilities. Transp. Res. Part D Transp. Environ. 2022, 109, 103356. [Google Scholar] [CrossRef]
  26. Seekins, T.; Rennie, B.; Hammond, J. Exploring the Feasibility of Using “Google Street View” to Assess the Accessibility of Community Environments: Developing Definitions and Observational Protocol for Image Recognition and Classification. Environ. Contexts Disabil. 2014, 8, 123–139. [Google Scholar] [CrossRef]
  27. Hara, K.; Sun, J.; Moore, R.; Jacobs, D.; Froehlich, J. Tohme: Detecting curb ramps in google street view using crowdsourcing, computer vision, and machine learning. In Proceedings of the 27th annual ACM symposium on User Interface Software and Technology UIST ‘14, Honolulu, HI, USA, 5–8 October 2014; Association for Computing Machinery: New York City, NY, USA, 2015; pp. 189–204. [Google Scholar]
  28. Hosseini, M.; Saugstad, M.; Miranda, F.; Sevtsuk, A.; Silva, C.T.; Froehlich, J.E. Towards Global-Scale Crowd+AI Techniques to Map and Assess Sidewalks for People with Disabilities. In Proceedings of the AVA: Accessibility, Vision, and Autonomy (CVPR 2022 Workshop), New Orleans, LA, USA, 19–24 June 2022. [Google Scholar] [CrossRef]
  29. Gibson, P.J.; Marshall, W.E. Disparate Approaches to Maintaining Roads and Sidewalks: An Interview Study of 16 U.S. Cities. Transp. Res. Rec. 2022, 2676, 553–567. [Google Scholar] [CrossRef]
  30. Froehlich, J.E.; Brock, A.M.; Caspi, A.; Guerreiro, J.; Hara, K.; Kirkham, R.; Schöning, J.; Tannert, B. Grand challenges in accessible maps. Interactions 2019, 26, 78–81. [Google Scholar] [CrossRef]
  31. Saha, M.; Chauhan, D.; Patil, S.; Kangas, R.; Heer, J.; Froehlich, J.E. Urban Accessibility as a Socio-Political Problem: A Multi-Stakeholder Analysis. Proc. ACM Hum. -Comput. Interact. 2020, 4, 1–26. [Google Scholar] [CrossRef]
  32. Terashima, M.; Clark, K. The Precarious Absence of Disability Perspectives in Planning Research. Innov. Dev. Urban Plan. Scholarsh. Res. 2021, 6, 120–132. [Google Scholar] [CrossRef]
  33. Korngold, D.; Lemos, M.; Rohwer, M. Smart Municipalities for All: A Vision for an Inclusive, Accessible Urban Future. AT&T. 2017. Available online: https://g3ict.org/publication/smart-cities-for-all-a-vision-for-an-inclusive-accessible-urban-future#:~:text=Accessible%2C%20Urban%20Future-,Smart%20Cities%20for%20All%3A%20A%20Vision,an%20Inclusive%2C%20Accessible%2C%20Urban%20Future&text=Smart%20cities%20aspire%20to%20use,as%20we%20lead%20our%20lives (accessed on 13 October 2023).
  34. Bolten, N.; Caspi, A. Towards routine, city-scale accessibility metrics: Graph theoretic interpretations of pedestrian access using personalized pedestrian network analysis. PLoS ONE 2021, 16, e0248399. [Google Scholar] [CrossRef]
  35. Eisenberg, Y.; Glover, J.; Winnick, A.; Berquist, S.; Abuwaer, N.; Casterjon, A. Where the Sidewalk Ends: The State of Municipal ADA Transition Planning for the Public Right-of-Way in the Chicago Region. 2021. Available online: https://www.metroplanning.org/uploads/cms/documents/ensemblemedia_mpc_adatransitionplanreport_compliant.pdf (accessed on 10 October 2023).
  36. Ørngreen, R.; Levinsen, K.T. Workshops as a research methodology. Electron. J. E-Learn. 2017, 15, 70–81. [Google Scholar]
  37. Saha, M.; Saugstad, M.; Maddali, H.T.; Aileen, Z.; Holland, R.; Bower, S.; Dash, A.; Chen, S.; Li, A.; Hara, K.; et al. Project Sidewalk: A Web-based Crowdsourcing Tool for Collecting Sidewalk Accessibility Data at Scale. In Proceedings of the 2019 CHI Conference on Human Factors in Computing Systems CHI ‘19, Glasgow, Scotland, UK, 4–9 May 2019; Association for Computing Machinery: New York City, NY, USA, 2019; pp. 1–14. [Google Scholar]
  38. Bigham, J.P.; Ladner, R.E.; Borodin, Y. The design of human-powered access technology. In Proceedings of the 13th International ACM SIGACCESS Conference on Computers and Accessibility ASSETS’ 11, Dundee, Scotland, UK, 24–26 October 2011; Association for Computing Machinery: New York City, NY, USA, 2011; pp. 3–10. [Google Scholar]
  39. Santos, S.L.; Chess, C. Evaluating Citizen Advisory Boards: The Importance of Theory and Participant-Based Criteria and Practical Implications. Risk Anal. 2003, 23, 269–279. [Google Scholar] [CrossRef]
  40. Zoom Video Communications Inc. Security Guide. Available online: https://explore.zoom.us/docs/doc/Zoom-Security-White-Paper.pdf (accessed on 13 October 2023).
  41. Archibald, M.M.; Ambagtsheer, R.C.; Casey, M.G.; Lawless, M. Using Zoom Videoconferencing for Qualitative Data Collection: Perceptions and Experiences of Researchers and Participants. Int. J. Qual. Methods 2019, 18, 1–8. [Google Scholar] [CrossRef]
  42. Hsieh, H.F.; Shannon, S.E. Three approaches to qualitative content analysis. Qual. Health Res. 2005, 15, 1277–1288. [Google Scholar] [CrossRef]
  43. International Technology and Engineering Educators Association (2022), Standards for Technological Literacy: Content for the Study of Technology 3rd Edition. Available online: https://assets-002.noviams.com/novi-file-uploads/iteea/standards/xstnd.pdf (accessed on 13 October 2023).
  44. Peck, E.M.; Ayuso, S.E.; El-Etr, O. Data is personal: Attitudes and perceptions of data visualization in rural Pennsylvania. In Proceedings of the 2019 CHI Conference on Human Factors in Computing Systems CHI ‘19, Glasgow, Scotland, UK, 4–9 May 2019; Association for Computing Machinery: New York City, NY, USA, 2019; pp. 1–12. [Google Scholar]
  45. Landry, R.; Amara, N.; Lamari, M. Climbing the ladder of research utilization evidence from social science research. Sci. Commun. 2001, 22, 396–422. [Google Scholar] [CrossRef]
  46. Lid, I.M. Implementing universal design in a Norwegian context: Balancing core values and practical priorities. Disabil. Stud. Q. 2016, 36, 1–15. [Google Scholar] [CrossRef]
  47. Kadir, S.A.; Jamaludin, M.; Rahim, A.A. Building managers’ views on accessibility and UD Implementation in public buildings: Putrajaya. J. ASIAN Behav. Stud. 2018, 3, 47–54. [Google Scholar] [CrossRef]
  48. Lid, I.M. Universal design and disability: An interdisciplinary perspective. Disabil. Rehabil. 2014, 36, 1344–1349. [Google Scholar] [CrossRef]
  49. Federal Highway Administration. Access for Individuals with Disabilities under Section 504 of the Rehabilitation Act and Title II of the ADA Handbook; Federal Highway Administration: McLean, VA, USA, 2007; FHWA-HCR-07-002.
  50. Goodchild, M.F.; Li, L. Assuring the Quality of Volunteered Geographic Information. Spat. Stat. 2012, 1, 110–120. [Google Scholar] [CrossRef]
  51. Khan, Z.T.; Johnson, P.A. Citizen and government co-production of data: Analyzing the challenges to government adoption of VGI. Can. Geogr./Géographe Can. 2020, 64, 374–387. [Google Scholar] [CrossRef]
  52. Haklay, M. How good is volunteered geographic information? A comparative study of OpenStreetMap and Ordnance Survey datasets. Environ. Plan. B Plan. Des. 2010, 37, 682–703. [Google Scholar] [CrossRef]
  53. Vlachokyriakos, V.; Crivellaro, C.; Le Dantec, C.A.; Gordon, E.; Wright, P.; Olivier, P. Digital civics: Citizen empowerment with and through technology. In Proceedings of the 2016 CHI Conference Extended Abstracts on Human Factors in Computing Systems CHI ‘16, San Jose, CA, USA, 7–12 May 2016; Association for Computing Machinery: New York City, NY, USA, 2016; pp. 1096–1099. [Google Scholar]
  54. Dickinson, J.; Díaz, M.; Le Dantec, C.A.; Erete, S. “The cavalry ain’t coming in to save us”: Supporting Capa Municipalities and Relationships through Civic Tech. Proc. ACM Hum.-Comput. Interact. 2019, 3, 1–21. [Google Scholar] [CrossRef]
  55. Dobransky, K.; Hargittai, E. The disability divide in internet access and use. Inf. Commun. Soc. 2006, 9, 313–334. [Google Scholar] [CrossRef]
  56. Hennig, S.; Zobl, F.; Wasserburger, W.W. Accessible Web Maps for Visually Impaired Users: Recommendations and Example Solutions. Cartogr. Perspect. 2017, 88, 6–27. [Google Scholar] [CrossRef]
Figure 1. (a). Project Sidewalk auditing interface. (b). Project Sidewalk validation interface. Screenshots courtesy of Project Sidewalk (http://projectsidewalk.org, accessed on 13 October 2023), which is available under the Creative Commons CC-BY license.
Disabilities 03 00040 g001aDisabilities 03 00040 g001b
Figure 2. Study design and participants.
Disabilities 03 00040 g002
Table 1. Participant demographic characteristics (n = 36).
Characteristics PwML *
(n = 11)
PwVL ** (n = 10) Caregivers (n = 7) ADA Coordinators and Urban Planners
(n = 8)
Age range 18–39 5 6 1 3
40–49 - - 3 3
50–64 2 4 3 2
65–79 4 - - -
Place of residence Urban 5 8 4 -
Suburban 5 2 3 -
Level of government Local - - - 2
Region (within State) - - - 4
State - - - 2
Employment status Full time (35+ h/week) 3 3 3 8
Part time (up to 34 h/week) 2 1 1 -
Unemployed or retired 6 6 3 -
Assistive device Cane(s) 2 2 - -
Crutches 2 - - -
Walker 2 - - -
Manual Wheelchair 1 - - -
Power Wheelchair 7 - - -
Scooter - - - -
Service dog - 2 - -
White cane - 9 - -
Other (e.g., screen reader) 1 1
Primary mode of transportation Personal vehicle (as passenger) 7 3 - -
Walk or wheel - - - -
Paratranasit/dial-a-ride 2 1 - -
Ride share app (Uber/Lyft) - 1 - -
Local transit (bus, train) 2 4 - -
Use of website or app for route planning
& wayfinding
Direction websites (Google maps) 7 1 - -
Navigation apps for people with visual limitations - 6 - -
Organization completed an ADA transition plan - - - 5
Organization has collected Public-Right-Of-Way data - - - 3
Organization has used crowdsourced data- - - 4
* People with mobility limitations. ** People with visual limitations.
Table 2. Topics discussed by the participants during the first series of workshops.
Topics Discussed Content
Usage of Accessibility data and tools Purposes varies depending on the users
Current use of accessibility tools
Management and Collection of Accessibility data Centralization of accessibility data with other infrastructure information
Right amount of data
Responsibility of data collection
Accuracy/Trust of Data and Tools Having access to updated data
Accuracy affected by data collector
Limitations of crowdsourcing and AI
Access and Accessibility of Data and Tools Issues with technology of tools
Accessibility of the online data collection tools
Public access to the data
Disclaimer/Publisher’s Note: The statements, opinions and data contained in all publications are solely those of the individual author(s) and contributor(s) and not of MDPI and/or the editor(s). MDPI and/or the editor(s) disclaim responsibility for any injury to people or property resulting from any ideas, methods, instructions or products referred to in the content.

