Article

State Anxiety in People Living with Disability and Visual Impairment during the COVID-19 Pandemic

by
Nikki Heinze
1,2,†,
Claire L. Castle
1,2,†,
Syeda F. Hussain
1,2,
Lauren R. Godier-McBard
3,
Theofilos Kempapidis
1,2 and
Renata S. M. Gomes
1,2,4,*
1
BRAVO VICTOR, Research, 12–14 Harcourt Street, London W1H 4HD, UK
2
Research & Innovation, Blind Veterans UK, 12–14 Harcourt Street, London W1H 4HD, UK
3
Veterans and Families Institute for Military Social Research, Anglia Ruskin University, Chelmsford CM1 1SQ, UK
4
Northern Hub for Veterans and Military Families Research, Department of Nursing, Midwifery and Health, Faculty of Health and Life Sciences, Northumbria University, Newcastle upon Tyne NE7 7XA, UK
*
Author to whom correspondence should be addressed.
These authors contributed equally to this work.
Disabilities 2022, 2(2), 235-246; https://doi.org/10.3390/disabilities2020017
Submission received: 11 November 2021 / Revised: 3 March 2022 / Accepted: 12 April 2022 / Published: 20 April 2022
(This article belongs to the Special Issue Disability and COVID-19)

Abstract

:
There has been growing recognition of the impact of COVID-19 and the restrictions implemented to contain the virus on mental health. This study provides a preliminary assessment of the longitudinal impact on state anxiety in individuals with disabilities and a subsample of individuals with visual impairment (VI). Two surveys were conducted in April–May 2020 (T1) and March 2021 (T2) to explore state anxiety (State-Trait Anxiety Inventory). Participants who consented to being re-contacted were invited to take part in T2. A total of 160 participants completed T1 and T2. There were no significant group differences in median anxiety at T1; however, at T2 anxiety was significantly higher in those with disabilities and there was a trend towards being higher in participants with VI compared to those with no disabilities. While not statistically significant within any of the three subgroups, state anxiety decreased slightly in those with no disabilities. The absence of a disability affecting mobility, experiencing loneliness, and poorer sleep quality predicted state anxiety at both timepoints. While anxiety appeared to decrease in individuals with no disabilities, it remained comparatively stable, and higher in those with disabilities. Loneliness and poor sleep may need to be addressed to alleviate feelings of anxiety.

1. Introduction

Governments around the globe introduced a range of measures of varying strictness to contain the COVID-19 pandemic. In addition to mask-wearing and social distancing, the United Kingdom (UK) government has also implemented three national lockdowns to date, in March 2020, November 2020, and January 2021, which required non-essential shops and schools to close and people to stay at home except for essential purposes. This resulted in substantial changes to working patterns, including a shift to home-based working, reduced hours, furlough, and job loss. Job and financial insecurity as well as health concerns during this time have been associated with feelings of fear, stress, and anxiety [1,2,3,4]. Women [5,6,7], those with chronic illness [5,8] and poor sleep quality [8] have been found to be at increased risk of anxiety during the pandemic, but conflicting evidence exists for the role of age, marital status, and living situation [5,8]. There is also concern about the impact of social restrictions on isolation and loneliness [9,10], which has been found to be a risk factor for anxiety during the pandemic [11,12,13].
Research suggests that people living with disabilities, such as visual impairment (VI), which tends to include those with sight impairment (partially sighted) and severe sight impairment (blindness), may have been at greater risk of negative financial outcomes, social isolation, loneliness, and reduced access to healthcare during the pandemic [7,14,15]. Whilst remotely delivered healthcare was valuable during this time [16], there have been concerns regarding the practicalities of these approaches in meeting the needs of individuals with disabilities, such as hearing and visual impairment and poor dexterity, and addressing individuals’ health needs with reduced access to clinical data [17]. People living with disabilities may also be at particular risk of experiencing a negative impact of the pandemic on mental health. Higher levels of anxiety and depression have been found in people with pre-existing physical and mental health conditions compared to those without health conditions [7,18], and those with moderate or severe VI were at least twice as likely to report a negative impact of lockdown on their mental health compared to people with mild or no VI [19]. Even before the pandemic, sight loss had been associated with a poorer quality of life, poorer social functioning, and negative mental health outcomes [20,21,22,23,24,25], although there is conflicting evidence relating to the impact of VI on anxiety [26,27]. Given the association between disability and negative mental health outcomes during the pandemic, as well as the long-term implications for public mental health [9], this paper provides a preliminary assessment of the levels of and changes in state anxiety during the pandemic in people living with disability in general and a subsample of those living with VI (self-reporting “visual impairment or blindness”), compared to those without disability.

2. Materials and Methods

This study utilises longitudinal data from two online surveys. Data were collected from 1 April to 15 May 2020 (T1) and 8–28 March 2021 (T2). The methods described below, along with sample characteristics and changes made to the questionnaire to improve data quality at T2, are reported elsewhere [28,29]. Microsoft Forms (Microsoft Corporation, Redmond, WA, USA) was used to develop the survey, which provides the user with features including colour contrast, high contrast settings, and compatibility with screen readers to meet the needs of participants with VI. The accessibility of the survey was reviewed by the accessibility team at Blind Veterans UK (BVUK), a charity supporting veterans of all ages living with VI. Consultation with the Medical Sciences Interdivisional Research Ethics Committee at the University of Oxford confirmed that ethical approval was not required for the study.

2.1. Materials

The questionnaire contained sections on demographics, including disability and employment status, self-isolation and living situation, health behaviours (e.g., smoking and exercise), sleep quality, state anxiety, and loneliness.
Disability status was assessed by asking participants first, if they had a disability and then, to indicate which type of disability/-ies they had from a list of 16 conditions. This list was informed by UK government guidance on defining disability. Self-isolation status was assessed by asking participants how long they had been self-isolating. At T2, a definition of self-isolation was added to the question (“By self-isolating we mean staying at home, except for urgent medical assistance, and not having any visitors”). Sleep quality and loneliness were assessed using the Pittsburgh Sleep Quality Index (PSQI) [30], and the UCLA Loneliness Scale (version 3) [31], respectively. In order to explore the impact of the pandemic at different timepoints, a measure was sought which assessed current feelings of anxiety (state anxiety), rather than anxiety disorders or trait anxiety, which assesses a person’s general disposition to feelings of anxiety. The state anxiety subscale of the State Trait Anxiety Inventory (STAI-S) [32] contains ten positively and ten negatively worded statements. Participants are asked to respond based on how they feel “right now”, using a 4-point scale ranging from 1, not at all to 4, very much. A state anxiety score is derived by reverse-scoring positively worded items and summing all scale responses. State anxiety scores range from 20 to 80. Higher scores indicate higher levels of state anxiety. In instances where respondents did not respond to one or two items, the score was derived by: (1) calculating the mean weighted score for the items with a valid response, (2) multiplying the mean weighted score by 20, and (3) rounding the resulting value to the next higher integer. In cases where three or more items were absent, no score was calculated, as the scale may lack validity [32].

2.2. Participants and Procedure

For T1, a convenience sample was recruited through personal and professional networks (including beneficiaries of BVUK), forums, and social media platforms. Adults aged 18 and over were invited to take part in the study by clicking on a link to the online survey. Following detailed participant information about the study, including the rights of research participants, respondents were asked to provide informed consent by agreeing to a list of consent statements. A total of 602 participants, aged 18 and over, completed T1. Participants who had consented to being contacted for follow-up research and had given a valid email address were sent an email inviting them to take part in the follow-up survey (T2). A total of 163 of the 329 participants invited to participate in T2 responded (49.5%).

2.3. Analysis

Following the analysis plan detailed in a previously published article [28] using the same sample population, the analysis sought to explore between-group differences in state anxiety at T1 and T2, within-group changes in state anxiety between T1 and T2, and identify factors which were predictive of state anxiety in this sample at both timepoints.
Results are reported for respondents who completed both T1 and T2. Participants were able to select “Prefer not to say” for questions and/or skip entire sections (except for consent and demographics) of the questionnaire if they did not feel comfortable answering the questions. Both responses were treated as missing and were excluded from the analysis. The total number of responses achieved (n) is provided, where this cannot be calculated from the frequencies provided. Proportions are calculated from the total number of responses achieved for the question.
Due to a spelling error, an incorrect adjective was listed for the STAI-S scale item Q4 in T1. The incorrect item was excluded to calculate a revised state anxiety score for T1 and for T2, Cronbach’s α = 0.96, respectively. Descriptive and inferential statistics use the revised score to enable comparison. The full STAI-S score was available for T2. Comparative statistical analysis using the full STAI-S did not produce different results (available on request). The revised state anxiety scores were not normally distributed (Shapiro–Wilk test, p < 0.05). Non-parametric tests were performed, and medians and means are reported.
First, Mann–Whitney U tests were carried out to explore group differences in state anxiety at T1 and T2 between (1) participants who reported having one or more types of disability (1 + disabilities) and those who reported having no disability, and separately for a subsample of (2) participants with VI (those who self-reported having “visual impairment or blindness”) and the “no disability” control group. It should be noted that the group of participants with 1+ disabilities included those with VI. Only 9 of the 37 individuals with VI reported having no additional disabilities; it was therefore not possible to control for comorbidity in this group. Second, Wilcoxon signed-rank tests and sign tests were used to explore within-group changes in state anxiety between T1 and T2. Third, hierarchical linear regressions were run for T1 and T2 to identify those factors which consistently predicted state anxiety in this sample and to explore the relationship between VI and state anxiety. Age, gender, loneliness, sleep quality, self-isolating, and living alone have previously been identified as risk factors for anxiety and were, therefore, included in the analysis. Employment status was not entered due to its overall stability across the two timepoints. In order to assess the association of VI and state anxiety, the other most prevalent types of disabilities reported in this sample were included in the model. The revised state anxiety score was used at both timepoints to enable comparison.

3. Results

3.1. Participant Characteristics

After removing two cases who did not consent to taking part in the research, and one case who had submitted two versions of the T1 questionnaire, 160 respondents completed T1 and T2. Most participants were White, female, and residing in the UK (Table 1). As reported in [28,29], the majority of participants at both timepoints were aged 46–55, living with others, and in paid employment. One T2 participant reported job loss and was currently looking for work; two participants reported being furloughed. Most had been self-isolating for 2–4 weeks at T1 and were not self-isolating at T2. The mean UCLA loneliness score was 40.50 ± 13.55 at T1, compared to 42.18 ± 14.54 at T2. The mean PSQI global sleep score at T1 was 7.01 ± 4.31, compared to 8.02 ± 4.59 at T2. Full findings for loneliness and sleep are reported elsewhere [28,33].
One-third of the sample population reported at least one type of disability. The most prevalent conditions in this sample were VI or blindness (n = 37, 23.1%), disability affecting mobility (n = 26, 16.3%), mental health conditions (n = 21, 13.1%), medical conditions such as asthma, diabetes and epilepsy (n = 20, 12.5%), and hearing impairment or deafness (n = 18, 11.3%). Among participants with VI, 28 (75.7%) reported comorbid conditions, most commonly disabilities affecting mobility (n = 18) or hearing impairment (n = 16), while nine (24.3%) reported VI only. The prevalence of VI and lack of ethnic diversity in this sample may be attributable to recruitment of participants through organisations such as BVUK, whose memberships consists of predominantly White UK veterans with VI.

3.2. Subgroup Differences in State Anxiety

Mean state anxiety using the revised score was higher in participants with 1+ disabilities and in those with VI compared to those with no disabilities at both timepoints (Table 2). At T1, median state anxiety did not differ significantly between participants with no disabilities and those with 1+ disabilities, U = 2994, p = 0.128, nor between those with no disabilities and those with VI, U = 1922, p = 0.620. However, at T2, median state anxiety was significantly higher among participants with 1+ disabilities than among those with no disabilities, U = 3413.5, p < 0.01, and the difference in median state anxiety between participants with VI and those with no disabilities was approaching statistical significance, U = 2244, p = 0.050.

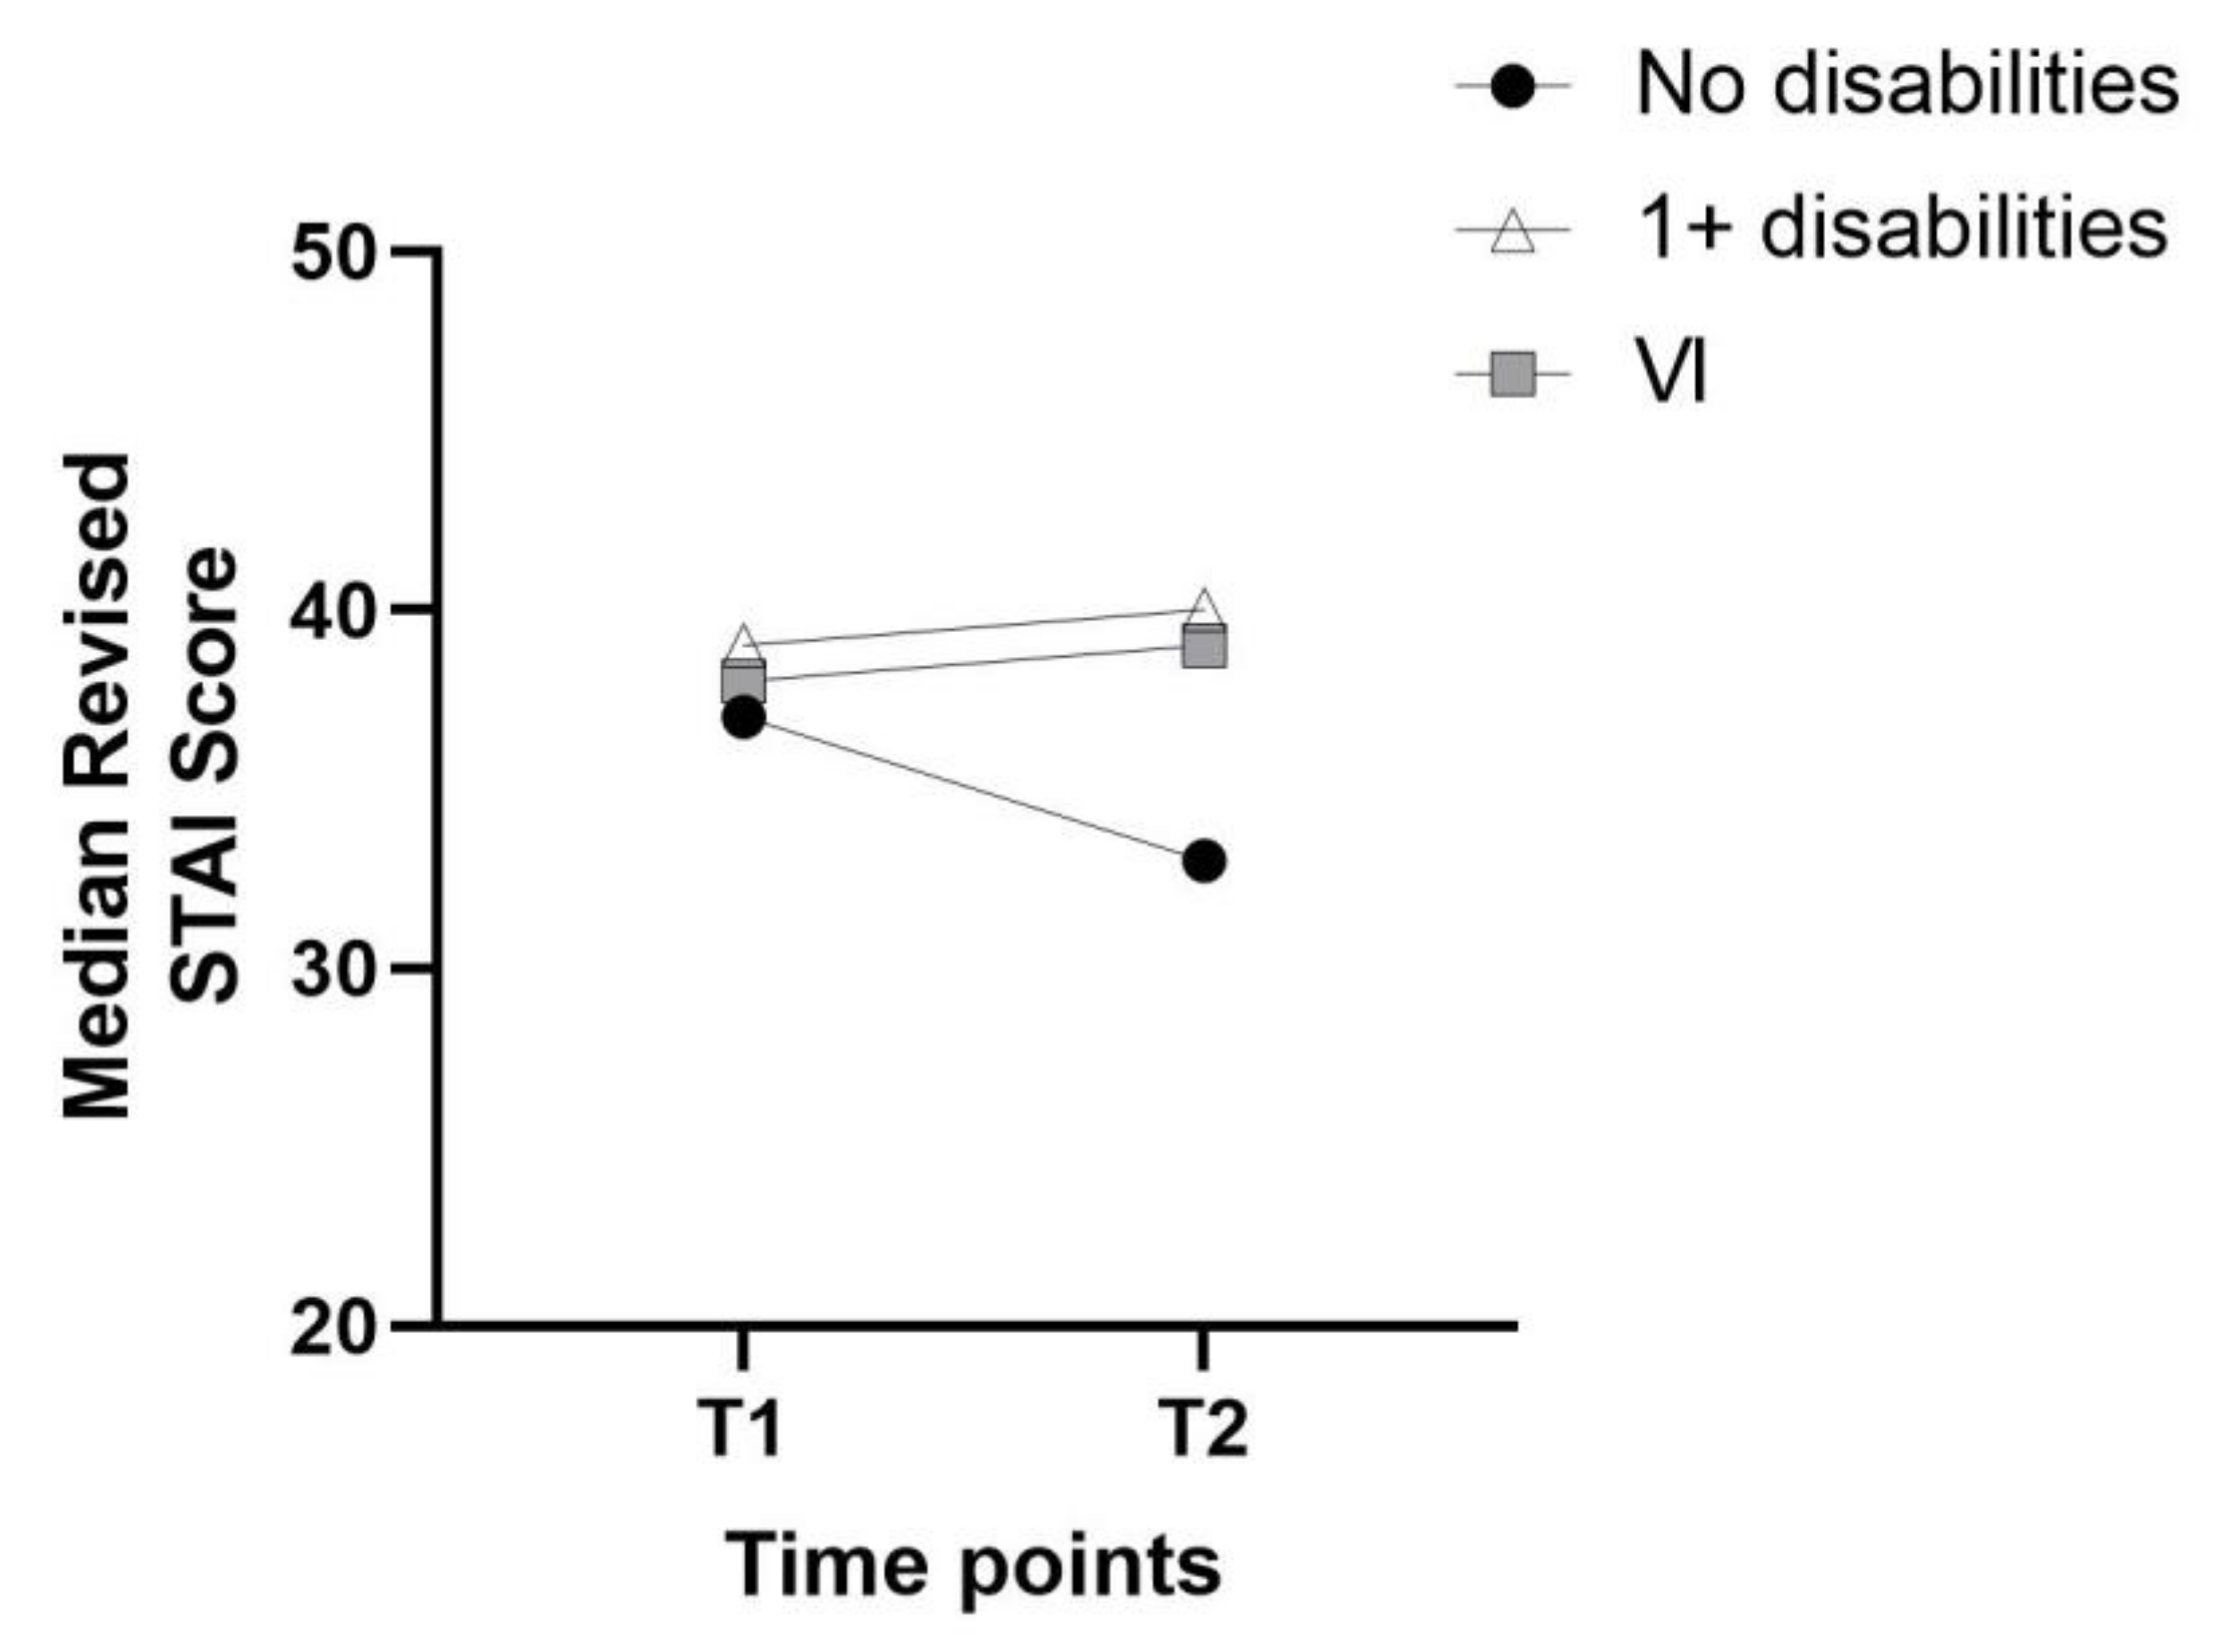
3.3. Changes in State Anxiety over Time

Median state anxiety remained relatively stable within all groups (Figure 1). Median state anxiety did not differ significantly between the two surveys for participants with VI, Z = 0.147, p = 0.883, nor for those with 1+disabilities, Z = −0.315, p = 0.752. There was a comparatively larger change in median state anxiety in the “no disabilities group,” but this decrease was also not statistically significant, Z = −0.940, p = 0.347.

3.4. Factors Predicting State Anxiety

A hierarchical multiple regression was conducted for T1 and repeated for T2 to identify factors which consistently predicted state anxiety and to explore the relationship with VI when controlling for factors previously associated with anxiety.
Table 3 reports results for the four models at T1 and T2. At T1, the full Model 4 was statistically significant, adjusted R2 = 0.541, F(11, 131) = 16.20, p < 0.001. The addition of loneliness, self-isolation, sleep quality, and living situation in Model 2 explained an extra 49.5% of the observed variance in state anxiety when controlling for age and gender, adjusted R2 = 0.537, F(6, 136) = 28.40, p < 0.001. Neither the addition of four types of disability (mental health issues, medical conditions, hearing impairment, and disability affecting mobility) in Model 3 nor the addition of VI in Model 4 significantly improved the model’s ability to predict state anxiety (p = 0.190 and p = 0.852, respectively). In the full Model 4, the factors which significantly predicted state anxiety were being female, reporting higher levels of loneliness, experiencing poorer sleep, and not having a disability affecting mobility.
At T2, the full Model 4 was also statistically significant, F(11, 135) = 17.41, p < 0.001; adjusted R2 = 0.553. Adding loneliness, sleep quality, self-isolation and living status in Model 2 explained an additional 51.3% of the variance in state anxiety when controlling for age and gender, F(6, 140) = 29.98, p < 0.001; adjusted R2 = 0.544. The four types of disability added in Model 3 accounted for an additional 2.4% of the observed variance, but this was not statistically significant (p = 0.100). Finally, the addition of VI in step 4 did not significantly improve the model’s ability to predict state anxiety (p = 0.949). As in T1, in the full Model 4, higher levels of loneliness, poorer sleep, and not having a disability affecting mobility predicted state anxiety, but unlike in T1, gender did not.

4. Discussion

This study provides a preliminary assessment of levels of and changes in state anxiety during the pandemic in adults with disabilities and those with VI compared to adults with no disabilities. Similar levels of state anxiety were found during the early stages of the pandemic (April–May 2020) across all three groups. Anxiety was slightly higher in participants with 1+ disabilities and VI, but there were no significant group differences. By March 2021, however, state anxiety was significantly higher in participants with 1+ disabilities, and showed a trend towards being higher in participants with VI than in those with no disabilities. While there were no statistically significant changes in state anxiety within any of the subgroups over time, the group differences at T2 appeared to have been driven by a decrease in state anxiety in participants with no disabilities. The T2 mean revised anxiety score in the non-disabled group was comparable to the normative STAI-S mean scores reported by Spielberger [32] for working-age men (35.72 ± 10.40) and women (35.20 ± 10.61). The decrease in anxiety observed for participants without disabilities may, therefore, reflect a gradual return to pre-pandemic levels as a result of adjusting to new routines, changes in social contact, and the introduction of a furlough scheme by the UK government in March 2020, which may have lessened anxiety relating to jobs and finances. However, pre-pandemic data pertaining to anxiety were not available for the current sample, and such conclusions must be drawn tentatively.
In contrast, anxiety levels remained consistently higher and comparatively stable in participants with disabilities, possibly pointing to a chronic level of anxiety in these individuals during the pandemic. Higher levels of generalised anxiety have been found in individuals with physical and mental health conditions [7,18] and disabilities such as VI [19,21] compared to those without these conditions, both before and during the pandemic. However, these studies did not use the STAI-S to assess anxiety. Research with older glaucoma patients (mean age 70.8 years) conducted prior to the pandemic found a higher mean STAI-S score for those with moderate/severe visual field defects than for those with no/low visual field defects (37.5 and 32.0, respectively) [34]. Both scores are slightly lower than the T1 and T2 mean revised anxiety scores (which exclude item 4) for participants with VI in this study. This suggests that anxiety levels in individuals with VI may have increased, at least to some extent, during the pandemic. Given existing evidence that individuals living with a disability have faced greater work-, social-, and healthcare-related concerns at this time [14,15], it is perhaps surprising that anxiety in these individuals did not increase further. Several factors may have mediated the experience of anxiety. First, while there is evidence of a greater impact of the pandemic on employment and work hours in people with disabilities [35], employment remained relatively stable in this sample, suggesting that, contrary to existing evidence [3,4], work or financial concerns may not have impacted on anxiety as much as other factors in this study. In addition, unemployment may not be an entirely new experience for people living with disabilities. Indeed, at T1 only 32.1% of those with disabilities were in paid employment compared to 88.6% of those with no disabilities. The proportion was even lower among those with VI (24.3%). In contrast, 1.9% of participants with no disabilities were unemployed at T1 compared to 24.5% of those with disabilities and 24.3% of those with VI. While this may be closing gradually, there is evidence of an employment gap for those with disabilities that precedes the pandemic [35].
Second, prior experiences with health-related concerns and social isolation in individuals living with a disability may have also minimised the impacts of the pandemic on worries about both health and social restrictions, despite concerns raised about the accessibility of remotely delivered health care [17].
Third, this sample included members of BVUK, who received support during the pandemic. There is some evidence of the positive impact of regular empathy-focused telephone calls on loneliness and anxiety [36]. In addition to regular phone calls from support workers and volunteers, BVUK beneficiaries were referred to targeted, remotely delivered interventions in response to specific social and welfare needs. Interventions included one-to-one and group sleep hygiene and well-being courses, as well as art groups and virtual exercise classes. These may have contributed to the relative stability of anxiety and the non-significant differences when compared with the non-disabled group found at both timepoints. Future research is required to confirm the findings relating to anxiety during the pandemic and to explore the efficacy of different interventions, including those delivered remotely, in reducing anxiety for different groups. This must also take into consideration the issues around accessibility for older adults and those with visual and mobility impairments raised elsewhere [17].
Not having a disability affecting mobility, loneliness, and sleep quality predicted state anxiety at both timepoints. It is unclear why not having a disability affecting mobility predicted anxiety, as research indicates a greater prevalence of anxiety in individuals with impaired mobility compared to those with no mobility difficulties [18]. One possible explanation may be that individuals with disabilities that affect mobility were less impacted by restrictions on movement. Loneliness and poor sleep have previously been identified as predictors of anxiety [8,37]. During the pandemic, people with disabilities have reported shorter sleep duration (<6 h) than those without disabilities [38], along with a high prevalence of insomnia (71%) [39]. While there were no statistically significant changes in loneliness nor sleep quality in participants with disabilities and VI in the current sample, levels of loneliness and sleep were consistently poorer in both groups [28,33]. State anxiety was further found to predict both loneliness and sleep quality in this sample, suggesting that the relationship between anxiety, loneliness, and sleep may be reciprocal. Given the higher levels of loneliness, poor sleep, and anxiety found in individuals with disabilities such as VI, interventions designed to support individuals living with a disability may benefit from taking into consideration their reciprocal nature.

Limitations of This Study

This study used a convenience sample. Sample sizes, particularly for those living with VI, were relatively small. Therefore, it is not possible to generalise findings to the wider population, and findings will need to be confirmed in a larger, representative sample. The use of an online survey meant that the survey did not reach those without internet access. This harder-to-reach group may have been at an increased risk of social isolation and anxiety during the pandemic. This will need to be explored in future research.
The sample included a small number of participants living outside the UK. Differences in public health messaging and restrictions across countries may have impacted mental health. Due to the small number of participants residing outside the UK, it was not possible to conduct a cross-cultural comparison. However, future research may benefit from an exploration of these cross-cultural differences to establish best practices. Participants from White backgrounds were overrepresented in this sample relative to the UK population (Census data suggests that 86% of the population is White [40]). The latter may reflect sharing of the survey through BVUK, a charity with predominantly White beneficiaries. There is concern that people from minority ethnic communities are underrepresented in health research [41]. Exploring the experiences of people from minority ethnic communities during the pandemic is important to minimise health inequalities and ensure that the support needs of these groups are met.
There were a number of limitations relating to the survey questions. First, while the use of self-reported disability in survey research is relatively common, there is evidence that self-reports of VI may result in an overidentification of cases, although cases of self-reported VI have been found to correlate moderately with visual acuity [42]. Objective measures of disability such as visual acuity for VI were not within the scope of this research, and the identification of disability, therefore, relied on self-reports. Second, a definition of self-isolation was added at T2 to account for a greater awareness of related terms, such as quarantining and shielding. This addition may have impacted participants’ understanding of the term.
A major limitation was the incorrect presentation of STAI-S item Q4 at T1. The revised score used in this study has been validated. While we do provide internal validity statistics, and the comparative analysis using the full STAI-S score did not produce different results, the possible impact of the exclusion of item 4 must be considered when reviewing the findings. The lack of pre-pandemic data for this sample further limits the conclusions which can be drawn from the findings. Finally, it was not possible to control for comorbidity due to the small sample sizes for those with disabilities and VI. Findings may have been impacted by the number and type of comorbid disabilities. Further research is needed to explore if and how differing types of disability, having one or multiple disabilities, and also the severity of VI, may impact mental health and well-being during and beyond the pandemic.

5. Conclusions

This study offers a preliminary assessment of state anxiety in people living with disabilities, and a subsample of those living with VI, across the pandemic. The current article expands on findings relating to loneliness [26] and sleep [27] in this sample. While state anxiety decreased slightly in individuals with no disabilities, indicating a possible return to pre-pandemic levels, anxiety was consistently higher, but remained relatively stable, in those with disabilities and those with VI. This may indicate a chronic level of state anxiety in these individuals. It is unclear if these elevated levels of anxiety reflect the impact of, or pre-date, the pandemic. The lack of pre-pandemic data, along with small sample sizes, limit the conclusions which can be drawn about changes in anxiety over time. The absence of a disability affecting mobility, experiencing loneliness, and poor sleep quality were associated with anxiety at both timepoints. The latter two may be more prevalent in those with disabilities, which may explain the elevated levels of state anxiety. The findings suggest that interventions designed to address anxiety will need to address loneliness and poor sleep as well. Future research will need to assess the efficacy of existing remotely delivered interventions, targeting poor sleep and loneliness, to address anxiety in groups with different accessibility and support needs.

Author Contributions

Conceptualization, R.S.M.G., N.H., C.L.C. and S.F.H.; methodology, R.S.M.G., T.K., C.L.C., N.H. and S.F.H.; formal analysis, N.H. and L.R.G.-M.; investigation, R.S.M.G. and N.H.; resources, R.S.M.G., T.K., C.L.C., N.H., S.F.H. and L.R.G.-M.; data curation, N.H.; writing—original draft preparation, N.H. and C.L.C.; writing—review and editing, S.F.H., N.H., C.L.C., T.K. and L.R.G.-M.; visualization, T.K.; project administration, R.S.M.G.; funding acquisition, R.S.M.G. All authors have read and agreed to the published version of the manuscript.

Funding

This research was fully self-funded by Blind Veterans UK.

Institutional Review Board Statement

Ethical review and approval were not required for the study on human participants in accordance with the local legislation and institutional requirements.

Informed Consent Statement

Informed consent was obtained from all participants involved in the study.

Data Availability Statement

The data presented in this study are not publicly available because participants were not asked if they consented for their data to be shared outside of the research teams involved in this study.

Acknowledgments

This work was carried out with a contribution of time from associates at Circadian Therapeutics, University of Oxford, who advised on sleep quality.

Conflicts of Interest

The authors declare no conflict of interest.

References

  1. Schimmenti, A.; Billieux, J.; Starcevic, V. The four horsemen of fear: An integrated model of understanding fear experiences during the COVID-19 pandemic. Clin. Neuropsychiatry 2020, 17, 41–45. [Google Scholar] [PubMed]
  2. Pedrosa, A.L.; Bitencourt, L.; Fróes, A.C.F.; Cazumbá, M.L.B.; Campos, R.G.B.; de Brito, S.B.C.S.; Silva, A.C.S. Emotional, behavioral, and psychological Impact of the COVID-19 Pandemic. Front. Psychol. 2020, 11, 566212. [Google Scholar] [CrossRef] [PubMed]
  3. Wilson, J.M.; Lee, J.; Fitzgerald, H.N.; Oosterhoff, B.; Sevi, B.; Shook, N.J. Job insecurity and financial concern during the COVID-19 pandemic are associated with worse mental health. J. Occup. Environ. Med. 2020, 62, 686–691. [Google Scholar] [CrossRef] [PubMed]
  4. McDowell, C.P.; Herring, M.P.; Lansing, J.; Brower, C.S.; Meyer, J.D. Associations between employment changes and mental health: US data from during the COVID-19 pandemic. Front. Psychol. 2021, 12, 631510. [Google Scholar] [CrossRef] [PubMed]
  5. Malesza, M.; Kaczmarek, M.C. Predictors of anxiety during the COVID-19 pandemic in Poland. Pers. Individ. Dif. 2021, 170, 110419. [Google Scholar] [CrossRef] [PubMed]
  6. Özdin, S.; Bayrak Özdin, Ş. Levels and predictors of anxiety, depression and health anxiety during COVID-19 pandemic in Turkish society: The importance of gender. Int. J. Soc. Psychiatry 2020, 66, 504–511. [Google Scholar] [CrossRef] [PubMed]
  7. Fancourt, D.; Bu, F.; Mak, H.W.; Paul, E.; Steptoe, A. COVID-19 Social Study Results Release 32; University College London: London, UK, 2021. [Google Scholar]
  8. Guo, Y.; Cheng, C.; Zeng, Y.; Li, Y.; Zhu, M.; Yang, W.; Xu, H.; Li, X.; Leng, J.; Monroe-Wise, A. Mental health disorders and associated risk factors in Quarantined adults during the COVID-19 outbreak in China: Cross-sectional study. J. Med. Internet Res. 2020, 22, e20328. [Google Scholar] [CrossRef]
  9. Brenner, M.H.; Bhugra, D. Acceleration of anxiety, depression, and suicide: Secondary effects of economic disruption related to COVID-19. Front. Psychiatry 2020, 11, 592467. [Google Scholar] [CrossRef]
  10. Banerjee, D.; Rai, M. Social isolation in COVID-19: The impact of loneliness. Int. J. Soc. Psychiatry 2020, 66, 525–527. [Google Scholar] [CrossRef]
  11. Hoffart, A.; Johnson, S.U.; Ebrahimi, O.V. Loneliness and Social Distancing During the COVID-19 Pandemic: Risk Factors and Associations With Psychopathology. Front. Psychiatry 2020, 11, 589127. [Google Scholar] [CrossRef]
  12. González-Sanguino, C.; Ausín, B.; Castellanos, M.Á.; Saiz, J.; López-Gómez, A.; Ugidos, C.; Muñoz, M. Mental health consequences during the initial stage of the 2020 Coronavirus pandemic (COVID-19) in Spain. Brain Behav. Immun. 2020, 87, 172–176. [Google Scholar] [CrossRef] [PubMed]
  13. Palgi, Y.; Shrira, A.; Ring, L.; Bodner, E.; Avidor, S.; Bergman, Y.; Cohen-Fridel, S.; Keisari, S.; Hoffman, Y. The loneliness pandemic: Loneliness and other concomitants of depression, anxiety and their comorbidity during the COVID-19 outbreak. J. Affect. Disord. 2020, 275, 109–111. [Google Scholar] [CrossRef] [PubMed]
  14. Lund, E.M.; Forber-Pratt, A.J.; Wilson, C.; Mona, L.R. The COVID-19 pandemic, stress, and trauma in the disability community: A call to action. Rehabil. Psychol. 2020, 65, 313. [Google Scholar] [CrossRef] [PubMed]
  15. Emerson, E.; Stancliffe, R.; Hatton, C.; Llewellyn, G.; King, T.; Totsika, V.; Aitken, Z.; Kavanagh, A. The impact of disability on employment and financial security following the outbreak of the 2020 COVID-19 pandemic in the UK. J. Public Health 2021, 43, 472–478. [Google Scholar] [CrossRef] [PubMed]
  16. Szmuda, T.; Ali, S.; Słoniewski, P. Telemedicine in neurosurgery during the novel coronavirus (COVID-19) pandemic. Neurol. I Neurochir. Pol. 2020, 54, 207–208. [Google Scholar]
  17. Jayaram, H.; Strouthidis, N.G.; Gazzard, G. The COVID-19 pandemic will redefine the future delivery of glaucoma care. Eye 2020, 34, 1203–1205. [Google Scholar] [CrossRef]
  18. Steptoe, A.; Di Gessa, G. Mental health and social interactions of older people with physical disabilities in England during the COVID-19 pandemic: A longitudinal cohort study. Lancet Public Health 2021, 6, e365–e373. [Google Scholar] [CrossRef]
  19. Ting, D.S.J.; Krause, S.; Said, D.G.; Dua, H.S. Psychosocial impact of COVID-19 pandemic lockdown on people living with eye diseases in the UK. Eye 2020, 35, 2064–2066. [Google Scholar] [CrossRef]
  20. Kempen, G.I.J.M.; Ballemans, J.; Ranchor, A.V.; van Rens, G.H.M.B.; Zijlstra, G.A.R. The impact of low vision on activities of daily living, symptoms of depression, feelings of anxiety and social support in community-living older adults seeking vision rehabilitation services. Qual. Life Res. 2012, 21, 1405–1411. [Google Scholar] [CrossRef] [Green Version]
  21. van der Aa, H.P.; Comijs, H.C.; Penninx, B.W.; van Rens, G.H.; van Nispen, R.M. Major depressive and anxiety disorders in visually impaired older adults. Investig. Ophthalmol. Vis. Sci. 2015, 56, 849–854. [Google Scholar] [CrossRef] [Green Version]
  22. Frank, C.R.; Xiang, X.; Stagg, B.C.; Ehrlich, J.R. Longitudinal Associations of Self-reported Vision Impairment With Symptoms of Anxiety and Depression Among Older Adults in the United States. JAMA Ophthalmol. 2019, 137, 793–800. [Google Scholar] [CrossRef]
  23. Fenwick, E.K.; Pesudovs, K.; Khadka, J.; Dirani, M.; Rees, G.; Wong, T.Y.; Lamoureux, E.L. The impact of diabetic retinopathy on quality of life: Qualitative findings from an item bank development project. Qual. Life Res. 2012, 21, 1771–1782. [Google Scholar] [CrossRef]
  24. Schliermann, R.; Heydenreich, P.; Bungter, T.; Anneken, V. Health-related quality of life in working-age adults with visual impairments in Germany. Disabil. Rehabil. 2017, 39, 428–437. [Google Scholar] [CrossRef] [PubMed]
  25. Zhang, X.; Bullard, K.M.; Cotch, M.F.; Wilson, M.R.; Rovner, B.W.; McGwin, G.; Owsley, C.; Barker, L.; Crews, J.E.; Saaddine, J.B. Association between depression and functional vision loss in persons 20 years of age or older in the United States, NHANES 2005–2008. JAMA Ophthalmol. 2013, 131, 573–581. [Google Scholar] [CrossRef] [PubMed] [Green Version]
  26. Nyman, S.R.; Gosney, M.A.; Victor, C.R. Psychosocial impact of visual impairment in working-age adults. Br. J. Ophthalmol. 2010, 94, 1427–1431. [Google Scholar] [CrossRef] [PubMed] [Green Version]
  27. Vancampfort, D.; Koyanagi, A.; Hallgren, M.; Probst, M.; Stubbs, B. The relationship between chronic physical conditions, multimorbidity and anxiety in the general population: A global perspective across 42 countries. Gen. Hosp. Psychiatry 2017, 45, 1–6. [Google Scholar] [CrossRef] [Green Version]
  28. Heinze, N.; Hussain, S.F.; Castle, C.L.; Godier-McBard, L.R.; Kempapidis, T.; Gomes, R.S. The long-term impact of the COVID-19 pandemic on loneliness in people living with disability and visual impairment. Front. Public Health 2021, 9, 738304. [Google Scholar] [CrossRef]
  29. Hussain, S.F.; Heinze, N.; Castle, C.L.; Godier-McBard, L.R.; Kempapidis, T.; Gomes, R.S.M. The Impact of COVID-19 on Health-Related Behaviours in People Living with Disabilities; BRAVO VICTOR: London, UK, 2021; manuscript submitted for publication. [Google Scholar]
  30. Buysse, D.J.; Reynolds, C.F., 3rd; Monk, T.H.; Berman, S.R.; Kupfer, D.J. The Pittsburgh Sleep Quality Index: A new instrument for psychiatric practice and research. Psychiatry Res. 1989, 28, 193–213. [Google Scholar] [CrossRef]
  31. Russell, D.W. UCLA Loneliness Scale (Version 3): Reliability, validity, and factor structure. J. Personal. Assess. 1996, 66, 20–40. [Google Scholar] [CrossRef]
  32. Spielberger, C.D.; Gorsuch, R.L.; Lushene, R.; Vagg, P.R.; Jacobs, G.A. Manual for the State-Trait Anxiety Inventory; Consulting Psychologists Press: Palo Alto, CA, USA, 1983. [Google Scholar]
  33. Heinze, N.; Hussain, S.F.; Castle, C.L.; Godier-McBard, L.R.; Kempapidis, T.; Ftouni, S.; Espie, C.A.; Gomes, R.S. The Impact of COVID-19 on Sleep Quality in People Living With Disabilities. Front. Psychol. 2021, 12, 786904. [Google Scholar] [CrossRef]
  34. Agorastos, A.; Skevas, C.; Matthaei, M.; Otte, C.; Klemm, M.; Richard, G.; Huber, C.G. Depression, anxiety, and disturbed sleep in glaucoma. J. Neuropsychiatry Clin. Neurosci. 2013, 25, 205–213. [Google Scholar] [CrossRef]
  35. Department for Work & Pensions. The Employment of Disabled People 2021. Available online: https://www.gov.uk/government/statistics/the-employment-of-disabled-people-2021/the-employment-of-disabled-people-2021 (accessed on 1 March 2022).
  36. Kahlon, M.K.; Aksan, N.; Aubrey, R.; Clark, N.; Cowley-Morillo, M.; Jacobs, E.A.; Mundhenk, R.; Sebastian, K.R.; Tomlinson, S. Effect of layperson-delivered, empathy-focused program of telephone calls on loneliness, depression, and anxiety among adults during the COVID-19 pandemic: A randomized clinical trial. JAMA Psychiatry 2021, 78, 616–622. [Google Scholar] [CrossRef] [PubMed]
  37. Frontini, R.; Rebelo-Gonçalves, R.; Amaro, N.; Salvador, R.; Matos, R.; Morouço, P.; Antunes, R. The Relationship Between Anxiety Levels, Sleep, and Physical Activity During COVID-19 Lockdown: An Exploratory Study. Front. Psychol. 2021, 12, 659599. [Google Scholar] [CrossRef] [PubMed]
  38. Pérez-Carbonell, L.; Meurling, I.J.; Wasserman, D.; Gnoni, V.; Leschziner, G.; Weighall, A.; Ellis, J.; Durrant, S.; Hare, A.; Steier, J. Impact of the novel coronavirus (COVID-19) pandemic on sleep. J. Thorac. Dis. 2020, 12, S163–S175. [Google Scholar] [CrossRef] [PubMed]
  39. Necho, M.; Birkie, M.; Gelaye, H.; Beyene, A.; Belete, A.; Tsehay, M. Depression, anxiety symptoms, Insomnia, and coping during the COVID-19 pandemic period among individuals living with disabilities in Ethiopia, 2020. PLoS ONE 2020, 15, e0244530. [Google Scholar] [CrossRef]
  40. Office for National Statistics. 2011 Census Analysis: Ethnicity and Religion of the Non-UK Born Population in England and Wales: 2011; Office for National Statistics: Newport, UK, 2015. [Google Scholar]
  41. Redwood, S.; Gill, P.S. Under-representation of minority ethnic groups in research—Call for action. Br. J. Gen. Pract. 2013, 63, 342–343. [Google Scholar] [CrossRef] [Green Version]
  42. Zimdars, A.; Nazroo, J.; Gjonca, E. The circumstances of older people in England with self-reported visual impairment: A secondary analysis of the English Longitudinal Study of Ageing (ELSA). Br. J. Vis. Impair. 2012, 30, 22–30. [Google Scholar] [CrossRef]
Figure 1. Change in median revised anxiety (STAI-S) scores between T1 and T2 by subgroup.
Disabilities 02 00017 g001
Table 1. Sample characteristics of total survey sample.
T1T2 % (n)T1 % (n)T2 % (n)
GenderFemale52.2 (83)
Male47.8 (76)
EthnicityAsian1.3 (2)
Black/African/Caribbean0.6 (1)
Hispanic/Latino/Spanish origin1.9 (3)
Mixed/Multiple Ethnic groups1.3 (2)
White/Other White95.0 (151)
Country of residence 1Canada0.6 (1)
France1.3 (2)
Germany1.9 (3)
Greece0.6 (1)
Malta5.6 (9)
Portugal3.1 (5)
Thailand0.6 (1)
UK76.9 (123)
USA9.4 (15)
Age18–25 1.9 (3)1.9 (3)
26–35 13.9 (22)11.4 (18)
36–45 13.9 (22)17.7 (28)
46–55 34.8 (55)31.0 (49)
56–65 25.9 (41)24.1 (38)
66–75 6.3 (10)10.8 (17)
76–85 3.2 (5)3.2 (5)
86+ --
Employment statusIn paid employment 73.5 (111)69.6 (110)
Employed but furloughed -1.3 (2)
Retired 16.6 (25)17.7 (28)
Unemployed, not looking for work 7.9 (12)9.5 (15)
Unemployed, but looking for work 2.0 (3)1.9 (3)
Time spent self-isolatingI am not self-isolating. 24.5 (39)70.9 (112)
0–2 weeks 5.7 (9)0.6 (1)
2–4 weeks 42.1 (67)-
4–8 weeks 27.0 (43)0.6 (1)
8–12 weeks 1.3 (2)1.3 (2)
3–4 months 0.6 (1)0.6 (1)
4–5 months (T2 only) -1.3 (2)
Over 6 months (T2 only) -24.7 (39)
Living statusI live on my own. 23.9 (38)23.9 (38)
I live with others. 76.1 (121)76.1 (121)
DisabilityNo disability66.5 (105)
One or more disabilities33.5 (53)
VI or blindnessVI not reported76.9 (123)
VI reported23.1 (37)
T1 = first survey, T2 = follow-up survey; n = frequency of participants giving the response; % = proportion of participants giving the response based on the total of valid responses achieved for the question, excluding those who selected “Prefer not to say” or did not answer the question. 1 The country of residence question was not repeated at T2.
Table 2. Descriptive statistics for revised anxiety (STAI-S) scores by subgroup at T1 and T2.
T1T2VI
No Disabilities1+ DisabilitiesVINo Disabilities1+ Disabilities
n10450351055135
M37.5441.5238.8935.6742.6740.49
SD13.5415.1213.9213.1215.1913.65
Mdn37.0039.0038.0033.0040.0039.00
IQR202416202721
T1 = first survey, T2 = follow-up survey; n = number of valid cases; M = mean; SD = standard deviation; Mdn = median; IQR = interquartilerange.
Table 3. Hierarchical multiple regressions for revised anxiety (STAI-S) scores.
VariableT1 T2
BβBβ
Model 1Constant52.127 *** 51.839 ***
Age−0.251 **−0.233−0.216 *−0.200
Sex−1.085−0.039−5.573 *−0.197
Model 2Constant14.154 ** 11.444 *
Age−0.095−0.088−0.047−0.044
Sex−6.131 **−0.222−0.361−0.013
Loneliness0.547 ***0.5270.511 ***0.517
Sleep quality1.066 ***0.3350.928 ***0.298
Self-isolation−0.239−0.0190.3770.094
Living situation4.167 *0.130−0.781−0.024
Model 3Constant13.217 * 11.805 *
Age−0.086−0.080−0.014−0.013
Sex−5.429 **−0.196−1.464−0.052
Loneliness0.551 ***0.5310.503 ***0.508
Sleep quality1.174 ***0.3691.033 ***0.332
Self-isolation−0.239−0.0190.3590.089
Living situation3.7780.117−2.499−0.076
Hearing impairment2.7030.054−3.755−0.083
Mobility impairment−6.118 *−0.157−6.279 *−0.164
Medical condition 1.9050.0434.2620.099
Mental health 0.0280.0012.0780.050
Model 4Constant13.187 * 11.834 *
Age−0.088−0.081−0.014−0.013
Sex−5.539 **−0.200−1.497−0.053
Loneliness0.552 ***0.5320.503 ***0.508
Sleep quality1.173 ***0.3691.031 ***0.331
Self-isolation−0.231−0.0190.3610.090
Living situation3.8410.119−2.511−0.076
Hearing impairment2.5030.050−3.671−0.081
Mobility impairment−6.261 *−0.160−6.237 *−0.163
Medical condition 1.8510.0424.2770.099
Mental health 0.0290.0012.0740.050
VI0.4850.014−0.168−0.005
Model 1Model 2Model 3Model 4
T1R20.0610.5560.5760.576
F4.58 *28.40 ***17.94 ***16.20 ***
ΔR20.0610.4950.0200.000
ΔF4.58 *37.90 ***1.560.03
T2R20.0500.5620.5870.587
F3.77 *29.98 ***19.29 ***17.41 ***
ΔR20.0500.5130.0240.000
ΔF3.77 *41.00 ***1.990.00
NT1 = 143; NT2 = 147. T1 = first survey, T2 = follow-up survey; B = unstandardized regression coefficient; β = standardized coefficient; R2 = coefficient of determination; ΔR2 = R2change; ΔF = F change. * p < 0.05; ** p < 0.01; *** p < 0.001.
Publisher’s Note: MDPI stays neutral with regard to jurisdictional claims in published maps and institutional affiliations.

