
Dynamic Standing Exercise in a Novel Assistive Device Compared with Standard Care for Children with Cerebral Palsy Who Are Non-Ambulant, with Regard to Quality of Life and Cost-Effectiveness


Abstract
:1. Introduction
2. Materials and Methods
2.1. Aspects of Quality of Life
2.2. Costs
2.3. Cost-Effectiveness Analysis
2.4. Sensitivity Analysis
2.5. Ethical Considerations
3. Results
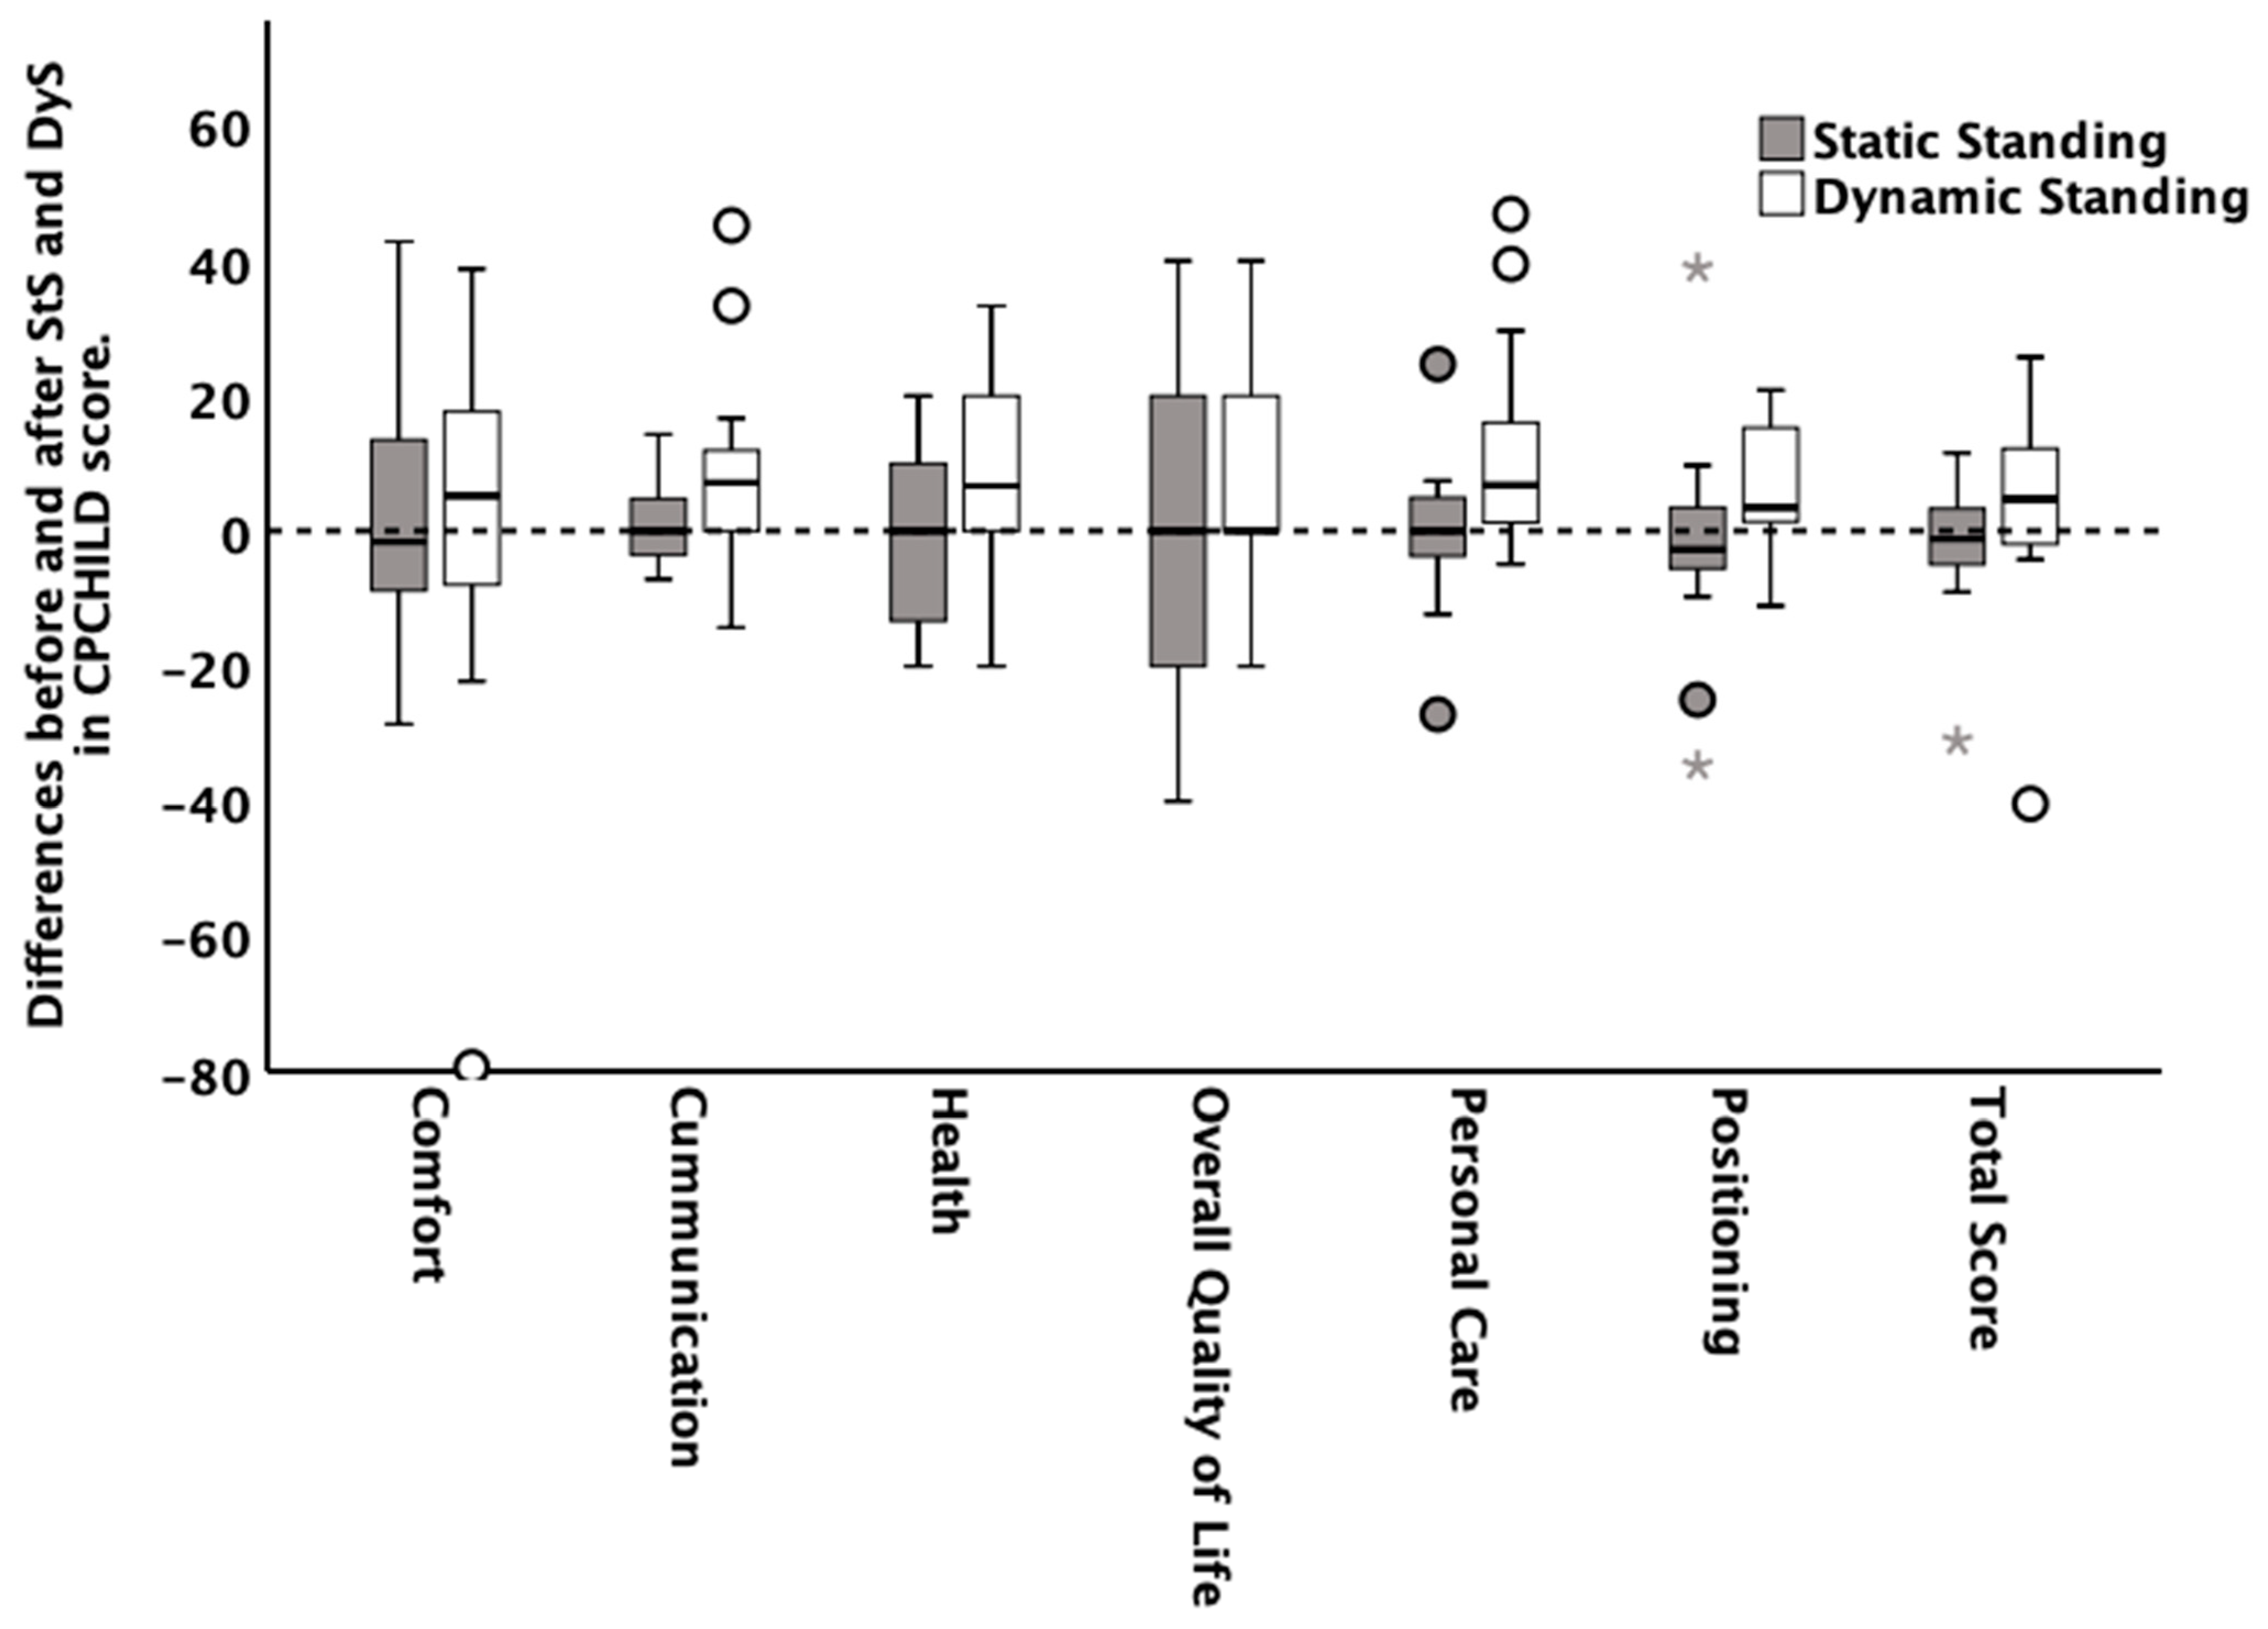
3.1. HRQOL
3.2. Satisfaction, Alertness, Fatigability, Ability to Focus, Bowel Function, Medication, and Pain
3.3. Costs
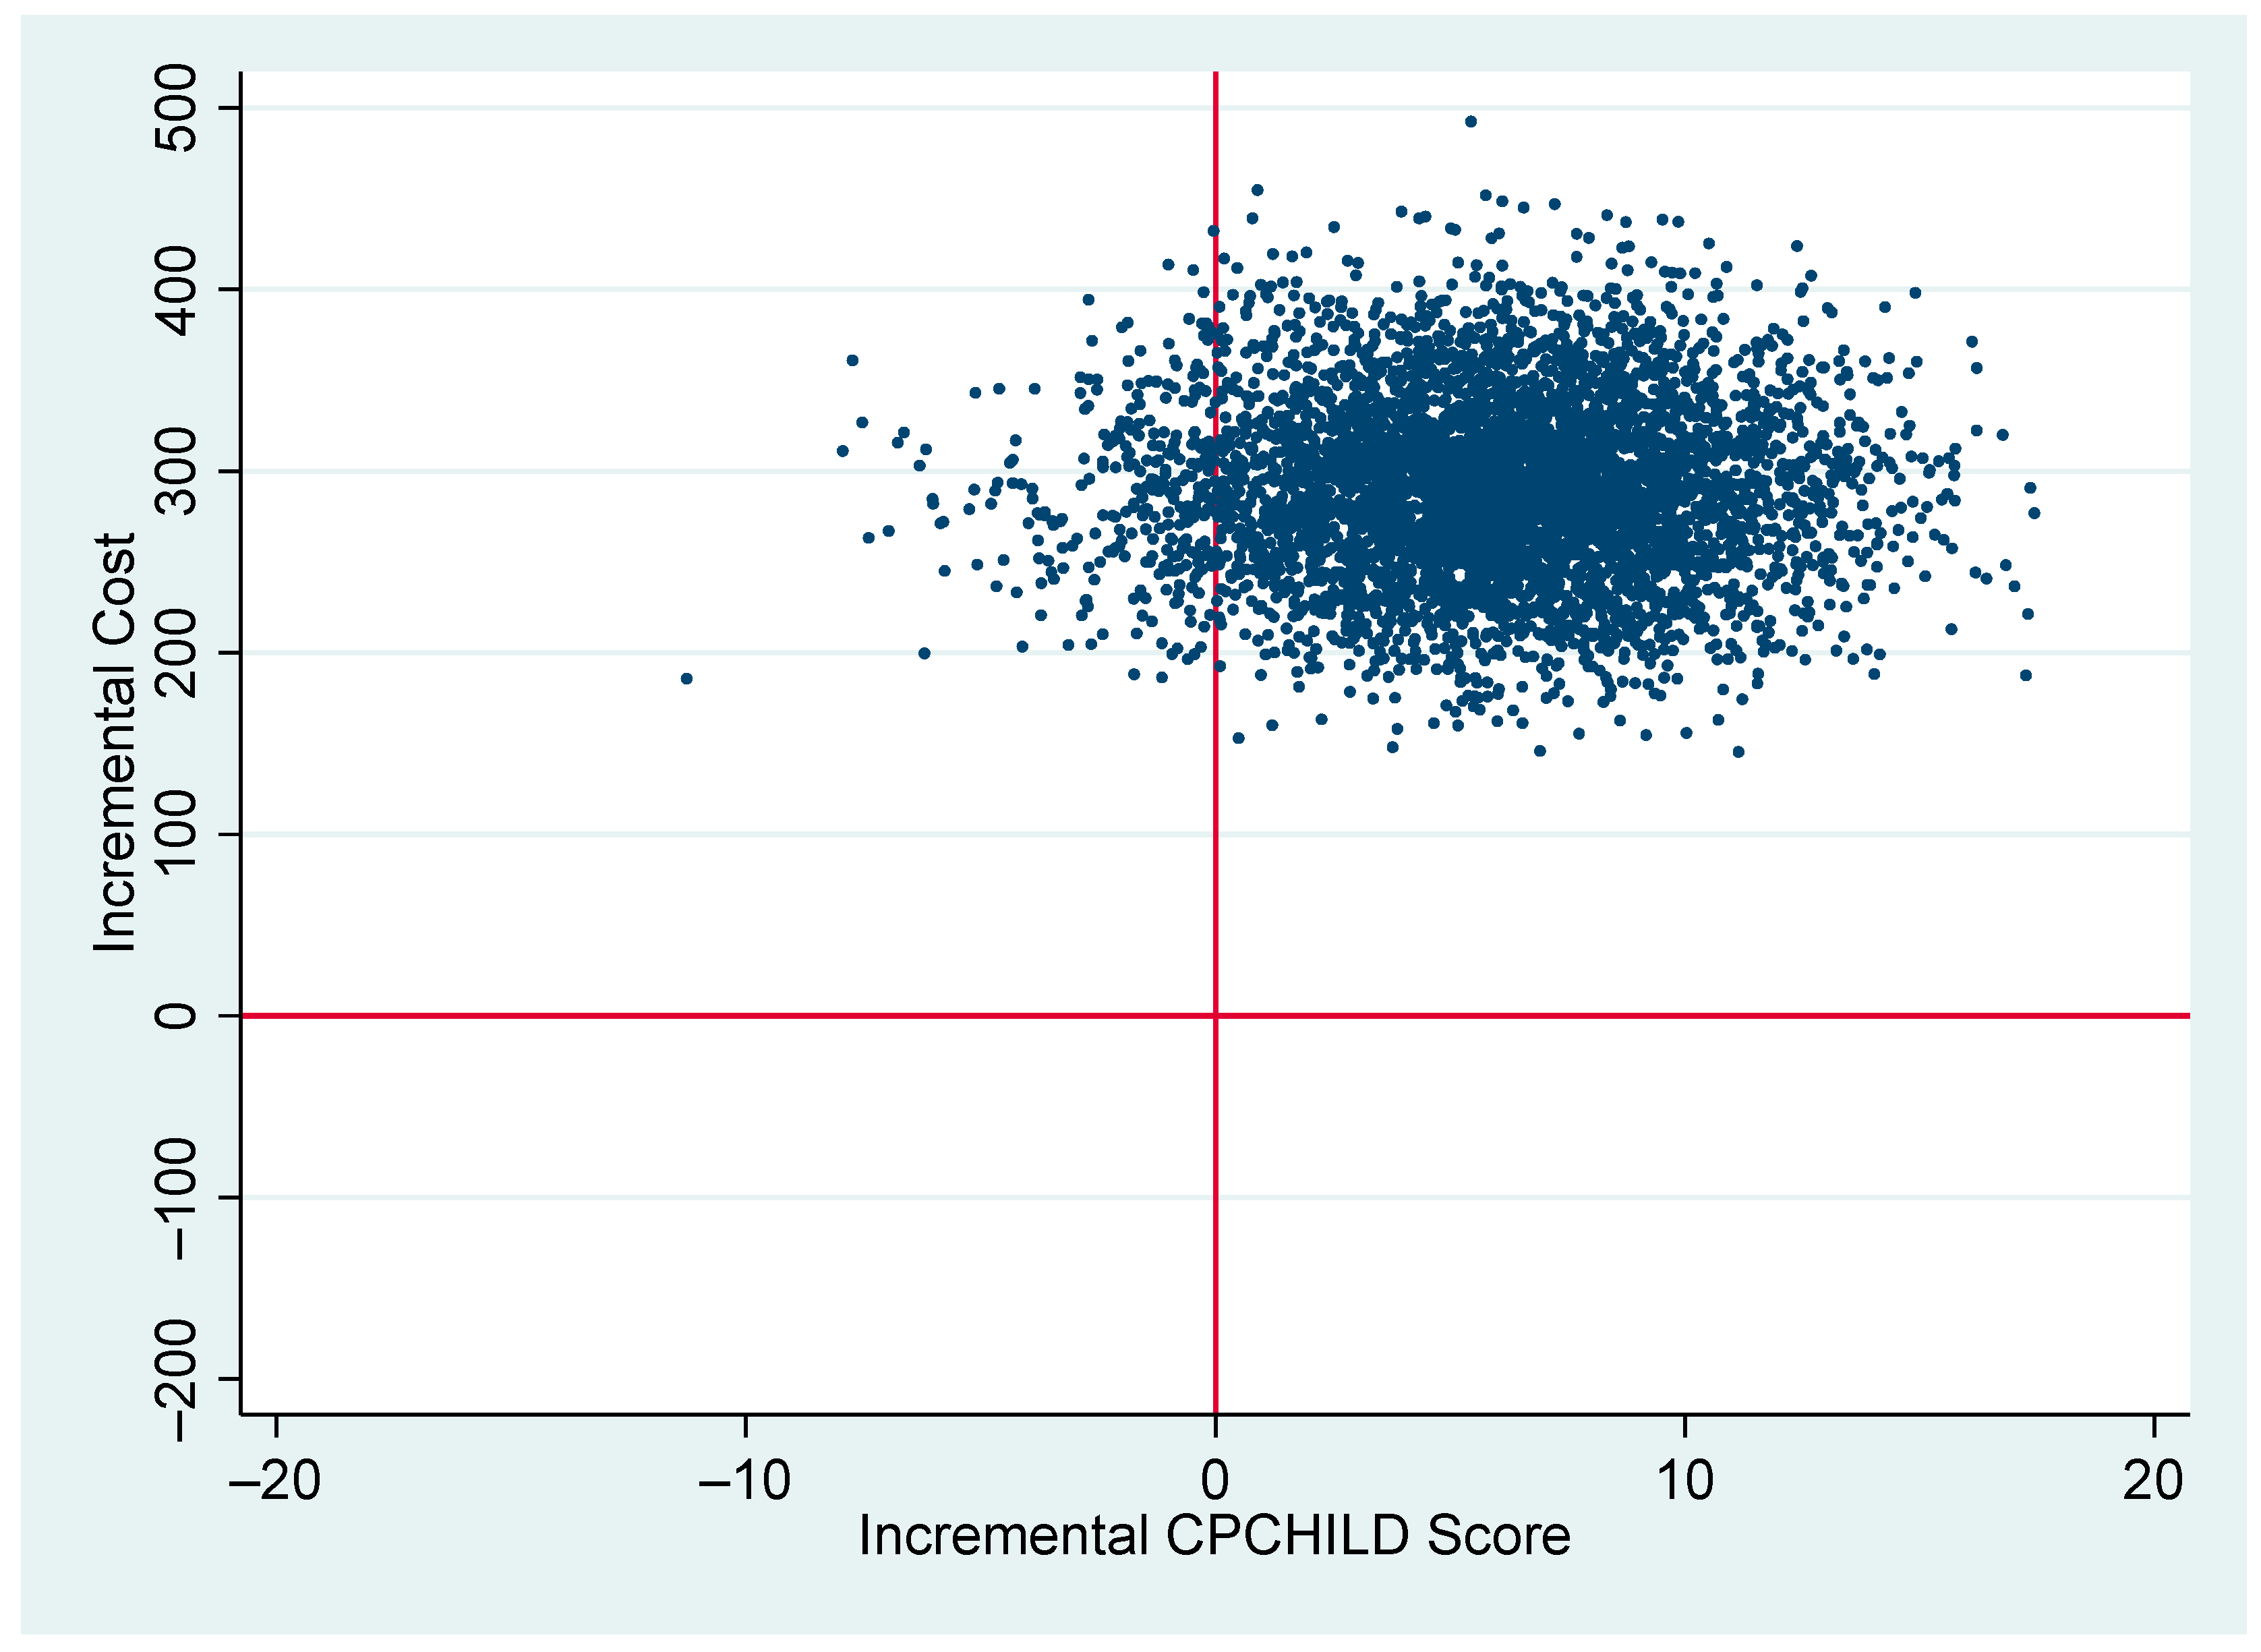
3.4. Cost-Effectiveness
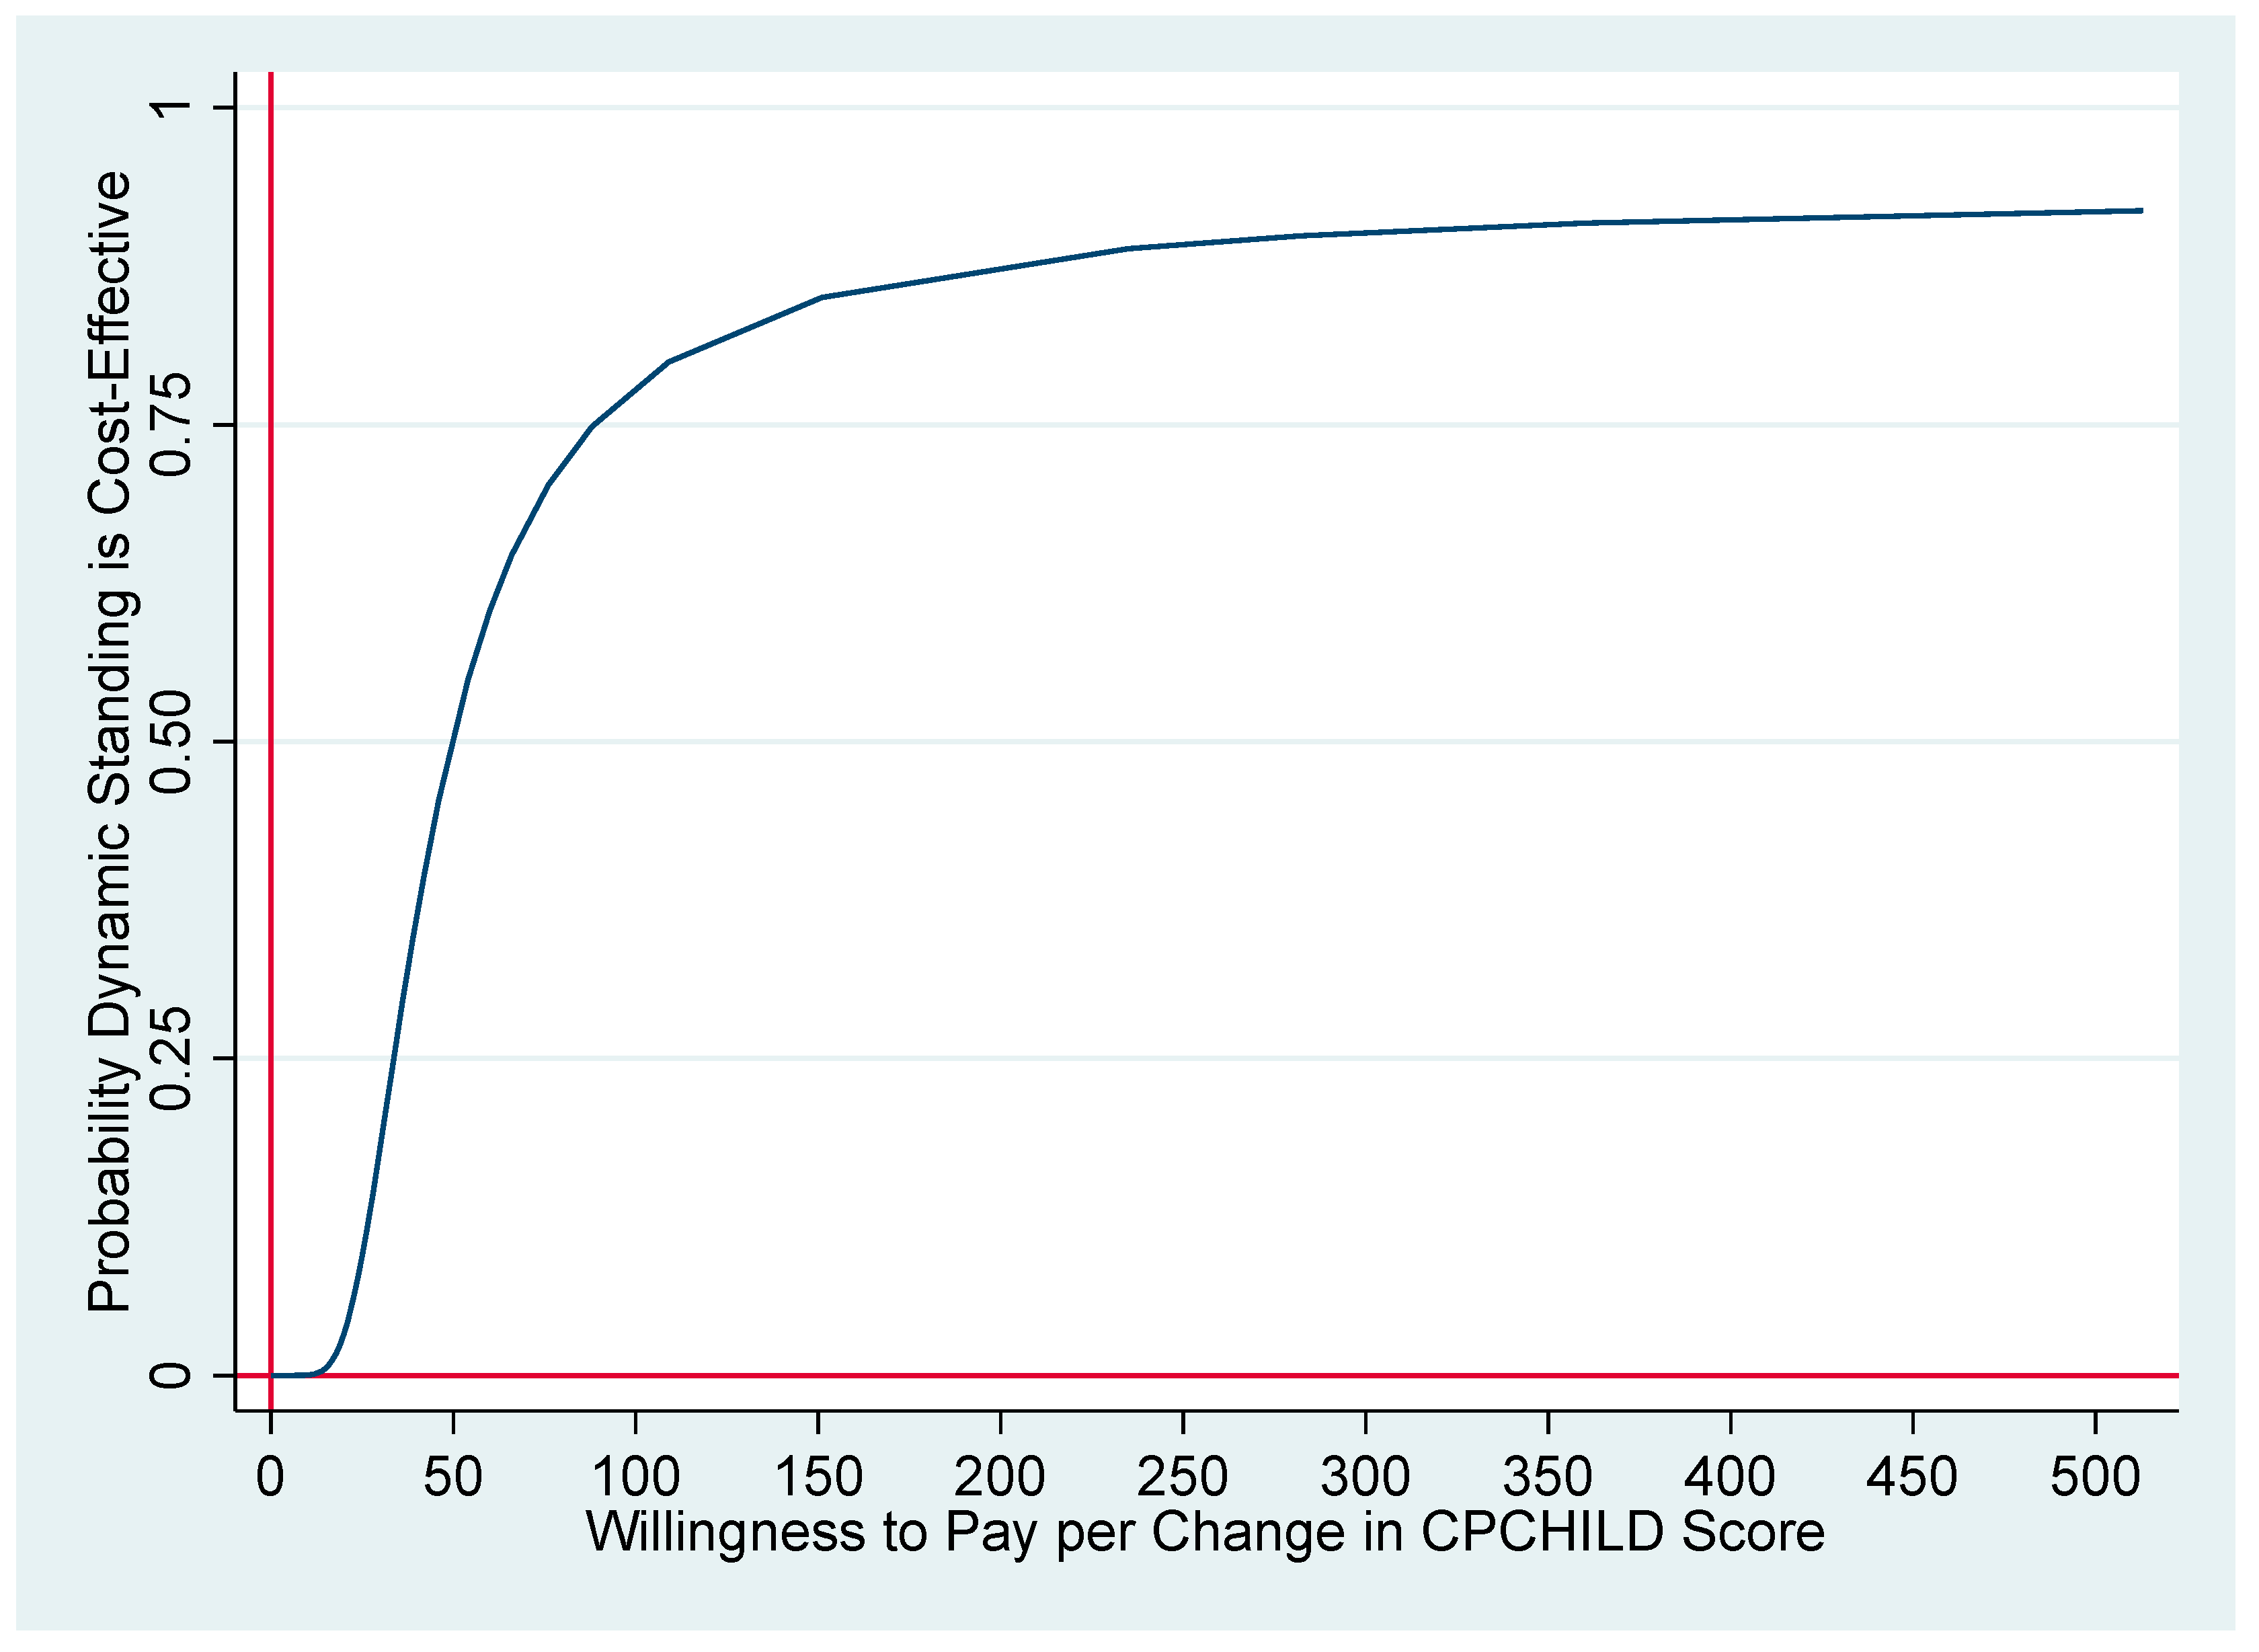
3.5. Sensitivity Analysis
4. Discussion
5. Conclusions
Supplementary Materials
Author Contributions
Funding
Institutional Review Board Statement
Informed Consent Statement
Data Availability Statement
Acknowledgments
Conflicts of Interest
Appendix A

| Difference in Cost (€) | Difference in Outcome | ICER | |
|---|---|---|---|
| Base case | 290 | 5.84 | 50 |
| Time valued at 25% of labor market productivity | 338 | 5.84 | 58 |
| No negative effect of standard care assumed | 290 | 4.38 | 66 |
| Exclude all participants (4) who do not have a standing shell as standard care | 196 | 3.91 | 50 |
References
- Rosenbaum, P.; Paneth, N.; Leviton, A.; Goldstein, M.; Bax, M.; Damiano, D.; Jacobsen, B. A report: The definition and classification of cerebral palsy. Dev. Med. Child Neurol. 2007, 109, 8–14. [Google Scholar]
- Palisano, R.J.; Rosenbaum, P.; Bartlett, D.; Livingston, M.H. Content validity of the expanded and revised Gross Motor Function Classification System. Dev. Med. Child Neurol. 2008, 50, 744–750. [Google Scholar] [CrossRef] [PubMed]
- Paleg, G.S.; Smith, B.A.; Glickman, L.B. Systematic review and evidence-based clinical recommendations for dosing of pediatric supported standing programs. Pediatr. Phys. Ther. 2013, 25, 232–247. [Google Scholar] [CrossRef] [PubMed]
- Goodwin, J.; Lecouturier, J.; Basu, A.; Colver, A.; Crombie, S.; Smith, J.; Howel, D.; McColl, E.; Parr, J.R.; Kolehmainen, N.; et al. Standing frames for children with cerebral palsy: A mixed-methods feasibility study. Health Technol. Assess. 2018, 22, 1–232. [Google Scholar] [CrossRef]
- Tornberg, Å.B.; Lauruschkus, K. Non-ambulatory children with cerebral palsy: Effects of four months of static and dynamic standing exercise on passive range of motion and spasticity in the hip. PeerJ 2020, 8, e8561. [Google Scholar] [CrossRef]
- Verschuren, O.; Peterson, M.D.; Balemans, A.C.; Hurvitz, E.A. Exercise and physical activity recommendations for people with cerebral palsy. Dev. Med. Child Neurol. 2016, 58, 798–808. [Google Scholar] [CrossRef]
- Innowalk. Available online: www.madeformovement.com/innowalk (accessed on 15 August 2021).
- Lauruschkus, K.; Hallström, I.; Westbom, L.; Tornberg, Å.; Nordmark, E. Participation in physical activities for children with cerebral palsy: Feasibility and effectiveness of physical activity on prescription. Arch. Physiother. 2017, 7, 13. [Google Scholar] [CrossRef] [Green Version]
- World Health Organization. Division of Mental Health and Prevention of Substance Abuse. WHOQOL: Measuring Quality of Life. 1997. Available online: https://apps.who.int/iris/handle/10665/63482 (accessed on 3 August 2021).
- Pettersson, K.; Rodby-Bousquet, E. Prevalence and goal attainment with spinal orthoses for children with cerebral palsy. J. Pediatric Rehabil. Med. 2019, 12, 197–203. [Google Scholar] [CrossRef] [Green Version]
- Jacobson, D.N.O.; Löwing, K.; Tedroff, K. Health-related quality of life, pain, and fatigue in young adults with cerebral palsy. Dev. Med. Child Neurol. 2020, 62, 372–378. [Google Scholar] [CrossRef]
- Janssen, C.G.; Voorman, J.M.; Becher, J.G.; Dallmeijer, A.J.; Schuengel, C. Course of health-related quality of life in 9-16-year-old children with cerebral palsy: Associations with gross motor abilities and mental health. Disabil. Rehabil. 2010, 32, 344–351. [Google Scholar] [CrossRef]
- Maher, C.A.; Toohey, M.; Ferguson, M. Physical activity predicts quality of life and happiness in children and adolescents with cerebral palsy. Disabil. Rehabil. 2016, 38, 865–869. [Google Scholar] [CrossRef]
- Marciniak, C.M.; Lee, J.; Jesselson, M.; Gaebler-Spira, D. Cross-Sectional Study of Bowel Symptoms in Adults with Cerebral Palsy: Prevalence and Impact on Quality of Life. Arch. Phys. Med. Rehabil. 2015, 96, 2176–2183. [Google Scholar] [CrossRef] [PubMed]
- Carlon, S.; Shields, N.; Yong, K.; Gilmore, R.; Sakzewski, L.; Boyd, R. A systematic review of the psychometric properties of Quality of Life measures for school aged children with cerebral palsy. BMC Pediatr. 2010, 10, 81. [Google Scholar] [CrossRef] [PubMed] [Green Version]
- Narayanan, U.G.; Fehlings, D.; Weir, S.; Knights, S.; Kiran, S.; Campbell, K. Initial development and validation of the Caregiver Priorities and Child Health Index of Life with Disabilities (CPCHILD). Dev. Med. Child Neurol. 2006, 48, 804–812. [Google Scholar] [CrossRef] [PubMed] [Green Version]
- Lewis, S.J.; Heaton, K.W. Stool form scale as a useful guide to intestinal transit time. Scand. J. Gastroenterol. 1997, 32, 920–924. [Google Scholar] [CrossRef]
- CPUP. A Follow-Up Surveillance Programme for People with Cerebral Palsy (CP). Available online: https://cpup.se (accessed on 3 August 2021).
- Walker, D.; Kumaranayake, L. Allowing for differential timing in cost analyses: Discounting and annualization. Health Policy Plan. 2002, 17, 112–118. [Google Scholar] [CrossRef] [Green Version]
- Statistics Sweden. Available online: www.scb.se (accessed on 3 August 2021).
- Aktiv Ortopedteknik. Available online: www.aktivortopedteknik.se (accessed on 15 August 2021).
- Sanders, G.D.; Neumann, P.J.; Basu, A.; Brock, D.W.; Feeny, D.; Krahn, M.; Kuntz, K.M.; Meltzer, D.O.; Owens, D.K.; Prosser, L.A.; et al. Recommendations for Conduct, Methodological Practices, and Reporting of Cost-effectiveness Analyses: Second Panel on Cost-Effectiveness in Health and Medicine. JAMA 2016, 316, 1093–1103, Erratum in: JAMA 2016, 316, 1924. [Google Scholar] [CrossRef]
- Briggs, A.H.; Wonderling, D.E.; Mooney, C.Z. Pulling cost-effectiveness analysis up by its bootstraps: A non-parametric approach to confidence interval estimation. Health Econ. 1997, 6, 327–340. [Google Scholar] [CrossRef]
- Briggs, A.; Fenn, P. Confidence intervals or surfaces? Uncertainty on the cost-effectiveness plane. Health Econ. 1998, 7, 723–740. [Google Scholar] [CrossRef]
- Fenwick, E.; O’Brien, B.J.; Briggs, A. Cost-effectiveness acceptability curves--facts, fallacies and frequently asked questions. Health Econ. 2004, 13, 405–415. [Google Scholar] [CrossRef] [Green Version]
- Husereau, D.; Drummond, M.; Petrou, S.; Carswell, C.; Moher, D.; Greenberg, D.; Augustovski, F.; Briggs, A.H.; Mauskopf, J.; Loder, E. Consolidated Health Economic Evaluation Reporting Standards (CHEERS) statement. Eur. J. Health Econ. 2013, 14, 367–372. [Google Scholar] [CrossRef] [PubMed] [Green Version]
- Jacobs, P.; Fassbender, K. The measurement of indirect costs in the health economics evaluation literature. A review. Int. J. Technol. Assess. Health Care 1998, 14, 799–808. [Google Scholar] [CrossRef] [PubMed]
- WMA Declaration of Helsinki 2013—Ethical Principles for Medical Research Involving Human Subjects. Available online: https://www.wma.net/policies-post/wma-declaration-of-helsinki-ethical-principles-for-medical-research-involving-human-subjects/ (accessed on 3 August 2021).
- CHCHILD Caregiver Priorities and Child Health Index of Life with Disabilities (CPCHILD©) Questionnaire. Manual and Interpretation Guide. Available online: https://lab.research.sickkids.ca/pscoreprogram/wp-content/uploads/sites/72/2017/09/6573-CPCHILD_manual.pdf (accessed on 26 December 2021).


| n 2 | Static Standing Median [q25th:q75th] | Dynamic Standing Median [q25th:q75th] | p-Value 3 | Effect Size 4 | |
|---|---|---|---|---|---|
| Before the exercise training period | |||||
| Total Score | 19 | 47.7 [44.3:57.7] | 51.3 [45.7:58.6] | 0.936 | 0.019 |
| Personal care, activities of daily living | 18 | 42.0 [31.8:51.9] | 43.8 [33.3:53.7] | 0.844 | 0.048 |
| Positioning, transferring, and mobility | 18 | 38.9 [25.7:50.3] | 38.9 [31.9:50.7] | 0.965 | 0.011 |
| Comfort and emotions | 18 | 75.0 [52.0:82.9] | 73.8 [52.2:86.1] | 0.663 | 0.106 |
| Communications and interactions | 19 | 45.2 [33.3:52.4] | 40.5 [33.3:54.8] | 0.541 | 0.144 |
| Health | 19 | 60.0 [40.0:73.3] | 53.3 [46.7:73.3] | 0.842 | 0.047 |
| Overall quality of life | 18 | 60.0 [40.0:60.0] | 60.0 [40.0:60.0] | 0.710 | 0.090 |
| After the exercise training period | |||||
| Total Score | 20 | 45.7 [41.2:53.2] | 57.5 [49.0:65.9] | 0.017 | 0.548 |
| Personal care, activities of daily living | 18 | 42.6 [32.7:55.9] | 52.5 [39.8:64.5] | 0.074 | 0.433 |
| Positioning, transferring, and mobility | 19 | 31.9 [25.0:48.6] | 45.8 [33.3:52.8] | 0.070 | 0.427 |
| Comfort and emotions | 18 | 69.8 [50.8:84.1] | 85.7 [59.9:88.9] | 0.199 | 0.312 |
| Communications and interactions | 20 | 41.7 [33.9:52.4] | 45.2 [41.2:65.5] | 0.007 | 0.616 |
| Health | 20 | 53.3 [46.7:66.7] | 60.0 [53.3:73.3] | 0.064 | 0.426 |
| Overall quality of life | 20 | 60.0 [40.0:60.0] | 60.0 [60.0:60.0] | 0.166 | 0.318 |
| Dynamic Standing Median [q25th:q75th] | Static Standing Median [q25th:q75th] | Difference (95% CI 2) | p-Value (Between-Group Comparison) Wilcoxon-Mann-Whitney | |
|---|---|---|---|---|
| CPCHILD 1 Score | 4.70 [−2.14:12.39] | −1.17 [−4.96:3.30] | 5.84 (−1.64 to 13.32) | 0.02 |
| Satisfaction | 1.00 [1.00:3.00] | 0.05 [−1.20:3.00] | 1.30 ** (0.31 to 2.29) | 0.02 |
| Alertness | 1.00 [0.00:2.00] | 0.00 [−1.50:1.00] | 0.95 (−0.24 to 2.14) | 0.08 |
| Fatigability | 1.5 [0.00:3.50] | 1.00 [−0.50:1.00] | 1.45 ** (0.33 to 2.57) | 0.03 |
| Ability to focus | 1.00 [0.00:2.00] | 0.00 [−0.50:0.50] | 1.2 ** (0.15 to 2.25) | 0.01 |
| Number of pain locations | −2.00 [−3.00:−1.00] | −0.00 [−1.00:0.00] | −1.75 *** (−2.50 to −1.00) | 0.00 |
| Number of doses of medicine | −2.00 [−4.00:0.00] | 0.00 [0.00:0.00] | −2.85 *** (−4.10 to −1.60) | 0.00 |
| Bristol Stool Scale 3 | −1.00 [−2.00:0.00] | 0.00 [0.00:1.00] | −1.05 *** (−1.64 to −0.46) | 0.00 |
| Bowel function: Frequency of bowel elimination *** | 0.00 | |||
| Increased | 10 (50%) | 0 (0%) | ||
| Unchanged | 10 (50%) | 18 (90%) | ||
| Reduced | 0 (0%) | 2 (10%) | ||
| Number of pain locations ** | 0.01 | |||
| Increased | 0 (0%) | 2 (10%) | ||
| Unchanged | 14 (70%) | 18 (90%) | ||
| Reduced | 6 (30%) | 0 (0%) |
| Difference in Cost (DyS 1 vs. StS 2) | Difference in Outcome (DyS vs. StS) | ICER | |
|---|---|---|---|
| CPCHILD 3 Score | 290 | 5.84 | 50 |
| Satisfaction | 290 | 1.30 | 223 |
| Number of pain locations | 290 | −1.75 | 166 |
| Stool consistency (Bristol Stool Scale 4) | 290 | −1.05 | 267 |
| Dynamic Standing (SD 1) | Static Standing (SD) | Difference (95% CI 2) | p-Value (Between-Group Comparison) Wilcoxon-Mann-Whitney | |
|---|---|---|---|---|
| Healthcare costs (perspective) § | 1190 (45) | 836 (193) | 354 *** (264 to 443) | 0.00 |
| Family cost (time) | 20 (0) | 84 (21) | −64 *** (−55 to −73) | 0.00 |
| Total cost societal perspective | 1210 (45) | 921 (212) | 290 *** (192 to 388) | 0.00 |
Publisher’s Note: MDPI stays neutral with regard to jurisdictional claims in published maps and institutional affiliations. |
© 2022 by the authors. Licensee MDPI, Basel, Switzerland. This article is an open access article distributed under the terms and conditions of the Creative Commons Attribution (CC BY) license (https://creativecommons.org/licenses/by/4.0/).
Share and Cite
Lauruschkus, K.; Jarl, J.; Fasth Gillstedt, K.; Tornberg, Å.B. Dynamic Standing Exercise in a Novel Assistive Device Compared with Standard Care for Children with Cerebral Palsy Who Are Non-Ambulant, with Regard to Quality of Life and Cost-Effectiveness. Disabilities 2022, 2, 73-85. https://doi.org/10.3390/disabilities2010006
Lauruschkus K, Jarl J, Fasth Gillstedt K, Tornberg ÅB. Dynamic Standing Exercise in a Novel Assistive Device Compared with Standard Care for Children with Cerebral Palsy Who Are Non-Ambulant, with Regard to Quality of Life and Cost-Effectiveness. Disabilities. 2022; 2(1):73-85. https://doi.org/10.3390/disabilities2010006
Chicago/Turabian StyleLauruschkus, Katarina, Johan Jarl, Katharina Fasth Gillstedt, and Åsa B. Tornberg. 2022. "Dynamic Standing Exercise in a Novel Assistive Device Compared with Standard Care for Children with Cerebral Palsy Who Are Non-Ambulant, with Regard to Quality of Life and Cost-Effectiveness" Disabilities 2, no. 1: 73-85. https://doi.org/10.3390/disabilities2010006
APA StyleLauruschkus, K., Jarl, J., Fasth Gillstedt, K., & Tornberg, Å. B. (2022). Dynamic Standing Exercise in a Novel Assistive Device Compared with Standard Care for Children with Cerebral Palsy Who Are Non-Ambulant, with Regard to Quality of Life and Cost-Effectiveness. Disabilities, 2(1), 73-85. https://doi.org/10.3390/disabilities2010006