Article

Dynamic Standing Exercise in a Novel Assistive Device Compared with Standard Care for Children with Cerebral Palsy Who Are Non-Ambulant, with Regard to Quality of Life and Cost-Effectiveness

by
Katarina Lauruschkus
1,*,
Johan Jarl
2,
Katharina Fasth Gillstedt
1 and
Åsa B. Tornberg
1
1
Department of Health Sciences, Faculty of Medicine, Lund University, 22100 Lund, Sweden
2
Health Economics, Department of Clinical Sciences, Faculty of Medicine, Lund University, 22184 Lund, Sweden
*
Author to whom correspondence should be addressed.
Disabilities 2022, 2(1), 73-85; https://doi.org/10.3390/disabilities2010006
Submission received: 30 September 2021 / Revised: 12 January 2022 / Accepted: 21 January 2022 / Published: 24 January 2022
(This article belongs to the Special Issue Health and Wellbeing of Individuals with Disability)

Abstract

:
Children with cerebral palsy who are non-ambulant cannot stand or walk independently. In Sweden, daily static standing is part of standard care for these children even though it is time-consuming and costly, and while it may benefit the well-being of many children, it is inconvenient for others. A novel stander enables dynamic standing through walking movements. The aim of this study was to compare dynamic and static standing regarding quality of life and cost-effectiveness. Twenty children with cerebral palsy who were non-ambulant were included in this randomized controlled study with a cross-over design. Mean age of the participants was 11.6 ± 3.6 years, nine were female. They participated in four months of static and four months of dynamic standing. Quality of life was assessed with the Caregiver Priorities and Child Health Index of Life with Disabilities (CPCHILD), which has been shown to be valid and reliable, and is tailored to children with severe cerebral palsy. Information about other aspects of quality of life and about cost-effectiveness was collected by study-specific questionnaires. Dynamic standing was the preferred alternative from the family perspective, as it cost less (€64, p < 0.01) and had greater benefits than standard (static standing) care. From societal and healthcare provider perspectives, dynamic standing had benefits but higher costs than static standing (€290 and €354 respectively, p < 0.01). These findings may contribute to the development of individualized standing recommendations.

1. Introduction

Cerebral palsy (CP) is the most prevalent motor disability amongst children, and is caused by a non-progressive interference, lesion, or other abnormality of the immature brain. It is often accompanied by comorbidities such as pain, epilepsy, and intellectual disability [1]. The functional limitations in children with CP vary from being able to walk without limitations to being non-ambulant and in need of support in all postures, and many children with CP experience a challenge in participating in physical activities. Children with CP, level IV-V according to the five level Gross Motor Function Scale Expanded and Revised (GMFCS E&R), cannot stand or walk independently [2]. In Sweden, 30–90 min of daily static standing (StS) is included in the standard care for children with CP who are non-ambulant (CP-NA) [3]. They do this either in individually built and adjusted standing shells placed in a prefabricated stander, or in prefabricated standers without a standing shell (Figure 1A–C). In StS, children are in an upright position, with no lower body movements possible. A variety of structural and functional effects of StS have been described, including improved bone mineral density, improved hip stability, a larger passive range of motion in the hip, knee and ankle joints, and enhanced activity and participation [3,4]. In addition, StS enables light physical activity [5,6].
However, StS is time-consuming and costly, and while it may benefit the well-being of many children, it is inconvenient for others. Some children and young people report pain and discomfort, and families experience an impact on the time they spend together [4]. A novel assistive device, Innowalk (Figure 1D), enables dynamic standing (DyS) by giving the children who cannot stand or walk by themselves an opportunity to experience walking movements with the legs in an upright weight-bearing position [7]. The results from a feasibility study aiming to facilitate physical activity in children with CP showed that children with CP-NA enjoyed DyS in the Innowalk. In addition, their parents reported warmer feet, improvements in bowel function, gross motor function, satisfaction, alertness, fatigability, and the ability to focus compared with StS [8]. When comparing four months of DyS with four months of StS, passive range of motion in the hip improved more with DyS and the spasticity in the hip decreased after one bout (30 min) of DyS, whereas StS had no such effects [5]. These positive effects of DyS compared with StS raise the question of whether or not DyS is a cost-effective treatment. This is an important question as the delivery of DyS requires resources that could be used for other purposes.
Quality of life is considered to be multidimensional and covers subjective appraisal of personal feelings, social relationships, societal values, and environmental and material conditions [9]. It can also be conceptualized as a person’s feeling of well-being across many domains, including physical, social, emotional, and spiritual aspects of life. Health-related quality of life (HRQOL) includes the person’s perceived physical and mental health over time within the broader concept of quality of life [10]. Pain [11], gross motor abilities, mental health [12], and physical activity [13] have been shown to be predictors of HRQOL in children with CP. In addition, bowel symptoms such as constipation and incontinence are frequent in individuals with CP over their lifespan, and they too have an impact on HRQOL [14].
To our knowledge, the effects of DyS on HRQOL have not been explored earlier, nor has any economic evaluation of DyS previously been performed. When comparing a novel intervention with standard care, cost-effectiveness analyses are essential for informed decisions about the efficient allocation of healthcare resources. Therefore, the aim of this study was to compare DyS and StS for children with CP-NA in terms of effect on HRQOL, costs, and cost-effectiveness over a four-month exercise training period, from both a healthcare and a societal perspective.

2. Materials and Methods

This study utilized data collected as part of a trial. Twenty-four children were initially included, and 20 completed the study. The number of children included in the study was based on a power calculation from preliminary data collected in a previous pilot and feasibility study. Dropout was caused by pain, illness, or surgery, and none of these reasons was related to the exercise intervention. The 20 participants, aged 5–17 years (mean 11.6 ± 3.6 years; 9 females) with CP-NA, were recruited through the Child and Youth Habilitation Services in the Skåne Region of southern Sweden. The children had either bilateral spastic or dyskinetic CP (14/6), GMFCS E&R level IV or V (11/9). Eighteen participants had an intellectual disability and 17 used augmentative and alternative communication.
The study was performed as a randomized controlled study with a cross-over design. A cross-over design was used due to the large individual differences in the population in this study, where each individual was their own control.
Each participant performed four months of StS and four months of DyS with a wash-out period of at least two weeks in-between. The participants were randomized into two groups by consecutive inclusion in the study and altered to start with StS or DyS. The intervention and the assessments were performed in the children’s habitual environment, which turned out to be their home or school, according to each participant’s preferences. A more detailed description of the exercise intervention has been published previously [5]. The assessments of HRQOL, bowel function, pain, satisfaction, alertness, fatigability, and the ability to focus were performed four times in total: once before and after each exercise training period. This procedure was chosen to enable the evaluation of each exercise intervention period. Information about the costs of and time spent in the two intervention regimes was collected from the children’s caregivers, from healthcare personnel employed by the Child and Youth Habilitation Services, from orthopedic engineers responsible for the standing shells, and from product specialists responsible for the dynamic standing devices.

2.1. Aspects of Quality of Life

The HRQOL was assessed by using the Scandinavian version of the Caregiver Priorities and Child Health Index of Life with Disabilities (CPCHILD), which has been shown to be valid and reliable, and is tailored to children with CP-NA [10,15,16]. The CPCHILD consists of six different sections and 37 items in total. The different domains are: (1) Activities of Daily Living/Personal Care (9 items), (2) Positioning, Transferring, and Mobility (8 items), (3) Comfort and Emotions (9 items), (4) Communication and Social Interaction (7 items), (5) Health (3 items), and (6) Quality of Life (1 item). For the first two sections, the degree of difficulty of performing each task was rated on a 7-point ordinal scale where 0 stands for ‘impossible’ and 6 for ‘no problem at all’. For the third section, the frequency of discomfort was rated on a 6-point ordinal scale where 0 stands for ‘every day’ and 5 for ‘none of the time’. Furthermore, for the first two sections the level of assistance needed to perform the task and for the third section the intensity of discomfort/emotions were rated on a 4-point ordinal scale where 0 stands for ‘total assistance’ respectively ‘severe’ and 3 for ‘independent’ respectively ‘none’. In the fourth section, the same 7-point ordinal scale as in the first two sections was used, but without an additional scale for the level of assistance needed. Items in sections 5 and 6 were rated on a 6-point ordinal scale. By dividing the raw item score by the maximum item score and multiplying by 100, the scores were transformed to a scale of 0 to 100 where 0 was the worst and 100 the best. By calculating the mean of these values, both within the different domains and for the total 37 items of the questionnaire, a standardized score of the overall HRQOL on the scale of 0 to 100 was achieved. Missing values resulted in the item being removed from the calculations. As long as no more than half of the items of the domain was unanswered, the remaining answers could still be used for calculating the score [10].
Information about each child’s satisfaction, alertness, fatigability, ability to focus, bowel function, and pain the last week before the exercise tests was collected by questionnaires. A study-specific questionnaire was designed to evaluate satisfaction, alertness, fatigability, and the ability to focus on a Visual Analogue Scale 1–10, where one represented ‘very bad’ and 10 ‘extremely good’.
Bowel function was assessed by another study-specific questionnaire, consisting of questions about the frequency of and pain associated with bowel elimination and about the number of doses of medicine used. The Bristol Stool Scale 1–7 was used to classify feces into seven different groups, where 1–2 indicated constipation, 3–4 an ideal stool, and 5–7 diarrhoea and urgency [17].
The occurrence of pain and the number of pain locations were assessed according to the CPUP protocol. The CPUP is a follow-up surveillance program and designated as a National Quality Register for people with CP in Sweden [18].
Data related to quality of life were analyzed for statistical differences with Wilcoxon-Mann-Whitney test since normal distribution of the data set could not be assumed.

2.2. Costs

Healthcare sector costs included costs for equipment and time spent by healthcare personnel to introduce, adjust, and maintain the equipment. As the expected lifetime of the equipment exceeded the 4-month study period (3 years for StS and 6.5 years for DyS), we annualized non-recurrent costs using a straight-line depreciation [19]. From a societal perspective we also included, in addition to the cost in the healthcare sector, time (including travel time) costs for parents’ visits to the Child and Youth Habilitation Services, the Assistive Technology Centers, and the Orthopedic Technical Centers. We assumed this time was taken from parental work time and was valued according to the human capital approach. We used the median salary in Sweden in 2019 (€2994/month) [20] including taxes and social fees (53.5%) divided by normal full-time monthly working hours (176) to obtain an hourly value of parental time of €17 per hour. The cost for healthcare personnel was similarly based on the average salaries for orthopedic engineers, assistive technology consultants, technicians, and physiotherapists. This information was collected directly from the Child and Youth Habilitation Services and an Orthopedic Technical Center. For DyS, the personnel cost included in the cost of the equipment as initiation, adjustment, and maintenance is included in Region Skåne’s procurement. The costs of the interventions were collected separately for each of the two standing regimes.
Sixteen children used a standing shell (n = 16), with a depreciation period of 3 years. The costs for the standing shells were taken from Region Skåne’s procurement agreement with the supplier [21], which includes cost of production and initial adjustment. Standing shells were individually cast for the growing child and could not be used for another child. Different types of standing frames were used for the standing shells, according to individual conditions and needs. Four children used standing frames without a standing shell. Standing frames were available in different sizes and could be used for other children.
The costs for DyS consisted of the cost for the Innowalk (n = 20), with a depreciation period of 6.5 years. Innowalk devices are available in four sizes. Each size can be adjusted to the growing child or adolescent within a specified span, and the Innowalk can be reused for another person. All additional assistive technology accessories for each Innowalk were included in the price, as were the costs for the product specialists who were responsible for the adjustments of each individual device.
As a normal distribution could not be assumed, the comparison of means between DyS and StS in terms of costs and effects was performed using Wilcoxon-Mann-Whitney test for continuous and Chi square test for categorical variables. All costs are presented as euros in 2019 years price levels (€1 = SEK10.5892). No discounting was applied due to the 4-month exercise training period.

2.3. Cost-Effectiveness Analysis

The economic evaluation was performed from both societal and healthcare perspectives, following guidelines [22]. The societal perspective included all costs irrespective of who was burdened by them, while the healthcare perspective only included costs to the healthcare sector. The incremental cost-effectiveness ratio (ICER) was calculated by dividing the incremental cost by the incremental benefits, the latter primarily measured as health-related quality of life. The ICER represented the additional cost of gaining one additional unit of the outcome under study in the intervention group compared with standard care. Uncertainty around incremental costs and outcomes was estimated using non-parametric bootstrapping with 5000 replications [23]. The bootstrapped cost-effect pairs and confidence intervals were then graphically presented in a cost-effectiveness plane where the difference between the two treatments in terms of costs are shown on the vertical axis and the effects on the horizontal axis [24]. The southeast quadrant of cost-effectiveness plane represents situations where the new treatment is more effective and less costly, i.e., dominating standard care, while the northwest quadrant represents the opposite. In these cases, the cost-effectiveness decision is straightforward. However, in the northeast (intervention is more costly and more effective) and the southwest quadrants (intervention is less costly and less effective) whether the intervention can be considered cost-effective depends on society’s willingness-to-pay for one unit of the effectiveness outcome used. To illustrate the likelihood of DyS being cost-effective at different willingness-to-pay thresholds, we also present a Cost-Effectiveness Acceptability Curve (CEAC) [25], which is a graphical illustration of the cost-effectiveness plane where the value of the outcome is allowed to vary. It should be noted that the trial was not originally powered to test the cost-effectiveness hypothesis.
This economic evaluation followed the Consolidated Health Economic Evaluation Reporting Standards (CHEERS) [26], see Supplementary Material.

2.4. Sensitivity Analysis

We performed three sensitivity analyses to check assumptions and uncertainties around the findings. First, we changed our assumption that the time spent by parents was taken out of work and instead assumed it was leisure time. We valued leisure time as 25% of the value of labor market productivity [27]. Second, as StS is standard care in Sweden, we did not expect to see any significant effect on HRQOL within this group over the study period. Therefore, we assigned, as a sensitivity analysis, an assumption of a zero effect of StS. Third, we limited the standard care to only adjusted standing shells placed in a prefabricated standers (n = 16), and excluded participants with prefabricated standers without a standing shell (n = 4) as the cost structure differed between standard care with and without shells.

2.5. Ethical Considerations

In accordance with the Declaration of Helsinki [28], the children received child-appropriate oral and written information before they gave their assent, and their caregivers received oral and written information before they submitted written consent. None of the authors was involved in the participants’ care. The study was approved by the Regional Ethical Review Board in Lund, Sweden (dnr 2017/67), and registered at ISRCTN (ISRCTN10569363).

3. Results

3.1. HRQOL

There was no statistically significant change in quality of life after StS. However, a statistically significant difference in quality of life between DyS and StS was seen (p = 0.017). Communications and interactions were rated higher after DyS than after StS (p = 0.007) (Table 1).
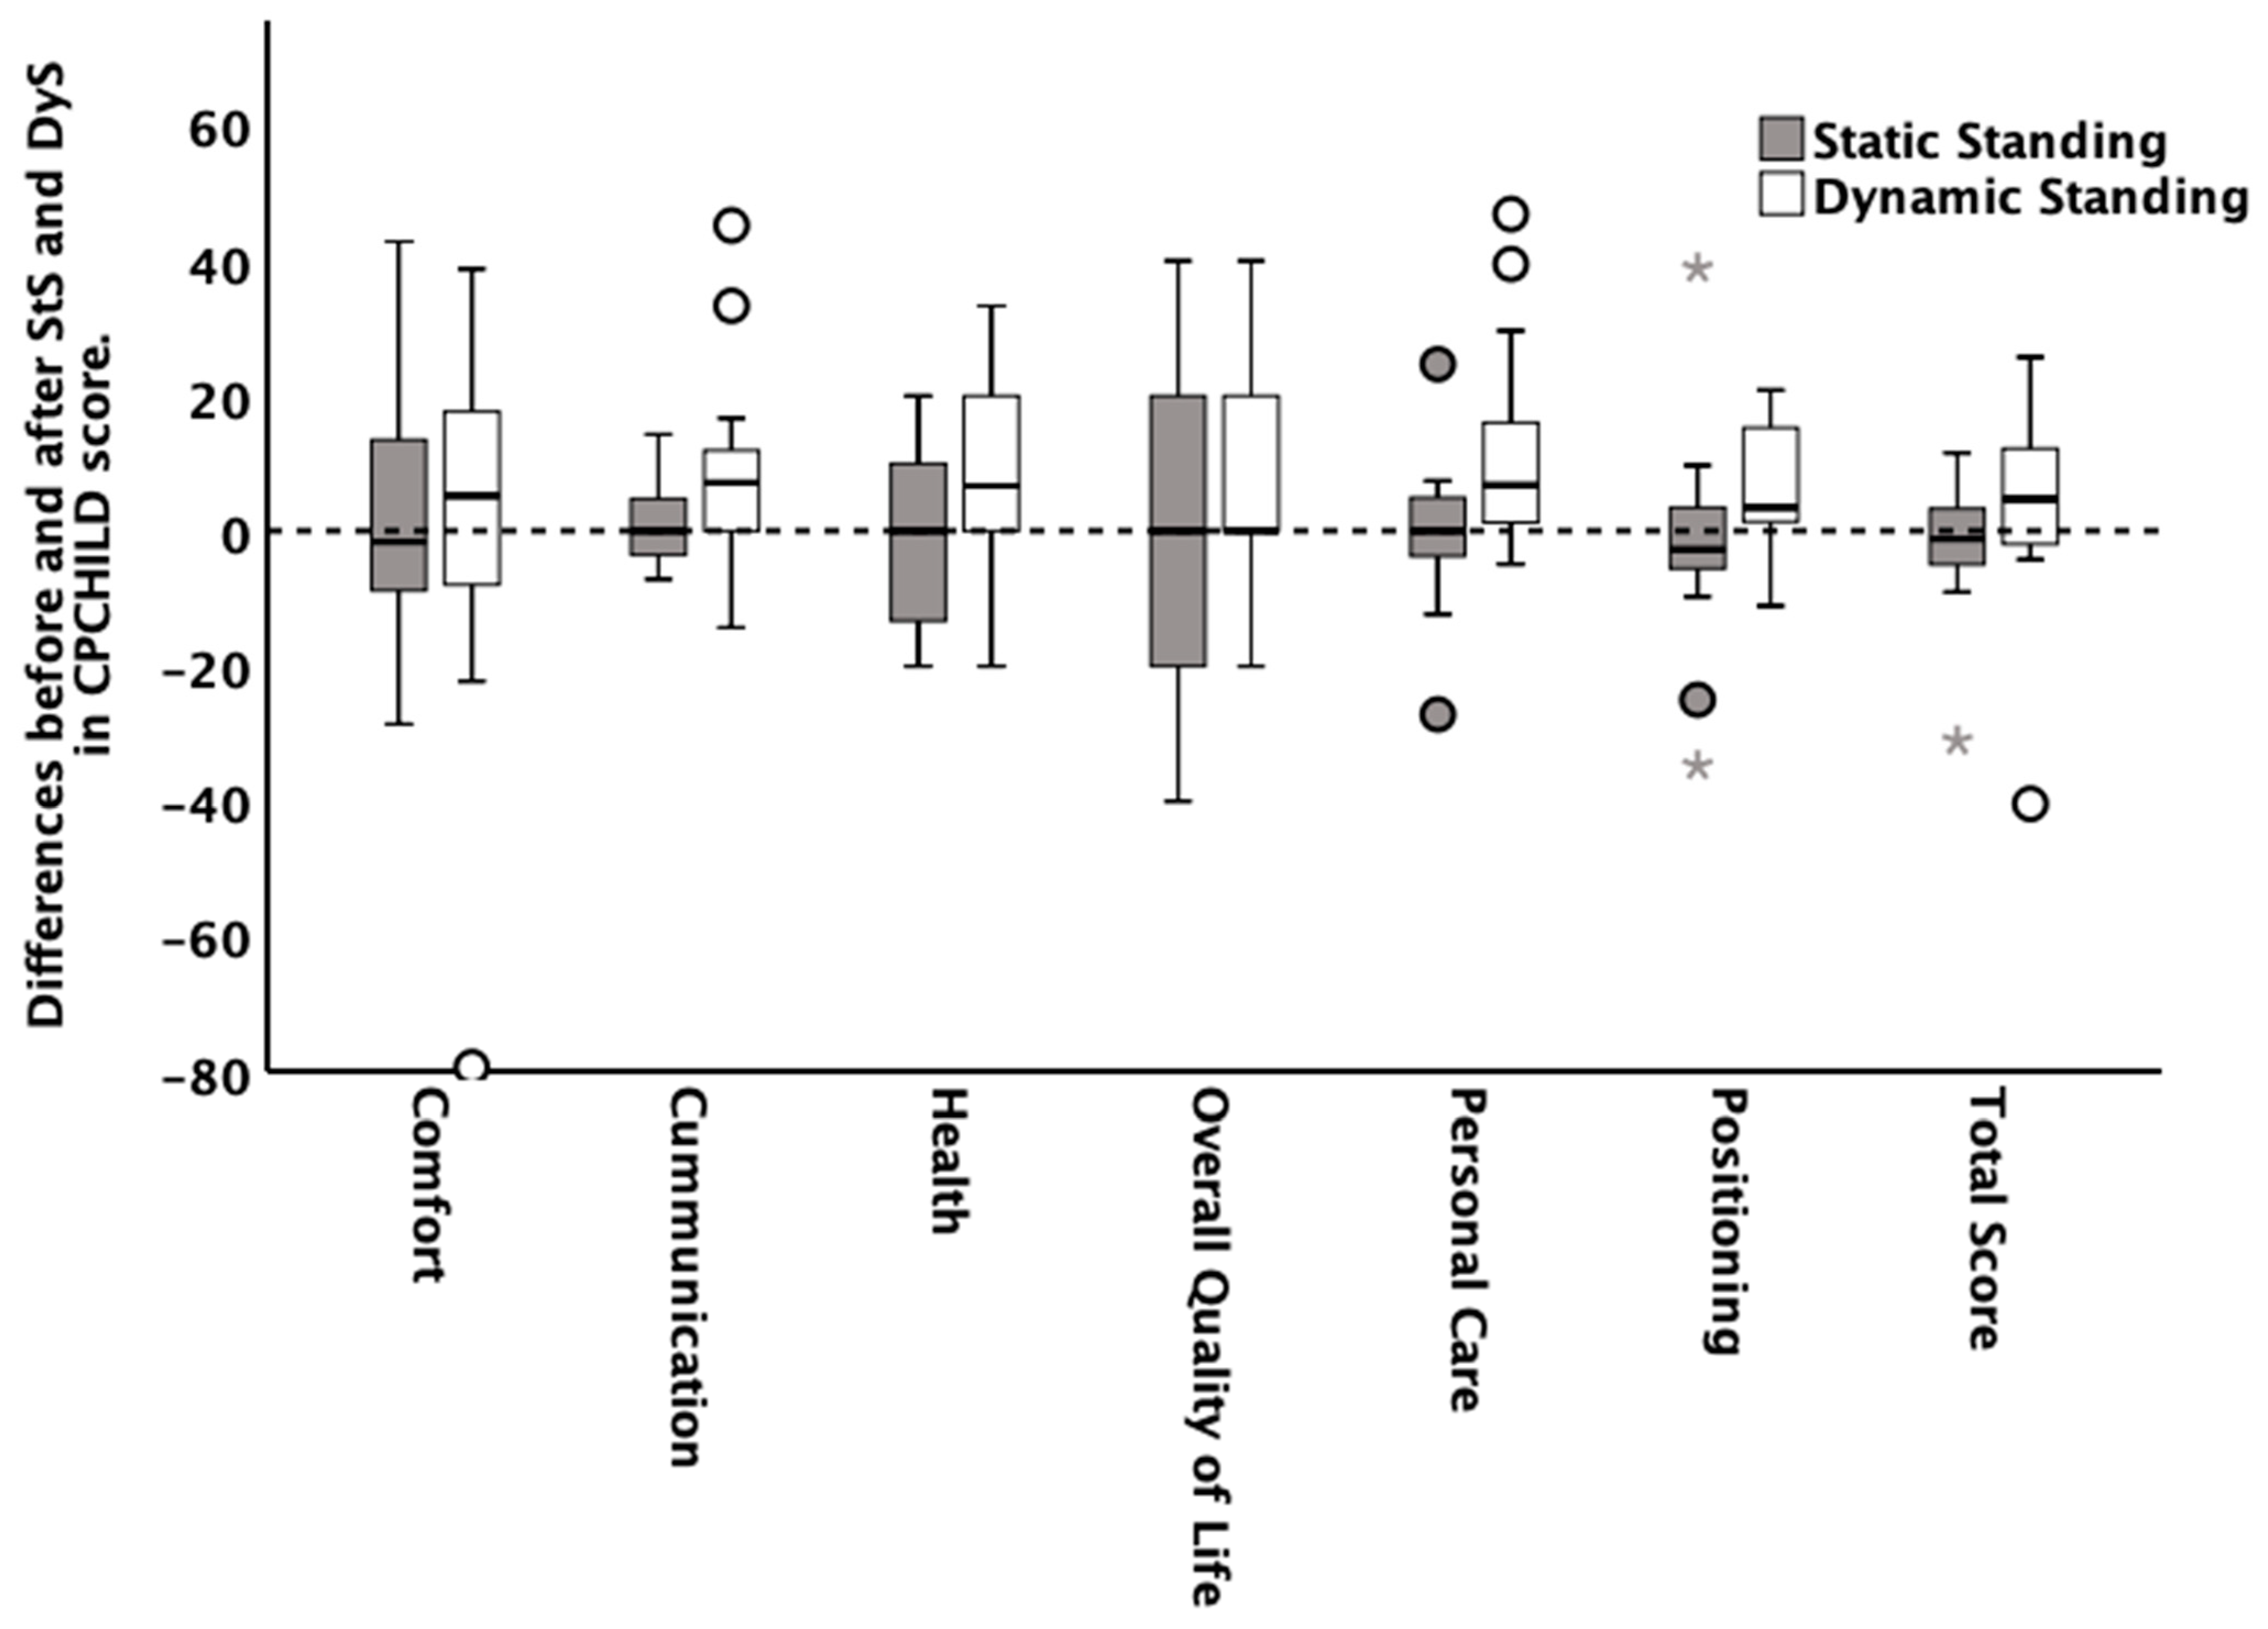
The comparison of the change in quality of life after the exercise training periods is further illustrated with boxplots in Figure 2, showing both the changes in total score and for each domain. The boxplots show that there was a clinically relevant increase in quality of life (larger than 5 units [29]) especially after DyS.

3.2. Satisfaction, Alertness, Fatigability, Ability to Focus, Bowel Function, Medication, and Pain

Changes in each child’s satisfaction, alertness, fatigability, ability to focus, bowel function, medication, and pain were seen both within and between the treatment groups as presented in Table 2. However, the differences between DyS and StS were larger than within the groups. DyS was better than StS in all outcomes except alertness. Bowel function was reported as increased, reduced, or unchanged frequency of bowel elimination. DyS was associated with less constipation than StS. DyS was associated with a reduction in pain locations, both measured as a continuous and a categorical variable, the latter indicating increasing, decreasing, or unchanged number of pain locations.

3.3. Costs

The average per patient healthcare costs for DyS were €354 higher than StS, which was predominantly due to a higher equipment cost for the Innowalk. The higher healthcare costs were somewhat compensated for by a lower cost from the family perspective, due to fewer journeys to the Habilitation Services, as all adjustments of the Innowalk were done in the families’ homes. However, the total cost of DyS was on average €290 higher per patient than StS over the four-month exercise training period.

3.4. Cost-Effectiveness

There were significant differences in costs from all studied perspectives. In addition, the studied outcome measures were all statistically significantly different between the groups, with the exception of alertness. In Table 3, we combine some of the outcomes with the societal cost by calculating the societal incremental cost-effectiveness ratio (ICER). The results show the societal cost of gaining one additional unit of the specific outcome measure. The ICERs for CPCHILD score, satisfaction, number of pain locations, and the Bristol Stool Scale varied between €50–267 per unit gained. From a healthcare perspective, due to the larger healthcare cost of DyS (Table 4), the ICERs amounted to €61–337. From the perspective of the family, the Innowalk was the dominating alternative as the costs were lower (Table 4) and the effects were higher than standard care (Table 3).
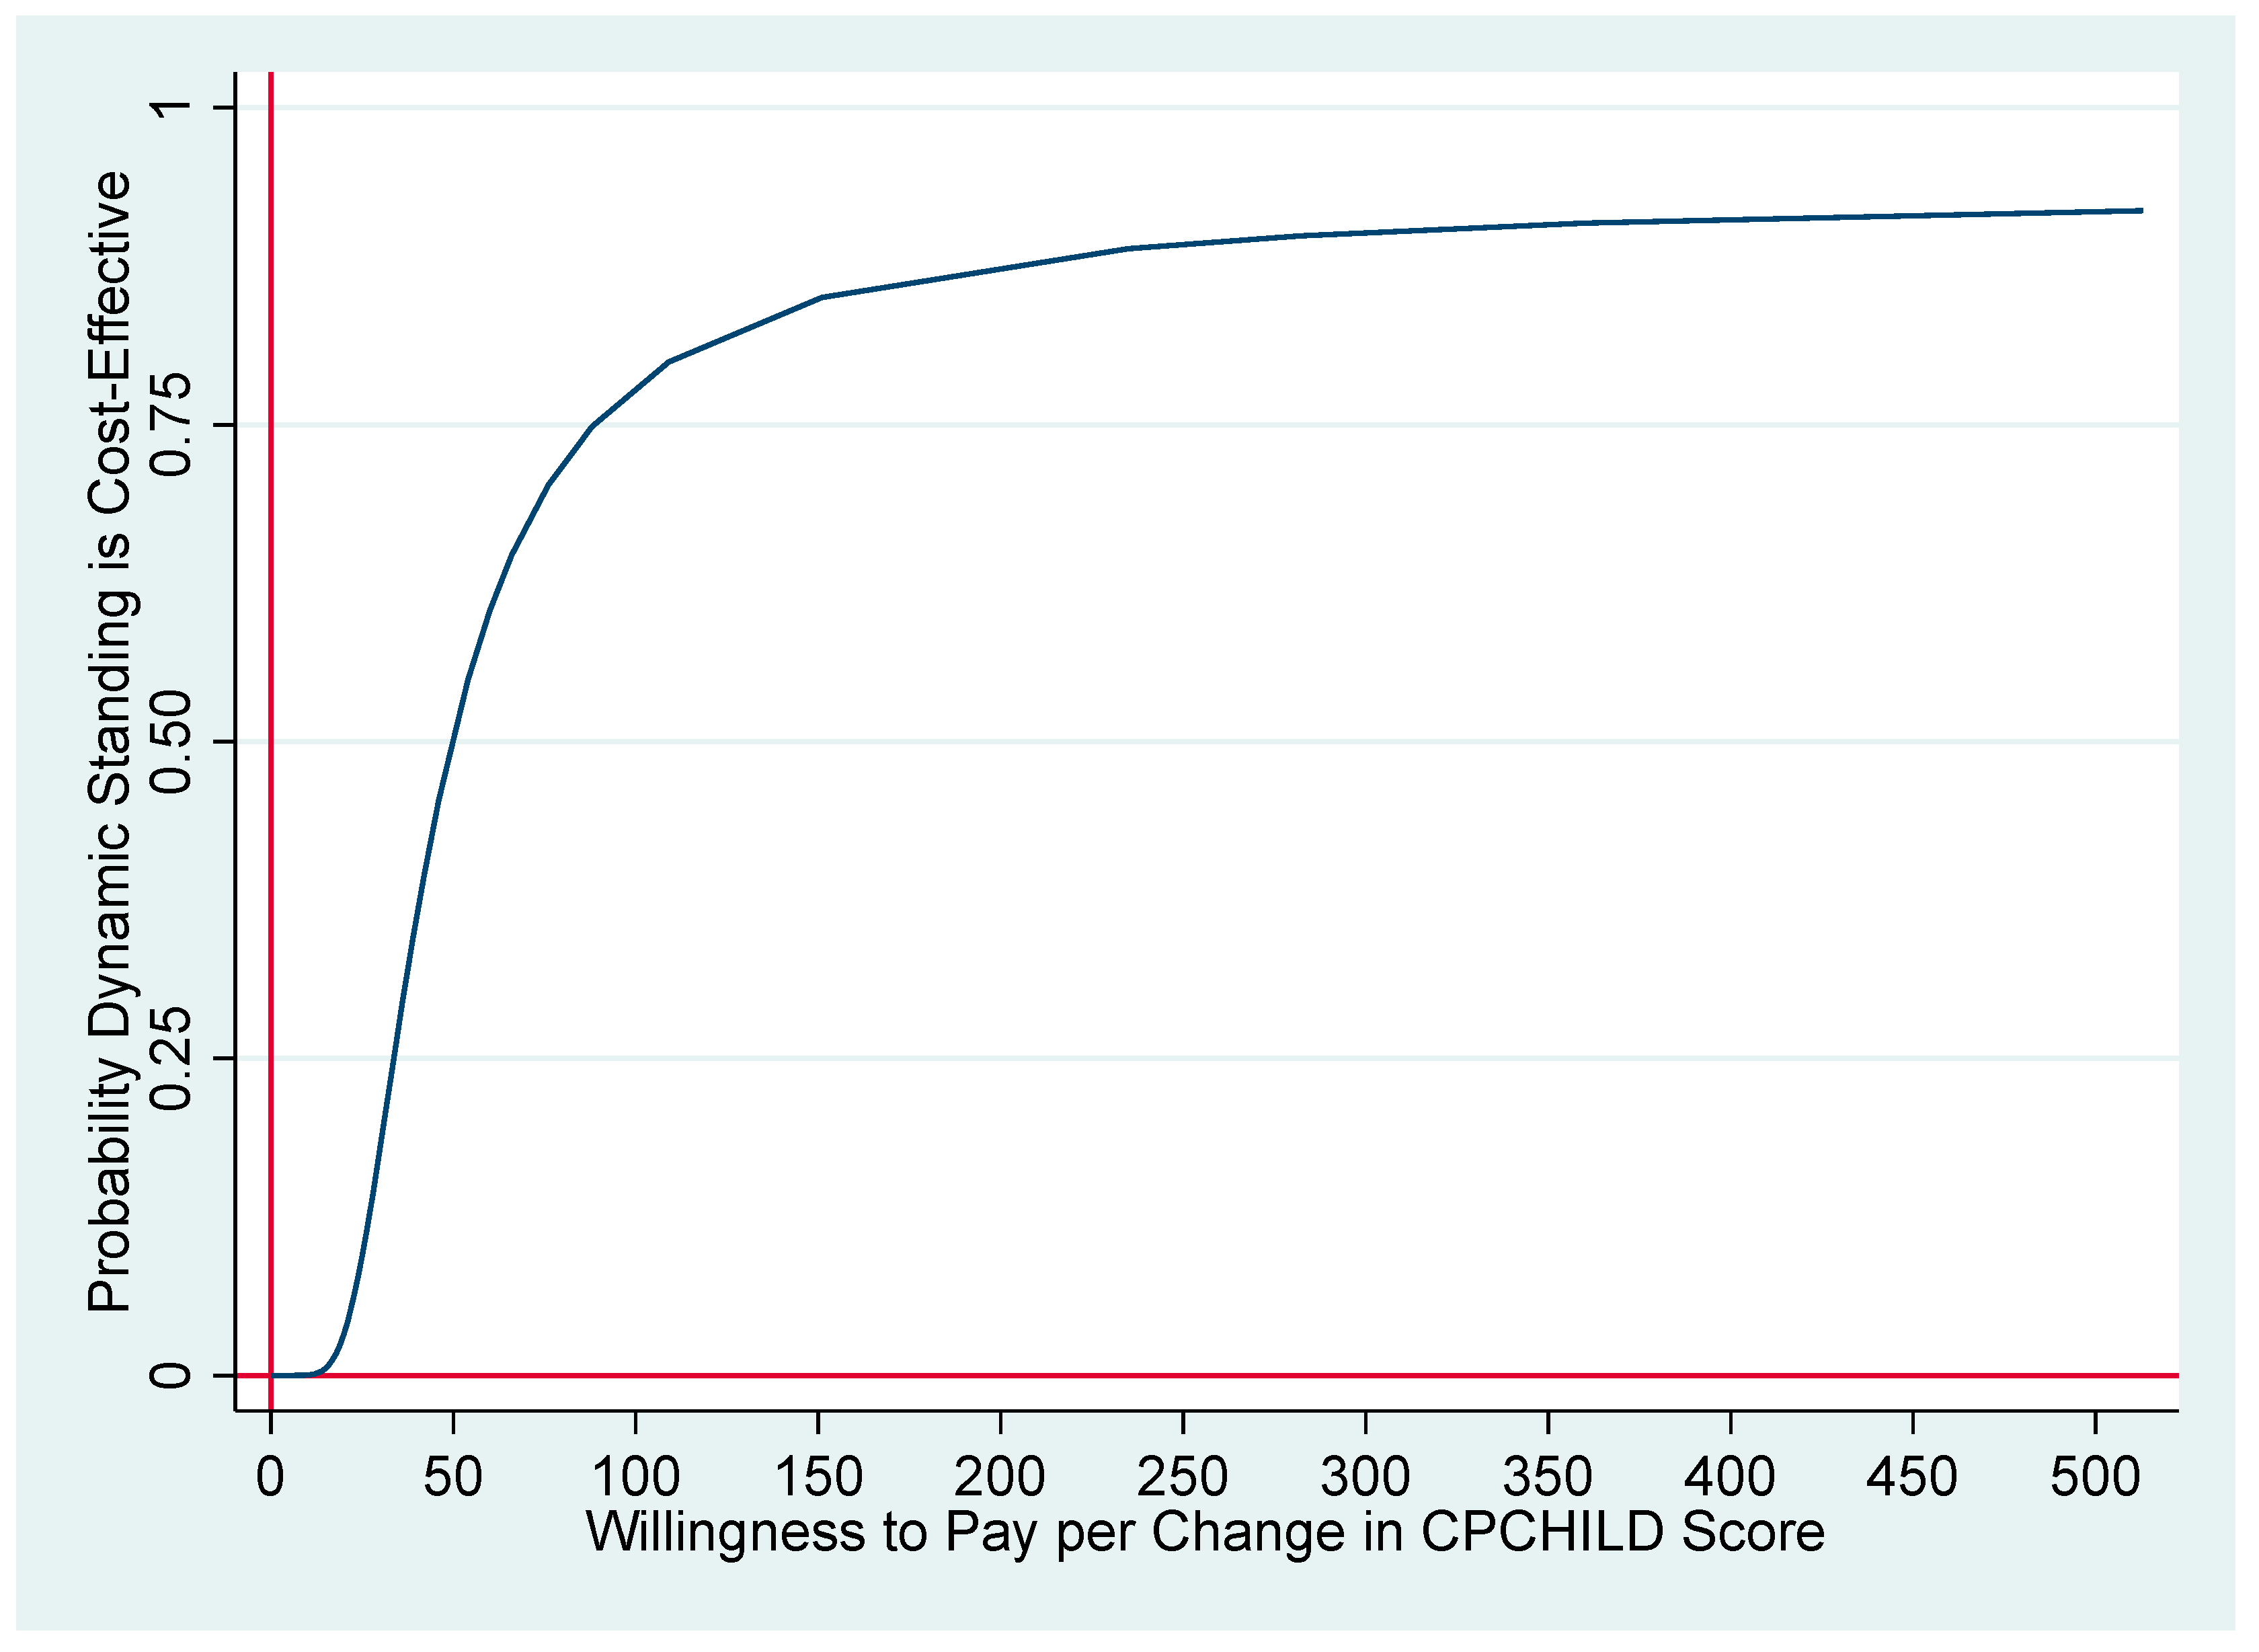
The cost-effectiveness plane for the main outcome, CPCHILD Score, shows that from a societal perspective about 94% of the bootstrapped incremental cost-effectiveness pairs were located in the north-east quadrant, while the remaining were located in the north-west (Figure 3). Presenting the bootstrapped results as a cost-effectiveness acceptability curve (Figure 4) shows that DyS had around 50% probability of being cost-effective compared to StS from the societal perspective at a willingness to pay for a one-unit change in the CPCHILD Score above €50, and 90% probability of being cost-effective at a willingness to pay above €360.

3.5. Sensitivity Analysis

To test the uncertainty around the base case result, three sensitivity analyses were performed investigating the effect of assumptions and methodological choices made (Table A1). In the base case, we assumed that the time of the parents was taken from labor market productivity. In the first sensitivity analysis, we instead assumed that this time was taken from the parents’ leisure time. This increased the cost difference between DyS and StS by reducing the overall cost for StS, resulting in a higher ICER (€58) than the base case.
In our second sensitivity analysis, we assumed that the insignificant numerical effect of StS was equal to zero. That is, as StS was the standard care that these children underwent, there was no reason to expect an effect of this training on our outcomes. This increased the ICER to €66 by reducing the positive effect of DyS. In the third sensitivity analysis, we limited our sample to children who, in standard care, used individually adjusted standing shells, placed in a prefabricated stander. That is, we excluded the four children who used standers without standing shells. This had no effect on the ICER, although both the cost and effect differences between the groups was reduced.

4. Discussion

The quality of life improved after a four-month exercise training period of DyS for children with CP-NA. The effect of DyS on our main outcome measuring HRQOL, the CPCHILD Score, was found to be statistically significant. In addition, the secondary outcomes satisfaction, fatigability, ability to focus, number of pain locations, number of doses of medicine, and bowel function improved significantly with DyS, which is in accordance with the parent-reported effects shown in a feasibility study [8]. However, the alertness improved slightly less with DyS than StS, which may have been due to tiredness after exercising. DyS showed better effects for the measured aspects of quality of life but was more costly in both a healthcare and societal perspective when compared to StS.
There are some minor differences between the results of this study and other studies that have used the CPCHILD regarding Total Score after performing StS. The study of Narayanan et.al. (2007) showed an average in Total Score of 51.9 for children with CP-NA [16], whereas the study of Pettersson et al. (2017) presented an average of 47.0 in Total Score [17]. In this study, the mean value of Total Score was 49.7 before the exercise training period with static standing and 47.5 after. This indicates that the results of this study regarding HRQOL when performing StS were within the normal expectancy for the analyzed GMFCS-E&R level, strengthening the credibility of this study. However, the decrease of Total Score after StS might be explained by the washout periods prior to each exercise training period, where the children did not have a standing exercise at all for at least two weeks. To be able to draw further conclusions of how StS affects children’s quality of life, StS would have to be compared to another standard treatment or treatment over a longer period of time.
The calculated ICERs for the CPCHILD score (€50), satisfaction (€223), number of pain locations (€166), and stool consistency (€267) indicate the required societal willingness to pay for a one-unit improvement in the specific outcomes in order for DyS to be considered cost-effective. The sensitivity analyses indicate that the results were affected by the assumptions in the study, but the overall effect was relatively small.
The higher healthcare costs of DyS compared to StS could provide acceptable value for money, but it depends on the valuation of the health outcomes. These are unfortunately unknown, although the positive effects of DyS on a number of different outcome measures (satisfaction, fatigability, ability to focus, number of pain locations, number of doses of medicine and bowel function, and Bristol Stool Scale) would indicate a potential for DyS to be cost-effective. It should be noted that the reduction in number of doses of medicines could not be valued in monetary terms due to lack of information in the trial. However, if this could have been done, it is likely that this would have reduced the healthcare cost of DyS, increasing the likelihood that DyS is cost-effective. In addition, we completely lacked information on healthcare visits/needs unrelated to adjustment of the training equipment. That is, we do not know whether or not DyS has an impact on healthcare utilization.
The trial lasted four months, which was too short a period to capture any long-term effects of the intervention. Four months is often also considered too short a period to capture quality of life effects. Considering the positive effect on quality of life indicated in the current study and the positive effects noted for other outcomes, it is possible that DyS will result in an even larger improvement in quality of life over time. However, further studies with longer follow-up periods are required to establish this.
The uncertainty analysis presented in the bootstrapped cost-effectiveness plane (Figure 3) shows that most incremental cost-effectiveness pairs fell in the northeast quadrant, indicating that DyS was both more costly and better, and the choice of whether or not to implement the intervention depends on the societal willingness to pay. The cost-effectiveness acceptability curve (Figure 4) indicates that there is a high likelihood that DyS is cost-effective if society’s willingness-to-pay for a one-unit increase in the CPCHILD Score is above €100 (>75%). Further studies are needed, however, that also include the effect of DyS, compared to StS, on healthcare and pharmaceutical costs. These studies should also endeavor to have a larger sample size and a longer follow-up period.
To the authors’ knowledge, this is the first economic evaluation of a trial comparing dynamic and static standing exercise training for children with non-ambulant cerebral palsy. The study has some limitations which mean that the study warrants cautious interpretation. As mentioned above, the study period was only four months and the effects might not be able to be extrapolated over a longer period. We also lack information on costs related to medications and healthcare utilization. The number of participants in the trial was small (n = 20 with a cross-over design) which means that individual costs and outcomes may have had a large impact on the results. Other factors regarding family preferences—such as set up time and location options, noise from the equipment, family attraction to physical activity, new technology, or participating in a study—were not assessed in this study. Finally, neither the families nor the assessors were blinded to treatment allocation due to the nature of the trial, which may imply an expectation bias. Although the structured questionnaires completed by the parents themselves could minimize this risk of bias, it cannot be ruled out.
Generalizing the results to other countries should be made with caution as the results of the current study depended on the contextual situation. When considering DyS in other contexts, differences in healthcare and social insurance systems as well as standard care need to be considered. In the future, it is important to use the results of this study together with the results of studies researching the physical effects of DyS in order to analyze the overall effects in a larger perspective. There are not many studies comparing the quality of life before and after using the Innowalk or other methods of dynamic standing, stressing the importance of further studies with a larger population.

5. Conclusions

Dynamic standing using the Innowalk was the preferred alternative from the family perspective, as it had lower costs and greater benefits than the standard care of static standing. Additional factors that may affect family preferences towards DyS or StS need to be investigated. From both a healthcare and a societal perspective, DyS was better but more costly than StS. If the value of a one-unit change in quality of life as measured in the CPCHILD score is considered to be above €100, DyS can be considered to be cost-effective. These findings may contribute to the development of individualized standing recommendations.

Supplementary Materials

The following are available online at https://www.mdpi.com/article/10.3390/disabilities2010006/s1, File S1: CHEERS Checklist.

Author Contributions

Conceptualization, K.L. and Å.B.T.; methodology, K.L., Å.B.T. and J.J.; formal analysis, Å.B.T. and J.J.; investigation, K.L. and Å.B.T.; resources, K.L. and Å.B.T.; data curation, Å.B.T. and K.F.G.; writing—original draft preparation, review and editing, K.L., Å.B.T., J.J. and K.F.G.; supervision, Å.B.T.; project administration, K.L.; funding acquisition, K.L., J.J. and Å.B.T. All authors have read and agreed to the published version of the manuscript.

Funding

This research was funded by the Foundation of Aid to Disabled in Skåne, the Promobilia Foundation, the Linnea and Joseph Carlsson Foundation, and the Swedish National Association for Disabled Children and Young People. J.J. was funded by the Swedish Research Council for Health, Working Life and Welfare (No. 2018-01468). The Health Economics Unit at Lund University also receives core funding from the Government Grant for Clinical Research (ALF F2014/354). The funders had no role in designing, conducting, or reporting the analysis.

Institutional Review Board Statement

The study was conducted according to the guidelines of the Declaration of Helsinki, approved by the Regional Ethical Review Board in Lund, Sweden (dnr 2017/67), and registered at ISRCTN (ISRCTN10569363).

Informed Consent Statement

The participating children received child-appropriate oral and written information before they gave their assent. Informed consent was obtained from all caregivers involved in the study.

Data Availability Statement

The data presented in this study are available on request from the corresponding author.

Acknowledgments

We wish to thank all participating children and their families for their active participation in the study. We also want to thank the Swedish national association for disabled children and young people for their support during the recruitment process. Finally, we want to thank Madeformovement, Norway, for adjusting the Innowalk devices used in the study for each participant, and Fredrik Rosengren, Rikke Damkjaer Moen, and Tomas Johansson from Madefor-movement for their particular engagement in this study.

Conflicts of Interest

The authors declare no conflict of interest. The funders had no role in the design of the study; in the collection, analyses, or interpretation of data; in the writing of the manuscript, or in the decision to publish the results.

Appendix A

Table A1. Sensitivity analyses of the Incremental Cost-Effectiveness Ratio (ICER) from the societal perspective.
Difference in Cost (€)Difference in OutcomeICER
Base case2905.8450
Time valued at 25% of labor market productivity3385.8458
No negative effect of standard care assumed2904.3866
Exclude all participants (4) who do not have a standing shell as standard care1963.9150

References

  1. Rosenbaum, P.; Paneth, N.; Leviton, A.; Goldstein, M.; Bax, M.; Damiano, D.; Jacobsen, B. A report: The definition and classification of cerebral palsy. Dev. Med. Child Neurol. 2007, 109, 8–14. [Google Scholar]
  2. Palisano, R.J.; Rosenbaum, P.; Bartlett, D.; Livingston, M.H. Content validity of the expanded and revised Gross Motor Function Classification System. Dev. Med. Child Neurol. 2008, 50, 744–750. [Google Scholar] [CrossRef] [PubMed]
  3. Paleg, G.S.; Smith, B.A.; Glickman, L.B. Systematic review and evidence-based clinical recommendations for dosing of pediatric supported standing programs. Pediatr. Phys. Ther. 2013, 25, 232–247. [Google Scholar] [CrossRef] [PubMed]
  4. Goodwin, J.; Lecouturier, J.; Basu, A.; Colver, A.; Crombie, S.; Smith, J.; Howel, D.; McColl, E.; Parr, J.R.; Kolehmainen, N.; et al. Standing frames for children with cerebral palsy: A mixed-methods feasibility study. Health Technol. Assess. 2018, 22, 1–232. [Google Scholar] [CrossRef]
  5. Tornberg, Å.B.; Lauruschkus, K. Non-ambulatory children with cerebral palsy: Effects of four months of static and dynamic standing exercise on passive range of motion and spasticity in the hip. PeerJ 2020, 8, e8561. [Google Scholar] [CrossRef]
  6. Verschuren, O.; Peterson, M.D.; Balemans, A.C.; Hurvitz, E.A. Exercise and physical activity recommendations for people with cerebral palsy. Dev. Med. Child Neurol. 2016, 58, 798–808. [Google Scholar] [CrossRef]
  7. Innowalk. Available online: www.madeformovement.com/innowalk (accessed on 15 August 2021).
  8. Lauruschkus, K.; Hallström, I.; Westbom, L.; Tornberg, Å.; Nordmark, E. Participation in physical activities for children with cerebral palsy: Feasibility and effectiveness of physical activity on prescription. Arch. Physiother. 2017, 7, 13. [Google Scholar] [CrossRef] [Green Version]
  9. World Health Organization. Division of Mental Health and Prevention of Substance Abuse. WHOQOL: Measuring Quality of Life. 1997. Available online: https://apps.who.int/iris/handle/10665/63482 (accessed on 3 August 2021).
  10. Pettersson, K.; Rodby-Bousquet, E. Prevalence and goal attainment with spinal orthoses for children with cerebral palsy. J. Pediatric Rehabil. Med. 2019, 12, 197–203. [Google Scholar] [CrossRef] [Green Version]
  11. Jacobson, D.N.O.; Löwing, K.; Tedroff, K. Health-related quality of life, pain, and fatigue in young adults with cerebral palsy. Dev. Med. Child Neurol. 2020, 62, 372–378. [Google Scholar] [CrossRef]
  12. Janssen, C.G.; Voorman, J.M.; Becher, J.G.; Dallmeijer, A.J.; Schuengel, C. Course of health-related quality of life in 9-16-year-old children with cerebral palsy: Associations with gross motor abilities and mental health. Disabil. Rehabil. 2010, 32, 344–351. [Google Scholar] [CrossRef]
  13. Maher, C.A.; Toohey, M.; Ferguson, M. Physical activity predicts quality of life and happiness in children and adolescents with cerebral palsy. Disabil. Rehabil. 2016, 38, 865–869. [Google Scholar] [CrossRef]
  14. Marciniak, C.M.; Lee, J.; Jesselson, M.; Gaebler-Spira, D. Cross-Sectional Study of Bowel Symptoms in Adults with Cerebral Palsy: Prevalence and Impact on Quality of Life. Arch. Phys. Med. Rehabil. 2015, 96, 2176–2183. [Google Scholar] [CrossRef] [PubMed]
  15. Carlon, S.; Shields, N.; Yong, K.; Gilmore, R.; Sakzewski, L.; Boyd, R. A systematic review of the psychometric properties of Quality of Life measures for school aged children with cerebral palsy. BMC Pediatr. 2010, 10, 81. [Google Scholar] [CrossRef] [PubMed] [Green Version]
  16. Narayanan, U.G.; Fehlings, D.; Weir, S.; Knights, S.; Kiran, S.; Campbell, K. Initial development and validation of the Caregiver Priorities and Child Health Index of Life with Disabilities (CPCHILD). Dev. Med. Child Neurol. 2006, 48, 804–812. [Google Scholar] [CrossRef] [PubMed] [Green Version]
  17. Lewis, S.J.; Heaton, K.W. Stool form scale as a useful guide to intestinal transit time. Scand. J. Gastroenterol. 1997, 32, 920–924. [Google Scholar] [CrossRef]
  18. CPUP. A Follow-Up Surveillance Programme for People with Cerebral Palsy (CP). Available online: https://cpup.se (accessed on 3 August 2021).
  19. Walker, D.; Kumaranayake, L. Allowing for differential timing in cost analyses: Discounting and annualization. Health Policy Plan. 2002, 17, 112–118. [Google Scholar] [CrossRef] [Green Version]
  20. Statistics Sweden. Available online: www.scb.se (accessed on 3 August 2021).
  21. Aktiv Ortopedteknik. Available online: www.aktivortopedteknik.se (accessed on 15 August 2021).
  22. Sanders, G.D.; Neumann, P.J.; Basu, A.; Brock, D.W.; Feeny, D.; Krahn, M.; Kuntz, K.M.; Meltzer, D.O.; Owens, D.K.; Prosser, L.A.; et al. Recommendations for Conduct, Methodological Practices, and Reporting of Cost-effectiveness Analyses: Second Panel on Cost-Effectiveness in Health and Medicine. JAMA 2016, 316, 1093–1103, Erratum in: JAMA 2016, 316, 1924. [Google Scholar] [CrossRef]
  23. Briggs, A.H.; Wonderling, D.E.; Mooney, C.Z. Pulling cost-effectiveness analysis up by its bootstraps: A non-parametric approach to confidence interval estimation. Health Econ. 1997, 6, 327–340. [Google Scholar] [CrossRef]
  24. Briggs, A.; Fenn, P. Confidence intervals or surfaces? Uncertainty on the cost-effectiveness plane. Health Econ. 1998, 7, 723–740. [Google Scholar] [CrossRef]
  25. Fenwick, E.; O’Brien, B.J.; Briggs, A. Cost-effectiveness acceptability curves--facts, fallacies and frequently asked questions. Health Econ. 2004, 13, 405–415. [Google Scholar] [CrossRef] [Green Version]
  26. Husereau, D.; Drummond, M.; Petrou, S.; Carswell, C.; Moher, D.; Greenberg, D.; Augustovski, F.; Briggs, A.H.; Mauskopf, J.; Loder, E. Consolidated Health Economic Evaluation Reporting Standards (CHEERS) statement. Eur. J. Health Econ. 2013, 14, 367–372. [Google Scholar] [CrossRef] [PubMed] [Green Version]
  27. Jacobs, P.; Fassbender, K. The measurement of indirect costs in the health economics evaluation literature. A review. Int. J. Technol. Assess. Health Care 1998, 14, 799–808. [Google Scholar] [CrossRef] [PubMed]
  28. WMA Declaration of Helsinki 2013—Ethical Principles for Medical Research Involving Human Subjects. Available online: https://www.wma.net/policies-post/wma-declaration-of-helsinki-ethical-principles-for-medical-research-involving-human-subjects/ (accessed on 3 August 2021).
  29. CHCHILD Caregiver Priorities and Child Health Index of Life with Disabilities (CPCHILD©) Questionnaire. Manual and Interpretation Guide. Available online: https://lab.research.sickkids.ca/pscoreprogram/wp-content/uploads/sites/72/2017/09/6573-CPCHILD_manual.pdf (accessed on 26 December 2021).
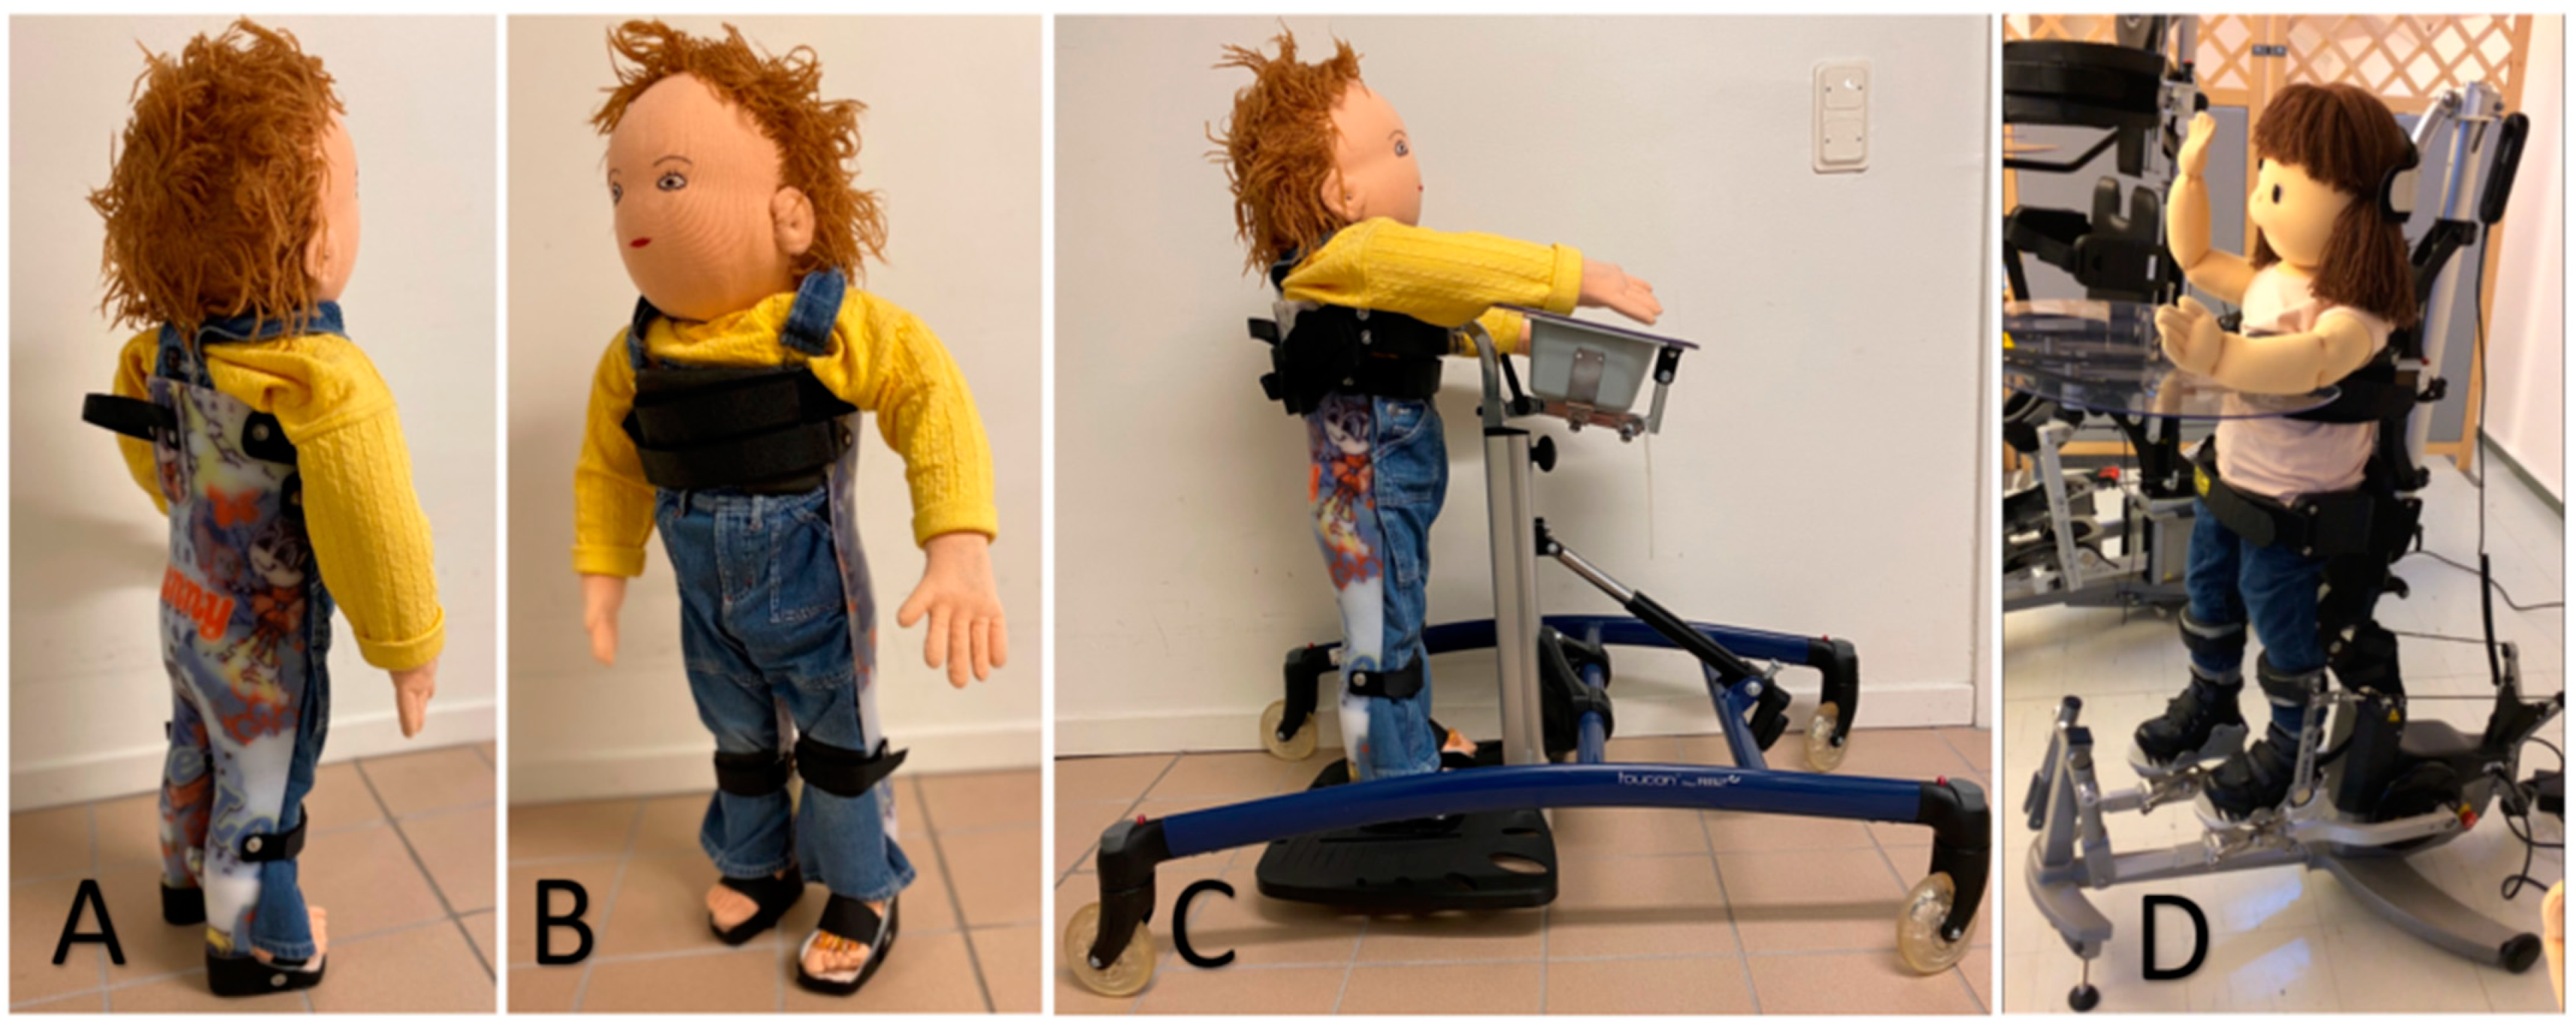
Figure 1. (A,B) Standing shell, (C) static standing a standing shell placed in a stander, (D) dynamic standing in the Innowalk.
Disabilities 02 00006 g001
Figure 2. Differences before and after each exercise training period according to the Caregiver Priorities and Child Health Index of Life with Disabilities (CPCHILD). Static standing (grey boxes) and dynamic standing (white boxes). These boxplots show the change in quality of life after each exercise training period compared with before, and show the results of each domain as well as the total score. The dotted line at 0 represents the original score of quality of life before the period started. Circles = 1st and 3rd quartile + 1.5 interquartile range; Stars = 1st and 3rd quartile + 3 interquartile range.
Disabilities 02 00006 g002
Figure 3. Cost-effectiveness plane (€) from the societal perspective (north-east 94.0%, south-east 0.0%, south-west 0.0%, north-west 6.0%). CPCHILD, Caregiver Priorities and Child Health Index of Life with Disabilities.
Disabilities 02 00006 g003
Figure 4. Cost-Effectiveness Acceptability Curve (CEAC) from the societal perspective. CEAC indicates the probability of the intervention being cost-effective at different willingness-to-pay for one additional outcome. CPCHILD, Caregiver Priorities and Child Health Index of Life with Disabilities.
Disabilities 02 00006 g004
Table 1. Standardized CPCHILD 1 scores of quality of life.
n 2Static Standing
Median [q25th:q75th]
Dynamic Standing
Median [q25th:q75th]
p-Value 3Effect Size 4
Before the exercise training period
 Total Score1947.7 [44.3:57.7]51.3 [45.7:58.6]0.9360.019
 Personal care, activities of daily living1842.0 [31.8:51.9]43.8 [33.3:53.7]0.8440.048
 Positioning, transferring, and mobility1838.9 [25.7:50.3]38.9 [31.9:50.7]0.9650.011
 Comfort and emotions1875.0 [52.0:82.9]73.8 [52.2:86.1]0.6630.106
 Communications and interactions1945.2 [33.3:52.4]40.5 [33.3:54.8]0.5410.144
 Health1960.0 [40.0:73.3]53.3 [46.7:73.3]0.8420.047
 Overall quality of life1860.0 [40.0:60.0]60.0 [40.0:60.0]0.7100.090
After the exercise training period
 Total Score2045.7 [41.2:53.2]57.5 [49.0:65.9]0.0170.548
 Personal care, activities of daily living1842.6 [32.7:55.9]52.5 [39.8:64.5]0.0740.433
 Positioning, transferring, and mobility1931.9 [25.0:48.6]45.8 [33.3:52.8]0.0700.427
 Comfort and emotions1869.8 [50.8:84.1]85.7 [59.9:88.9]0.1990.312
 Communications and interactions2041.7 [33.9:52.4]45.2 [41.2:65.5]0.0070.616
 Health2053.3 [46.7:66.7]60.0 [53.3:73.3]0.0640.426
 Overall quality of life2060.0 [40.0:60.0]60.0 [60.0:60.0]0.1660.318
1 CPCHILD, Caregiver Priorities and Child Health Index of Life with Disabilities. 2 n, number of responses. 3 Between-group comparison analyzed by Wilcoxon-Mann-Whitney. 4 Non-parametric effect size was calculated by η2 = Z2/(n − 1). Z = z-score of the signed ranks in the Wilcoxon-Mann-Whitney test.
Table 2. Mean changes in outcomes over the study period, within and between treatment groups.
Dynamic Standing
Median [q25th:q75th]
Static Standing
Median [q25th:q75th]
Difference
(95% CI 2)
p-Value
(Between-Group Comparison)
Wilcoxon-Mann-Whitney
CPCHILD 1 Score4.70 [−2.14:12.39]−1.17 [−4.96:3.30]5.84
(−1.64 to 13.32)
0.02
Satisfaction1.00 [1.00:3.00]0.05 [−1.20:3.00]1.30 **
(0.31 to 2.29)
0.02
Alertness1.00 [0.00:2.00]0.00 [−1.50:1.00]0.95
(−0.24 to 2.14)
0.08
Fatigability1.5 [0.00:3.50]1.00 [−0.50:1.00]1.45 **
(0.33 to 2.57)
0.03
Ability to focus1.00 [0.00:2.00]0.00 [−0.50:0.50]1.2 **
(0.15 to 2.25)
0.01
Number of pain locations−2.00 [−3.00:−1.00]−0.00 [−1.00:0.00]−1.75 ***
(−2.50 to −1.00)
0.00
Number of doses of medicine−2.00 [−4.00:0.00]0.00 [0.00:0.00]−2.85 ***
(−4.10 to −1.60)
0.00
Bristol Stool Scale 3−1.00 [−2.00:0.00]0.00 [0.00:1.00]−1.05 ***
(−1.64 to −0.46)
0.00
Bowel function: Frequency of bowel elimination *** 0.00
Increased10 (50%)0 (0%)
Unchanged10 (50%)18 (90%)
Reduced0 (0%)2 (10%)
Number of pain locations ** 0.01
Increased0 (0%)2 (10%)
Unchanged14 (70%)18 (90%)
Reduced6 (30%)0 (0%)
Asterisk indicates significant difference in the change over the study period between the treatment groups on 1% (***), and 5% (**) levels. No within-group statistical analysis was conducted for the increased/decreased frequency of bowel function and number of pain locations as this is reported in the original variables in the table (number of pain locations and Bristol Stool Scale). 1 CPCHILD, Caregiver Priorities and Child Health Index of Life with Disabilities. 2 CI, Confidence Interval. 3 The Bristol Stool Scale is a medical aid to classify feces into different groups, where 1–2 indicates constipation, 3–4 an ideal stool, and 5–7 diarrhea and urgency.
Table 3. Incremental Cost-Effectiveness Ratios (ICER) from the societal perspective.
Difference in Cost
(DyS 1 vs. StS 2)
Difference in Outcome
(DyS vs. StS)
ICER
CPCHILD 3 Score2905.8450
Satisfaction2901.30223
Number of pain locations290−1.75166
Stool consistency (Bristol Stool Scale 4)290−1.05267
1 DyS, Dynamic Standing, 2 StS, Static Standing, 3 CPCHILD, Caregiver Priorities and Child Health Index of Life with Disabilities, 4 The Bristol Stool Scale is a medical aid to classify feces into seven different groups, where 1–2 indicates constipation, 3–4 an ideal stool, and 5–7 diarrhea and urgency.
Table 4. Mean cost (€) over the study period, within and between treatment groups, continuous variables.
Dynamic Standing
(SD 1)
Static Standing
(SD)
Difference
(95% CI 2)
p-Value
(Between-Group Comparison)
Wilcoxon-Mann-Whitney
Healthcare costs (perspective) §1190 (45)836 (193)354 ***
(264 to 443)
0.00
Family cost (time)20 (0)84 (21)−64 ***
(−55 to −73)
0.00
Total cost societal perspective1210 (45)921 (212)290 ***
(192 to 388)
0.00
*** indicates significant difference between treatment groups on 1% level. 1 SD, standard deviation, 2 CI, confidence interval. § As adjustment and maintenance is included in the procurement of the dynamic standing equipment in Region Skåne, it is not possible to separate the equipment costs from labor costs. We therefore chose to present the healthcare costs combined for both forms of standing.
Publisher’s Note: MDPI stays neutral with regard to jurisdictional claims in published maps and institutional affiliations.