Abstract
Knitted heaters have attracted significant interest due to their flexibility and ease of integration into smart textile applications. However, uneven heat distribution remains a major challenge, leading to comfort issues and inefficient energy usage. This study presents an analytical, physics-based model that links the resistance, power distribution, and surface temperature of knitted heaters to key design parameters such as size, configuration, material properties, and knitting structure to establish guidelines for achieving a desired temperature rise over a specified surface area. The model was validated experimentally across a range of heaters (3–12 lines) arranged in ladder and diagonal configurations. Results showed good agreement between predictions and measurements for higher line counts (10–12), while larger deviations occurred in smaller heaters (3–5 lines) due to contact resistance and current losses. A prototype knitted wristband demonstrated physiologically relevant heating (>33 °C) under safe, low-voltage operation. These findings provide a quantitative design framework for optimizing knitted heaters and highlight their potential for scalable integration into wearable and therapeutic applications.
1. Introduction
Smart textiles have attracted significant attention owing to their potential applications in textile-based antennas [1], energy harvesting [2], electromagnetic shielding [3], and health monitoring [4]. Integrating smart functionalities into garments leverages inherent textile qualities such as comfort, breathability, stretchability, and washability. Consequently, textiles serve as ideal platforms for active temperature regulation applications. Such textile heaters are particularly beneficial for soldiers or workers operating in cold environments, as well as for medical applications aiming to reduce thermal stress [4] and to improve thermal comfort in general. They are especially useful for rehabilitation therapies, such as treating rheumatic arthritis and alleviating muscle spasms and inflammation [5]. They aid in reducing joint stiffness, enhancing blood circulation, and improving the flexibility of collagen tissues, all contributing to pain relief through the therapeutic application of heat. They can also be applied to body joints to promote the effective functioning of bodily components and alleviate discomfort in muscles and joints [6]. Even during surgery, textile-based heaters can be used for an anesthetized patient who can experience significant heat loss during surgery [7]. Furthermore, smart heating insoles and socks such as electrical heating pads can be used to improve the thermal comfort of occupational workers in cold environments [8].
The performance of electrical heating textiles relies predominantly on the type of conductive material used in the structure. As conductive materials, metallic wires are commonly used. Hamdani et al. investigated stainless steel as a heater material and concluded that the temperature distribution is primarily concentrated within the central parts of the heater, resulting in non-uniform heat distribution [9]. Yanyan et al. studied the thermal performance of fine copper wire integrated into interlining fabric. They concluded that the breaking strength and elongation at the break of the copper wires remain relatively unaffected by aging time and temperature, displaying favorable thermo-mechanical properties. However, despite these mechanical advantages, metallic wires present several drawbacks when integrated into textiles, primarily due to their reduced flexibility, increasing rigidity, and hindered moisture extraction [10].
Given the limitations of traditional metallic wires, researchers have explored a variety of alternative conductive materials to enhance heater performance using metallic nanomaterials, intrinsic conductive polymers (ICPs), grapheme, and carbon nanotubes (CNTs). Metallic nanoparticles coated onto the textile can achieve stable heating performance with high surface temperatures at very low electrical potential [11]. However, toxicity and durability restrict wearable applications. Intrinsic conductive polymers (ICPs) can show superior flexibility, light weight, and good conductivity, but they are inferior in long-term stability. Many researchers have explored the impregnation of materials with CNTs and graphene, which have demonstrated excellent heating performance. However, comprehensive reviews on graphene-enhanced textiles and graphene fibers indicate performance advantages (conductivity, flexibility) but also note scale-up and cost barriers for mass production—a key reason most graphene/CNT heater studies remain at lab scale [12,13]. Apart from the mentioned conductive materials, it is possible to produce heaters from commercially available conductive yarns to overcome the challenges. These yarns are well suited for mass production using existing knitting machinery [14].
While material choice is fundamental, the manufacturing technique also plays a critical role in heater performance, particularly how the conductive yarns are integrated into textile structures. Common approaches include weaving, knitting, and nonwoven fabrication [15]. Different textile fabrication techniques, such as weaving, knitting, and non-woven production, each present specific trade-offs: woven fabrics offer dimensional stability but may limit stretchability, whereas non-woven structures can pose challenges for uniform integration of conductive elements [5]. Knitted structures, in contrast, offer stretchability, breathability, and close body fit. Knitting also allows tuning of electrical properties through changes in loop density, knit pattern, and yarn configuration. Maurya et al. compared rib, interlock, and plain knit structures with varying knitting densities and concluded that rib knit samples with a compact structure and a short loop length showed good heating performance [16]. A study by Hamdani et al., on the other hand, concluded that the interlock structure is particularly favored for heating fabrics, primarily due to its stability. Moreover, it has been observed that the interlock structure can achieve a higher temperature compared to the plain structure when subjected to the same voltage. Additionally, the interlock structure reaches its steady-state temperature in less time when compared to the plain knitted structure [9]. Liu et al. (2015) investigated plain, rib, and interlock knit fabrics produced from silver-plated yarn and polyester staple yarn and reported that the fabrics’ maximum equilibrium temperature increases proportionally with their power consumption density [17]. Six different knit structures were studied by Kexia et al. [18]. They concluded that the temperature of knitted structures increased proportional to the square of the applied voltage and from their results the maximum surface temperature at 2.4 V increases from the plain knit to rib to interlock structure.
In the studies so far, only relatively small-area heaters have been used. Despite these advances, most studies focus on small heating areas and do not fully address current losses in large wearable heaters. However, for medical applications, there is a need to apply textile heaters to larger areas of the body—such as 50 × 200 mm—while maintaining close contact with the skin. This need for larger, flexible heaters underlines a gap in current research, which our study aims to address. Knitting is the preferred technique. One possible challenge is the occurrence of current losses along the heater length. Adding extra heater lines can lead to uneven heating, with lower temperatures appearing farther away from the power source. In this study, we demonstrate that the performance of textile-based heaters at a given voltage is primarily governed by the electrical resistance of the heater lines, with yarn and knitting parameters playing a more indirect role. Based on our findings, we propose practical guidelines for optimizing knitted heater designs. Our results indicate that heating performance can be effectively tuned by controlling the heater’s resistance, which, in turn, can be adjusted through specific knitting parameters and layout configurations.
2. Theory
In the literature reviewed above, conflicting conclusions have been reported regarding heater performance. Maurya [16] found that rib structures outperform interlock and plain knits, Hamdani reported that interlock yields higher peak temperatures and Sun observed the performance order as interlock > rib > plain knit [9]. Such inconsistencies make it difficult for designers and researchers to make informed decisions when selecting heater designs.
From a heat transfer standpoint, however, the governing principles are relatively straightforward. The maximum attainable temperature is determined predominantly by the balance between the applied electrical power and the heat losses to the environment, rather than by the knit structure itself. The heating rate is governed by the ratio of the fabric’s thermal mass (i.e., thickness and density) to the heat transfer coefficient. The main influence of knitting parameters arises through their effect on the electrical resistance of the knitted elements. Heater lines with different knitting structure and yarn conductivity but with the same resistance are expected to exhibit essentially equivalent thermal performance.
The objective of this section is to develop a simplified model that addresses these considerations and provides design guidelines for heaters capable of achieving a specified temperature rise over a defined surface area. The core of the model is to connect the three key aspects of heater design using physical equations. This is accomplished by first deriving the equivalent electrical resistance of the different knitted arrangements, then determining the current and power distribution across the heater lines and lead wires, and finally formulating the resulting surface temperature rise driven by power input and moderated by heat loss. This framework supports the rational design of heaters optimized for performance, safety, and comfort.
A rectangular area can be covered with heater lines using three fundamental configurations.
- A serpentine (zigzag) pattern (Figure 1a), where the heater line meanders across the surface;
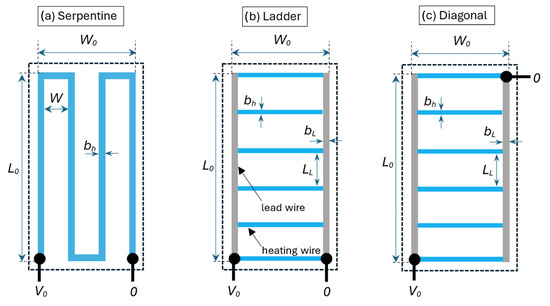 Figure 1. Layout and geometrical parameters of a serpentine (a), ladder (b), and diagonal (c) configuration. The power is applied via the connection points, indicated as black circles.
 - A ladder configuration (Figure 1b), in which two parallel electrode lines distribute power to interconnecting heater wires with higher resistance that dissipate energy;
- A diagonal configuration (Figure 1c), similar to the ladder setup but arranged diagonally.
The ladder configuration is the simplest and most straightforward. However, if the equivalent heater resistance Req is too high, it can present challenges. Since the heater is designed for applications near human skin, the operating voltage should remain below 50 V to prevent skin irritation [19]. To ensure safety, we limit the maximum voltage to 12 V and the current to approximately 500 mA, allowing for a maximum power output of 6 Watt with a resistance of 24 Ω.
As shown in the experimental section, knitted heater lines typically have resistances exceeding 1 Ω/cm. For example, a heater measuring 15 cm in length and 5 cm in width, arranged in a serpentine pattern with four lines, would have a resistance of approximately 65 Ω. Such a setup would generate only 2.2 Watt, which may be insufficient for adequate heating. To address this, low-resistance lead wires or electrode lines are used to distribute the power to a series of parallel higher-resistance heating elements (Figure 1b,c). The ladder configuration benefits from power connection points placed in proximity but suffers from heat loss in wires positioned farther from the power source. In contrast, the diagonal configuration distributes power more evenly across the surface, mitigating this issue.
The equivalent resistance of the serpentine configuration is given as (see Figure 1a)
in which is the resistance per unit length of the heater wire and n denotes the number of longitudinal heater lines. For ideal lead wires with zero resistance, the equivalent resistances of both the ladder and diagonal configuration would be given as , in which Rh denotes the heating wire resistance. In practice, the lead wire segments between the heating wires have a small but finite resistance. As demonstrated by Jansen [20], the expression for the equivalent resistances of the ladder configurations can then be written as
and for the diagonal configuration as
where ε is the ratio between twice the lead wire resistance, RL, and the heater resistance Rh. With these expressions we can immediately estimate the overall resistance and thus the total power that can be generated by the heaters.
As mentioned before, this power is not evenly distributed over the heater surface, so, as a next step we would like to calculate the local power p in the heater wires and lead wire parts. For this, we need the local currents i:
where subscripts h and L stand for the heater and lead wire, respectively. By using the finite difference method, Jansen [20] derived the following closed-form expressions for the current distributions in ladder resistor networks.
whereas for the diagonal configuration, they are given as
Here k is the heater wire index, ranging from 1 close to the power source to n at the far end. All these equations depend on three parameters: the heater and lead wire segment resistances Rh and RL (expressed as the resistance ratio ε) and the number of heater lines n. The resistances can be manipulated by, e.g., changing the line width or length, the knit structure, or choosing a yarn with different conductivity. For the present study, we focus on the geometrical parameters and use the following relation for the resistance of a knitted or embroidered conductive line with length L and width W:
Here, CR is the knit structure resistivity that depends on the resistivity of the conductive yarn, as well as the knitting structure and stitch density. This constant can be determined experimentally by measuring the resistance of several knitted lines with varying dimensions. Alternatively, it can be estimated through numerical simulations of the knit structure. Note that in practice, it may be more effective to express length and width in terms of the number of course and wale stitches rather than using standard length measurements.
When a knitted surface is heated, its temperature increases in proportion to the applied heating power until the generated Joule heat balances the heat loss to the environment. As demonstrated by Zhang et al. [21], this behavior can be modeled using a simple exponential relationship
where T0 is the initial temperature and ph is the local heating power, h the heat transfer coefficient and A the surface area. The parameter τ is a time constant that depends on the density , heat capacity , and thickness d of the knit structure. In the current paper, we focus on the steady-state temperature rise and rewrite this as
where CH = 1/hA is a coefficient that can be determined experimentally.
3. Materials and Methods
Knitted heaters were fabricated using a combination of knitting and stitching, as illustrated in Figure 2. Initially, double-jersey knit samples were produced with varying numbers of heater lines: 2, 3, 5, 10, and 12. The heater lines were formed using silver-plated nylon yarns integrated into the double-jersey base structure, primarily made from cotton. Double jersey was selected to allow the heating yarns to be situated on a single surface of the fabric and to have the back side as an insulation layer. The heaters were produced with an NP11 setting for the knitting density. The fabric structure had a total width of 100 rows, of which 70 rows were for the heater lines. For the heating elements, Shieldex® 235/36 dtex Z 130 HC + B yarn (Statex Produktions- und Vertriebs GmbH, Bremen, Germany) was selected due to its relatively high resistivity of approximately 768 Ω/m. Lead wires were fabricated using Shieldex® 235/36 dtex 2-ply HC + B yarn, chosen for its lower resistivity of 50 Ω/m. Modern industrial knitting machines like the Stoll ADF series can produce high-resistivity heater lines and the perpendicular low-resistivity lead wires in a single process. The Stoll CMS 530 flatbed weft knitting machine (Karl Mayer Stoll GmbH & Co., Reutlingen, Germany) used in this study, however, can knit conductive yarns only horizontally in the course direction and lacks independent yarn carrier movement in both directions. Therefore, for the samples used to validate the theoretical section, heater lines were knitted first, and vertical lead wires were subsequently added via embroidery.
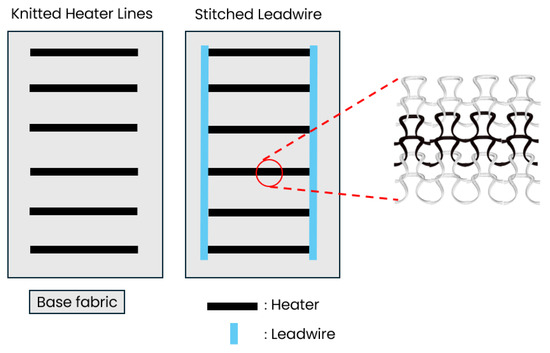
Figure 2.
Production process of knitted heaters starting with initial knitting followed by stitching of the lead wires.
Two different yarns were used for stitching: a non-conductive yarn positioned on the back and a conductive yarn placed at the desired location on the front. To ensure proper production of the embroidered conductive lead wire on the knitted heater, a layer of Stitch & Tear® (Weinheim, Germany), a stabilizing backing material, was added to support and stabilize the embroidery process. This layer was removed after stitching.
The resistance measurements were carried out using a FLUKE 110 digital multimeter (Everett, WA, USA). The power for the heating tests was supplied by a N6705B DC power analyzer from Agilent Technologies (Santa Clara, CA, USA), and the temperatures were measured using a FLIR E60 thermal camera (Wilsonville, OR, USA) mounted on a tripod. All thermal images were analyzed with Thermal FLIR software (product version: 2.0.37). The knitted samples were clamped onto a frame and placed in free air, as shown in Figure 3. The thermal camera consistently recorded the highest temperature within the selected region of interest. For the thermal images’ validation, the average temperature of each heater line was determined by drawing a line across each heating element and average temperature using the FLIR Thermal Studio program (product version: 2.0.37).
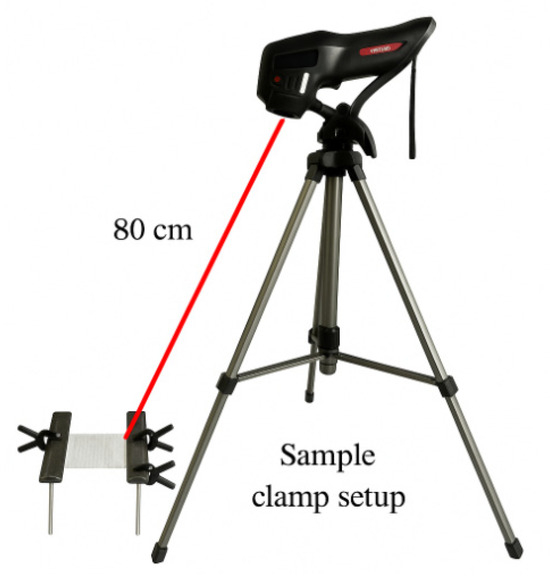
Figure 3.
Experimental setup for thermal imaging measurements. A FLIR infrared camera is mounted on a tripod at a fixed distance of 80 cm from the sample, which is secured using a custom clamp to ensure stability during imaging.
4. Results
4.1. Heater Line Knit Structures
To determine the resistance parameter of Equation (8), samples were knitted with the Shieldex 235/36 dtex-1 ply yarn containing conductive lines with 2, 3, 5, 10, and 12 courses width and 100 wale stitches long. Optical images are shown in Figure 4. As the number of courses increases, the coverage of conductive yarn within the fabric becomes noticeably denser reducing the visible gaps between loops. At two and three courses, the conductive yarn is sparsely visible, with significant gaps between loops. With five courses, the structure becomes more uniform. A close-up image of the different courses is shown in Figure 5. It also demonstrates that the double-jersey structure, with its different front and back sides, helps produce insulated textile heaters. The stitch densities in the course and wale directions were calculated as 4.72 courses/cm and 10 wales/cm, respectively (see Supplementary Materials Figure S2).
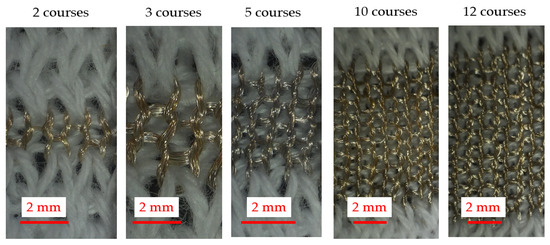
Figure 4.
Optical images of knitted heaters of various lined heaters.
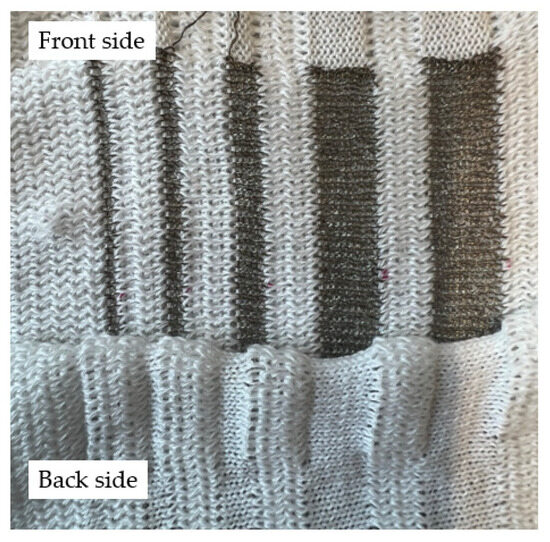
Figure 5.
Heater lines with 12, 10, 5, 3, and 2 courses at the front side (upper part) and the insulated back side (lower part).
4.2. Equivalent Resistances of Knitted Heaters
The overall heater resistances predicted by Equations (2) and (3) are compared with the measured values in Figure 6. The comparison reveals that the equivalent resistance decreases as the number of heater lines increases. In both graphs, the measured values closely follow the calculated values, indicating that the theoretical or modeled calculations align well with the experimental measurements. The largest drop in resistance occurs between one and three heater lines, and the curves tend to flatten as the number of lines in-creases, suggesting diminishing changes in Req for higher numbers of heater lines. The similarity of the deviations observed in both configurations indicates that the model captures the physical behavior of the system, while opportunities for refinement remain.
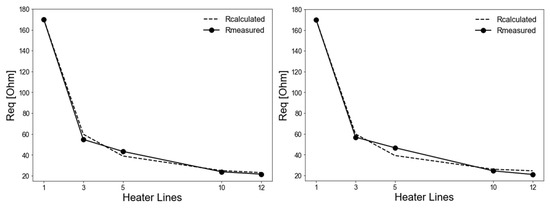
Figure 6.
Equivalent resistances of knitted heaters with 3 to 12 lines in ladder (left) and diagonal (right) configurations. The plotted values show both the predicted (calculated from Equations (2) and (3)) and measured resistances.
4.3. Resistance Characterization of the Heater Lines
For the L/W (length to width ratio), the ratio of the number of courses to wales was used instead of the actual measured length and width. Figure 7 shows the relationship between resistance (in Ω) and the L/W ratio for a knitted heater, with multiple data series represented by different colors. The lines show a linear trend, as expected, and the overall slope CR is determined from a fit through all data points and is calculated to be 2.78 ± 0.07 Ω.
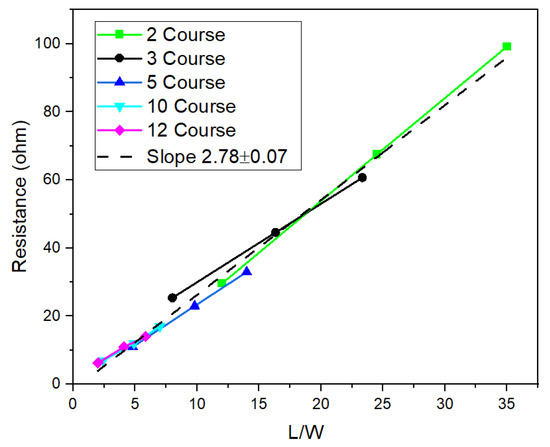
Figure 7.
Resistance versus L/W for heaters with 2, 3, 5, 10, and 12 courses.
The temperature change (∆T) versus power (P) graph is shown in Figure 8. All curves exhibit a linear trend, indicating that ∆T is proportional to the applied power. The slopes of the lines for the 3, 5, 10, and 12 course lines are, respectively, 20.95, 23.98, 27.70, and 26 °C/Watt. The corresponding mean absolute error (MAE) and root mean square error (RMSE) values are low across all configurations, indicating that the linear model accurately represents the measured data (see Supplementary Materials Figure S1). The results of the two-course sample deviate significantly from this trend. To verify this deviation, two additional measurements were performed, resulting in an average slope for the two lines of 45.96 ± 1.28 °C /Watt (see Supplementary Materials Figure S3). The resistance coefficient Cl for the 0.2 cm wide lead wires was determined to be 0.67 ± 0.03 Ω by plotting the resistance of lead wires versus L/W (see Supplementary Materials Figure S4).
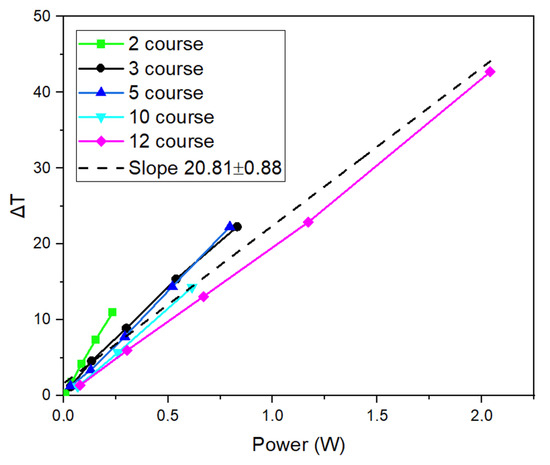
Figure 8.
Temperature change versus power graph of different heater lines.
4.4. Validation of Measured and Predicted Temperature Profiles
In this section, we evaluate the performance of heaters composed of multiple heater lines of a width of two courses, connected by stitched lead wires of 0.2 cm width. Thermal images of samples with 3, 5, 10, and 12 heater lines arranged in a ladder configuration are shown in Figure 9. Across all configurations, the heaters exhibit a clear decrease in heating power for heater lines further away from the power source and this effect becomes more pronounced as the number of heater lines increases. The three-heater sample has a maximum temperature at the left line of 33.9 °C and 25.1 °C for the last heater line. The five-line sample recorded a peak temperature of 39.8 °C, with the first and last heater lines measuring 25.4 °C and 37.4 °C, respectively. The sample with 10 heaters shows a more substantial heat output, reaching a maximum temperature of 59.2 °C. The 12-course configuration demonstrates a rather large temperature non-uniformity. The maximum temperature (79.6 °C) is in the lead wires near the power source and the heating wires at the end of the sample are hardly increasing in temperature. Thermal images of the heaters in diagonal configurations are provided in Supplementary Materials Figure S5. They show a more uniform temperature distribution from left to right heater line but also and increased thermal dissipation in the lead wire elements near the power source connections.
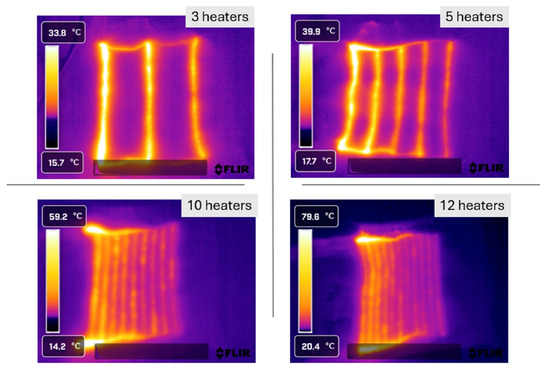
Figure 9.
Different heater samples and their thermal images. The power is applied at the two left corners (ladder configuration).
The measured temperature differences along the heater lines in the ladder configurations are compared with predictions from Equations (5) and (6), as shown in Figure 10. For the predictions, we used the previously determined heat transfer coefficient of 45.96 ± 1.28 C/Watt and resistance coefficients of 2.78 ± 0.07 Ω and 0.67 ± 0.03 Ω for the heater line and the lead wires, respectively. For ladder configurations, the model predictions capture the general trend of decreasing temperature with increasing distance from the power source, although they exhibit an overprediction that becomes more pronounced in heaters with fewer lines. This overprediction is most pronounced for the three-line heater ranging 2 to 6 °C. For the 5-, 10-, and 12-line heaters, this gap is smaller, ranging from approximately 0.4 to 2 °C. The overall trend shows that prediction accuracy improves as the number of heater lines increase. Also, the three- and five-line heater configurations exhibit a more rapid temperature drop along the heater lines compared to the 10- and 12-line configurations.
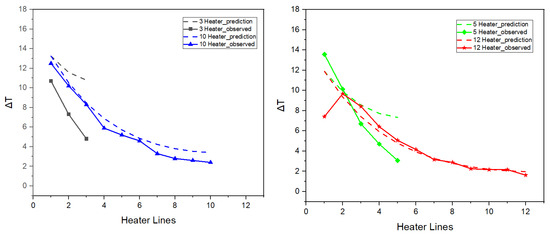
Figure 10.
The observed (full lines with symbols) and calculated (Equations (5) and (6), dashed lines) temperatures for knitted heaters in ladder configuration with 3 and 10 heater lines (left) and 5 and 12 heater lines (right).
Figure 11 shows the corresponding results for the diagonal configuration. Unlike the ladder configuration, both the predicted and observed values display a non-monotonic trend, with a minimum temperature in the middle. For the three- and five-line heater configurations the observed and predicted values diverge more significantly, ranging approximately from 3.5 to 5 °C and from 3.6 to 5.3 °C, respectively. In contrast, the 10- and 12-heater configurations exhibit a smoother, more consistent temperature profile and better agreement between predicted and observed temperatures (within ~1 to 2 °C).
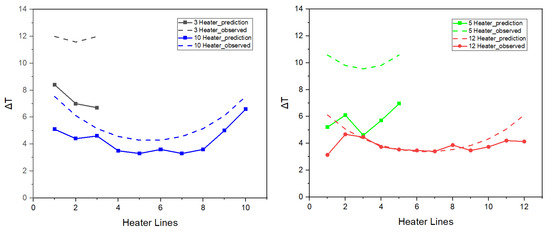
Figure 11.
The observed (full lines with symbols) and calculated (Equations (5) and (7), dashed lines) temperatures for knitted heaters in diagonal configuration with 3 and 10 heater lines (left) and 5 and 12 heater lines (right).
The average absolute deviations between predicted and measured ΔT for both ladder and diagonal configurations are illustrated in Figure 12. In both configurations, the largest differences are observed for the samples with three and five heater lines, while the predictions and measurements show much closer agreement for higher heater line counts (10 and 12 samples).
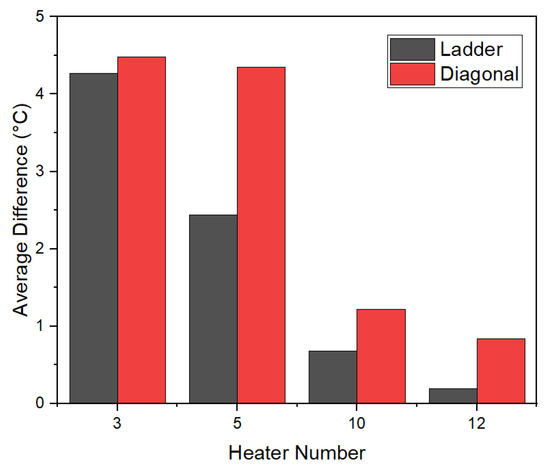
Figure 12.
Average difference between predicted and observed data versus heaters with different courses.
5. Discussion
We analyzed the thermal performance of a knitted heater composed of a chosen number of parallel heater lines interconnected by two lead wire lines. The thermal performance model consists of three verifiable components.
- Prediction of the equivalent resistance of a heater consisting of several heater lines and two interconnecting lead wires;
- Prediction of the resistance and heating capacity of knitted conductive lines of a given length and widths;
- Prediction of the temperature variations across the heater lines based on the current distribution for a given overall power input.
In our experimental series, the total heater length was kept constant, while the number of heater lines was varied from three to twelve. Consequently, the lengths of the lead wire segments differed, resulting in resistance ratio parameters ranging from ε = 0.023 to ε = 0.006. As shown in Figure 6, the close agreement between predictions and measurements indicate that these effects are well captured by the model, allowing accurate prediction of the overall heater resistance.
The assumption that the resistance of a knitted line increases linearly with the line length and decreases linearly with its width (Equation (8)) is confirmed by the results as shown in Figure 7. The proportionality constant in this study was determined to be 2.78 ± 0.07 Ω. A knitted line 100 wales long and two courses wide will thus have a resistance of about 115 Ω. In general, the resistance parameter depends on the stitch type, knitting parameters, and the resistivity and type of conductive yarn used. In Table 1, resistivity values for other conductive yarns and knit structures are listed. The resistivity values vary depending on both the knit structure and the conductive yarn type. Double-jersey structures exhibit lower resistivity than single-jersey samples due to their denser configuration which enhances electrical pathways. Similarly, resistivity tends to decrease with increasing course and wale numbers, indicating the effect of higher stitch density on conductivity. These results indicate that the majority of line resistivity values fall within the range of CR = 2 to 6.

Table 1.
Resistivity values of different conductive yarn types and knit structures.
In addition, we evaluated the heat generated by applying a voltage to the various knitted lines. As expected, our measurements confirmed a linear relationship between the temperature rise and the applied power, as shown in Figure 9. Contrary to our expectations, however, the heater line performance showed a clear dependence on the line width. Lines two courses wide have a much higher proportionality constant compared to those with three or more courses (Figure 13). For widths between 3 and 12 courses, a consistent but much slower decrease is observed. The deviation of the two course structures can probably be attributed to the much looser knit structure (Figure 4, left picture). The slower overall decrease can be explained by the surface effect. Broader lines have larger surface area and thus an increasing heat loss to the surroundings.
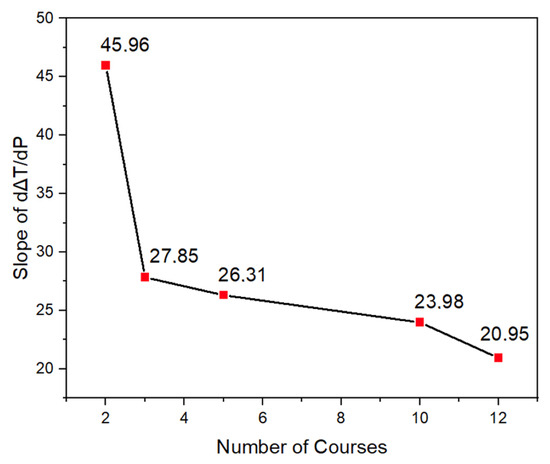
Figure 13.
Effect of line width on generated temperature increase per unit of applied power.
As explained in the introduction, lead wires with non-zero resistance cause progressively lower currents in subsequent heater lines. In the present examples, the lead wire resistance is substantial (0.67 Ω cm−1), leading to significant voltage drops and corresponding reductions in current. As shown in Figure 8, these effects manifest as poor heating performance at locations distant from the power input points. While such pronounced non-uniformities in heating should be avoided in practical applications, they are valuable here for validating the proposed model.
Our measurements show that, for heaters with a larger number of heater lines (10 and 12), the predicted temperature distributions agree with the experimental data within 1–2 °C. In contrast, heaters with only three or five heater lines exhibited much larger deviations, up to 5 °C. These unexpectedly large discrepancies cannot be attributed to inaccuracies in the resistance and current distribution predictions (Equations (2)–(7)), as these are exact and in full agreement with simulations [22]. It is also unlikely that the deviations result from errors in the determined heat transfer parameter CH, since the thermal boundary conditions of a heater line in a three- or five-line heater are comparable to those in a heater with 10 or 12 lines. We therefore attribute the discrepancies to variations in the contact resistance between the lead wire and the heater line in heaters with fewer lines. Such variations may occur when the stitched lead wires do not fully cover the ends of the heating wires.
Lateral conduction in the 10–12-line heaters naturally equalizes temperature variations, whereas heaters with only 3–5 lines lack sufficient lateral conduction, making them more sensitive to local contact resistance. Limited lateral conduction makes the heater more sensitive to local variations, such as contact resistance, temperature drops, or localized hotspots near the lead wires.
The heatmaps illustrate the impact of heater arrangement and quantity on relative error as shown in Figure 14. Increasing the number of heaters generally lowers the relative error in both ladder and diagonal configurations. In the ladder configuration, the darker red colors for the three- and the five-line heaters indicate overprediction of the temperature, while in the diagonal configuration, the darker blue colors correspond to an underprediction of temperature. In the ladder configuration, relative errors tend to decrease as the number of heaters increases, particularly noticeable for 10 and 12 heaters. These results highlight the importance of heater arrangement and quantity in controlling system precision and suggest that design optimization should consider both factors to minimize relative error.
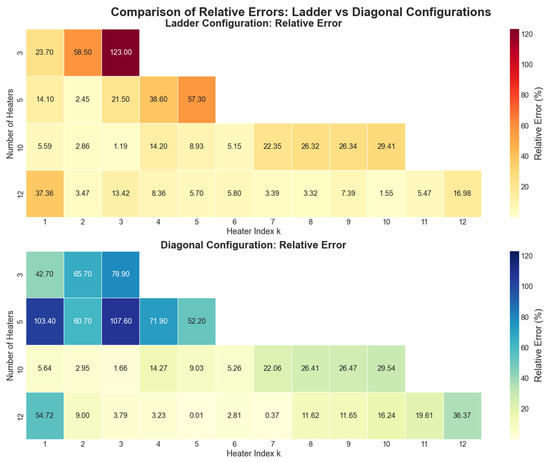
Figure 14.
Comparison of relative errors (%) for ladder and diagonal heater configurations with a different number of heater lines. The heater index k corresponds to the heater line numbering defined in Equation (6).
A knitted heater with 10 lines, each courses wide, is integrated into a wearable wristband configuration. As shown in the thermal image (Figure 15), the heater rapidly reaches surface temperatures above 33 °C demonstrating active heating while conforming comfortably to the shape of the hand. It is worth noting that, in practical applications requiring heating over larger surface areas, heaters typically incorporate between 10 and 30 heater lines. Consequently, our finding that the model accurately predicts performance for heaters with a larger number of heater lines supports its applicability for the design of large-area, textile-based heaters. Surface temperatures around 33 °C are considered physiologically supportive, for example, in wound healing, as identified by Lugoda et al. in their wearable textile thermograph study [22]. The heater highlights its potential for integration into smart textiles and personal thermal therapy.
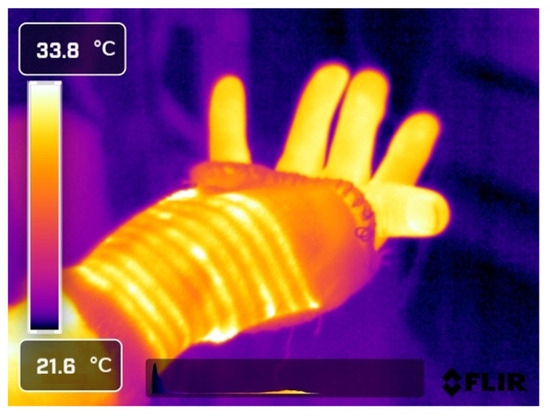
Figure 15.
Thermal image of a wearable wristband with 10 heater lines, each 2 stitches wide, showing the conformability to the body shape.
6. Conclusions
This study discusses the design space of fully textile-based and stretchable knitted heaters. Heated garments may incorporate multiple heating units, each supplied independently. Using a conservative operating limit of 12 V and 500 mA per unit provides a maximum power output of 6 W and an associated target resistance of approximately 24 Ω per heater. We derived a simple model that (1) relates the heater line resistance to the heater layout, knit line structure, geometry, and conductive yarn resistance, (2) relates the heater layout to heater line currents, and (3) relates the heater line currents to the steady-state temperature. Experimental results confirmed the predictive accuracy of the model, particularly for heaters with higher line counts (≥10), which closely matched theoretical expectations. Remaining discrepancies suggest that lead wire resistance and contact resistance variations are critical factors that need to be further optimized. Overall, the findings provide practical design guidelines for integrating low-voltage knitted heaters into wearable applications, with strong potential for scalable manufacturing using existing textile technologies. This study was the demonstration and characterization of the heated prototype, without conducting user trials to assess thermal comfort or safety under real-world conditions. Future work will focus on performing actual wearing tests to evaluate these aspects and validate the practical performance of the developed system.
Supplementary Materials
The following supporting information can be downloaded at: https://www.mdpi.com/article/10.3390/thermo5040054/s1, Figure S1: Relationship between power input and ΔT for a knitted heater. Blue markers indicate measured data; red dashed line shows the linear fit through the origin. Fitted slope (°C/W), MAE, RMSE, and Max error are shown in the inset box; Figure S2: Stitch number versus length (cm) in course (left) and wale (right) directions of knitted heaters; Figure S3: Temperature change versus power graph of 2-line heater; Figure S4: Resistance versus L/W graph for 0.2 cm width lead wire; Figure S5: The thermal images of diagonal heaters of 3, 5, 10 and 12 heaters.
Author Contributions
Conceptualization, S.G. and K.M.B.J.; methodology, B.B.; validation, B.B., S.G. and K.M.B.J.; writing—original draft preparation, B.B.; writing—review and editing, S.G. and K.M.B.J.; visualization, B.B.; supervision, S.G. and K.M.B.J. All authors have read and agreed to the published version of the manuscript.
Funding
Beyza Bozali is supported by the Turkish Ministry of National Education for her PhD studies.
Informed Consent Statement
Not applicable.
Data Availability Statement
The original contributions presented in this study are included in the article. Further inquiries can be directed to the corresponding author.
Conflicts of Interest
The authors declare no conflicts of interest.
Abbreviations
The following abbreviations are used in this manuscript:
| ICPs | Intrinsic conductive polymers |
| CNTs | Carbon nanotubes |
| Req | Equivalent resistance |
| Rh | Heater resistance |
| ε | Resistance ratio |
| n | Number of heater lines |
| T0 | Initial temperature |
| ph | Heating power |
| CR | Resistivity constant |
| CH | Heat capacity |
| L/W | Length-to-width ratio |
| ∆T | Temperature change |
References
- Asha Banu, S.M.; Meena Alias Jeyanthi, K. Textile based antenna design for breast cancer detection. Mater. Today Proc. 2022, 62, 4814–4820. [Google Scholar] [CrossRef]
- White, P.; Bavykin, D.; Moshrefi-Torbati, M.; Beeby, S. The Energy Harvesting Performance of a Flexible Triboelectric-Based Electrospun PTFE/PVDF Fibre. Eng. Proc. 2023, 30, 8. [Google Scholar]
- Verma, S.; Dhangar, M.; Paul, S.; Chaturvedi, K.; Khan, M.A.; Srivastava, A.K. Recent Advances for Fabricating Smart Electromagnetic Interference Shielding Textile: A Comprehensive Review. Electron. Mater. Lett. 2022, 18, 331–344. [Google Scholar] [CrossRef]
- Hatamie, A.; Angizi, S.; Kumar, S.; Pandey, C.M.; Simchi, A.; Willander, M.; Malhotra, B.D. Review—Textile Based Chemical and Physical Sensors for Healthcare Monitoring. J. Electrochem. Soc. 2020, 167, 037546. [Google Scholar] [CrossRef]
- Stoppa, M.; Chiolerio, A. Wearable electronics and smart textiles: A critical review. Sensors 2014, 14, 11957–11992. [Google Scholar] [CrossRef] [PubMed]
- Cochrane, C.; Hertleer, C.; Schwarz-Pfeiffer, A. Smart textiles in health. In Smart Textiles and Their Applications; Woodhead Publishing: Cambridge, UK, 2016; pp. 9–32. [Google Scholar]
- Möhring, U.; Schwabe, D.; Hanus, S. Textiles for patient heat preservation during operations. In Handbook of Medical Textiles; Woodhead Publishing: Cambridge, UK, 2011; pp. 434–442. [Google Scholar]
- Chen, Z.; Li, J.; Song, W.; Lu, Y.; Cao, B. Smart Wireless Charging Heating Insoles: Improving Body Thermal Comfort of Young Males in an Extremely Cold Environment. Cloth. Text. Res. J. 2020, 40, 220–234. [Google Scholar] [CrossRef]
- Hamdani, S.T.A.; Fernando, A.; Maqsood, M. Thermo-mechanical behavior of stainless steel knitted structures. Heat Mass Transf. 2015, 52, 1861–1870. [Google Scholar] [CrossRef]
- Bai, Y.; Li, H.; Gan, S.; Li, Y.; Liu, H.; Chen, L. Flexible heating fabrics with temperature perception based on fine copper wire and fusible interlining fabrics. Measurement 2018, 122, 192–200. [Google Scholar] [CrossRef]
- Cai, L.; Song, A.Y.; Wu, P.; Hsu, P.C.; Peng, Y.; Chen, J.; Liu, C.; Catrysse, P.B.; Liu, Y.; Yang, A.; et al. Warming up human body by nanoporous metallized polyethylene textile. Nat. Commun. 2017, 8, 496. [Google Scholar] [CrossRef] [PubMed]
- Park, H.K.; Kim, S.M.; Lee, J.S.; Park, J.-H.; Hong, Y.-K.; Hong, C.H.; Kim, K.K. Flexible plane heater: Graphite and carbon nanotube hybrid nanocomposite. Synth. Met. 2015, 203, 127–134. [Google Scholar] [CrossRef]
- Aznar, P.R.D.; Junior, H.L.O. Advances and Applications of Graphene-Enhanced Textiles: A 10-Year Review of Functionalization Strategies and Smart Fabric Technologies. Textiles 2025, 5, 28. [Google Scholar] [CrossRef]
- Thilagavathi, G.; Muthukumar, N.; Kannaian, T. Development and Characterization of Electric Heating Fabric Based on Silver Coated Nylon Yarn. J. Text. Eng. Fash. Technol. 2017, 1, 224–226. [Google Scholar] [CrossRef]
- Tseghai, G.B.; Malengier, B.; Fante, K.A.; Nigusse, A.B.; Van Langenhove, L. Integration of Conductive Materials with Textile Structures, an Overview. Sensors 2020, 20, 6910. [Google Scholar] [CrossRef] [PubMed]
- Maurya, S.K.; Das, A.; Kumar, B. Optimization of Heating Performance of the Rib-Knitted Wearable Heating Pad. In Proceedings of the E-Textiles 2022, Nottingham, UK, 8–10 November 2022. [Google Scholar]
- Liu, H.; Li, J.; Chen, L.; Liu, L.; Li, Y.; Li, X.; Li, X.; Yang, H. Thermal-electronic behaviors investigation of knitted heating fabrics based on silver plating compound yarns. Text. Res. J. 2015, 86, 1398–1412. [Google Scholar] [CrossRef]
- Kexia, S.; Liu, S.; Hairu, L. Structural Parameters Affecting Electrothermal Properties of Woolen Knitted Fabrics Integrated with Silver-Coated Yarns. Polymers 2019, 11, 1709. [Google Scholar] [CrossRef] [PubMed]
- NFPA. NFPA 70E: Standard for Electrical Safety in the Workplace; NFPA: Quincy, MA, USA, 2004. [Google Scholar]
- Jansen, K.M.B. Closed-Form Solutions for Current Distribution in Ladder-Type Textile Heaters. Thermo 2024, 4, 433–444. [Google Scholar] [CrossRef]
- Zhang, L.; Baima, M.; Andrew, T.L. Transforming Commercial Textiles and Threads into Sewable and Weavable Electric Heaters. ACS Appl. Mater. Interfaces 2017, 9, 32299–32307. [Google Scholar] [CrossRef] [PubMed]
- Lugoda, P.; Hughes-Riley, T.; Morris, R.; Dias, T. A Wearable Textile Thermograph. Sensors 2018, 18, 2369. [Google Scholar] [CrossRef] [PubMed]


Disclaimer/Publisher’s Note: The statements, opinions and data contained in all publications are solely those of the individual author(s) and contributor(s) and not of MDPI and/or the editor(s). MDPI and/or the editor(s) disclaim responsibility for any injury to people or property resulting from any ideas, methods, instructions or products referred to in the content. |
© 2025 by the authors. Licensee MDPI, Basel, Switzerland. This article is an open access article distributed under the terms and conditions of the Creative Commons Attribution (CC BY) license (https://creativecommons.org/licenses/by/4.0/).