Article

Integrating Life Cycle Assessment and Response Surface Methodology for Optimizing Carbon Reduction in Coal-to-Synthetic Natural Gas Process

1
Department of Civil Engineering, Design School, Xi’an Jiaotong-Liverpool University, Suzhou 215123, China
2
School of Civil Engineering and Architecture, Zhejiang Sci-Tech University, Hangzhou 310018, China
3
Department of Civil and Environmental Engineering, University of Liverpool, Liverpool L69 3GH, UK
4
Department of City Culture and Communication, Suzhou City University, Suzhou 215104, China
*
Author to whom correspondence should be addressed.
Thermo 2025, 5(4), 47; https://doi.org/10.3390/thermo5040047
Submission received: 16 September 2025 / Revised: 28 October 2025 / Accepted: 31 October 2025 / Published: 3 November 2025

Abstract

Coal-to-Synthetic Natural Gas (SNG) plays a crucial role in China’s decarbonization strategy but faces significant sustainability challenges due to its carbon-intensive nature. This study integrates Life Cycle Assessment (LCA) with Box–Behnken Design and Response Surface Methodology (BBD-RSM) to quantify and optimize key parameters for emission reduction. The LCA results indicate that 90.48% of total emissions originate from the SNG production stage, while coal mining accounts for 9.38%, leading to a carbon intensity of 660.92 g CO2eq/kWh, second only to conventional coal power. Through BBD-RSM optimization, the optimal parameter combination was identified as a raw coal selection rate of 62.5%, an effective calorific value of 16.75 MJ/kg, and a conversion efficiency of 83%, corresponding to an energy-based rate of return (ERR) of 49.79%. The optimized scenario demonstrates a substantial reduction in total life-cycle emissions compared with the baseline, thereby improving the environmental viability of coal-to-SNG technology. Furthermore, this study employs the energy-based rate of return (ERR) as a normalization and comparative evaluation metric to quantitatively assess emission reduction potential. The ERR, combined with BBD-RSM, enables a more systematic exploration of emission-driving factors and enhances the application of statistical optimization methods in the coal-to-SNG sector. The findings provide practical strategies for promoting the low-carbon transformation of the coal-to-SNG industry and contribute to the broader advancement of sustainable energy development.

1. Introduction

As global concerns over climate change intensify, reducing carbon emissions has become a central focus of energy policies worldwide [1]. China, in particular, faces the dual challenge of ensuring energy security while striving to meet its ambitious climate target of peaking carbon emissions by 2030 and achieving carbon neutrality by 2060 [2]. To navigate these challenges, coal-to-Synthetic Natural Gas (SNG) has emerged as a transitional energy solution. Leveraging China’s abundant coal reserves, SNG production can supplement natural gas demand, contributing to energy security [3,4]. Despite its potential benefits in alleviating air pollution and energy shortages, coal-to-SNG remains highly carbon-intensive, with emissions that surpass those of most renewable energy technologies [5]. This paradox highlights the urgent need to optimize the SNG production process to balance economic objectives with environmental sustainability. Beyond environmental burdens, resource extraction can also bring broader sustainability challenges [6], highlighting the importance of adopting a life-cycle perspective.
The coal-to-SNG process involves coal gasification, followed by syngas purification, and then catalytic methanation to convert syngas into SNG [7]. The resulting synthetic gas is chemically similar to natural gas and fully compatible with existing natural gas infrastructure. This compatibility has accelerated the construction of SNG plants in China [8]. However, debates persist about whether the carbon emissions from SNG power generation exceed those of conventional coal technologies. Previous studies have identified several challenges associated with coal-to-SNG, including high capital investment [9], significant Greenhouse Gas (GHG) emissions [10], and water consumption [11], with some arguing that the technology has not yet realized the expected energy savings or emissions reductions [12,13]. These concerns are particularly pertinent given China’s commitment to peaking carbon emissions by 2030 and achieving carbon neutrality by 2060 [14]. Consequently, the environmental sustainability of SNG remains a critical issue requiring immediate attention.
Existing literature on the environmental impact of coal-to-SNG production has primarily focused on Life Cycle Assessment (LCA) [15]. For example, Liu et al. (2024) [16] quantified GHG emissions across the production stages, while Zeng et al. (2019) [17] explored the trade-offs between water consumption and energy output. Kolb et al. (2021) [18] compared the haze pollution and carbon intensity of SNG with conventional coal technologies. Despite these contributions, gaps remain in understanding emission drivers at specific production stages and in utilizing optimization techniques to reduce emissions effectively. While LCA provides valuable insights, it often lacks detailed identification of key emission drivers and fails to integrate optimization strategies that could enhance sustainability. Moreover, parameter optimization is recognized as a crucial step in reducing emissions [19,20], yet most studies have focused on techno-economic analysis rather than on the statistical optimization of critical production variables.
Response Surface Methodology (RSM) coupled with Box–Behnken Design (BBD) offers significant potential to address these gaps [21]. RSM is a statistical technique that models the relationship between multiple variables and a response variable, such as carbon emissions [22]. BBD is an experimental design method that efficiently selects experimental points to estimate the parameters of an RSM model [23]. These methodologies have been successfully applied in chemical and energy systems to optimize process parameters, improve product quality, and reduce environmental impacts [24,25]. However, their application in coal-to-SNG research has been limited. The complex, multi-variable nature of SNG production makes it an ideal candidate for RSM-BBD optimization, which can identify the optimal combination of parameters to minimize carbon emissions while maintaining or improving production efficiency.
To address this research gap, the current study develops an LCA-based computational framework to conduct a comprehensive analysis of the carbon emissions associated with a typical coal-to-SNG power plant in China. This paper makes two key contributions: (1) it applies the rate-of-return normalization comparison method to quantitatively assess the emissions-reduction potential of coal-to-SNG technology and identify key emission drivers; and (2) it integrates Box–Behnken Design with Response Surface Methodology (BBD-RSM) to optimize critical production parameters, a novel approach in coal-to-SNG carbon emissions research. Unlike previous studies that primarily focused on LCA, this work uses LCA as a foundation and optimizes key parameters through BBD-RSM, providing a more data-driven and actionable approach to emission reduction. This integrated methodology is innovative in the context of coal-to-SNG and offers practical guidance for enhancing the sustainability of the technology.
The remainder of this paper is structured as follows: Section 2 outlines the research methodology and data sources; Section 3 presents the LCA calculation results and compares the carbon emission intensities with other energy sources; Section 4 explores emissions-reduction strategies for coal-to-SNG; and Section 5 offers conclusions and implications.

2. Research Methodology

This study evaluates the carbon footprint of coal-to-SNG process through LCA, utilizing key standards such as the Product Life Cycle Accounting and Reporting Standard (PARS) [26], ISO 14067 [27], and the Publicly Available Specification (PAS) 2050:2011 [28]. All three standards commonly utilize LCA, which forms the bedrock for carbon footprint calculations. The widespread acceptance of LCA is attributed to its capacity to offer detailed [29], micro-level analysis, thereby bolstering the credibility of its outcomes. This method is composed of four principal steps:
E m i s s i o n = i n E m i s s i o n i = i n j m C o n s u m p t i o n i j × E m i s s i o n   F a c t o r i j
where Emission is the total carbon emissions throughout the life cycle; Emissioni is the carbon emissions at stage i; Consumptionij is the consumption of material j at stage i; and Emission Factorij is the carbon emission factor for material j at stage i (indicating the carbon emissions per unit of energy consumed).

2.1. Objectives and Scope

The primary objective of this study is to optimize key parameters in the coal-to-SNG production lifecycle to reduce carbon emissions. Since the commissioning of China’s first SNG project in 2013, the industry has made significant progress, with over 70 projects now operational. Notable projects such as Datang Keqi, Xinjiang Qinghua, and Yili Xintian have achieved a total production capacity of 7.495 billion Nm3 per year, operating at 100% capacity utilization, as shown in Table 1 [17,30]. Despite rapid expansion, research into the carbon emissions of the SNG industry remains limited and inconclusive. Key challenges include high capital investment, substantial GHG emissions, excessive water consumption, and environmental contamination, all of which impede progress toward energy conservation and emission reduction goals and involve potential health impacts [31].
China’s policy toward SNG has also evolved. In 2010, most projects were suspended due to environmental concerns, with only a few demonstration projects allowed. By 2013, policy shifted to support the industry as part of efforts to alleviate natural gas shortages and improve air quality [32]. Coal-to-SNG is now viewed as a transitional energy option in China’s broader energy strategy. This study selects the Datang Keqi coal-to-SNG project as a case study, as it is China’s first demonstration project and offers comprehensive data, making it a representative case for LCA analysis. Using 1 kWh of electricity produced from SNG as the functional unit, the study conducts a systematic evaluation of life cycle carbon emissions and explores optimization strategies. The results aim to fill existing research gaps, support emission reduction efforts, and inform the sustainable development of the coal-to-SNG sector.

2.2. System Boundary

This study provides a comprehensive analysis of carbon emissions from the cradle to the gate of the coal-to-SNG process. The life cycle system diagram is shown in Figure 1, where the green virtual boundary defines the limits of the system. The analysis encompasses the following key processes [3]: (1) coal mining and washing (S1), (2) coal transportation (S2), (3) coal-to-SNG production (S3), and (4) pipeline transportation (S4). A custom tool built using Microsoft Excel is used for the LCA of the coal-to-SNG process. Data are sourced from publications, literature, and reports from authorities and institutions, with details on data sources and selection criteria provided in Section 2.5.
To account for data limitations in some processes, the following exclusions and assumptions are made: (1) Energy consumption and pollutant emissions from equipment construction and decommissioning are considered negligible and thus excluded. (2) SNG power generation is treated as the final disposal stage, allowing for normalized comparative analysis. (3) Based on the total raw coal consumption, it is estimated that the final disposal stage could generate approximately 4.07 × 10¹⁰ kWh of electricity. These assumptions provide a conservative estimate of the life cycle carbon emissions from coal-to-SNG.

2.3. Assessment of Carbon Emissions from Coal-to-SNG

This study inventories and calculates carbon emissions throughout the coal-to-SNG production life cycle, from coal extraction to SNG generation. Carbon emissions at each stage result from specific activities, and their magnitude determines the overall emissions of that stage. In the coal mining stage, emissions primarily come from direct fuel combustion and indirect electricity consumption. Additionally, hydrocarbon emissions from coalbeds, mainly methane (CH4), are an important source of greenhouse gases. Given its global warming potential approximately 25 times that of CO2, methane emissions from coal mining should not be ignored [33]. In the transportation stage, fuel consumption from gasoline and diesel is the main source of greenhouse gases, as coal is primarily transported by rail, road, and waterways [34]. For the coal-to-SNG production process, major emission sources encompass coal gasification, syngas conversion, acid gas removal, and indirect emissions resulting from electricity consumption. When integrating SNG into the pipeline network, emissions primarily stem from natural gas combustion and leakages [35]. The calculation of life cycle carbon emissions from coal-to-SNG is detailed in the Supplementary Materials.

2.4. Normalization

Energy value refers to the total effective energy input required to produce resources, labor, and products, encompassing both direct and indirect inputs [36]. Due to variations in the sources and levels of different energy forms, they cannot be directly compared or aggregated. To provide a deeper analysis of the factors affecting carbon emission reduction in the coal-to-SNG process, this study introduces an energy-based rate of return (ERR) as a key performance indicator, which is developed based on the conventional rate of return concept. This indicator, traditionally defined as the ratio of income to capital, is here adapted to measure the overall energy utilization efficiency of the coal-to-SNG system by normalizing carbon emissions into equivalent energy consumption, specifically electricity generation [37]. In this way, the ERR reflects the relationship between energy output and environmental impact, serving as an energy-efficiency indicator indirectly associated with life-cycle carbon reduction potential. This normalization uses local greenhouse gas emission factors from the National Development and Reform Commission [38], which provide standardized emission factors for various energy sources and technologies. The ERR is calculated as follows:
R a t e   o f   r e t u r n = I n c o m e C a p i t a l × 100 %
E n e r g y b a s e d   r a t e   o f   r e t u r n = E n e r g y   g e n e r a t i o n E n e r g y   c o n s u m p t i o n   E n e r g y   c o n s u m p t i o n × 100 %  
where Energy generation is the total energy produced during the coal-to-SNG process (kWh); Energy consumption is the total energy input required for the production process (kWh), which includes direct and indirect energy use such as extraction, transportation, and conversion of coal-to-SNG.
By subtracting energy consumption from energy generation, the formula calculates the net energy output. The result is then divided by energy consumption, creating a ratio that reflects the efficiency of the process. A higher ERR indicates a greater capacity to generate energy while consuming relatively less energy, which directly correlates to lower carbon emissions [39]. In other words, a more efficient process will have a higher ERR, as it requires fewer resources to produce the same amount of energy, thus reducing its overall carbon emission.

2.5. Data Collection

A robust LCA model requires extensive data on production processes, energy and material consumption, energy consumption coefficients, and carbon emission factors [40]. Accurate and reliable data are essential to ensure precise assessments. This study focuses on the Datang Keqi coal-to-SNG demonstration project, where lignite is transported 200 km by rail from the Shengli coal field. The produced SNG is then delivered to Beijing via a 400-km pipeline. Key data, such as coal mining routes and pipeline transport distances, are sourced from related literature [4,41] and the Energy Professional Knowledge Service System [42]. Additional data on transportation energy consumption and coal-to-SNG power units are obtained from the Ministry of Transport of the People’s Republic of China [43] and the National Development and Reform Commission [44]. Preference is given to local greenhouse gas emission factors from the National Development and Reform Commission [38], supplemented by literature and Intergovernmental Panel on Climate Change data [45]. The GWP of each greenhouse gas is based on the IPCC Fifth Assessment Report [46]. The activity data and emission factors employed in this study are available in the Supplementary Materials.

3. Results

3.1. Life Cycle Carbon Emissions Analysis of Coal-to-SNG

Current research on carbon monitoring and production technologies for coal-to-SNG projects has often been insufficient in capturing the full life cycle of carbon emissions. This study addresses this gap by systematically identifying and summarizing key carbon emission factors across the entire life cycle. According to the life cycle carbon emission accounting model, the total emissions for coal-to-SNG production amount to 2.69 × 10⁷ tons, as shown in Table 2. These emissions are primarily concentrated in two stages: coal mining and washing (S1) and coal-to-SNG production (S3), together accounting for 99.86% of the total emissions. Therefore, efforts to reduce emissions should focus on optimizing technologies and processes in these two stages.
In the coal mining and washing stage (S1), emissions amount to 2.53 × 10⁶ tons, constituting 9.38% of the total. These are primarily associated with indirect emissions from electricity consumption used in mechanized mining operations and coal preparation, direct CH4 emissions due to coalbed methane leakage, and spontaneous combustion of residual coal seams. Notably, China’s current coalbed methane utilization rate remains relatively low, leading to significant fugitive methane emissions with high global warming potential [47]. This indicates an urgent need to improve methane capture technologies and enforce stricter regulatory requirements for emission control at coal mines. The coal transportation stage (S2) contributes 2.81 × 10⁴ tons, or about 0.1% of total emissions. Although comparatively small, this segment offers untapped potential for emission reduction by optimizing logistics, adopting cleaner transportation fuels, and upgrading outdated transport infrastructure, especially considering the currently high energy intensity and route inefficiencies across China’s coal supply chain [48]. The coal-to-SNG production stage (S3) is by far the most carbon-intensive, generating 2.44 × 10⁷ tons of CO2-equivalent emissions, or 90.48% of the total. These emissions mainly originate from the energy-intensive chemical conversion processes, including oxidation reactions, gasification, methanation, and high-temperature combustion needed to synthesize natural gas from coal feedstock [49]. Therefore, improving thermal efficiency, enhancing reactor design, and integrating carbon capture and storage (CCS) or utilization (CCUS) technologies are key levers for reducing the carbon footprint of this stage. Furthermore, real-time monitoring and digital optimization of process parameters could lead to additional efficiency gains. Pipeline transportation (S4), the final stage, accounts for 1.02 × 10⁴ tons of emissions, or just 0.04% of the total. Although the carbon impact is relatively minor, incremental improvements such as reducing transmission losses, optimizing pipeline pressure, and minimizing leakages through better maintenance and smart monitoring systems can further support overall emission reduction efforts.
Overall, the distribution of carbon emissions across stages follows the pattern: S3 > S1 > S2 > S4. Therefore, priority should be given to optimizing coal-to-SNG production (S3) and coal mining and washing (S1). Specific focus should be placed on increasing CH4 utilization rates and improving coal washing to reduce greenhouse gas emissions and resource waste. Additionally, enhancements to the transportation network, such as reducing energy consumption and adopting more direct routes, can help reduce emissions at the transport stage.

3.2. Comparative Carbon Emission Intensity

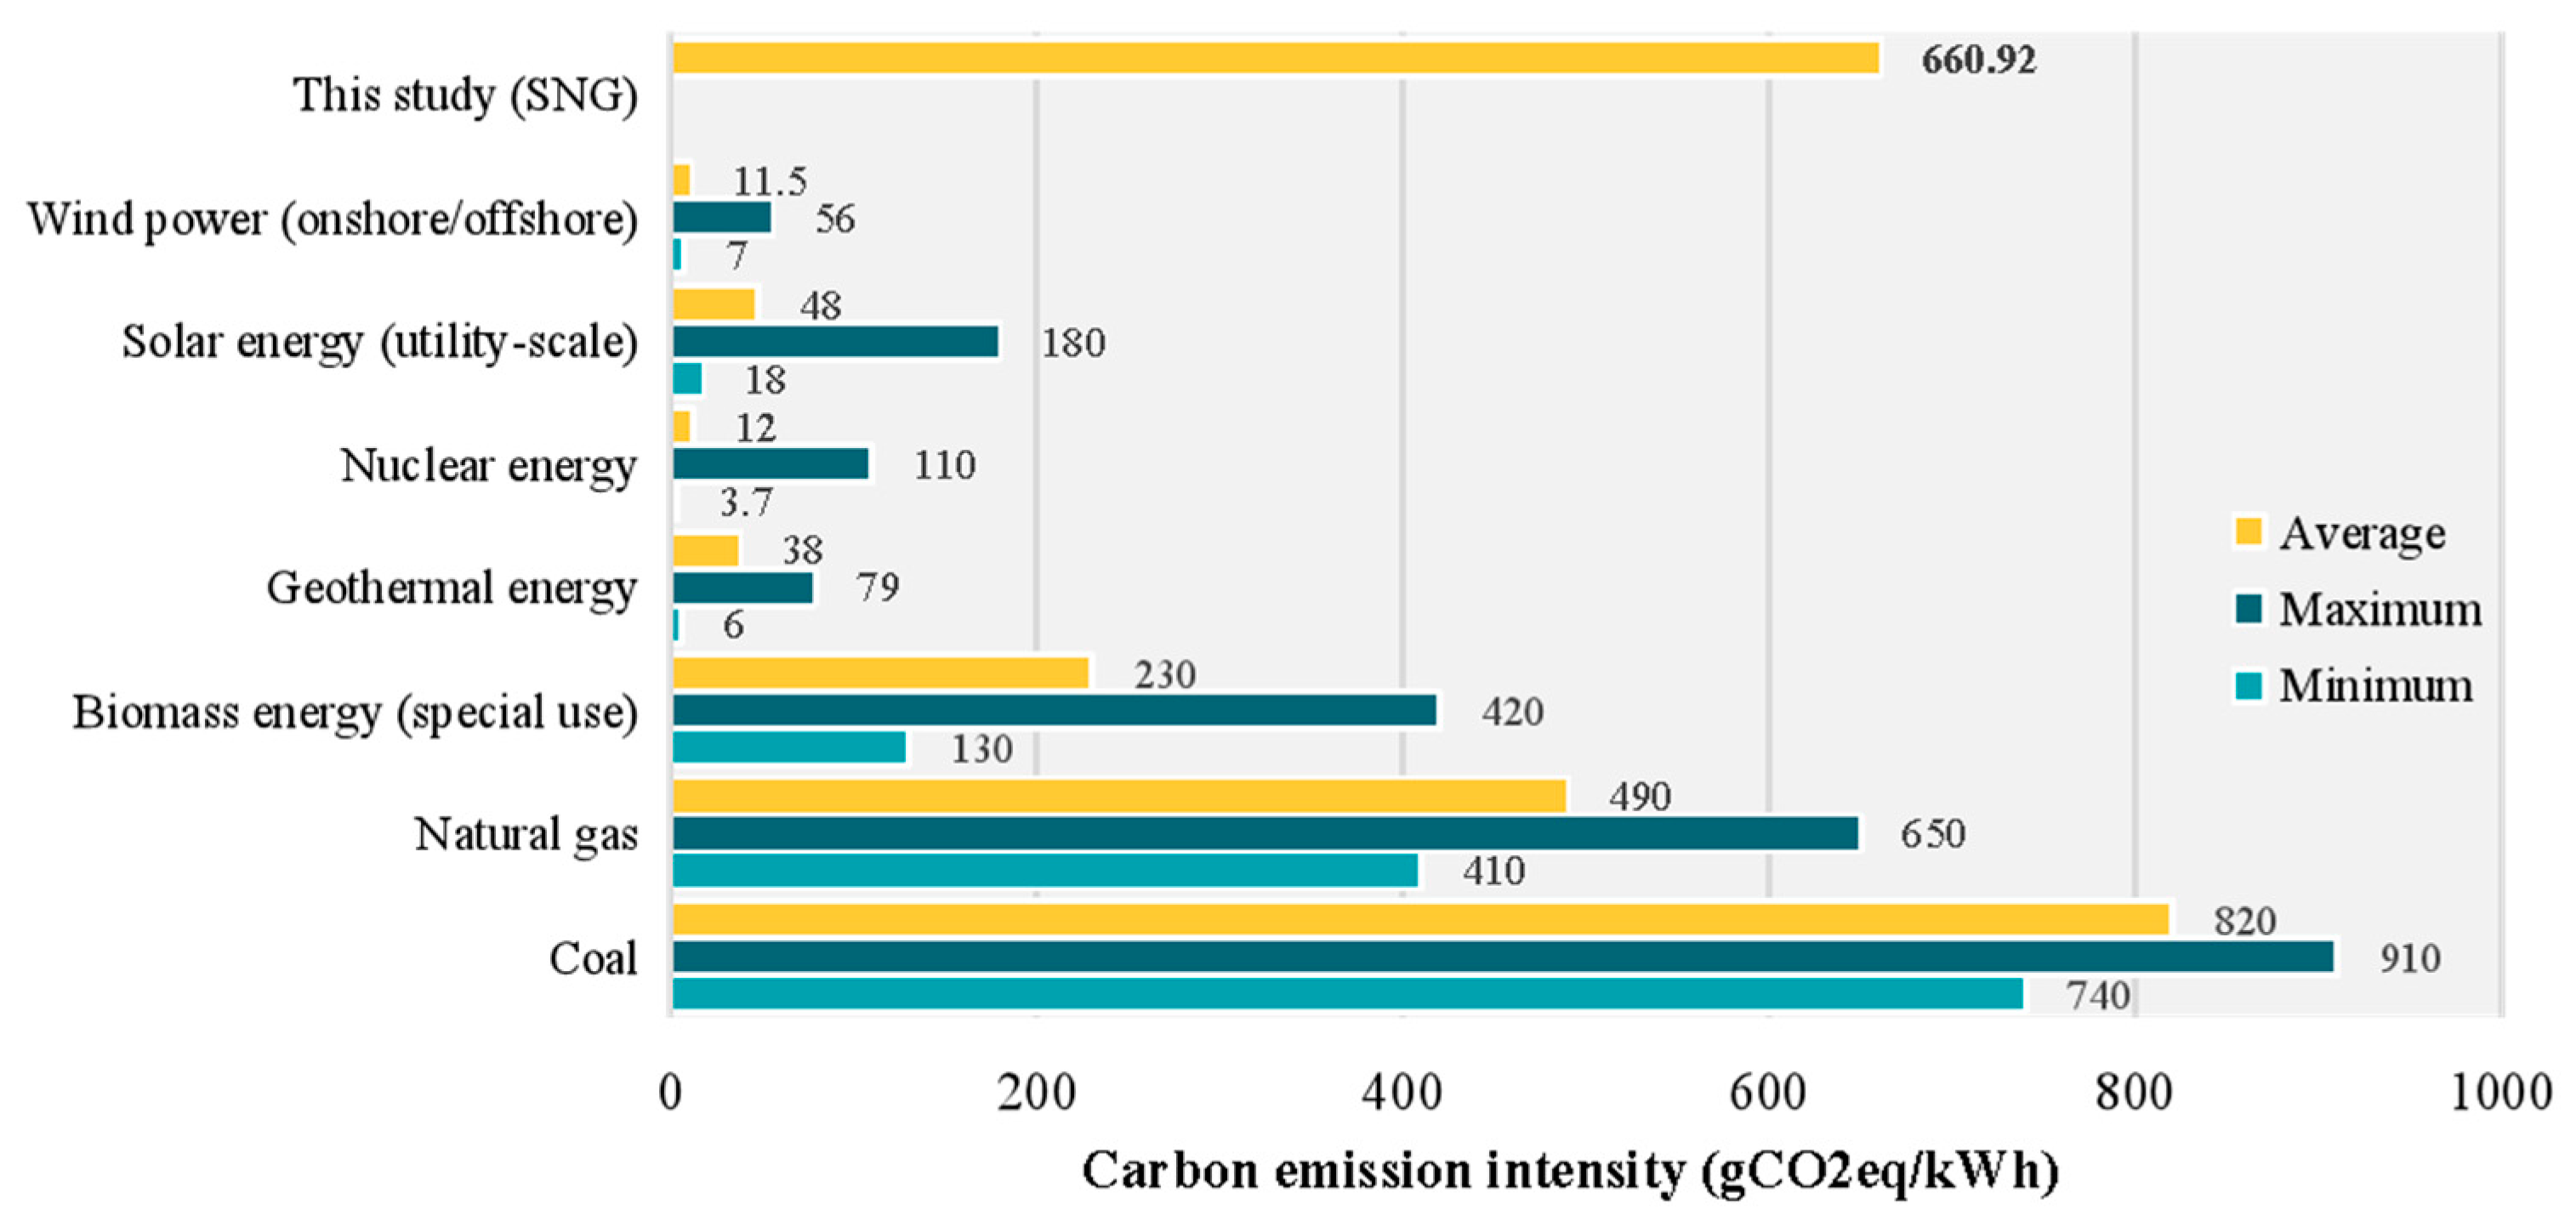
Based on the total raw coal consumption, this study estimates that coal-to-SNG production generates 4.07 × 10¹⁰ kWh of electricity, with a carbon emission intensity of 660.92 g CO2eq/kWh. Figure 2 compares the carbon emission intensities of other energy sources, including wind power [50,51,52,53,54], solar energy [55,56,57,58], nuclear energy [59,60,61], geothermal [62,63], biomass energy [59,64,65], natural gas [66], and coal [67,68,69]. The results show that the carbon intensity of SNG-based power generation is significantly higher than that of most other energy sources, second only to conventional coal-fired power. This highlights the substantial challenges faced by coal-to-SNG in terms of reducing carbon emissions. From a life cycle standpoint, fossil fuels like coal and natural gas are significant contributors to greenhouse gas emissions. In contrast, clean energy technologies including geothermal, hydropower, nuclear, solar, and wind have considerably lower life cycle emissions, often less than one-tenth of those from fossil fuels.
Despite these challenges, coal-to-SNG remains a critical transitional energy source [5]. To address the pressing need for emission reductions, this study applies an innovative BBD-RSM approach to optimize key operational parameters. By identifying the most influential variables and their optimal settings, including coal quality, calorific value, and conversion efficiency, this method provides a quantitative basis for targeted emission reductions. Moreover, this research offers methodological contributions to the field. While previous studies on SNG have largely focused on process simulations or general techno-economic analysis, few have employed statistical experimental design to systematically optimize life cycle environmental performance. The use of BBD-RSM not only enhances the predictive accuracy of emission outcomes but also delivers practical guidance for plant operators and policymakers seeking to balance energy production with environmental stewardship.

4. Discussion

4.1. Response Surface Optimization Design

To minimize carbon emissions throughout the entire life cycle of coal-to-SNG process, this study utilizes the BBD-RSM design to refine the experimental setup meticulously. Through rigorous statistical analysis, a refined quadratic correction model specifically tailored for this process is established [70,71]. Additionally, two-dimensional contour plots are employed to analyze the intricate interactions among various factors, enabling the identification of optimal parameter combinations to achieve the lowest carbon emissions in coal-to-SNG conversion.

4.1.1. Identification of Key Influencing Factors and Levels

The rapid advancement of coal washing and processing technologies underscores the critical role of the raw coal selection rate in achieving cleaner and more efficient utilization [68]. Although the China National Coal Association targets a selection rate exceeding 95% by 2025 [72], large-scale SNG enterprises such as Datang Keqi and Xinjiang Qinghua generally operate at 70–80%, while smaller regional plants often remain below 50% due to equipment aging and limited upgrading capacity [73]. Therefore, a range of 40–85% is defined to represent both existing industrial conditions and the attainable upper limit under current technologies. The effective calorific value of feed coal, which governs gasification efficiency and methane yield, varies with coal rank: lignite typically provides 15–18 MJ/kg, bituminous coal 18–25 MJ/kg, and anthracite up to 27 MJ/kg [74]. As most SNG plants use coals with moderate carbonization levels and relatively high volatility, a range of 16.75–25.12 MJ/kg is selected to represent typical industrial feedstocks. The conversion efficiency of the coal-to-SNG process mainly depends on gasifier configuration, reaction conditions, and heat integration. Industrial plants generally achieve 50–70% efficiency [8,9,49], whereas studies indicate that employing steam recycling, waste-heat recovery, and advanced methanation catalysts increases it to about 83% under optimized conditions [75]. Consequently, the interval of 50–83% provides a realistic and technically justified range that reflects both current performance and achievable improvement through process optimization.
To investigate the specific impact of these factors on emission reduction throughout the coal-to-SNG life cycle, this study employs the BBD-RSM design principles of Design-Expert 13 software [76], considering the most important factors influencing emission reduction and their ranges. Specifically, the raw coal selection rate (A), effective calorific value of coal (B), and conversion efficiency of coal-to-SNG (C) are selected as variables in a three-factor, three-level experimental design, as shown in Table 3. The main objective is to analyze the direct effects of each factor on emission reduction and explore their complex interaction mechanisms. This multidimensional analysis provides valuable insights into potential pathways for improving emission reduction efficiency in the coal-to-SNG production process.

4.1.2. Establishment of Regression Model and Analysis of Variance

Following the design conditions of the Design-Expert software, 17 experiments are conducted to determine the energy-based rate of return (ERR) of the coal-to-SNG process under various conditions. The experimental design and results are presented in Table 4.
Analysis of variance (ANOVA) and subsequent model validation indicate that the key factors influencing the ERR of the coal-to-SNG process, in order of importance, are B, C, and A. As shown in Table 5, ANOVA results show that B has the most significant impact on ERR (F-value of 2744.3, p-value < 0.0001), indicating a highly statistically significant effect. Factor C also significantly influences ERR (F-value of 2414.92, p-value < 0.0001). Factor A has a relatively minor impact (F-value of 12.97, p-value = 0.0087). The interaction between B and C (BC) is also highly significant (F-value of 177.41, p-value < 0.0001), highlighting the importance of optimizing both B and C to maximize ERR. Other interactions (AB, AC) and quadratic terms (A2, C2) are not statistically significant, with p-values exceeding the conventional threshold (p > 0.05), suggesting their negligible contribution to the model’s outcome. The simplified model further highlights that optimizing factors B and C is the most effective strategy for maximizing ERR:
The coded regression equation derived from the analysis is as follows:
Y = 20.73 0.0514 A 23.60 B + 0.7011 C + 0.0198 A B 0.0005 A C 0.2688 B C 0.0005 A 2 + 4.45 B 2 + 0.0040 C 2  
This equation can be simplified by excluding non-significant terms:
Y = 20.73 0.0514 A 23.60 B + 0.7011 C 0.2688 B C + 4.45 B 2
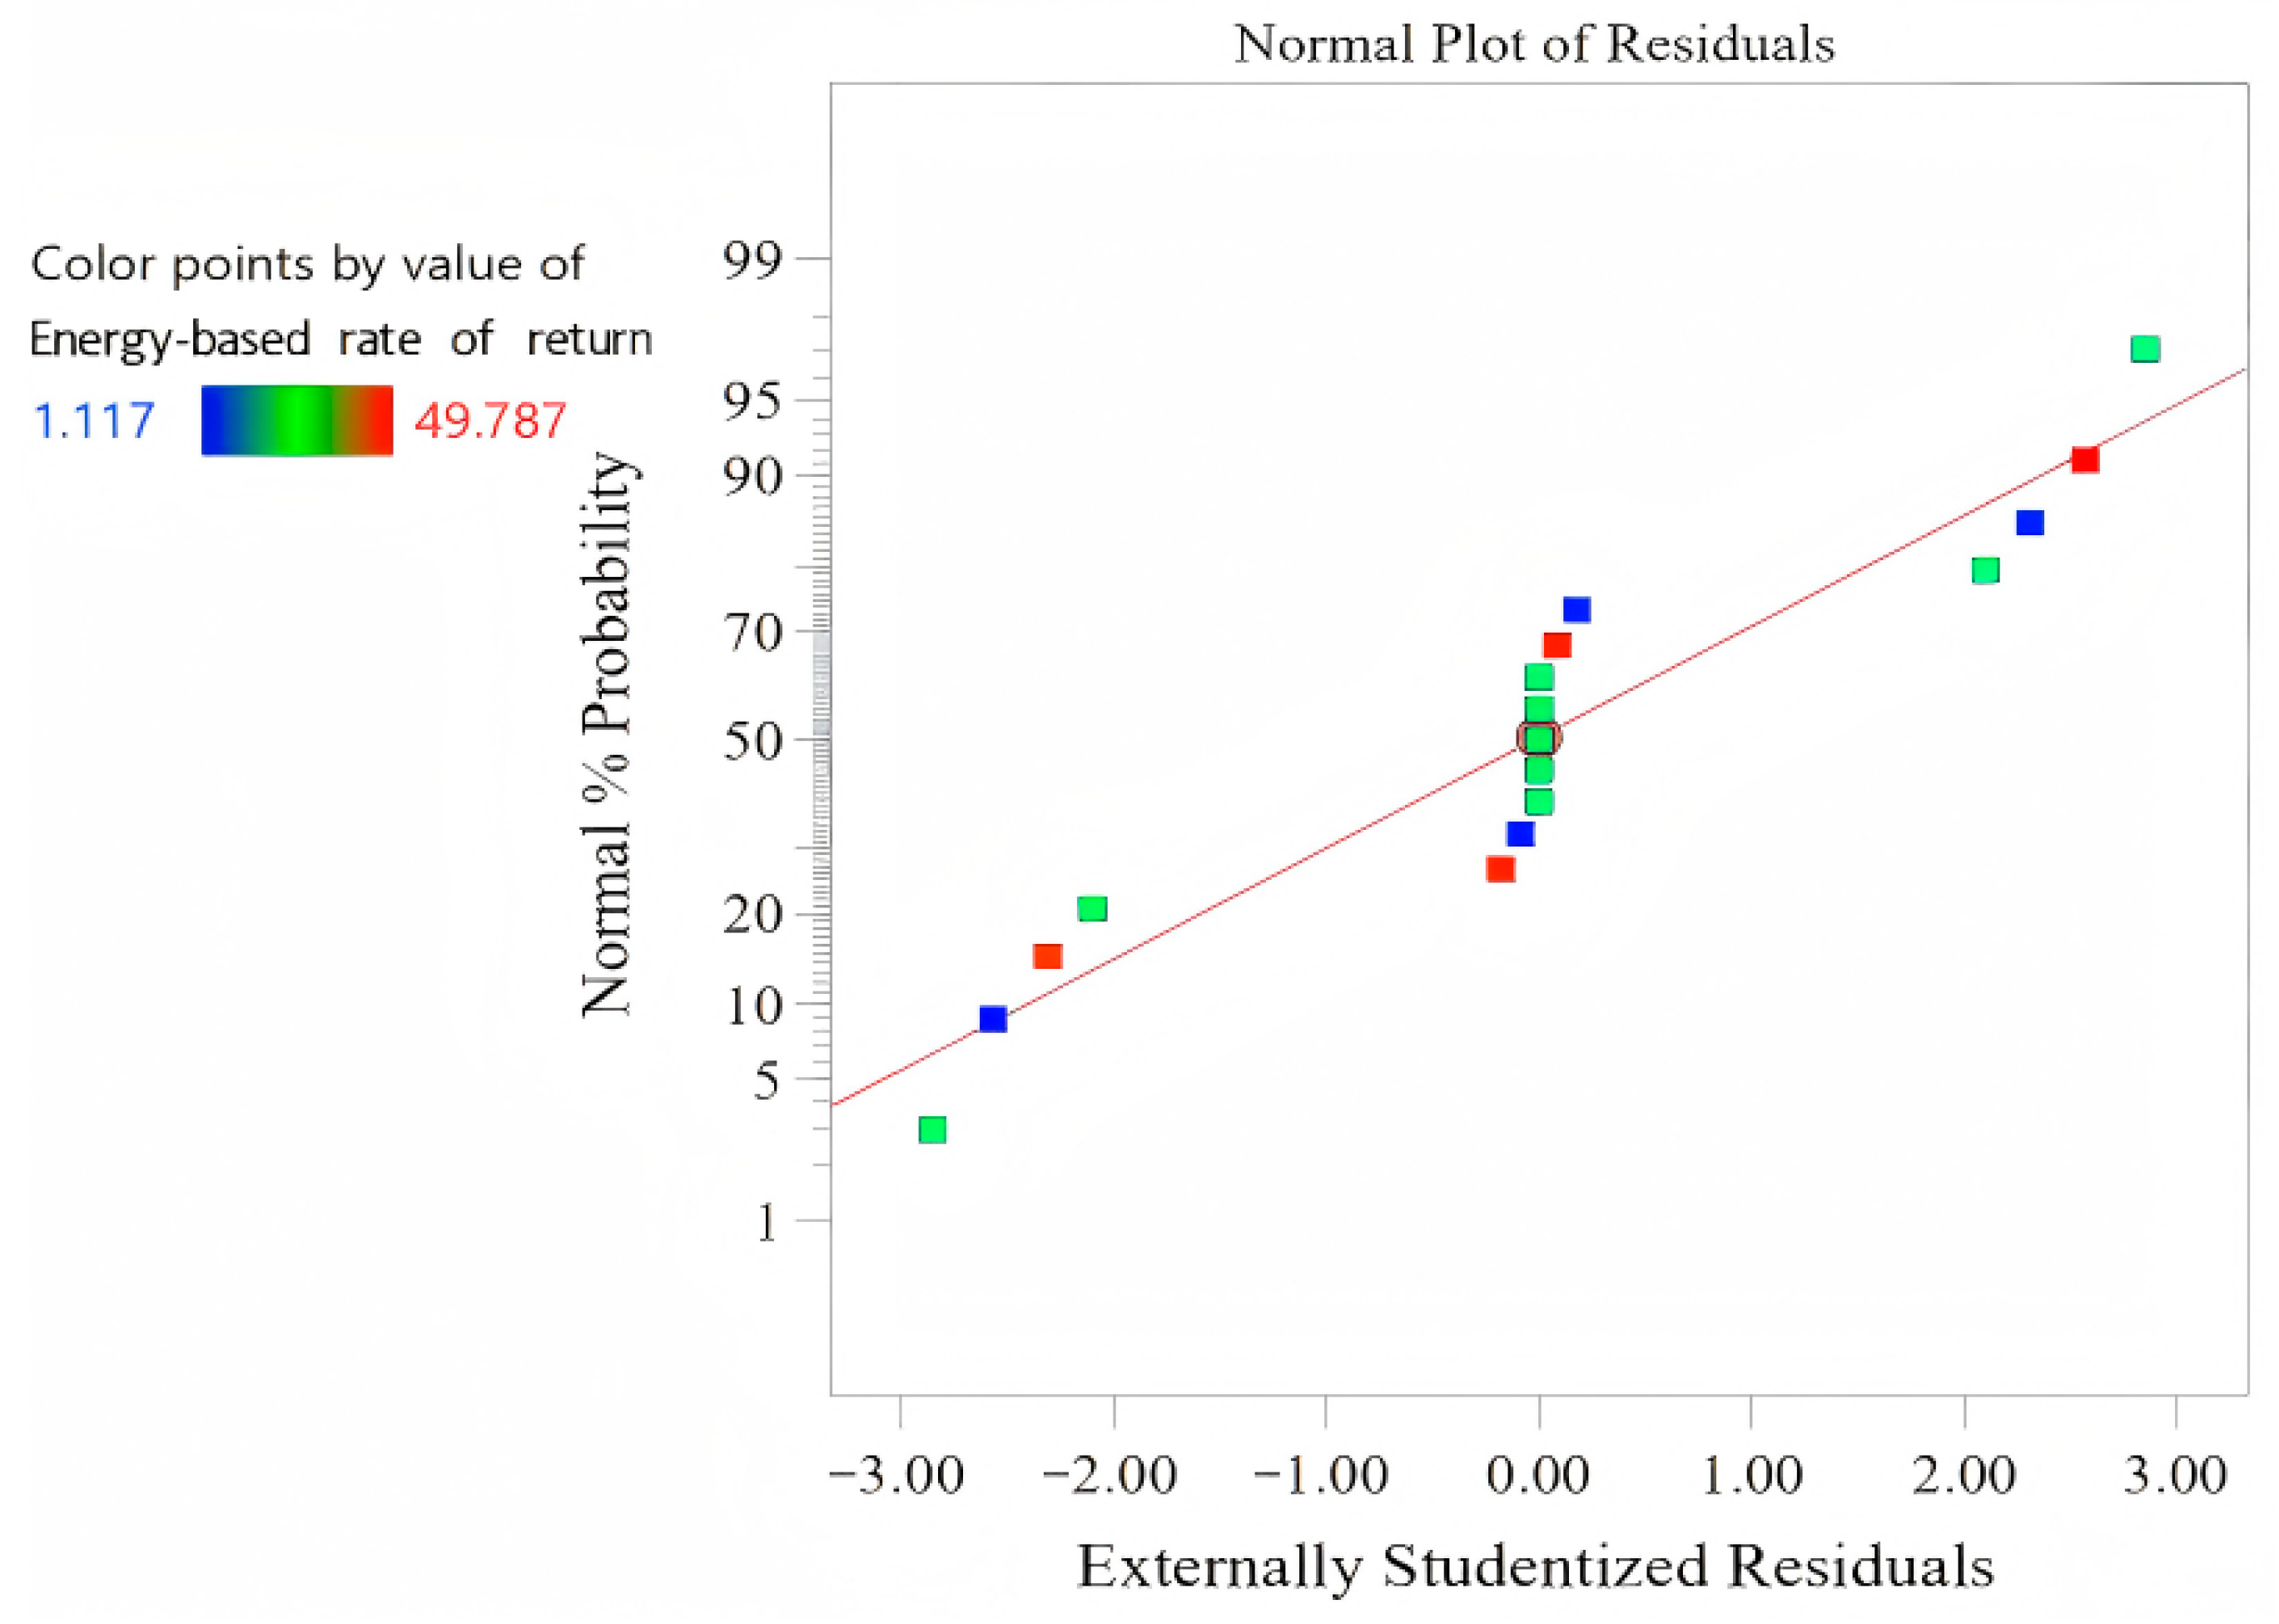
To further evaluate the model’s predictive performance, a comparison between predicted and actual values is shown in Figure 3. The strong linear correlation indicates high accuracy and reliability of the model’s predictions [77]. The residuals follow a normal distribution along the diagonal line without discernible patterns or outliers, further supporting the model’s validity. The regression model’s coefficient of determination (R2 = 1) confirms an excellent fit [78], demonstrating the model’s robustness in accurately predicting carbon emissions under various conditions.

4.2. Box–Behnken Response Surface Analysis of Interactions

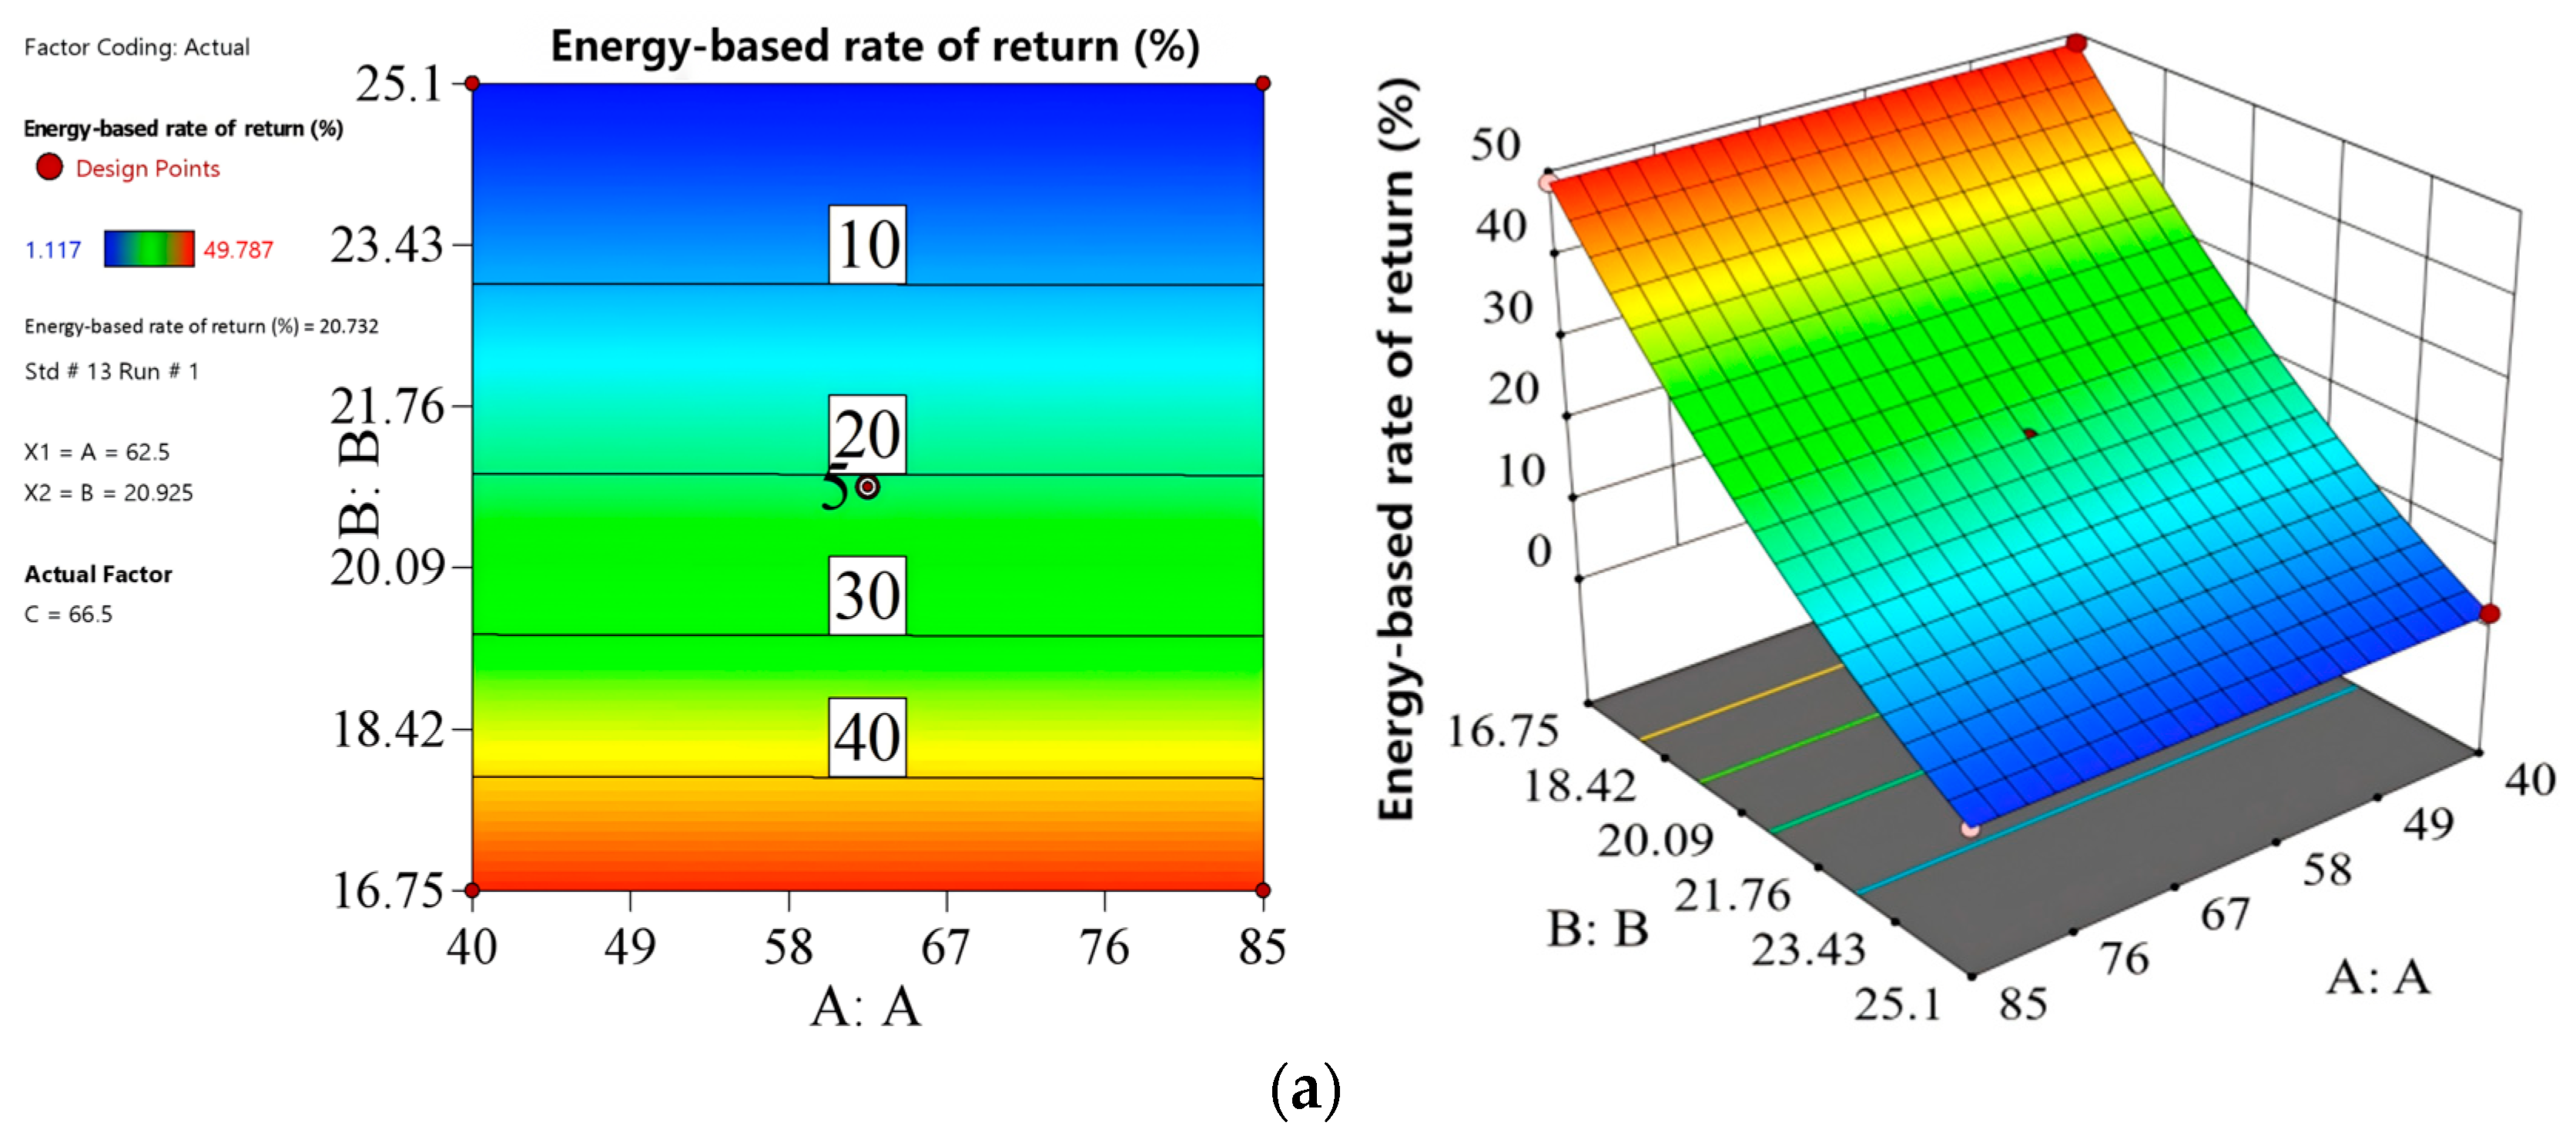
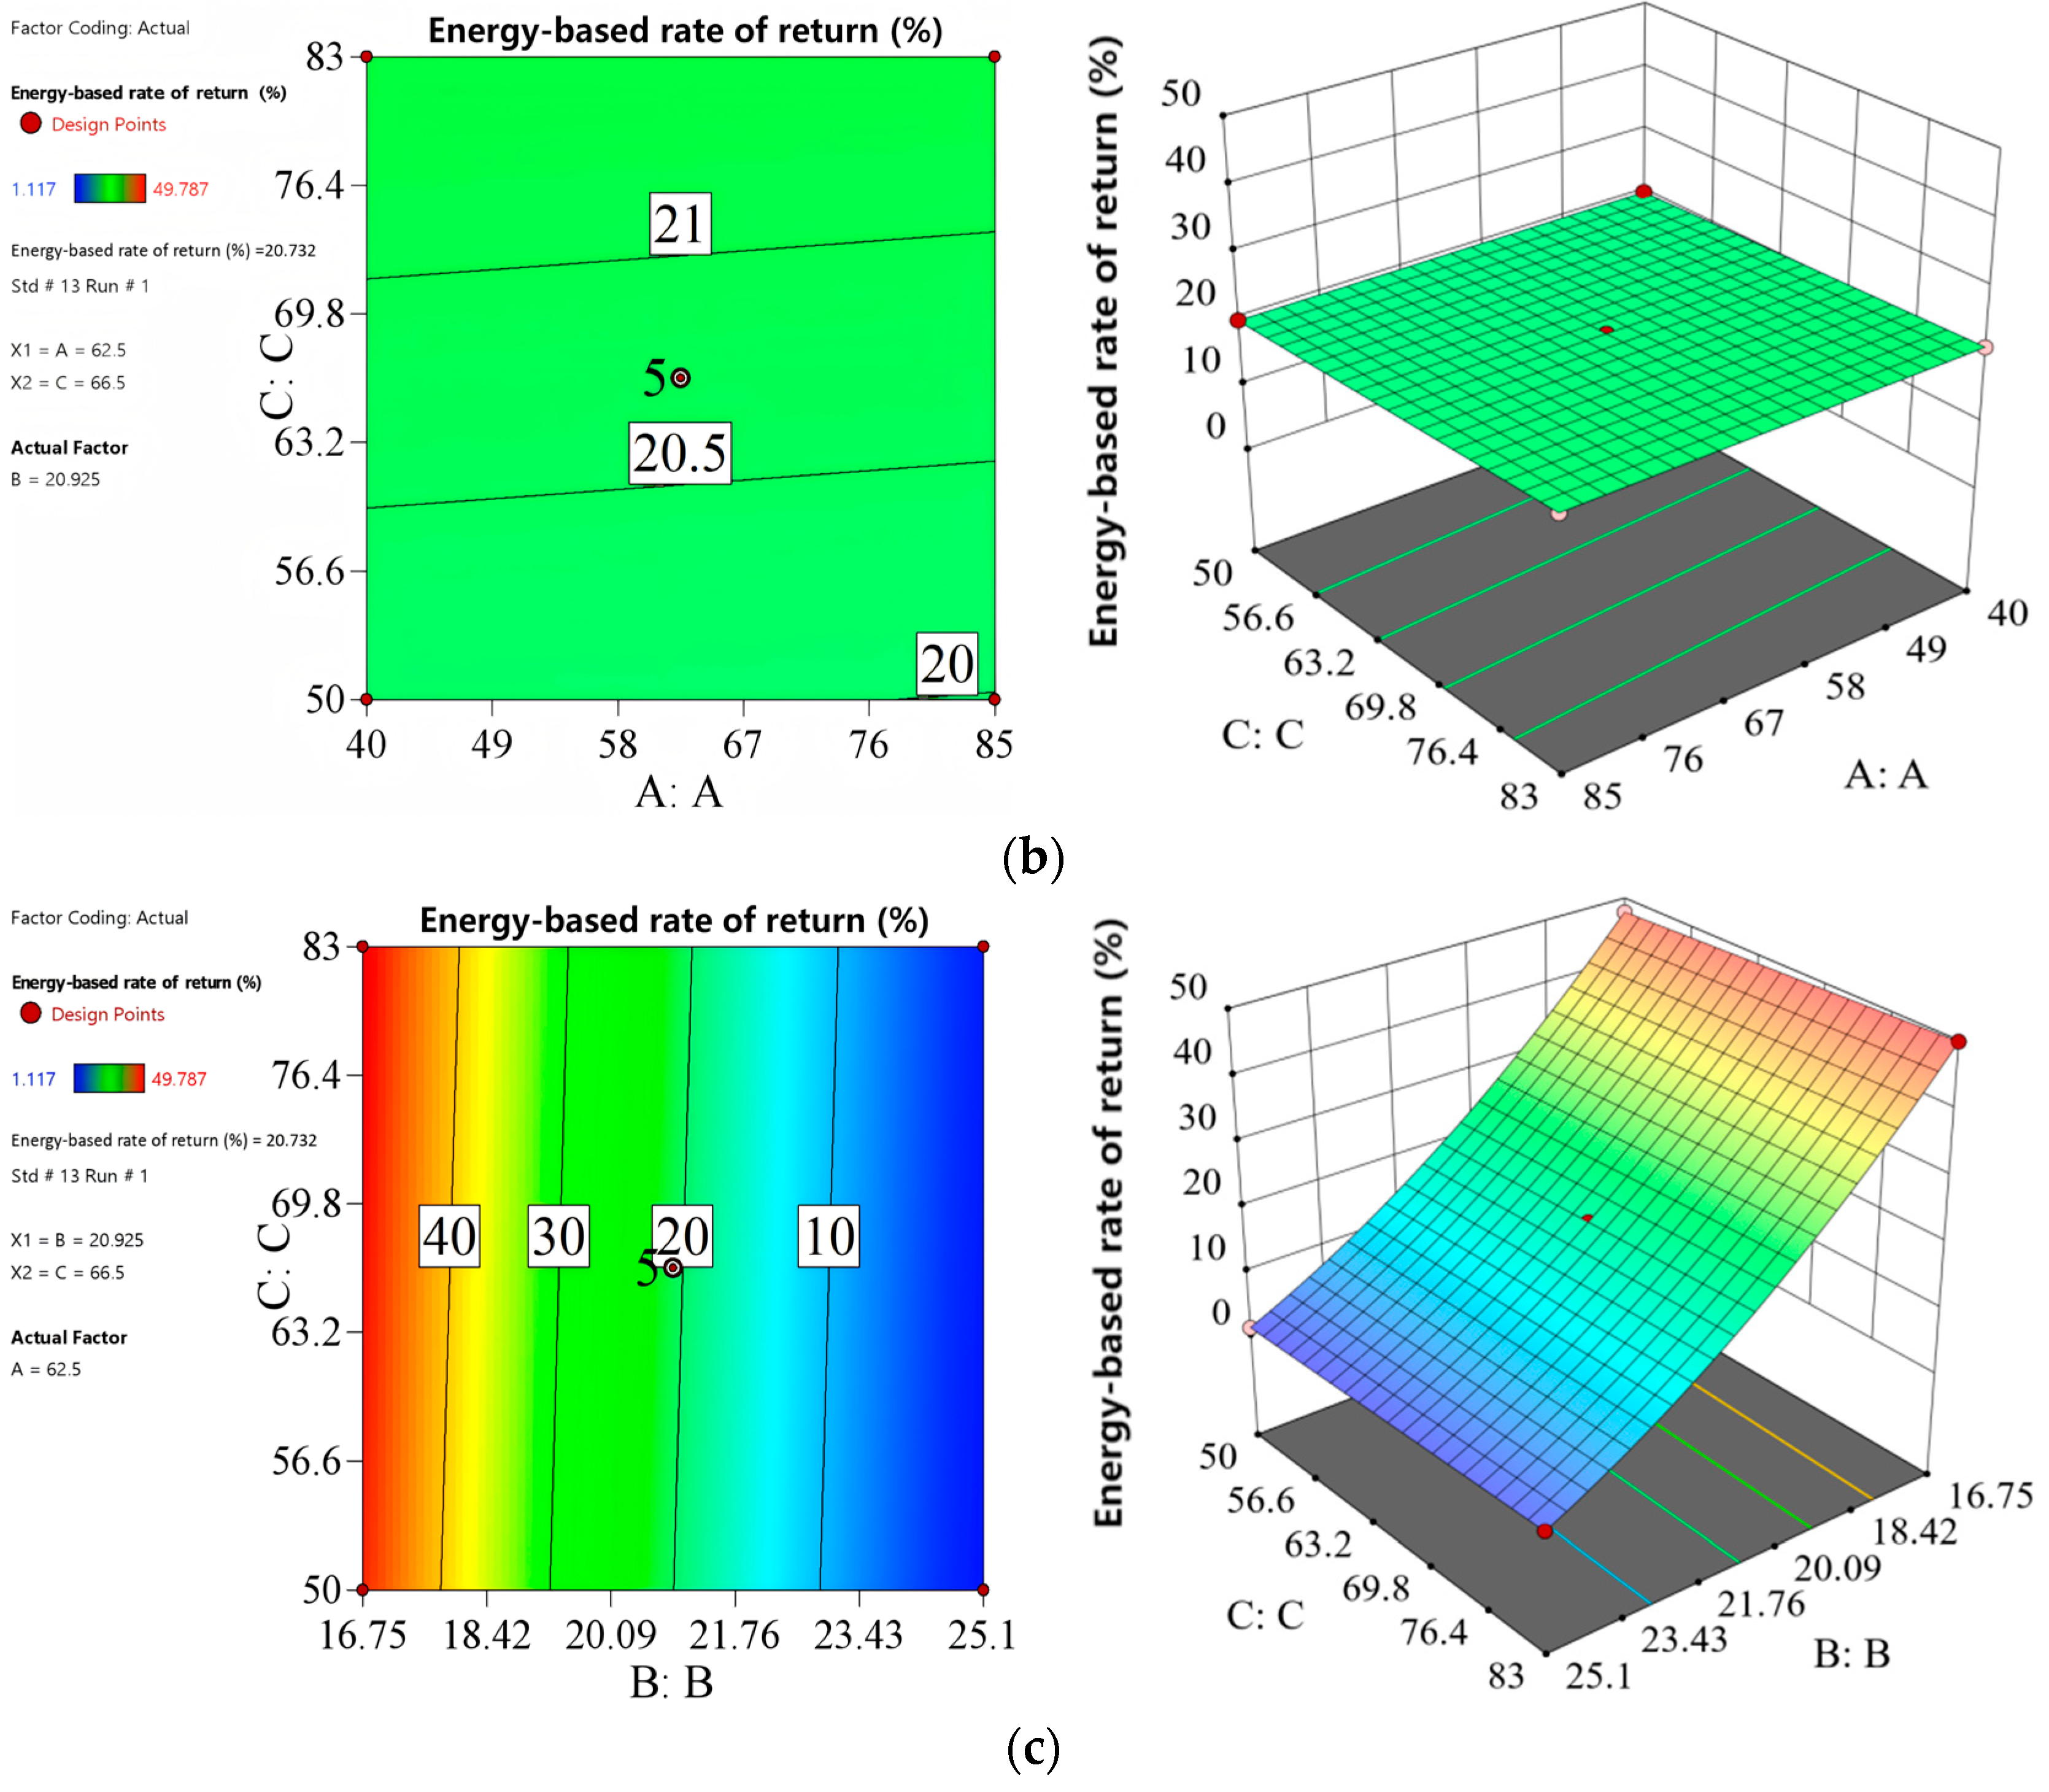
The interaction effects among the key parameters were further investigated using BBD-RSM. As shown in Figure 4, the 3D response surfaces and 2D contour plots clearly depict how raw coal selection rate (A), effective calorific value (B), and conversion efficiency (C) jointly influence the EER, providing both quantitative and visual evidence of factor interactions.
  • Figure 4a: The response surface between A and B is relatively flat, indicating no significant interaction. However, the contour plot shows a clear trend: the ERR increases sharply as B decreases, while A remains nearly constant. The almost vertical contour lines confirm that B exerts a much stronger effect than A. This implies that reducing the effective calorific value of coal substantially improves the ERR, whereas variations in the raw coal selection rate have minimal influence under the tested conditions.
  • Figure 4b: The interaction between A and C is also weak. The response surface is smooth, and the contour plot shows only slight gradients, suggesting limited interaction. Increasing C modestly enhances the ERR, but this improvement occurs independently of A. These results indicate that while conversion efficiency contributes to better performance, the raw coal selection rate remains a less influential factor.
  • Figure 4c: In contrast, the interaction between B and C is highly significant. The response surface exhibits pronounced curvature, and the contour plot reveals steep gradients and dense contour lines. The ERR reaches its maximum when B is minimized and C is maximized, underscoring the synergistic effect of fuel quality and process efficiency. This finding highlights that joint optimization of B and C is essential for achieving the greatest economic benefit.
Among the three examined parameters, the effective calorific value of coal (B) and the conversion efficiency (C) emerge as the dominant factors affecting the ERR. Their interaction is particularly significant, as the ERR reaches its highest point when the effective calorific value is minimized and the conversion efficiency is maximized. While the raw coal selection rate (A) is still a relevant factor, its impact on the ERR is relatively minor, whether considered on its own or in interaction with other factors.

4.3. Optimized Process and Verification Tests

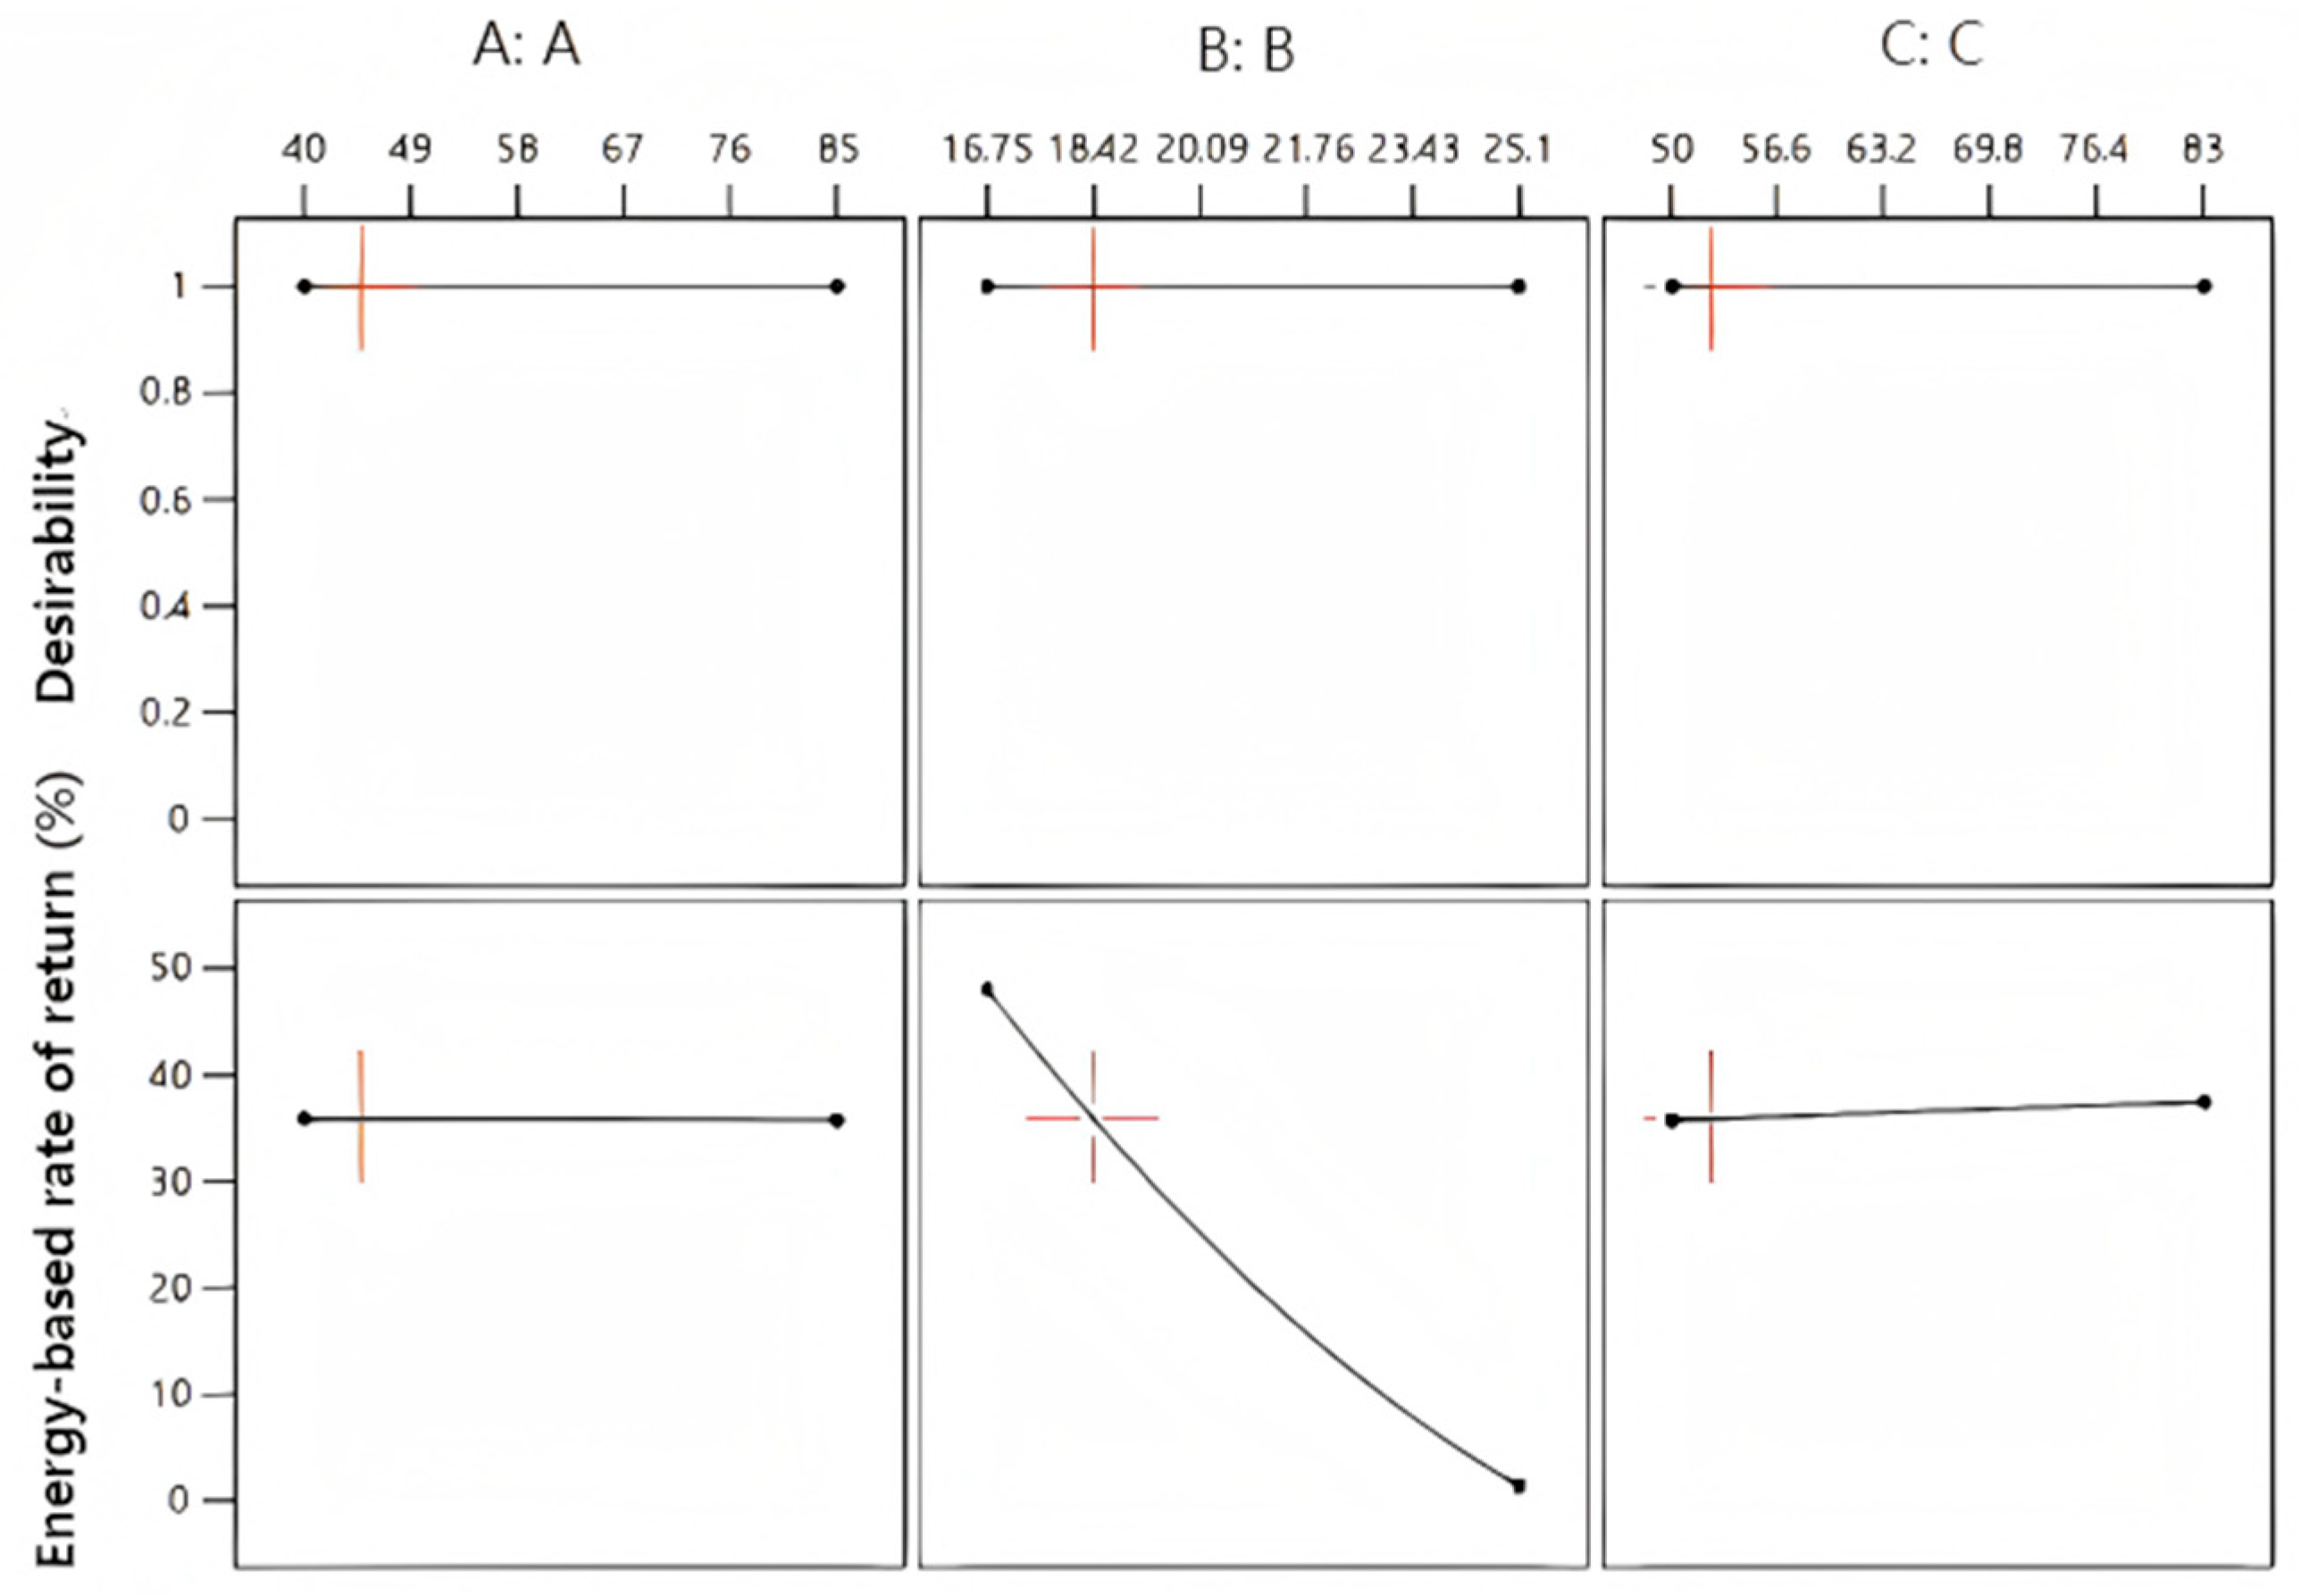
The optimization of model parameters is conducted using Design-Expert 13 software, resulting in the selection of five recommended parameter sets for ERR verification tests. The desirability function, as depicted in the upper part of Figure 5, confirms the earlier findings that reducing the effective calorific value of coal (B) and increasing the conversion efficiency of coal-to-SNG (C) significantly enhance the ERR. This aligns well with prior analyses and highlights the critical role these parameters play in system optimization. The bottom panel of Figure 5 further reveals the individual trends between each factor and the response variable (energy-based rate of return). While factor A (raw coal selection rate) appears to have a relatively flat influence, factor B exhibits a strong negative correlation, suggesting that lower values of B are beneficial. Conversely, factor C shows a positive linear relationship with the ERR, underscoring its direct contribution to economic performance. These trends confirm that the model accurately reflects the interaction effects among key process parameters and supports robust decision-making for process improvement.
Table 6 presents a comprehensive set of results that serve as a testament to the model’s accuracy and reliability [70]. The close alignment between the predicted and actual rates of return in the table is remarkable. This strong correlation indicates that the model is not only capable of making accurate predictions but also reliable in its estimations. Through the optimization process, the optimal parameter settings have been determined: a raw coal selection rate (A) of 62.5%, an effective calorific value of coal (B) of 16.75 MJ/kg, and a conversion efficiency (C) of 83%. Under these precisely calibrated conditions, both the predicted and actual rates of return achieve their peak levels. This outcome is a clear indication that this specific combination of parameters is highly effective in achieving the most substantial emission reduction. In other words, it represents an optimal configuration for the coal-to-SNG conversion process, balancing efficiency and environmental considerations.
The model results show that ERR increases as the effective calorific value of coal (B) decreases within the examined parameter space. This relationship is confined within the range defined by the Box–Behnken Design (BBD) and reflects the nonlinear interaction between the effective calorific value of coal (B) and conversion efficiency (C) in the gasification and synthesis stages. Within this model domain, coals with lower effective calorific value, typically characterized by higher volatile content and improved reactivity, achieve more complete gasification under optimized thermal and pressure conditions, thereby enhancing the utilization efficiency of input energy. Meanwhile, the relatively lower energy density of such coals reduces process energy input intensity, resulting in higher ERR values when evaluated on a normalized energy basis. From a life-cycle perspective, coal with a lower effective calorific value is often sourced from regions closer to SNG production facilities, which reduces embodied emissions associated with mining and transportation. Consequently, the modeled relationship between the effective calorific value of coal and ERR reflects an integrated thermochemical and system-level interaction rather than a simple linear dependence.

5. Conclusions

This study delved deeply into the carbon emissions during the production of coal-to-Synthetic Natural Gas (SNG), integrating Life Cycle Assessment (LCA) with Box–Behnken Design and Response Surface Methodology (BBD-RSM). The carbon emissions in the coal-to-SNG process exhibit distinct stage-based characteristics. The SNG production stage and the coal mining and washing stage are the main sources of carbon emissions, accounting for 90.48% and 9.38%, respectively. Overall, its carbon emission intensity reaches as high as 660.92 g CO2eq/kWh, only lower than that of traditional coal-fired power generation and far higher than most other energy sources. This quantified data clearly reveals the enormous challenges that coal-to-SNG faces in carbon emission reduction. After optimization using BBD-RSM, the optimal parameter combination for coal-to-SNG production was determined: a raw coal selection rate of 62.5%, an effective calorific value of 16.75 MJ/kg, and a conversion efficiency of 83%. Such optimization highlights the close coupling between coal properties, process parameters, and overall energy efficiency. Under this parameter combination, the energy-based rate of return can reach 49.79%, providing crucial quantitative evidence for emission reduction practices in the coal-to-SNG production industry and indicating a clear direction for the industry’s emission reduction efforts.
These insights carry several policy and industrial implications. First, there is a pressing need to enhance regulatory frameworks and quality standards across the coal supply chain. This includes establishing a standardized coal grading system, clarifying coal usage specifications, and promoting the broader adoption of high-quality commercial coal. Such regulatory improvements should be tailored to regional contexts to avoid blanket approaches that overlook local variations in resource and infrastructure conditions. Second, advancing technological innovation remains a cornerstone for driving transformation in the coal chemical industry. Key areas include the development of cleaner coal utilization technologies, deployment of carbon capture and storage (CCS) systems, and integration of renewable energy to reduce lifecycle emissions. A unified national strategy should be formulated to support these innovations and establish clear technical standards related to energy efficiency and emission performance. Third, consistent government support is essential to accelerate the adoption of low-carbon technologies. Financial incentives, tax relief, and policy subsidies can encourage private-sector investment and stimulate innovation, ultimately diversifying China’s energy portfolio and reducing reliance on coal-to-SNG production. Fourth, the environmental performance of coal-to-SNG projects can be further improved through targeted interventions, such as optimizing water usage, implementing CCS technologies, and improving the operational efficiency of coal preparation and processing systems. In practical operation, adjusting the calorific value of feed coal within a reasonable range can also contribute to emission reduction without compromising gas yield, forming a technical basis for subsequent policy design.
Despite the promising results of parameter optimization, their large-scale application in real production is still influenced by multiple technical and economic factors, including catalyst performance, system integration, and capital investment constraints. Achieving and sustaining a conversion efficiency close to 83% relies on improving heat recovery in gasification, enhancing catalyst durability in methanation, and ensuring stable reaction conditions through precise process control. These improvements are technically feasible with current industrial capabilities but require continuous upgrading and operational refinement. Economically, higher efficiency often entails additional capital investment and operating costs. Although such expenditures may increase initial financial pressure, they can improve overall energy utilization and reduce life-cycle carbon intensity over time. Consequently, the optimized configuration improves the overall energy conversion efficiency to around 49.8%, which substantially enhances process performance and reduces life-cycle carbon intensity compared with conventional conditions. This represents a practical and balanced pathway for decarbonization, particularly in regions rich in low-calorific-value lignite resources, such as Inner Mongolia and Xinjiang. While large-scale carbon capture and storage (CCS) technologies can achieve deeper emission reductions, their high investment cost and energy penalty currently limit widespread deployment. In contrast, process optimization provides a more incremental yet economically viable route toward a low-carbon transition in the coal-to-SNG industry. Future research should refine these optimized parameters through pilot-scale validation, integrate them with emerging clean coal technologies, and establish techno-economic benchmarks for different enterprise scales, while policy implementation can follow a phased approach that combines short-term standard formulation and pilot testing with medium-term incentives and long-term supervision to promote a steady and practical transition toward low-carbon coal-to-SNG development.

Supplementary Materials

The following supporting information can be downloaded at https://www.mdpi.com/article/10.3390/thermo5040047/s1, Table S1: Relevant parameters of gas emission; Table S2: Carbon emissions per unit distance; Table S3: Relevant parameters of coal-to-SNG production.

Author Contributions

Conceptualization, C.Z. and J.H. (Jianli Hao); methodology, C.Z. and J.H. (Ji Han); software, S.Y.; validation, C.Z., J.H. (Jianli Hao) and Y.S.; formal analysis, S.Y. and J.H. (Ji Han); investigation, C.Z.; resources, Y.S.; data curation, S.Y.; writing—original draft preparation, C.Z.; writing—review and editing, L.D.S. and J.H. (Jianli Hao); visualization, S.Y.; supervision, L.D.S.; project administration, J.H. (Jianli Hao); funding acquisition, Y.S. All authors have read and agreed to the published version of the manuscript.

Funding

This research was funded by Xi’an Jiaotong-Liverpool University, grant numbers PGRS (FOSA2212030) and RDS10120240304, and by the Jiangsu Province Engineering Research Center of Construction Carbon Neutral Technology, grant number JZTZH2022-0401.

Data Availability Statement

The author will provide the data for this paper upon request.

Conflicts of Interest

The author declares no conflicts of interest.

References

  1. Nakao, A.; Morlando, D.; Knuutila, H.K. Techno-Economic Assessment of the Multi-Absorber Approach at an Industrial Site with Multiple CO2 Sources. Int. J. Greenh. Gas Control 2025, 142, 104326. [Google Scholar] [CrossRef]
  2. Zhao, W.; Hao, J.L.; Gong, G.; Ma, W.; Zuo, J.; Di Sarno, L. Decarbonizing Prefabricated Building Waste: Scenario Simulation of Policies in China. J. Clean. Prod. 2024, 458, 142529. [Google Scholar] [CrossRef]
  3. Hu, B.; Zhang, B.; Li, Y.; Zhang, J. Towards Carbon Neutrality: Optimizing Generation and Storage Capacities in Germany and Carbon Pricing in China. Sustain. Prod. Consum. 2024, 46, 703–716. [Google Scholar] [CrossRef]
  4. Gao, D.; Qiu, X.; Zheng, X.; Zhang, Y. Life Cycle Analysis of Coal-Based Synthetic Natural Gas for Heat Supply and Electricity Generation in China. Chem. Eng. Res. Des. 2018, 131, 709–722. [Google Scholar] [CrossRef]
  5. Haider, J.; Lee, B.; Choe, C.; Abdul Qyyum, M.; Shiung Lam, S.; Lim, H. SNG Production with Net Zero Outflow of CO2 in an Integrated Energy System: An Energy and Economic Aspects. Energy Convers. Manag. 2022, 270, 116167. [Google Scholar] [CrossRef]
  6. Kreuzer, M.; Sommer, M.; Deffner, V.; Bertke, S.; Demers, P.A.; Kelly-Reif, K.; Laurier, D.; Rage, E.; Richardson, D.B.; Samet, J.M.; et al. Lifetime Excess Absolute Risk for Lung Cancer Due to Exposure to Radon: Results of the Pooled Uranium Miners Cohort Study PUMA. Radiat. Environ. Biophys. 2024, 63, 7–16. [Google Scholar] [CrossRef]
  7. Chyou, Y.P.; Chiu, H.M.; Chen, P.C.; Chien, H.Y.; Wang, T. Coal-Derived Synthetic Natural Gas as an Alternative Energy Carrier for Application to Produce Power—Comparison of Integrated vs. Non-Integrated Processes. Energy 2023, 282, 128958. [Google Scholar] [CrossRef]
  8. Zhang, J.; Chu, B.; Li, Z.; Yan, B. Optimal Design of a Coal-Based Synthetic Natural Gas (SNG) Process with Different Coal Ranks and Gasification Technologies via Techno-Economic Analysis. Chem. Eng. Res. Des. 2022, 183, 150–159. [Google Scholar] [CrossRef]
  9. Wei, D.; Jia, Z.; Sun, Z.; Gao, Y.; Wang, G.; Zeng, L. Process Simulation and Economic Analysis of Calcium Looping Gasification for Coal to Synthetic Natural Gas. Fuel Process. Technol. 2021, 218, 106835. [Google Scholar] [CrossRef]
  10. Chauvy, R.; Dubois, L.; Thomas, D.; De Weireld, G. Environmental Impacts of the Production of Synthetic Natural Gas from Industrial Carbon Dioxide. Sustain. Prod. Consum. 2022, 30, 301–315. [Google Scholar] [CrossRef]
  11. Prasad, V.; Almara, L.M.; Wang, G.-X. Ultra-Long-Distance Transport of Supercritical Natural Gas (SNG) at Very-High Mass Flow Rates via Pipelines through Land, Underground, Water Bodies, and Ocean. Gas Sci. Eng. 2023, 117, 205053. [Google Scholar] [CrossRef]
  12. Djettene, R.; Dubois, L.; Duprez, M.E.; De Weireld, G.; Thomas, D. Integrated CO2 Capture and Conversion into Methanol Units: Assessing Techno-Economic and Environmental Aspects Compared to CO2 into SNG Alternative. J. CO2 Util. 2024, 85, 102879. [Google Scholar] [CrossRef]
  13. Lee, K.; Sun, P.; Elgowainy, A.; Baek, K.H.; Bobba, P. Techno-Economic and Life Cycle Analysis of Synthetic Natural Gas Production from Low-Carbon H2 and Point-Source or Atmospheric CO2 in the United States. J. CO2 Util. 2024, 83, 102791. [Google Scholar] [CrossRef]
  14. Peng, H.T.; Zhang, D.; Zhong, J.T.; Guo, L.F.; Guo, S.Y.; Huang, J.L.; Wang, D.Y.; Miao, C.H.; Zhang, X.L.; Zhang, X.Y. Representative CO2 Emissions Pathways for China’s Provinces toward Carbon Neutrality under the Paris Agreement’s 2 °C Target. Adv. Clim. Change Res. 2024, 15, 1096–1106. [Google Scholar] [CrossRef]
  15. Cormos, C.C.; Dragan, M.; Petrescu, L.; Cormos, A.M.; Dragan, S.; Bathori, A.M.; Galusnyak, S.C. Synthetic Natural Gas (SNG) Production by Biomass Gasification with CO2 Capture: Techno-Economic and Life Cycle Analysis (LCA). Energy 2024, 312, 133507. [Google Scholar] [CrossRef]
  16. Liu, J.; Zhuang, Y.; Wang, C.; Du, J. Life Cycle Carbon Footprint Assessment of Coal-to-SNG/Methanol Polygeneration Process. Sci. Total Environ. 2024, 908, 168409. [Google Scholar] [CrossRef]
  17. Zeng, S.; Gu, J.; Yang, S.; Zhou, H.; Qian, Y. Comparison of Techno-Economic Performance and Environmental Impacts between Shale Gas and Coal-Based Synthetic Natural Gas (SNG) in China. J. Clean. Prod. 2019, 215, 544–556. [Google Scholar] [CrossRef]
  18. Kolb, S.; Plankenbühler, T.; Hofmann, K.; Bergerson, J.; Karl, J. Life Cycle Greenhouse Gas Emissions of Renewable Gas Technologies: A Comparative Review. Renew. Sustain. Energy Rev. 2021, 146, 111147. [Google Scholar] [CrossRef]
  19. Szima, S.; Cormos, C.C. CO2 Utilization Technologies: A Techno-Economic Analysis for Synthetic Natural Gas Production. Energies 2021, 14, 1258. [Google Scholar] [CrossRef]
  20. Zhang, L.; Gao, R.; Wang, L.; Zhang, C.; Jun, K.W.; Kim, S.K.; Zhao, T.; Wan, H.; Guan, G. Carbon-Neutral Light Olefins Production for Energy Decarbonization: Process Development and Techno-Econo-Environmental Analysis. Chem. Eng. J. 2023, 471, 144611. [Google Scholar] [CrossRef]
  21. Goh, B.H.H.; Chong, C.T.; Milano, J.; Tiong, S.K.; Cui, Y.; Ng, J.-H. Response Optimisation of TiO2-Supported Bimetallic NiCo Catalyst for the Cracking and Deoxygenation of Waste Cooking Oil into Jet-Fuel Range Hydrocarbon Fuels under Non-Hydrogen Environment. Energy 2024, 309, 133057. [Google Scholar] [CrossRef]
  22. Zhu, L.; Song, Y.; Chen, H.; Wang, M.; Liu, Z.; Wei, X.; Zhao, C.; Ai, T. Optimization of Power Generation and Sewage Treatment in Stacked Pulsating Gas-Liquid-Solid Circulating Fluidized Bed Microbial Fuel Cell Using Response Surface Methodology. Int. J. Hydrog. Energy 2025, 101, 161–172. [Google Scholar] [CrossRef]
  23. Chahdoura, S.; Bahloul, R.; Tlija, M.; Tahan, A. Multi-Objective Optimization of PLA-FDM Parameters for Enhancement of Industrial Product Mechanical Performance Based on GRA-RSM and BBD. Prog. Addit. Manuf. 2025, 10, 1355–1383. [Google Scholar] [CrossRef]
  24. Chetia, B.; Debbarma, S.; Ahmed, F. Parametric Optimization of Variable Compression Ratio Diesel Engine Run on Waste Cooking Biodiesel with CeO2 Nanoparticles Using Response Surface Methodology (RSM) Technique. Fuel 2025, 389, 134544. [Google Scholar] [CrossRef]
  25. Nazerifard, R.; Mohammadpourfard, M.; Heris, S.Z. Optimization of the Integrated ORC and Carbon Capture Units Coupled to the Refinery Furnace with the RSM-BBD Method. J. CO2 Util. 2022, 66, 102289. [Google Scholar] [CrossRef]
  26. Bhatia, P.; Cummis, C.; Draucker, L.; Rich, D.; Lahd, H.; Brown, A. Greenhouse Gas Protocol Product Life Cycle Accounting and Reporting Standard; World Resources Institute: Washington, DC, USA, 2011. [Google Scholar]
  27. ISO 14067:2018(En), Greenhouse Gases—Carbon Footprint of Products—Requirements and Guidelines for Quantification. Available online: https://www.iso.org/obp/ui/en/#iso:std:iso:14067:ed-1:v1:en (accessed on 18 September 2024).
  28. PAS 2050:2011; Specification for the Assessment of the Life Cycle Greenhouse Gas Emissions of Goods and Services. BSI British Standards Institution: London, UK, 2011.
  29. Hao, J.L.; Zhao, W.; Gong, G.; Ma, W.; Li, L.; Zhang, Y. Catalyzing Sustainability through Prefabrication: Integrating BIM-LCA for Assessing Embodied Carbon in Timber Formwork Waste. Sustain. Chem. Pharm. 2024, 41, 101698. [Google Scholar] [CrossRef]
  30. Huo, J.; Yang, D.; Xia, F.; Tang, H.; Zhang, W. Feasibility Analysis and Policy Recommendations for the Development of the Coal Based SNG Industry in Xinjiang. Energy Policy 2013, 61, 3–11. [Google Scholar] [CrossRef]
  31. Laurier, D.; Marsh, J.W.; Rage, E.; Tomasek, L. Miner Studies and Radiological Protection against Radon. Ann. ICRP 2020, 49, 57–67. [Google Scholar] [CrossRef]
  32. Wang, X.; Sun, X.; Ahmad, M.; Zhang, H. Does Low Carbon Energy Transition Impede Air Pollution? Evidence from China’s Coal-to-Gas Policy. Resour. Policy 2023, 83, 103723. [Google Scholar] [CrossRef]
  33. Gianoutsos, N.J.; Haase, K.B.; Birdwell, J.E. Geologic Sources and Well Integrity Impact Methane Emissions from Orphaned and Abandoned Oil and Gas Wells. Sci. Total Environ. 2024, 912, 169584. [Google Scholar] [CrossRef] [PubMed]
  34. Yeo, Y.; Yoo, T.; Yoo, S.; Ahn, Y.H. 2050 Net-Zero Scenarios and Well-to-Wheel Greenhouse Gas Emissions Assessment of South Korea’s Road Sector. J. Clean. Prod. 2025, 492, 144809. [Google Scholar] [CrossRef]
  35. Boothroyd, I.M.; Almond, S.; Worrall, F.; Davies, R.K.; Davies, R.J. Assessing Fugitive Emissions of CH4 from High-Pressure Gas Pipelines in the UK. Sci. Total Environ. 2018, 631–632, 1638–1648. [Google Scholar] [CrossRef] [PubMed]
  36. Feng, D.; Zhang, W.; Li, Y.; Zhang, Y.; Zhang, Z.; Zhao, Y.; Gao, J.; Sun, S. Study on Biochar and Silicon Co-Production Technology of Rice Husk Based on the New Ammonia CO2 Capture Method and Its Comprehensive Benefits. Sustain. Energy Technol. Assess. 2023, 60, 103558. [Google Scholar] [CrossRef]
  37. Tsuchiya, Y.; Swai, T.A.; Goto, F. Energy Payback Time Analysis and Return on Investment of Off-Grid Photovoltaic Systems in Rural Areas of Tanzania. Sustain. Energy Technol. Assess. 2020, 42, 100887. [Google Scholar] [CrossRef]
  38. Yu, X.; Tan, C. China’s Process-Related Greenhouse Gas Emission Dataset 1990–2020. Sci Data 2023, 10, 55. [Google Scholar] [CrossRef]
  39. Martínez-López, A.; Ballester-Falcón, P.; Mazorra-Aguiar, L.; Marrero, A. Solar Photovoltaic Systems for the Short Sea Shipping’s Compliance with Decarbonization Regulations in the European Union. Sustain. Energy Technol. Assess. 2023, 60, 103506. [Google Scholar] [CrossRef]
  40. Xing, W.; Tam, V.W.; Le, K.N.; Hao, J.L.; Wang, J. Life Cycle Assessment of Sustainable Concrete with Recycled Aggregate and Supplementary Cementitious Materials. Resour. Conserv. Recycl. 2023, 193, 106947. [Google Scholar] [CrossRef]
  41. Li, H.; Yang, S.; Zhang, J.; Qian, Y. Coal-Based Synthetic Natural Gas (SNG) for Municipal Heating in China: Analysis of Haze Pollutants and Greenhouse Gases (GHGs) Emissions. J. Clean. Prod. 2016, 112, 1350–1359. [Google Scholar] [CrossRef]
  42. Li, J.; Tian, Y.; Zhang, Y.; Xie, K. Assessing Spatially Multistage Carbon Transfer in the Life Cycle of Energy with a Novel Multi-Flow and Multi-Node Model: A Case of China’s Coal-to-Electricity Chain. J. Clean. Prod. 2022, 339, 130699. [Google Scholar] [CrossRef]
  43. MTPRC. Transport Industry Development Statistical Bulletin 2016; MTPRC: Beijing, China, 2017. [Google Scholar]
  44. Li, J.; Zhang, Y.; Tian, Y.; Cheng, W.; Yang, J.; Xu, D.; Wang, Y.; Xie, K.; Ku, A.Y. Reduction of Carbon Emissions from China’s Coal-Fired Power Industry: Insights from the Province-Level Data. J. Clean. Prod. 2020, 242, 118518. [Google Scholar] [CrossRef]
  45. IPCC. 2006 IPCC Guidelines for National Greenhouse Gas Inventories; Intergovernmental Panel on Climate Change: Geneva, Switzerland, 2006. [Google Scholar]
  46. Stocker, T.F. IPCC Climate Change 2013: The Physical Science Basis; Cambridge University Press: Cambridge, UK, 2013. [Google Scholar]
  47. Haran, S.; Rao, A.B.; Banerjee, R. Life Cycle Energy-Carbon-Water Footprint Assessment of an Existing Coal Power Plant Retrofitted with Calcium Looping (CaL) Based CCS System. Int. J. Greenh. Gas Control 2023, 130, 104015. [Google Scholar] [CrossRef]
  48. Wolf, N.; Kühn, L.; Höck, M. International Supply Chains for a Hydrogen Ramp-up: Techno-Economic Assessment of Hydrogen Transport Routes to Germany. Energy Convers. Manag. X 2024, 23, 100682. [Google Scholar] [CrossRef]
  49. Chauvy, R.; Verdonck, D.; Dubois, L.; Thomas, D.; De Weireld, G. Techno-Economic Feasibility and Sustainability of an Integrated Carbon Capture and Conversion Process to Synthetic Natural Gas. J. CO2 Util. 2021, 47, 101488. [Google Scholar] [CrossRef]
  50. Cong, N.; Song, Y.; Zhang, M.; Wu, W. Life Cycle Assessment of Carbon Reduction Potential of EoL Wind Turbine Blades Disposal Scenarios in China. Environ. Impact Assess. Rev. 2023, 100, 107072. [Google Scholar] [CrossRef]
  51. Li, H.; Jiang, H.-D.; Dong, K.-Y.; Wei, Y.-M.; Liao, H. A Comparative Analysis of the Life Cycle Environmental Emissions from Wind and Coal Power: Evidence from China. J. Clean. Prod. 2020, 248, 119192. [Google Scholar] [CrossRef]
  52. Wang, L.; Wang, Y.; Du, H.; Zuo, J.; Yi Man Li, R.; Zhou, Z.; Bi, F.; Garvlehn, M.P. A Comparative Life-Cycle Assessment of Hydro-, Nuclear and Wind Power: A China Study. Appl. Energy 2019, 249, 37–45. [Google Scholar] [CrossRef]
  53. Li, J.; Li, S.; Wu, F. Research on Carbon Emission Reduction Benefit of Wind Power Project Based on Life Cycle Assessment Theory. Renew. Energy 2020, 155, 456–468. [Google Scholar] [CrossRef]
  54. Zhao, X.; Cai, Q.; Zhang, S.; Luo, K. The Substitution of Wind Power for Coal-Fired Power to Realize China’s CO2 Emissions Reduction Targets in 2020 and 2030. Energy 2017, 120, 164–178. [Google Scholar] [CrossRef]
  55. Malode, S.; Prakash, R.; Mohanta, J.C. Sustainability Assessment of Rooftop Solar Photovoltaic Systems: A Case Study. Environ. Impact Assess. Rev. 2024, 108, 107609. [Google Scholar] [CrossRef]
  56. Marashli, A.; Gasaymeh, A.M.; Shalby, M. Comparing the Global Warming Impact from Wind, Solar Energy, and Other Electricity Generating Systems through Life Cycle Assessment Methods (A Survey). Int. J. Renew. Energy Res. 2022, 12, 899–920. [Google Scholar] [CrossRef]
  57. Pu, Y.; Wang, P.; Wang, Y.; Qiao, W.; Wang, L.; Zhang, Y. Environmental Effects Evaluation of Photovoltaic Power Industry in China on Life Cycle Assessment. J. Clean. Prod. 2021, 278, 123993. [Google Scholar] [CrossRef]
  58. Tawalbeh, M.; Al-Othman, A.; Kafiah, F.; Abdelsalam, E.; Almomani, F.; Alkasrawi, M. Environmental Impacts of Solar Photovoltaic Systems: A Critical Review of Recent Progress and Future Outlook. Sci. Total Environ. 2021, 759, 143528. [Google Scholar] [CrossRef]
  59. Gao, C.; Na, H.; Song, K.; Dyer, N.; Tian, F.; Xu, Q.; Xing, Y. Environmental Impact Analysis of Power Generation from Biomass and Wind Farms in Different Locations. Renew. Sustain. Energy Rev. 2019, 102, 307–317. [Google Scholar] [CrossRef]
  60. Guidi, G.; Violante, A.C.; De Iuliis, S. Environmental Impact of Electricity Generation Technologies: A Comparison between Conventional, Nuclear, and Renewable Technologies. Energies 2023, 16, 7847. [Google Scholar] [CrossRef]
  61. Mello, G.; Ferreira Dias, M.; Robaina, M. Wind Farms Life Cycle Assessment Review: CO2 Emissions and Climate Change. Energy Rep. 2020, 6, 214–219. [Google Scholar] [CrossRef]
  62. O’Sullivan, M.; Gravatt, M.; Popineau, J.; O’Sullivan, J.; Mannington, W.; McDowell, J. Carbon Dioxide Emissions from Geothermal Power Plants. Renew. Energy 2021, 175, 990–1000. [Google Scholar] [CrossRef]
  63. Paulillo, A.; Striolo, A.; Lettieri, P. The Environmental Impacts and the Carbon Intensity of Geothermal Energy: A Case Study on the Hellisheiði Plant. Environ. Int. 2019, 133, 105226. [Google Scholar] [CrossRef]
  64. Foong, S.Y.; Chan, Y.H.; Yek, P.N.Y.; Lock, S.S.M.; Chin, B.L.F.; Yiin, C.L.; Lan, J.C.-W.; Lam, S.S. Microwave-Assisted Pyrolysis in Biomass and Waste Valorisation: Insights into the Life-Cycle Assessment (LCA) and Techno-Economic Analysis (TEA). Chem. Eng. J. 2024, 491, 151942. [Google Scholar] [CrossRef]
  65. Wu, T.; Liu, K.; Cheng, X.; Zhang, J. Analysis of Energy, Carbon Emissions and Economics during the Life Cycle of Biomass Power Generation: Case Comparison from China. Biomass Bioenergy 2024, 182, 107098. [Google Scholar] [CrossRef]
  66. Song, Q.; Wang, Z.; Li, J.; Duan, H.; Yu, D.; Liu, G. Comparative Life Cycle GHG Emissions from Local Electricity Generation Using Heavy Oil, Natural Gas, and MSW Incineration in Macau. Renew. Sustain. Energy Rev. 2018, 81, 2450–2459. [Google Scholar] [CrossRef]
  67. Rasheed, R.; Javed, H.; Rizwan, A.; Sharif, F.; Yasar, A.; Tabinda, A.B.; Ahmad, S.R.; Wang, Y.; Su, Y. Life Cycle Assessment of a Cleaner Supercritical Coal-Fired Power Plant. J. Clean. Prod. 2021, 279, 123869. [Google Scholar] [CrossRef]
  68. Tao, Y.; Brander, M. A Comparative Prospective Life Cycle Assessment of Coal-Fired Power Plants in the US with MEA/MOF-Based Carbon Capture. J. Clean. Prod. 2024, 456, 142418. [Google Scholar] [CrossRef]
  69. Wang, N.; Ren, Y.; Zhu, T.; Meng, F.; Wen, Z.; Liu, G. Life Cycle Carbon Emission Modelling of Coal-Fired Power: Chinese Case. Energy 2018, 162, 841–852. [Google Scholar] [CrossRef]
  70. Zalazar-Garcia, D.; Román, M.C.; Fernandez, A.; Asensio, D.; Zhang, X.; Fabani, M.P.; Rodriguez, R.; Mazza, G. Exergy, Energy, and Sustainability Assessments Applied to RSM Optimization of Integrated Convective Air-Drying with Pretreatments to Improve the Nutritional Quality of Pumpkin Seeds. Sustain. Energy Technol. Assess. 2022, 49, 101763. [Google Scholar] [CrossRef]
  71. Sabbagh, O.; Fanaei, M.A.; Arjomand, A.; Hossein Ahmadi, M. Multi-Objective Optimization Assessment of a New Integrated Scheme for Co-Production of Natural Gas Liquids and Liquefied Natural Gas. Sustain. Energy Technol. Assess. 2021, 47, 101493. [Google Scholar] [CrossRef]
  72. Lei, Y.; Yin, Z.; Lu, X.; Zhang, Q.; Gong, J.; Cai, B.; Cai, C.; Chai, Q.; Chen, H.; Chen, R.; et al. The 2022 Report of Synergetic Roadmap on Carbon Neutrality and Clean Air for China: Accelerating Transition in Key Sectors. Environ. Sci. Ecotechnology 2024, 19, 100335. [Google Scholar] [CrossRef] [PubMed]
  73. Song, J.; Fan, Y.; Cheng, Z.; Wang, F.; Shi, X.; Yi, H.; Zhang, A.; Dong, Y. Thermodynamic Analysis of an Air Liquid Energy Storage System Coupling Rankine Cycle and Methane Steam Reforming to Improve System Electrical Conversion and Energy Efficiency. Renew. Energy 2023, 219, 119586. [Google Scholar] [CrossRef]
  74. Cenușă, V.-E.; Opriș, I. Design Optimization of Cogeneration Steam Power Plants with Supercritical Parameters. Sustain. Energy Technol. Assess. 2024, 64, 103727. [Google Scholar] [CrossRef]
  75. Tang, J.; Long, Y.; Zhang, L.; Zeng, S.; Tian, S.; Zhang, C. Experimental Study of Coal Rank Effect on Carbon Dioxide Injection to Enhance CBM Recovery. Fuel 2023, 354, 129393. [Google Scholar] [CrossRef]
  76. Emeji, I.C.; Patel, B. Box-Behnken Assisted RSM and ANN Modelling for Biodiesel Production over Titanium Supported Zinc-Oxide Catalyst. Energy 2024, 308, 132765. [Google Scholar] [CrossRef]
  77. Jain, A.; Jyoti Bora, B.; Sharma, P.; Kumar, R.; Jyoti Medhi, B.; Balakrishnan, D.; Senthilkumar, N. Statistical Analysis of Mesua Ferrea Seed Oil Biodiesel Fueled Diesel Engine at Variable Injection Timings Using Response Surface Methodology. Sustain. Energy Technol. Assess. 2023, 60, 103476. [Google Scholar] [CrossRef]
  78. Kumar, R.; Nadda, R.; Kumar, S.; Razak, A.; Sharifpur, M.; Aybar, H.S.; Ahamed Saleel, C.; Afzal, A. Influence of Artificial Roughness Parametric Variation on Thermal Performance of Solar Thermal Collector: An Experimental Study, Response Surface Analysis and ANN Modelling. Sustain. Energy Technol. Assess. 2022, 52, 102047. [Google Scholar] [CrossRef]
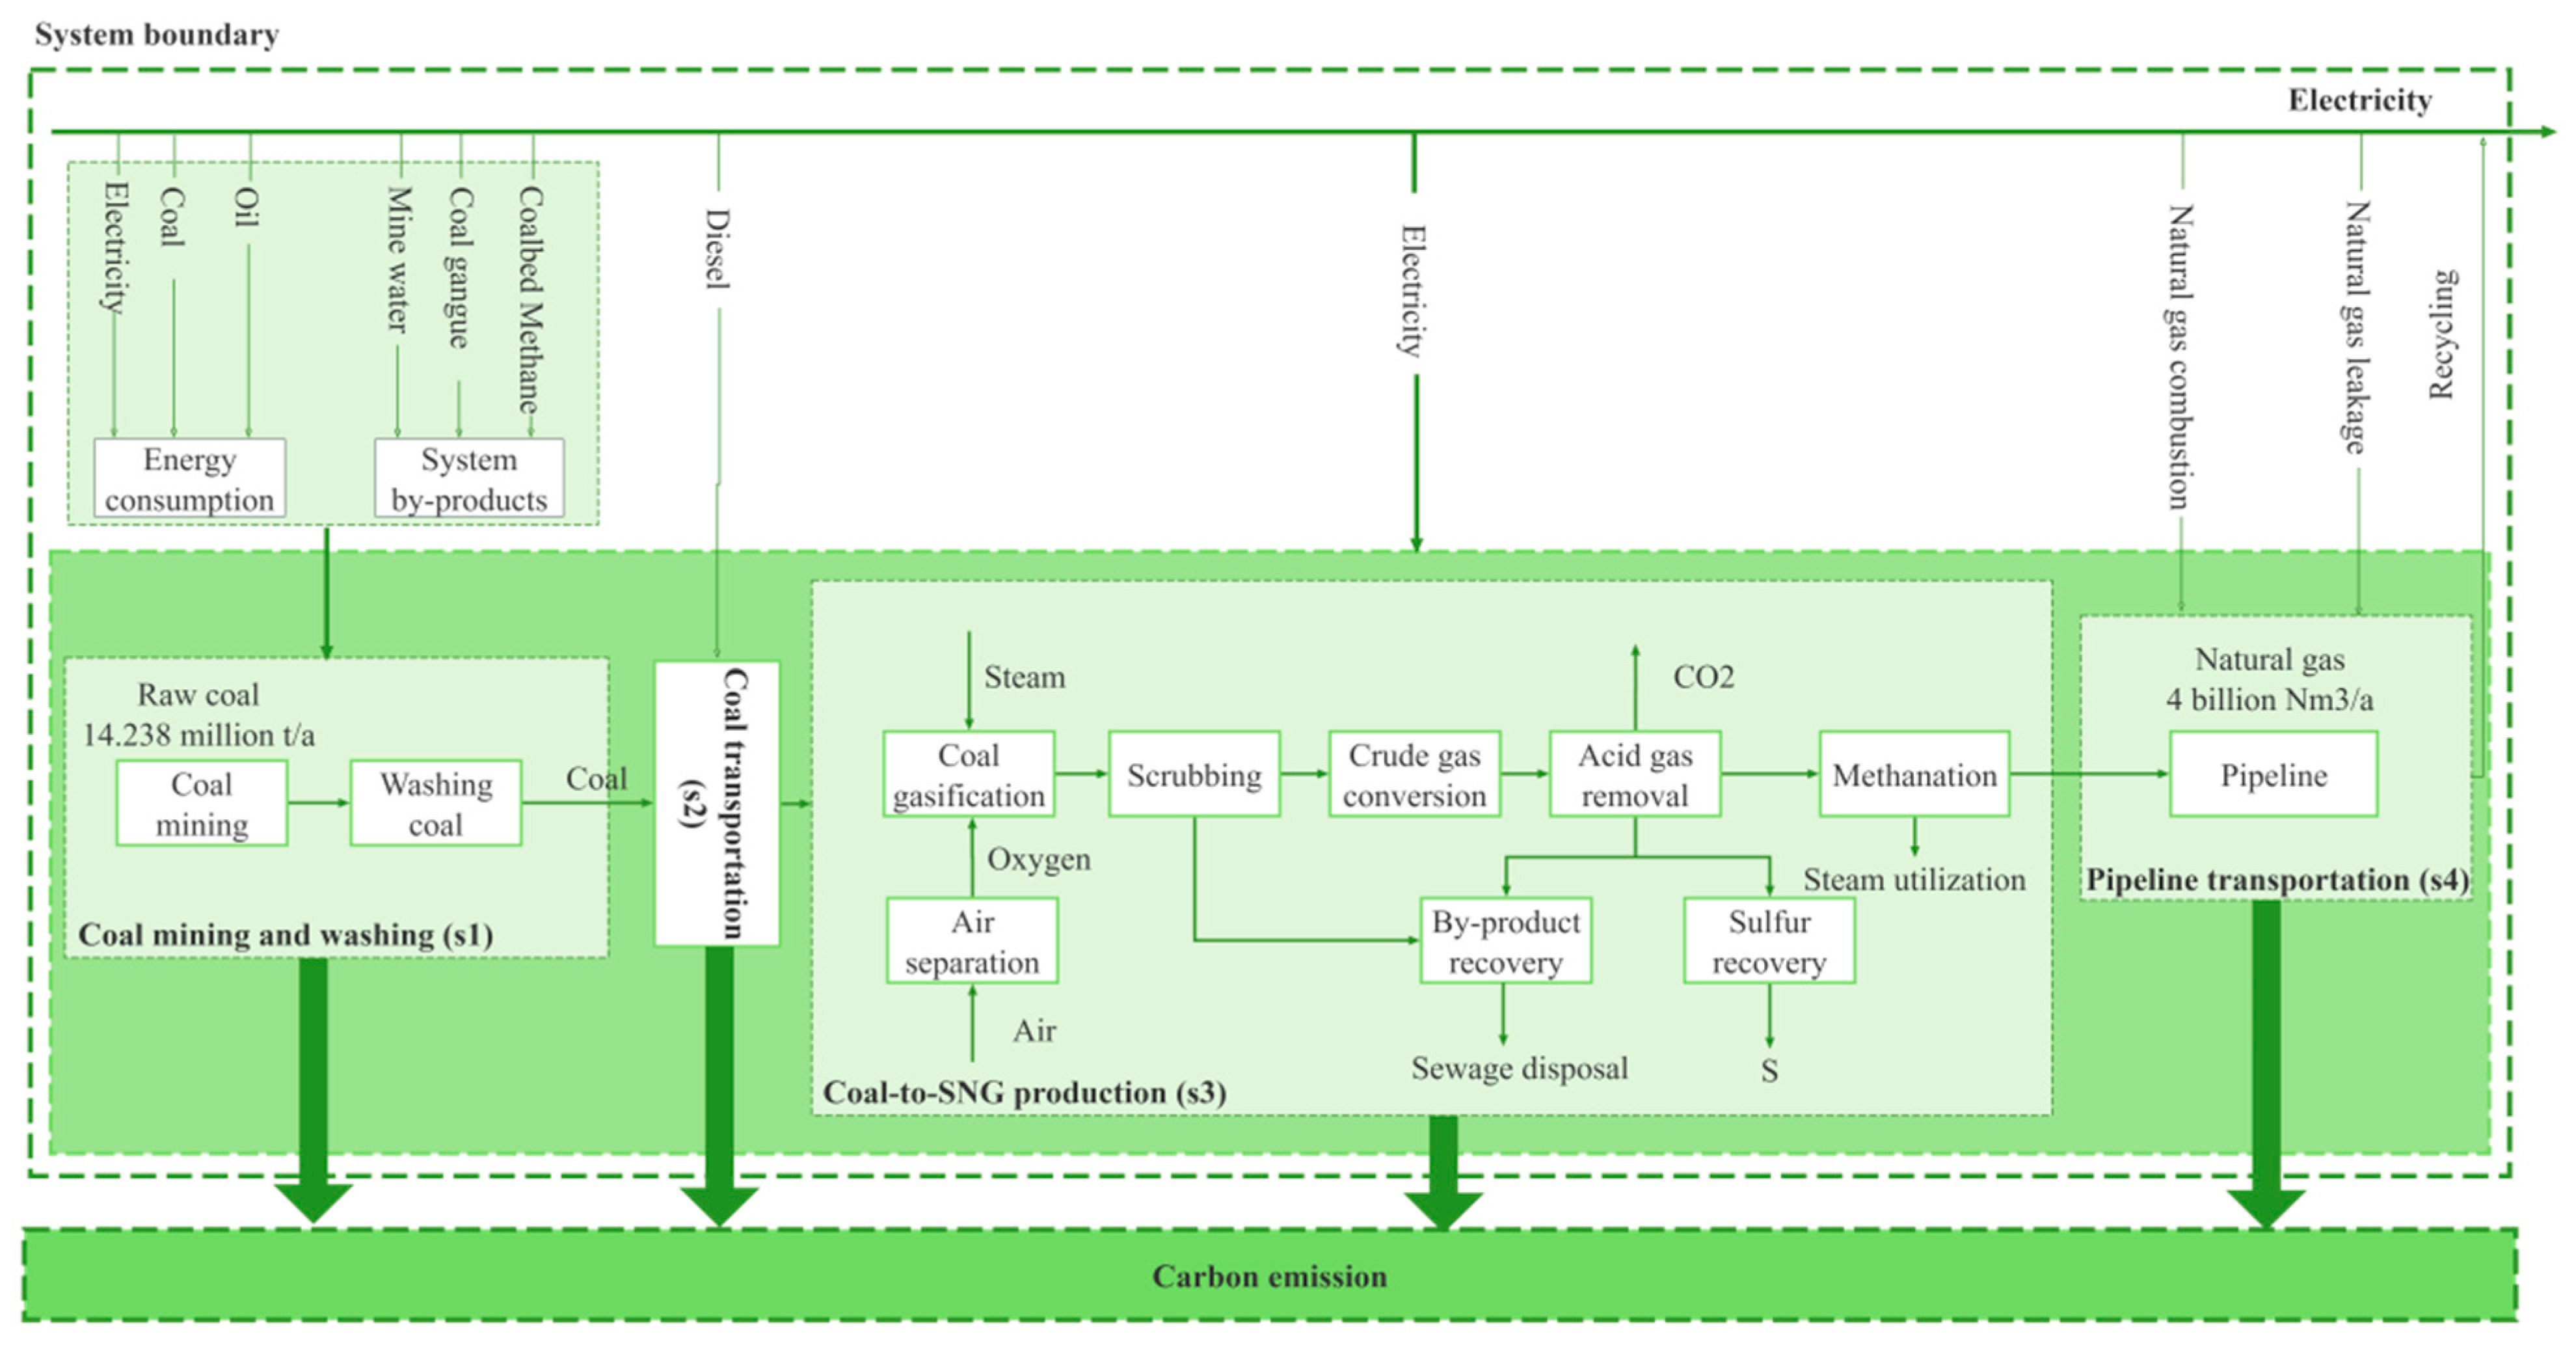
Figure 1. Life cycle system diagram of coal-to-SNG process.
Thermo 05 00047 g001
Figure 2. Life cycle carbon emission intensity of each power generation method.
Thermo 05 00047 g002
Figure 3. Energy-based rate of return residual distribution.
Thermo 05 00047 g003
Figure 4. Three-dimensional plots of interaction effects: (a) A-B interaction effect, (b) A-C interaction effect, and (c) B-C interaction effect.
Thermo 05 00047 g004aThermo 05 00047 g004b
Figure 5. Trend chart of the influence of desirable factors on response value.
Thermo 05 00047 g005
Table 1. Main coal-to-SNG projects in China.
ProjectsInvestment Funds (Billion RMB)Scale (Billion Nm3/a)Approved TimeTime of Putting into ProductionScale in Production (Nm3/a)
Datang Keqi3.44.02009.082013.121.3
Xinjiang Qinghua19.45.52010.082014.121.3
Yili Xintian18.52.02017.052017.032.0
Inner Mongolia Huaxing22.94.02022.04Under construction4.0 (Plan)
Xinjiang Energy30.04.02022.09Under construction4.0 (Plan)
Xinjiang Qinghua Phase II19.45.52023.07Under construction4.0 (Plan)
Xinjiang Tianchi Energy20.04.02023.09Under construction4.0 (Plan)
Xinjiang Qiya Chemical40.06.02023.10Under construction4.0 (Plan)
Yitai Yili Energy2.02.02023.10Under construction4.0 (Plan)
Henan Energy20.04.02023.11Under construction4.0 (Plan)
Table 2. Summary of life cycle carbon emissions of coal-to-SNG process.
StageCarbon Emissions (t)Carbon Intensity (g CO2eq/kWh)Proportion (%)
Coal mining and washing (S1)Coal mining2.48 × 10661.049.38
Coal washing4.38 × 104
Subtotal2.53 × 106
Coal transportation (S2)2.81 × 1040.690.10
Coal-to-SNG production (S3)2.44 × 107598.9490.48
Pipeline transportation (S4)1.02 × 1040.250.04
Total2.69 × 107660.92100
Table 3. Key influence factors and levels.
FactorsLevelsUnit
A: Raw coal selection rate40~85%
B: Effective calorific value of coal16.750~25.120MJ/kg
C: Conversion efficiency of coal-to-SNG50~83%
Table 4. Response surface test design and results.
No.A: Coal Selection Rate (%)B: Effective Calorific Value of Coal (MJ/kg)C: Conversion Efficiency (%)Energy-Based Rate of Return (%)
162.525.1501.12
28525.166.51.55
34025.166.51.62
462.525.1832.06
58520.935020.02
64020.935020.12
762.520.9366.520.73
862.520.9366.520.73
962.520.9366.520.73
1062.520.9366.520.73
1162.520.9366.520.73
128520.938321.35
134020.938321.45
148516.7566.548.7
1562.516.755047.77
164016.7566.548.85
1762.516.758349.79
Table 5. Variance analysis for the regression model.
SourceSum of SquaresdfMean SquareF-Valuep-ValueSignificance
Model4541.99504.663.10 × 105<0.0001**
A0.021110.021112.970.0087*
B4453.8914453.892.74 × 106<0.0001**
C3.9313.932414.92<0.0001**
AB0.001610.00160.95810.3603
AC1.00 × 10−611.00 × 10−60.00060.9809
BC0.288910.2889177.41<0.0001**
A21.05 × 10−611.05 × 10−60.00060.9804
B283.28183.2851,137.71<0.0001**
C20.000110.00010.04140.8446
Residual0.011470.0016
Lack of Fit0.011430.0038
Pure Error040
Cor Total4541.9216
Note: * indicates the significant impact (p < 0.05); ** Indicates the extremely significant impact (p < 0.01).
Table 6. Optimized mix ratio and verification results.
NumberRecommended ParameterTheoretical Energy-Based Rate of Return (%)Actual Energy-Based Rate of Return (%)
A: Coal Selection Rate (%)B: Effective Calorific Value of Coal (MJ/kg)C: Conversion Efficiency (%)
162.5016.7583.0049.7549.79
285.0016.7566.5048.7048.70
348.0916.8572.1148.3648.32
462.5016.7550.0047.8147.77
582.2116.9965.6046.8346.72
Disclaimer/Publisher’s Note: The statements, opinions and data contained in all publications are solely those of the individual author(s) and contributor(s) and not of MDPI and/or the editor(s). MDPI and/or the editor(s) disclaim responsibility for any injury to people or property resulting from any ideas, methods, instructions or products referred to in the content.