Article

Optimization of Cogeneration Supercritical Steam Power Plant Design Based on Heat Consumer Requirements

by
Victor-Eduard Cenușă
and
Ioana Opriș
*
Department of Power Generation and Use, Faculty of Energy Engineering, National University of Science and Technology POLITEHNICA Bucharest, RO-060042 Bucharest, Romania
*
Author to whom correspondence should be addressed.
Thermo 2025, 5(3), 29; https://doi.org/10.3390/thermo5030029
Submission received: 2 July 2025 / Revised: 1 August 2025 / Accepted: 7 August 2025 / Published: 10 August 2025

Abstract

High-efficiency design solutions for cogeneration steam power plants are studied for different steam consumer requirements (steam pressures between 3.6 and 40 bar and heat flow rates between 10 and 40% of the fuel heat flow rate into the steam generators). Using a genetic algorithm, optimum designs for schemes with extraction-condensing steam turbines, reheat, and supercritical parameters were found considering four objective functions (high global efficiency, low specific investment in equipment, high exergetic efficiency, and high power-to-heat ratio in full cogeneration mode). A second Pareto front was computed from the prior solutions, considering the first two objective functions, resulting in the high-efficiency cogeneration schemes with a primary energy savings (PES) ratio higher than 10%. The results showed that the PES ratio depends strongly on the steam consumer requirements, rising from values under 10% for low heat flow rates and few preheaters to over 25% for a higher number of preheaters, high heat flow rates, and low steam pressures to the consumer. At the same heat flow rate to the consumer, the power-to-heat ratio in full cogeneration mode increases with the decrease in the required steam pressure to the consumer.

1. Introduction

The high interest in increasing energy efficiency production and in lowering the negative impact on the environment (decreasing the greenhouse gas emissions and lowering the fuel consumption) has led to the use of combined heat and power (CHP) plants. CHP units are considered in the 2012/27/EU Directive [1,2] by the promotion of high-efficiency cogeneration, CHP units having at least 10% primary energy savings compared to reference values of separate heat and electricity production. To obtain energy savings, several possible solutions are available: cogeneration by using gas turbines with conventional fuel [3], CHP plants by using steam turbines [4,5], and integration of biomass gasification [6], the integration of solar energy or biomass within regenerative Rankine cycles [7,8]. Also, the carbon capture technology was integrated into cogeneration power plants [9,10]. The recovery of the waste heat from engines [11] or from nuclear power plants [12] was also studied. Complex distributed cogeneration systems using solid oxide fuel cells, gas turbines, steam turbines, and heat exchangers are analyzed in [13].
In cogeneration units, the steam consumer’s quantitative and qualitative parameters depend on the steam consumer’s requirements. Usually, lower steam pressures are needed for urban consumers (heating and hot water), while possibly higher steam pressures are used by industrial steam consumers, depending on the needs of each specific industry. Examples of industries that use cogeneration units with steam turbines include the sugarcane and alcohol industry [4,14,15,16], the ethylene industry [17], the pulp and paper industry [18], water desalination [19], etc. Most cogeneration units use backpressure or extraction-condensing steam turbines without steam reheating. In case of extraction-condensing steam turbines, according to the heat requirements of urban or industrial steam consumers (steam pressure and temperature, specific steam mass flow rate), steam is extracted from the steam turbine before its complete expansion, thus reducing the electricity produced by the CHP unit [20]. The optimization of CHP units is needed and should focus on the increase in global efficiency, the increase in exergetic efficiency, and the increase in the power-to-heat ratio in full cogeneration mode. Also, according to the 2012/27/EU Directive [1], the primary energy saving compared to the separate production of heat and power is an important characteristic of CHP units that should be analyzed. Several complex energy–exergy, exergy–economic–environmental, and thermo-economic optimizations of CHP units are studied within the scientific literature [13,19,21,22]. In [15], it is shown that the integration of exergy and pinch analyses is necessary for the integration of steam turbine cogeneration systems.
Dedicated software, like AspenPlus, TRNSYS, EBSILON, SEpro, etc., was used to study and improve the performance of cogeneration power plants, along with genetic algorithms or neural networks. Thus, to predict the performance of a CHP unit, Ref. [6] used AspenPlus and a neural network model based on particle swarm optimization. For a 300 MW cogeneration unit, Ref. [10] also used AspenPlus to optimize the full heat recovery integration of a sodium-based carbon capture system. A solar-biomass driven cogeneration system in the Canary Islands was optimized in [23] by using the Multi-Objective Grasshopper Optimization Algorithm. A modified neural network combining Boolean mapping with a cutting-edge feed-forward algorithm was used by [24] to study isolated systems that include renewable energy. The TRNSYS software was used by [5] to analyze the performance of a cogeneration power plant, which was integrated with a solar system. The Modelica/DYMOLA platform was used in [25] to model a 300 MW drum-type boiler and allow efficient dynamic operation. Other examples of software used for technical and economic optimization are IPSEpro [26,27] and EBSILON [28,29]. Also, the ProSimPlus process simulator was used by [16] for the exergy analysis.
In the scientific literature, the focus is mainly on cogeneration units with steam turbines without reheat and subcritical parameters. There are a few studies that analyze cogeneration supercritical steam power plants with reheat. Also, these studies analyze specific schemes without considering the optimization of the design and the influence of the steam consumer requirements on the design solutions.
This study focuses on steam turbine cogeneration cycles with supercritical parameters and extraction-condensing steam turbines. To meet the gap in the scientific literature, this study identifies the optimum design solutions that should be considered to deliver heat at the pressure and heat flow rate required by a steam consumer. To this end, the schemes with the highest global efficiency and lowest investment were selected from a set of four objective Pareto solutions (maximized global efficiency, exergetic efficiency, power-to-heat ratio in full cogeneration mode, and minimized specific investment in equipment).
The objective of this study was to extract from the optimum schemes those schemes that meet the condition of high-efficiency cogeneration (primary energy saving over 10% [1]). The scope of this paper is to study the influence of the main parameters of the steam cycle, as well as the cycle design, on the primary energy saving ratio value.

2. Thermodynamic Cycle

The scheme of the thermodynamic cycle of supercritical steam cogeneration power plants considered in this study is shown in Figure 1.
It contains the following main components:
  • The steam generator (SG), which comprises two main parts: the main part of the SG (mainSG), which generates steam with supercritical parameters, and the steam reheater (RH), where steam is reheated after its expansion in the first cylinder of the turbine.
  • The steam turbine (ST) and the electrical generator (EG). The ST has three distinct cylinders through which steam passes and expands, namely the high-, intermediate-, and low-pressure turbines (HPTs, IPTs, LPTs). All these cylinders contain one or more steam extractions that provide steam to the preheating system and the steam consumer. This study considers HPTs with steam extraction. However, the number of steam extractions from IPTs and LPTs is variable, depending on the preheating system design optimization. In the electrical generator (EG), mechanical energy is transformed into electrical energy.
  • The condenser (C) condenses the steam that exits the LPTs into water by using a cooling water circuit. The condensing pressure is below the atmospheric pressure to maximize the steam expansion in the ST.
  • The steam consumer (SC) requires a specific heat flow rate with specific steam parameters. To ensure this requirement, the ST should have a steam extraction whose position from the ST depends on the steam pressure to the SC.
  • The preheating system. Feedwater is heated through a series of low-pressure heaters (LPHs), a deaerator (D), and a series of high-pressure heaters (HPHs). Steam for the preheating system is extracted from the ST. The condensate from the HPHs is carried in cascade toward D, and the condensate from the LPHs is carried in cascade toward C.
  • Electrical pumps. There are the following electrical pumps along the thermodynamic circuit: the condensate pumps (CPs), which introduce the condensate into the LPHs and send it toward D, and the feedwater pumps (FWPs), which send the feedwater through the HPHs toward the SG.

3. Materials and Methods

The design schemes of supercritical condensing steam turbines and steam reheat are analyzed and optimized by using a genetic algorithm. For given heat requirements to a steam consumer, the main parameters and the main characteristics of the thermodynamic cycle scheme that allows the highest global efficiency with the lowest specific investment in equipment are optimized. Moreover, schemes with high-efficiency cogeneration are indicated. The multi-criterion optimization is based on the methodology described in [30] and the Non-Dominated Sorting Genetic Algorithm 2 (NSGA-II).

3.1. Input Data, Assumptions, and Restrictions

The input data used in the model of the thermodynamic cycle schemes (Figure 1) are given in Table 1.
Besides the input data in Table 1, which were varied during simulation, there are also design data (equipment, connections), design computing options (if some design conditions are imposed or not), constant values, restrictions, and assumptions. The key restrictions and assumptions considered by the model are as follows [20,30,31,32]:
  • For the steam generator, the use of the same known fuel, with a given heat flow rate of fuel (QSG); the efficiency of the SG is constant (0.95).
  • For the steam turbine, there is a bleed steam in the HPT; the steam quality at the LPT exit must be higher than the minimum accepted value (0.88).
  • For the electrical generator, the mechanical efficiency of the turbine and electrical generator (ηmg) depends on the internal power of the ST.
  • For the condenser, the condenser steam pressure (pc) is an input parameter (Table 1), which varies within a given interval.
  • For the steam consumer, the steam pressure at the SC and the heat flow rate at the SC are input values (Table 1), modified according to the SC requirements. The SC condensate is replaced by the supply water at the condenser (C).
  • For the preheating system, equal temperature increases in preheaters, lower than the maximum imposed value of 32 °C (except for preheaters next to the SC); use of the lowest number of preheaters; the number of HPHs should not exceed the number of LPHs; the deaerator pressure should be lower than the maximum imposed value (12 bar); steam extraction pressure to preheaters closest to the SC is adjusted to be equal to the SC pressure.
  • For the pumps, the electrical motor overall efficiencies of the pumps are constant (0.85 for the FWP and 0.8 for the CP).

3.2. Modeling Equations

The equipment in Figure 1 (steam generator, steam turbine, pumps, preheating system, condenser) is modelled by the mass and heat balance equations. The main equations [30] that model the thermodynamic cycle are given below.

3.2.1. Steam Generator (SG, SGmain, RH)

The two parts of the SG (mainSG and RH) are calculated separately. The heat flow rate in SGmain, in kW, is given by
Q S G m a i n = F S G h m s h i n S G ,
where Q S G m a i n is in kW; FSG—steam flow rate at the SG exit, in kg/s; hms—main steam specific enthalpy at the SG exit, in kJ/kg; and hinSG—feed water specific enthalpy in the SG, in kJ/kg;
The heat flow rate in the RH depends on which cylinder the SC is fed from. Thus, if the SC is fed from the HPT, Q R H , in kW, is
Q R H = F S G F o u t H P T F b s F S C h i n R H h o u t R H ,
where FoutHPT—preheating steam flow rate from the HPT exit, in kg/s; Fbs—bleed steam flow rate from the HPT to the last HPH, in kg/s; FSC—steam flow rate to the SC, in kg/s; hinRH—specific enthalpy of steam at the RH input, in kJ/kg; and houtRH—specific enthalpy of steam at the RH output, in kJ/kg.
If the SC is fed after the HPT (from the IPT or LPT), Q R H , in kW, is given by
Q R H = F S G F o u t H P T F b s h i n R H h o u t R H .
The heat flow rate produced in the entire SG, in kW, is obtained by summing the heat flow rate in SGmain (Equation (1)) and in the RH (Equation (2) or Equation (3)):
Q o u t S G = Q S G m a i n + Q R H = η S G Q S G   ,
where Q o u t S G —heat flow rate produced in the SG, in kW; QSG—fuel heat flow rate in the SG, in kW; and ηSG—SG efficiency.

3.2.2. Steam Turbine (ST)

The turbine is divided into several zones. A zone is defined at the entrance of a cylinder up to the first steam extraction, between two consecutive steam extractions, and from the last steam extraction to the exit of the cylinder. Considering that within the ST there are nST zones, the specific steam enthalpy at the output of ST zone k (where k varies between 1 and nST), in kJ/kg, is
h o u t S T k = h i n S T k h i n S T k h t / o u t S T k η S T k ,
where hinSTk—specific steam enthalpy at ST zone k input, in kJ/kg, houtSTk—specific steam enthalpy at ST zone k output, in kJ/kg; h t / o u t T k —theoretical specific enthalpy at exit of zone k, in kJ/kg; and η S T k —isentropic efficiency of the k zone.
The internal power produced by the ST zones k that are upstream of the steam extraction to the SC, in kW, is
P S T k = F S T k h i n S T k h o u t S T k ,
and the internal power produced by the ST zones k that are downstream of the steam extraction to the SC, in kW, is
P S T k = F S T k F S C h i n S T k h o u t S T k .
Summing the internal power produced by all ST zones (calculated with Equation (6) or Equation (7)) yields the internal power of the ST, PST, in kW:
P S T = k = 1 n S T P S T k .
Two other important values are calculated for ST, which are subject to optimization:
  • The dimensionless ratio between the reheating pressure and the main steam pressure:
    r p = p r h / p m s ,
  • The difference between the reheat and the main steam temperature, in °C:
    Δ t r h = t r h t m s ,
    where t r h —reheat steam temperature, in °C; t m s —main steam temperature, in °C.

3.2.3. Electrical Generator (EG)

The power at EG, in kW, is given by
P E G = η m g P S T ,
where ηmg—the mechanical-generator assembly efficiency, dimensionless.

3.2.4. Preheating System (HPH, D, LPH) and Condenser (C)

All through the preheating system, the feedwater temperature increases from the saturation temperature at the condenser ( t c , in °C) to t i n S G , the feedwater temperature into SG, in °C. From these, the temperature increase across the preheater, in °C, is calculated as
Δ t p = t i n S G t c / z ,
The energy balance equation on a preheater is
F s / i n h s / i n + F w / i n h w / i n + F c / i n h c / i n = F s / o u t h s / o u t + F w / o u t h w / o u t + F c / o u t h c / o u t ,
where F s / i n , F s / o u t ,—input/output steam mass flow rate, in kg/s; h s / i n , h s / o u t —specific enthalpy of steam, in kJ/kg; F w / i n , F w / o u t —input/output feedwater mass flow rate, in kg/s; h w / i n , h w / o u t —feedwater specific enthalpy, in kJ/kg; F c / i n , F c / o u t —input/output condensate mass flow rate, in kg/s; and h c / i n , h c / o u t —condensate specific enthalpy, in kJ/kg.
The energy balance equation on a preheater is
F s / i n h s / i n + F w / i n h w / i n + F c / i n h c / i n = F w / o u t h w / o u t + F c / o u t h c / o u t ,
where F s / i n —input steam mass flow rate, in kg/s; h s / i n —steam specific enthalpy, in kJ/kg; F w / i n , F w / o u t —input/output feedwater mass flow rate, in kg/s; h w / i n , h w / o u t —input/output feedwater specific enthalpy, in kJ/kg; F c / i n , F c / o u t —input/output condensate mass flow rate, in kg/s; and h c / i n , h c / o u t —condensate specific enthalpy, in kJ/kg.
In Equation (14), the output condensate mass flow rate is
F c / o u t = F s / i n + F c / i n ,
Also, in the specific case of a contact heat exchanger (the deaerator), h w / o u t equals h c / o u t in Equation (14).

3.2.5. Electrical Pumps (FWP, CP)

The electrical motor power of the EP, calculated as the sum of the electrical motor power of the CP ( P C P ) and the electrical motor power of the FWP ( P F W P ), in kW, is
P E P = P C P + P F W P
The electrical motor power of the CP, in kW, is
P C P = F C P h t / o u t C P     h i n C P / η C P ,
where F C P —CP mass flow rate, in kg/s; h t / o u t C P —theoretical output specific enthalpy at the CP, in kJ/kg; h i n C P —input specific enthalpy at the CP, in kJ/kg; and η C P —CP and electrical motor overall efficiency.
Similar to Equation (17), the electrical motor power of the FWP, in kW, is
P F W P = F F W P h t / o u t F W P     h i n F W P / η F W P ,
where F F W P —FWP mass flow rate, in kg/s; h i n F W P , h t / o u t F W P —input/theoretical output specific enthalpy at the FWP, in kJ/kg; and η F W P —FWP and electrical motor overall efficiency.
The design of the cycle results from an iterative computation. Starting from an initial number of preheaters and considering the input parameters, preheaters are added, and the scheme is progressively reconfigured to meet the modeling assumptions and restrictions. Iterations stop when all the mass and heat balance equations are fulfilled simultaneously for all equipment. Thus, the best scheme is found, with the minimum number of preheaters and with the lowest investment.

3.3. Performance Indicators

Once the scheme of the thermohydraulic circuit is set up, the performance of the CHP plant is assessed by the calculation of four energetic, exergetic, and economic performance indicators (Table 2).
Additionally, the primary energy savings (PES) ratio was calculated [1]:
PESratio = [1 − 1/(ηhCHP/ηhREF + ηeCHP/ηeREF)] × 100,
where PESratio—primary energy savings ratio, in percentage; ηhCHP—heat efficiency of the CHP; ηeCHP—electrical efficiency of the CHP; ηhREF—reference efficiency for heat production; and ηeREF—reference efficiency for electricity production. Thermodynamic cycles that have PES over 10% meet the condition of high-efficiency cogeneration and are promoted by the 2012/27/EU Directive [1].
The numerical calculations to compute the model were made under Scilab software [34] by using the XSteam physical water/steam properties [35]. The model was validated in [30] against data from existing power plants in the literature [36,37,38].

3.4. Thermodynamic Cycle Optimization

The objective function consists of optimizing the four performance indicators shown in Table 2:
Objective_function_4 = {ηgl = max; ηex = max; CCHP = max; IsEQ = min},
subject to the model restrictions indicated in Section 3.1.
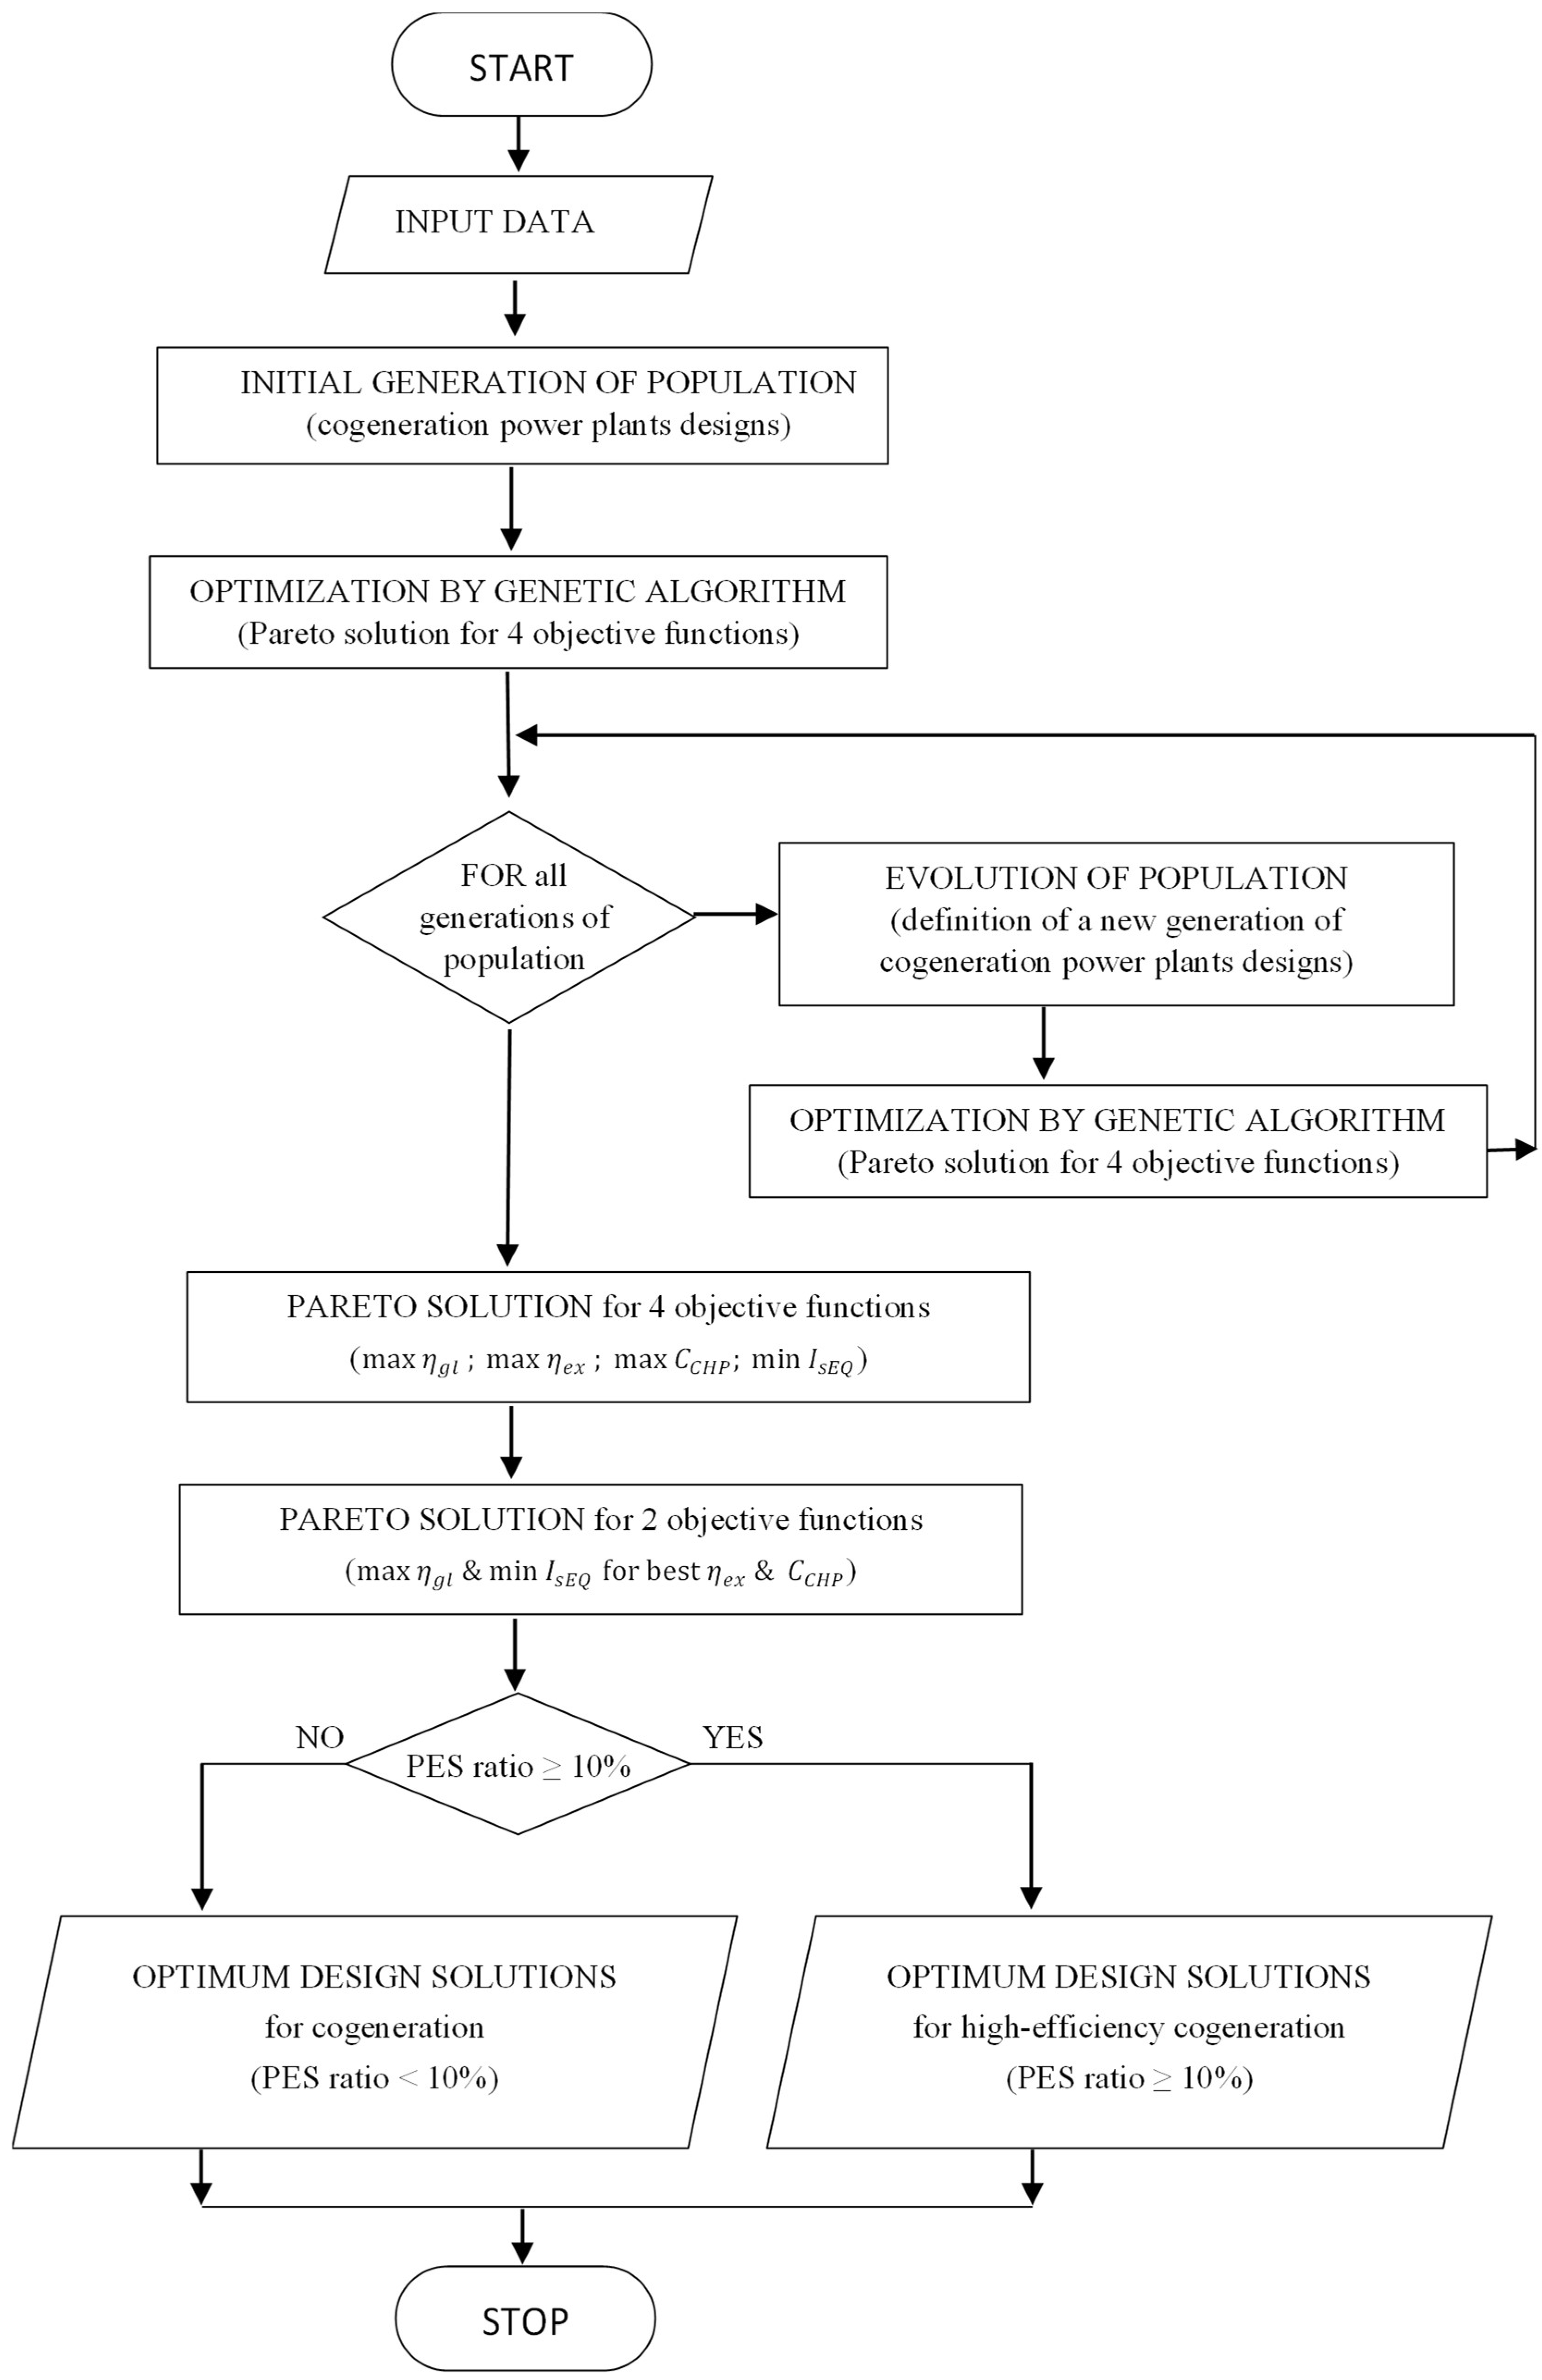
The optimization problem with constraints in Equation (20) is solved by using the Niched Sharing Genetic Algorithm (NSGA II) algorithm [34,39]. The heuristic optimization follows the processes in the flowchart shown in Figure 2. Starting from an initial set of Pareto design solutions that were found for the first generation of population, the evolution to better generations was made by successive operations of mutation and crossover strategies. Only the Pareto solutions of each generation were chosen and saved for further evolution [40,41]. Thus, throughout the evolution from one generation to another, the set of Pareto solutions was successively improved toward the optimum. The optimization program using the NSGA II algorithm was developed under Scilab, by using an initial population of 500, which evolved over 500 generations [32,42].
In Figure 2, the selection of the best design schemes for the thermodynamic cycle was made through three successive steps:
  • Heuristic optimization of the four objective functions, Objective_function_4, shown in Equation (19): the simultaneous maximization of global efficiency, exergetic efficiency, and power-to-heat ratio in full cogeneration mode, and minimization of specific investment in equipment.
  • Two-objective Pareto optimization, chosen from the four objective Pareto solutions, involving simultaneous maximization of global efficiency and minimization of specific investment in equipment:
    Pareto_2/4 = {ηgl = max; ηex = max}.
  • Selection of high-efficiency cogeneration schemes from the two objective Pareto solutions (Equation (21)).
The methodology was used for different SC consumer requirements to highlight the optimized solutions and their corresponding PESratio. The results are presented and discussed in Section 4.

4. Results and Discussion

The genetic algorithm was run for different combinations of heat flow rates to the SC (between 0.1QSG and 0.4QSG) and steam pressures to the SC (between 3.6 and 40 bar). This section contains the input data and the values on the Pareto frontiers (objective functions, corresponding optimum parameters, and chosen design).

4.1. Input Data

Pareto solutions that maximize global efficiency and minimize the specific investment in equipment were searched for thermodynamic cycles schemes (Figure 1) that have the fuel heat flow rate QSG = 1700 MW. The variable input parameters of the cycle that were used by the genetic algorithm are given in Table 3.
The optimization model was run independently for 12 different requirements of the SC (three heat flow rate levels to the SC and four steam pressures at the SC).
The considered values for the heat flow rates to the SC were as follows:
  • Low heat flow rate to the SC: QSC = 0.1QSG = 170 MW;
  • Medium heat flow rate to the SC: QSC = 0.2QSG = 340 MW;
  • High heat flow rate to the SC: QSC = 0.4QSG = 680 MW.
For each of these heat flow rate levels to the SC, four steam pressures to the SC were considered to cover a large range of values: pSC = 3.6 bar, pSC = 12 bar, pSC = 20 bar, and pSC = 40 bar. Hence, the genetic algorithm was run 12 times, resulting in 12 Pareto frontiers for 4 objective functions, which then gave another 12 Pareto frontiers for 2 objective functions. High-efficiency cogeneration Pareto solutions (PESratio over 10%) were put into evidence.
The results of the optimization are grouped into three categories according to the level of the heat flow rate to the SC (low, medium, high) and are presented in Section 4.2, Section 4.3 and Section 4.4. Each category contains all four SC steam pressures (3.6 bar, 12 bar, 20 bar, 40 bar). In Section 4.2, Section 4.3 and Section 4.4, the results on the Pareto frontier and corresponding optimum values of the ratio between reheating and main steam pressure and PESratio are shown. Also, the statistical analysis for the optimum input parameters and for the CHP plant performance indicators (PESratio, ηgl, IsEQ, CCHP, ηex) are computed for the three considered heat flow rates (for QSC = 0.1QSG, QSC = 0.2QSG, and QSC = 0.4QSG).

4.2. Pareto Design Solutions for Low Heat Flow Rate to SC

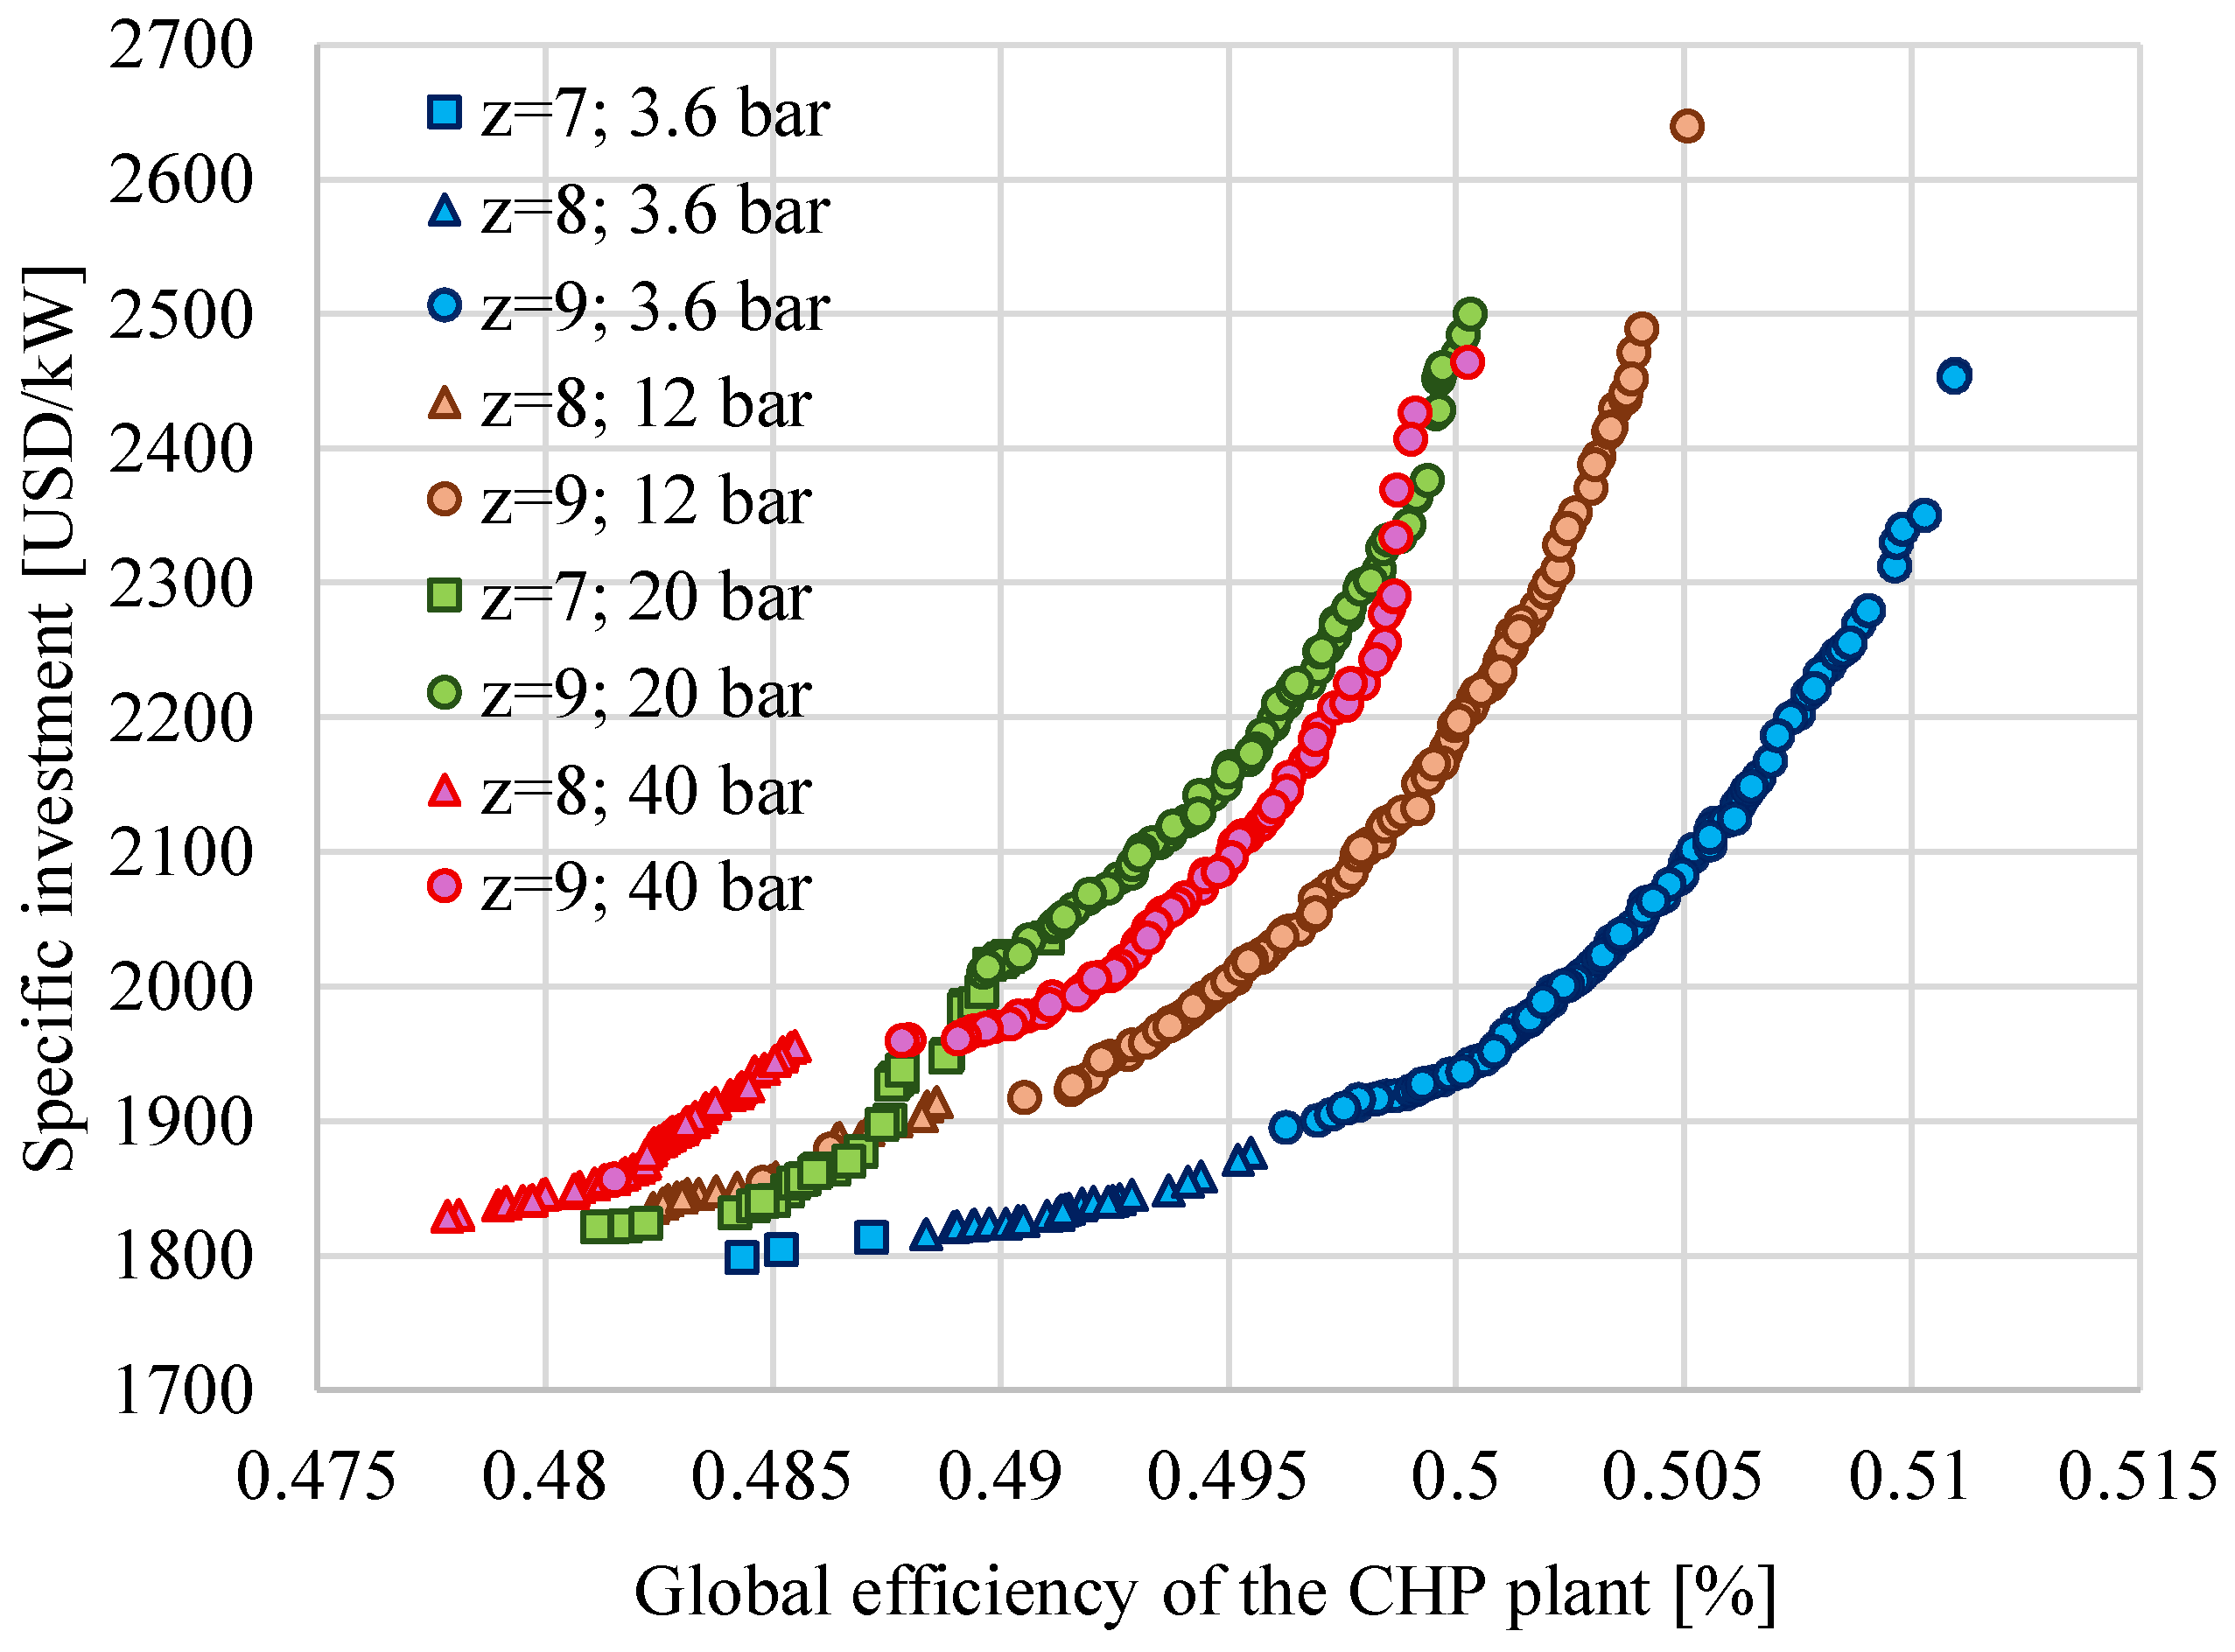
Figure 3 presents the Pareto frontier for a low heat flow rate to the SC (QSC = 0.1QSG), highlighting the steam pressure to the SC with different colors: blue for pSC = 3.6 bar, orange for pSC = 12 bar, green for pSC = 20 bar, and red for pSC = 40 bar. Moreover, the number of preheaters used in each case is indicated by different markers: squares for z = 7, triangles for z = 8, and circles for z = 9. This legend was used in all the following graphs for an easier comparison of data.
In the case of a low heat consumer (QSC = 0.1QSG), ηgl varies between 47.8% and 51.1% (Figure 3), depending on the steam pressure (pSC) of the SC and on the number of preheaters (z). For the same number of preheaters, the increase in pSC (from 3.6 bar to 20 bar) leads to a decrease in ηgl, for the same IsEQ. This happens because the steam flow that is sent to the SC is no longer used to produce work in the turbine. However, if the steam is extracted from the HPT exit or from the HPT bleed (for example for pSC = 40 bar, Figure 3), it is possible that ηgl increases due to the change in conditions, as the steam flow extracted for SC is not entering the steam reheater and it is not receiving heat from the steam generator.
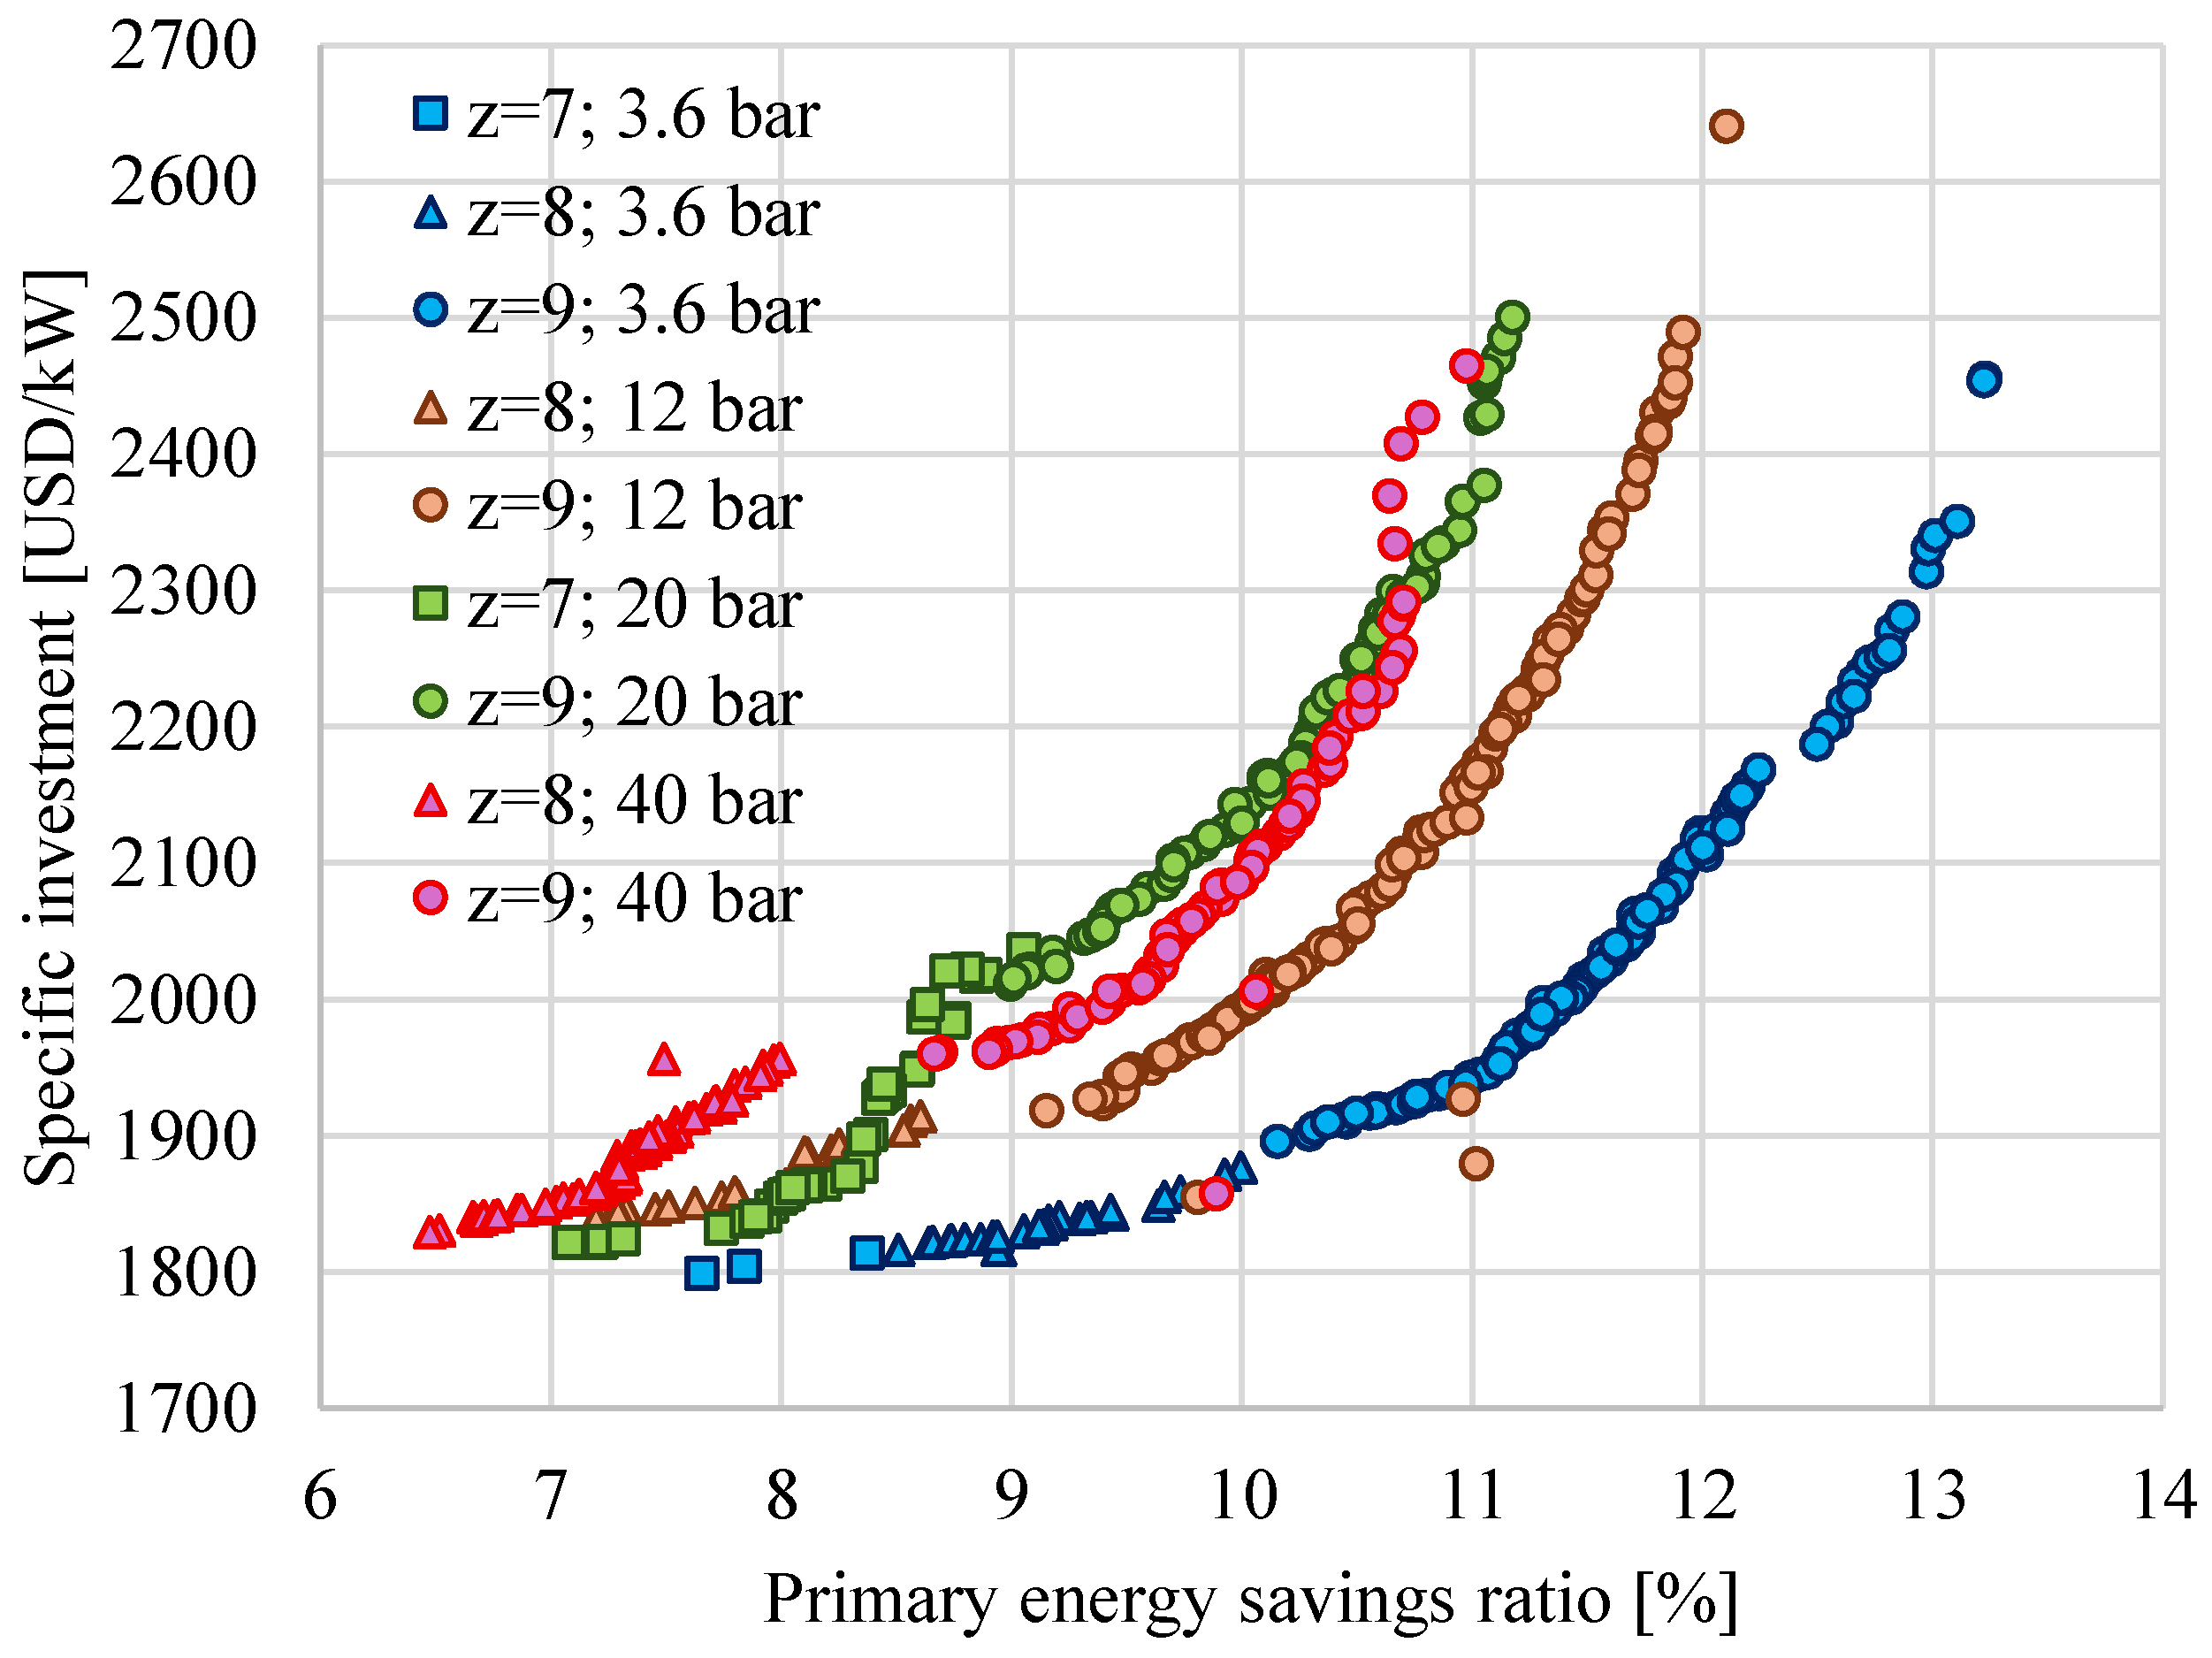
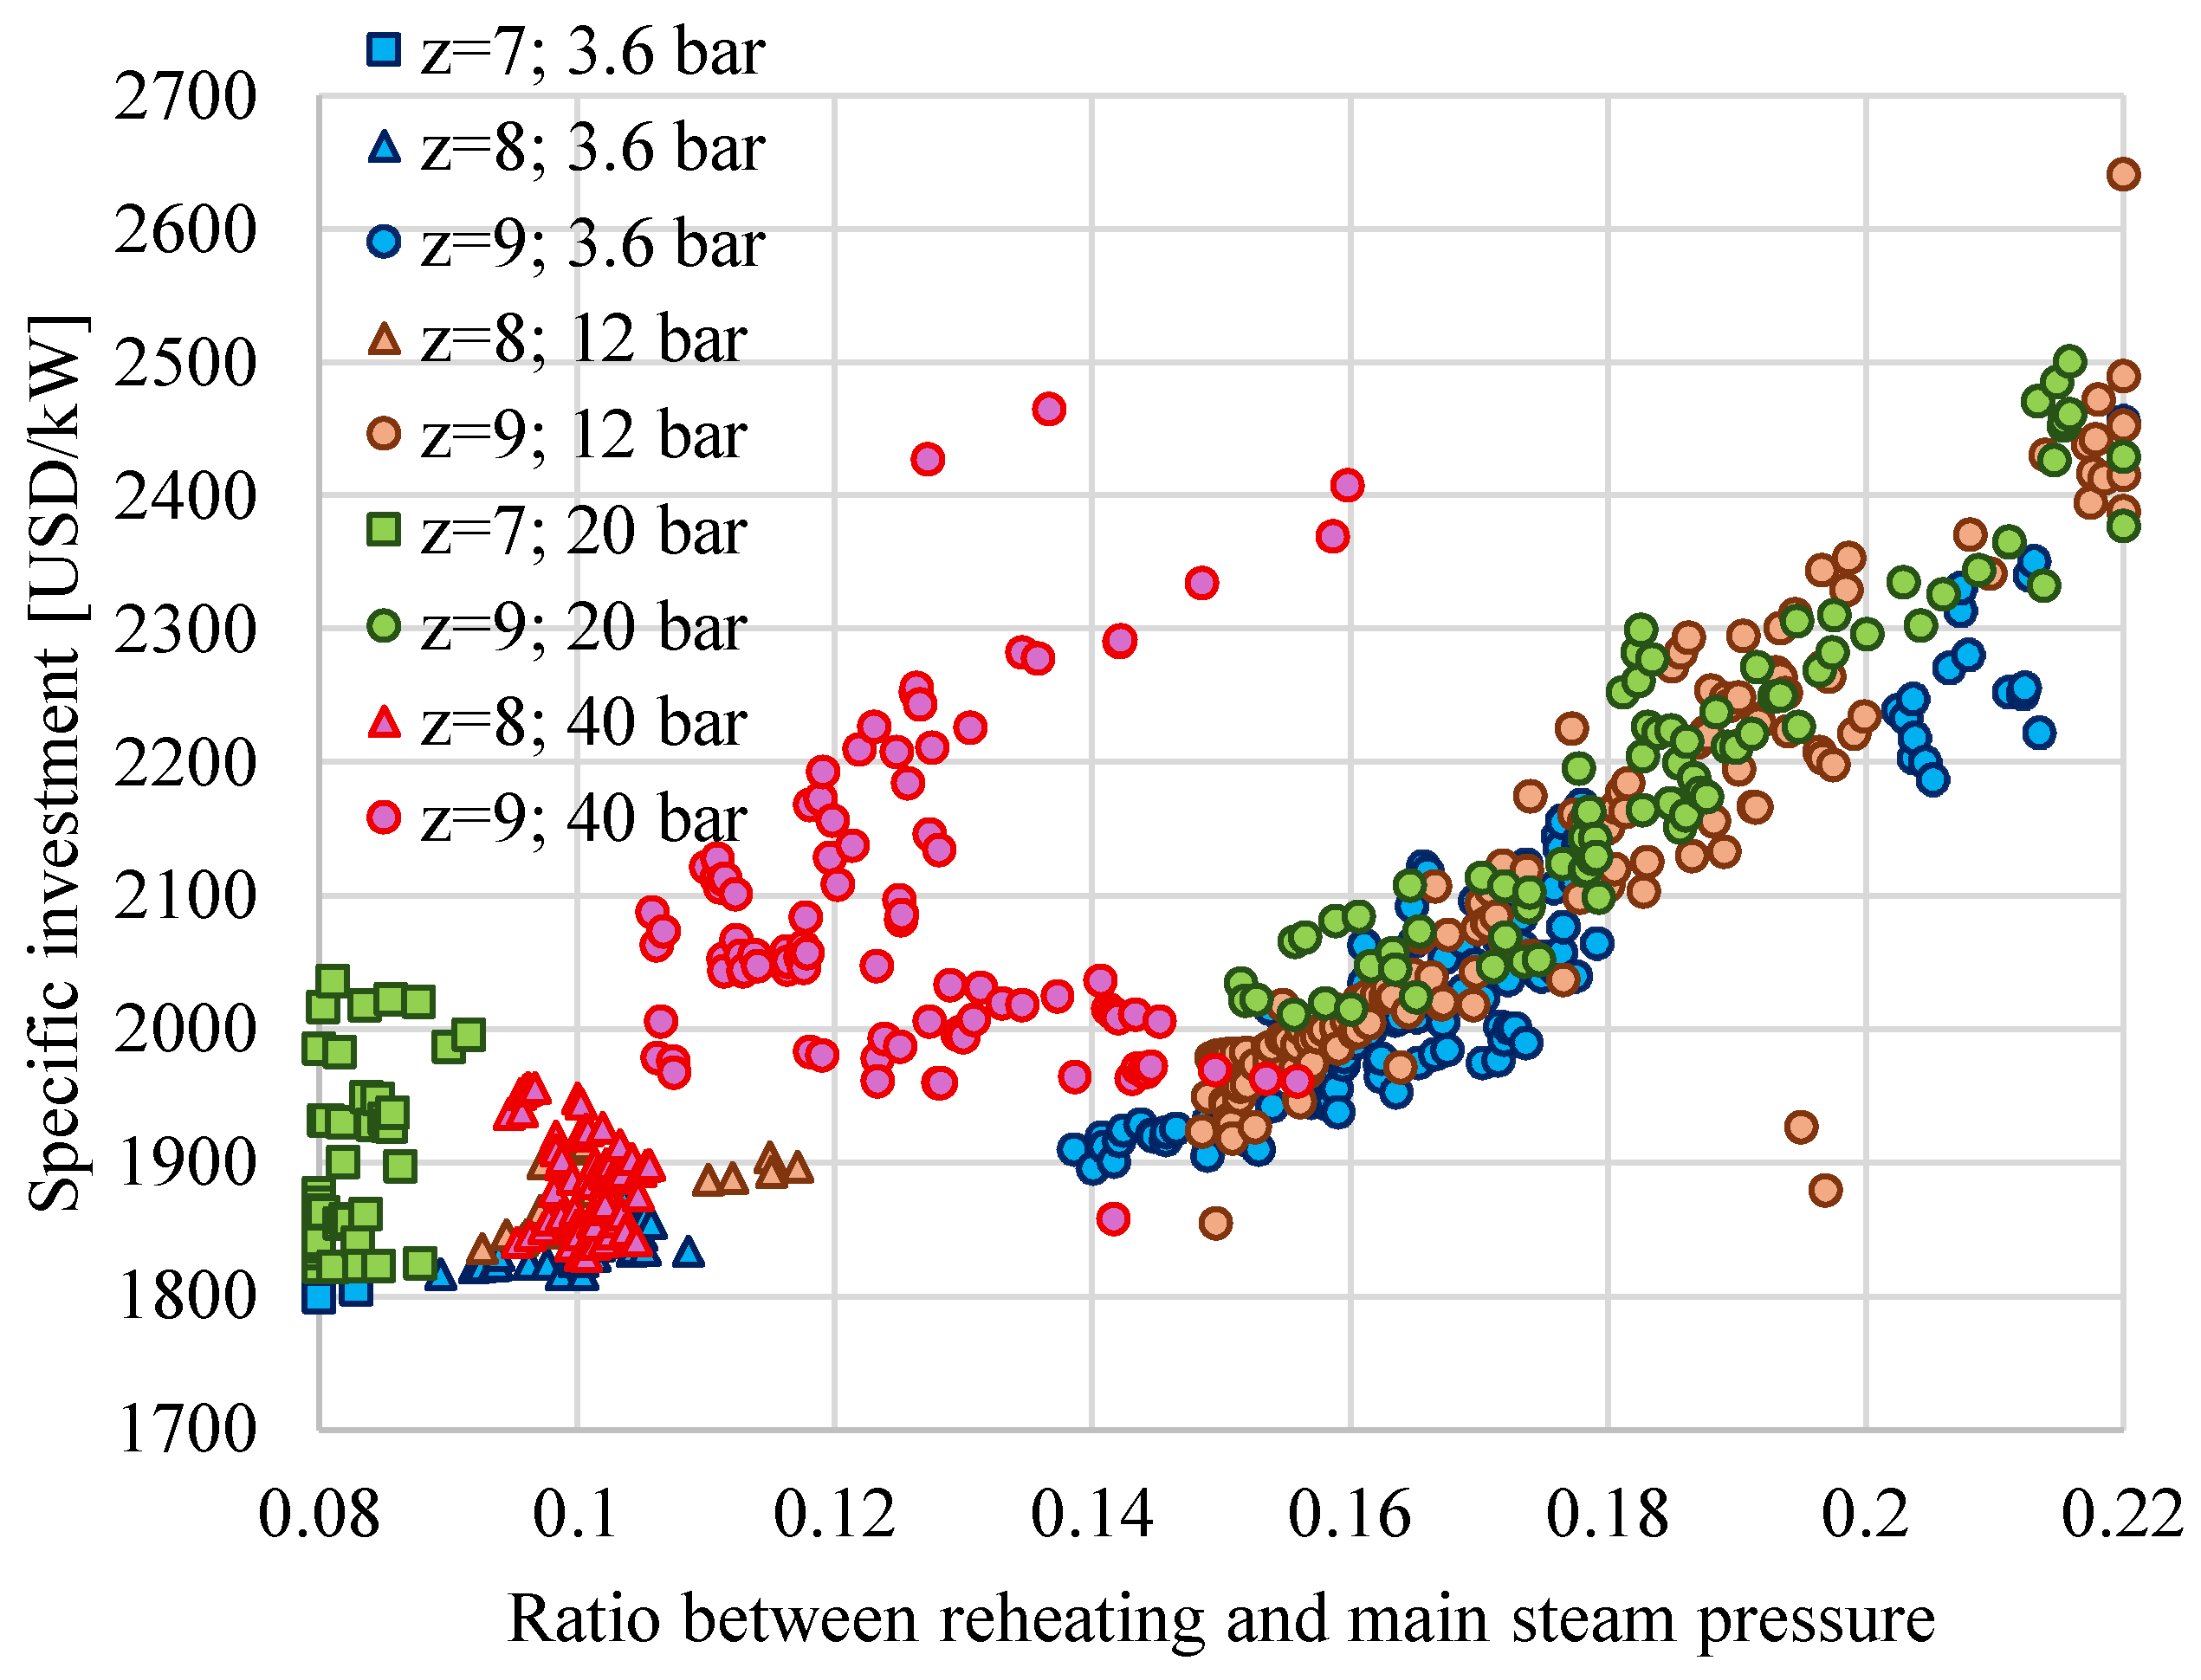
Figure 4, Figure 5 and Figure 6 and Table 4 and Table 5 contain the results on the Pareto frontier corresponding to the heat flow rate to the SC of 0.1QSG.
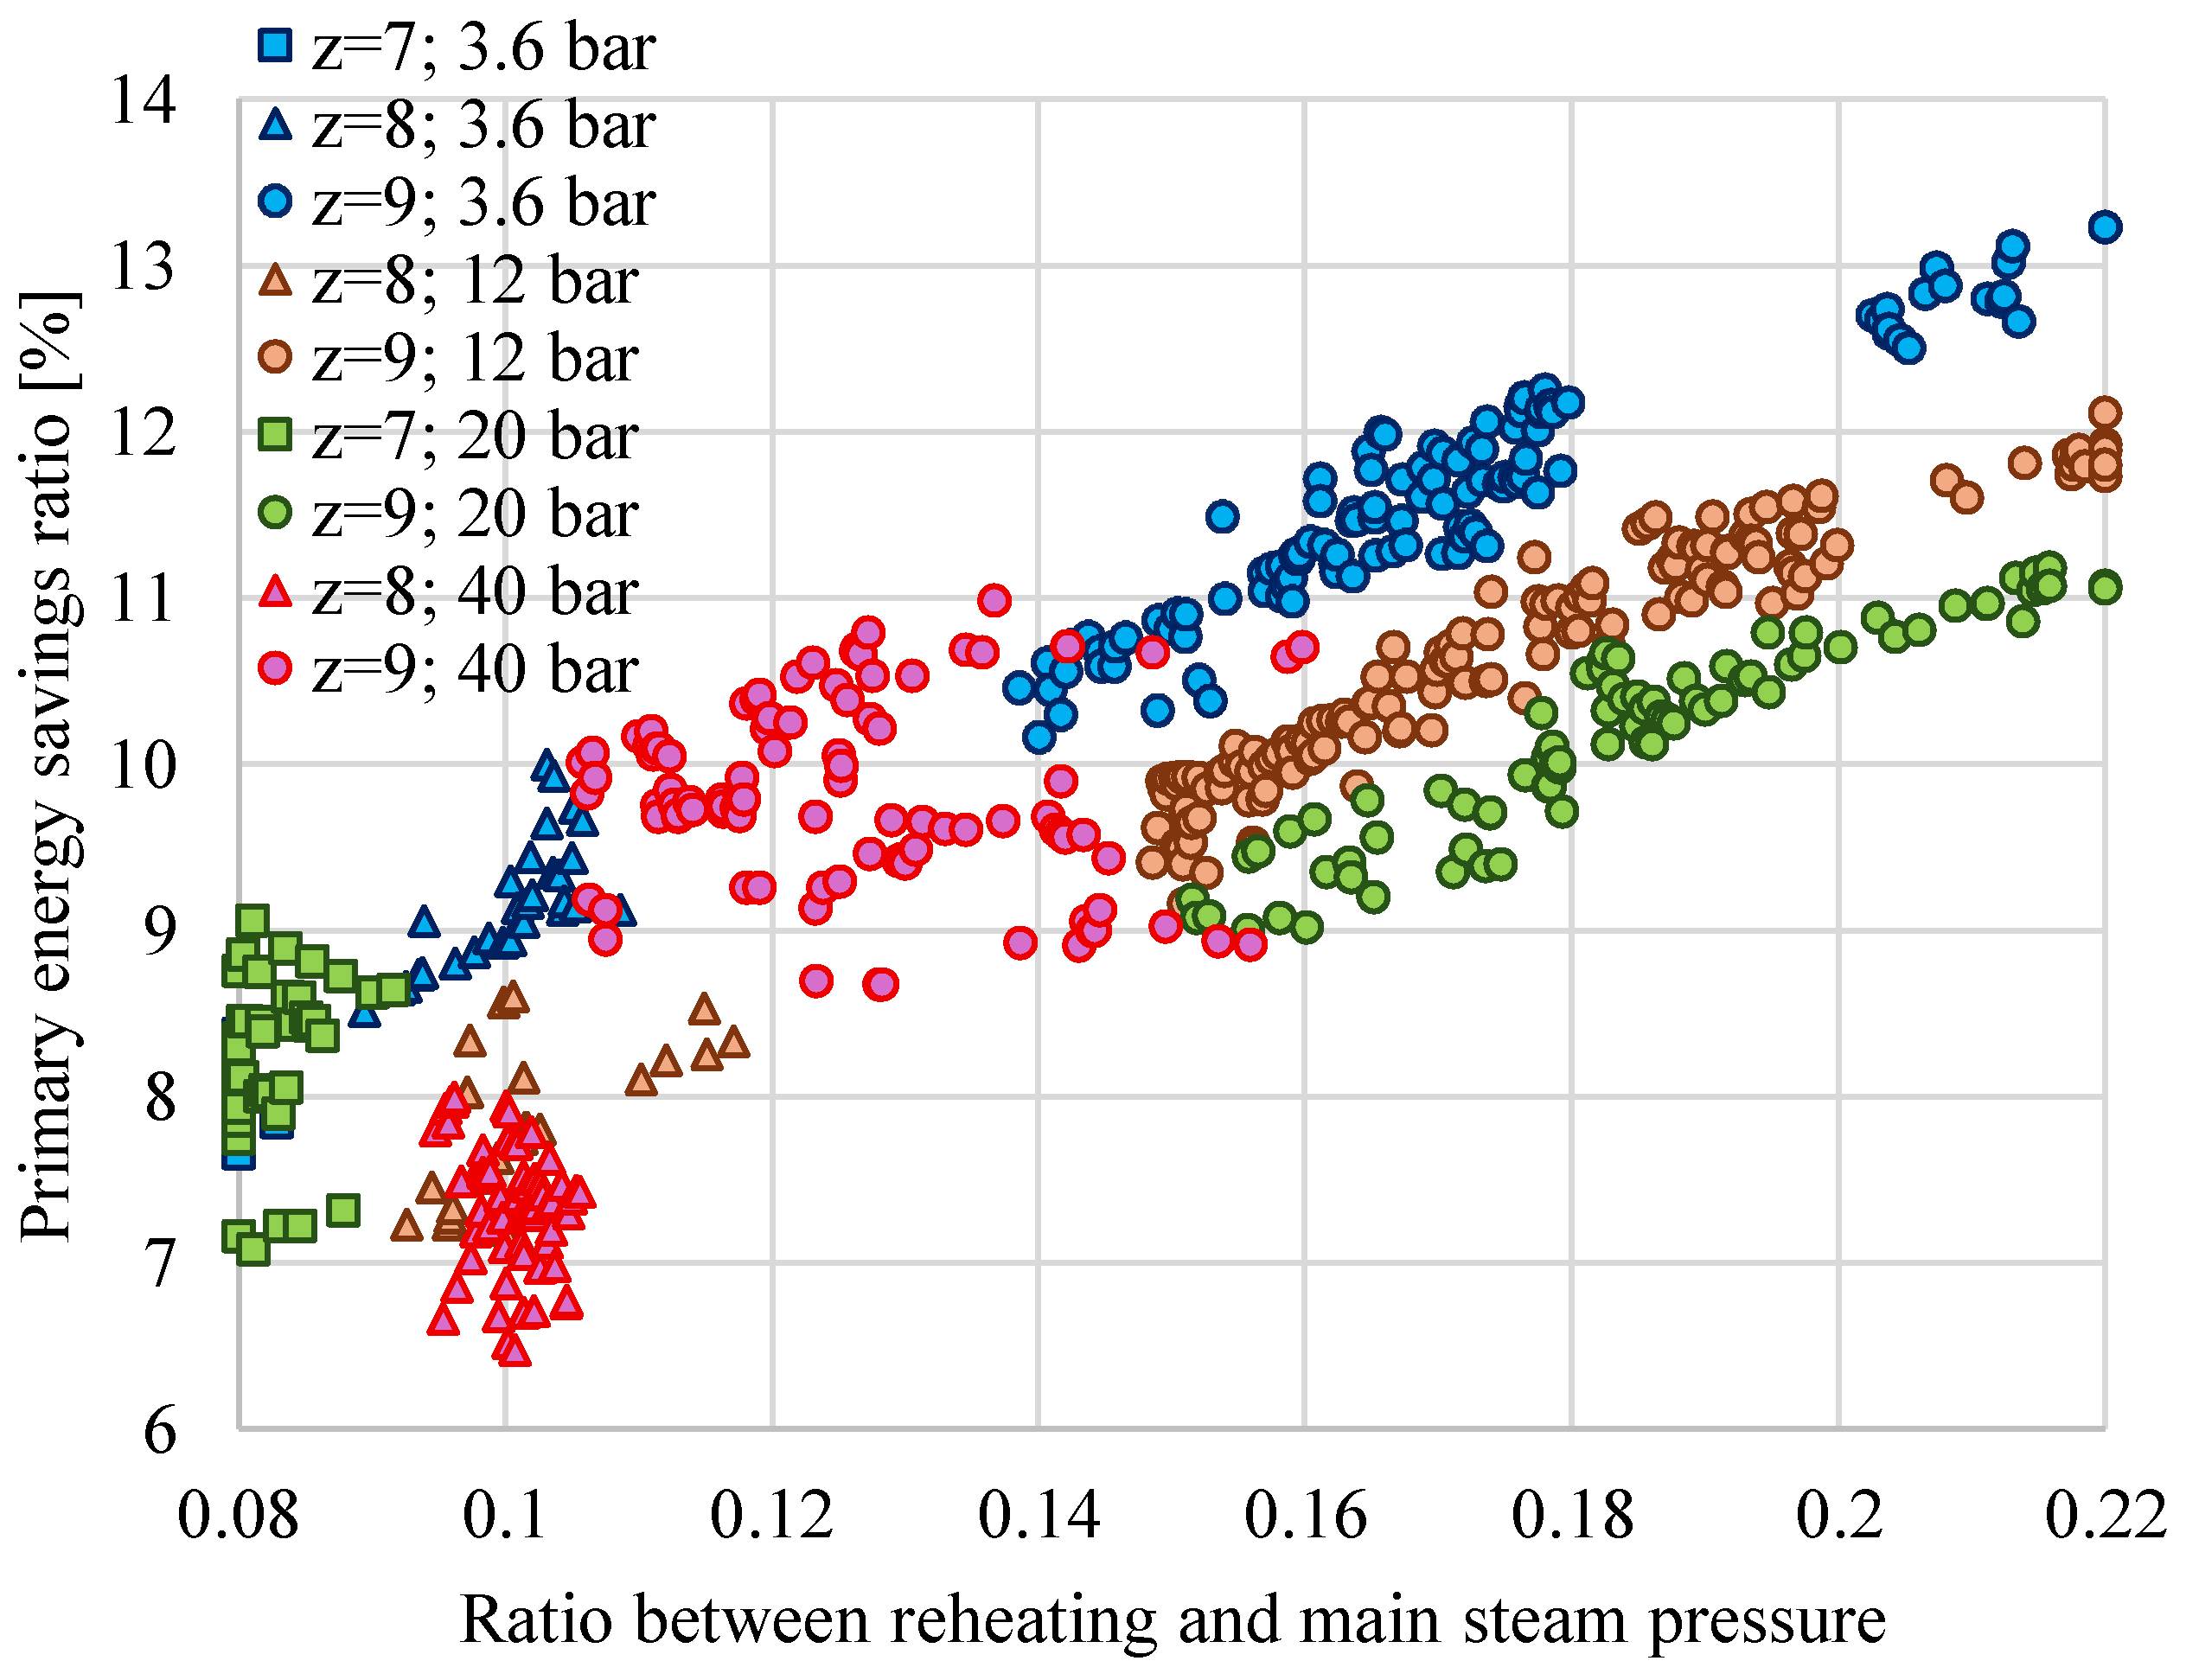
The CHP plant with a low heat consumer (QSC = 0.1QSG) does not always meet the condition of a high-efficiency cogeneration power plant (PESratio > 10%), as can be seen in Figure 4 and Figure 6. This condition is not met in any case with z < 9.
For z = 9, QSC = 0.1QSG, and pSC for 3.6 bar to 20 bar, the optimum rp is over 0.14, while for z = 7 and 8, rp is under 0.12 (Figure 5 and Figure 6). For pSC = 40 bar, the optimum rp is between 0.095 and 0.16, with the highest values being for the highest z, as for the lower pSC cases.

4.3. Pareto Design Solutions for Medium Heat Flow Rate to SC

The results of the design optimization for the heat flow rate to the SC of 0.2QSG are presented in Figure 7, Figure 8, Figure 9 and Figure 10 and Table 6 and Table 7. The colors and the markers used in the figures have the same significance as in the prior case.
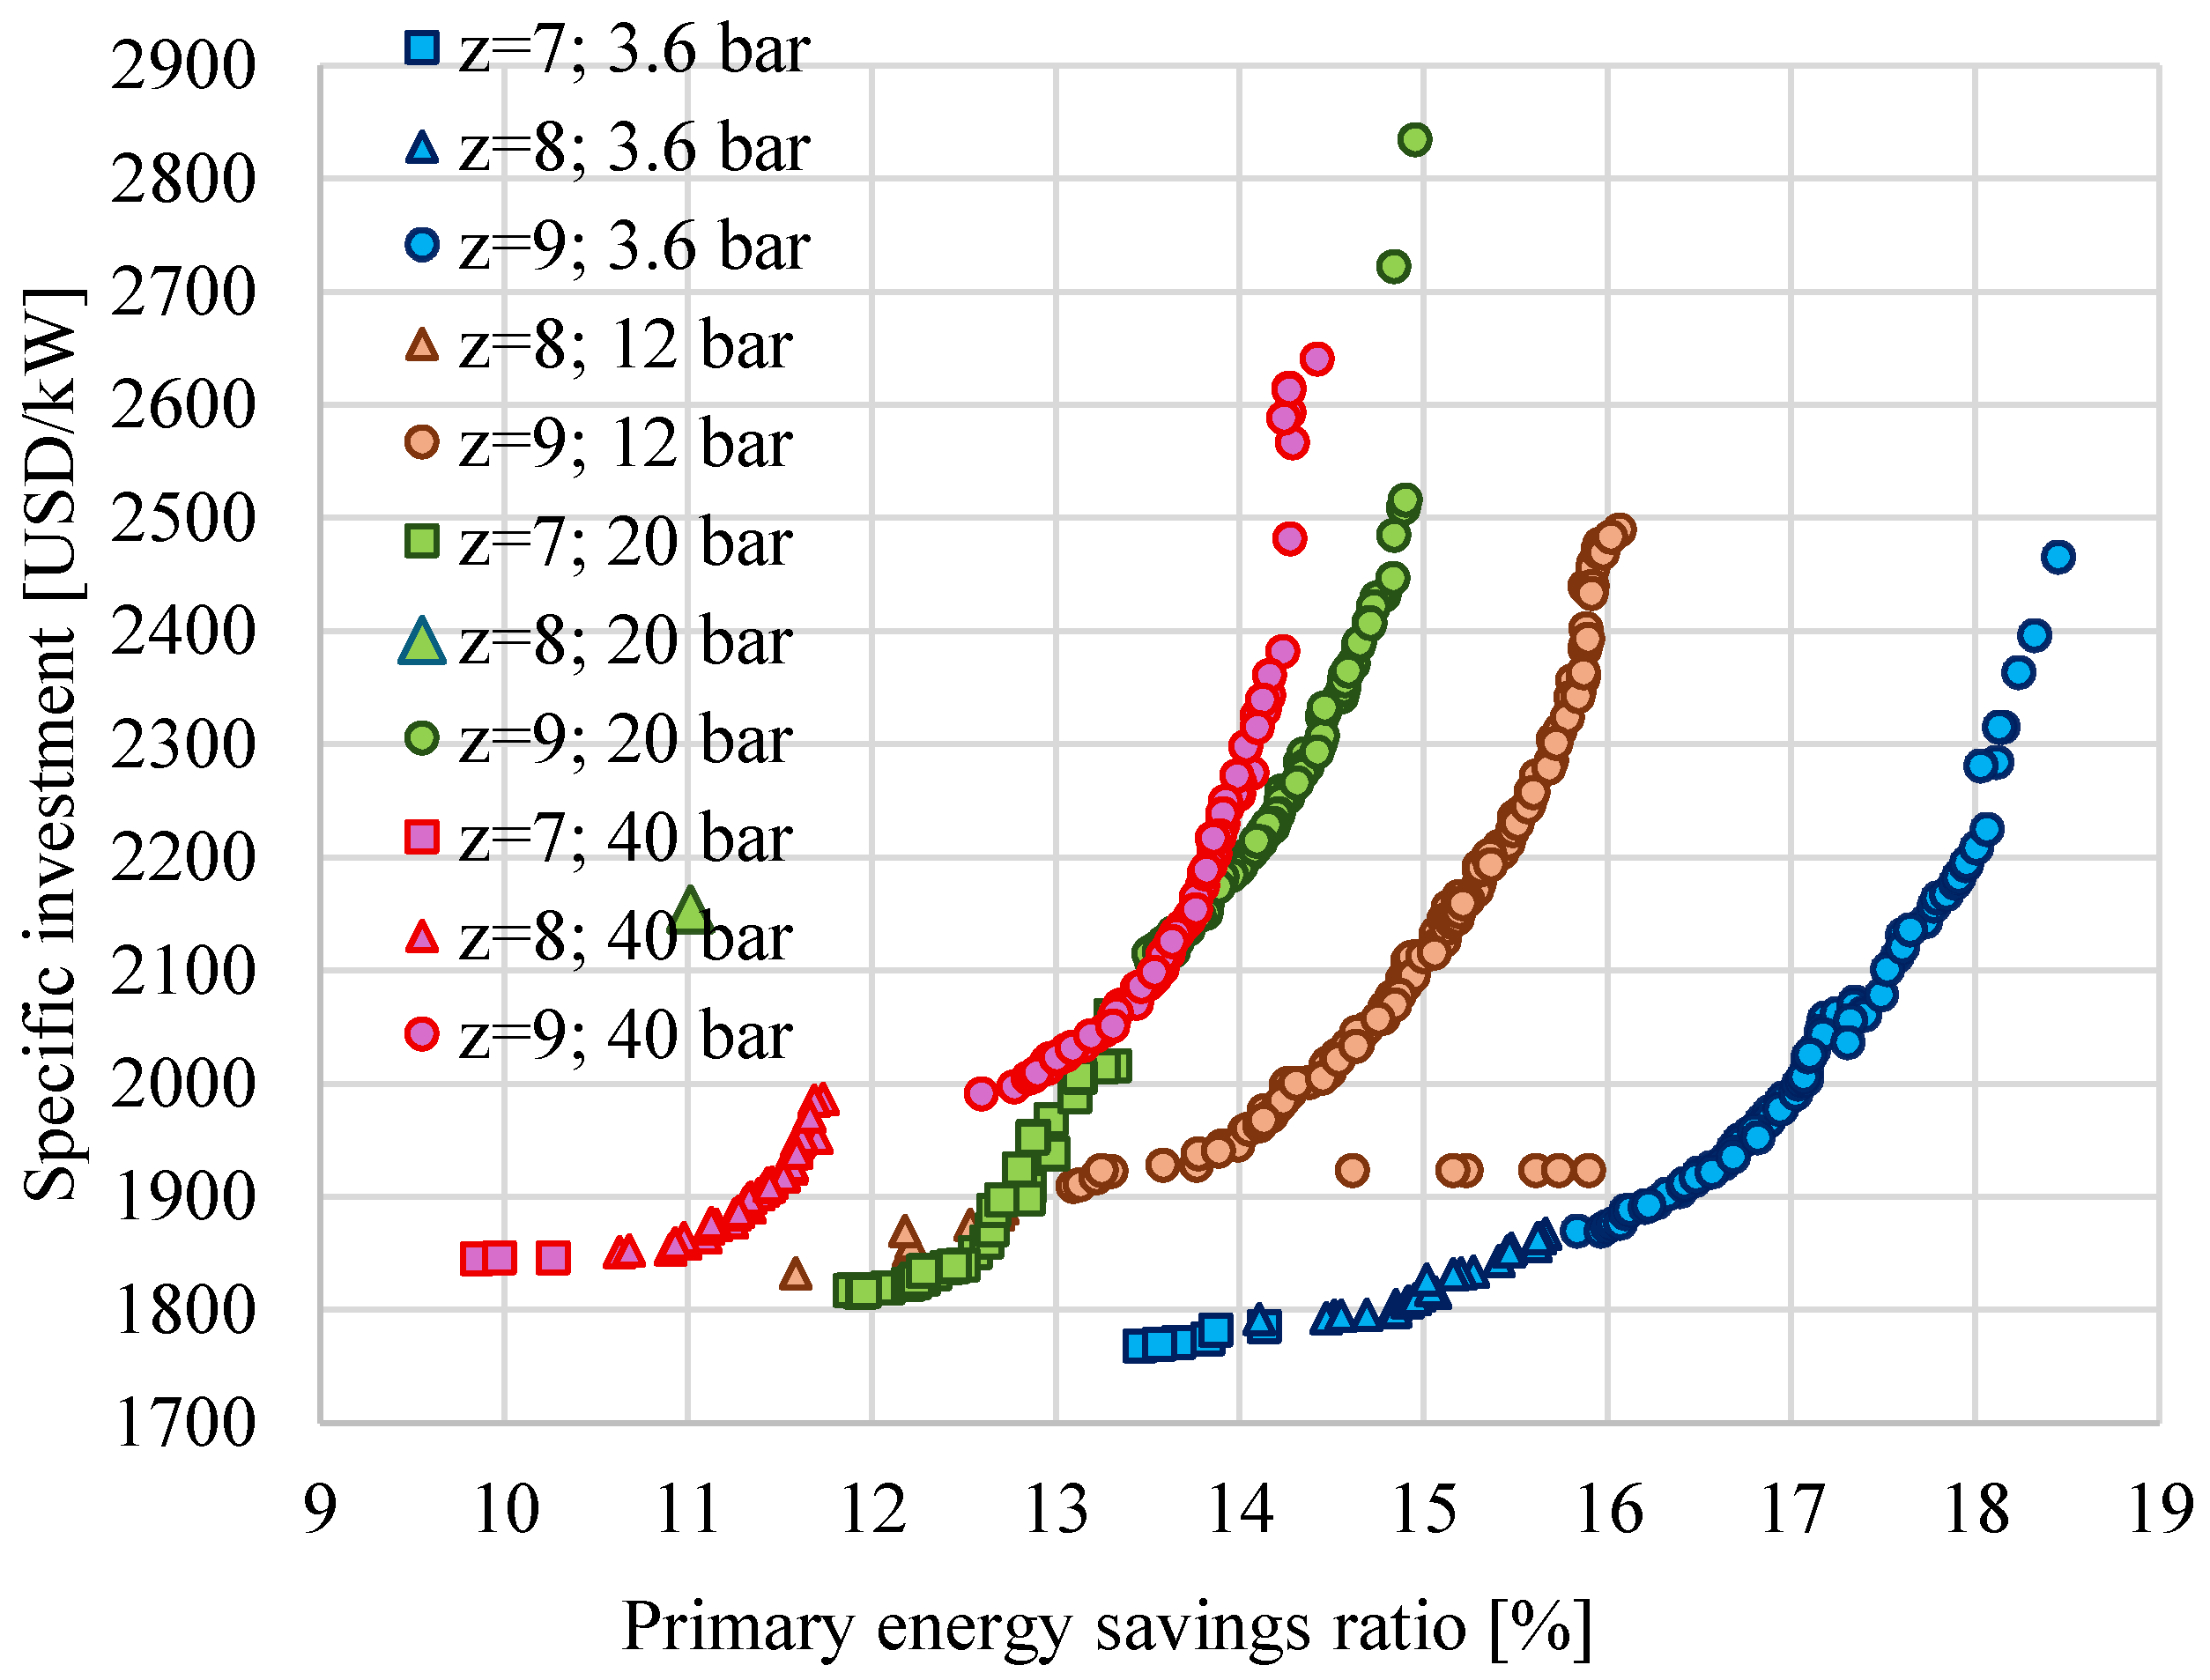
For a medium heat consumer (QSC = 0.2QSG), ηgl varies between 54.5% and 59.1% (Figure 7). If the SC requires steam at 3.6 bar, ηgl is over 57.7% for z = 9. In this case, IsEQ varies between 1868 USD/kW and 2465 USD/kW (Figure 7 and Figure 8). For a similar IsEQ = 2000 USD/kW and the same z = 9, ηgl = 56% if the SC requires pSC = 40 bar and increases by 4.3%, reaching ηgl = 58.4%, if the SC requires only pSC = 3.6 bar (Figure 7).
Except for two Pareto points, for pSC = 40 bar and z = 7, in all cases, PESratio > 10% for QSC = 0.2QSG (Figure 8 and Figure 10). However, it is observed that the PESratio decreases with the increase in pSC (Figure 10, Table 7). The values of the PESratio are between 9.8% and 14.5% (Figure 10) for pSC = 40 bar, and z from 7 to 9. If the scheme with z = 9 is chosen, the PESratio is between 12.6% and 14.5% (Figure 10).
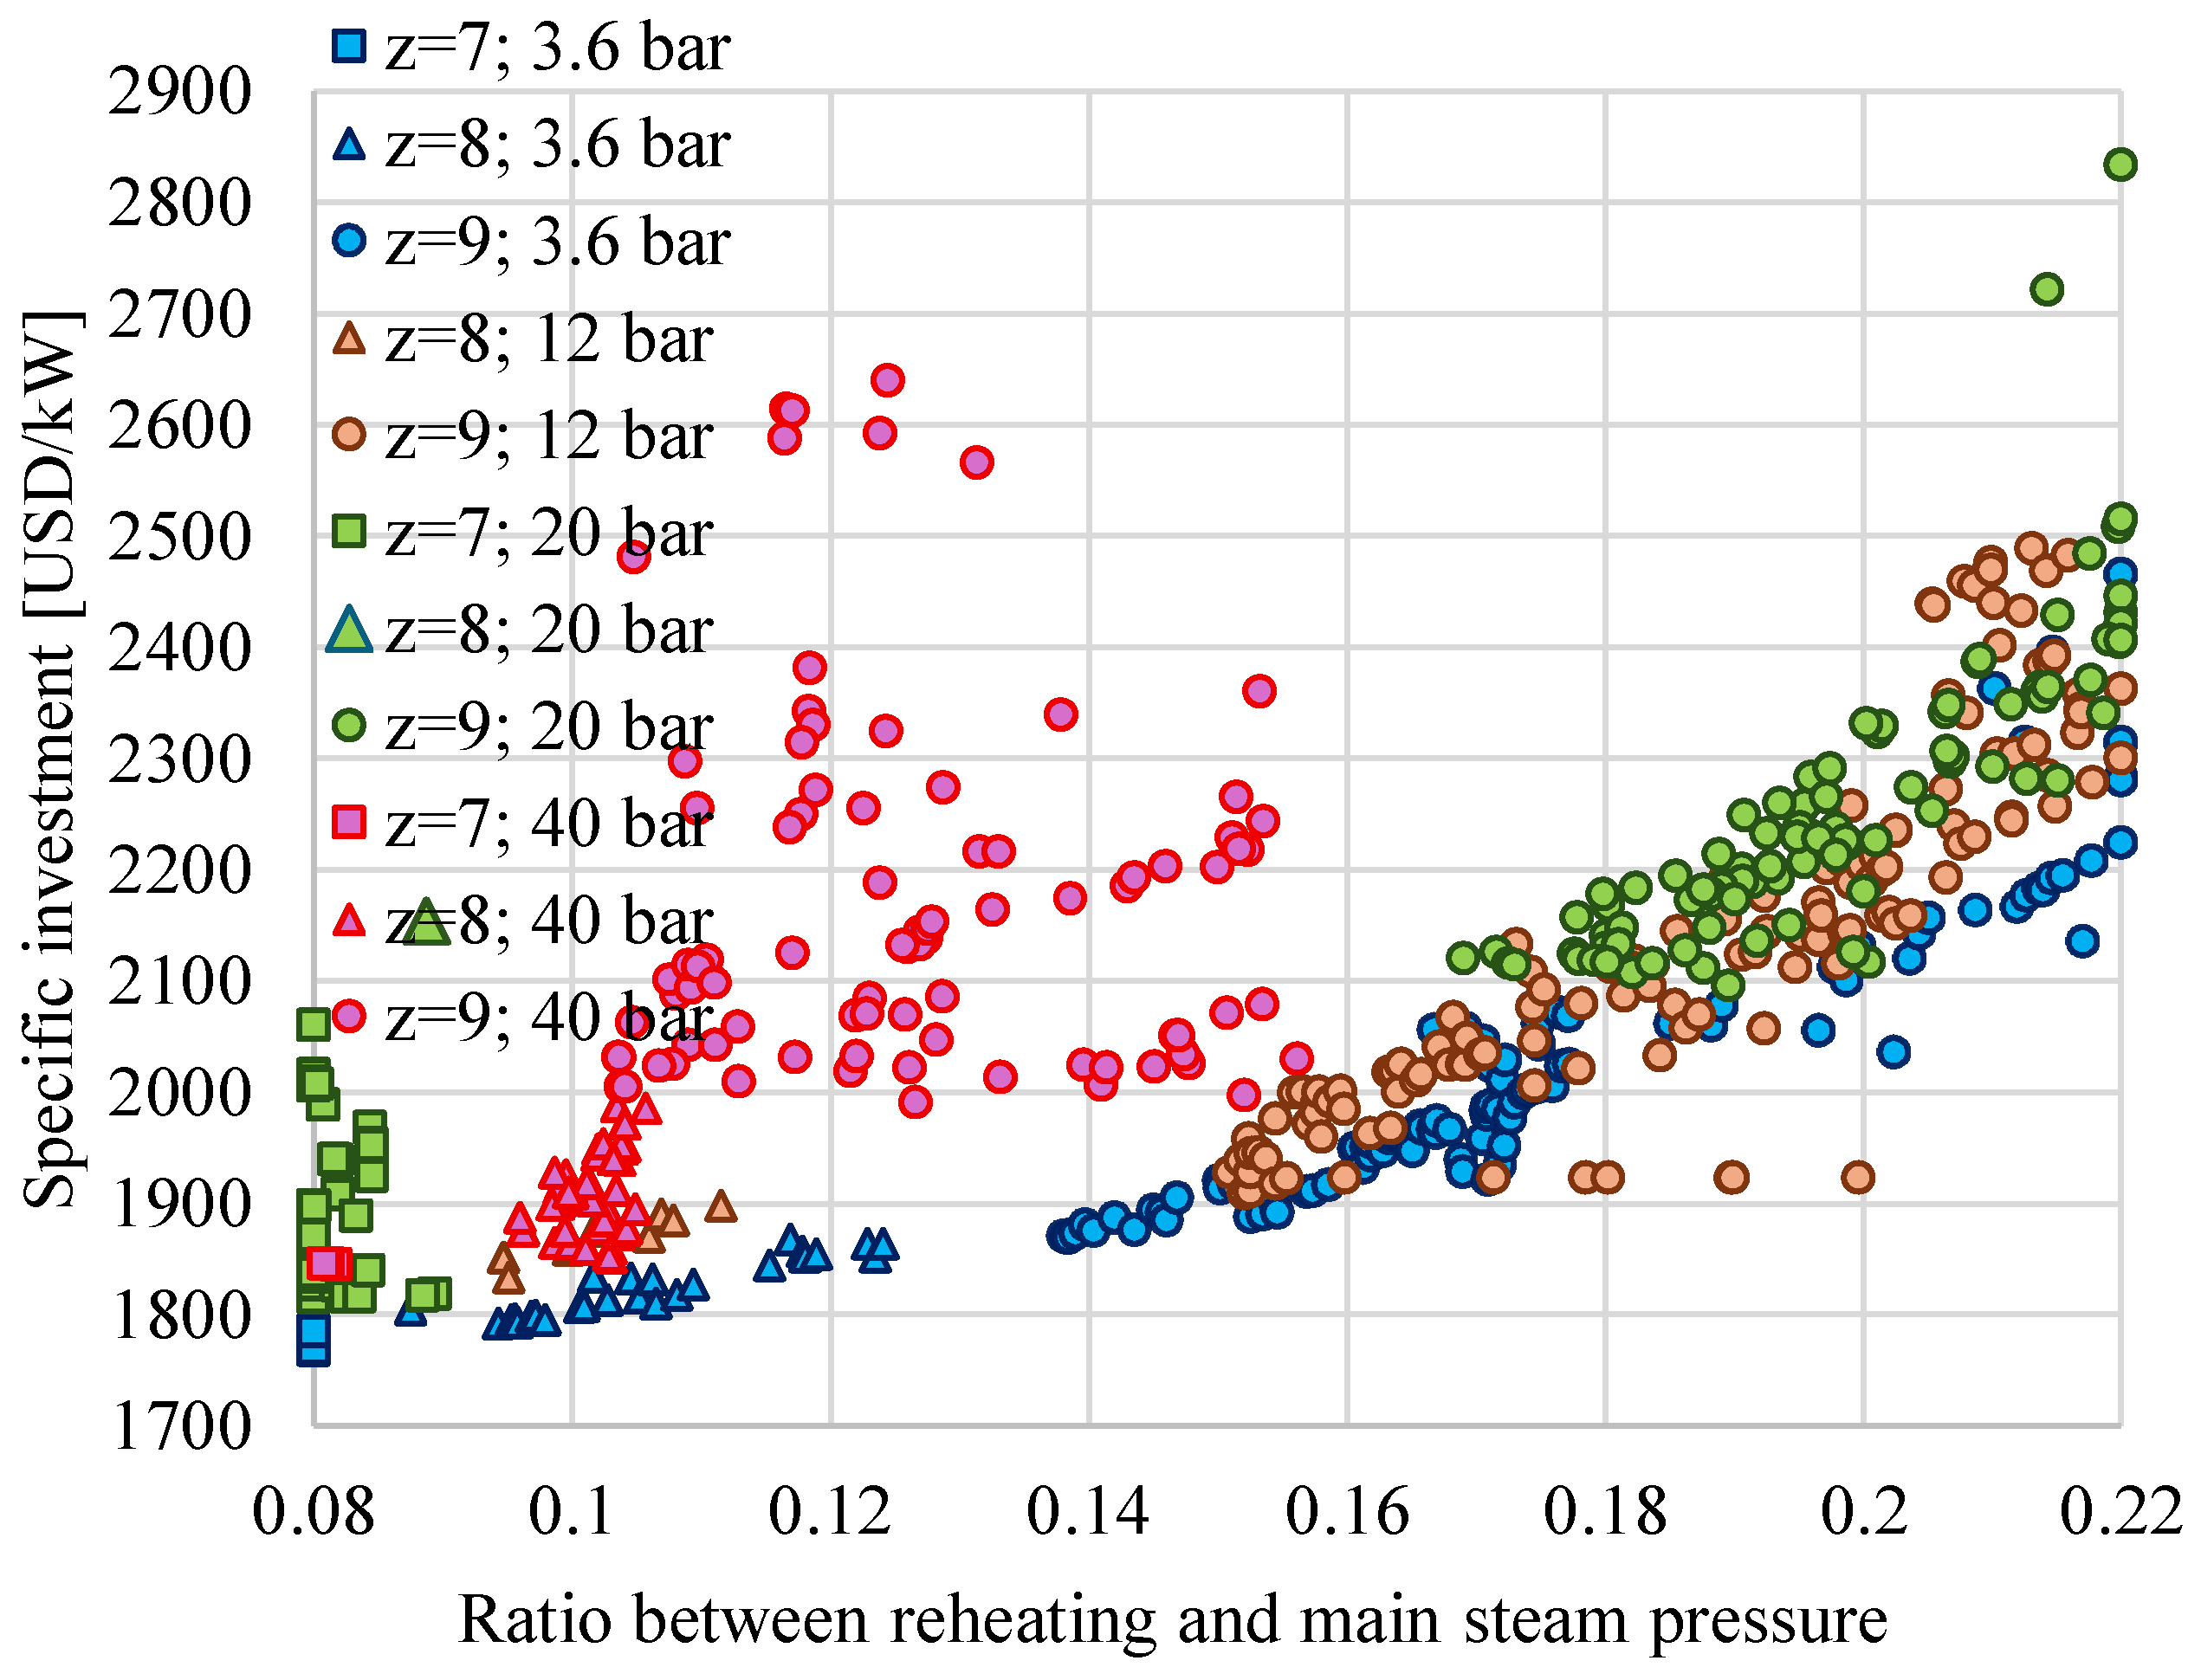
However, for pSC = 40 bar, rp has a restrictive interval compared to the other cases, and it stops at rp = 0.16 (Figure 9 and Figure 10, Table 7). This is due to the jump of the steam extraction for the SC, for pSC = 40 bar, in the HPT. Thus, for z = 7 and z = 8, the SC is fed with the steam from the HPT extraction (the HPT bleed), and for z = 9, the steam for the SC is taken from the HPT exit.

4.4. Pareto Design Solutions for High Heat Flow Rate to SC

Figure 11, Figure 12, Figure 13 and Figure 14 and Table 8 and Table 9 present the design optimization Pareto solutions for the heat flow rate to the SC of 0.4QSG.
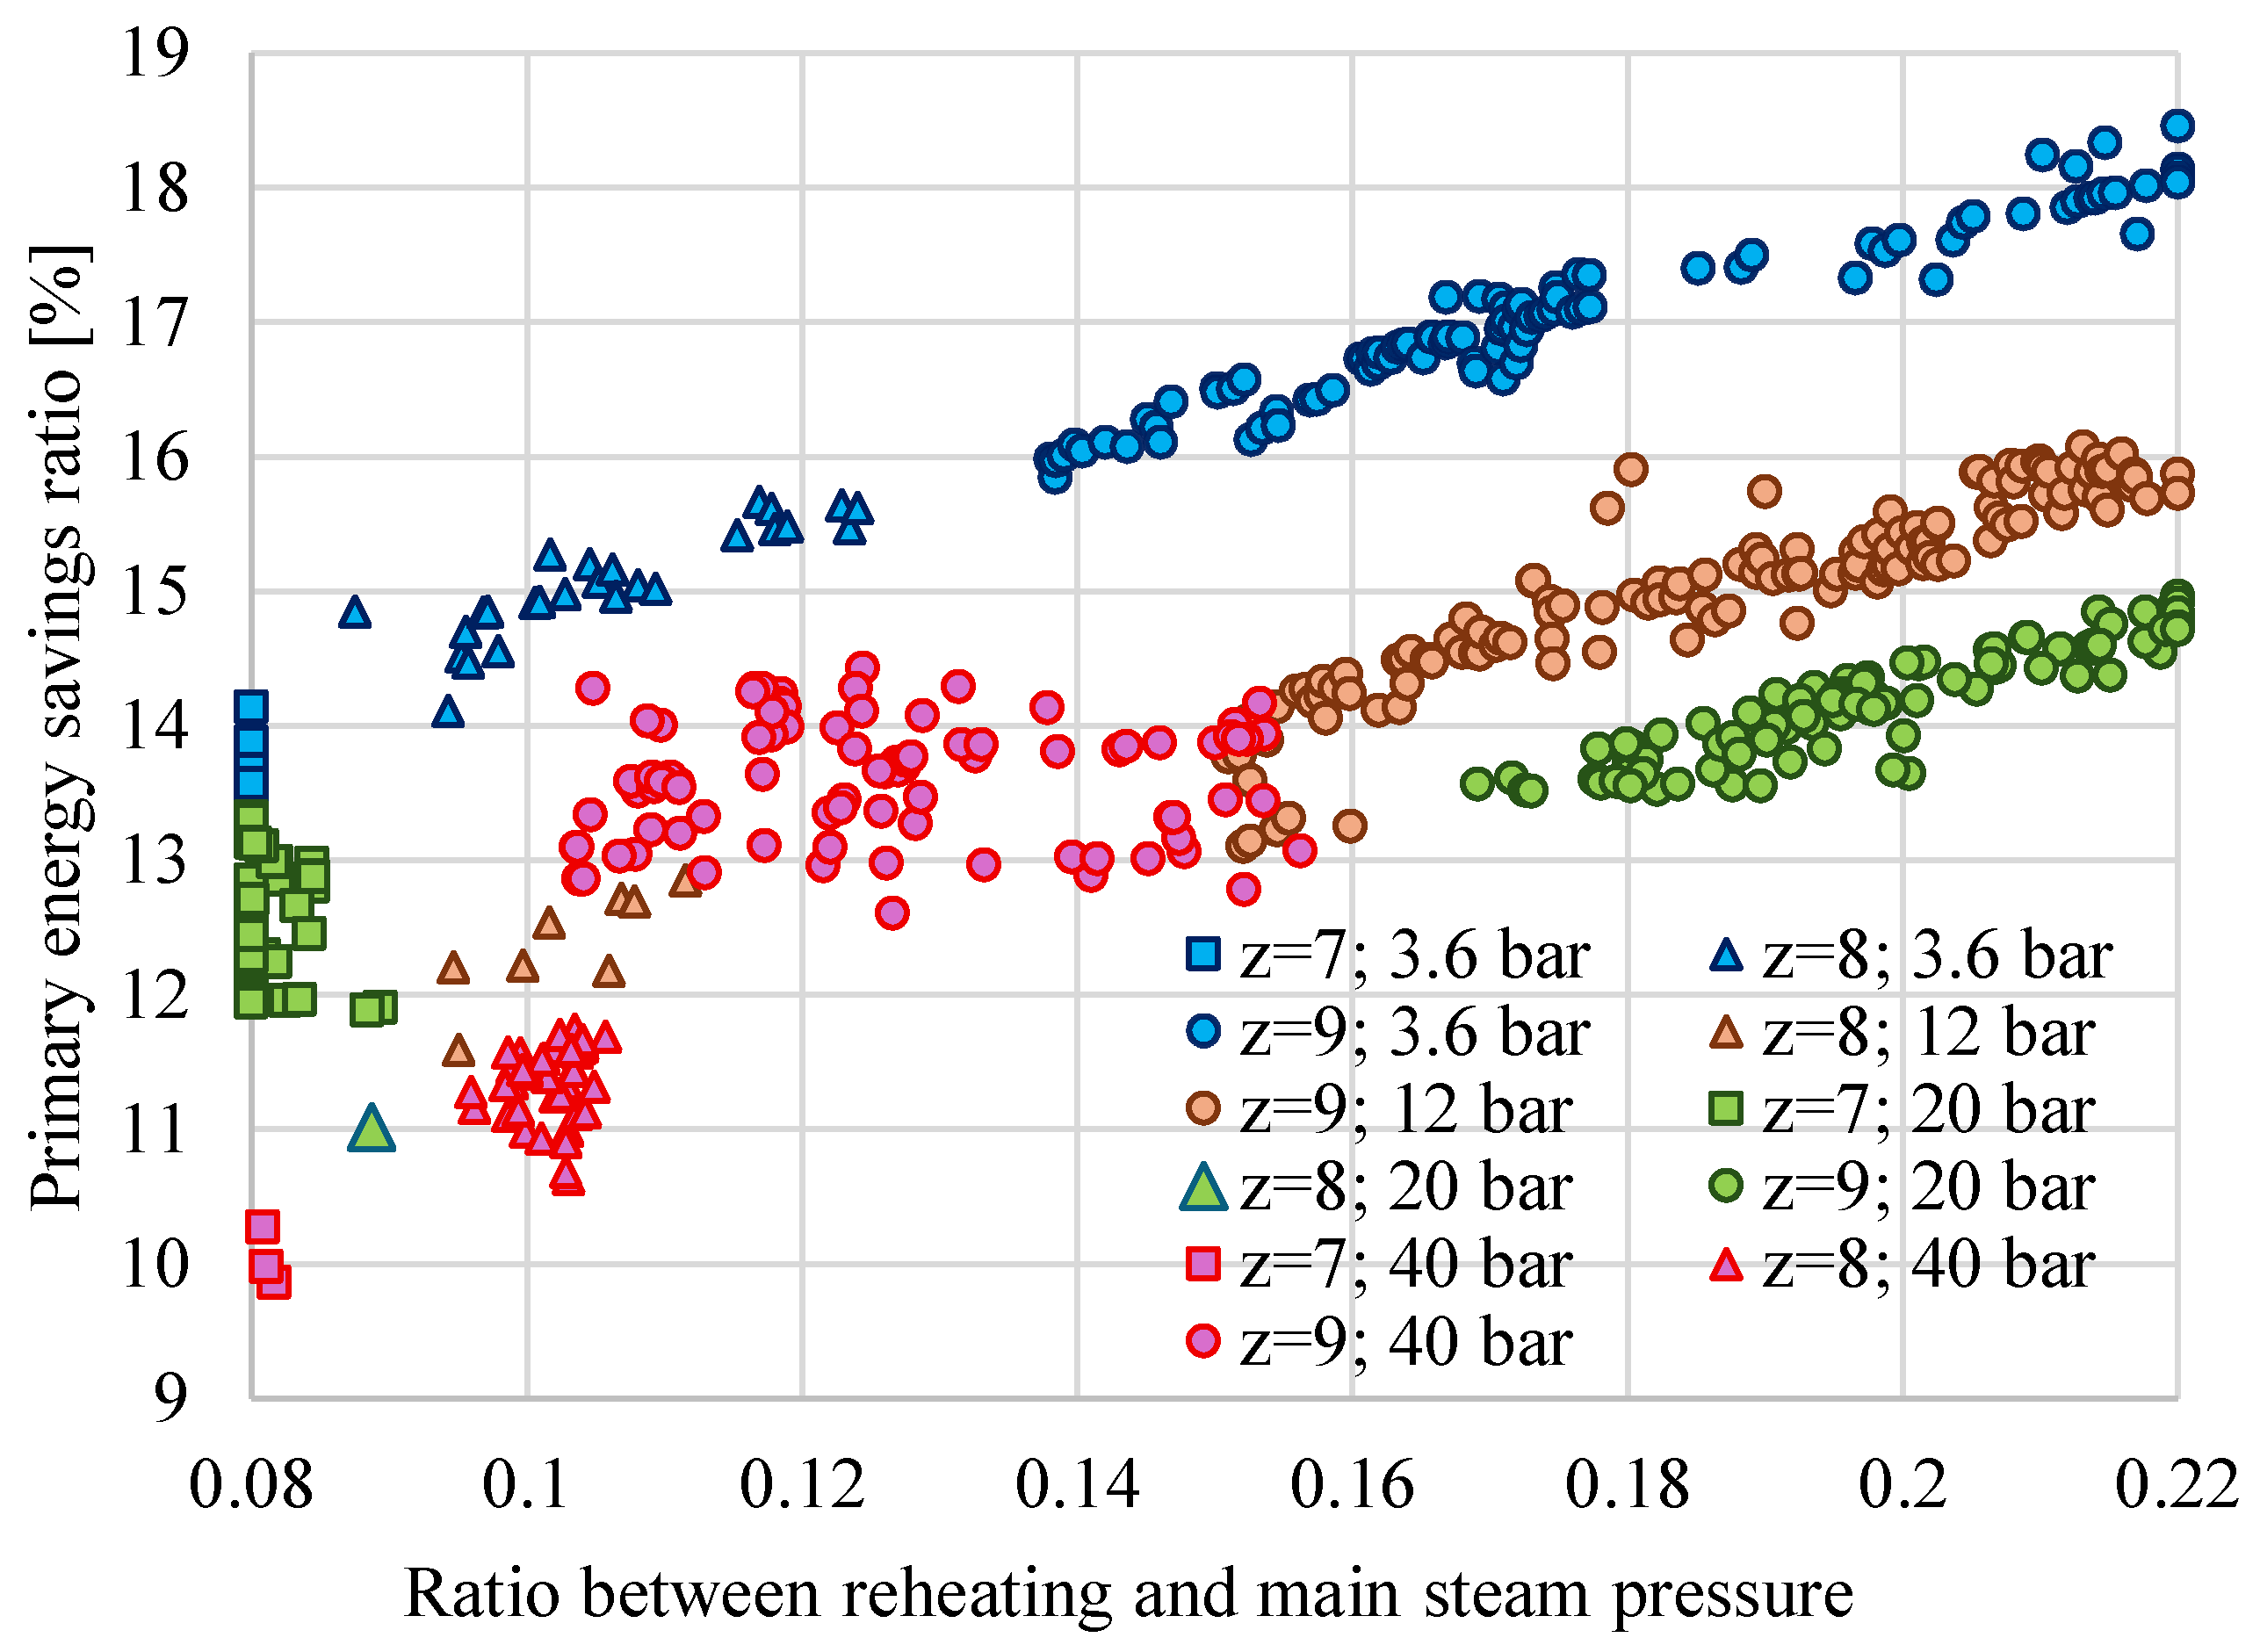
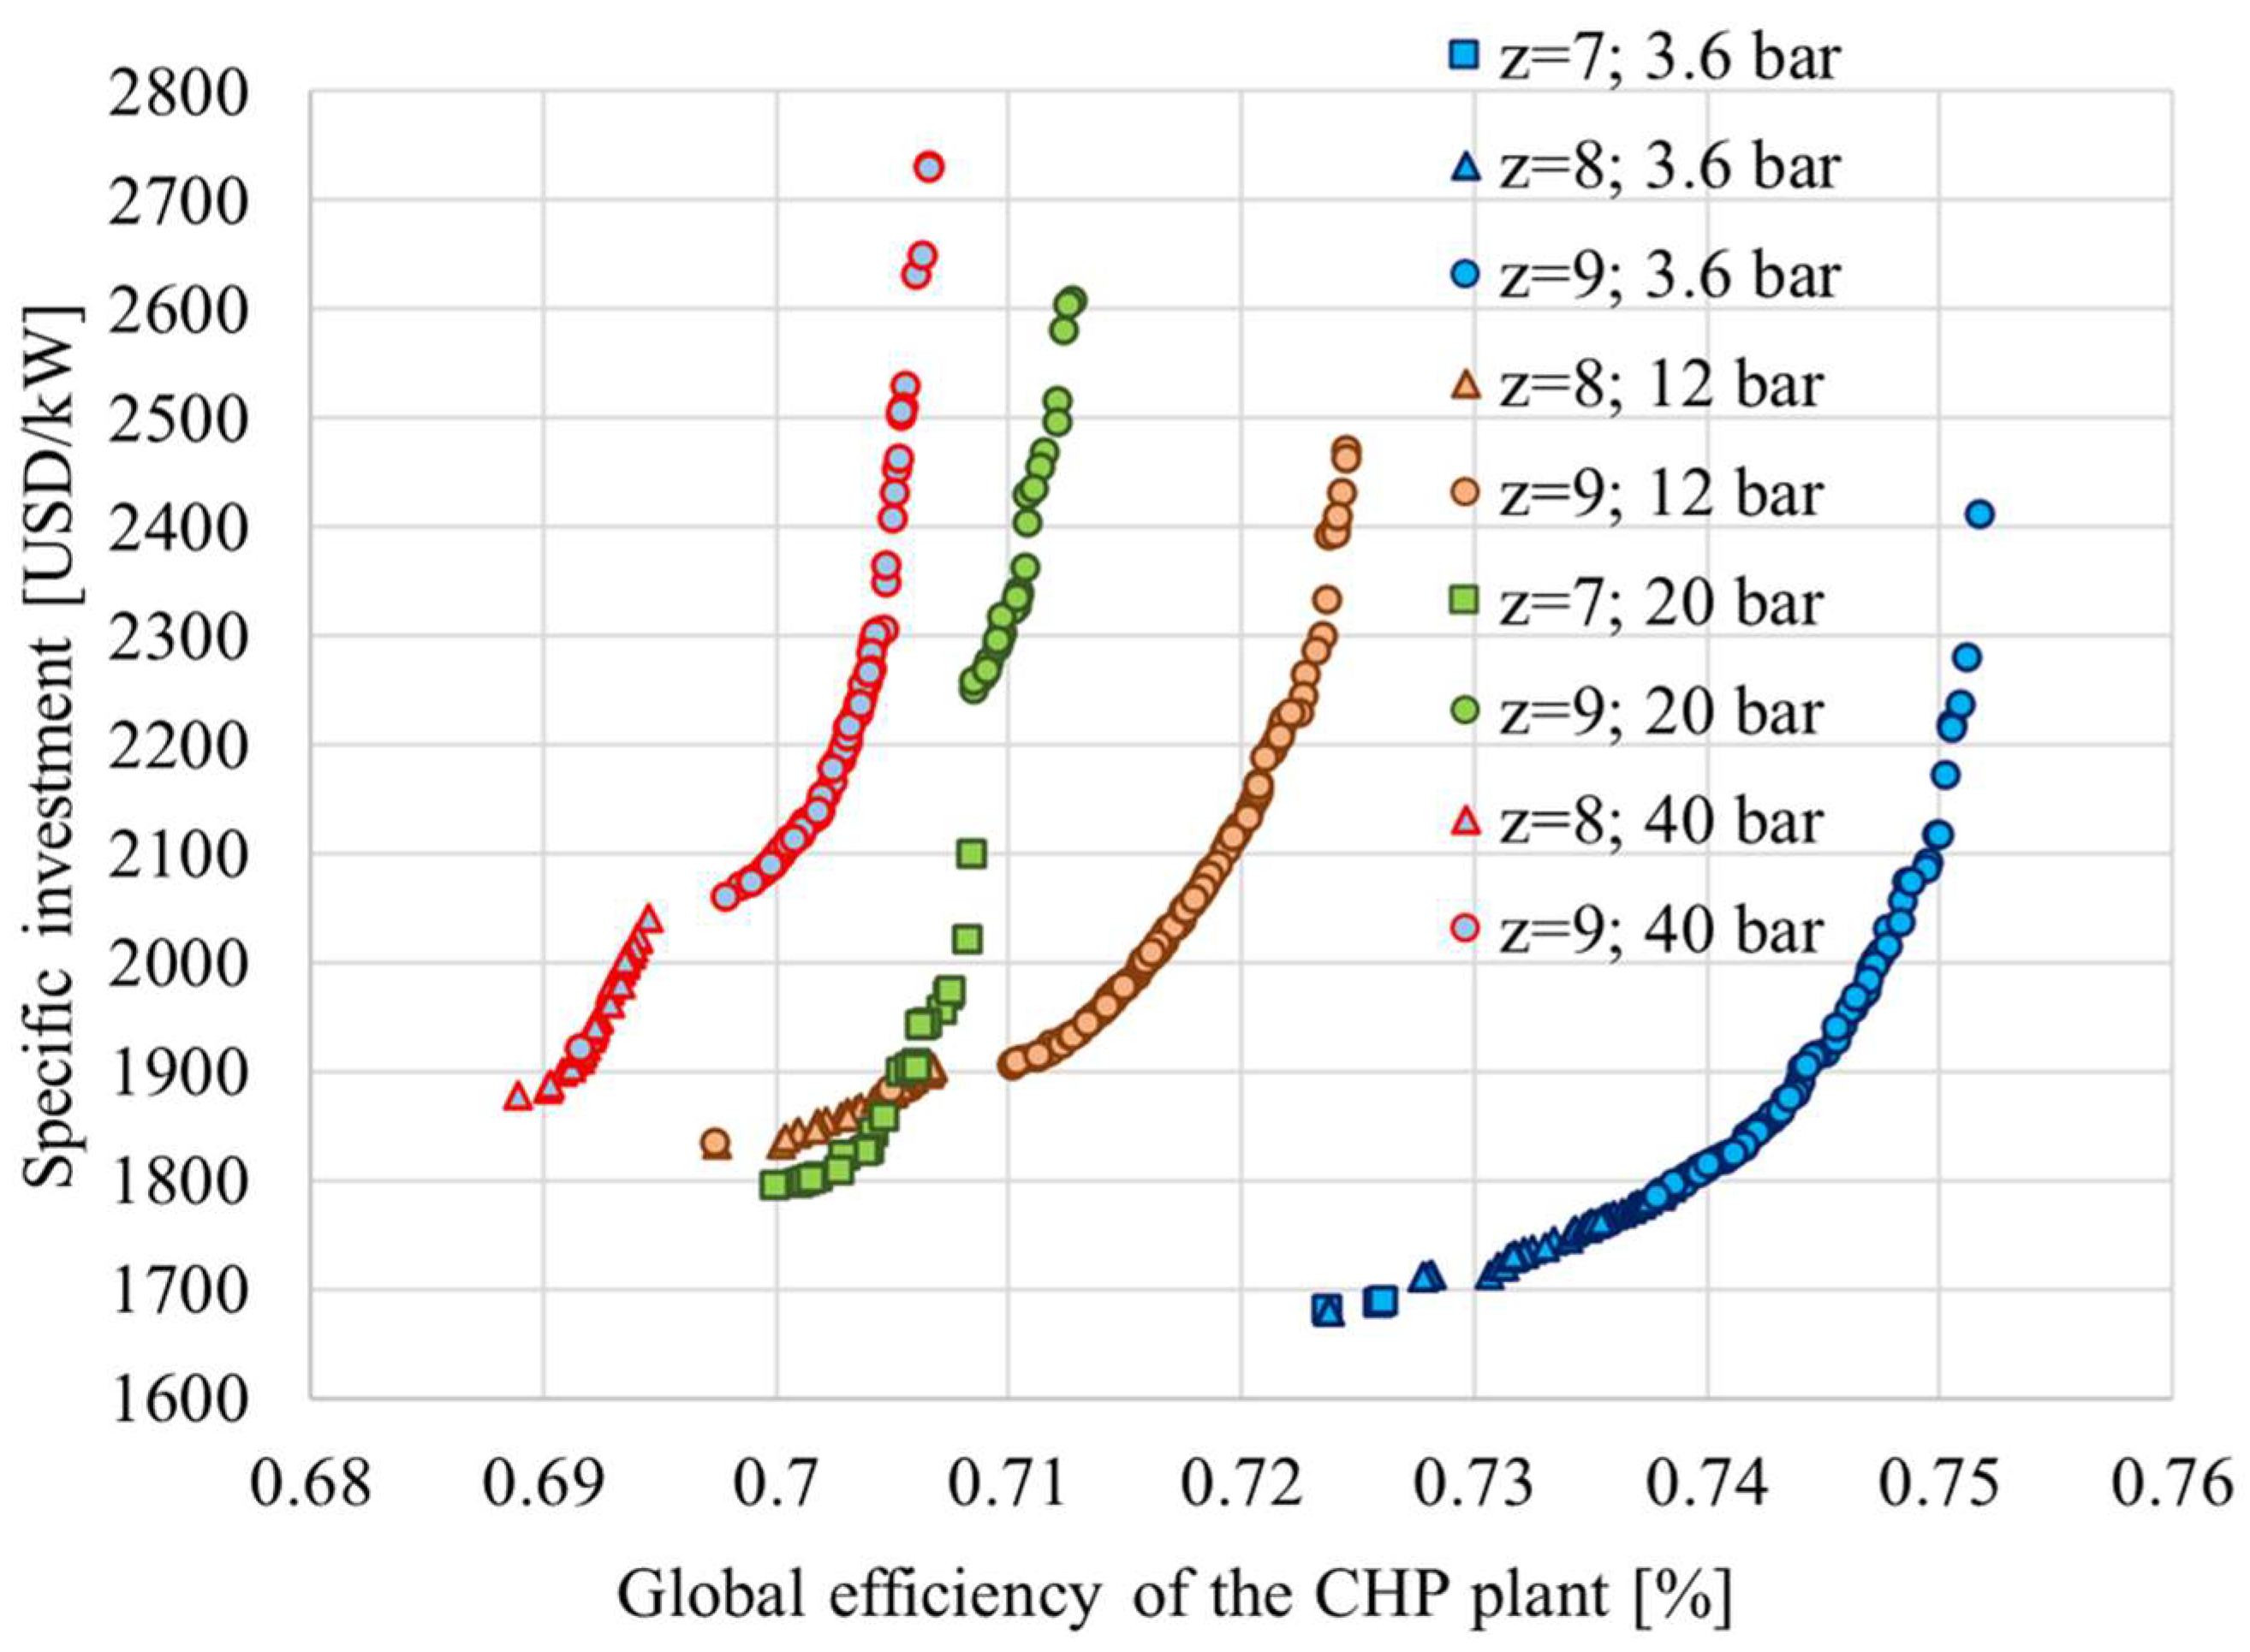
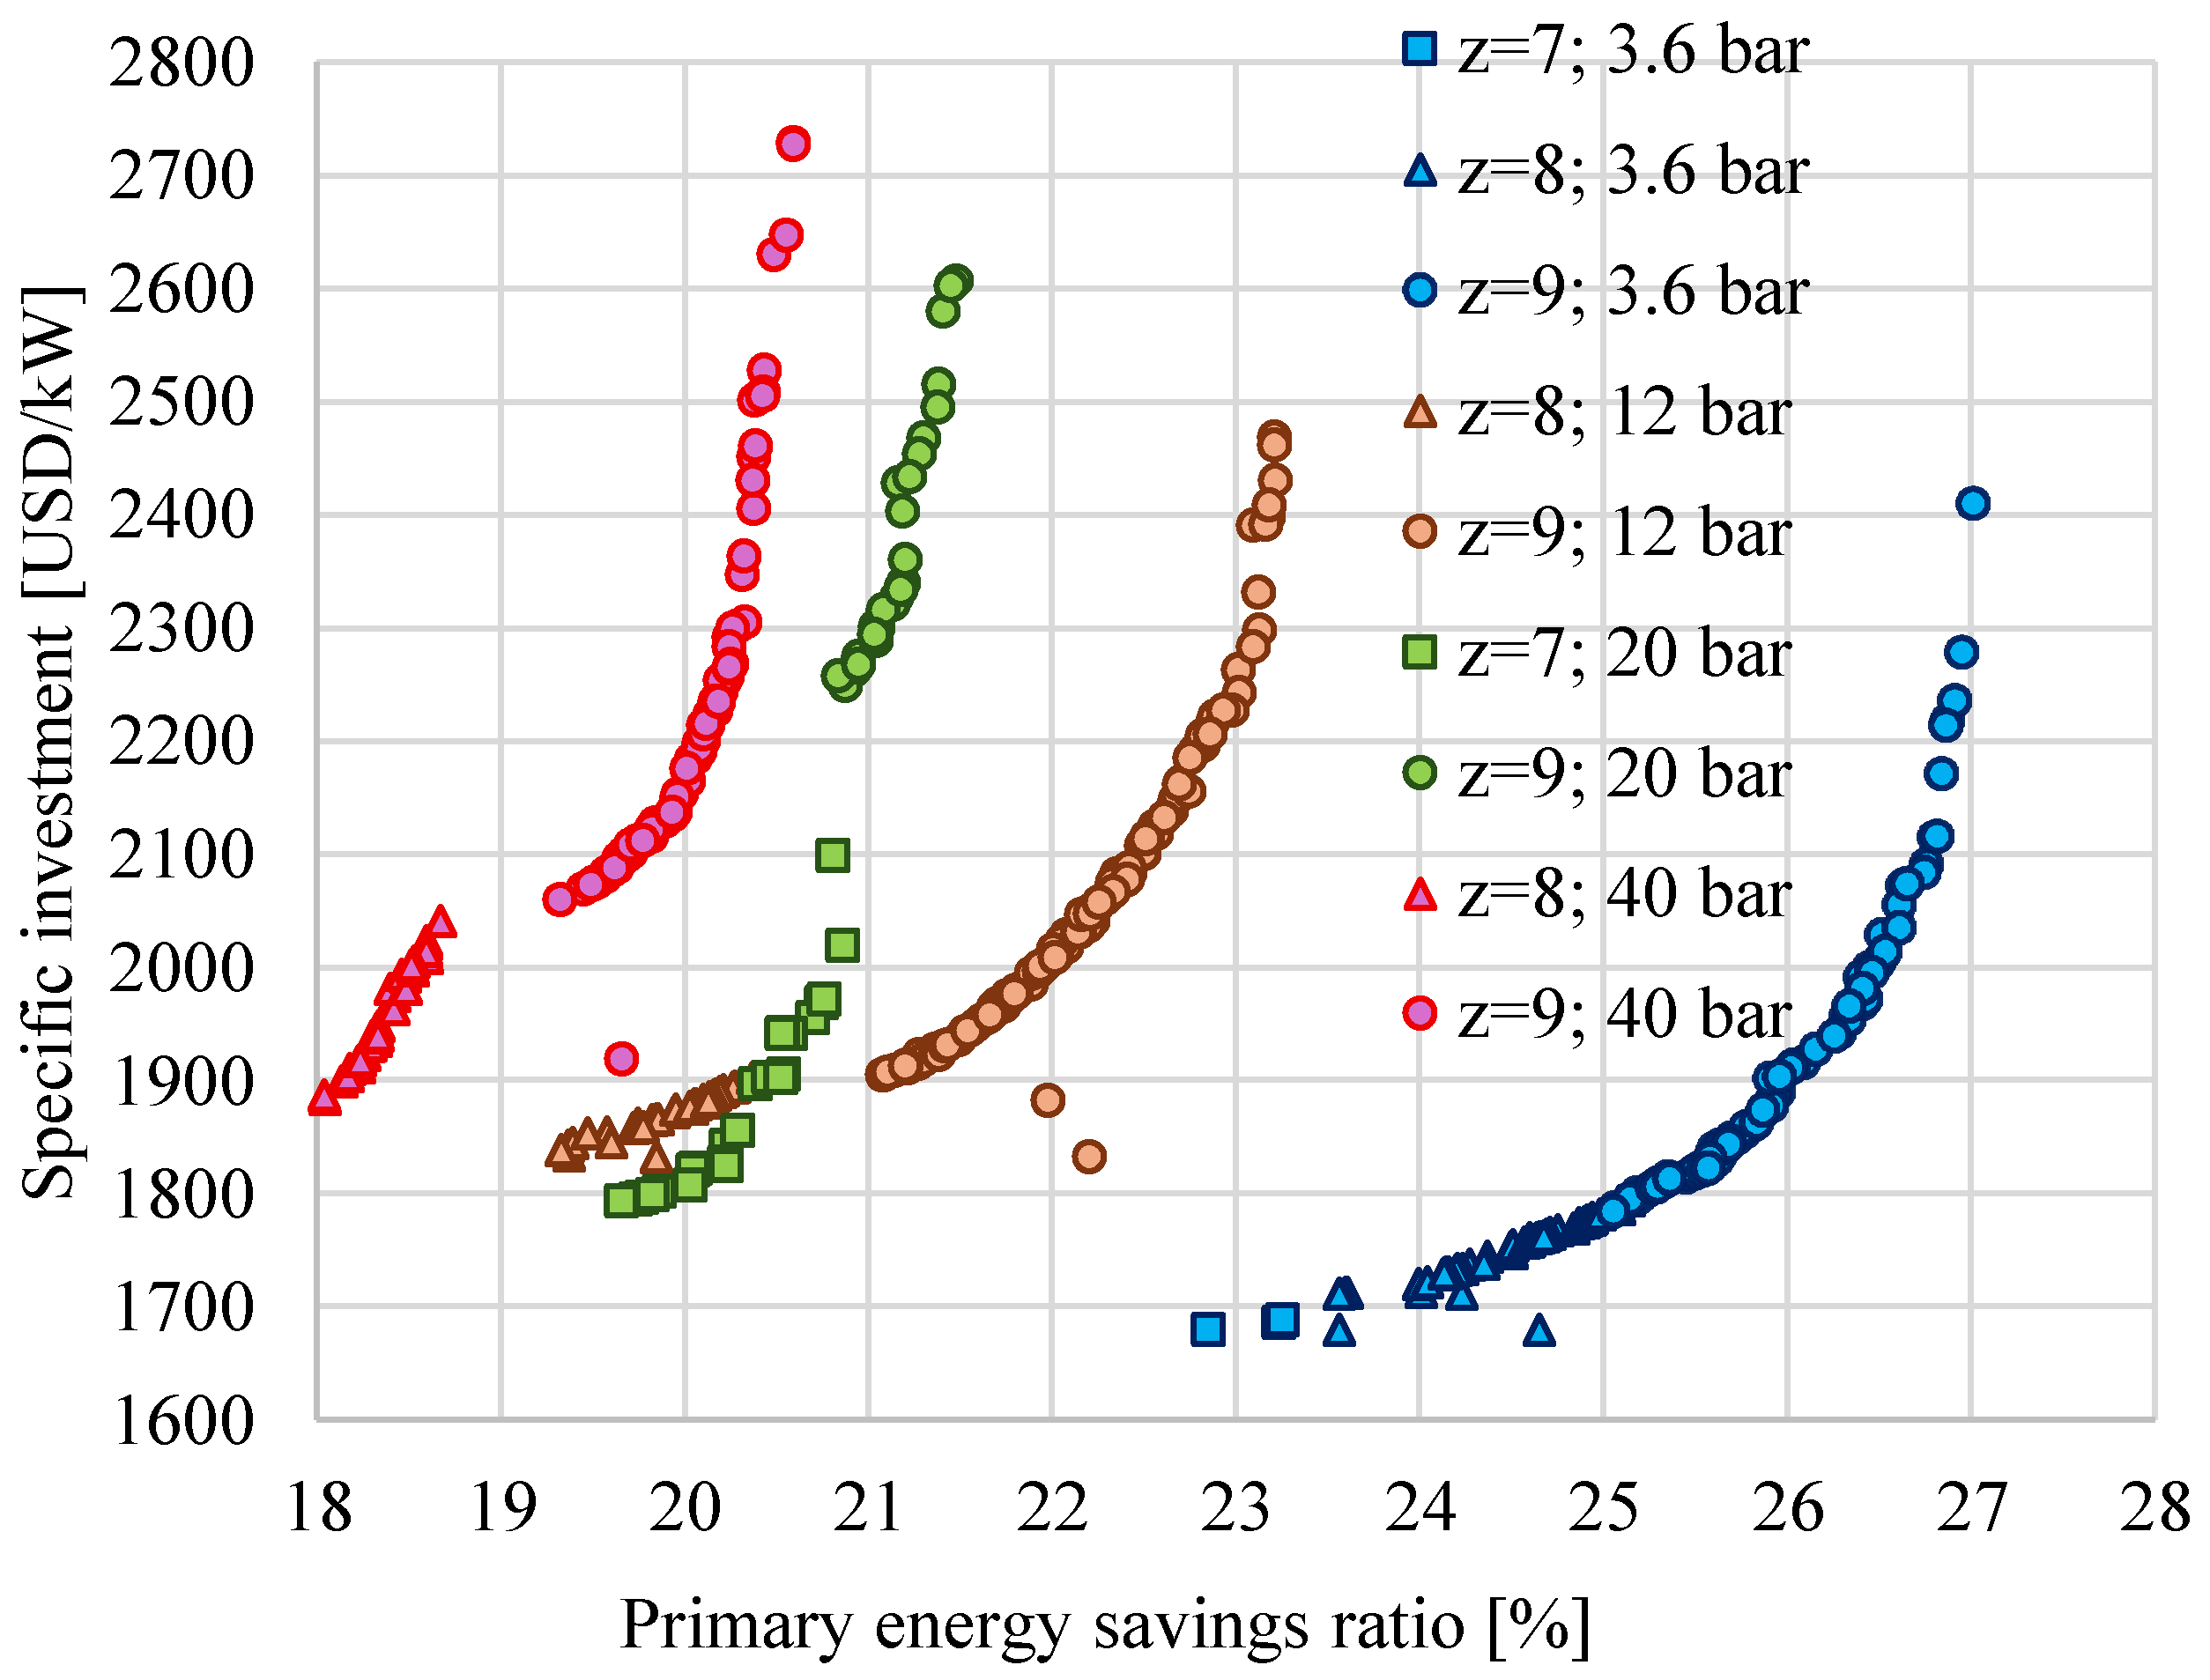
In the case of a high heat consumer, ηgl has the highest values. For QSC = 0.4QSG, ηgl varies between 68.8% and 75.2% (Figure 11). Also, in that case, PESratio has the highest values. For QSC = 0.4QSG, the PESratio varies between 18% and 27% (Figure 12). For the lowest pSC (pSC = 3.6 bar), the PESratio is over 23.6% (Figure 12 and Figure 14).
When the steam pressure at the exit of the HPT increases, Δ t p (Equation (12)) also increases. This happens until the maximum imposed value of Δ t p is reached. When Δ t p reaches its maximum accepted value, z is increased to reduce Δ t p . In Figure 11, as well as in Figure 3 and Figure 7, at SC pressures of 40 bar, a discontinuity in the variation of the global efficiency of the CHP plant is observed when the number of preheaters, z, changes.
In the cases in which the steam consumer (SC) requires 40 bar, the following apply:
-
If z = 8, the SC is fed from the steam extraction somewhere along the HPT, with the pressure at the HPT exit able to vary freely between the limits imposed for r p .
-
If z = 9, the SC is fed from the steam extraction at the exit of the HPT, thus fixing the pressure at the HPT exit at 40 bar, as required by the SC.
Therefore, in the case in which the SC is fed from the steam extraction at the HPT exit (z = 9), the number of possible cases is drastically reduced. For example, for a particular pms, there is only one possible value for r p , not a range of values. Thus, there are no more continuous possible cases between the minimum r p and the one corresponding to 40 bar. Because of this, when z changes from 8 to 9, a jump is generated ( r p jumps directly to the high value that corresponds to the SC pressure of 40 bar). The corresponding feedwater temperature into the SG also jumps to a higher value. Therefore, the global efficiency of the CHP plant also jumps abruptly to a higher value (Figure 3, Figure 7 and Figure 11).
Similar discontinuities in Figure 3, Figure 7 and Figure 11 can be observed at an SC pressure of 20 bar, when the steam extraction for the SC jumps from the exit of the HPT into the IPT.
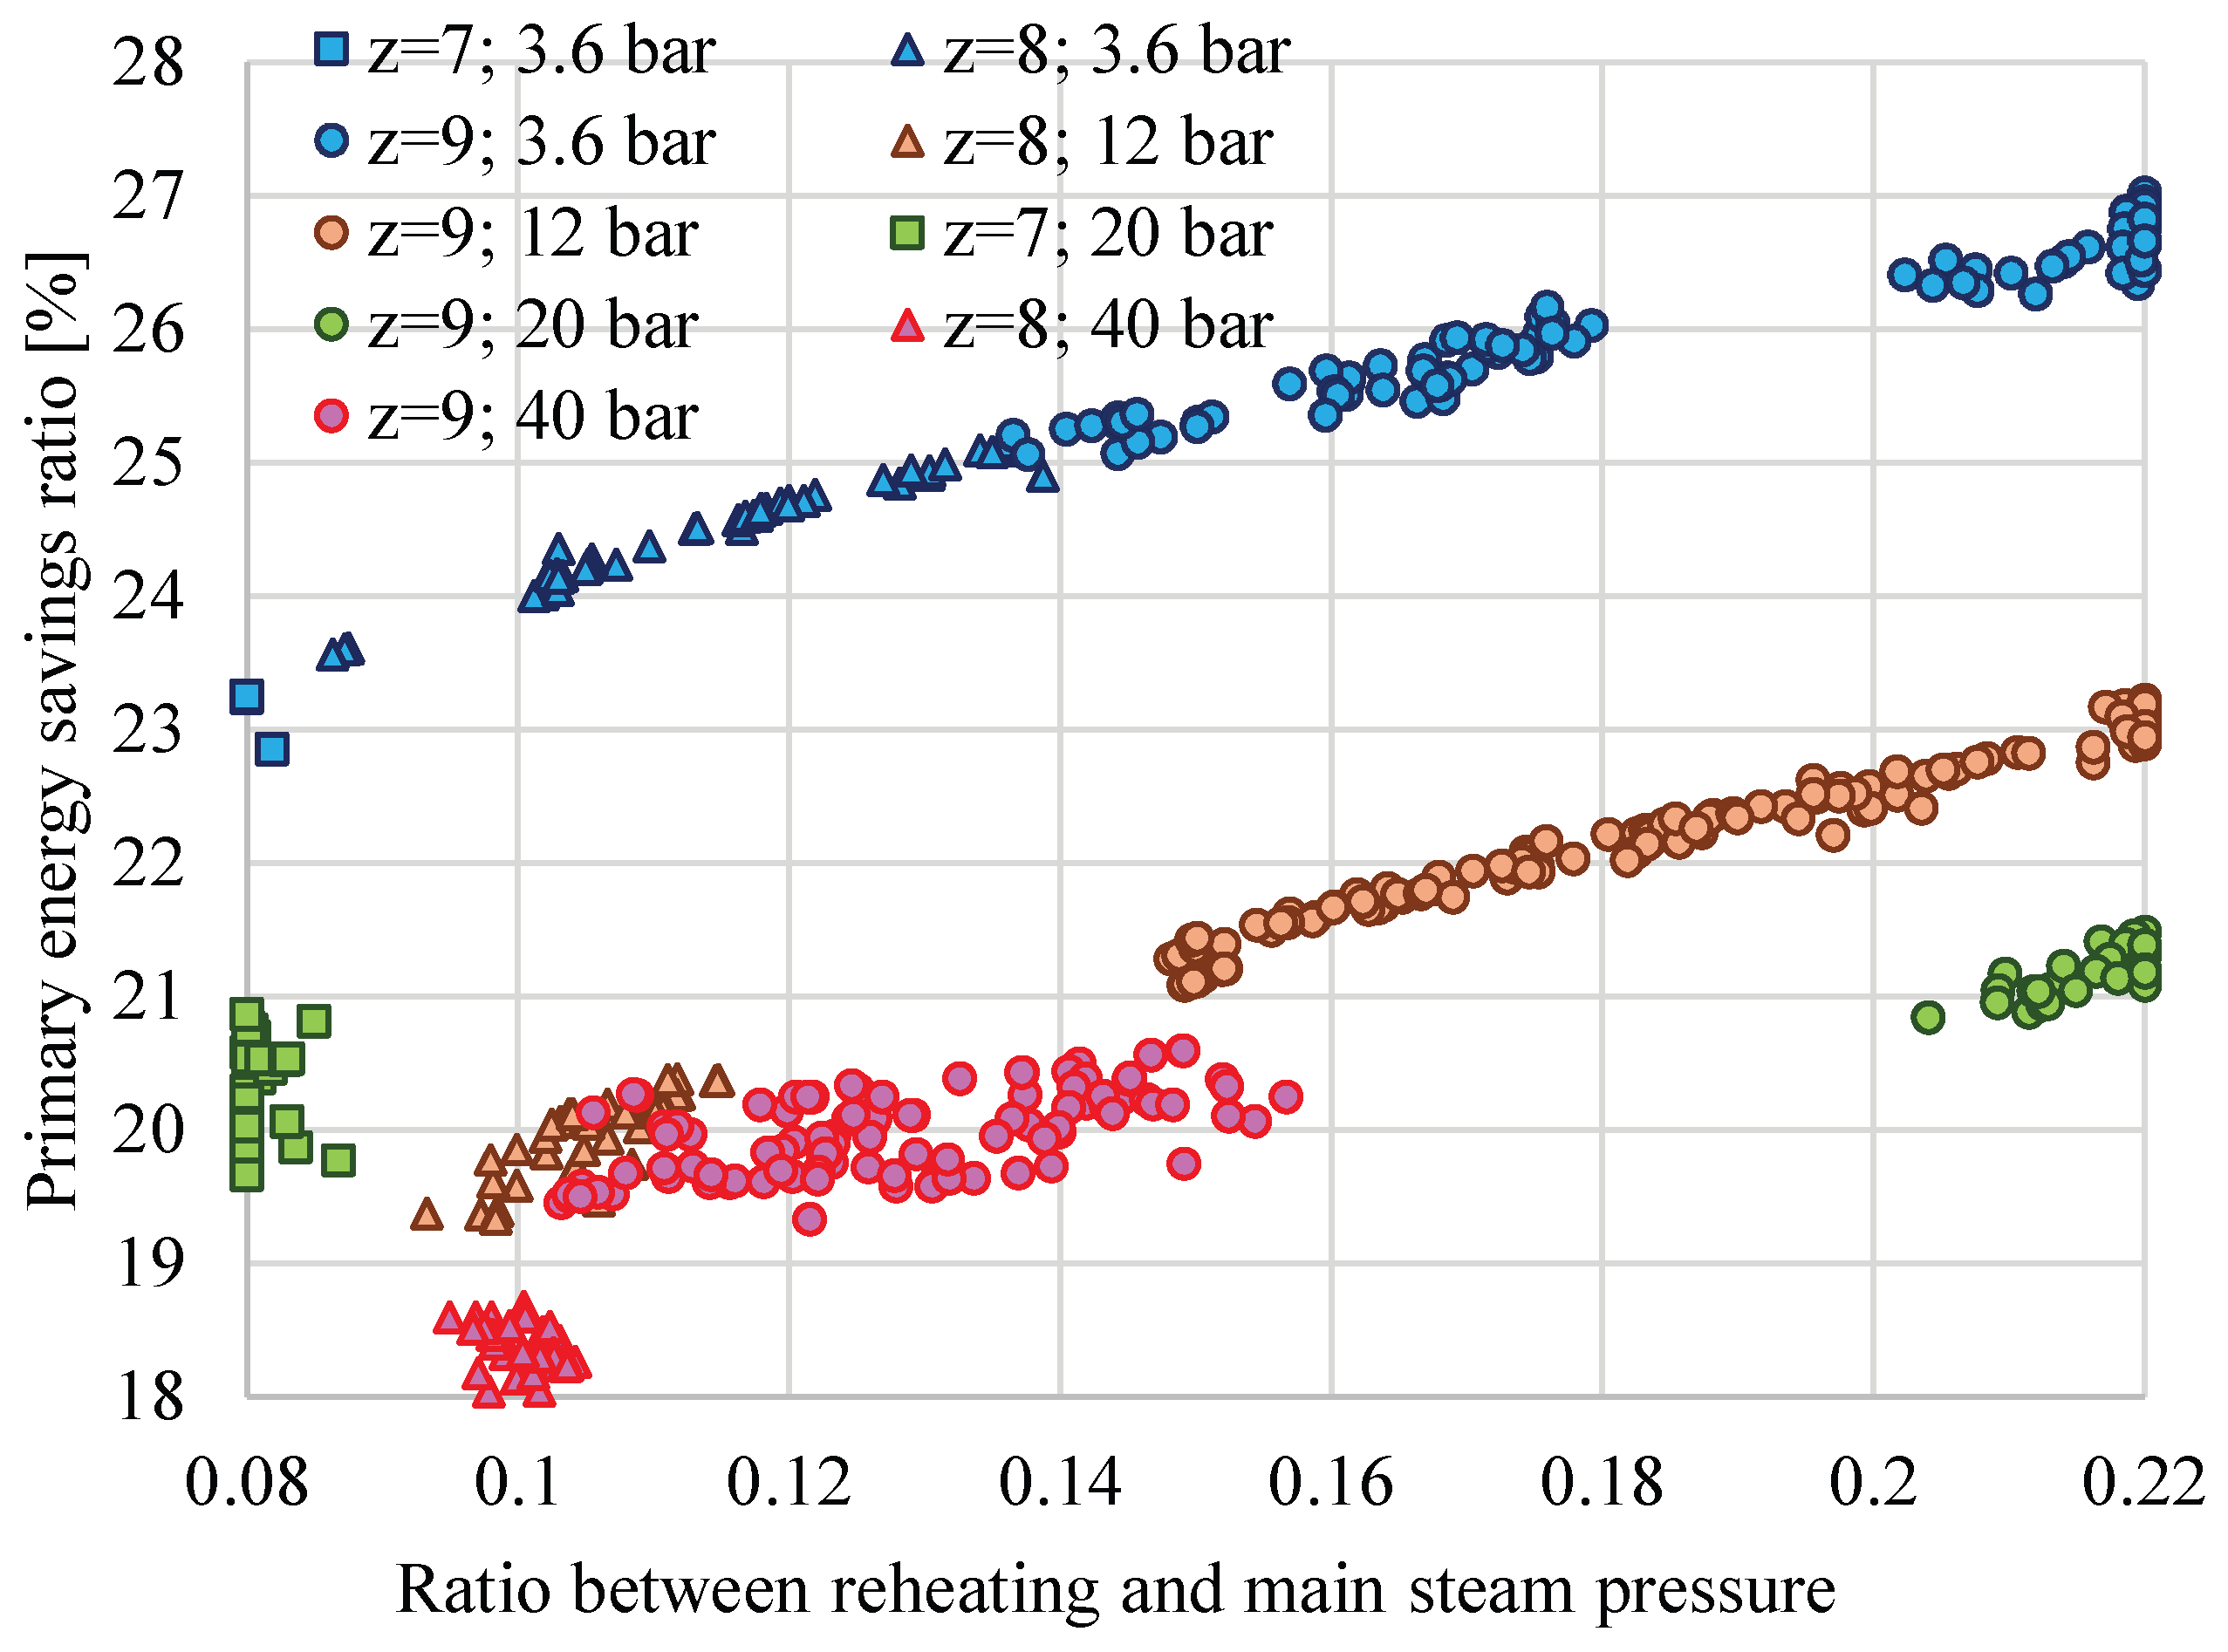
The PESratio depends strongly on QSC, increasing with QSC (Table 5, Table 7 and Table 9). Also, the PESratio depends on the pSC and the number of preheaters (z). For QSC = 0.4QSG and pSC = 3.6 bar, if z = 9, the PESratio is between 25.1% and 27.0%, while for z = 7, the PESratio is between 23.9% and 23.2%. Also, for QSC = 0.4QSG and pSC = 20 bar, if z = 9, the PESratio is between 20.8% and 21.5%, while for z = 7, the PESratio is between 19.7% and 20.9% (Figure 12 and Figure 14).
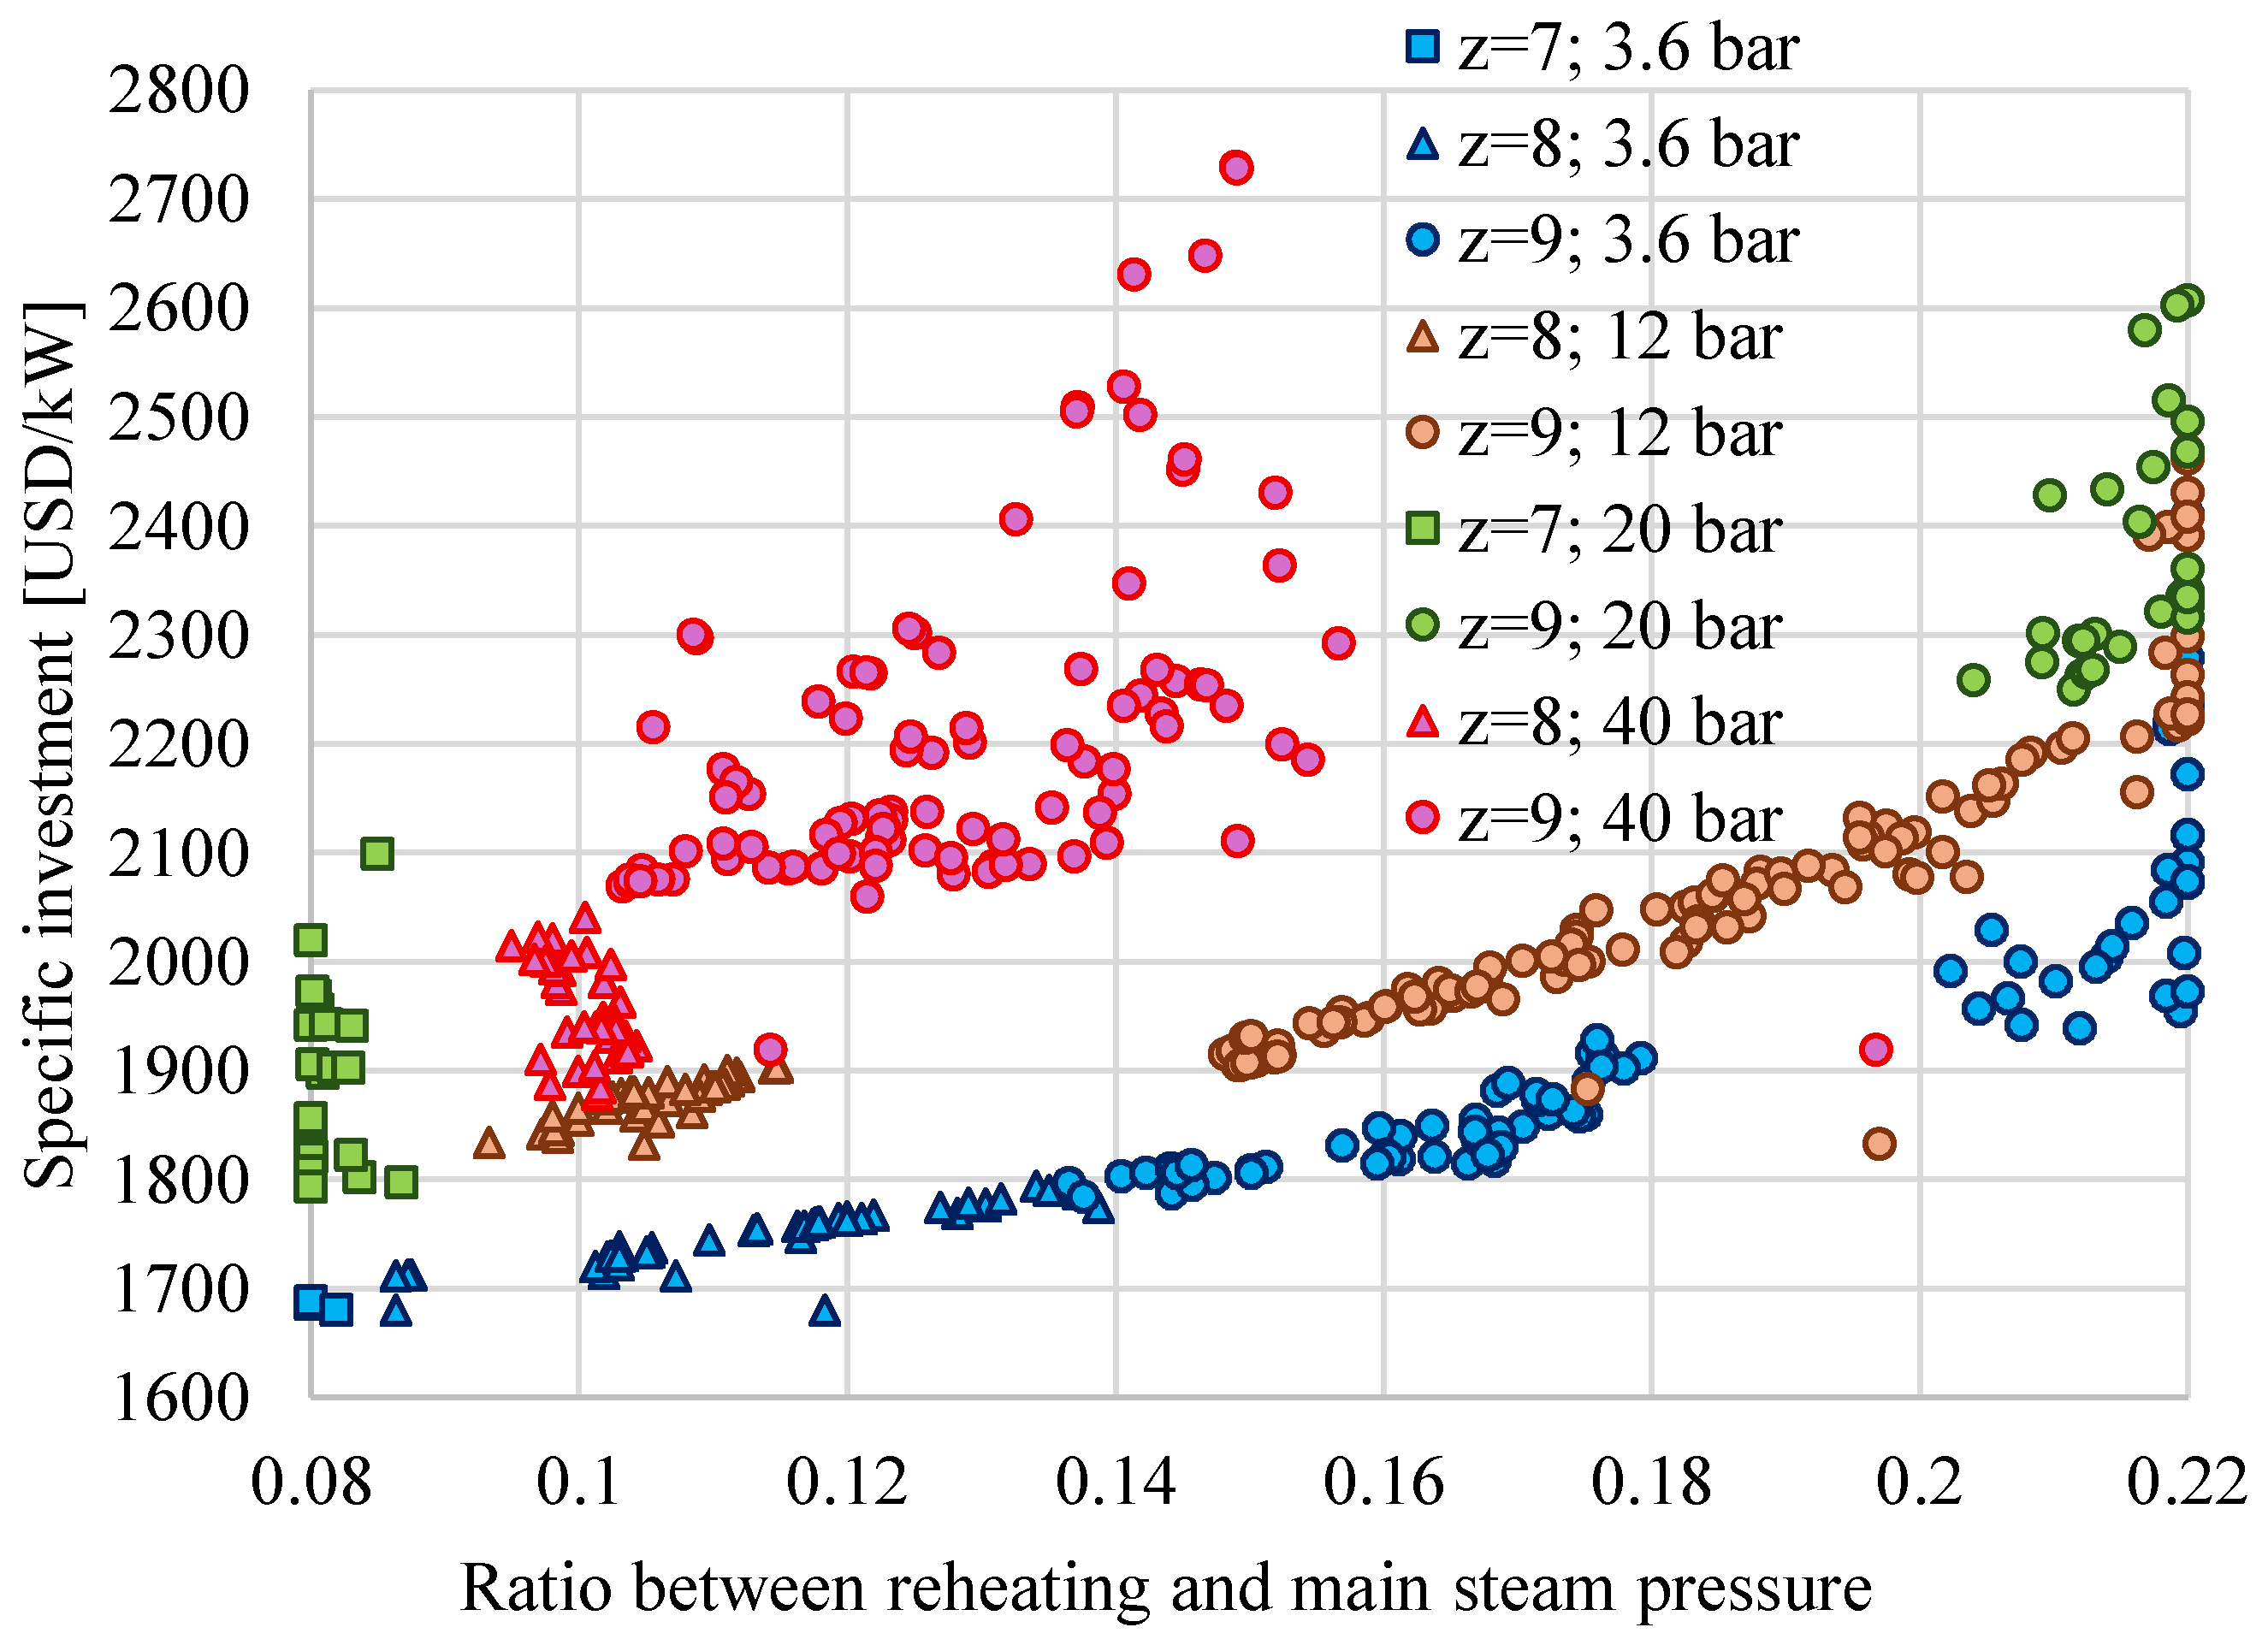
The optimum rp depends strongly on the number of preheaters (z) (Figure 5, Figure 6, Figure 9, Figure 10, Figure 13 and Figure 14). For QSC = 0.4QSG and pSC = 20 bar, if z = 9, rp is over 0.204, while for z = 7, rp is only 0.087. Also, for QSC = 0.4QSG and pSC = 12 bar, if z = 9, rp is over 0.148, while for z = 8, rp is between 0.093 and 0.115 (Figure 13 and Figure 14).
ηex does not have significant variations even if the power produced by the turbine varies significantly (Table 5, Table 7 and Table 9), because the decrease in power is compensated by an increase in exergy sent to the SC.
CCHP depends strongly on pSC. CCHP increases if pSC decreases, for the same QSC (Table 5, Table 7 and Table 9), because more power is produced in cogeneration. The steam required for the SC produces power until it is extracted from the turbine; the lower the pSC, the greater the additional power produced by the turbine.
PESratio and η g l show best values at 3.6 bar due to the higher expansion ratio of the steam between the main steam pressure and SC at the lower pressure (3.6 bar). This leads to an increase in the mechanical work in the turbine and in the electrical power. As the fuel heat flow rate has an imposed value, η g l increases. Similarly, PESratio increases. After steam is extracted from the turbine for SC, the steam mass flow rate in the rest of the turbine (from SC pressure to the condenser pressure) decreases substantially, and therefore, the corresponding mechanical work and electrical power for that section of the turbine decreases substantially. The shorter this last turbine section is, the better the performance.

5. Conclusions

The optimum design of cogeneration with steam turbines depends on the heat consumer requirements. Steam consumers requiring steam pressures between 3.6 bar and 40 bar were analyzed, for delivered heat flow rates between 10% and 40% of the fuel heat flow rate into the steam generators. The best design solution was searched among schemes with extraction-condensing steam turbines, reheat, and supercritical parameters. Based on a design methodology, by using a genetic algorithm, a first Pareto frontier was defined. The four objective functions were global efficiency, specific investment in equipment, exergetic efficiency, and power-to-heat ratio in full cogeneration mode. From the first Pareto, a second one was computed by selecting the solutions with maximum global efficiency and minimum specific investment in equipment. High-efficiency cogeneration schemes with primary energy savings ratios higher than 10% were selected.
The main conclusions of the optimization study are as follows:
  • The ratio between the reheating pressure and the main steam pressure (rp) depends strongly on the number of preheaters (z); higher z corresponds to a higher optimal rp.
  • The PESratio depends strongly on SC requirements. When QSC increases, the PESratio also increases from values below 10% (for QSC = 0.1QSG and a small number of preheaters) to values above 25% (for QSC = 0.4QSG, pSC = 3.6 bar, and z = 9).
  • For a medium-heat consumer (QSC = 0.2QSG) at IsEQ = 2000 USD/kW and z = 9, ηgl increases by 4.3% if pSC decreases from 40 bar to 3.6 bar.
  • For the same QSC, CCHP increases with the decrease in pSC due to the supplementary power produced in cogeneration.
This study showed the influences of the requirements of the steam consumer and of the main steam parameters on cogeneration design solutions. A future study can analyze the heuristic optimization of supercritical steam cogeneration power plants with two steam consumers. Also, this subject can be further investigated by studying the possible integration of CO2 capture and renewable energy sources in the optimized schemes.

Author Contributions

Conceptualization, V.-E.C. and I.O.; methodology, V.-E.C. and I.O.; software, I.O.; validation, V.-E.C. and I.O.; investigation, V.-E.C.; writing—original draft preparation, V.-E.C. and I.O.; writing—review and editing, V.-E.C. and I.O. All authors have read and agreed to the published version of the manuscript.

Funding

This research received no external funding.

Data Availability Statement

The original contributions presented in this study are included in this article; further inquiries can be directed to the corresponding author.

Conflicts of Interest

The authors declare no conflicts of interest.

References

  1. Directive 2012/27/EU of the European Parliament and of the Council of 25 October 2012 on Energy Efficiency, Amending Directives 2009/125/EC and 2010/30/EU and Repealing Directives 2004/8/EC and 2006/32/EC. Off. J. Eur. Union 2012, L 315/1, 14.11.2012. Available online: https://eur-lex.europa.eu/legal-content/EN/TXT/HTML/?uri=CELEX:32012L0027 (accessed on 28 June 2025).
  2. Kurmayer, N.J. New EU Energy Efficiency Directive Sets 11.7% Reduction Target by 2030. Euractiv. 10 March 2023. Available online: https://www.euractiv.com/section/energy-environment/news/new-eu-energy-efficiency-directive-sets-11-7-reduction-target-by-2030/ (accessed on 28 June 2025).
  3. Caglayan, H.; Caliskan, H.; Hong, H.; Caliskan, N.; Kale, U.; Kilikevičius, A. Advanced exergoeconomic analysis and mathematical modelling of the natural gas fired gas turbine unit used for industrial cogeneration system. Case Stud. Therm. Eng. 2024, 61, 104969. [Google Scholar] [CrossRef]
  4. Da Silva, L.M.C.; Alcântara, M.T.; Higa, M. Cogeneration and thermal integration of multiple effect evaporator in sugarcane industry. Therm. Sci. Eng. Prog. 2025, 63, 103715. [Google Scholar] [CrossRef]
  5. Lozano, M.A.; dos Santos, R.; Santos, J.J.C.S.; Serra, L.M. Optimal modes of operation and product cost allocation in sugarcane steam cogeneration plants. Therm. Sci. Eng. Prog. 2024, 52, 102686. [Google Scholar] [CrossRef]
  6. Wu, X.L.; Yang, Y.; Li, K.; Xu, Y.W.; Peng, J.; Chi, B.; Wang, Z.; Li, X. Performance prediction of gasification-integrated solid oxide fuel cell and gas turbine cogeneration system based on PSO-BP neural network. Renew. Energy 2024, 237, 121711. [Google Scholar] [CrossRef]
  7. Iodice, P.; Langella, G.; Amoresano, A.; Senatore, A. Comparative exergetic analysis of solar integration and regeneration in steam power plants. J. Energy Eng. 2017, 143, 04017042. [Google Scholar] [CrossRef]
  8. Hajabdollahi, H.; Saleh, A.; Yadollahi, N.K. Multi-objective optimization of a solar-assisted cogeneration system in hot climate: An exergoeconomic and exergoenvironmental assessment. Therm. Sci. Eng. Prog. 2025, 62, 103656. [Google Scholar] [CrossRef]
  9. Michaelides, E.E. Power and Energy Requirements for Carbon Capture and Sequestration. Thermo 2025, 5, 8. [Google Scholar] [CrossRef]
  10. Guo, P.; Hua, J.; Xue, Q.; Zhao, X.; Hu, J.; Duan, P. A study on the integration and flexible operation strategy of sodium-based CO2 capture system in cogeneration power plants and economic analysis. Energy Convers. Manag. 2025, 326, 119491. [Google Scholar] [CrossRef]
  11. Zhi, L.H.; Hu, P.; Chen, L.X.; Zhao, G. Performance analysis and optimization of engine waste heat recovery with an improved transcritical-subcritical parallel organic Rankine cycle based on zeotropic mixtures. Appl. Therm. Eng. 2020, 181, 115991. [Google Scholar] [CrossRef]
  12. Abolghasem, M.; Sadeghi, K.; Ghazaie, S.H.; Sokolova, E.; Sergeev, V.; Ksenia, N.; Peng, W. Enhancing nuclear cogeneration efficiency using the low-grade waste heat recovery from nuclear hydrogen production system. Nucl. Eng. Des. 2025, 441, 114166. [Google Scholar] [CrossRef]
  13. Huang, Z.; You, H.; Han, J.; Li, G.; Xiao, Y.; Hu, B.; Chen, Z.H.; Chen, D. Techno-economic evaluation and multi-objective optimization of a cogeneration system integrating solid oxide fuel cell with steam Rankine and supercritical carbon dioxide Brayton cycles. Fuel 2025, 382, 133675. [Google Scholar] [CrossRef]
  14. Wu, Y.; Fu, L.; Zhang, S.; Tang, D. Study on a novel co-operated heat and power system for improving energy efficiency and flexibility of cogeneration plants. Appl. Therm. Eng. 2019, 163, 114429. [Google Scholar] [CrossRef]
  15. Sharew, S.S.; Di Pretoro, A.; Yimam, A.; Negny, S.; Montastruc, L. Combining Exergy and Pinch Analysis for the Operating Mode Optimization of a Steam Turbine Cogeneration Plant in Wonji-Shoa, Ethiopia. Entropy 2024, 26, 453. [Google Scholar] [CrossRef]
  16. Sharew, S.S.; Di Pretoro, A.; Yimam, A.; Negny, S.; Montastruc, L. Exploiting exergy and exergoeconomic analysis as decisional tool for cogeneration plant optimal operating mode: A sugar factory case study. Energy Rep. 2024, 12, 143–157. [Google Scholar] [CrossRef]
  17. Shen, F.; Zhao, L.; Du, W.; Zhong, W.; Qian, F. Large-scale industrial energy systems optimization under uncertainty: A data-driven robust optimization approach. Appl. Energy 2020, 259, 114199. [Google Scholar] [CrossRef]
  18. Ali, R.H.; Samee, A.A.A.; Attalla, M.; Maghrabie, H.M. Energy-exergy approach of a cogeneration system in pulp and paper industry with a chemical recovery of black liquor and soda. Case Stud. Therm. Eng. 2023, 42, 102712. [Google Scholar] [CrossRef]
  19. Zeitoun, O.; Orfi, J.; Khan, S.U.-D.; Al-Ansary, H. Desalinated Water Costs from Steam, Combined, and Nuclear Cogeneration Plants Using Power and Heat Allocation Methods. Energies 2023, 16, 2752. [Google Scholar] [CrossRef]
  20. Choi, S.; Kim, S.; Jung, M.; Lee, J.; Lim, J.; Kim, M. Comparative analysis of exergy-and enthalpy-based allocation methods for cogeneration businesses in the industrial complex of South Korea. Energy 2022, 240, 122837. [Google Scholar] [CrossRef]
  21. Li, D.; Wang, J. Study of supercritical power plant integration with high temperature thermal energy storage for flexible operation. J. Energy Storage 2018, 20, 140–152. [Google Scholar] [CrossRef]
  22. Manesh, M.K.; Navid, P.; Baghestani, M.; Abadi, S.K.; Rosen, M.A.; Blanco, A.M.; Amidpour, M. Exergoeconomic and exergoenvironmental evaluation of the coupling of a gas fired steam power plant with a total site utility system. Energy Convers. Manag. 2014, 77, 469–483. [Google Scholar] [CrossRef]
  23. Mousavi Rabeti, S.A.; Khoshgoftar Manesh, M.H.; Blanco-Marigorta, A.M.; Del Río Gamero, B. Multi-objective Optimization, Techno-economic Analysis, and Life Cycle Assessment of an Innovative Solar-Biomass-Driven Cogeneration System Integrated with MED-RO-MD: A Case Study of the Canary Islands. Renew. Energy 2025, 256, 123757. [Google Scholar] [CrossRef]
  24. Nikolaidis, P. Mixed Thermal and Renewable Energy Generation Optimization in Non-Interconnected Regions via Boolean Mapping. Thermo 2024, 4, 445–460. [Google Scholar] [CrossRef]
  25. Wang, X.; Wang, C.; Zhu, J.; Wang, H.; Dai, C.; Sun, L. Dynamic Exergy Analysis of Heating Surfaces in a 300 MW Drum-Type Boiler. Thermo 2025, 5, 17. [Google Scholar] [CrossRef]
  26. Saari, J.; Martinez, C.M.; Kaikko, J.; Sermyagina, E.; Mankonen, A.; Vakkilainen, E. Techno-economic optimization of a district heat condenser in a small cogeneration plant with a novel greedy cuckoo search. Energy 2022, 239, 122622. [Google Scholar] [CrossRef]
  27. Panowski, M.; Zarzycki, R.; Kobyłecki, R. Conversion of steam power plant into cogeneration unit—Case study. Energy 2021, 231, 120872. [Google Scholar] [CrossRef]
  28. Wang, Z.; Gu, Y.; Liu, H.; Li, C. Optimizing thermal–electric load distribution of large-scale combined heat and power plants based on characteristic day. Energy Convers. Manag. 2021, 248, 114792. [Google Scholar] [CrossRef]
  29. Wang, X.; Duan, L. Comparative study of multiple-mode collaborative operation strategy and traditional heat and power decoupling technologies for cogeneration system based on GTCC. Case Stud. Therm. Eng. 2023, 49, 103213. [Google Scholar] [CrossRef]
  30. Cenușă, V.E.; Opriș, I. Design optimization of cogeneration steam power plants with supercritical parameters. Sustain. Energy Technol. Assess. 2024, 64, 103727. [Google Scholar] [CrossRef]
  31. Opriş, I.; Cenuşă, V.E.; Norişor, M.; Darie, G.; Alexe, F.N.; Costinaş, S. Parametric optimization of the thermodynamic cycle design for supercritical steam power plants. Energy Convers. Manag. 2020, 208, 112587. [Google Scholar] [CrossRef]
  32. Opriș, I.; Cenușă, V.E. Parametric and heuristic optimization of multiple schemes with double-reheat ultra-supercritical steam power plants. Energy 2023, 266, 126454. [Google Scholar] [CrossRef]
  33. Kler, A.M.; Zharkov, P.; Epishkin, N.O. Parametric optimization of supercritical power plants using gradient methods. Energy 2019, 189, 116230. [Google Scholar] [CrossRef]
  34. Scilab Enterprises. Scilab 6.0.1. Available online: https://www.scilab.org/ (accessed on 4 May 2025).
  35. Bondarenko, O. XSteam. Water and Steam Properties According to IAPWS IF-97. 2020. Available online: https://fileexchange.scilab.org/toolboxes/502000 (accessed on 4 May 2025).
  36. Lai, F.; Wang, S.; Liu, M.; Yan, J. Operation optimization on the large-scale CHP station composed of multiple CHP units and a thermocline heat storage tank. Energy Convers. Manag. 2020, 211, 112767. [Google Scholar] [CrossRef]
  37. Zhang, K.; Liu, M.; Zhao, Y.; Zhang, S.; Yan, H.; Yan, J. Thermo-economic optimization of the thermal energy storage system extracting heat from the reheat steam for coal-fired power plants. Appl. Therm. Eng. 2022, 215, 119008. [Google Scholar] [CrossRef]
  38. Liu, H.; Geng, Z.; Gu, Y.; Mo, Z.; Yu, Z.; He, X.; Lu, S. A regional integrated energy system with a coal-fired CHP plant, screw turbine and solar thermal utilization: Scenarios for China. Energy Convers. Manag. 2020, 212, 112812. [Google Scholar] [CrossRef]
  39. Daneh-Dezfuli, A.; Ghanad-Dezfuli, M.; Changizian, M. A novel 4E-based optimization framework for circular biomass multi-generation systems integrating NSGA-II and ANN to enhance resource efficiency and sustainability. Int. Commun. Heat Mass Transf. 2025, 164, 108849. [Google Scholar] [CrossRef]
  40. Wang, L.; Yang, Y.; Dong, C.; Morosuk, T.; Tsatsaronis, G. Parametric optimization of supercritical coal-fired power plants by MINLP and differential evolution. Energy Convers. Manag. 2014, 85, 828–838. [Google Scholar] [CrossRef]
  41. Cenușă, V.E.; Opriș, I. Optimal Design Parameters for Supercritical Steam Power Plants. Thermo 2025, 5, 1. [Google Scholar] [CrossRef]
  42. Jiang, Q.; Wang, P. NSGA-II algorithm based control parameters optimization strategy for megawatt novel nuclear power systems. Energy 2025, 316, 134444. [Google Scholar] [CrossRef]
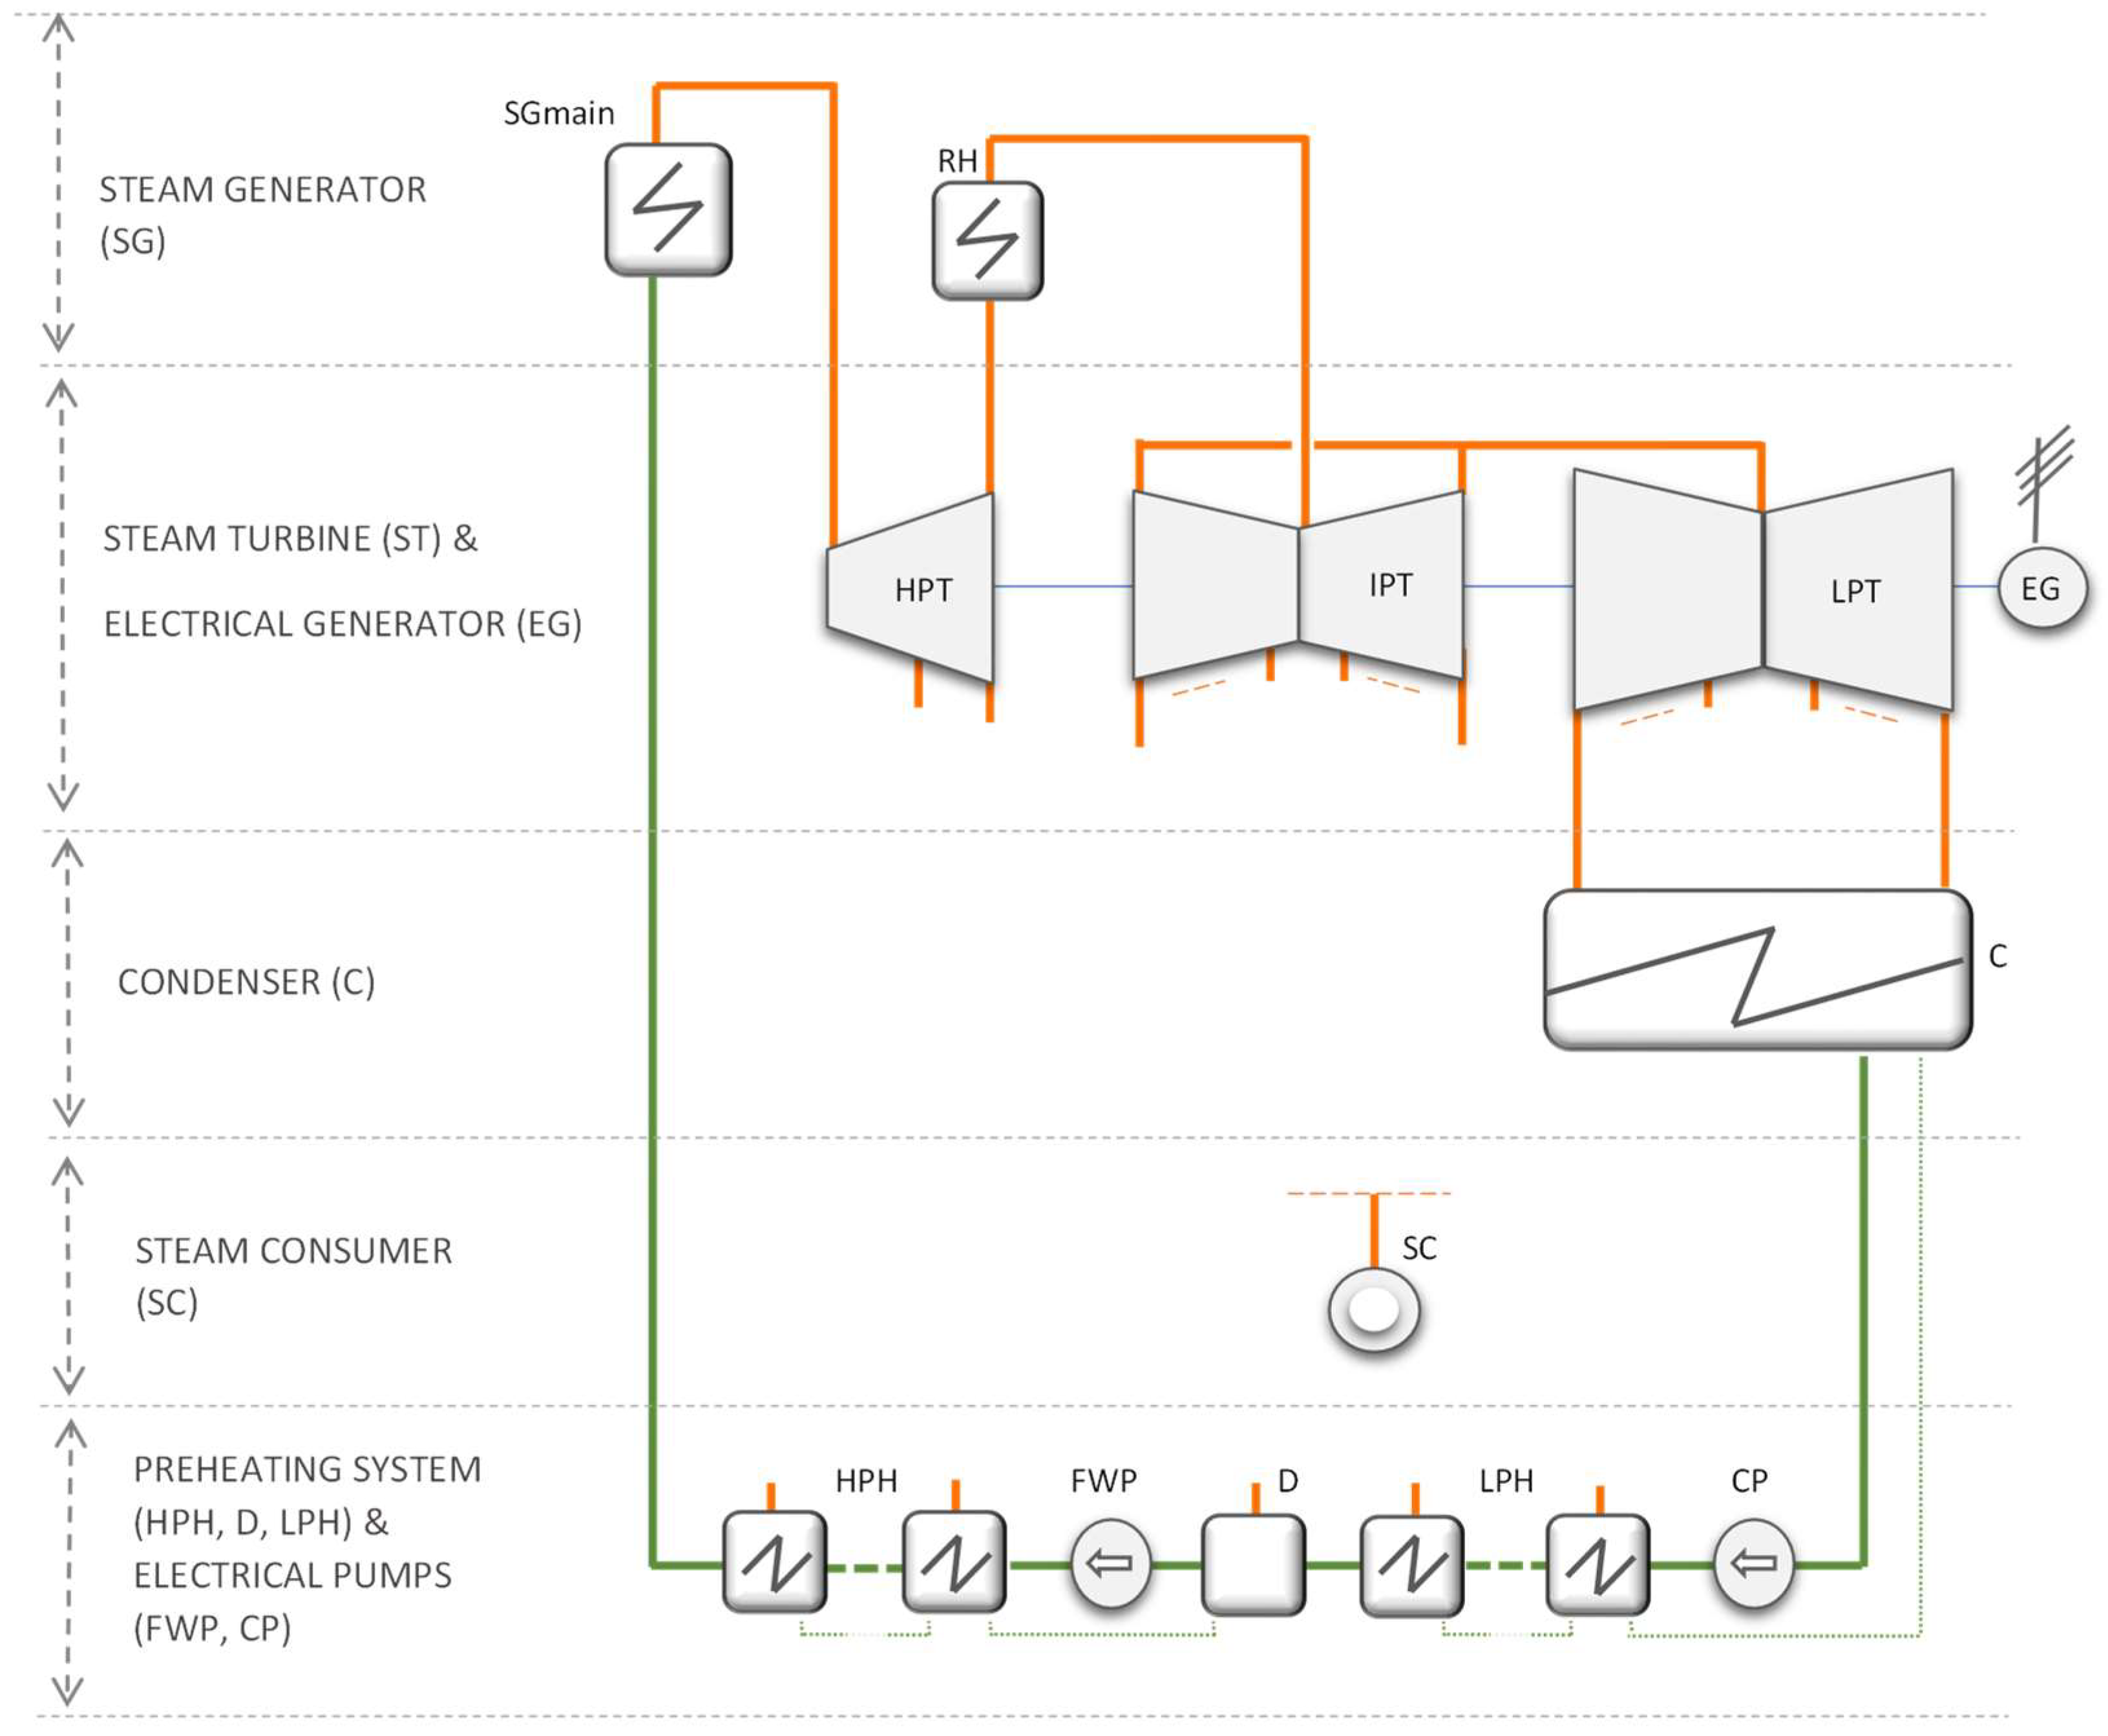
Figure 1. Thermodynamic cycle of supercritical cogeneration steam TPPs.
Thermo 05 00029 g001
Figure 2. Thermodynamic cycle optimization flowchart.
Thermo 05 00029 g002
Figure 3. Pareto frontier for QSC = 0.1QSG. Specific investment vs. global efficiency of the CHP plant.
Thermo 05 00029 g003
Figure 4. Pareto solution for QSC = 0.1QSG. Specific investment vs. primary energy savings ratio.
Thermo 05 00029 g004
Figure 5. Pareto solution for QSC = 0.1QSG. Specific investment vs. ratio between reheating and main steam pressure.
Thermo 05 00029 g005
Figure 6. Pareto solution for QSC = 0.1QSG. Primary energy saving ratio vs. ratio between reheating and main steam pressure.
Thermo 05 00029 g006
Figure 7. Pareto frontier for QSC = 0.2QSG. Specific investment vs. global efficiency of the CHP plant.
Thermo 05 00029 g007
Figure 8. Pareto solution for QSC = 0.2QSG. Specific investment vs. primary energy savings ratio.
Thermo 05 00029 g008
Figure 9. Pareto solution for QSC = 0.2QSG. Specific investment vs. ratio between reheating and main steam pressure.
Thermo 05 00029 g009
Figure 10. Pareto solution for QSC = 0.2QSG. Primary energy saving ratio vs. ratio between reheating and main steam pressure.
Thermo 05 00029 g010
Figure 11. Pareto frontier for QSC = 0.4QSG. Specific investment vs. global efficiency of the CHP plant.
Thermo 05 00029 g011
Figure 12. Pareto solution for QSC = 0.4QSG. Specific investment vs. primary energy savings ratio.
Thermo 05 00029 g012
Figure 13. Pareto solution for QSC = 0.4QSG. Specific investment vs. ratio between reheating and main steam pressure.
Thermo 05 00029 g013
Figure 14. Pareto solution for QSC = 0.4QSG. Primary energy saving ratio vs. ratio between reheating and main steam pressure.
Thermo 05 00029 g014
Table 1. Input data into the thermodynamic cycle scheme.
ParameterSymbolUnits
Heat flow rate to steam generatorQSGkW
Main steam pressurepmsbar
Main steam temperaturetms°C
Difference between reheat and main steam temperatureΔtrh°C
Ratio between the reheating pressure and the main steam pressure rp-
Steam pressure at condenserpcbar
Heat flow rate at SCQSCkW
Steam pressure at SCpSCbar
Table 2. CHP plant performance indicators.
Performance IndicatorSymbolUnitsEquationLegend
global efficiency of the CHP plantηgl%ηgl = (PEGPEP + QSC)/QSG × 100PEG—power at EG, in kW; PEP—motor power of EP; QSC—heat flow rate to SC, in kW; QSG—fuel heat flow rate in SG, in kW.
exergetic efficiency ηex%ηex = (PEGPEP + ExSC)/Exf × 100 *PEG—power at EG, in kW; PEP—motor power of EP; ExSC—exergy of SC, in kW; Exf—input exergy of the fuel, in kW
power-to-heat ratio in full cogeneration modeCCHP-CCHP = PeCHP/QSCPeCHP—power in full cogeneration mode, in kW
specific investment in equipmentIsEQUSD/kWIsEQ = CEQ fm/PEGCEQ—cost of equipment (SGmain, RH, HPT, IPT, LPT, C, HPH, D, LPH, FWP, CP, EG), in USD; fm—multiplying factor to consider other costs and construction costs (fm = 2.08) [33]; PEG—power at EG, in kW.
* The reference temperature to compute exergy was 298.15 K.
Table 3. Input data into the optimization model.
ParameterUnitsDomain of Variation
pmsbar240–280
tms°C550–600
Δtrh°C0–20
rp-0.08–0.22
pcbar0.04–0.05
Table 4. Optimum values for low heat flow rate to the SC (QSC = 0.1QSG). Statistical analysis.
pSC
[bar]
Statistical Analysisrp
[-]
pms
[bar]
tms
[°C]
Δtrh
[°C]
pc
[bar]
3.6med ± σ 0.16 ± 0.03272.3 ± 5.4576.8 ± 7.115.1 ± 3.20.047 ± 0.003
min–max0.08–0.22246.4–279.9558.6–591.75.5–19.40.04–0.05
12med ± σ 0.17 ± 0.03274.3 ± 4.6578.8 ± 6.315 ± 2.30.045 ± 0.003
min–max0.09–0.22254.6–279.2566–596.24.7–19.70.04–0.05
20med ± σ 0.15 ± 0.05272.1 ± 6.8579.4 ± 5.514.9 ± 3.40.045 ± 0.003
min–max0.08–0.22244.1–278.9559.8–591.44.1–19.10.04–0.05
40med ± σ 0.12 ± 0.02274.2 ± 3.7577 ± 715.7 ± 1.60.047 ± 0.003
min–max0.09–0.16263.5–279.3557.9–595.96.9–18.80.04–0.05
Table 5. CHP plant performance indicators values for QSC = 0.1QSG. Statistical analysis.
pSC
[bar]
Statistical AnalysisPESratio
[%]
ηgl
[%]
IsEQ
[USD/kW]
CCHP
[-]
ηex
[%]
3.6med ± σ 11 ± 1.350.1 ± 0.62005 ± 1430.71 ± 0.0440.3 ± 0.5
min–max7.7–13.248.4–51.11799–24550.6–0.7638.9–41.3
12med ± σ 10.2 ± 1.249.6 ± 0.62080 ± 1670.56 ± 0.0340.6 ± 0.5
min–max7.2–12.148.2–50.51836–26400.48–0.6139.4–41.4
20med ± σ 9.5 ± 1.149.2 ± 0.52102 ± 1790.53 ± 0.0340.4 ± 0.6
min–max7.1–11.248.1–501821–25000.48–0.5739.2–41.2
40med ± σ 8.8 ± 1.348.9 ± 0.62003 ± 1350.48 ± 0.0740.3 ± 0.6
min–max6.5–1147.8–501829–24640.38–0.5539.2–41.3
Table 6. Optimum values for medium heat flow rate to the SC (QSC = 0.2QSG). Statistical analysis.
pSC
[bar]
Statistical Analysisrp
[-]
pms
[bar]
tms
[°C]
Δtrh
[°C]
pc
[bar]
3.6med ± σ 0.16 ± 0.04273.4 ± 5.1576.4 ± 5.815.8 ± 2.90.047 ± 0.003
min–max0.08–0.22252.8–278.5563.4–593.74.9–19.70.04–0.05
12med ± σ 0.18 ± 0.03275.2 ± 2.4580.3 ± 814.7 ± 2.60.045 ± 0.003
min–max0.09–0.22258.1–279.8559–599.64.8–180.04–0.05
20med ± σ 0.16 ± 0.05274.3 ± 4.8579.8 ± 6.214.8 ± 2.10.045 ± 0.004
min–max0.08–0.22254.5–278.4563.9–598.88.3–18.60.04–0.05
40med ± σ 0.12 ± 0.02273.7 ± 3.8580 ± 7.815.2 ± 2.60.046 ± 0.003
min–max0.08–0.16256–279.9556.2–598.24.1–19.30.04–0.05
Table 7. CHP plant performance indicators values for QSC = 0.2QSG. Statistical analysis.
pSC
[bar]
Statistical AnalysisPESratio
[%]
ηgl
[%]
IsEQ
[USD/kW]
CCHP
[-]
ηex
[%]
3.6med ± σ 16.5 ± 1.158.1 ± 0.61971 ± 1440.74 ± 0.0441 ± 0.5
min–max13.5–18.556.5–59.21767–24650.65–0.839.7–42
12med ± σ 14.9 ± 0.957.1 ± 0.52136 ± 1760.61 ± 0.0341.4 ± 0.4
min–max11.6–16.155.5–57.81833–24890.52–0.6540.1–42
20med ± σ 13.7 ± 0.956.5 ± 0.42152 ± 2040.56 ± 0.0141.2 ± 0.6
min–max11–1555.5–57.21815–28340.54–0.5840–42
40med ± σ 12.8 ± 1.256 ± 0.62085 ± 1910.52 ± 0.0441.1 ± 0.6
min–max9.9–14.454.5–56.91845–26400.45–0.5639.6–41.9
Table 8. Optimum values for high heat flow rate to the SC (QSC = 0.4QSG). Statistical analysis.
pSC
[bar]
Statistical Analysisrp
[-]
pms
[bar]
tms
[°C]
Δtrh
[°C]
pc
[bar]
3.6med ± σ 0.16 ± 0.04274.4 ± 3.3572.3 ± 6.315.5 ± 2.60.047 ± 0.003
min–max0.08–0.22252–279.3561.5–594.94.3–19.40.04–0.05
12med ± σ 0.17 ± 0.04275.2 ± 3.1572.7 ± 6.112.3 ± 2.30.047 ± 0.003
min–max0.09–0.22254.5–279.7557.2–591.25–18.30.04–0.05
20med ± σ 0.15 ± 0.07273.9 ± 4.3578.3 ± 7.713.8 ± 3.40.044 ± 0.004
min–max0.08–0.22263.8–278.7558.2–591.91.4–18.20.04–0.05
40med ± σ 0.12 ± 0.02276.6 ± 1.9578.9 ± 6.813.9 ± 2.50.045 ± 0.003
min–max0.09–0.2269.3–279.5566.3–597.36.5–190.04–0.05
Table 9. CHP plant performance indicators values for QSC = 0.4QSG. Statistical analysis.
pSC
[bar]
Statistical analysisPESratio
[%]
ηgl
[%]
IsEQ
[USD/kW]
CCHP
[-]
ηex
[%]
3.6med ± σ 25.4 ± 0.974 ± 0.71856 ± 1320.76 ± 0.0442.2 ± 0.5
min–max22.9–2772.4–75.21680–24100.67–0.8241.1–43.2
12med ± σ 21.7 ± 171.4 ± 0.72022 ± 1370.62 ± 0.0342.5 ± 0.4
min–max19.3–23.269.7–72.51832–24690.53–0.6741.3–43.3
20med ± σ 20.76 ± 0.570.8 ± 0.32146 ± 2630.58 ± 0.0141.5 ± 0.8
min–max19.65–21.4870–71.31793–26070.56–0.641.2–43.4
40med ± σ 19.53 ± 0.7870 ± 0.52139 ± 1740.54 ± 0.0342.3 ± 0.5
min–max17.81–20.5968.9–70.71878–27300.49–0.5741.4–43.1
Disclaimer/Publisher’s Note: The statements, opinions and data contained in all publications are solely those of the individual author(s) and contributor(s) and not of MDPI and/or the editor(s). MDPI and/or the editor(s) disclaim responsibility for any injury to people or property resulting from any ideas, methods, instructions or products referred to in the content.