Review

Biomedical Applications of Raman Spectroscopy: A Review

1
CMEMS-UMinho, University of Minho, 4800-058 Guimarães, Portugal
2
LABBELS-Associate Laboratory, Braga/Guimarães, Portugal
*
Author to whom correspondence should be addressed.
Photochem 2025, 5(4), 29; https://doi.org/10.3390/photochem5040029
Submission received: 18 July 2025 / Revised: 23 September 2025 / Accepted: 24 September 2025 / Published: 26 September 2025

Abstract

Raman spectroscopy is a widely used technology in the biomedical field, including specific applications from cancer diagnosis to an active role in the pharmaceutical industry. Despite the extensive use of Raman spectroscopy in research studies, there are still some limitations to its applicability in daily clinical diagnosis. This review initially presents the main principles of Raman spectroscopy and then its most relevant applications in the biomedical field, exploring the main advantages, challenges, and limitations. Additionally, other Raman-based techniques are identified as alternatives to the conventional technique. Overall, this review aims to present the currently available applications of Raman spectroscopy in the biomedical field and future appropriate perspectives, as possible guidance for new Raman-based biomedical devices.

1. Introduction

Raman spectroscopy is a powerful tool that gives a biochemical fingerprint of a sample. It relies on the intrinsic and inelastic scattering characteristics of the molecular composition of a sample and has several advantages, such as it does not require extrinsic labels (e.g., dyes, stains, or radioactive labels), it is non-invasive or non-destructive, it has a high chemical specificity, and it has a high degree of spatial resolution [1,2,3,4].
The Raman spectrum is the result of photons inelastically scattered due to the excitation or relaxation of the vibrational modes of molecules that compose a sample. The Raman spectrum plots the intensity of the Raman scattered radiation as a function of its frequency difference from the incident radiation (in units of wavenumbers, cm−1) [5,6].
In recent years, several studies have been conducted in the field of biomedical research, since diseases alter the chemical composition of a sample. Thus, Raman spectroscopy has the potential to differentiate between a diseased and a normal sample. Changes in the composition of a sample (due to disease development) lead to changes in the intensities, shapes, and locations of the Raman peaks. Besides Raman spectra acquisition, it is also required a large amount of trained reference data and robust analysis models (e.g., machine learning methods), since most of the samples (e.g., tissues) are a complex assembly of several molecular structures. Figure 1 shows an example of the significance of Raman spectroscopy combined with a machine learning method in biological diagnosis [1,2,7].
Raman spectroscopy has been used to differentiate cancerous colorectal [9], breast [10], skin [8], lung [11], prostate [12], and cervical [13] tissues. Moreover, Raman spectroscopy is also reported as a potential tool in the diagnosis and evaluation of neurodegenerative diseases [2], immunology (e.g., diagnosis and discrimination of autoimmune disorders) [3], the detection of infectious [14] and metabolic [15] diseases, and the pharmaceutical industry [16]. Figure 2 summarizes the most relevant biomedical applications of Raman spectroscopy.
Additionally, recent developments in Raman spectrometers, i.e., their simplicity, portability, low-cost, and ease of operation, make Raman technology attractive for biomedical research and future clinical applicability [17].
Other Raman-based techniques are described in biomedical research, such as stimulated Raman scattering (SRS), coherent anti-Stokes Raman scattering (CARS), surface-enhanced Raman spectroscopy (SERS), and tip-enhanced Raman spectroscopy (TERS), aiming to fill specific drawbacks of conventional Raman spectroscopy [2,18].
This review aims to present the most recent and relevant Raman studies in the biomedical field, identifying the main advantages, challenges, and limitations of each approach. Other Raman-based techniques will be described throughout this review. Future perspectives will also be addressed concerning the Raman spectroscopy applications in biomedical research and prospects for new Raman-based biomedical devices.

2. Principles of Raman Spectroscopy

The Raman effect was first observed in 1928 by the Indian physicist C.V. Raman [7,19]. Raman spectroscopy is based on the inelastic scattering of light, providing a unique fingerprint of a molecule or system, such as nonmetallic solids, liquids, gases, or polymers [17].
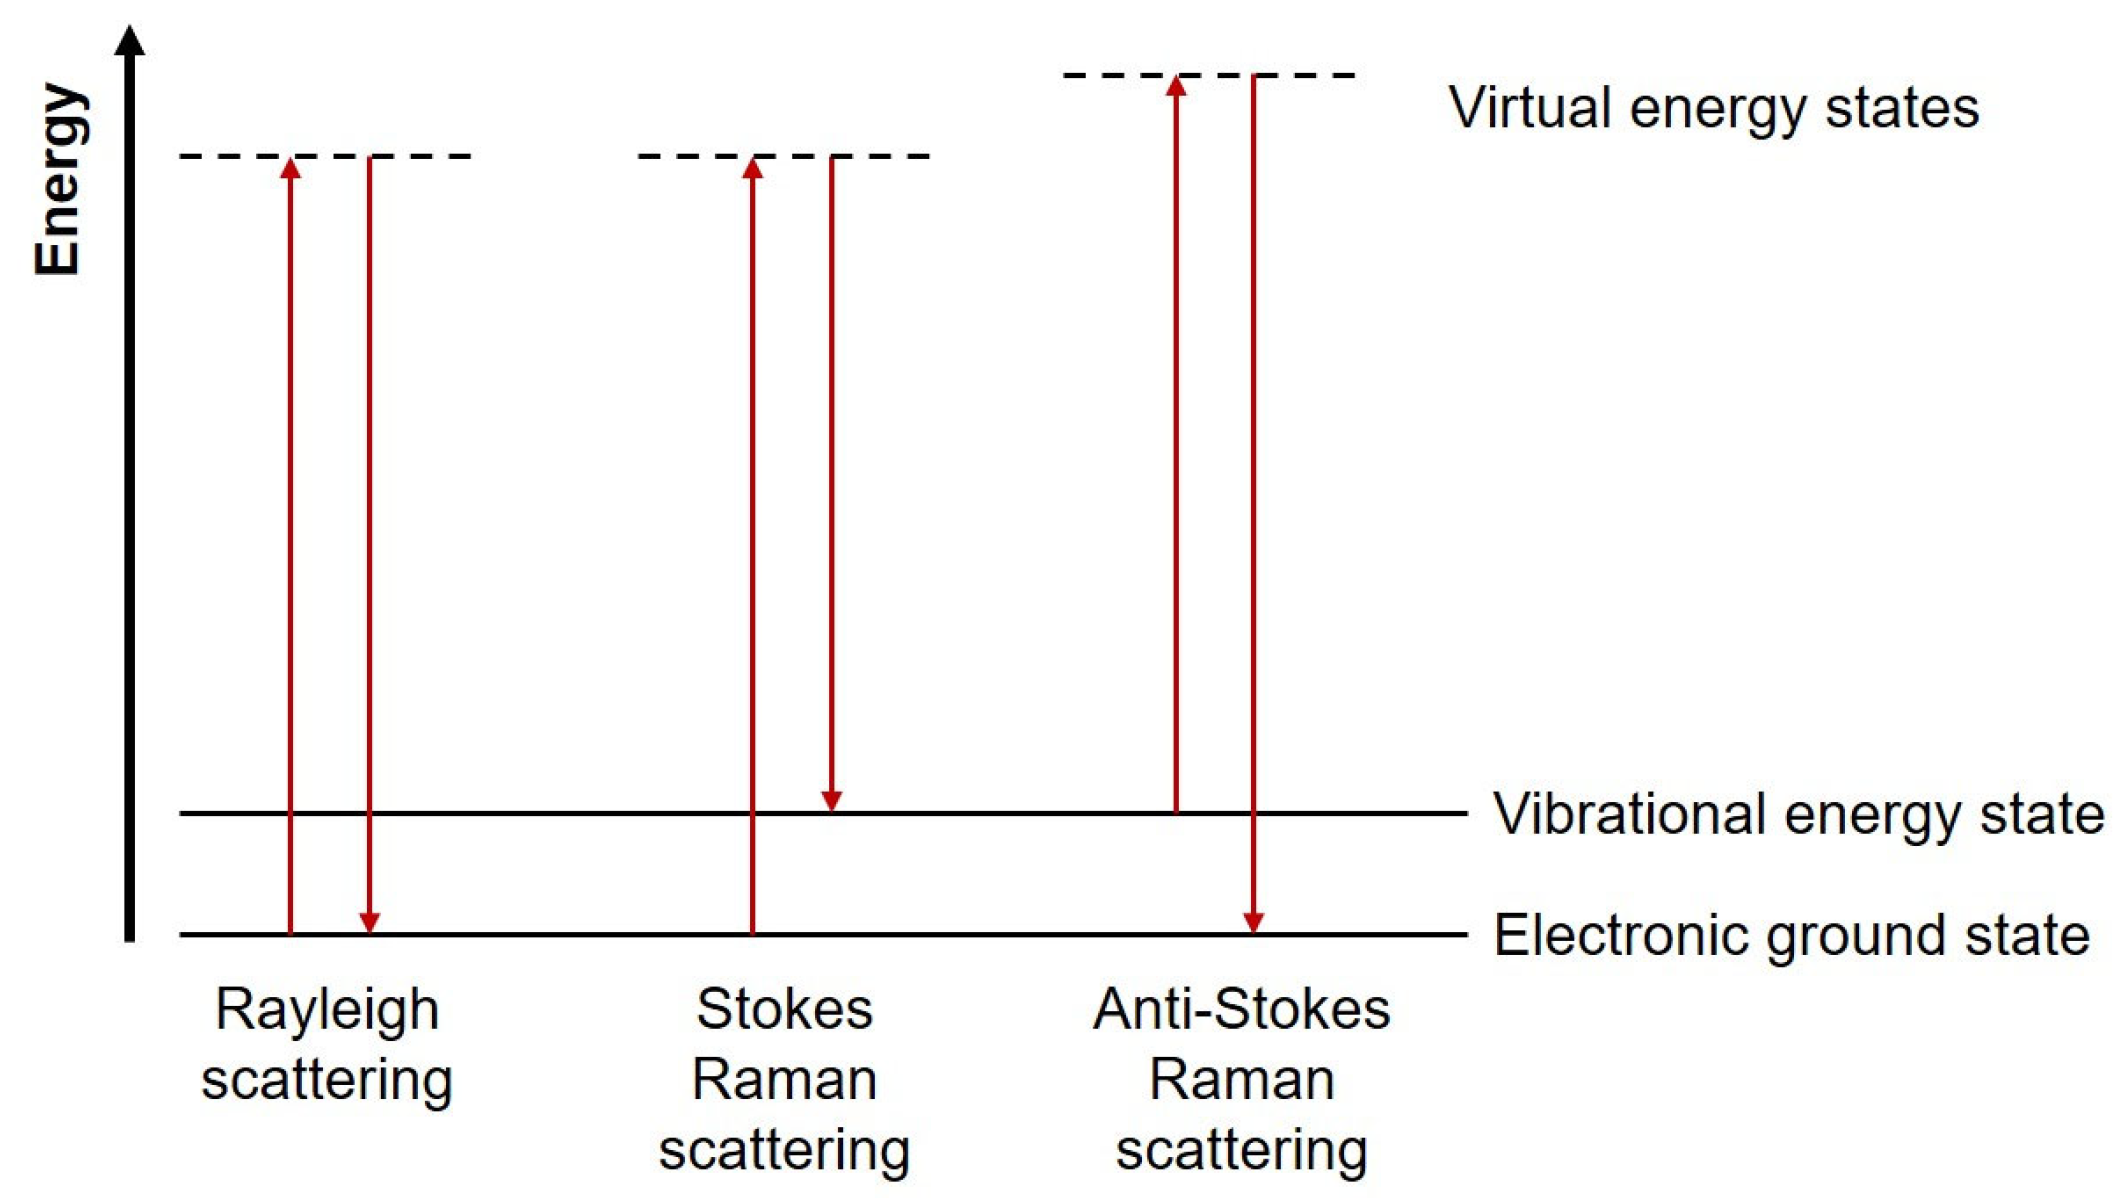
When light interacts with a material, several interactions can occur, such as absorption, reflection, and scattering. Scattering is the deviation of light from its original path and its propagation in different directions. When the energy of the scattered photon is equal to that of the incident photon, elastic or Rayleigh scattering occurs. On the other hand, when there is a difference in energy between the scattered photon and the incident photon, inelastic or Raman scattering occurs. Most of the scattered light suffers Rayleigh scattering, and only a small portion (one photon in 108) undergoes the Raman effect [7,17].
Raman scattering can be Stokes or anti-Stokes. Stokes Raman scattering occurs when a portion of the incident light is used for the vibrational motion of atoms or the rotational motion of molecules, resulting in light emission with lower energy and consequently longer wavelength. On the other hand, when the material is already in a high-energy state and receives more light, there is the emission of light with higher energy and consequently shorter wavelength, resulting in the anti-Stokes Raman [7].
Figure 3 shows the Jablonski diagram to explain the energy transitions of Rayleigh and Raman scattering.
As previously referred, Raman provides a fingerprint of a sample because the difference in energy between the incident photon and the scattered photon corresponds to the chemical bond excited by this energy. Raman can thus allow the effective characterization of several vibrational modes associated with the chemical bonds of a sample [2,20].
Raman spectroscopy presents several advantages. It is a non-destructive technique, requires minimal sample preparation, is label-free, has high molecular specificity, is compatible with physiological measurements due to low interference from water, and is suitable for chemical analysis, classification, and imaging of biological samples [21].
It is also important to note that Raman spectroscopy is a complementary technique to Infrared (IR) spectroscopy, since these two techniques are sensitive to molecular vibrations. Both techniques measure molecular vibrations and phonons, providing information about the chemical composition of a sample, molecular conformation, and chemical structure. However, they are based on different physical mechanisms. Raman spectroscopy measures inelastically scattered light due to molecular vibrations that cause changes in the polarizability of the molecules. It is more sensitive to homo-nuclear molecular bonds. IR spectroscopy measures light absorption due to molecular vibrations that cause changes in the electric dipolar moment of the molecules. It is more sensitive to heteronuclear functional groups (polar functional groups). Thus, depending on the sample molecular symmetry, certain vibrations can be measured only with Raman spectroscopy and not with IR spectroscopy, or vice versa. Therefore, Raman and IR spectroscopies are complementary and can be used together to achieve a more complete understanding of the composition of a sample and the molecular structure [22,23].
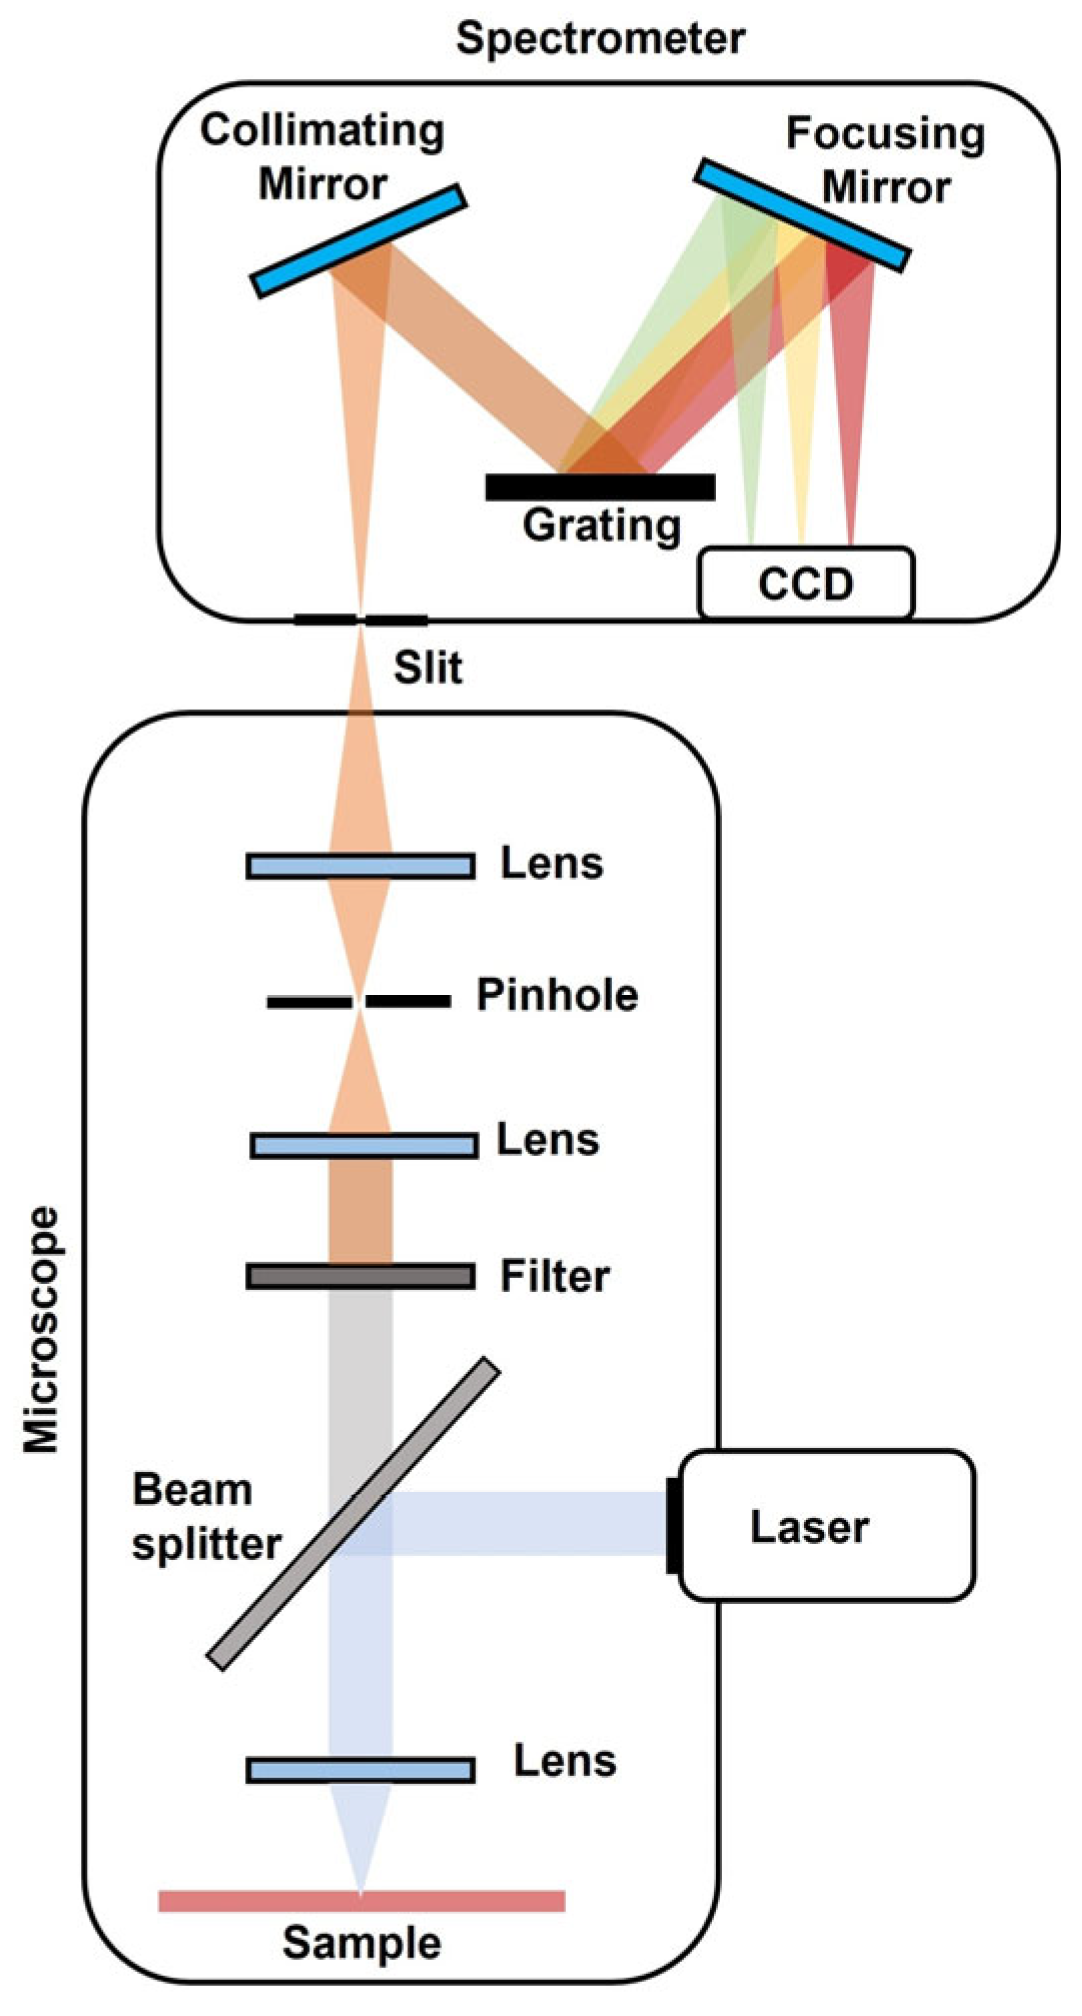
Raman spectroscopy can be performed with a typical laboratory Raman system, consisting of a laser that is directed and focused on the sample. Then, the light scattered off the sample is collected in a 180° backscatter geometry and directed to a filter that blocks the laser light, letting pass only the Raman scattered light. After that, light is focused on the entrance slit of a spectrometer, directed to a grating, and finally focused on a charge-coupled device (CCD) detector (Figure 4) [24,25].
The most relevant spectral range is regarded from 500 to 1800 cm−1, where the characteristic Raman peaks arise from nucleic acids, proteins, lipids/phospholipids, amino acids, carotenoids, etc. [1].
Currently, several types of lasers can be used in Raman systems, including argon (488 nm and 514.5 nm), helium–neon (632.8 nm), and krypton (530.9 nm and 647.1 nm) lasers for the visible region and near-infrared (NIR) lasers (785 nm and 830 nm). The main advantage of using NIR lasers is the reduction in the sample photodamage and fluorescence background. The use of diode lasers is an attractive approach due to their appreciable size, low-weight, and the possibility of integrating a portable Raman device [17].
Raman systems used for laboratory research, as the one shown in Figure 4, are typically used in ex vivo applications, aiming to collect high-quality spectra with different excitation/detection wavelengths and data acquisition times. Moreover, the laser can scan the sample to acquire a Raman spectrum at each point (spatial mapping), allowing for the visualization and quantification of different components in an area of the sample. The acquired spectra can then be used to develop and test algorithms/models for the characterization of samples. For in vivo biomedical applications, a Raman fiber optic probe must be used to allow access to organs, where improved sensitivity and reduced size are desirable, and it is under constant development to increase the feasibility of Raman for clinical applications. Figure 5 shows a schematic of a Raman system with a fiber optic probe. The light provided by the laser passes through an optical fiber and through a laser line cleanup filter that is internal to the probe, removing unwanted signals, including those arising from the fiber itself. Then, the laser light is focused on the sample with internal lenses. Backscattered light is collected by the lenses and directed to an internal edge filter that passes only the Raman scattering. Finally, the Raman light is connected to the slit of the spectrometer [24].

3. Raman Biomedical Applications

3.1. Cancer

Raman spectroscopy has been widely used for the differentiation of normal and cancerous tissues, acting as a complementary technique for tissue biopsy [4].
Gastric cancer diagnosis is one of the main applications of Raman spectroscopy, involving the acquisition of Raman spectra and several methodologies for spectroscopy data analysis [26]. Also, in the field of the gastrointestinal tract, and very recently, Cao et al. [9] reported the ex vivo acquisition of Raman spectra from colorectal tissues and the development of a deep learning approach to classify tumor tissues based on their Raman spectra, achieving 98.5% accuracy in the detection of colorectal cancer. Fousková et al. [27] also reported an approach for in vivo tissue diagnosis of colorectal carcinoma based on Raman spectroscopy. The authors proposed using several supervised machine learning methods, achieving 91% accuracy in distinguishing colorectal lesions from healthy tissues. For the in vivo acquisition of the Raman spectra during colonoscopy, they used a combination of a fiber-optic microprobe with a portable Raman spectrometer. Esteves et al. [28] recently reported the acquisition of Raman spectra from chicken chorioallantoic membrane (CAM) colon tumor samples and the analysis of the spectra with machine learning based algorithms, achieving 93% accuracy in the differentiation between neoplastic and non-neoplastic colon tumors.
The previous types of studies (ex vivo, in vivo, and CAM samples) have some advantages and limitations, which may be considered depending on the kind of research. In vivo studies may be more realistic since the acquired Raman spectra are achieved in fresh tissues, and the acquisition may be in situ and during conventional endoscopy. On the other hand, when conducting ex vivo analyses, it is always challenging to keep the sample properties because the sample composition and structure may change once the tissue is excised [4]. Finally, CAM samples may be interesting for testing new methodologies of Raman spectra analysis, due to the reduced ethical issues, compared with the ex vivo and in vivo studies that require patient permissions or approval from ethics committees.
The use of Raman spectroscopy for detecting breast cancer is also widely reported, involving ex vivo and in vivo applications, and biofluids [29]. Recently, Lazaro-Pacheco et al. [30] reported the ex vivo acquisition of Raman spectra of tissue microarrays of breast cancer biopsy samples and normal breast tissue. The spectra were analyzed with principal component analysis (PCA) in specific spectral regions to identify biochemical changes and spectral biomarkers associated with cancer. PCA was followed by linear discriminant analysis (LDA). Breast cancer and normal breast tissue were successfully differentiated with a sensitivity of 90% and a specificity of 78%. Bhattacharjee et al. [31] reported transcutaneous in vivo Raman spectroscopy from carcinogen-induced rats (in mammary glands). The Raman spectra were analyzed using PCA and principal component-linear discriminant analysis (PC-LDA), making it possible to distinguish pre-tumor spectra from controls. For the in vivo acquisition of the Raman spectra, they used a combination of a Raman probe with a spectrometer. Finally, Nargis et al. [10] reported the use of Raman spectroscopy for the classification of different stages of breast cancer using serum samples from breast cancer patients and healthy individuals. The Raman spectra were analyzed with PCA and partial least squares-discriminant analysis (PLS-DA) for the classification of disease samples and healthy ones, achieving a sensitivity of 88.2% and a specificity of 97.7%.
The previously presented studies give promising signs for the application of Raman spectroscopy for in situ detection of breast cancer. However, there are still some challenges, the main one related to the laser power and integration time when a Raman signal is acquired, which are sometimes altered to improve the signal-to-noise ratio. This can be impractical and unsafe for in vivo applications. Another major concern is the amount of data contained within a Raman spectrum. Automated spectral diagnostic frameworks must be developed to help medical staff [29].
Raman spectroscopy can also offer a significant advance in skin cancer diagnosis [32]. Recently, Bratchenko et al. [8] reported an efficient skin tumor classification using convolutional neural networks (CNN) analysis of Raman spectra. The spectra were acquired in vivo with a portable Raman setup, making it possible to classify skin cancers, including malignant vs. benign tumors, melanomas vs. pigmented tumors, and melanomas vs. seborrheic keratosis.
The use of Raman spectroscopy in skin cancer diagnosis can present several innovations. One of them is the association of Raman with other technologies such as optical coherence tomography (OCT), ultrasound, or magnetic resonance imaging (MRI), which can improve the classification of skin lesions by using morphological and biochemical information. The application of Raman for skin cancer diagnosis also has some challenges related to several factors, such as sample heterogeneity, potential degradation of the sample due to light overexposure, and environmental factors like temperature [32].
Raman spectroscopy can also have strong potential in the detection of lung cancer. Very recently, Hano et al. [33] reported the use of Raman spectra from human blood plasma samples (from lung cancer patients and healthy controls) and machine learning models for the detection of lung cancer. The models achieved accuracies from 0.77 to 0.85. This study demonstrated that Raman spectroscopy is a powerful method for in vitro diagnostics of lung cancer. Fousková et al. [34] reported the comparison between in vivo and ex vivo Raman spectroscopy for lung cancer diagnosis. For the in vivo study, Raman spectra were collected during routine bronchoscopy, using a custom-made fiber-optic microprobe coupled to a portable Raman spectrometer. The spectra were analyzed with a PCA-support vector machine (SVM) model, achieving 87.2% diagnostic accuracy. For the ex vivo study, Raman spectra were acquired from lung tissues (samples of endobronchial pathologies). Again, the spectra were analyzed with the PCA-SVM model, achieving 100% diagnostic accuracy. It was concluded that despite the best accuracy of the ex vivo study, the in vivo approach can be crucial for a rapid diagnosis.
The use of Raman spectroscopy for the diagnosis of prostate cancer is also reported with biofluids and tissues. Chen et al. [35] described a diagnostic method for prostate cancer using urine samples, Raman spectroscopy, and the CNN algorithm. The Raman spectra of urine samples are different between prostate cancer and benign prostatic hyperplasia. The results showed a diagnostic accuracy of 74.95%. Breugel et al. [36] reported the test of a thin optical probe to detect prostate cancer in real-time, using Raman spectroscopy and a classification method. The Raman spectra were acquired on fresh prostate biopsy samples seconds after their collection. PCA analyzed the data, and PLS-DA was used as a classification method, achieving 90% sensitivity and 80.2% specificity for diagnosing clinically significant cancers.
Cervical cancer diagnosis can also benefit from Raman spectroscopy, involving ex vivo and in vivo experiments and studies on biofluids [37]. Wang et al. [13] reported the Raman spectra acquisition of sections of six kinds of cervical tissues (obtained by cervical biopsy under colposcopy). The spectra were analyzed by an independent t-test (p ≤ 0.05), analyzing the difference in relative intensity of the spectra from six types of tissues. An SVM algorithm was used as a classification model of six types of tissues (cervical inflammation, cervical intraepithelial neoplasia (CIN) I, II, and III, cervical squamous cell carcinoma, and cervical adenocarcinoma), achieving 85.7% diagnostic accuracy. Shaikh et al. [38] reported a comparative study with diffuse reflectance and Raman spectra recorded in vivo to detect cervical cancer. Diffuse reflectance and Raman spectra were recorded from the same sites, using optical fibers coupled to excitation sources and spectrometers. Data were analyzed using PCA-LDA, and the classification between normal and tumor sites achieved a sensitivity and a specificity of 91% and 96% for the Raman spectroscopy and 85% and 95% for the diffuse reflectance spectroscopy. Despite the best results achieved with Raman spectroscopy, diffuse reflectance spectroscopy can be a better approach to use in some specific situations, due to its simplicity and lower cost implementation compared with Raman spectroscopy. Shrivastava et al. [39] reported the Raman spectra acquisition of serum samples from cervical cancer patients and controls. The data were analyzed with PCA-LDA, and the distinction between control and cervical cancer patients achieved a sensitivity of 92.5% and a specificity of 85%.
In cervical cancer and considering the diagnosis and prevention, Raman spectra acquisition in vivo during colposcopy would be interesting to improve the accuracy in primary interventions guided by colposcopy. On the other hand, ex vivo and biofluids approaches would be more interesting in evaluating the response of the patient to radiation or chemotherapy [38].
Raman spectroscopy can also be used in brain cancer diagnosis, involving studies with solid tissue samples or liquid samples [40,41]. Iturrioz-Rodríguez et al. [42] reported a study for discrimination between glioma cells (patient-derived, from biopsies) and healthy astrocytes using Raman spectroscopy. The spectra were analyzed with PCA-LDA, achieving an accuracy of 92.5% in distinguishing cancer from healthy cells. Bukva et al. [43] reported a study to evaluate the potential of Raman spectroscopy for the diagnosis of central nervous system (CNS) tumors, using blood serum analysis. The Raman spectra from serum-derived small extracellular vesicles (sEVs) were obtained, considering four patient groups: glioblastoma multiforme, brain metastasis, meningioma, and lumbar disc herniation as a control. Data were analyzed with a PCA-SVM algorithm for classification. The patient groups were distinguished with a sensitivity of 80–95% and a specificity of 80–90%.
Raman spectroscopy offers a rapid and non-destructive analysis of tissues and fluids, and can be helpful in the brain cancer area, through several applications, such as aiming to achieve an optimal tumor resection during surgery by a precise differentiation between healthy brain tissue and several tumor types [41].
Finally, the use of Raman spectroscopy can also be relevant for bladder cancer diagnosis [44]. Bovenkamp et al. [45] reported a study exploring the Raman capability for the diagnosis of bladder cancer ex vivo. Bladder tissue samples were obtained from biopsies, and Raman spectra were measured with a Raman microscope. Data were analyzed with PCA, and a k-nearest neighbor (kNN) algorithm was implemented for data classification. An accuracy of 93% was achieved in discriminating low-grade from high-grade lesions. The authors have also used another optical technique in combination with Raman, the OCT, to improve diagnosis capability, as OCT gives structural information and Raman molecular characteristics.
Table 1 summarizes the most recent and relevant applications of Raman spectroscopy in cancer diagnosis. Most of the reported studies use multivariate methods for data analysis. These methods are suitable for large multidimensional datasets and for exploring the complete spectral information. However, the effective implementation of these methods requires data pretreatment to eliminate undesired signals and enhance the discrimination of features. Additionally, these methods are mathematically conceptual, and thus, there is no direct physical interpretability [46,47].
Additionally, other Raman-based techniques can be useful in cancer diagnosis. Some of these techniques include SRS and CARS. Conventional Raman scattering is based on the use of a single laser source, leading to the spontaneous emission of photons at different wavelengths, and it is a naturally weak signal to obtain spectral information about a sample. SRS is based on the use of two pulses of coherent radiation reaching the sample simultaneously, allowing for the identification and tracking of specific molecules, as well as the acquisition of stronger signals, with strength proportional to the molecule concentration, for direct biochemical imaging. CARS is also based on the use of synchronized laser pulses to coherently excite the internal chemical vibrations of molecules. It is a faster and more sensitive Raman imaging technique, since it is based on a nonlinear optical interaction [18].

3.2. Neurodegenerative Diseases

Raman spectroscopy can offer information about the chemical composition of biological samples (e.g., blood, saliva, and cerebrospinal fluid) and thus can be used in the diagnosis of neurodegenerative diseases (e.g., Alzheimer’s disease (AD) and Parkinson’s disease (PD)) [2].
Recently, it was proposed that blood biomarkers can be used to detect neurodegenerative diseases. A study using Raman spectroscopy was reported by Paraskevaidi et al. [48] for the analysis of blood plasma samples from individuals divided into healthy controls, early AD, late-stage AD, and dementia with Lewy bodies (DLB). PCA-LDA was applied to the data, and the results achieved high accuracy for the different groups, including the differentiation between AD and healthy individuals, and between different types of dementia. Carota et al. [49] also reported the analysis of blood serum samples from healthy controls and dementia patients with Raman spectroscopy. Data were analyzed using multivariate methods (e.g., PCA), and a classification method was developed (i.e., random forest (RF)). The blood serum from patients presented a lower concentration of carotenoids, which leads to a correct discrimination between controls and patients, achieving 93% of correct predictions with RF.
Carlomagno et al. [50] reported the use of Raman spectroscopy for the analysis of salivary samples from PD patients and healthy controls. Machine and deep learning approaches were applied to the data, and a classification model was developed. The model achieved accuracy, specificity, and sensitivity of more than 97% for the single-spectrum attribution to the correct group.
Ryzhikova et al. [51] reported the analysis of cerebrospinal fluid samples from AD patients and healthy controls by near-infrared Raman spectroscopy. Cerebrospinal fluid samples were collected by lumbar puncture. Artificial neural networks (ANNs) and support vector machine discriminant analysis (SVM-DA) statistical methods were used to differentiate AD patients from healthy controls, achieving 84% sensitivity and specificity.
Thus, there are several advantages in employing Raman spectroscopy for the diagnosis of neurodegenerative diseases, due to the possibility of a non-invasive and highly specific early detection of the disease. However, some factors are limiting the application of Raman spectroscopy in clinics as an alternative to traditional diagnostic methods. Some factors are the technology’s high cost, prolonged analytical times, and the weak nature of the Raman signal, which can also be affected by the spontaneous biological fluorescence of the sample. Recent related technologies are being used for signal enhancement, such as SERS and TERS, which are also used to diagnose neurodegenerative diseases. SERS is a technique that uses a nano-roughened metal surface to enhance the scattered Raman signal, being capable of detecting very weak signals, even from low concentrations of molecules. TERS is a single-point SERS, where a metallic nanoparticle is used to enhance the light field, and not a roughened metallic surface. Thus, TERS provides nanoscale spectral information, combining the chemical sensitivity of Raman spectroscopy with the spatial resolution of atomic force microscopy [2,52,53].

3.3. Immunology

Raman spectroscopy is also reported in the diagnosis of autoimmune diseases. A high number of studies are reported with the Raman analysis of blood serum samples, due to its ease of collection, minimal invasiveness, low-cost, and broader use in clinical applications [54].
Callery et al. [55] reported the use of Raman in the diagnosis of systemic lupus erythematosus (SLE), using the Raman spectra of serum blood samples from SLE patients and healthy controls. Multivariate analysis and a classification model construction were achieved using PCA and PLS-DA. It was possible to differentiate the Raman spectra from SLE patients and healthy controls. The classification model achieved 99% accuracy, 100% sensitivity, and 99% specificity.
Chen et al. [56] reported the use of Raman spectroscopy for the diagnosis of primary Sjögren syndrome (pSS). Raman spectra of serum samples were acquired from patients with pSS and healthy controls. Data were analyzed with PCA, and a particle swarm optimization (PSO)-SVM algorithm was applied as a classification model, achieving a specificity, sensitivity, and accuracy of 88.89%, 100% and 94.44%, respectively.
Xu et al. [57] reported the Raman spectra acquisition of serum samples from SLE patients and controls. After preprocessing of the raw spectra, the data were classified using a deep learning model, a two-branch Bayesian network, achieving an accuracy of 85.9% in the diagnosis of SLE patients.
In the field of immunology, the use of Raman spectroscopy with machine learning approaches can revolutionize research in immunometabolism, enhancing the understanding of complex Raman phenotypes, biomarker discovery, and more comprehensive research studies [54].

3.4. Other Applications

The use of Raman spectroscopy is also stated in the classification of hepatitis infections. Zhao et al. [58] reported the analysis of serum samples by Raman spectroscopy, including samples from patients with hepatitis B virus, patients with hepatitis C virus, and healthy subjects. Data were analyzed with PCA, and a classification model was then implemented, named a multiscale convolutional neural network. The model achieved an accuracy of 94.92%, a sensitivity of 97.44%, and a specificity of 94.54%, effectively screening for hepatitis B and C.
Raman spectroscopy is also applied for the diagnosis of metabolic diseases. Wu et al. [59] reported the use of Raman spectroscopy in the analysis of urine samples from diabetic patients and healthy volunteers. After data preprocessing and analysis with PCA, a residual neural network (Resnet) model was implemented to classify and identify diabetic patients and healthy ones. The model achieved an accuracy of 84.28%.
Raman spectroscopy also plays a crucial role in the pharmaceutical industry. This technique allows the precise and sensitive quantification of drug substances, even substances with low concentration in mixtures, identifying critical variables and their relevance in the development of new drugs. Additionally, in the process development of new drugs, Raman spectroscopy is critical for process monitoring, allowing in-line and real-time analysis of the productive processes, which is integrated in the concept of Good Manufacturing Practices of the 21st century. Finally, the application of Raman spectroscopy in pharmaceutical nanomaterials is also relevant, enabling the evaluation of nanoscale substances non-destructively (e.g., the crystalline state, cellular interactions) [16].

4. Conclusions and Future Perspectives

As demonstrated in this manuscript, Raman spectroscopy has a huge potential for the diagnosis of diseases, as it is a particular label-free technique that gives a chemical fingerprint of a sample, being sensitive to small changes in biological samples (e.g., blood, urine, saliva, tissues) due to disease progression.
Raman spectroscopy with data processing and classification, more specifically with multivariate and machine learning approaches, represents a great potential for disease diagnosis in the biomedical field, as stated throughout this manuscript. It is also worth mentioning that there is a challenge in using machine learning approaches for Raman spectra classification, related to the training and data preparation. Machine learning approaches require a large and diverse set of data, and also a well-characterized dataset to produce accurate results. Spectra quality is also relevant to minimize the necessity of extra preprocessing techniques [60].
In recent years, there has been a significant advance in Raman spectroscopy due to the developments in lasers, detectors, and software approaches. However, it is imperative to make efforts toward greater advances in Raman technology to facilitate its application not only in research but also in daily clinical diagnosis. Some key aspects can be worked on, such as the development of portable and point-of-care Raman spectroscopy devices that will enable on-site measurements and a rapid decision about a sample state; the development of machine learning approaches for automatic and rapid extraction of relevant information in real-time from complex and large datasets, allowing for the automated classification and identification of a sample; and the integration of additional techniques to improve the biological samples analysis, such as SERS, which could involve advances in materials science and engineering, through the development of novel substrates and optical materials. SERS combines all the advantages of Raman spectroscopy, such as high specificity, with an increased sensitivity due to the signal amplification generated by the use of nanostructures. The use of SERS also requires addressing some issues related to biocompatibility, toxicity, reliability, and reproducibility, which are influenced by the substrate used [4,61,62].
Most of the studies performed with Raman spectroscopy use lesion and normal samples. To use Raman spectroscopy in daily diagnosis, the parameters associated with pathological and normal samples need to be standardized, i.e., the relationship between the molecular markers and the diseases needs to be established. Other major concerns in the application of Raman spectroscopy in daily diagnosis are the safety, cost, and complexity of laser sources. In vivo Raman spectroscopy usually requires high power or long integration times to compensate for the weak nature of the Raman signal and fluorescence interference. Some research has been performed to optimize laser parameters, including wavelength and power, to maintain a good signal-to-noise ratio and avoid tissue damage. New ways to achieve a more efficient excitation of the samples are also being explored through new laser sources and delivery systems. It is also important to note that some research is needed concerning the combination of Raman spectroscopy with other technologies, including the ones already implemented clinically, ensuring their adaptation to the complex and dynamic clinical environment. Interdisciplinary collaboration will also be crucial for the successful integration of Raman spectroscopy in clinical practice, including physicians, biomedical engineers, material scientists, and spectroscopists. Finally, large-scale clinical trials and multicenter studies in vivo must be performed to fully support the use of Raman spectroscopy in clinical practice [4,63,64].

Author Contributions

The work presented in this paper was a collaboration of all authors. S.P. performed literature analysis and wrote the first draft of the manuscript. J.H.C. corrected and revised the manuscript. All authors have read and agreed to the published version of the manuscript.

Funding

This research received no external funding.

Acknowledgments

This work was supported by UID/04436: Centro de Microssistemas Eletromecânicos da Universidade do Minho (CMEMS-UMinho). Sara Pimenta thanks FCT for the grant 2022.00101.CEECIND/CP1718/CT0008, https://doi.org/10.54499/2022.00101.CEECIND/CP1718/CT0008.

Conflicts of Interest

The authors declare no conflicts of interest.

References

  1. Khristoforova, Y.; Bratchenko, L.; Bratchenko, I. Raman-Based Techniques in Medical Applications for Diagnostic Tasks: A Review. Int. J. Mol. Sci. 2023, 24, 15605. [Google Scholar] [CrossRef]
  2. Chen, C.; Qi, J.; Li, Y.; Li, D.; Wu, L.; Li, R.; Chen, Q.; Sun, N. Applications of Raman Spectroscopy in the Diagnosis and Monitoring of Neurodegenerative Diseases. Front. Neurosci. 2024, 18, 1301107. [Google Scholar] [CrossRef]
  3. Chaudhary, N.; Wynne, C.; Meade, A.D. A Review of Applications of Raman Spectroscopy in Immunology. Biomed. Spectrosc. Imaging 2020, 9, 23–31. [Google Scholar] [CrossRef]
  4. Qi, Y.; Chen, E.X.; Hu, D.; Yang, Y.; Wu, Z.; Zheng, M.; Sadi, M.A.; Jiang, Y.; Zhang, K.; Chen, Z.; et al. Applications of Raman Spectroscopy in Clinical Medicine. Food Front. 2024, 5, 392–419. [Google Scholar] [CrossRef]
  5. Ye, Q.; Spencer, P. Analyses of Material-Tissue Interfaces by Fourier Transform Infrared, Raman Spectroscopy, and Chemometrics. In Material-Tissue Interfacial Phenomena; Elsevier: Amsterdam, The Netherlands, 2017; pp. 231–251. [Google Scholar]
  6. Hernández, Y.; Galarreta, B.C. Noble Metal-Based Plasmonic Nanoparticles for SERS Imaging and Photothermal Therapy. In Nanomaterials for Magnetic and Optical Hyperthermia Applications; Elsevier: Amsterdam, The Netherlands, 2019; pp. 83–109. [Google Scholar]
  7. Kim, Y.; Jung, S.U.; Choi, J. Application of Raman Spectroscopy in Breast Cancer Surgery. Kosin Med. J. 2023, 38, 176–183. [Google Scholar] [CrossRef]
  8. Bratchenko, I.A.; Bratchenko, L.A.; Khristoforova, Y.A.; Moryatov, A.A.; Kozlov, S.V.; Zakharov, V.P. Classification of Skin Cancer Using Convolutional Neural Networks Analysis of Raman Spectra. Comput. Methods Programs Biomed. 2022, 219, 106755. [Google Scholar] [CrossRef] [PubMed]
  9. Cao, Z.; Pan, X.; Yu, H.; Hua, S.; Wang, D.; Chen, D.Z.; Zhou, M.; Wu, J. A Deep Learning Approach for Detecting Colorectal Cancer via Raman Spectra. BME Front. 2022, 2022, 9872028. [Google Scholar] [CrossRef]
  10. Nargis, H.F.; Nawaz, H.; Bhatti, H.N.; Jilani, K.; Saleem, M. Comparison of Surface Enhanced Raman Spectroscopy and Raman Spectroscopy for the Detection of Breast Cancer Based on Serum Samples. Spectrochim. Acta A Mol. Biomol. Spectrosc. 2021, 246, 119034. [Google Scholar] [CrossRef]
  11. Li, Y.; Jia, M.; Zeng, X.; Huang, K.; Bai, Z. Pattern Recognition Methods Combined with Raman Spectra Applied to Distinguish Serums from Lung Cancer Patients and Healthy People. J. Biosci. Med. 2017, 5, 95–105. [Google Scholar] [CrossRef]
  12. Artemyev, D.N.; Kukushkin, V.I.; Avraamova, S.T.; Aleksandrov, N.S.; Kirillov, Y.A. Using the Method of “Optical Biopsy” of Prostatic Tissue to Diagnose Prostate Cancer. Molecules 2021, 26, 1961. [Google Scholar] [CrossRef]
  13. Wang, J.; Zheng, C.-X.; Ma, C.-L.; Zheng, X.-X.; Lv, X.-Y.; Lv, G.-D.; Tang, J.; Wu, G.-H. Raman Spectroscopic Study of Cervical Precancerous Lesions and Cervical Cancer. Lasers Med. Sci. 2021, 36, 1855–1864. [Google Scholar] [CrossRef] [PubMed]
  14. Khan, S.; Ullah, R.; Khan, A.; Ashraf, R.; Ali, H.; Bilal, M.; Saleem, M. Analysis of Hepatitis B Virus Infection in Blood Sera Using Raman Spectroscopy and Machine Learning. Photodiagnosis Photodyn. Ther. 2018, 23, 89–93. [Google Scholar] [CrossRef] [PubMed]
  15. Guevara, E.; Torres-Galván, J.C.; Ramírez-Elías, M.G.; Luevano-Contreras, C.; González, F.J. Use of Raman Spectroscopy to Screen Diabetes Mellitus with Machine Learning Tools. Biomed. Opt. Express 2018, 9, 4998. [Google Scholar] [CrossRef] [PubMed]
  16. Jesus, J.I.S.; Löbenberg, R.; Bou-Chacra, N.A. Raman Spectroscopy for Quantitative Analysis in the Pharmaceutical Industry. J. Pharm. Pharm. Sci. 2020, 23, 24–46. [Google Scholar] [CrossRef]
  17. Siraj, N.; Bwambok, D.K.; Brady, P.N.; Taylor, M.; Baker, G.A.; Bashiru, M.; Macchi, S.; Jalihal, A.; Denmark, I.; Le, T.; et al. Raman Spectroscopy and Multivariate Regression Analysis in Biomedical Research, Medical Diagnosis, and Clinical Analysis. Appl. Spectrosc. Rev. 2021, 56, 615–672. [Google Scholar] [CrossRef]
  18. Adamczyk, A.; Orzechowska, S.; Nowakowska, A.M.; Brzozowski, K.; Majzner, K.; Baranska, M. Stimulated Raman Scattering Microscopy in the Analysis of Cancer Cells—A Review and Own Research. TrAC Trends Anal. Chem. 2023, 169, 117366. [Google Scholar] [CrossRef]
  19. Raman, C.V.; Krishnan, K.S. A New Type of Secondary Radiation. Nature 1928, 121, 501–502. [Google Scholar] [CrossRef]
  20. Ye, K.; Li, K.; Lu, Y.; Guo, Z.; Ni, N.; Liu, H.; Huang, Y.; Ji, H.; Wang, P. An Overview of Advanced Methods for the Characterization of Oxygen Vacancies in Materials. TrAC Trends Anal. Chem. 2019, 116, 102–108. [Google Scholar] [CrossRef]
  21. Eberhardt, K.; Stiebing, C.; Matthäus, C.; Schmitt, M.; Popp, J. Advantages and Limitations of Raman Spectroscopy for Molecular Diagnostics: An Update. Expert. Rev. Mol. Diagn. 2015, 15, 773–787. [Google Scholar] [CrossRef]
  22. Kurouski, D.; Dazzi, A.; Zenobi, R.; Centrone, A. Infrared and Raman Chemical Imaging and Spectroscopy at the Nanoscale. Chem. Soc. Rev. 2020, 49, 3315–3347. [Google Scholar] [CrossRef]
  23. Hadjiivanov, K.I.; Panayotov, D.A.; Mihaylov, M.Y.; Ivanova, E.Z.; Chakarova, K.K.; Andonova, S.M.; Drenchev, N.L. Power of Infrared and Raman Spectroscopies to Characterize Metal-Organic Frameworks and Investigate Their Interaction with Guest Molecules. Chem. Rev. 2021, 121, 1286–1424. [Google Scholar] [CrossRef]
  24. Auner, G.W.; Koya, S.K.; Huang, C.; Broadbent, B.; Trexler, M.; Auner, Z.; Elias, A.; Mehne, K.C.; Brusatori, M.A. Applications of Raman Spectroscopy in Cancer Diagnosis. Cancer Metastasis Rev. 2018, 37, 691–717. [Google Scholar] [CrossRef]
  25. Schmid, T.; Dariz, P. Raman Microspectroscopic Imaging of Binder Remnants in Historical Mortars Reveals Processing Conditions. Heritage 2019, 2, 1662–1683. [Google Scholar] [CrossRef]
  26. Liu, K.; Zhao, Q.; Li, B.; Zhao, X. Raman Spectroscopy: A Novel Technology for Gastric Cancer Diagnosis. Front. Bioeng. Biotechnol. 2022, 10, 856591. [Google Scholar] [CrossRef] [PubMed]
  27. Fousková, M.; Vališ, J.; Synytsya, A.; Habartová, L.; Petrtýl, J.; Petruželka, L.; Setnička, V. In Vivo Raman Spectroscopy in the Diagnostics of Colon Cancer. Analyst 2023, 148, 2518–2526. [Google Scholar] [CrossRef] [PubMed]
  28. Esteves, B.; Pimenta, S.; Maciel, M.J.; Costa, M.; Baltazar, F.; Cerqueira, M.F.; Alpuim, P.; Silva, C.A.; Correia, J.H. Raman Spectroscopy for Classification of Neoplastic and Non-Neoplastic CAM Colon Tumors. Heliyon 2024, 10, e36981. [Google Scholar] [CrossRef]
  29. Hanna, K.; Krzoska, E.; Shaaban, A.M.; Muirhead, D.; Abu-Eid, R.; Speirs, V. Raman Spectroscopy: Current Applications in Breast Cancer Diagnosis, Challenges and Future Prospects. Br. J. Cancer 2022, 126, 1125–1139. [Google Scholar] [CrossRef]
  30. Lazaro-Pacheco, D.; Shaaban, A.M.; Titiloye, N.A.; Rehman, S.; ur Rehman, I. Elucidating the Chemical and Structural Composition of Breast Cancer Using Raman Micro-Spectroscopy. EXCLI J. 2021, 20, 1118–1132. [Google Scholar]
  31. Bhattacharjee, T.; Maru, G.; Ingle, A.; Murali Krishna, C. Transcutaneous in Vivo Raman Spectroscopy of Breast Tumors and Pretumors. J. Raman Spectrosc. 2015, 46, 1053–1061. [Google Scholar] [CrossRef]
  32. Delrue, C.; Speeckaert, R.; Oyaert, M.; De Bruyne, S.; Speeckaert, M.M. From Vibrations to Visions: Raman Spectroscopy’s Impact on Skin Cancer Diagnostics. J. Clin. Med. 2023, 12, 7428. [Google Scholar] [CrossRef]
  33. Hano, H.; Lawrie, C.H.; Suarez, B.; Paredes Lario, A.; Elejoste Echeverría, I.; Gómez Mediavilla, J.; Crespo Cruz, M.I.; Lopez, E.; Seifert, A. Power of Light: Raman Spectroscopy and Machine Learning for the Detection of Lung Cancer. ACS Omega 2024, 9, 14084–14091. [Google Scholar] [CrossRef]
  34. Fousková, M.; Habartová, L.; Vališ, J.; Nahodilová, M.; Vaňková, A.; Synytsya, A.; Šestáková, Z.; Votruba, J.; Setnička, V. Raman Spectroscopy in Lung Cancer Diagnostics: Can an in Vivo Setup Compete with Ex Vivo Applications? Spectrochim. Acta A Mol. Biomol. Spectrosc. 2024, 322, 124770. [Google Scholar] [CrossRef]
  35. Chen, S.; Zhang, H.; Yang, X.; Shao, X.; Li, T.; Chen, N.; Chen, Z.; Xue, W.; Pan, J.; Liu, S. Raman Spectroscopy Reveals Abnormal Changes in the Urine Composition of Prostate Cancer: An Application of an Intelligent Diagnostic Model with a Deep Learning Algorithm. Adv. Intell. Syst. 2021, 3, 2000090. [Google Scholar] [CrossRef]
  36. van Breugel, S.J.; Low, I.; Christie, M.L.; Pokorny, M.R.; Nagarajan, R.; Holtkamp, H.U.; Srinivasa, K.; Amirapu, S.; Nieuwoudt, M.K.; Simpson, M.C.; et al. Raman Spectroscopy System for Real-time Diagnosis of Clinically Significant Prostate Cancer Tissue. J. Biophotonics 2023, 16, e202200334. [Google Scholar] [CrossRef] [PubMed]
  37. Shaikh, R.; Daniel, A.; Lyng, F.M. Raman Spectroscopy for Early Detection of Cervical Cancer, a Global Women’s Health Issue—A Review. Molecules 2023, 28, 2502. [Google Scholar] [CrossRef] [PubMed]
  38. Shaikh, R.; Prabitha, V.G.; Dora, T.K.; Chopra, S.; Maheshwari, A.; Deodhar, K.; Rekhi, B.; Sukumar, N.; Krishna, C.M.; Subhash, N. A Comparative Evaluation of Diffuse Reflectance and Raman Spectroscopy in the Detection of Cervical Cancer. J. Biophotonics 2017, 10, 242–252. [Google Scholar] [CrossRef] [PubMed]
  39. Shrivastava, A.; Aggarwal, L.M.; Murali Krishna, C.; Pradhan, S.; Mishra, S.P.; Choudhary, S.; Patel, C.B.; Singla, S.; Singh, R.K. Diagnostic and Prognostic Application of Raman Spectroscopy in Carcinoma Cervix: A Biomolecular Approach. Spectrochim. Acta A Mol. Biomol. Spectrosc. 2021, 250, 119356. [Google Scholar] [CrossRef]
  40. Murugappan, S.; Tofail, S.A.M.; Thorat, N.D. Raman Spectroscopy: A Tool for Molecular Fingerprinting of Brain Cancer. ACS Omega 2023, 8, 27845–27861. [Google Scholar] [CrossRef]
  41. Stupak, E.V.; Glotov, V.M.; Askandaryan, A.S.; Clancy, S.E.; Hiana, J.C.; Cherkasova, O.P.; Stupak, V. V Raman Spectroscopy in the Diagnosis of Brain Gliomas: A Literature Review. Cureus 2025, 17, e79165. [Google Scholar] [CrossRef]
  42. Iturrioz-Rodríguez, N.; De Pasquale, D.; Fiaschi, P.; Ciofani, G. Discrimination of Glioma Patient-Derived Cells from Healthy Astrocytes by Exploiting Raman Spectroscopy. Spectrochim. Acta A Mol. Biomol. Spectrosc. 2022, 269, 120773. [Google Scholar] [CrossRef]
  43. Bukva, M.; Dobra, G.; Gomez-Perez, J.; Koos, K.; Harmati, M.; Gyukity-Sebestyen, E.; Biro, T.; Jenei, A.; Kormondi, S.; Horvath, P.; et al. Raman Spectral Signatures of Serum-Derived Extracellular Vesicle-Enriched Isolates May Support the Diagnosis of CNS Tumors. Cancers 2021, 13, 1407. [Google Scholar] [CrossRef]
  44. Kanmalar, M.; Abdul Sani, S.F.; Kamri, N.I.N.B.; Said, N.A.B.M.; Jamil, A.H.B.A.; Kuppusamy, S.; Mun, K.S.; Bradley, D.A. Raman Spectroscopy Biochemical Characterisation of Bladder Cancer Cisplatin Resistance Regulated by FDFT1: A Review. Cell Mol. Biol. Lett. 2022, 27, 9. [Google Scholar] [CrossRef]
  45. Bovenkamp, D.; Sentosa, R.; Rank, E.; Erkkilä, M.T.; Placzek, F.; Püls, J.; Drexler, W.; Leitgeb, R.A.; Garstka, N.; Shariat, S.F.; et al. Combination of High-Resolution Optical Coherence Tomography and Raman Spectroscopy for Improved Staging and Grading in Bladder Cancer. Appl. Sci. 2018, 8, 2371. [Google Scholar] [CrossRef]
  46. Gautam, R.; Vanga, S.; Ariese, F.; Umapathy, S. Review of Multidimensional Data Processing Approaches for Raman and Infrared Spectroscopy. EPJ Tech. Instrum. 2015, 2, 8. [Google Scholar] [CrossRef]
  47. Otel, I.; Silveira, J.; Vassilenko, V.; Mata, A.; Carvalho, M.L.; Santos, J.P.; Pessanha, S. Application of Unsupervised Multivariate Analysis Methods to Raman Spectroscopic Assessment of Human Dental Enamel. Computers 2021, 11, 5. [Google Scholar] [CrossRef]
  48. Paraskevaidi, M.; Morais, C.L.M.; Halliwell, D.E.; Mann, D.M.A.; Allsop, D.; Martin-Hirsch, P.L.; Martin, F.L. Raman Spectroscopy to Diagnose Alzheimer’s Disease and Dementia with Lewy Bodies in Blood. ACS Chem. Neurosci. 2018, 9, 2786–2794. [Google Scholar] [CrossRef] [PubMed]
  49. Carota, A.G.; Campanella, B.; Del Carratore, R.; Bongioanni, P.; Giannelli, R.; Legnaioli, S. Raman Spectroscopy and Multivariate Analysis as Potential Tool to Follow Alzheimer’s Disease Progression. Anal. Bioanal. Chem. 2022, 414, 4667–4675. [Google Scholar] [CrossRef]
  50. Carlomagno, C.; Bertazioli, D.; Gualerzi, A.; Picciolini, S.; Andrico, M.; Rodà, F.; Meloni, M.; Banfi, P.I.; Verde, F.; Ticozzi, N.; et al. Identification of the Raman Salivary Fingerprint of Parkinson’s Disease Through the Spectroscopic– Computational Combinatory Approach. Front. Neurosci. 2021, 15, 704963. [Google Scholar] [CrossRef]
  51. Ryzhikova, E.; Ralbovsky, N.M.; Sikirzhytski, V.; Kazakov, O.; Halamkova, L.; Quinn, J.; Zimmerman, E.A.; Lednev, I.K. Raman Spectroscopy and Machine Learning for Biomedical Applications: Alzheimer’s Disease Diagnosis Based on the Analysis of Cerebrospinal Fluid. Spectrochim. Acta A Mol. Biomol. Spectrosc. 2021, 248, 119188. [Google Scholar] [CrossRef]
  52. Griffin, G.D.; Stratis-Cullum, D.N. Biosensors. In Encyclopedia of Microbiology; Elsevier: Amsterdam, The Netherlands, 2009; pp. 88–103. [Google Scholar]
  53. Verma, P. Tip-Enhanced Raman Spectroscopy: Technique and Recent Advances. Chem. Rev. 2017, 117, 6447–6466. [Google Scholar] [CrossRef]
  54. Xu, J.; Morten, K.J. Raman Micro-Spectroscopy as a Tool to Study Immunometabolism. Biochem. Soc. Trans. 2024, 52, 733–745. [Google Scholar] [CrossRef] [PubMed]
  55. Callery, E.L.; Morais, C.L.M.; Nugent, L.; Rowbottom, A.W. Classification of Systemic Lupus Erythematosus Using Raman Spectroscopy of Blood and Automated Computational Detection Methods: A Novel Tool for Future Diagnostic Testing. Diagnostics 2022, 12, 3158. [Google Scholar] [CrossRef] [PubMed]
  56. Chen, X.; Wu, X.; Chen, C.; Luo, C.; Shi, Y.; Li, Z.; Lv, X.; Chen, C.; Su, J.; Wu, L. Raman Spectroscopy Combined with a Support Vector Machine Algorithm as a Diagnostic Technique for Primary Sjögren’s Syndrome. Sci. Rep. 2023, 13, 5137. [Google Scholar] [CrossRef] [PubMed]
  57. Xu, Q.; Wu, X.; Chen, X.; Zhang, Z.; Wang, J.; Li, Z.; Chen, X.; Lei, X.; Li, Z.; Ma, M.; et al. Diagnosis and Activity Prediction of SLE Based on Serum Raman Spectroscopy Combined with a Two-Branch Bayesian Network. Front. Immunol. 2025, 16, 1467027. [Google Scholar] [CrossRef]
  58. Zhao, Y.; Tian, S.H.; Yu, L.; Zhang, Z.H.; Zhang, W. Analysis and Classification of Hepatitis Infections Using Raman Spectroscopy and Multiscale Convolutional Neural Networks. J. Appl. Spectrosc. 2021, 88, 441–451. [Google Scholar] [CrossRef]
  59. Wu, J.; Cui, X.; Kang, Z.; Wang, S.; Zhu, G.; Yang, S.; Wang, S.; Li, H.; Lu, C.; Lv, X. Rapid Diagnosis of Diabetes Based on ResNet and Raman Spectroscopy. Photodiagnosis Photodyn. Ther. 2022, 39, 103007. [Google Scholar] [CrossRef]
  60. Luo, R.; Popp, J.; Bocklitz, T. Deep Learning for Raman Spectroscopy: A Review. Analytica 2022, 3, 287–301. [Google Scholar] [CrossRef]
  61. Pathak, D.K.; Rani, C.; Sati, A.; Kumar, R. Developments in Raman Spectromicroscopy for Strengthening Materials and Natural Science Research: Shaping the Future of Physical Chemistry. ACS Phys. Chem. Au 2024, 4, 430–438. [Google Scholar] [CrossRef]
  62. Canetta, E. Current and Future Advancements of Raman Spectroscopy Techniques in Cancer Nanomedicine. Int. J. Mol. Sci. 2021, 22, 13141. [Google Scholar] [CrossRef]
  63. Wang, Y.; Fang, L.; Wang, Y.; Xiong, Z. Current Trends of Raman Spectroscopy in Clinic Settings: Opportunities and Challenges. Adv. Sci. 2024, 11, 2300668. [Google Scholar] [CrossRef]
  64. Liu, J.; Wang, P.; Zhang, H.; Guo, Y.; Tang, M.; Wang, J.; Wu, N. Current Research Status of Raman Spectroscopy in Glioma Detection. Photodiagnosis Photodyn. Ther. 2024, 50, 104388. [Google Scholar] [CrossRef]
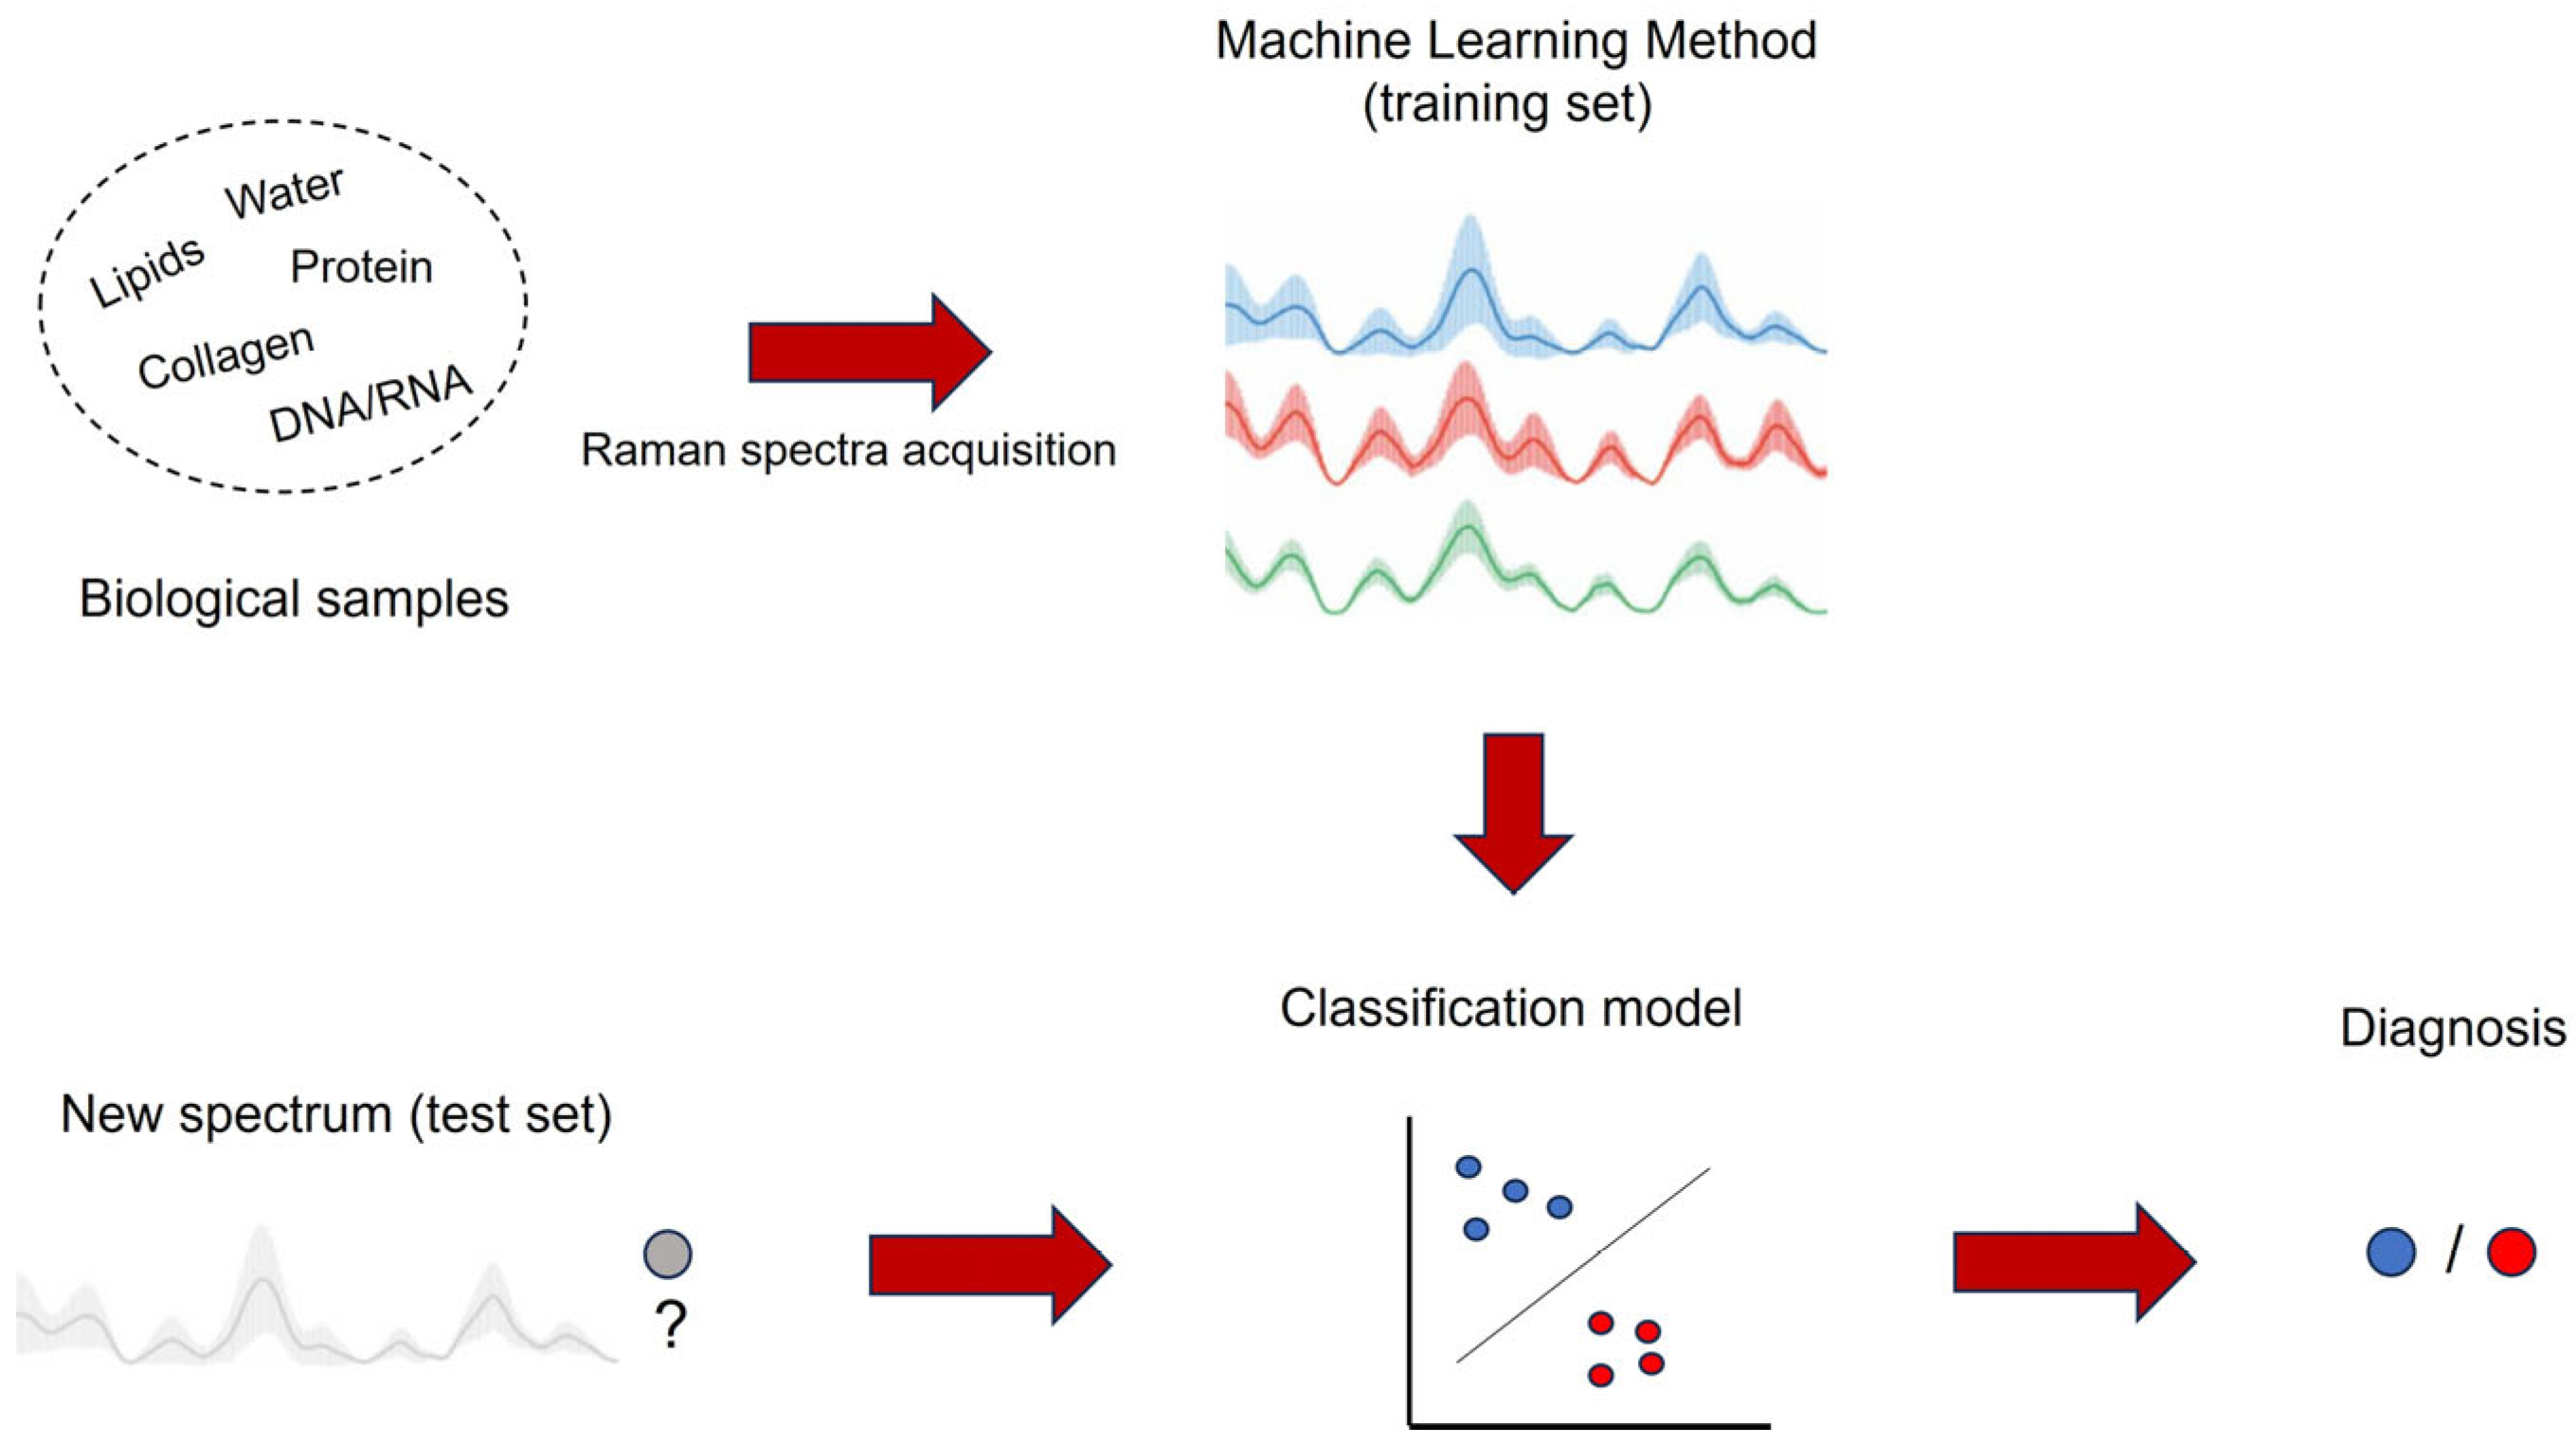
Figure 1. A combination of Raman spectroscopy and a machine learning method for disease diagnosis, showing the differentiation between a healthy (blue circle) and a diseased (red circle) sample. Adapted from [1], the spectra were reprinted with permission from [8]. Copyright 2022, Elsevier.
Photochem 05 00029 g001
Figure 2. Biomedical applications of Raman spectroscopy.
Photochem 05 00029 g002
Figure 3. Jablonski diagram showing the energy transitions for Rayleigh and Raman scattering. In Raman scattering, there is an energy difference between the scattered photon and the incident photon. This energy arises from the vibrations of atoms or the rotational motion of molecules. Adapted from [7].
Photochem 05 00029 g003
Figure 4. Standard laboratory Raman system. Adapted from [25].
Photochem 05 00029 g004
Figure 5. Raman system with fiber optic probe. Adapted from [24,25].
Photochem 05 00029 g005
Table 1. Raman spectroscopy in cancer diagnosis.
ReferenceCancerExperimentData Analysis
Cao et al. [9], 2022ColorectalEx vivoDeep-learning approach
Fousková et al. [27], 2023In vivoSupervised machine learning methods
Esteves et al. [28], 2024 ColonCAM samplesMachine learning based algorithms
Lazaro-Pacheco et al. [30], 2021BreastEx vivoPCA and LDA
Bhattacharjee et al. [31], 2015In vivoPCA and PC-LDA
Nargis et al. [10], 2021Serum samplePCA and PLS-DA
Bratchenko et al. [8], 2022SkinIn vivoCNN analysis
Hano et al. [33], 2024 LungBlood plasma samplesMachine learning models
Fousková et al. [34], 2024In vivo and ex vivoPCA-SVM model
Chen et al. [35], 2021ProstateUrine samplesCNN algorithm
Breugel et al. [36], 2023Ex vivoPCA and PLS-DA
Wang et al. [13], 2021CervicalEx vivoIndependent t-test, SVM algorithm
Shaikh et al. [38], 2017In vivoPCA-LDA
Shrivastava et al. [39], 2021Serum samplesPCA-LDA
Iturrioz-Rodríguez et al. [42], 2022BrainEx vivoPCA-LDA
Bukva et al. [43], 2021Blood serumPCA-SVM algorithm
Bovenkamp et al. [45], 2018BladderEx vivoPCA and kNN
Disclaimer/Publisher’s Note: The statements, opinions and data contained in all publications are solely those of the individual author(s) and contributor(s) and not of MDPI and/or the editor(s). MDPI and/or the editor(s) disclaim responsibility for any injury to people or property resulting from any ideas, methods, instructions or products referred to in the content.