Article

Selective and Sensitive Dual Chromogenic Cyanide and Fluorescent Azide Probe

1
Department of Chemistry, Howard University, 626 College Street NW, Washington, DC 20059, USA
2
Department of Chemistry, Morgan State University, 1700 E Cold Spring Ln, Baltimore, MD 21251, USA
3
Department of Chemistry and Earth Sciences, College of Arts and Sciences, Qatar University, PO Box 2713, Doha, Qatar
4
Department of Chemistry, College of Science, Kuwait University, Farwaniya 85700, Kuwait
5
Tarrant County Community College District, Northwest Campus, 4801 Marine Creek Parkway, Fort Worth, TX 76179, USA
*
Authors to whom correspondence should be addressed.
Photochem 2025, 5(2), 12; https://doi.org/10.3390/photochem5020012
Submission received: 30 January 2025 / Revised: 17 March 2025 / Accepted: 1 May 2025 / Published: 6 May 2025

Abstract

:
IR-780 is a heptamethine cyanine dye that exhibits strong absorbance in the near-infrared region. Herein, we report IR-780 dye as a dual sensor for chromogenic cyanide detection and azide’s fluorogenic sensing in acetonitrile. Cyanide and hydroxide cause instant, dramatic color changes in the dye solution from green to yellow and dramatic spectral changes in the UV-Vis spectrum. The interaction of cyanide and hydroxide with the dye caused a dramatic decrease in the intensity of the strong absorption band at 780 nm and a concomitant band appearance at 435 nm. Other monovalent ions, including fluoride, chloride, bromide, iodide, dihydrogen phosphate, thiocyanate, acetate, and dihydrogen arsenate, caused no significant color or spectral changes. UV-Vis studies showed that the IR-780 dye is sensitive and selective to both ions. The detection limits for cyanide and azide are 0.39 µM and 0.50 µM, respectively. Interestingly, the IR-780 dye exhibited strong fluorescence at 535nm upon interaction with azide, while its initial emission at 809 nm was quenched. Both UV-Vis and fluorescence spectroscopy accomplished the detection of cyanide and azide using IR-780. Furthermore, the sensor’s effectiveness in fluorescence imaging of intracellular CN⁻ ions is demonstrated in live HeLa cells.

1. Introduction

Cyanine dye IR 780 (Scheme 1) is a lipophilic dye with absorption and emission capabilities in the near-infrared (NIR) region. It is used in the bioimaging and therapy of different types of cancers [1,2,3,4,5]. It is highly effective in pre-clinical tumor detection and as a drug delivery agent, aiding in clinical planning for oncological surgeries. NIR dyes can harness their photothermal stability due to the absorbance in the NIR range, accompanied by concomitant heat emission. At the same time, its hydrophobicity is a limitation of its application. Based on their excellent photophysical properties, biocompatibility, and low toxicity, these compounds have applications in chemical sensing and detecting anions, cations, and biomolecules [6].
Cyanide is of interest to analytical and environmental chemists due to its wide range of industrial applications and environmental impact. Exposure to cyanide may lead to chronic and acute diseases, such as blood toxicity and cardiovascular and nervous system disorders. Cyanide is fatal at very low concentrations. Organic cyanides, known as nitriles, are used extensively as versatile precursors for various pharmaceuticals, agrochemicals, polymers, and dyes. Different analytical methods have been developed to detect cyanide, such as titrimetric [7], voltammetric [8], and electrochemical [9] analysis. However, these methods are time-consuming and may involve highly sophisticated experimental settings.
Various molecular sensors have been developed in search of rapid and straightforward methods for cyanide detection. The selective cyanide sensors were designed to capitalize on cyanide’s high nucleophilicity and weak hydrogen bonding properties in aqueous media. Examples of reported colorimetric and fluorimetric cyanide sensors are oxazines [10], cationic boranes [11], acridinium salts [12], benzil-based systems [13], oxalohydrazide as a fluorescent probe for Al3+/CN- [14], coumarins [15,16,17,18], hydrazones [19], aldehydes and ketones [20,21,22,23], imines, and natural dyes such as Lawsone [24] and curcumin [25]. The currently available cyanide sensors require an extended synthesis procedure and are not readily available for development. Additionally, several available cyanide sensors are limited in their application, as they perform optimally in organic solvents, are susceptible to interference from other anions, and/or exhibit low sensitivity due to their short absorption and emission wavelengths, which can interfere with other natural processes. Some of these sensors have high detection limits; therefore, developing more sensitive cyanide probes is necessary.
Sodium azide is a colorless, tasteless, odorless solid that is widely employed in automobile airbags [26], airplane escape chutes, pest control, agriculture, research laboratories as a preservative [27], and biocide [28]. The toxicity and lethality of sodium azide are comparable to those of cyanide. Contamination by sodium azide is, therefore, a significant environmental concern. Significantly few azide sensors have been developed, such as the fluorescent sensor nitrobenzoxadiazole [29], a discriminative sensor for sulfide/azide [30].
Recently, different classes of cyanine platforms were developed [31], with such platforms containing cyanine, hemicyanine, and squaraines as probes and chemosensors [6]. These platforms are preferred for detection because they are easily accessible, low-cost, non-destructive, highly selective, and sensitive toward analytes [32,33,34,35,36]. NIR fluorescent probes were used as chemosensors for biologically essential analytes such as ROS/RNS [37,38], biological thiols [39,40,41], amyloid proteins [42], metal ions (Cu2+, Hg2+, and Zn2+) [42], metal ions [43,44,45,46,47,48,49], sulfur dioxide [50], enzymes [51,52], intracellular pH changes [53,54,55], and cyanide sensors [56].
Extensive work on developing chromogenic and fluorogenic cyanide chemosensors has been reviewed [57]. Pentamethine (Cy5) cyanine dye was first reported as a fluorescent sensor for cyanide in water [58]. The investigation was primarily qualitative, yielding unsatisfactory results for the acetonitrile/water mixture. Therefore, the solvent system was changed to biphasic (dichloromethane/water, 1:1) with the addition of a phase transfer catalyst (tetrabutylammonium bromide). Using cyanine dye (Cy7) as a cyanide sensor in both the organic and solid phases [59] was reported, employing quantitative and qualitative methods.
This paper reports IR-780 dye as a new single-molecular discriminative and multi-analyte probe for two lethally toxic and industrially relevant species: cyanide and azide ions. The addition of cyanide ions to the probe’s indolium group interrupted the π-conjugation. Due to internal charge transfer (ICT) disruption, the color changed from green to yellow.

2. Experimental

2.1. Materials and Methods

The IR-780 dye and all anions, including tetrabutylammonium salts of cyanide, azide, phosphate, acetate, thiocyanate, bromide, hydroxide, and inorganic salts of fluoride, chloride, iodide, dihydrogen phosphate, and dihydrogen arsenate, were purchased from Sigma-Aldrich. All UV-Vis spectroscopy experiments were conducted in the solution phase and recorded using an Agilent UV spectrometer (model 8453) equipped with a quartz cuvette (path length, 1 cm). Fluorescence spectral experiments were performed using a Shimadzu Spectrofluorophotometer (Model RF-6000) with an excitation wavelength of 430 nm and a quartz cuvette (path length, 1; volume, 3000 µL). Spectrophotometric titrations were performed at various concentrations of the sensors and anions in acetonitrile.

2.2. Preparation of the Dye and Anion Stock Solutions

A 5.0 × 10⁻³ M dye stock solution was prepared in acetonitrile. This solution was further diluted to 5.0 μM. This concentration was used consistently throughout UV-Vis and fluorescence studies. All the anions were prepared at a concentration of 1.0 × 10⁻¹ M in 100% acetonitrile, and a diluted solution of 1.0 × 10⁻³ M was prepared and used for analysis. Meanwhile, the inorganic salts were dissolved in 100% deionized water. The total volume of the solutions was maintained at 2000 μL. This study was also performed in 100% acetonitrile and acetonitrile water (75:25).

2.3. The Quantitative Response of the Dye to Various Anions by UV-Vis and Fluorescence Studies

Blank correction was performed using 100% acetonitrile. Reference correction was performed using the reagent alone in 100% acetonitrile. For the dye–anion analyses, 20 μL of the dye was added to a mixture of 1960 μL of acetonitrile and 20 μL of the organic anions, and the mixture was shaken well. The absorbance reading was recorded immediately. This was performed for all the samples. In the case of a 75:25 acetonitrile–water mixture as the solvent, 20 μL of the dye was added to a mix of 1480 μL of acetonitrile and 480 μL of water, followed by the addition of 20 μL of different anions, and the readings were recorded immediately. The dye (5.0 μM) and each selective anion (5.0 μM) were mixed in ratios 1:9, 2:8, 3:7, 4:6, 5:5, 6:4, 7:3, 8:2, and 9:1 in acetonitrile and acetonitrile/water (3:1) to calculate the stoichiometric ratio from Job’s plot. After mixing for a few seconds, the UV-Vis reading was taken at room temperature. The fluorescence was measured at an excitation wavelength of 430 nm. The concentrations were the same as above, and the screening of anions by fluorescence was performed only in 100% acetonitrile.

2.4. The Fluorescence Imaging of Live Cells with the Dye and the Quenching of Fluorescence in the Presence of Cyanide

HeLa cells (CCL-2) were purchased from the American Type Culture Collection (ATCC; Manassas, VA, USA). Following ATCC’s protocol, the cells were cultured in Eagle’s Minimum Essential Medium (EMEM, ATCC) supplemented with 10% fetal bovine serum (FBS, Gibco by Thermo Fisher Scientific, Waltham, MA, USA) and 1% penicillin–streptomycin. Cultures were maintained at 37 °C in a humid atmosphere containing 5.0% CO2. Fluorescence imaging was performed using a Leica STELLARIS 5 Confocal Microscope. For the MTS assay, the CellTiter 96® Aqueous One Solution Cell Proliferation Assay Kit (Promega, Madison, WI, USA) was utilized following the manufacturer’s instructions.

3. Results and Discussions

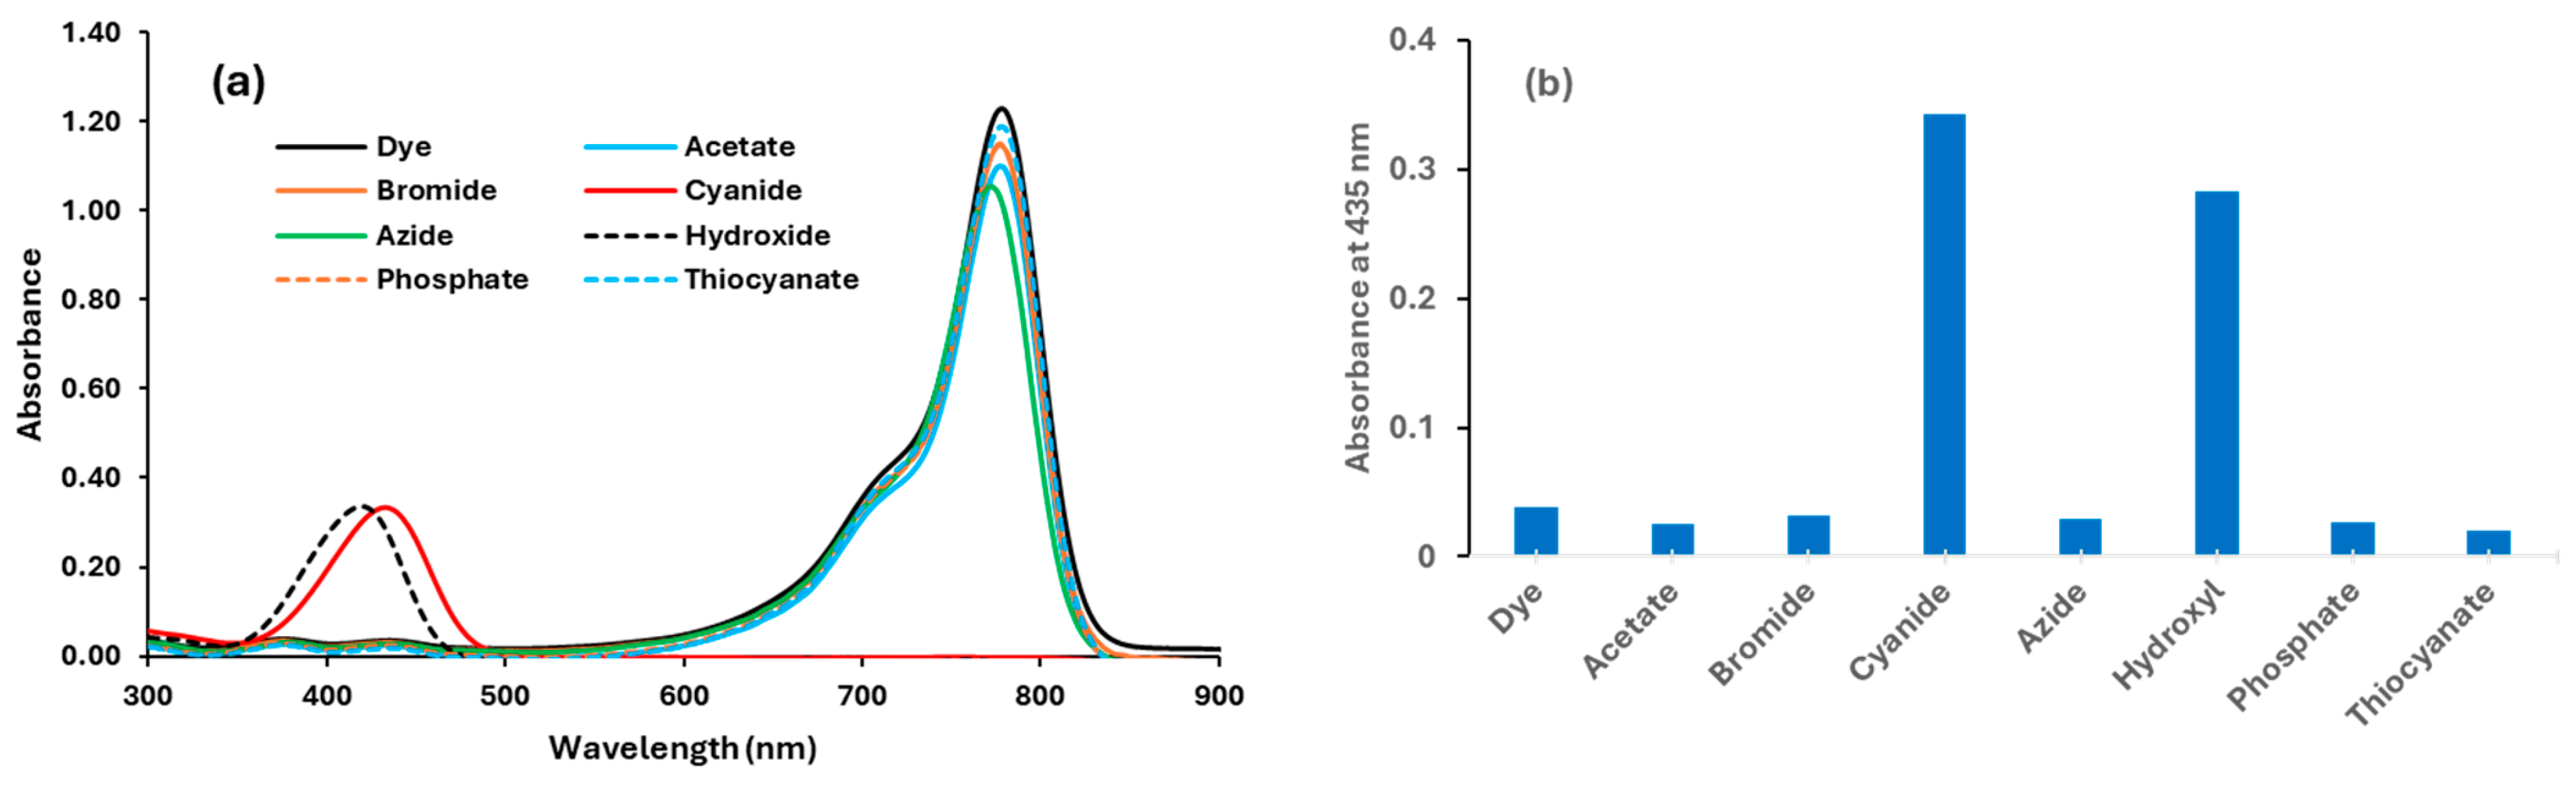
3.1. Investigation of the Dye’s Selectivity and Sensitivity Towards Anions in 100% Acetonitrile
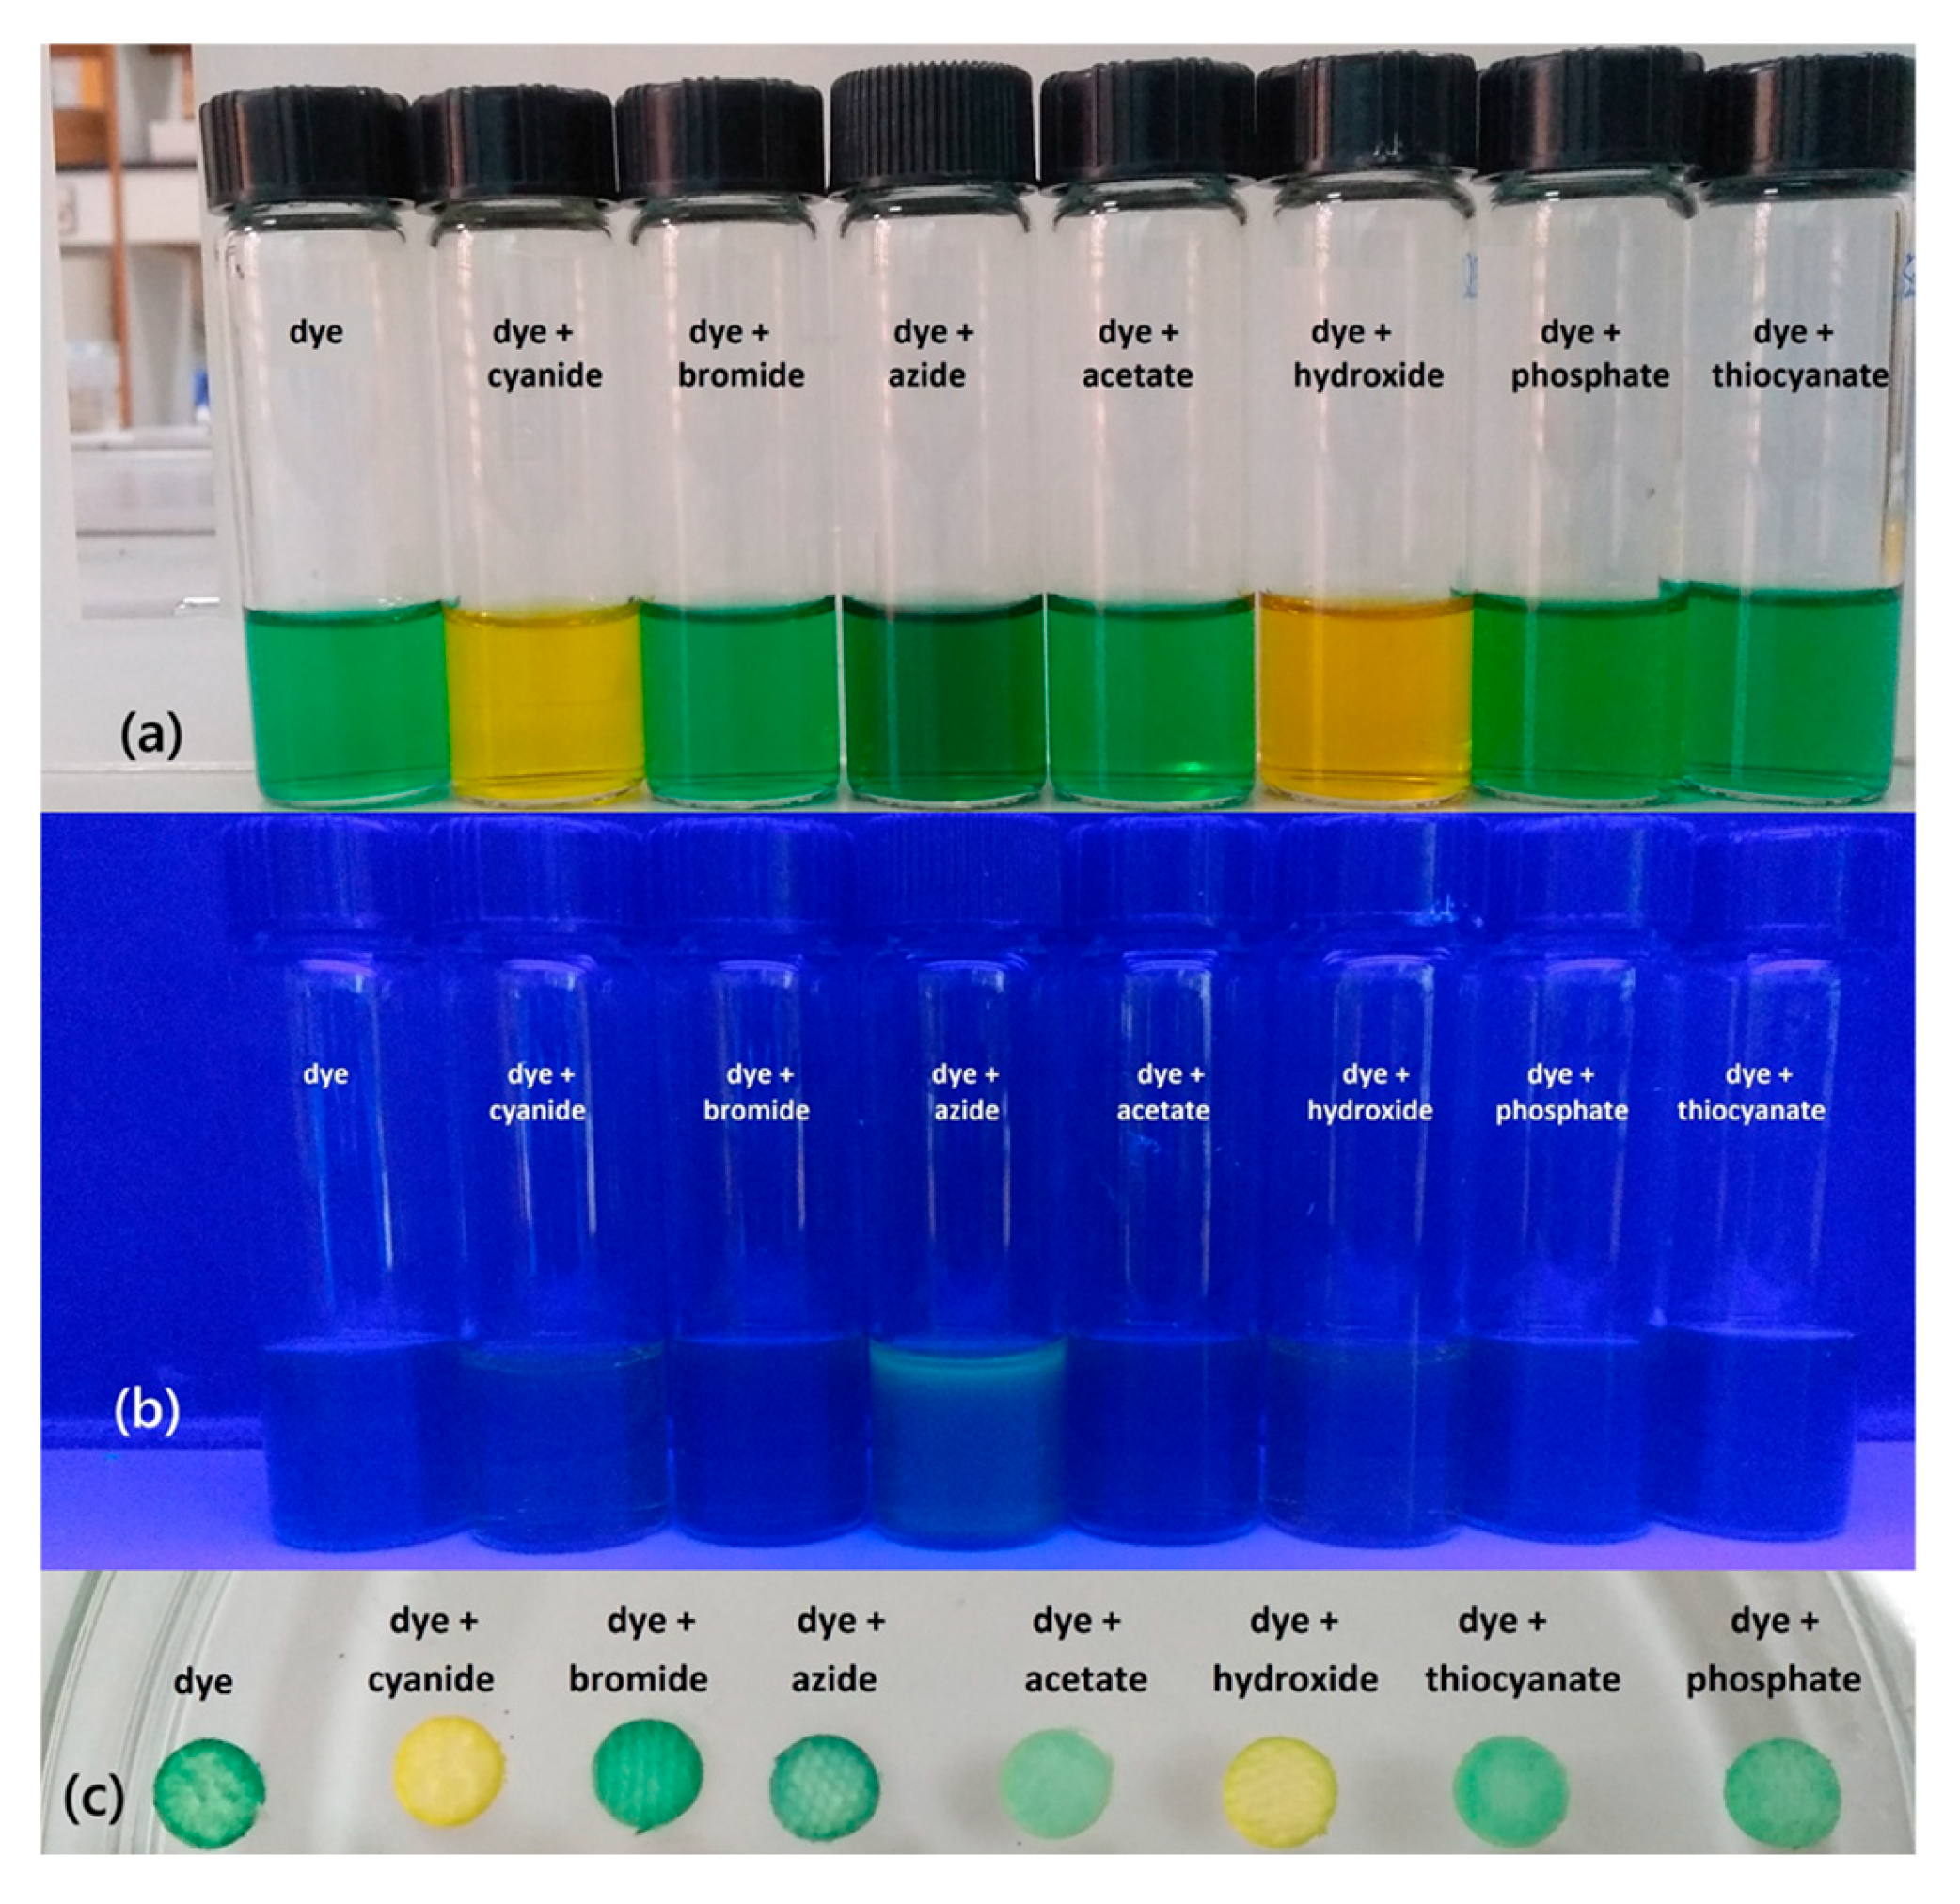
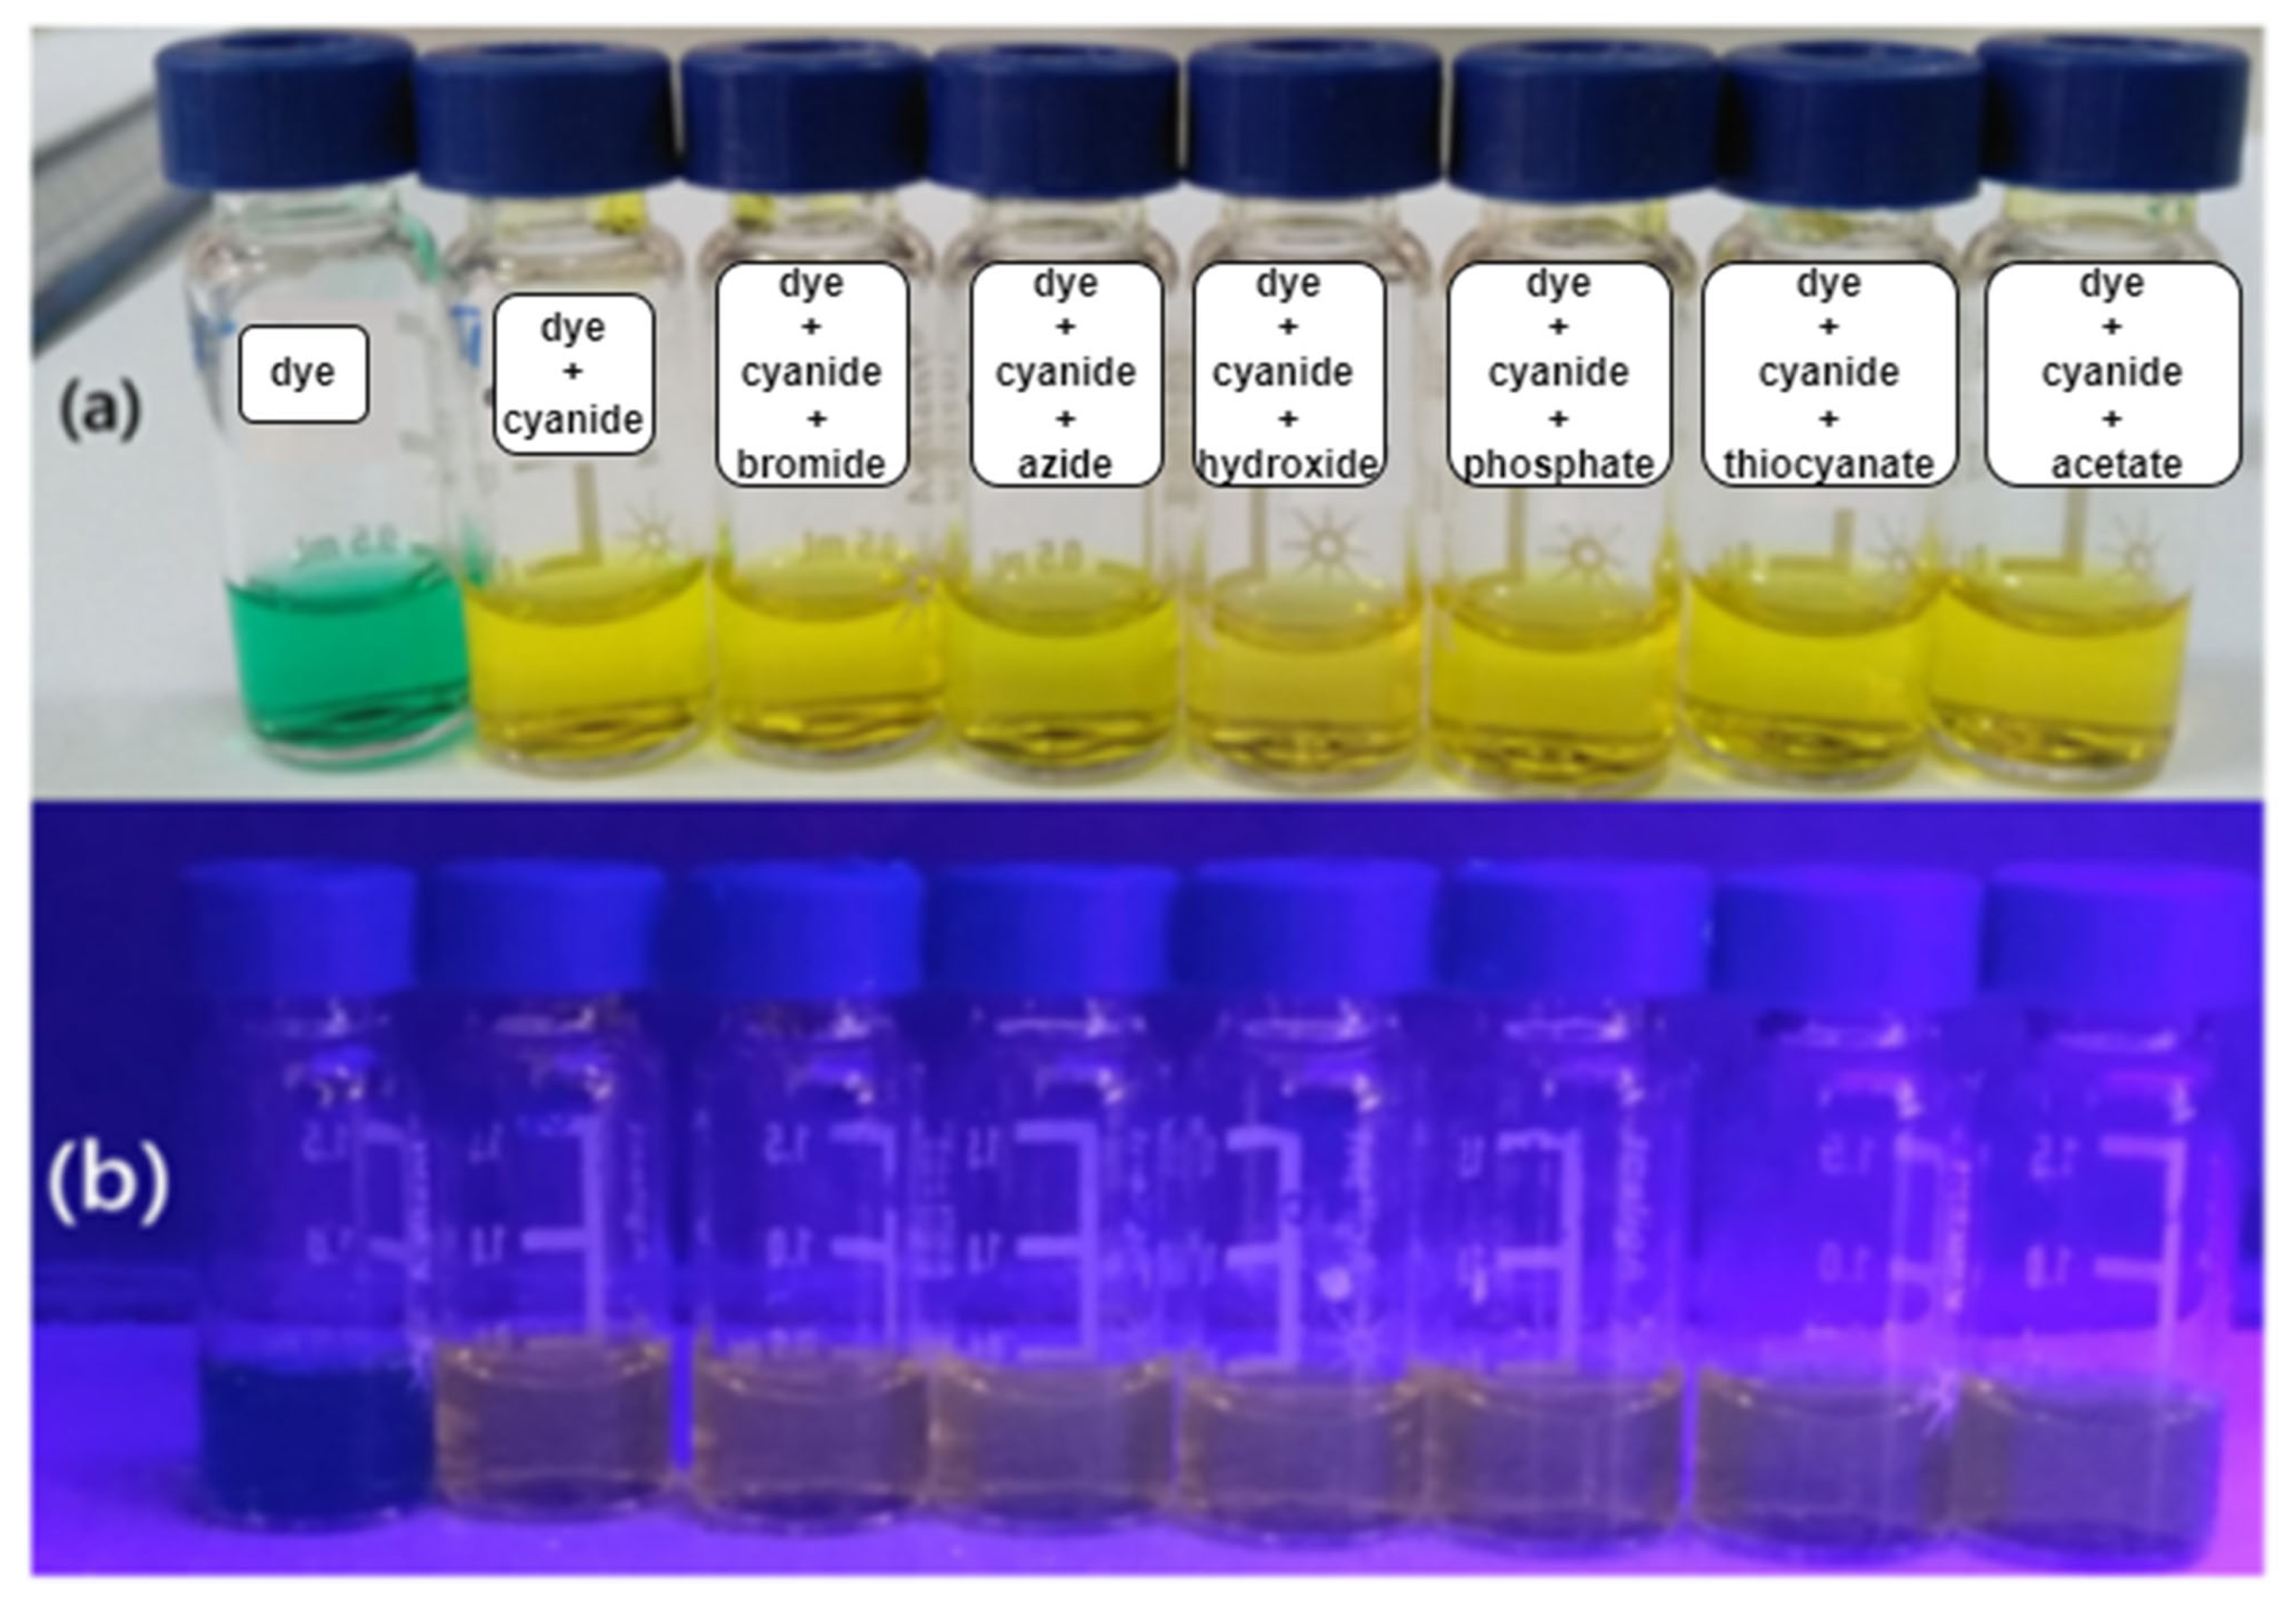
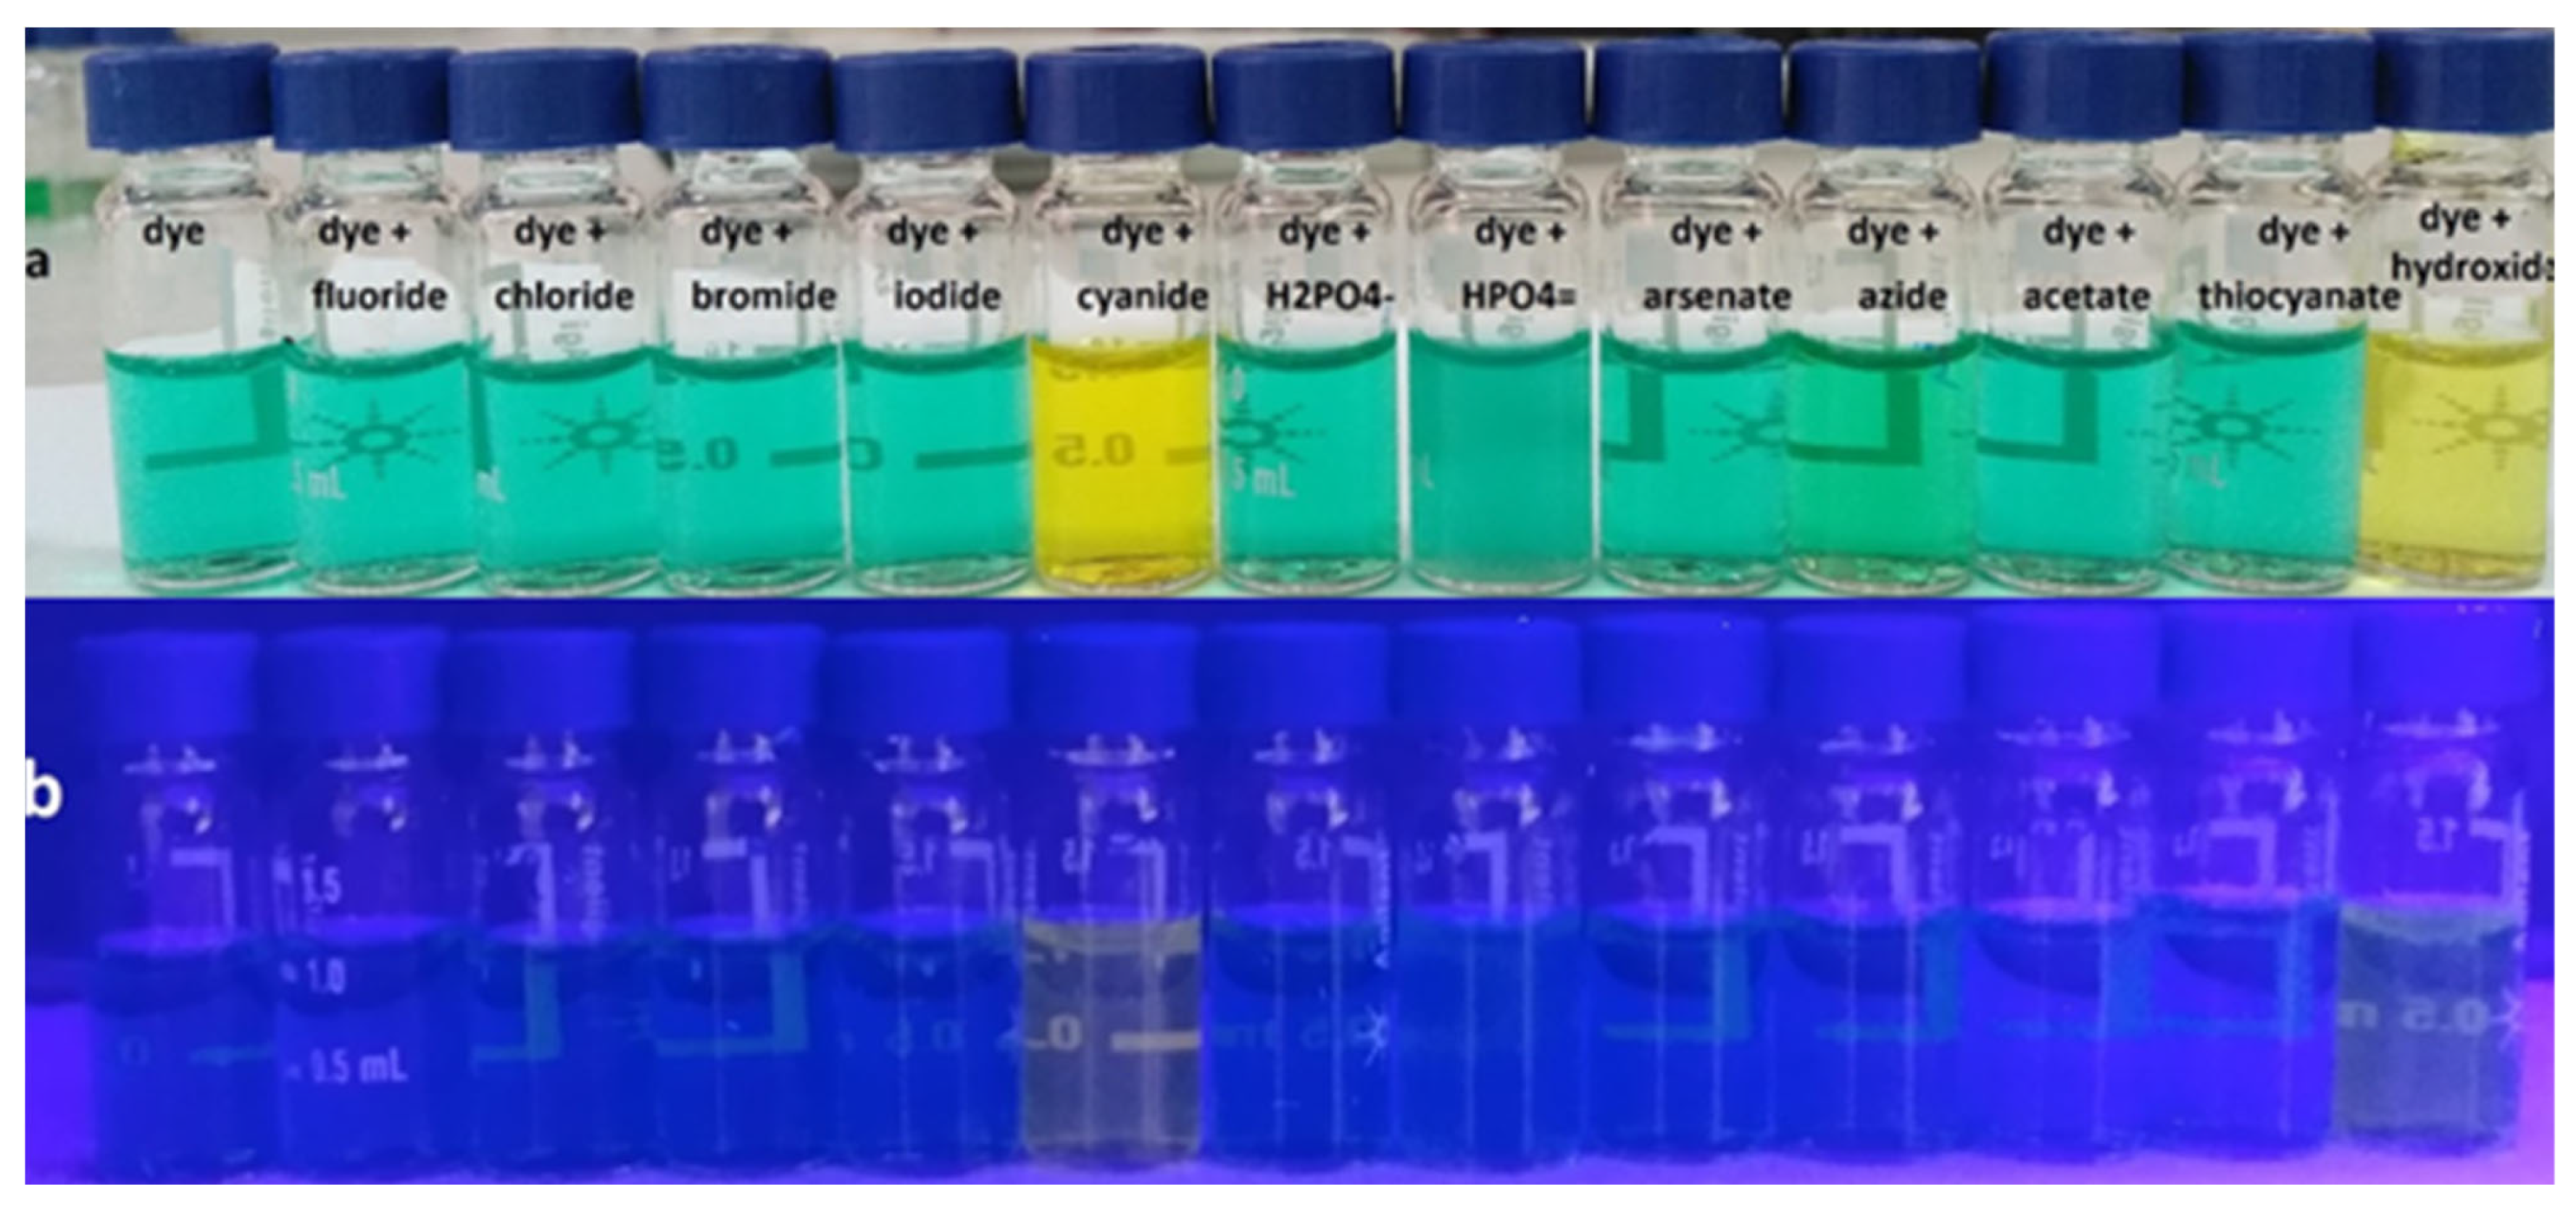
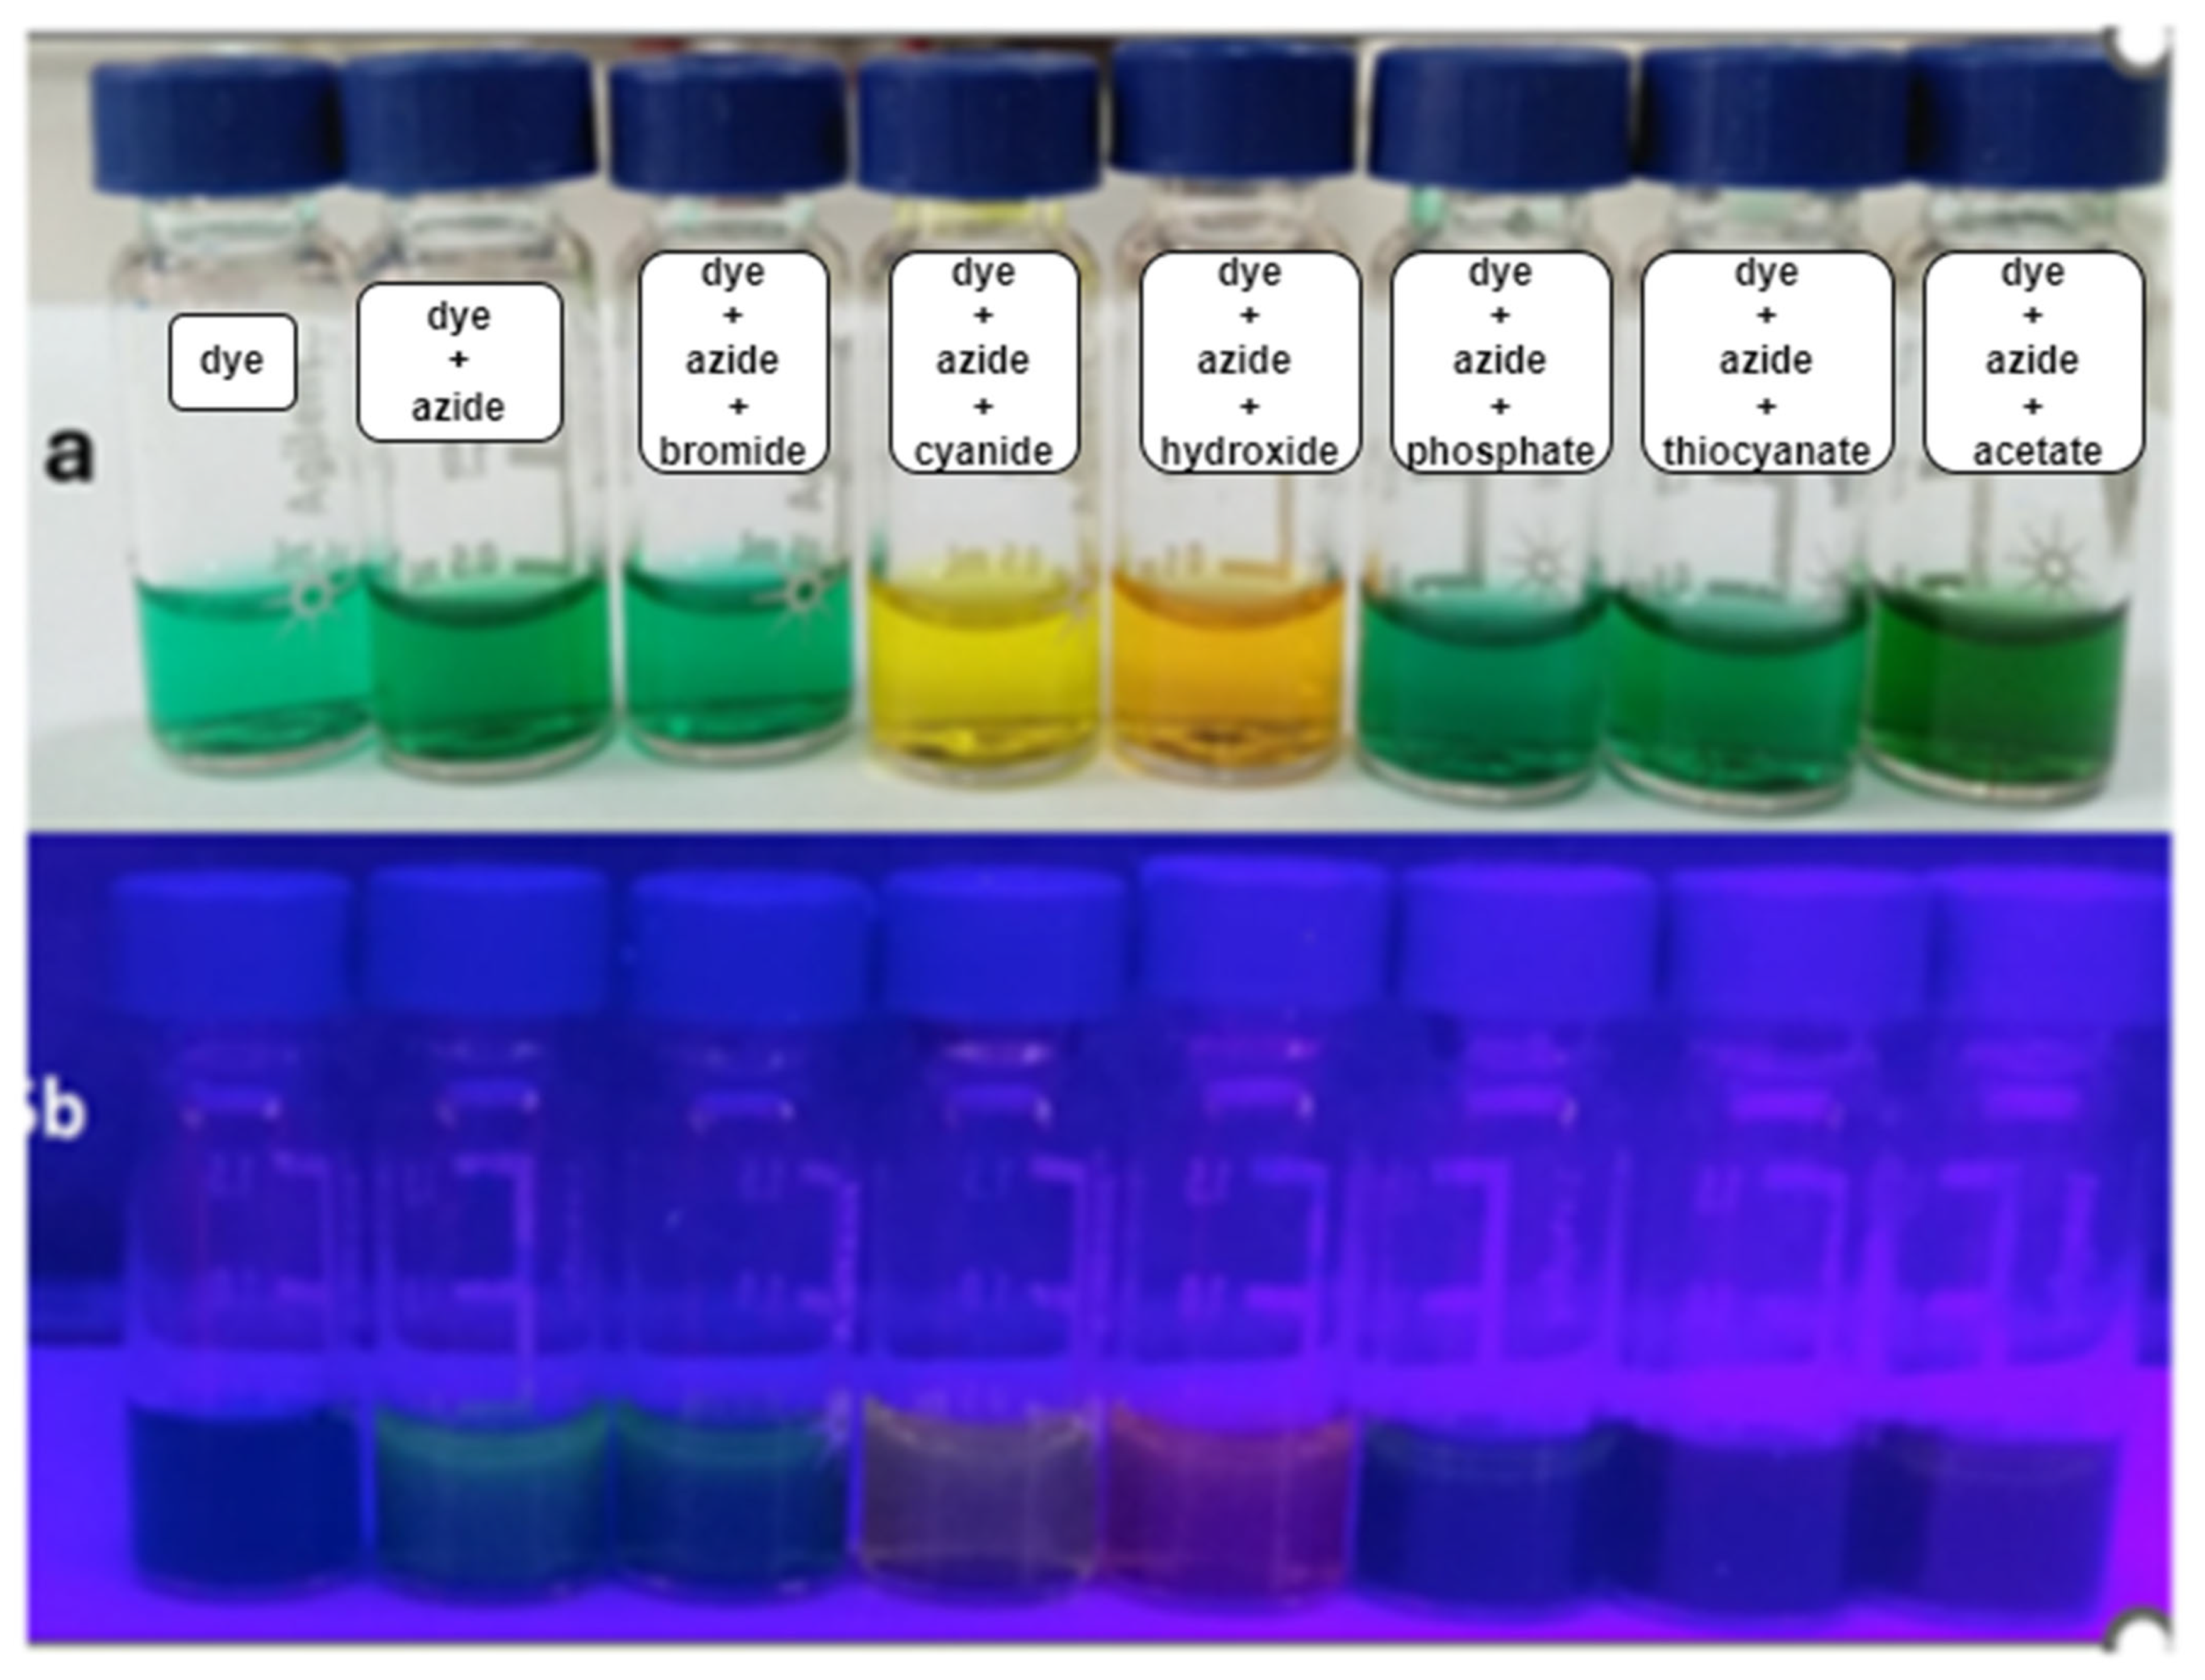
3.1.1. Visual Test

Upon mixing the dye solution (50 μM) with 20 equivalents of the anions tested, an instant color change from green to yellow was observed with cyanide and hydroxide. Acetate, phosphate, and azide caused no significant change but exhibited a slight increase over time, as shown in Figure 1a. In contrast, other anions, such as bromide, chloride, iodide, fluoride, and thiocyanate, showed no change. On the other hand, only azide exhibited strong yellow fluorescence under a UV lamp with an excitation wavelength of 365 nm. Interestingly, these changes were instantaneous and visible, as shown under normal light and a UV lamp at 365 nm (Figure 1a,b). The color change was also demonstrated on cellulose disks, as shown in Figure 1c. As reported earlier, this reflects the dye’s capability as a selective colorimetric probe for cyanide and hydroxide [56]. The strong fluorescence due to azide has not been previously reported or investigated. The color change with azide became significant with time. The interaction of cyanide and hydroxide with the dye caused a dramatic decrease in the intensity of the strong absorption band at 780 nm and a concomitant band appearance at 435 nm, as shown in Figure 2. Other monovalent ions, including fluoride, chloride, bromide, iodide, dihydrogen phosphate, thiocyanate, acetate, and dihydrogen arsenate, caused no significant color or spectral changes.

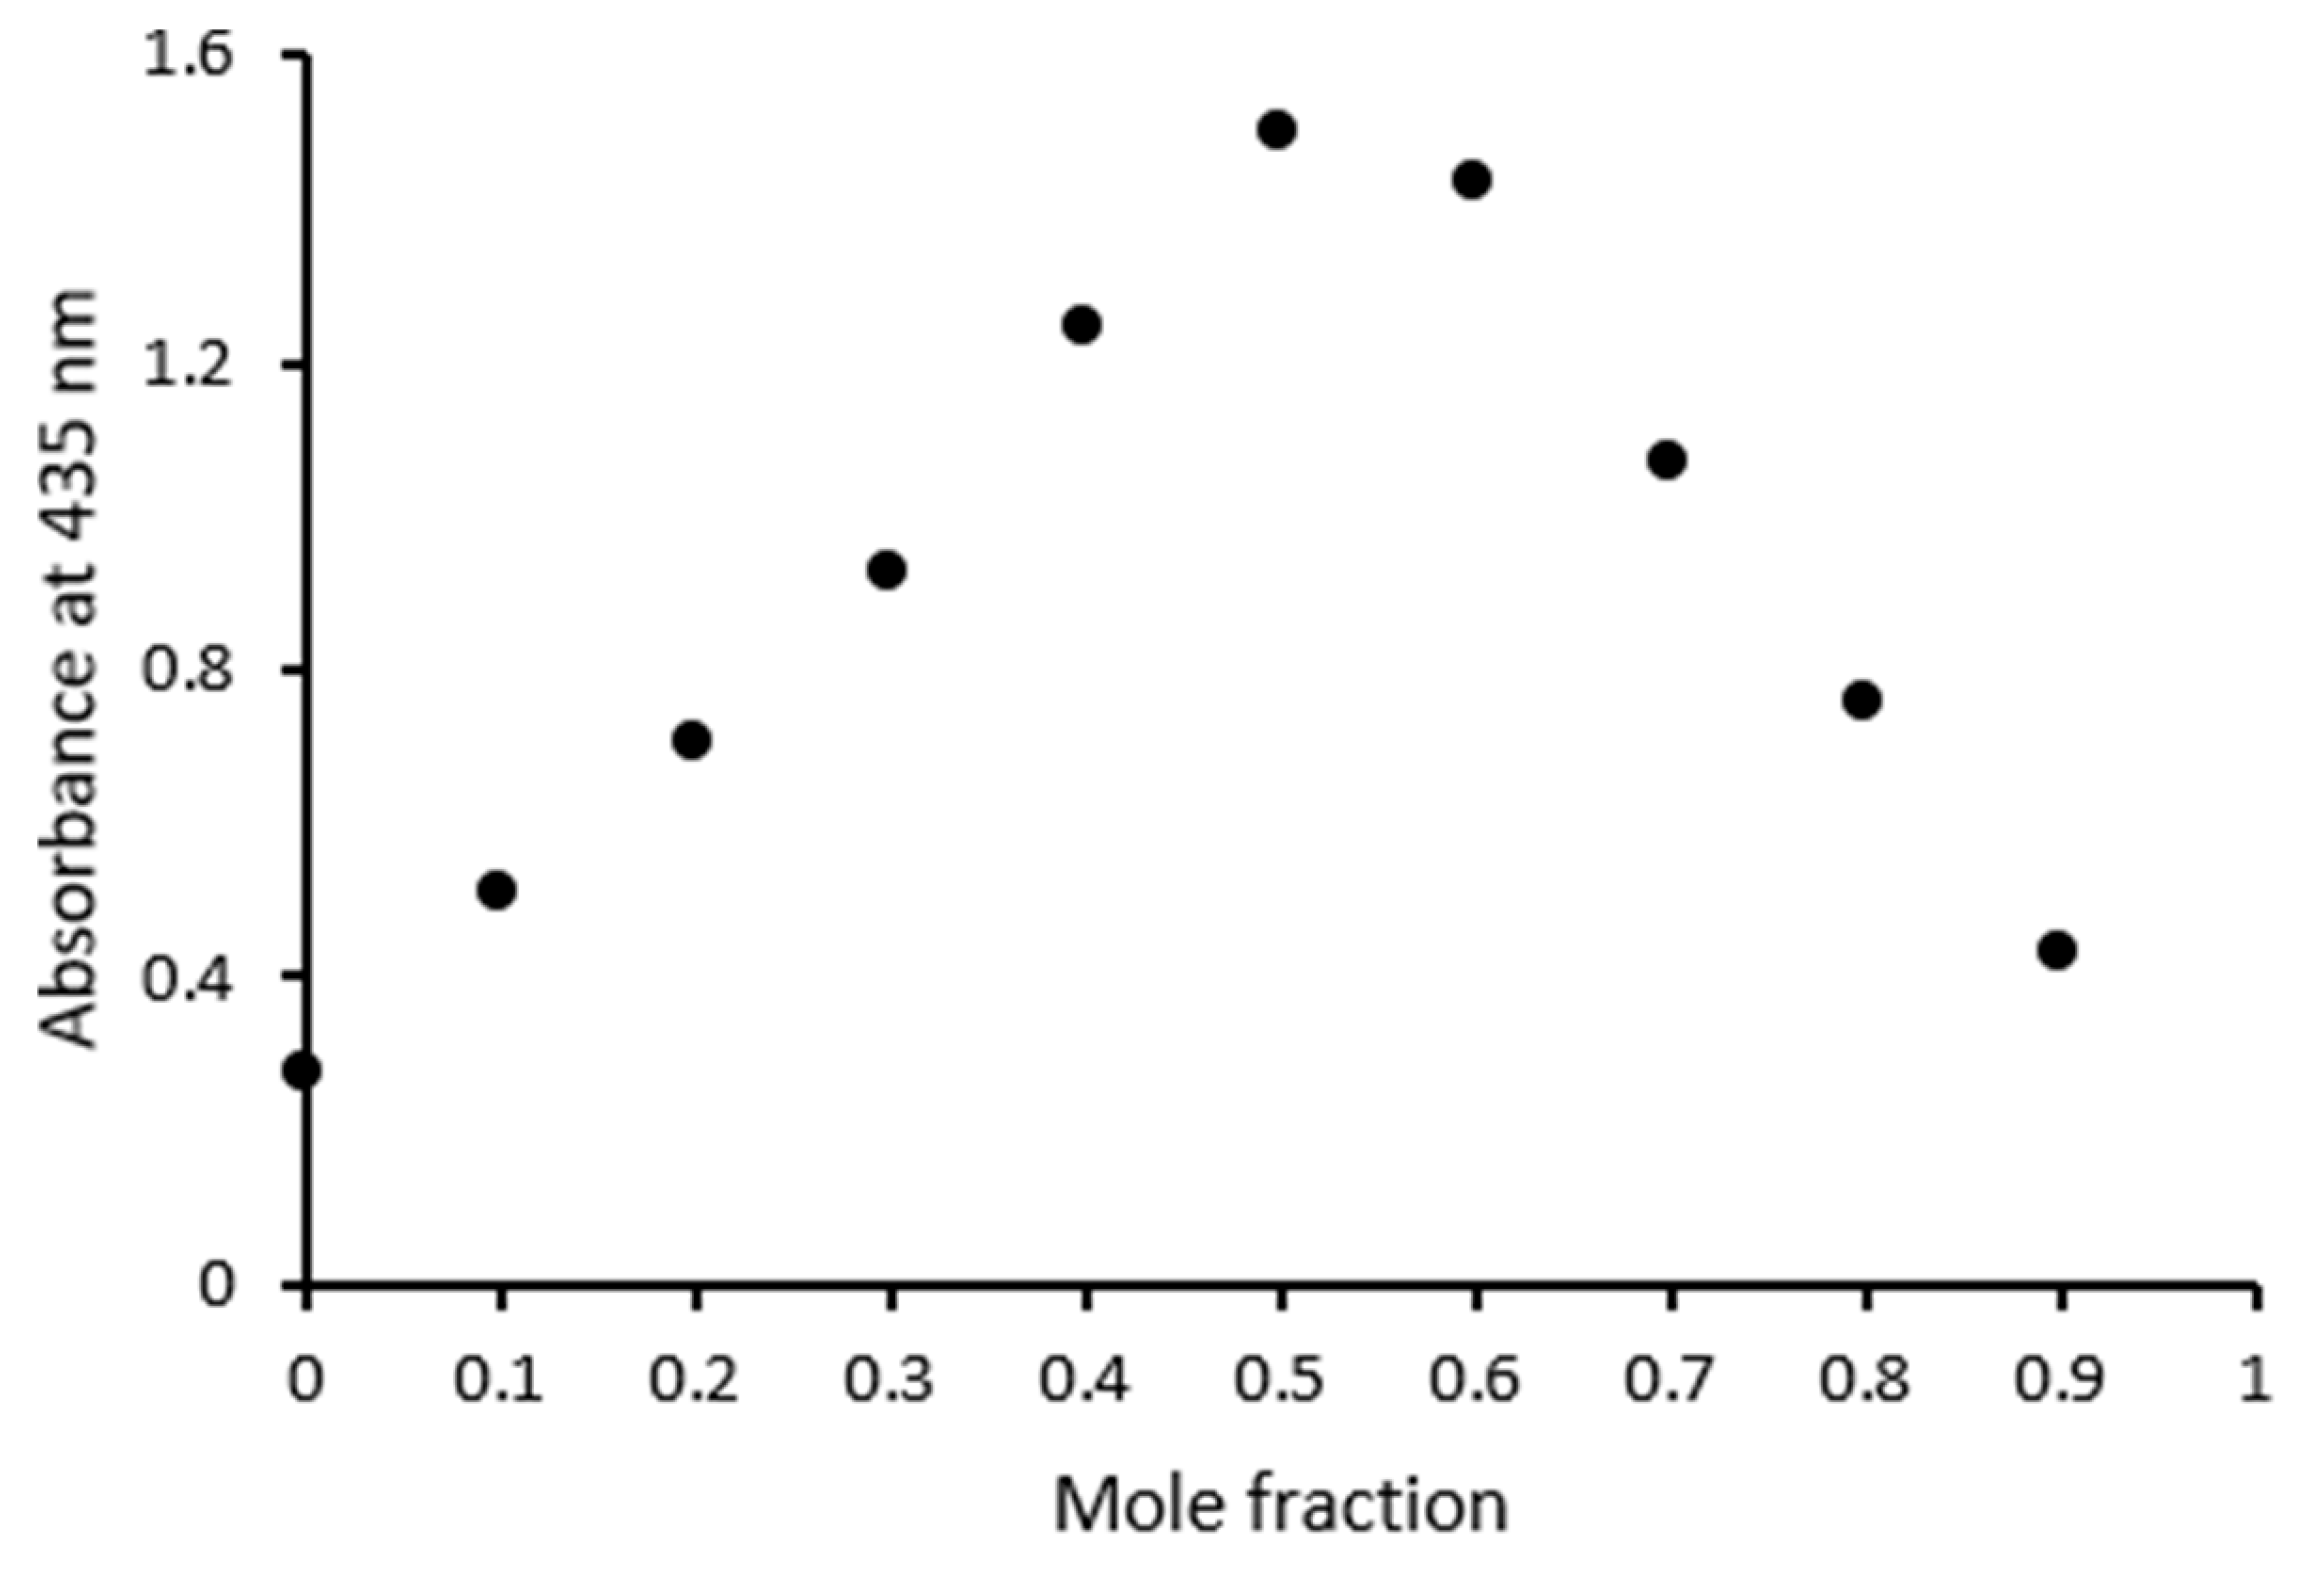
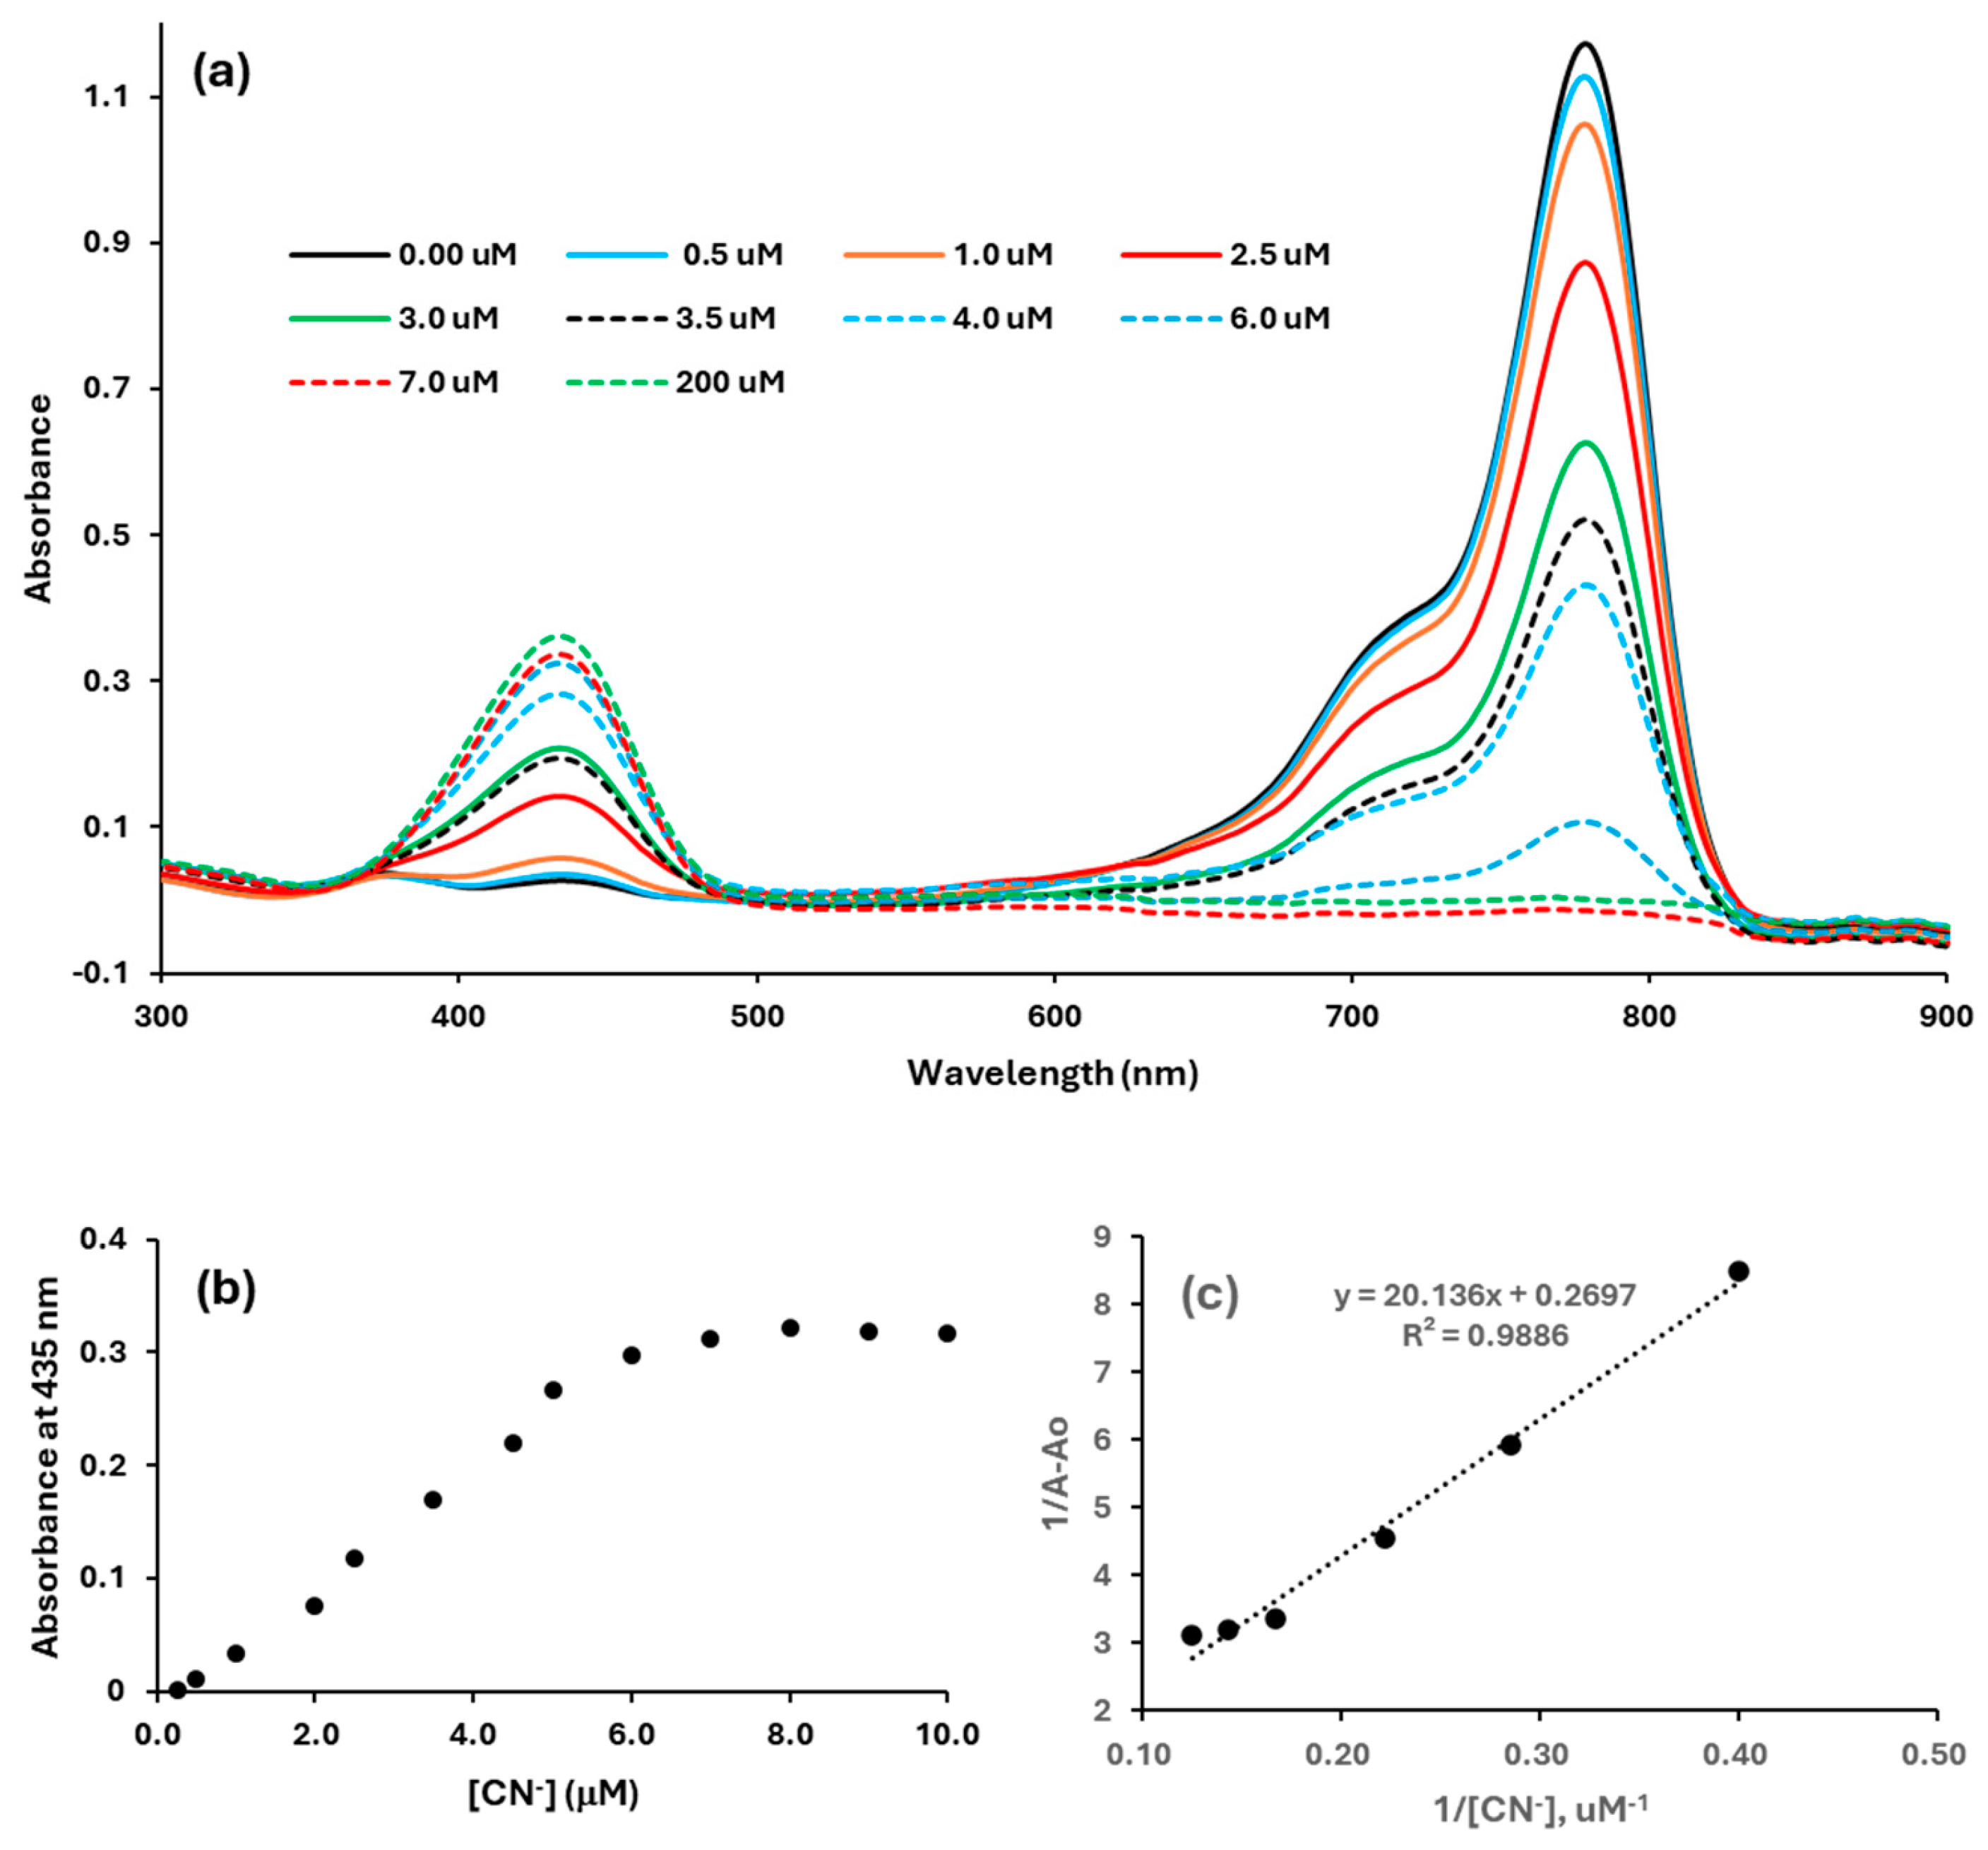
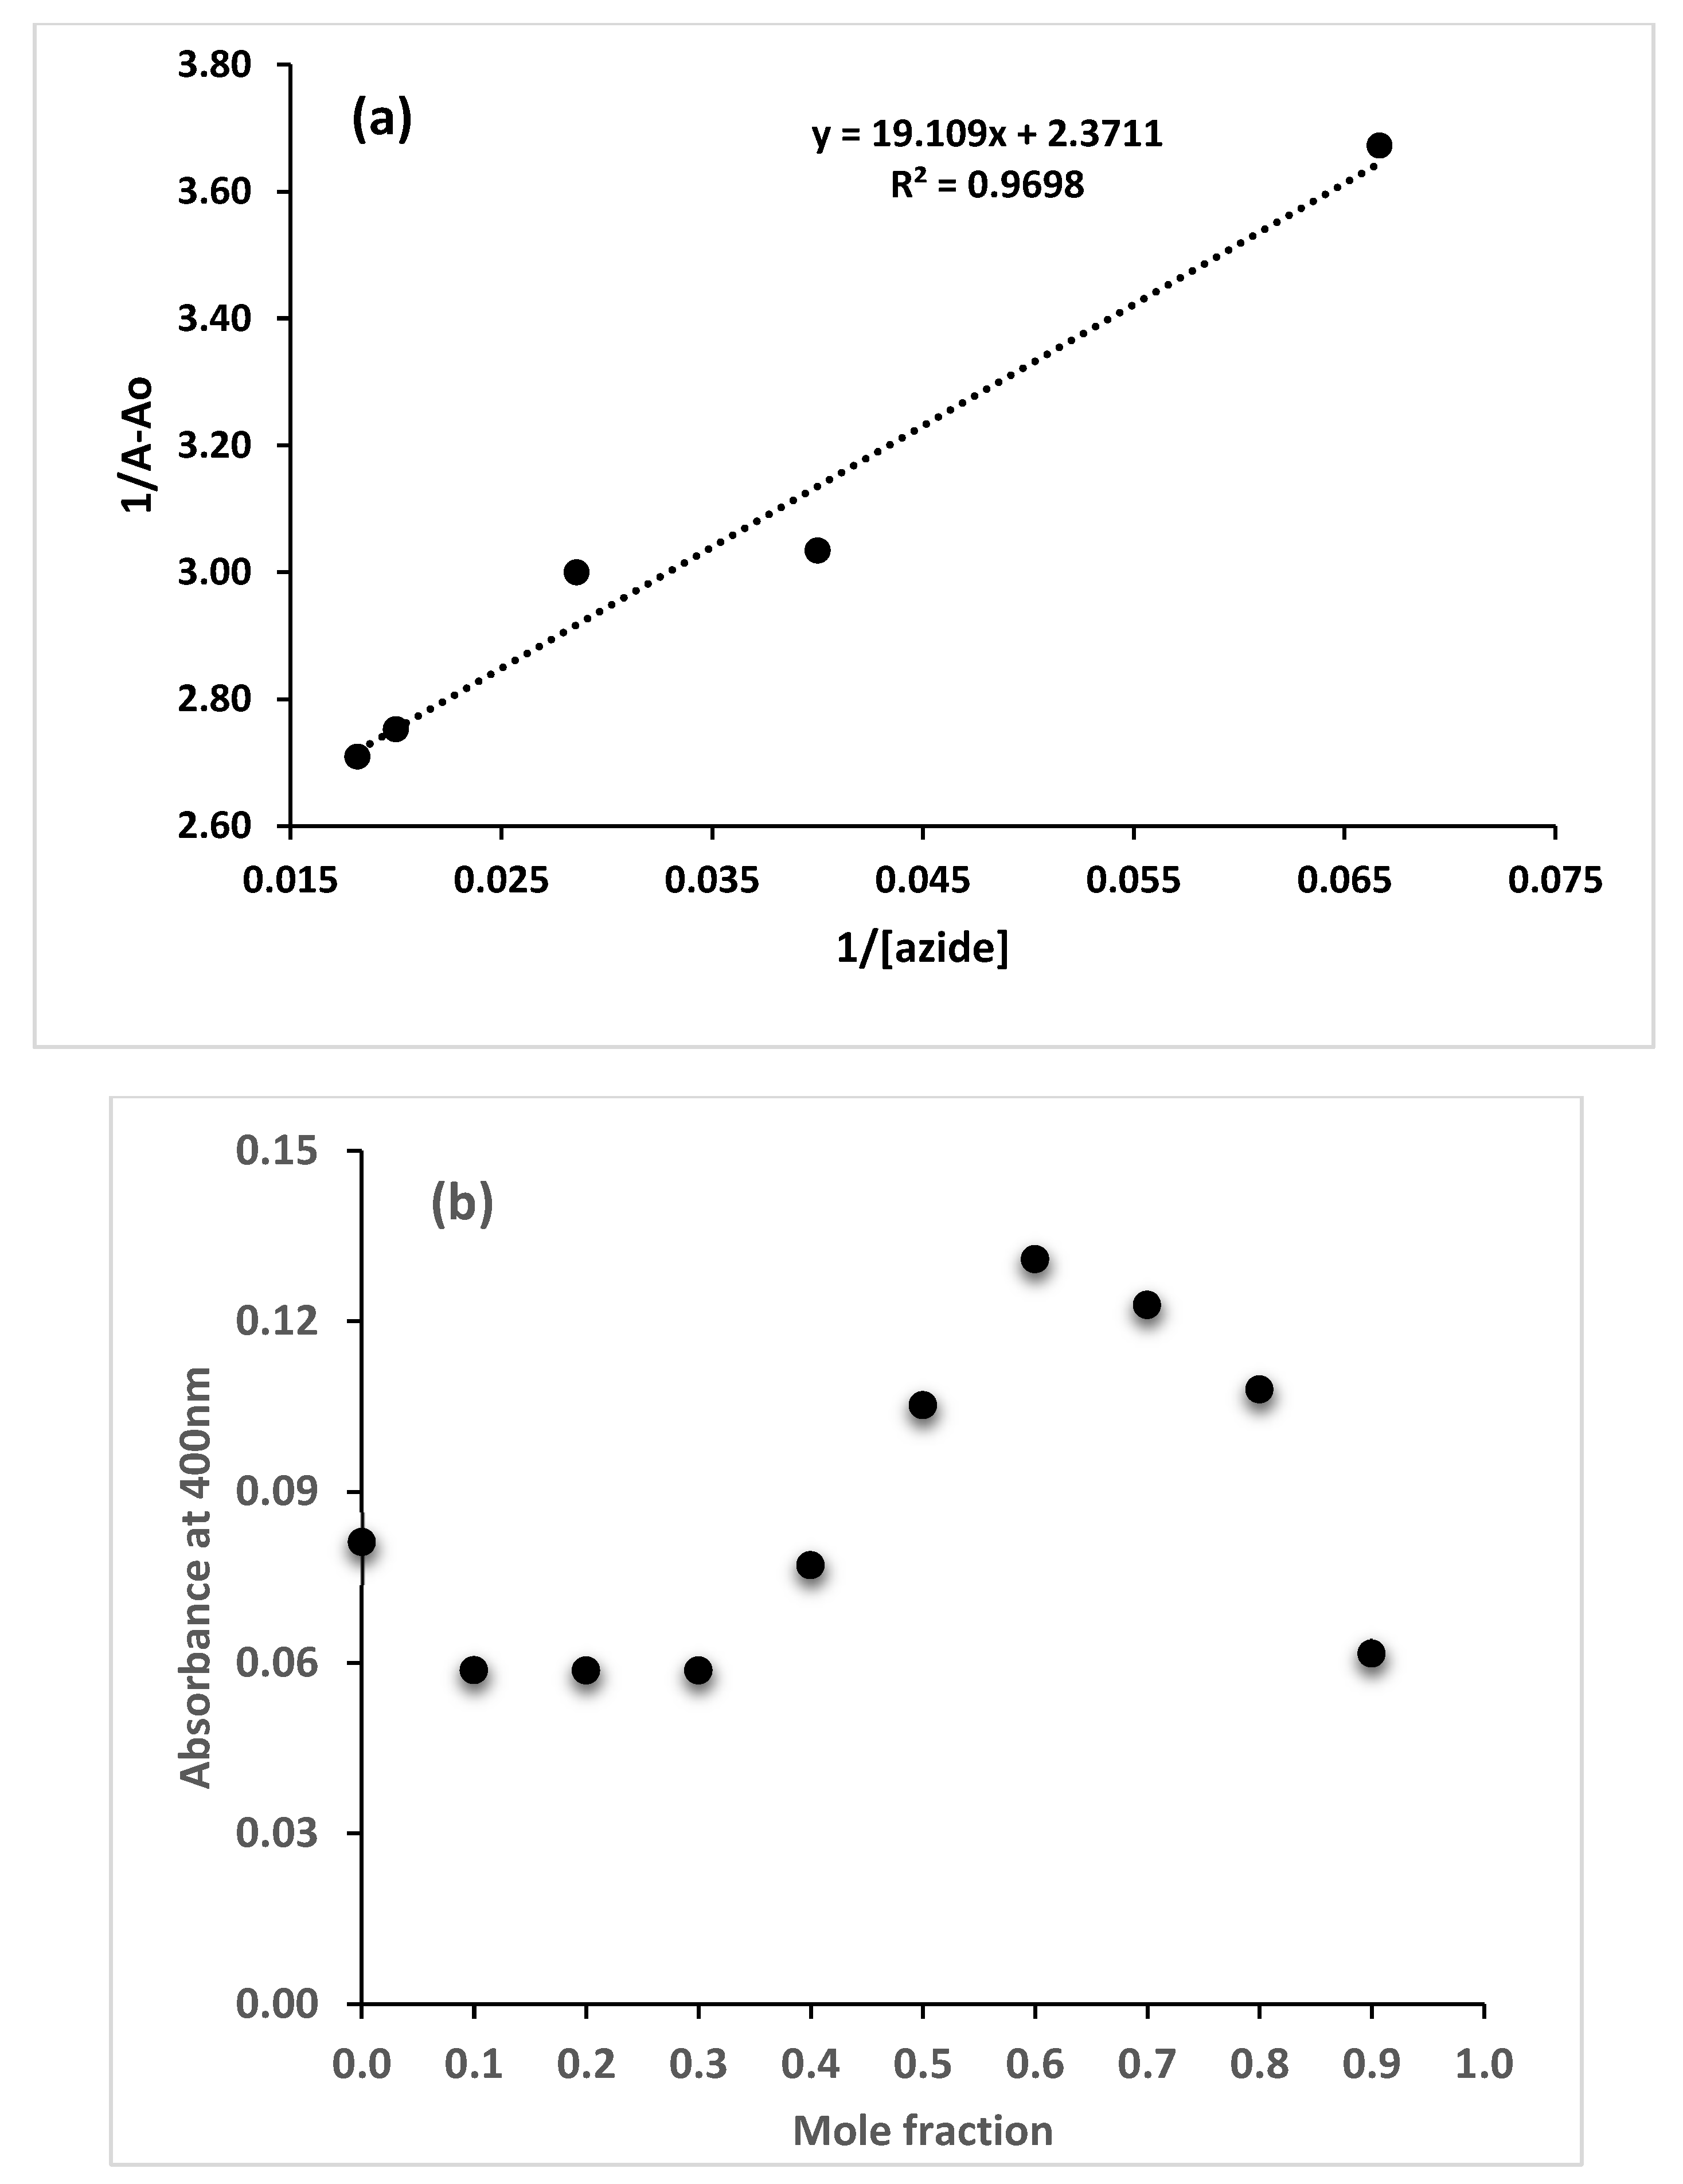
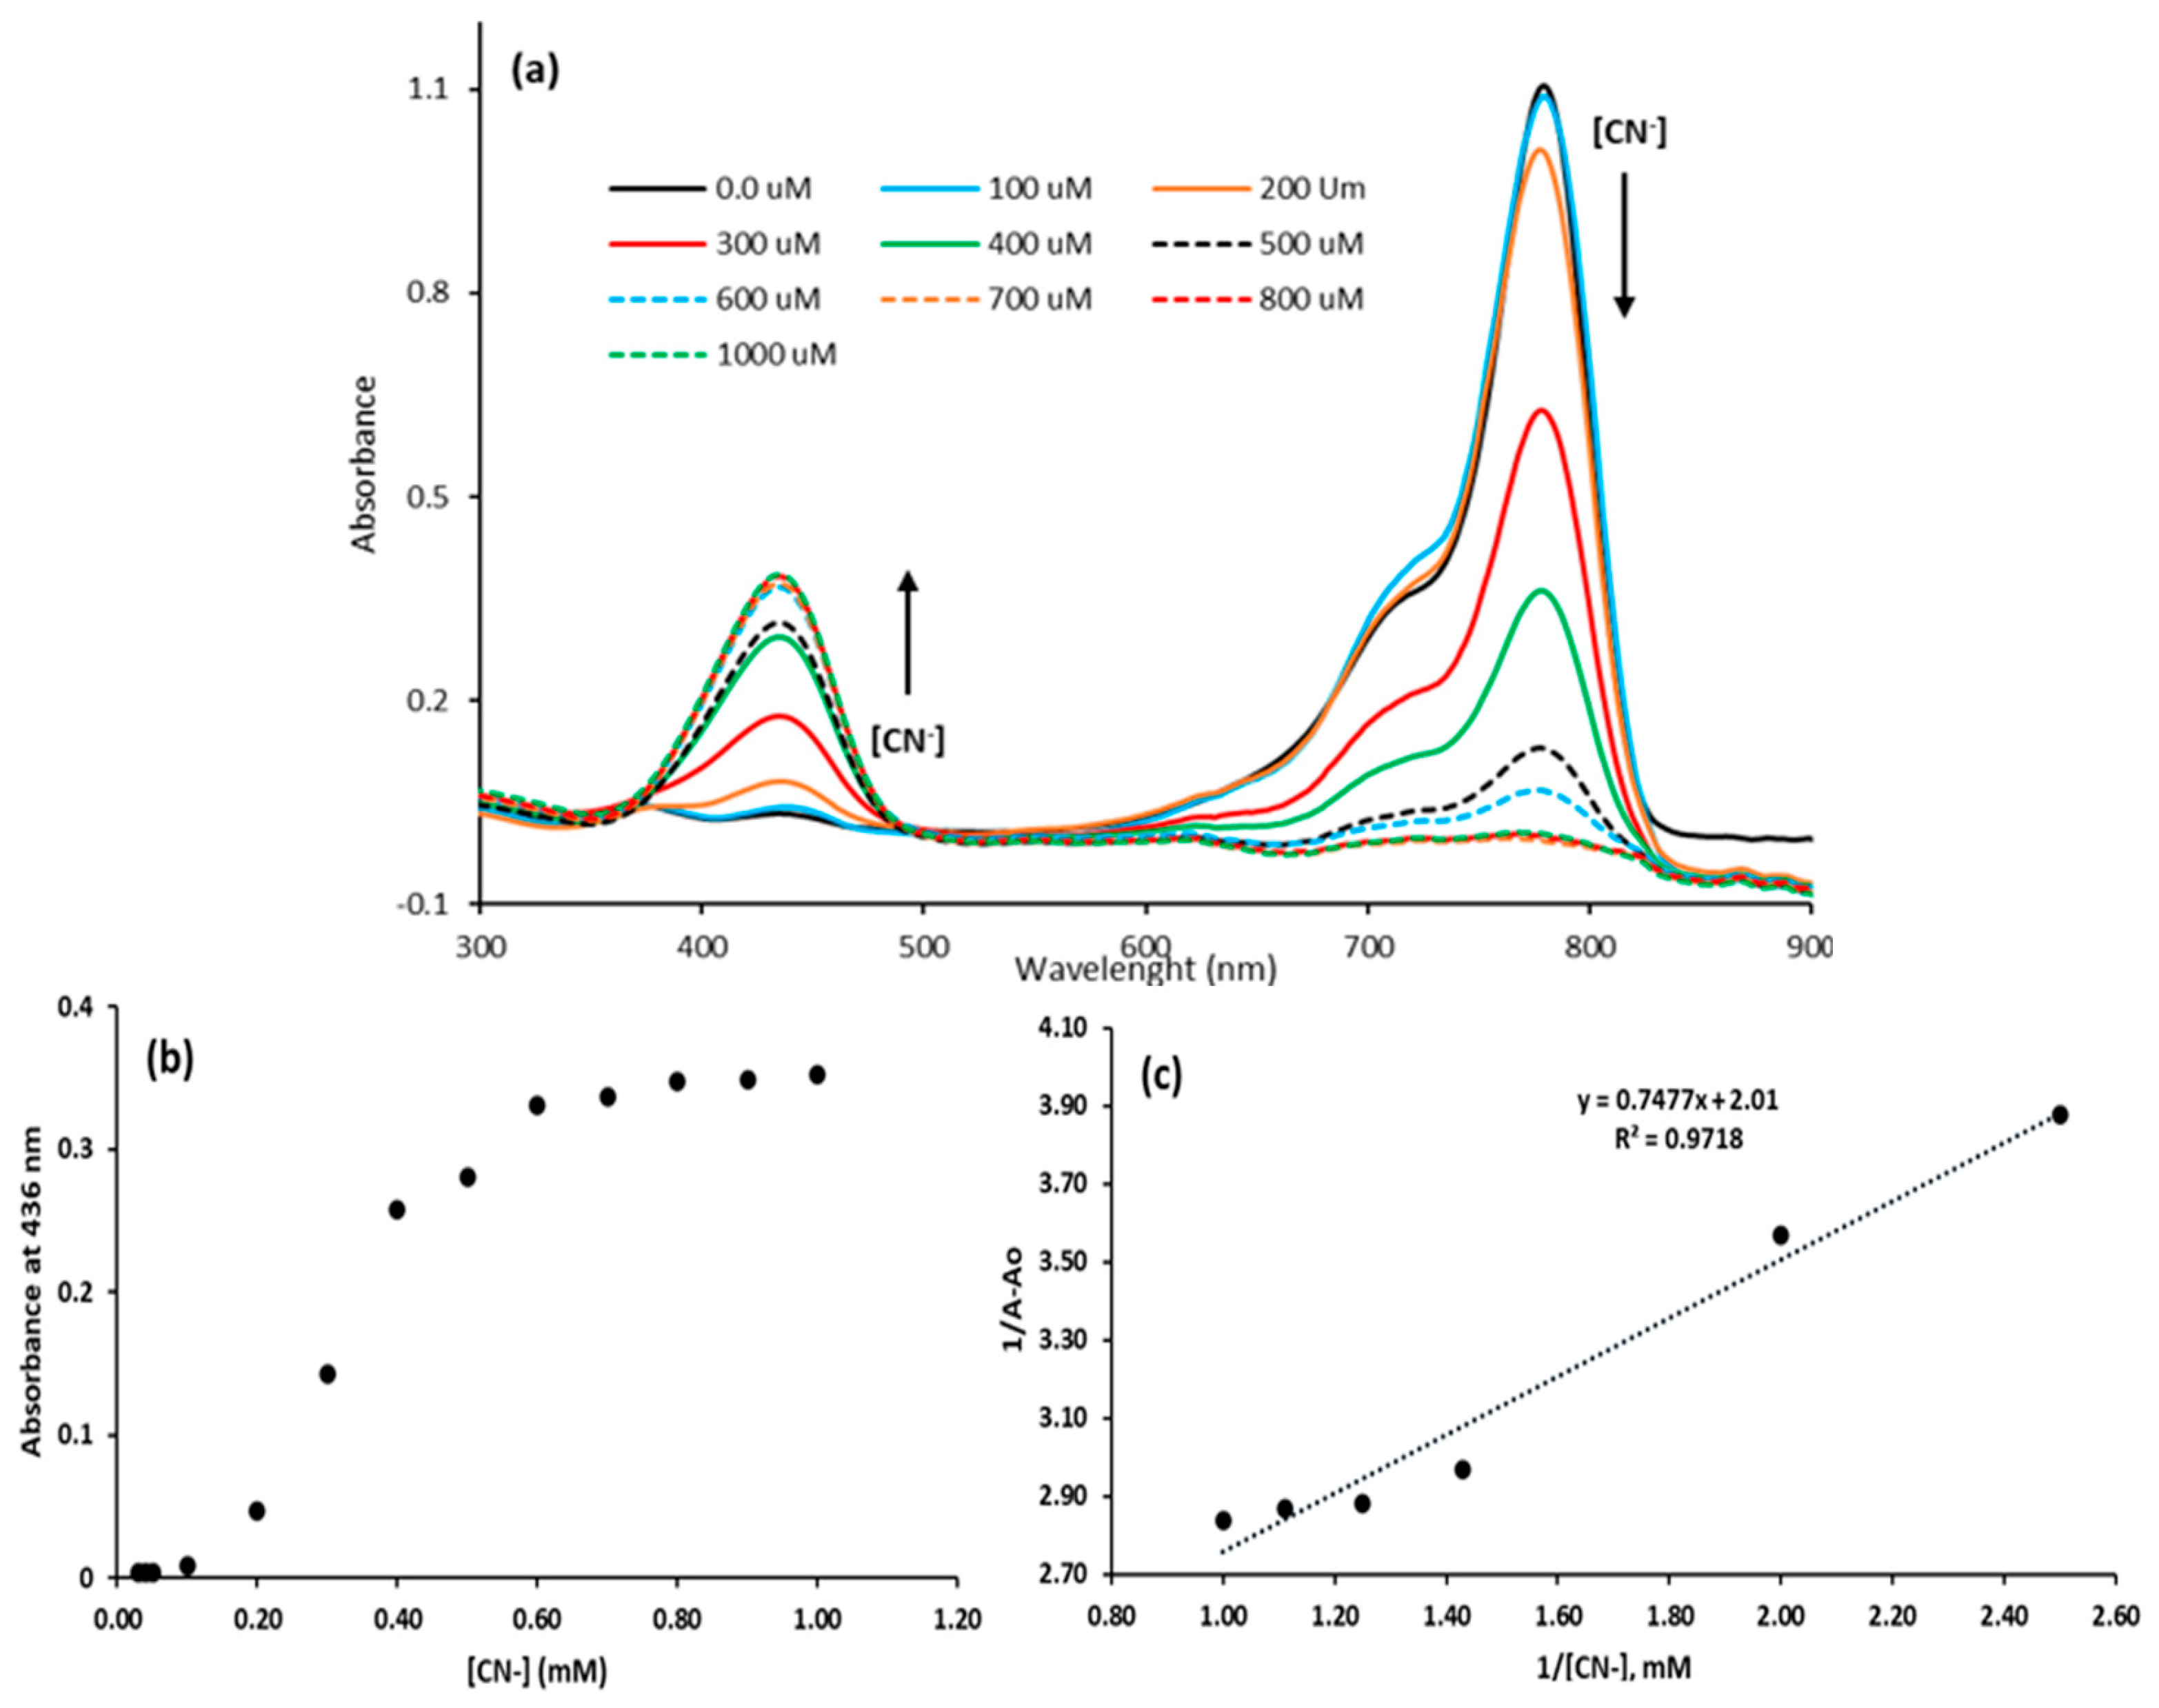
3.1.2. Stoichiometry and Binding Constants

The stoichiometric ratio of the dye–cyanide complex was determined using Job’s plot, which revealed a 1:1 stoichiometric ratio with a total concentration of 1.0 × 10⁻⁵ M (Figure 3). The UV-Vis titration of the dye with varying cyanide concentrations is plotted in Figure 4a. A plot of absorbance versus cyanide concentration, along with the Benesi–Hildebrand equation plot at 435 nm, is shown in Figure 4b and Figure 4c, respectively. The calculated binding constant was 1.35 × 10⁴ M−1 (Figure 4c). The limit of detection of cyanide (3.3σ/slope) [60,61] was found to be 0.39 μM, which is lower than the WHO guidelines for drinking water (2.6 μΜ) [62]. Figure 5a plots the UV-Vis titration of the dye with varying hydroxide concentrations, while Figure 5b shows the absorbance vs. hydroxide concentration plot. Figure 5c shows the Benesi–Hildebrand equation plot at 424 nm, which resulted in a binding constant of 3.73 × 10⁻⁴ M−1.

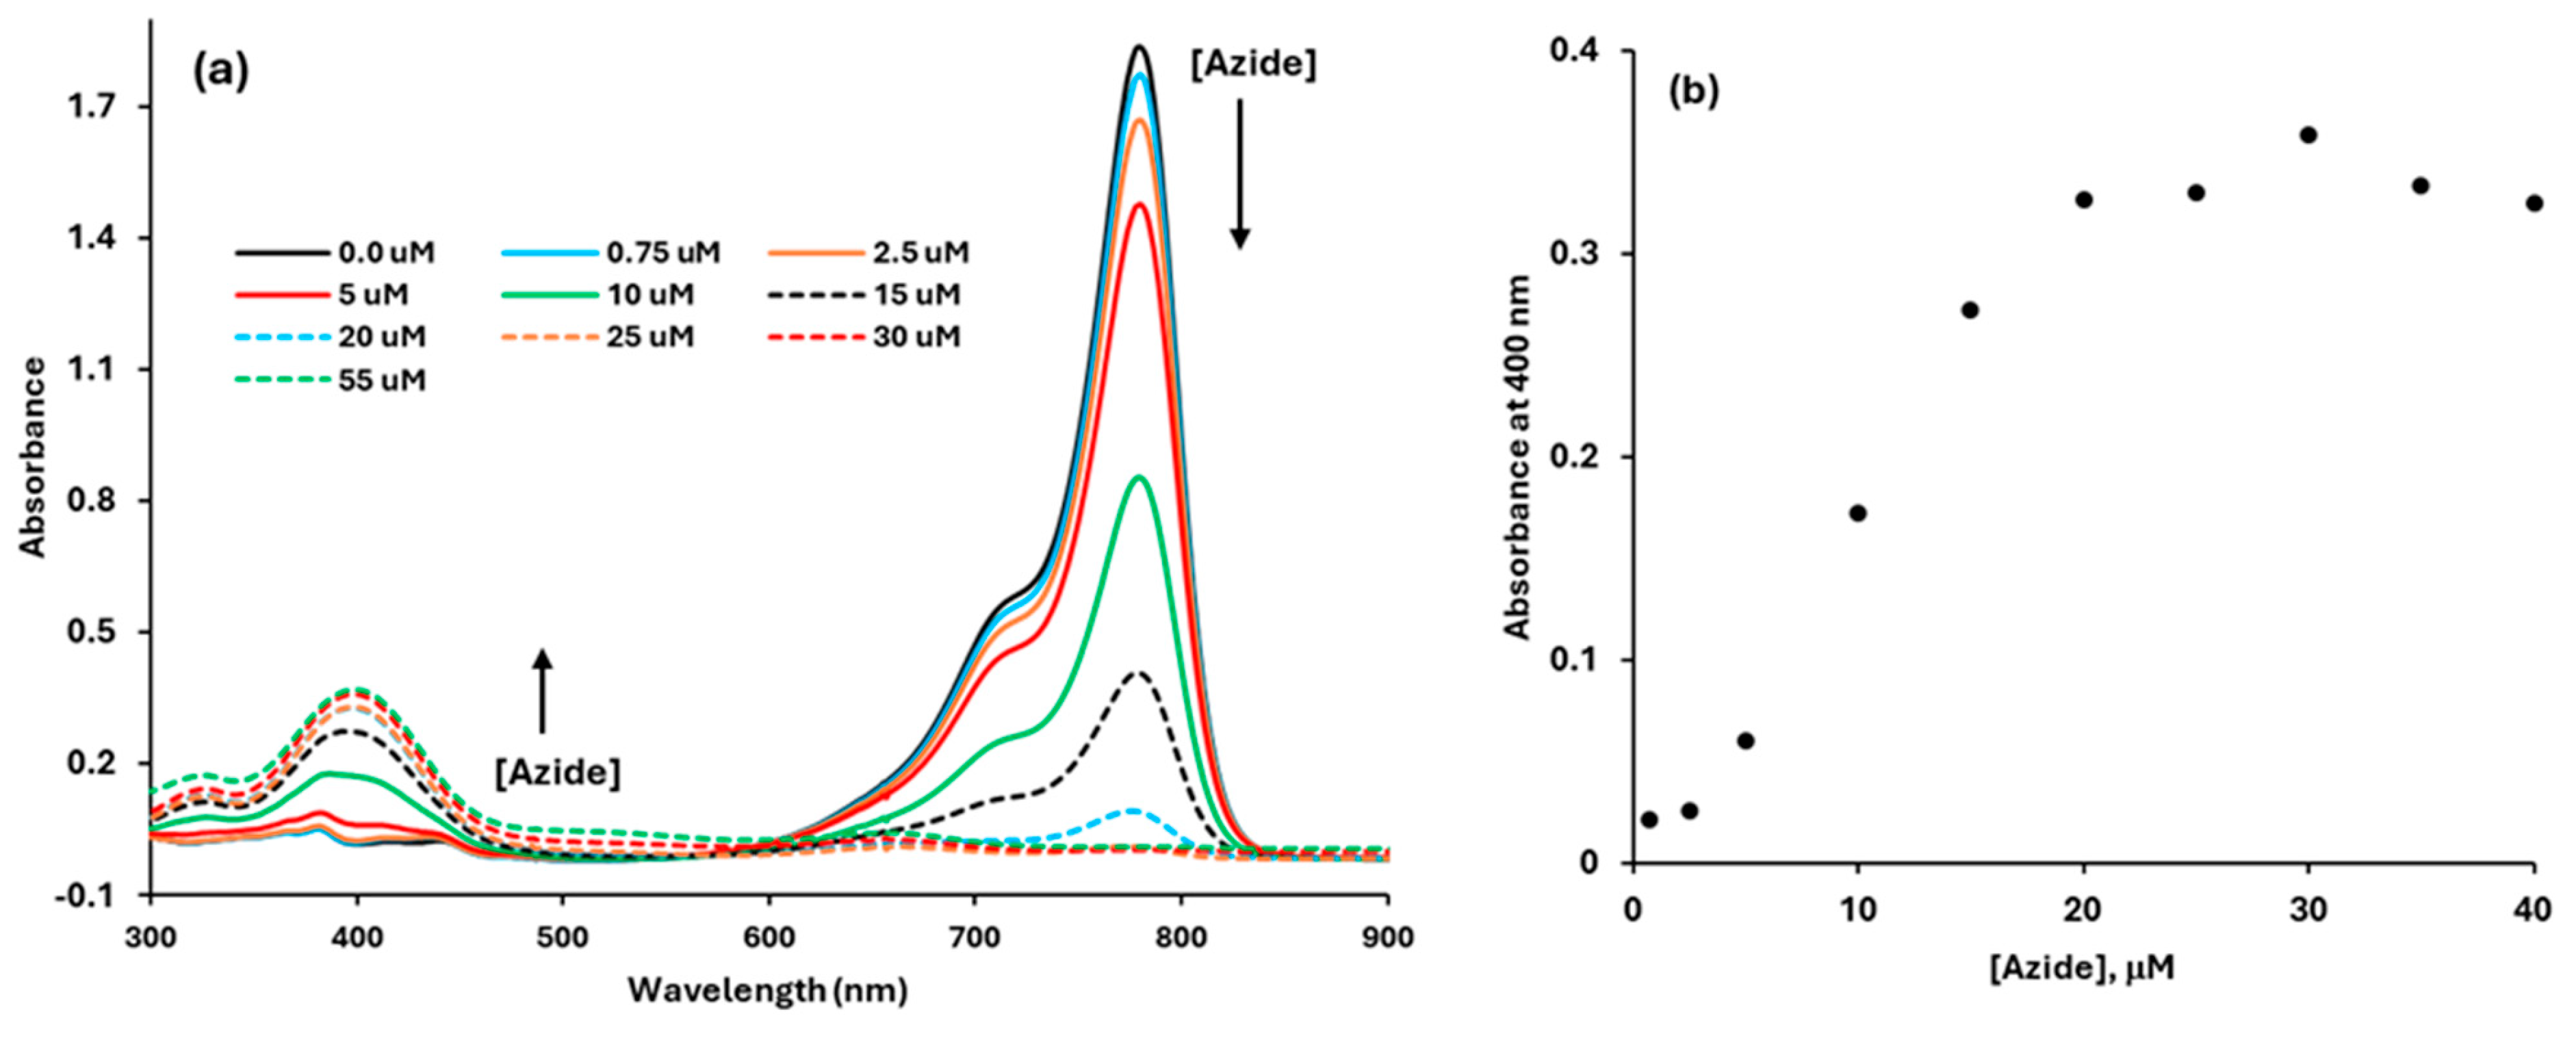
3.1.3. UV-Vis Interaction of the Dye with Azide in Acetonitrile

The dye was titrated with varying concentrations of azide in acetonitrile. The band at 400 nm increased while the band at 780 nm decreased. The absorbance was recorded after 20 min of reaction. The results are presented in Figure 6a,b. The Benesi–Hildebrand plot resulted in a binding constant of 1.14 × 10⁵ M−1 (Figure 7a). Based on Job’s plot, a stoichiometry of about 1:1 was observed, as shown in Figure 7b. However, depending on the nucleophilic substitution reaction rates, the sensor may show a 1:1 or 1:2 stoichiometry ratio between the sensor and the azide ion.

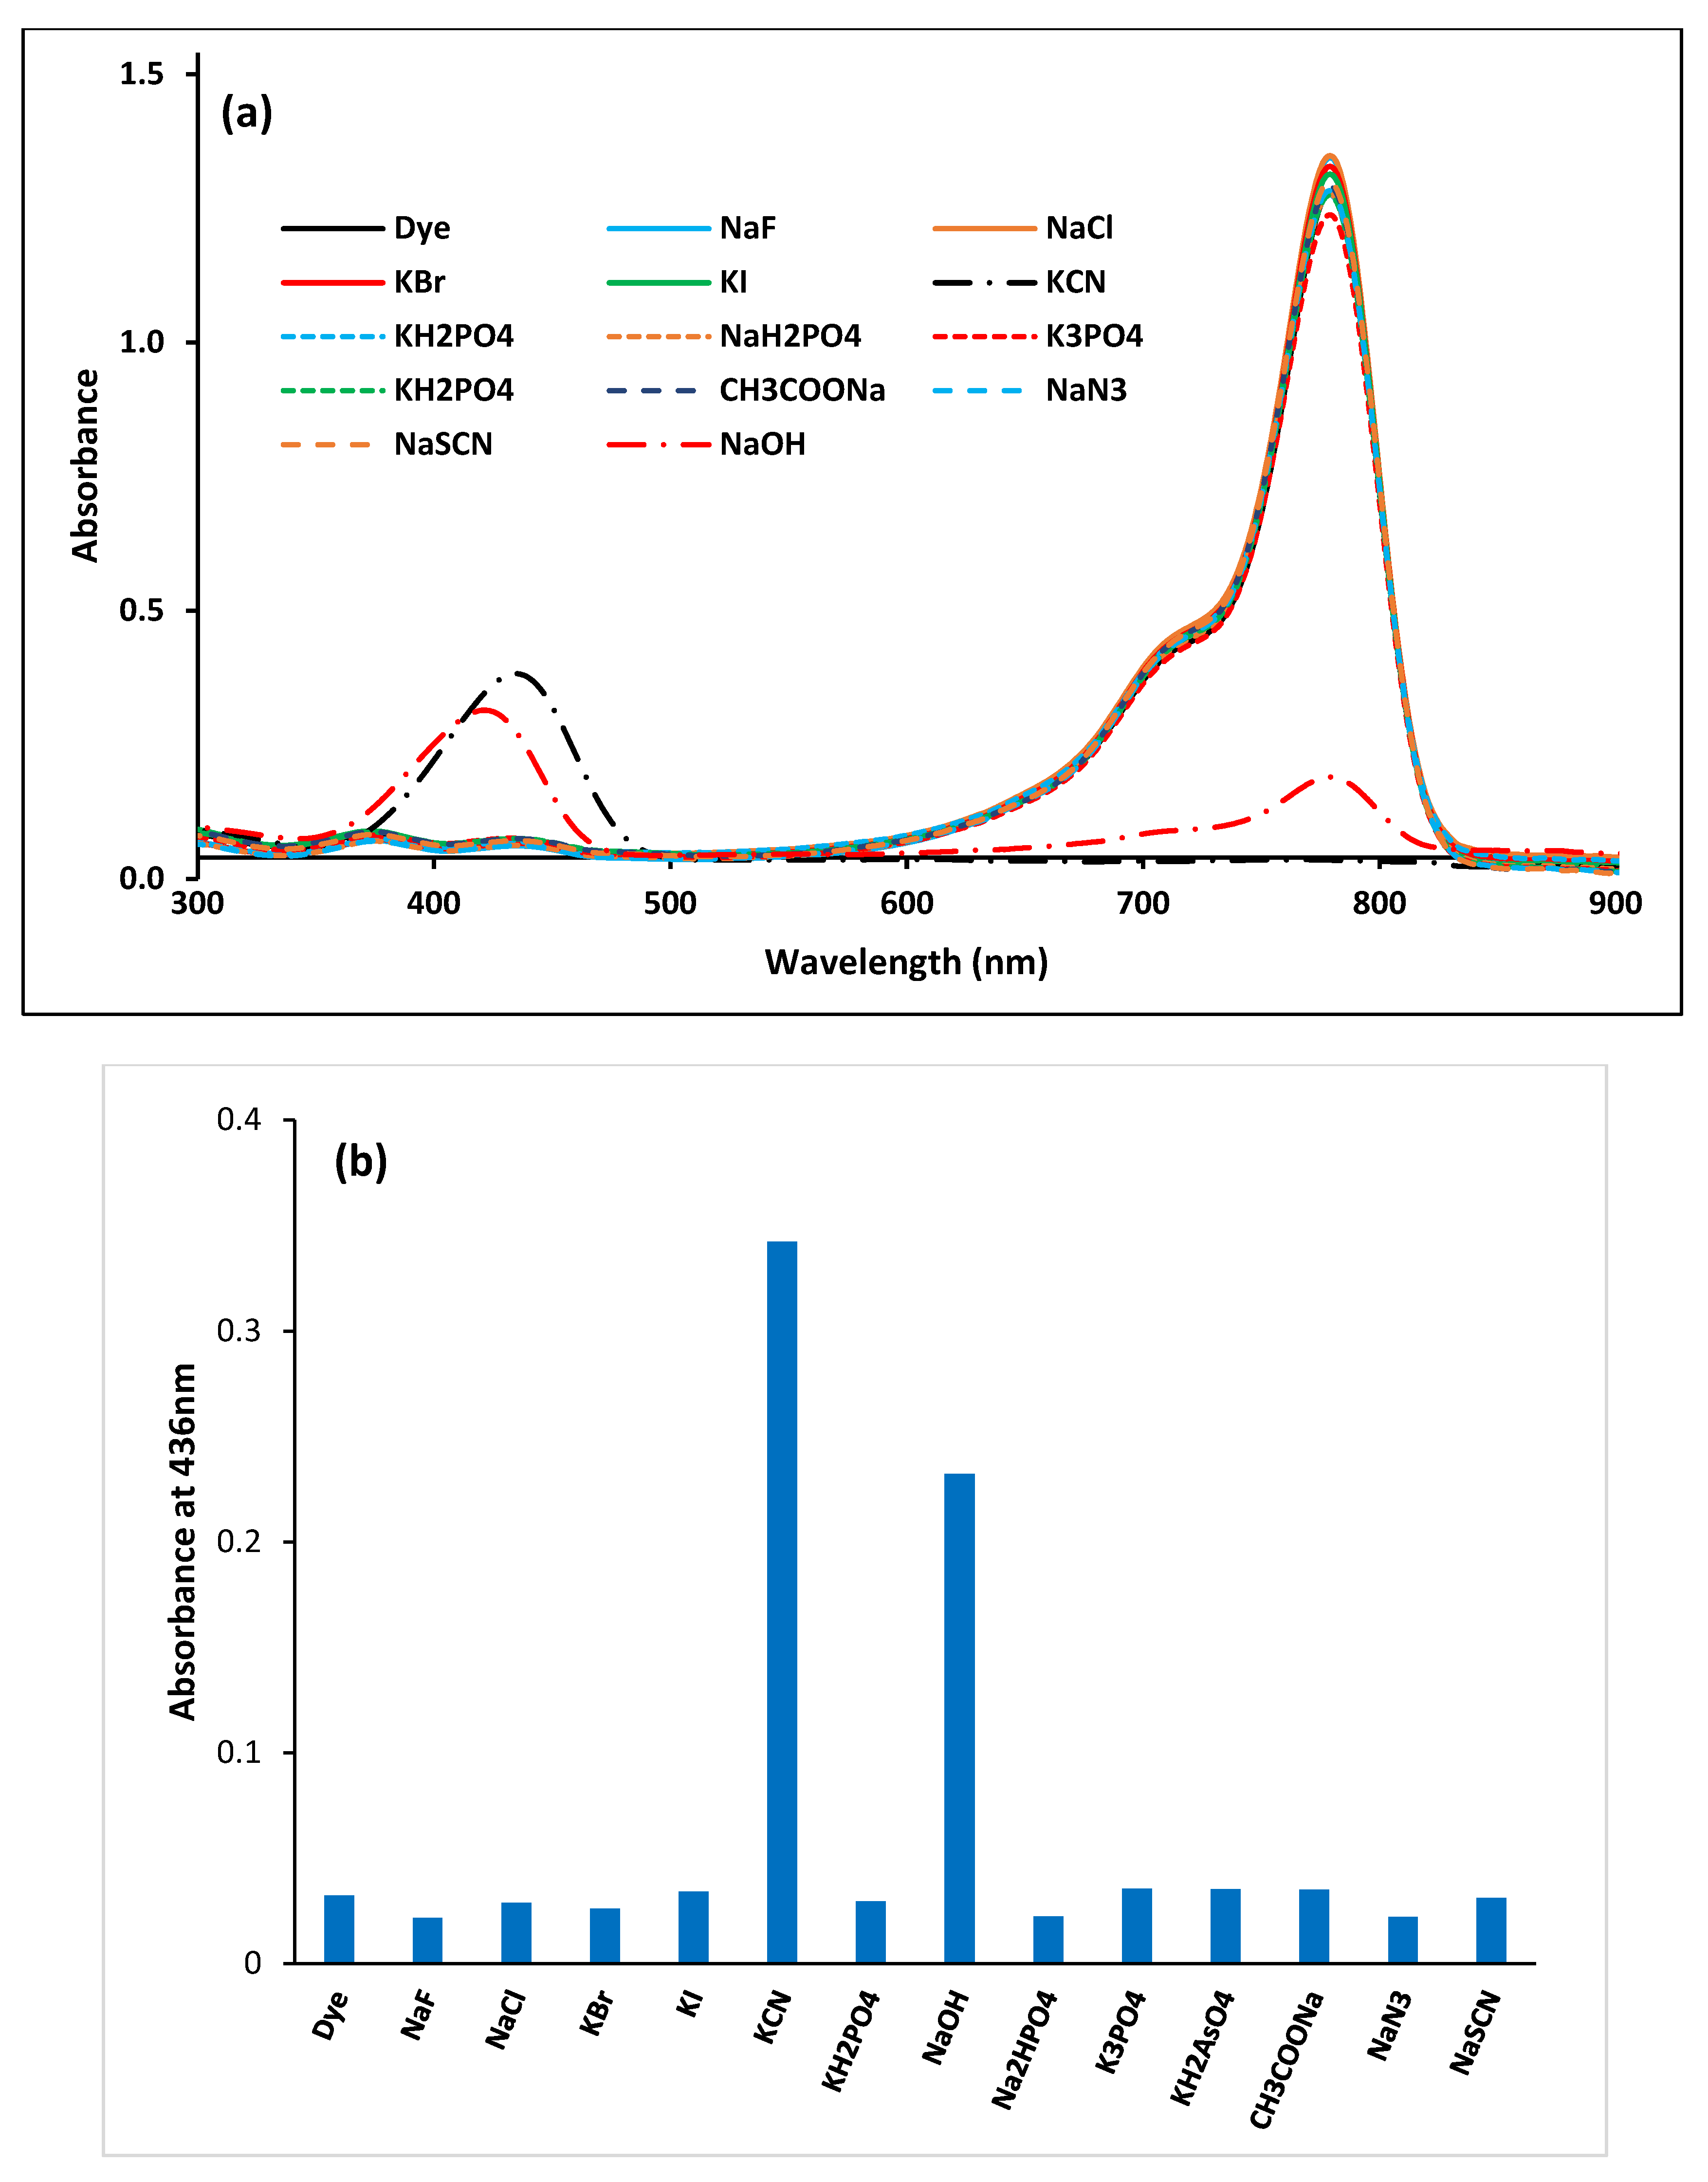
3.1.4. Interference of Common Ions with Cyanide–Dye Interaction

The anion-selective signaling behavior of the dye exhibited pronounced cyanide selectivity, characterized by a color change from green to yellow that was exclusive to cyanide, as shown in Figure 8a under normal light and Figure 8b under a UV lamp at 365 nm. The dye’s response to cyanide was not significantly affected by the presence of other commonly encountered anions, as shown in Figure 8c.

3.2. UV-Vis Selectivity and Sensitivity Studies in Acetonitrile and Water Mixture

3.2.1. Visual Tests

This study was performed in acetonitrile–water to study the effect of water on the sensitivity and selectivity of the dye for various anions (3:1, v/v). The dye concentration was maintained at 5.0 µM, and monovalent inorganic salts were dissolved in deionized water at 0.1 M for the investigation. A time lag of a few minutes was observed for the visual color change from green to yellow, specifically for cyanide and hydroxides, particularly at lower concentrations (Figure 9a). Additionally, no fluorescence was observed in the presence of water at 365 nm (Figure 9b). The selectivity for cyanide and hydroxide was enhanced, while sensitivity was reduced upon increasing the water content. It took a few minutes to achieve the intense color, indicating that the interaction was slower than that in pure acetonitrile, as shown in the UV-Vis results (Figure 10). The dye’s sensitivity to the anions diminished in the presence of water. Higher concentrations, approximately 100 times that of cyanide and approximately 700 times that of hydroxide, are needed to detect the ions compared to the concentration in 100% acetonitrile. The absorption readings were taken at 5 min.

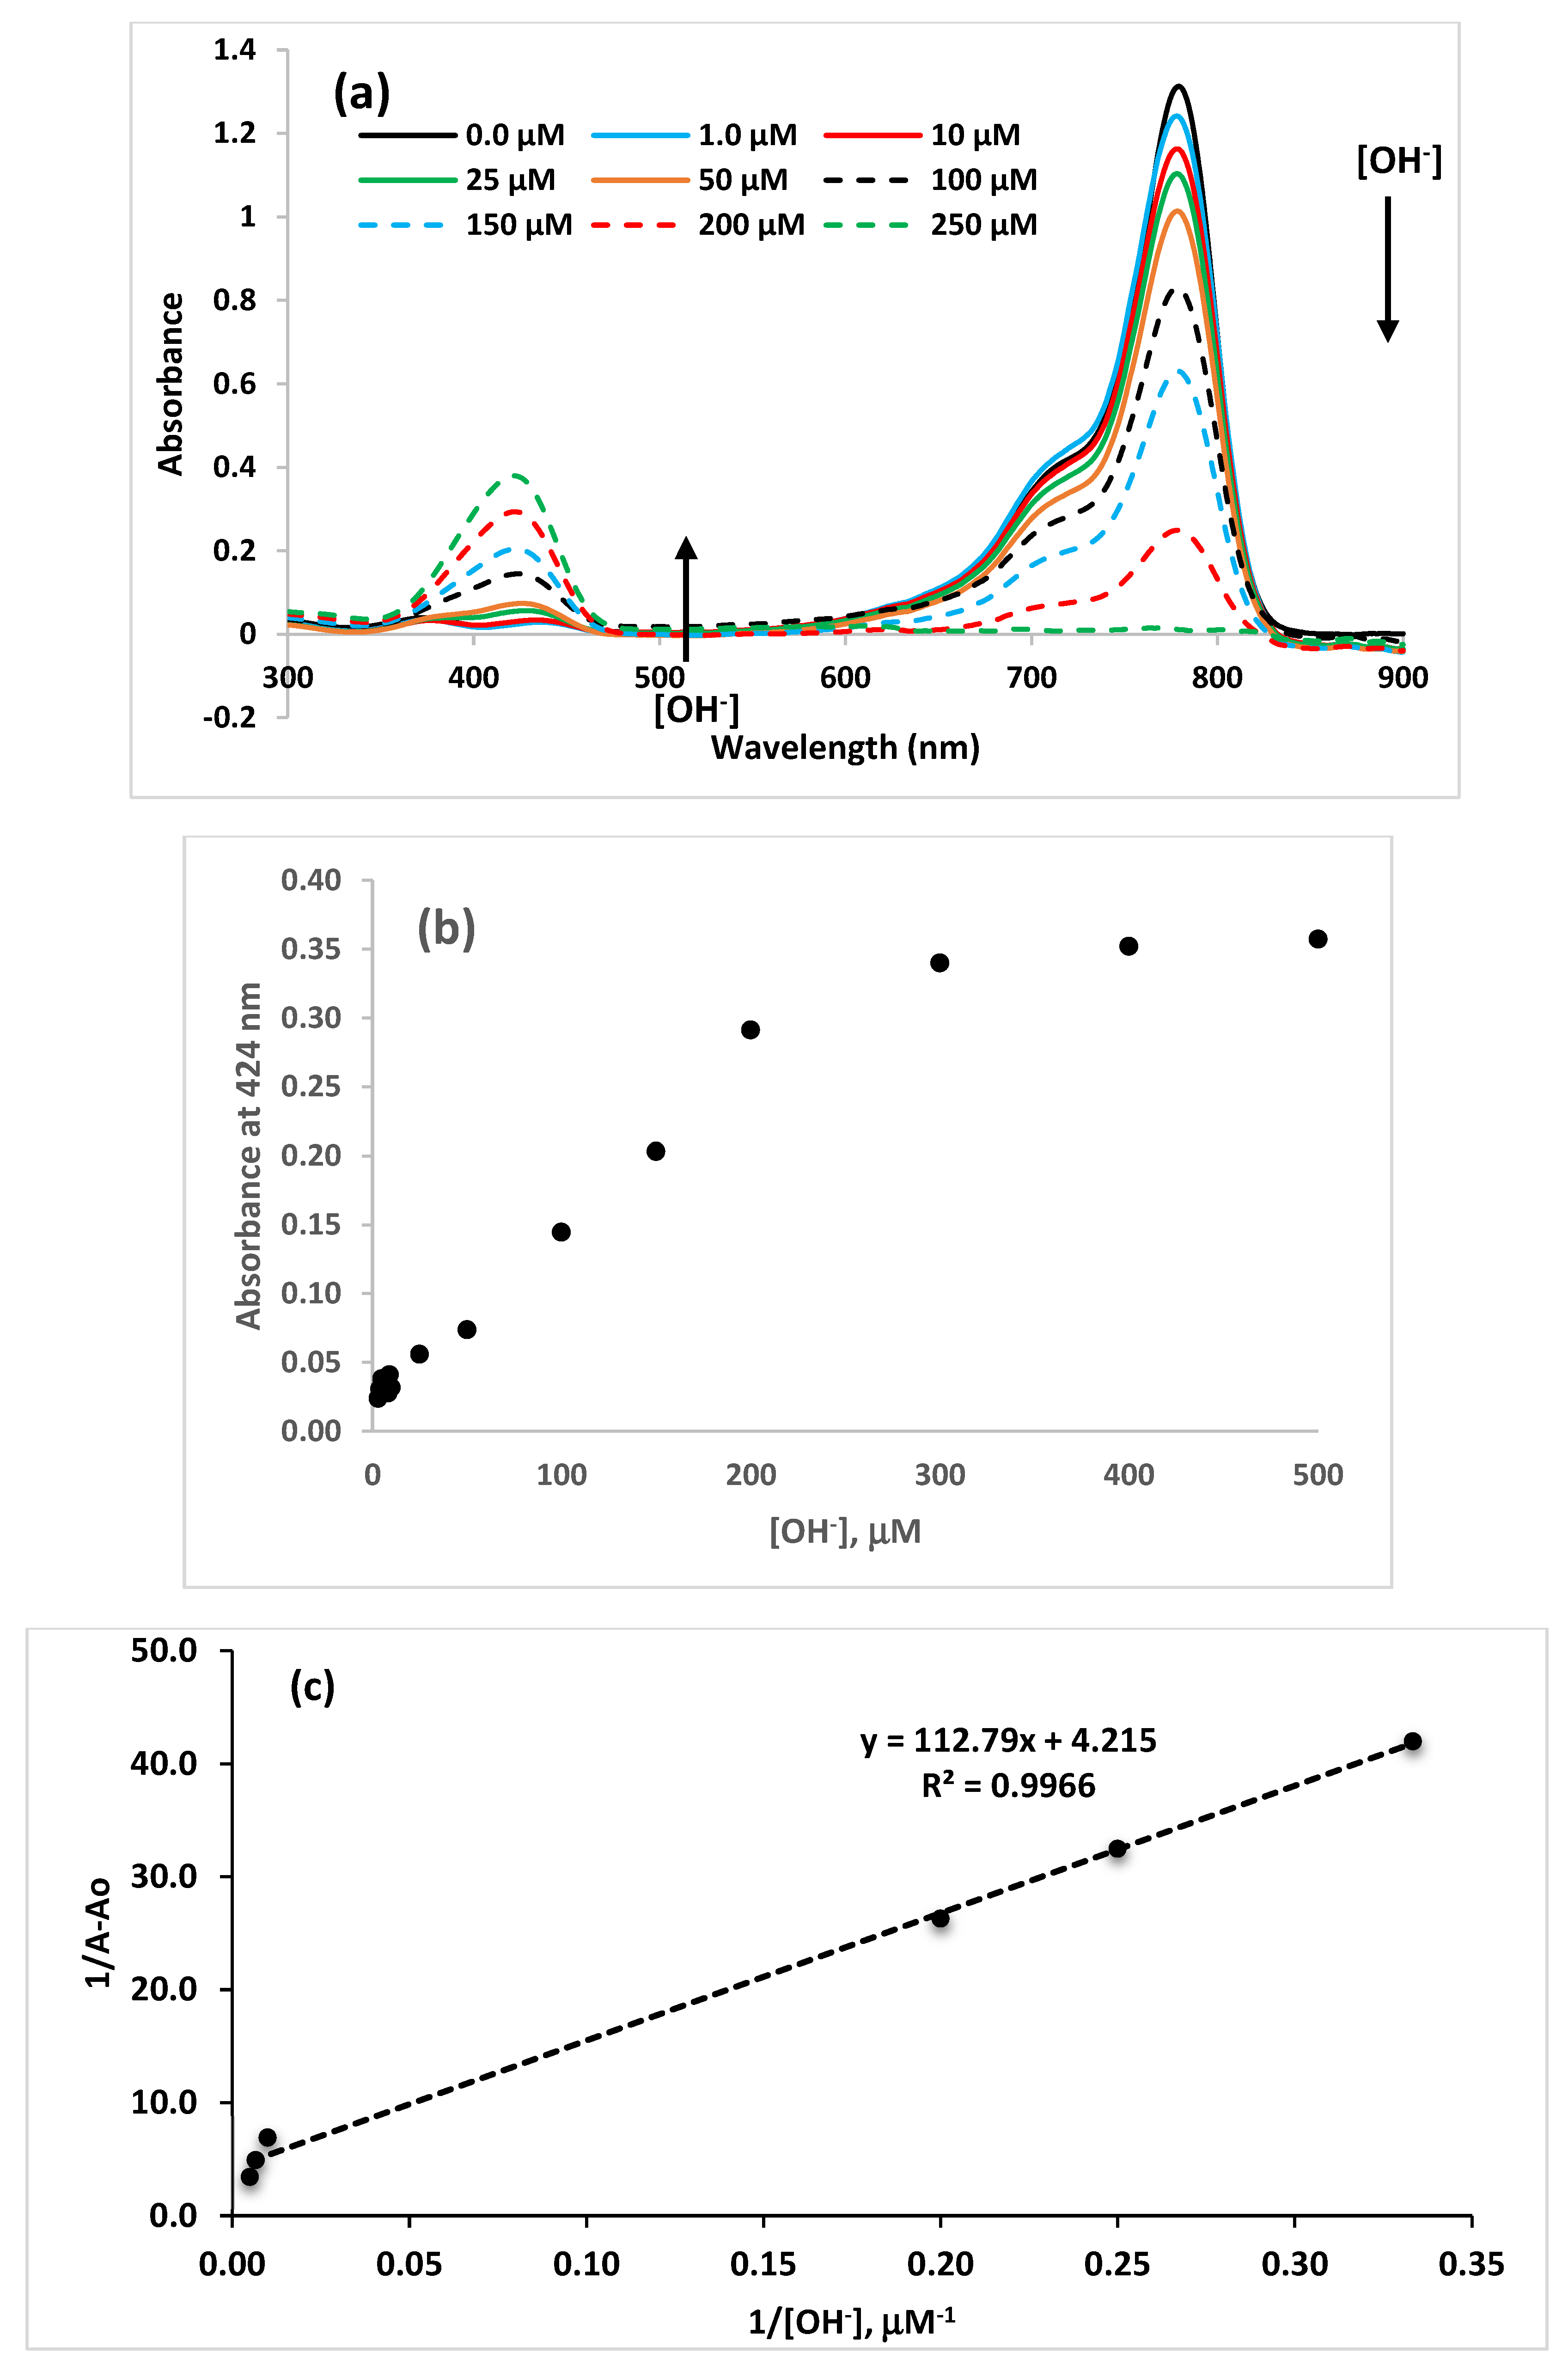
3.2.2. Binding Constants

The titration absorption spectra for the dye with cyanide and hydroxide in acetonitrile–water (75:25 v/v) are plotted in Figure 11a and Figure 12a, respectively. The λmax for the dye–CN complex is 435 nm, and for the dye–OH complex, it is 424 nm. Titration of the dye with cyanide and hydroxide in aqueous acetonitrile resulted in weak interaction, required a higher concentration to detect these anions, and did not exhibit a good linear relationship in the aqueous solvent compared to pure acetonitrile. In the aqueous system, lower binding constants were also obtained from the Benesi–Hildebrand equation plot for the dye–CN complex at 435 nm (2700 M−1, Figure 11b) and the dye–OH complex (1309 M−1, Figure 12c). Azide did not cause any change within 5 min in the aqueous solvent system.
Based on the titration results, the dye’s reactivity with cyanide and hydroxide was rapid, as they are good nucleophiles, while azide showed slower reactions due to its low nucleophilicity. The nucleophilic attack on the iminium ion carbon of the dye resulted in the disruption of the chromophore and the loss of conjugation between the two nitrogen atoms in the system. This resulted in a hypsochromic shift in the absorption band from 780 nm to 435 nm, 424 nm, and 400 nm for cyanide, hydroxide, and azide, respectively. The cyanide ion can be separated from the hydroxide ion by adjusting the PH to a neutral pH. The proposed reaction is presented in Scheme 1. The structure of the complex was confirmed using 1H and 13C NMR studies, as discussed in Section 3.4.1 and Section 3.4.2.

3.3. The Fluorescence Sensing Property of the Dye

The fluorescence selectivity of the dye (5.0 Μm) was tested against different TBA salts (1.0 × 10⁻⁴ M) in 100% acetonitrile and for inorganic salts in 1% aqueous acetonitrile at an excitation wavelength of 430 nm. The dye exhibited strong emission at 535 nm upon excitation at 430 nm in the presence of 100 equivalents of TBA–azide. Weak emission spectra were observed at 521 nm and 523 nm for TBA-OH and TB-acetonitrile, respectively, in 100% acetonitrile, as shown in Figure 13a. The fluorescence was quenched with time for cyanide and hydroxide and enhanced in the case of azide. It is noteworthy that fluorescence quenches in 1% aqueous acetonitrile. The fluorescence intensity of the dye with different anions at 535 nm is presented in Figure 13b. These results strongly indicate that the dye is an excellent, sensitive, and selective sensor for azide. First, azide can be distinguished from cyanide and other ions using UV-Vis spectroscopy based on reaction time, as the color changes over time, due to its slower spectral response and color changes. Additionally, it is the only anion that exhibits strong fluorescence in anhydrous acetonitrile, whereas other ions show no significant fluorescence. The nucleophilic binding of the azide ion to the iminium group and the chlorine substitution on the dye may result in a fluorescence change. Also, the unique structure of azide and the presence of charge may contribute to structural change in the IR 780 dye molecule.

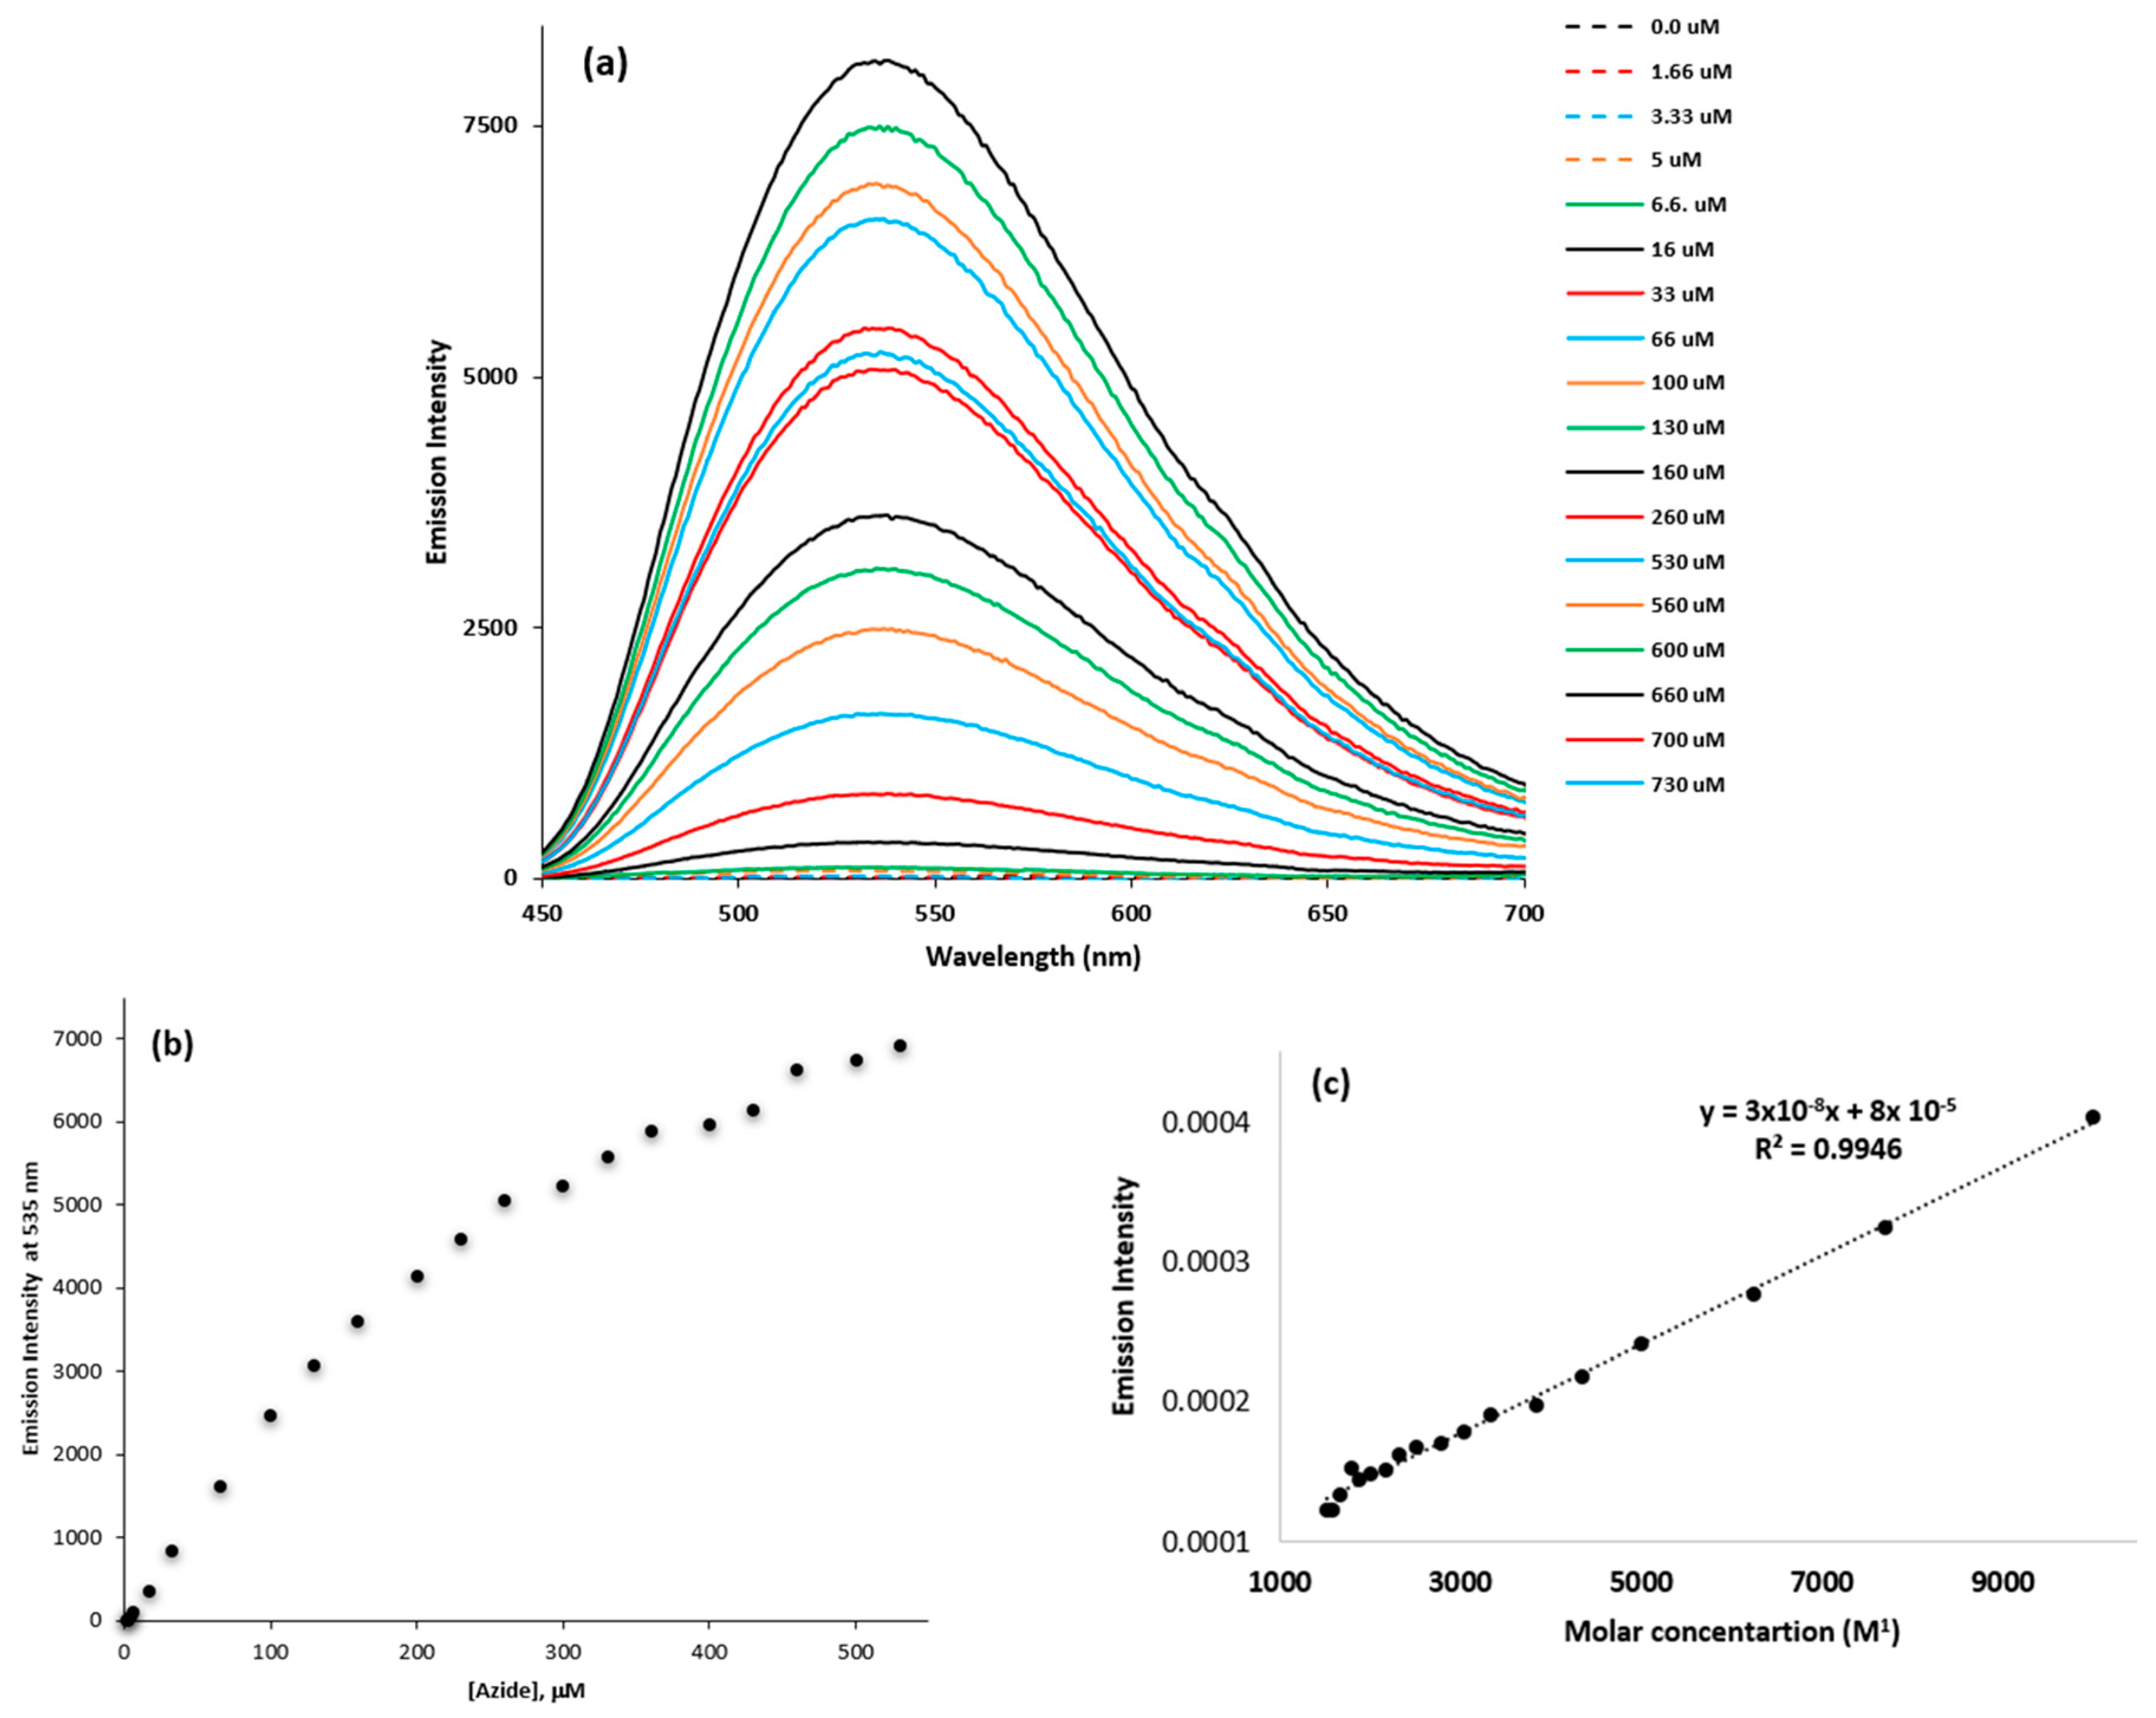
3.3.1. Fluorescence Titration of the Dye with Azide

The dye (5.0 µM) was fluorescence-titrated with TBA–azide in acetonitrile at 535 nm (Figure 14a). As shown in Figure 14b, emission increases linearly with azide concentration. The binding constant, calculated according to the Benesi–Hildebrand equation, is 2700 M−1, as shown in Figure 14c.

3.3.2. The Competitive Signaling of Azide with the Dye in the Presence of Possibly Interfering Ions

The dye exhibited pronounced azide selectivity, with strong fluorescence at 535 nm. There was no interference from other anions, even when the dye was mixed with 20 equivalents of azide and then added with 100 equivalents of interfering anions. Figure 15a,b show the visual appearance under normal light and a UV lamp at 365 nm. The response of the dye for azide was not significantly affected by the presence of other commonly encountered anions, as demonstrated in Figure 15c.

3.4. Binding Mechanism

A detailed nuclear magnetic resonance (NMR) study was performed to study the mechanism of cyanide’s interaction with the dye. Titrating a known amount of the dye with a KCN solution showed that the cyanide ion was added to the iminium carbon in a 1:1 ratio, as indicated by Job’s plot. The mechanism of the anions’ interaction with the dye is proposed to be a nucleophilic addition to the iminium ion, as shown in Scheme 1.

3.4.1. 1H NMR Analysis

Confirmation of the proposed mechanism for the nucleophilic addition of anions to the iminium ion is supported by 1H and 13C NMR data. Due to the symmetry of the structures, the 1H NMR spectrum of the dye (Figure 16a) displays 11 peaks corresponding to 44 protons. After adding anions such as cyanide, azide, or hydroxide, dramatic changes in chemical shifts and splitting occur due to the loss of symmetry and the generation of a chiral center. This supports the proposed addition of the iminium ion carbon, as indicated in Scheme 1. The 1H NMR spectra for azide and hydroxide can be explained using the cyanide case as the reference. Table 1 summarizes all the obvious changes observed in the chemical shifts. However, the spectra appeared more complicated for these anions, involving more than one product or intermediate.
The addition of cyanide caused significant changes in the 1H NMR spectrum of dye (Table 1). The four geminal methyl groups at 1.68 ppm split into three singlets, 1.56 ppm (6H), 1.20 ppm (3H), and 1.03 ppm (3H), due to anisotropy and proximity to the chiral center. The four methylene protons next to the nitrogen of the indole ring at 4.21 ppm split into three signals: 3.63 ppm (2H triplet) for the methylene hydrogen next to the nitrogen away from the chiral center, and 3.02 ppm (dt, 1H; 2.86 dt) for the two enantiotropic hydrogens close to the chiral center. The vinylic signals at 8.27 and 6.35 ppm split into signals at 7.36 (d, J = 15.84 Hz, 1H), 7.31 (d, J = 12.41 Hz, 1H), 5.77 (d, J = 15.84, 1H), and 5.47 (d, 12.41 Hz, 1H).
Analogous changes were observed for hydroxide and azide, as listed in Table 1. The spectra for the dye before and after the addition of the anions are shown in Figure 16a–d for the dye and the dye upon the addition of cyanide, hydroxide, and azide, respectively. This shows that the mechanism is similar for the three anions; hydroxide appears to yield more products, while the azide reaction is slow, resulting in complex spectra that indicate additional reaction pathways or mixing with the starting material. However, significant changes can be interpreted and compared to the cyanide results.

3.4.2. 13C-NMR Analysis

The mechanism of adding anions to the iminium carbon is also supported by 13C NMR (Figure 17). The dye showed 18 carbon signals due to symmetry. The symmetry is lost after the addition of cyanide, and 37 signals appear, with an increase of one carbon due to the presence of carbon cyanide. There were dramatic changes in the chemical shifts in the carbon signals. The signal at 172.92 disappeared, accompanied by the appearance of a peak at 80.76 ppm. A new peak appeared at 92.96 ppm, which is suggested to be the vinylic carbon next to the indole ring away from the addition center. An analogous effect was observed for other anions, such as hydroxide and azide. All other changes due to loss of symmetry resulted in a doubling of the number of signals for the aliphatic carbons. The significant changes observed in the addition of cyanide, hydroxide, and azide are given in Table 2.
Upon the addition of hydroxide, changes similar to those caused by cyanide were observed. The peak at 172 ppm gradually disappeared, forming two new peaks at 92.46 ppm and 99.18 ppm. The iminium carbon shifted to 99.18 ppm. The downfield shift relative to that of cyanide addition could be due to the electronegativity of the hydroxyl group. Upon adding azide, the dye exhibited complex 1H and 13C NMR spectra. The reaction was slow; therefore, a mixture of the starting material and the products or complex existed. Analogous peaks were observed due to the interaction of cyanide and hydroxide at 94.84 ppm, 92.95 ppm, and 89.71 ppm. The difference may be attributed to the electronegativity of the azide.

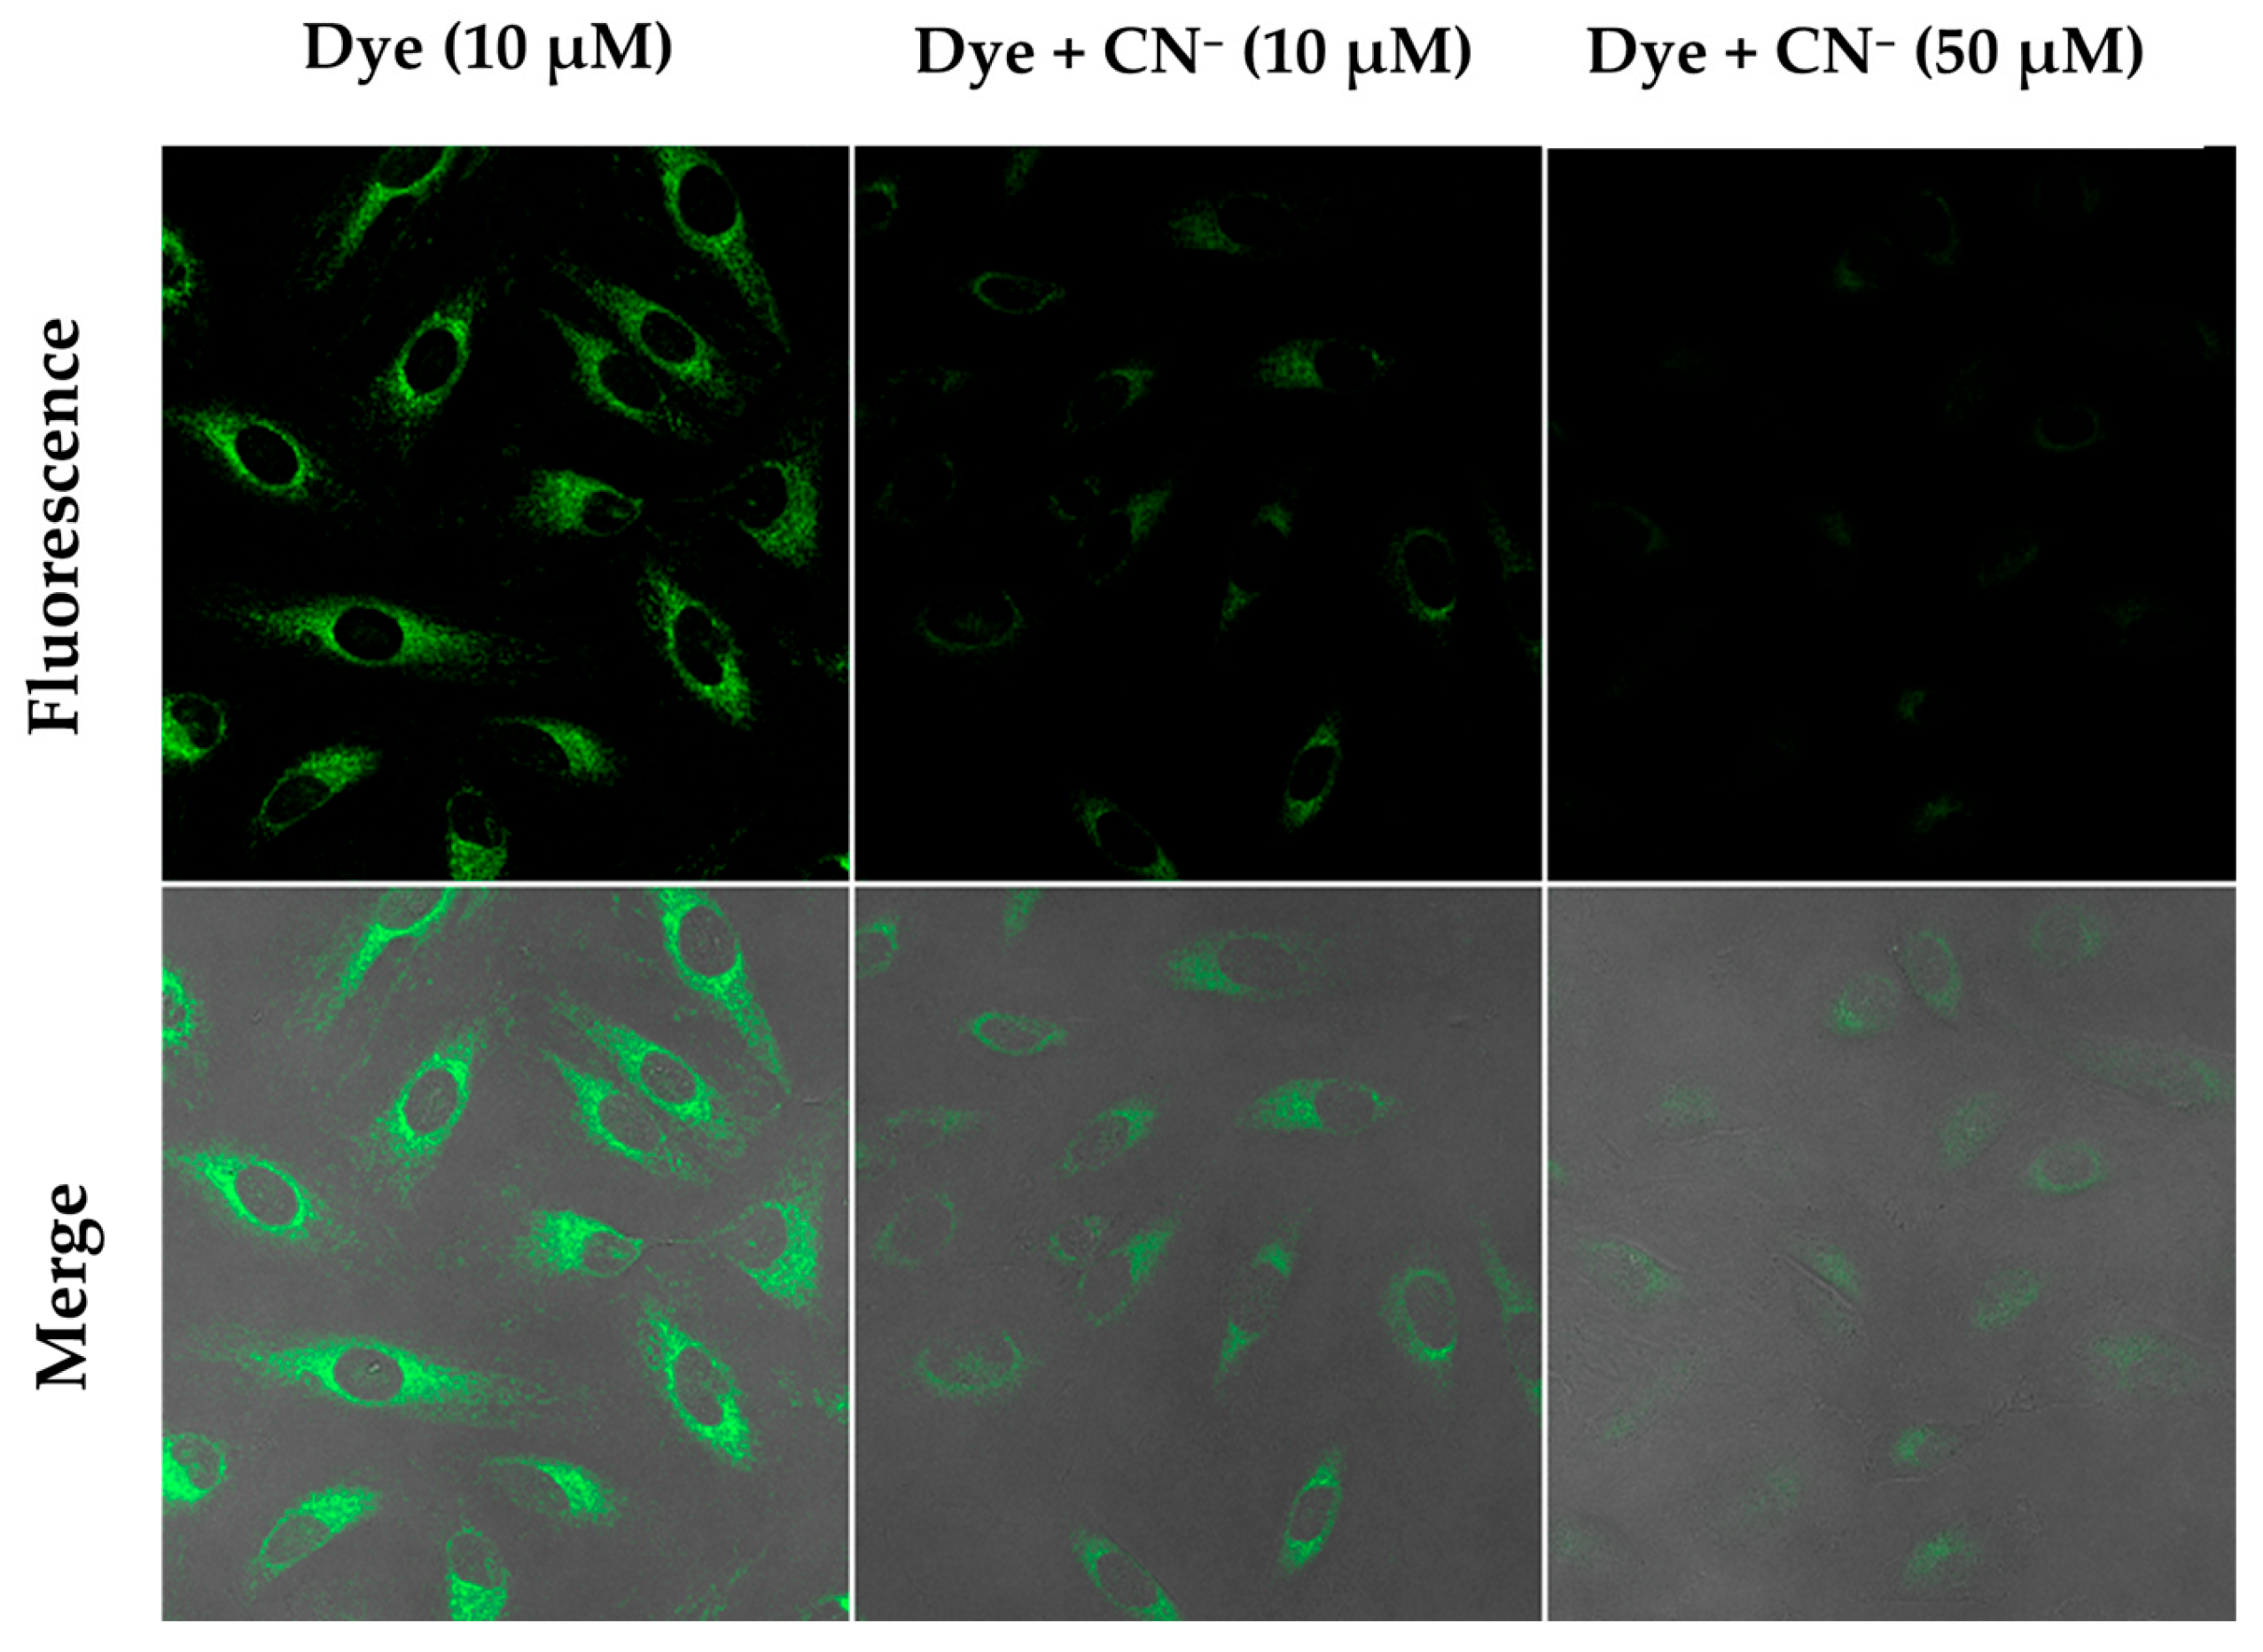
3.4.3. Fluorescence Detection of CN⁻ in HeLa Cell Lines

The IR-780 dye, at a concentration of 10 µM, was readily internalized by HeLa cells without affecting cell viability. Cells were seeded at a density of 2 × 10⁴ cells per well in the #1.5 polymer coverslip µ-Slide 4 well chamber slides (Ibidi) and allowed to adhere overnight. The following day, the cells were incubated with 500 µL of 10 µM IR-780 dye for 30 min at 37 °C. Fluorescence imaging of the free IR-780 was captured using a confocal laser scanning microscope. Subsequently, the cells were treated with 10 µM and 50 µM CN⁻ for an additional 30 min, followed by further imaging [56,63]. As shown in Figure 18, fluorescence staining with IR-780 was highly specific to the cells, with the background (areas without cells, Figure S1) remaining non-fluorescent (black), even without washing off the probe. A significant decrease in fluorescence intensity was observed upon CN addition, indicating effective quenching of the dye’s emission. Moreover, the extent of fluorescence quenching was directly proportional to the CN⁻ concentration. These results demonstrate CN’s specific and concentration-dependent quenching effect on fluorescence within cells.

4. Conclusions

This study demonstrates that the IR-780 dye is a selective sensor for visually and optically detecting cyanide, hydroxide, and azide in organic media. No significant interaction is observed with any of the other tested anions. Using UV-Vis spectroscopy, the method can discriminate between cyanide and azide based on reaction time. It was demonstrated that the dye interacts with azide and exhibits strong fluorescence within a few minutes, while no significant fluorescence was observed for other ions, making it a suitable fluorescent probe for detecting azide in acetonitrile. The dye’s interaction with the tested anions is characterized by a nucleophilic addition at the iminium carbon, as confirmed by the color change and 1H-NMR and 13C-NMR studies. Strong binding constants were observed between the dye and anions. The detection of cyanide was demonstrated in solutions, on solid platforms, on test strips, and finally, in a living cell.

Supplementary Materials

The following supporting information can be downloaded at: https://www.mdpi.com/article/10.3390/photochem5020012/s1, Figure S1: Confocal fluorescence microscopy images of HeLa cells treated with dye (IR-780), showing the effect of cyanide addition.

Author Contributions

Conceptualization, F.A. and Y.M.H.; Methodology, Y.M.H., B.A., A.M.S. and S.U.; Investigation, Y.M.H., R.R., S.U. and A.M.S.; Resources, F.A. and Y.M.H.; Data curation, R.R.; Writing, review & editing, A.M.S. and F.A.; Supervision, Y.M.H.; All authors have read and agreed to the published version of the manuscript.

Funding

Y.M.H. acknowledges support from NPRP grant #7-495-1-094 from the Qatar National Research Fund, a Qatar Foundation, and Qatar University through Grant #QUCG-CAS-20/21-1. F.A. also acknowledges the support of the National Science Foundation’s Division of Chemistry under grant [2100629].

Institutional Review Board Statement

Not applicable.

Informed Consent Statement

Not applicable.

Data Availability Statement

The original contributions presented in this study are included in the article. For further inquiries, please contact the corresponding authors.

Acknowledgments

The authors thank Haw-Lih Su from the Central Laboratory Unit, Qatar University, for recording NMR spectra and his valuable input.

Conflicts of Interest

The authors declare that they have no known competing financial interests or personal relationships that could have appeared to influence the work reported in this paper.

References

  1. Sheng, X.; Ye, Z.; Liu, S.; He, W.; Ren, J.; Yin, J. Cyanine IR-780 for distinguishing 2-amino thiophenols from position isomers. Dye. Pigment. 2016, 131, 84–90. [Google Scholar] [CrossRef]
  2. Yi, X.; Yan, F.; Wang, F.; Qin, W.; Wu, G.; Yang, X.; Shao, C.; Chung, L.W.K.; Yuan, J. IR-780 dye for near-infrared fluorescence imaging in prostate cancer. Med. Sci. Monit. Int. Med. J. Exp. Clin. Res. 2015, 21, 511–517. [Google Scholar]
  3. Thomas, R.G.; Jeong, Y.Y. NIRF Heptamethine Cyanine Dye Nanocomplexes for Multi Modal Theranosis of Tumors. Chonnam Med. J. 2017, 53, 83–94. [Google Scholar] [CrossRef] [PubMed]
  4. Zhang, E.; Luo, S.; Tan, X.; Shi, C. Mechanistic study of IR-780 dye as a potential tumor targeting and drug delivery agent. Biomaterials 2014, 35, 771–778. [Google Scholar] [CrossRef]
  5. Duan, L.; Wang, L.; Zhang, C.; Yu, L.; Guo, F.; Sun, Z.; Xu, Y.; Yan, F. Role of near-infrared heptamethine cyanine dye IR-783 in diagnosis of cervical cancer and its mechanism. Int. J. Clin. Exp. Pathol. 2019, 12, 2353–2362. [Google Scholar]
  6. Sun, W.; Guo, S.; Hu, C.; Fan, J.; Peng, X. Recent Development of Chemosensors Based on Cyanine Platforms. Chem. Rev. 2016, 116, 7768–7817. [Google Scholar] [CrossRef]
  7. Suzuki, T.; Hioki, A.; Kurahashi, M. Development of a method for estimating an accurate equivalence point in nickel titration of cyanide ions. Anal. Chim. Acta 2003, 476, 159–165. [Google Scholar] [CrossRef]
  8. Safavi, A.; Maleki, N.; Shahbaazi, H.R. Indirect determination of cyanide ion and hydrogen cyanide by adsorptive stripping voltammetry at a mercury electrode. Anal. Chim. Acta 2004, 503, 213–221. [Google Scholar] [CrossRef]
  9. Rao, V.K.; Suresh, S.; Rao, N.B.S.N.; Rajaram, P. An electrochemical sensor for detection of hydrogen cyanide gas. Bull. Electrochem. 1997, 13, 327–329. [Google Scholar]
  10. Tomasulo, M.; Sortino, S.; White, A.J.P.; Raymo, F.M. Fast and Stable Photochromic Oxazines. J. Org. Chem. 2005, 70, 8180–8189. [Google Scholar] [CrossRef]
  11. Hudnall, T.W.; Gabbaï, F.P. Ammonium Boranes for the Selective Complexation of Cyanide or Fluoride Ions in Water. J. Am. Chem. Soc. 2007, 129, 11978–11986. [Google Scholar] [CrossRef] [PubMed]
  12. Yang, Y.-K.; Tae, J. Acridinium Salt Based Fluorescent and Colorimetric Chemosensor for the Detection of Cyanide in Water. Org. Lett. 2006, 8, 5721–5723. [Google Scholar] [CrossRef] [PubMed]
  13. Cho, D.-G.; Kim, J.H.; Sessler, J.L. The Benzil−Cyanide Reaction and Its Application to the Development of a Selective Cyanide Anion Indicator. J. Am. Chem. Soc. 2008, 130, 12163–12167. [Google Scholar] [CrossRef]
  14. Jo, T.G.; Lee, J.J.; Nam, E.; Bok, K.H.; Lim, M.H.; Kim, C. A highly selective fluorescent sensor for the detection of Al3+ and CN− in aqueous solution: Biological applications and DFT calculations. New J. Chem. 2016, 40, 8918–8927. [Google Scholar] [CrossRef]
  15. Yuan, L.; Lin, W.; Yang, Y.; Song, J.; Wang, J. Rational Design of a Highly Reactive Ratiometric Fluorescent Probe for Cyanide. Org. Lett. 2011, 13, 3730–3733. [Google Scholar] [CrossRef]
  16. Wu, X.; Xu, B.; Tong, H.; Wang, L. Highly Selective and Sensitive Detection of Cyanide by a Reaction-Based Conjugated Polymer Chemosensor. Macromolecules 2011, 44, 4241–4248. [Google Scholar] [CrossRef]
  17. Hong, S.-J.; Lee, C.-H. Nitrovinyl substituted calix [4]pyrrole as a unique, reaction-based chemosensor for cyanide anion. Tetrahedron Lett. 2012, 53, 3119–3122. [Google Scholar] [CrossRef]
  18. Afkhami, A.; Sarlak, N. A novel cyanide sensing phase based on immobilization of methyl violet on a triacetylcellulose membrane. Sens. Actuators B Chem. 2007, 122, 437–441. [Google Scholar] [CrossRef]
  19. Yang, Z.; Liu, Z.; Chen, Y.; Wang, X.; He, W.; Lu, Y. A new ratiometric and colorimetric chemosensor for cyanide anion based on Coumarin-hemicyanine hybrid. Org. Biomol. Chem. 2012, 10, 5073–5076. [Google Scholar] [CrossRef]
  20. Lv, X.; Liu, J.; Liu, Y.; Zhao, Y.; Chen, M.; Wang, P.; Guo, W. A ratiometric fluorescent probe for cyanide based on FRET. Org. Biomol. Chem. 2011, 9, 4954–4958. [Google Scholar] [CrossRef]
  21. Lee, H.; Chung, Y.M.; Ahn, K.H. Selective fluorescence sensing of cyanide with an o-(carboxamido)trifluoroacetophenone fused with a cyano-1,2-diphenylethylene fluorophore. Tetrahedron Lett. 2008, 49, 5544–5547. [Google Scholar] [CrossRef]
  22. Niu, H.-T.; Jiang, X.; He, J.; Cheng, J.-P. A highly selective and synthetically facile aqueous-phase cyanide probe. Tetrahedron Lett. 2008, 49, 6521–6524. [Google Scholar] [CrossRef]
  23. Ding, Y.; Li, T.; Zhu, W.; Xie, Y. Highly selective colorimetric sensing of cyanide based on formation of dipyrrin adducts. Org. Biomol. Chem. 2012, 10, 4201–4207. [Google Scholar] [CrossRef] [PubMed]
  24. Hijji, Y.M.; Barare, B.; Zhang, Y. Lawsone (2-hydroxy-1,4-naphthoquinone) as a sensitive cyanide and acetate sensor. Sens. Actuators B Chem. 2012, 169, 106–112. [Google Scholar] [CrossRef]
  25. Hijji, Y.M.; Elsafy, A.G.; Al-Easa, H.S.; Attili, B.; Abdelrasoul, M.; Mohamed, N.; Nasrallah, G.K. Curcumin a colorimetric and fluorimetric cyanide probe in aqueous system and living cells. Anal. Methods 2019, 11, 5169–5176. [Google Scholar] [CrossRef]
  26. Betterton, E.A. Environmental Fate of Sodium Azide Derived from Automobile Airbags. Crit. Rev. Environ. Sci. Technol. 2003, 33, 423–458. [Google Scholar] [CrossRef]
  27. Paz-y-Miño, C.; Beaty, D.; López-Cortés, A.; Proaño, I. Frequency of GJB2 and del(GJB6-D13S1830) mutations among an Ecuadorian mestizo population. Int. J. Pediatr. Otorhinolaryngol. 2014, 78, 1648–1654. [Google Scholar] [CrossRef]
  28. Lichstein, H.C. Studies of the Effect of Sodium Azide on Microbic Growth and Respiration: III. The Effect of Sodium Azide on the Gas Metabolism of B. subtilis and P. aeruginosa and the Influence of Pyocyanine on the Gas Exchange of a Pyocyanine-Free Strain of P. aeruginosa in the Presence of Sodium Azide. J. Bacteriol. 1944, 47, 239–251. [Google Scholar]
  29. Kim, H.W.; Choi, M.G.; Park, H.; Lee, J.W.; Chang, S.-K. Single molecular multianalyte signaling of sulfide and azide ions by a nitrobenzoxadiazole-based probe. RSC Adv. 2015, 5, 4623–4627. [Google Scholar] [CrossRef]
  30. Jeong, Y.A.; Chang, I.J.; Chang, S.-K. Discriminative sensing of sulfide and azide ions in solution by a nitrobenzoxadiazole-dansyl dyad by simply tuning the water content. Sens. Actuators B Chem. 2016, 224, 73–80. [Google Scholar] [CrossRef]
  31. Mishra, A.; Behera, R.K.; Behera, P.K.; Mishra, B.K.; Behera, G.B. Cyanines during the 1990s:  A Review. Chem. Rev. 2000, 100, 1973–2012. [Google Scholar] [CrossRef] [PubMed]
  32. Quang, D.T.; Kim, J.S. Fluoro- and Chromogenic Chemodosimeters for Heavy Metal Ion Detection in Solution and Biospecimens. Chem. Rev. 2010, 110, 6280–6301. [Google Scholar] [CrossRef] [PubMed]
  33. de Silva, A.P.; Gunaratne, H.Q.N.; Gunnlaugsson, T.; Huxley, A.J.M.; McCoy, C.P.; Rademacher, J.T.; Rice, T.E. Signaling Recognition Events with Fluorescent Sensors and Switches. Chem. Rev. 1997, 97, 1515–1566. [Google Scholar] [CrossRef]
  34. Yang, Y.; Zhao, Q.; Feng, W.; Li, F. Luminescent Chemodosimeters for Bioimaging. Chem. Rev. 2013, 113, 192–270. [Google Scholar] [CrossRef]
  35. Fabbrizzi, L.; Poggi, A. Sensors and switches from supramolecular chemistry. Chem. Soc. Rev. 1995, 24, 197–202. [Google Scholar] [CrossRef]
  36. Lee, M.H.; Kim, J.S.; Sessler, J.L. Small molecule-based ratiometric fluorescence probes for cations, anions, and biomolecules. Chem. Soc. Rev 2015, 44, 4185–4191. [Google Scholar] [CrossRef]
  37. Chen, X.; Tian, X.; Shin, I.; Yoon, J. Fluorescent and luminescent probes for detection of reactive oxygen and nitrogen species. Chem. Soc. Rev. 2011, 40, 4783–4804. [Google Scholar] [CrossRef]
  38. Xu, K.; Wang, L.; Qiang, M.; Wang, L.; Li, P.; Tang, B. A selective near-infrared fluorescent probe for singlet oxygen in living cells. Chem. Commun. 2011, 47, 7386–7388. [Google Scholar] [CrossRef]
  39. Wang, R.; Yu, F.; Chen, L.; Chen, H.; Wang, L.; Zhang, W. A highly selective turn-on near-infrared fluorescent probe for hydrogen sulfide detection and imaging in living cells. Chem. Commun. 2012, 48, 11757–11759. [Google Scholar] [CrossRef]
  40. Yin, J.; Kwon, Y.; Kim, D.; Lee, D.; Kim, G.; Hu, Y.; Ryu, J.-H.; Yoon, J. Cyanine-Based Fluorescent Probe for Highly Selective Detection of Glutathione in Cell Cultures and Live Mouse Tissues. J. Am. Chem. Soc. 2014, 136, 5351–5358. [Google Scholar] [CrossRef]
  41. Wang, X.; Lv, J.; Yao, X.; Li, Y.; Huang, F.; Li, M.; Yang, J.; Ruan, X.; Tang, B. Screening and investigation of a cyanine fluorescent probe for simultaneous sensing of glutathione and cysteine under single excitation. Chem. Commun. 2014, 50, 15439–15442. [Google Scholar] [CrossRef] [PubMed]
  42. Zhytniakivska, O.; Kurutos, A.; Tarabara, U.; Vus, K.; Trusova, V.; Gorbenko, G.; Gadjev, N.; Deligeorgiev, T. Probing the amyloid protein aggregates with unsymmetrical monocationic trimethine cyanine dyes. J. Mol. Liq. 2020, 311, 113287. [Google Scholar] [CrossRef]
  43. Tang, B.; Cui, L.J.; Xu, K.H.; Tong, L.L.; Yang, G.W.; An, L.G. A Sensitive and Selective Near-Infrared Fluorescent Probe for Mercuric Ions and Its Biological Imaging Applications. ChemBioChem 2008, 9, 1159–1164. [Google Scholar] [CrossRef] [PubMed]
  44. Tang, B.; Huang, H.; Xu, K.; Tong, L.; Yang, G.; Liu, X.; An, L. Highly sensitive and selective near-infrared fluorescent probe for zinc and its application to macrophage cells. Chem. Commun. 2006, 3, 3609–3611. [Google Scholar] [CrossRef]
  45. Yang, Y.; Cheng, T.; Zhu, W.; Xu, Y.; Qian, X. Highly Selective and Sensitive Near-Infrared Fluorescent Sensors for Cadmium in Aqueous Solution. Org. Lett. 2011, 13, 264–267. [Google Scholar] [CrossRef]
  46. Cao, X.; Lin, W.; Wan, W. Development of a near-infrared fluorescent probe for imaging of endogenous Cu+ in live cells. Chem. Commun. 2012, 48, 6247–6249. [Google Scholar] [CrossRef]
  47. Hirayama, T.; Van de Bittner, G.C.; Gray, L.W.; Lutsenko, S.; Chang, C.J. Near-infrared fluorescent sensor for in vivo copper imaging in a murine Wilson disease model. Biochemistry 2012, 109, 2228–2233. [Google Scholar] [CrossRef]
  48. Chen, Y.; Yang, C.; Yu, Z.; Chen, B.; Han, Y. A highly sensitive hemicyanine-based fluorescent chemodosimeter for mercury ions in aqueous solution and living cells. RSC Adv. 2015, 5, 82531–82534. [Google Scholar] [CrossRef]
  49. Kar, C.; Shindo, Y.; Oka, K.; Nishiyama, S.; Suzuki, K.; Citterio, D. Spirolactam capped cyanine dyes for designing NIR probes to target multiple metal ions. RSC Adv. 2017, 7, 24970–24980. [Google Scholar] [CrossRef]
  50. Zhang, C.; Ding, Y.; Zhou, M.; Xiang, Y.; Tong, A. An in-situ, reversible fluorescent paper sensor for selective detection of ambient CO2. J. Mater. Chem. C 2023, 11, 299–306. [Google Scholar] [CrossRef]
  51. Abebe, F.; Sutton, T.; Perkins, P.; Shaw, R. Two colorimetric fluorescent turn-on chemosensors for detection of Al3+ and N3-: Synthesis, Photophysical and computational studies. Luminescence 2018, 33, 1194–1201. [Google Scholar] [CrossRef] [PubMed]
  52. Li, X.; Shi, W.; Chen, S.; Jia, J.; Ma, H.; Wolfbeis, O.S. A near-infrared fluorescent probe for monitoring tyrosinase activity. Chem. Commun. 2010, 46, 2560–2562. [Google Scholar] [CrossRef] [PubMed]
  53. Yu, H.; Sun, M.; Zhang, K.; Zhu, H.; Liu, Z.; Zhang, Y.; Zhao, J.; Wu, L.; Zhang, Z.; Wang, S. A reversible near-infrared pH probes for optical measurements of pH in complete water system and living cells. Sens. Actuators B Chem. 2015, 219, 294–300. [Google Scholar] [CrossRef]
  54. Han, J.; Burgess, K. Fluorescent Indicators for Intracellular pH. Chem. Rev. 2010, 110, 2709–2728. [Google Scholar] [CrossRef]
  55. Li, X.; Yue, Y.; Wen, Y.; Yin, C.; Huo, F. Hemicyanine based fluorimetric and colorimetric pH probe and its application in bioimaging. Dye. Pigment. 2016, 134, 291–296. [Google Scholar] [CrossRef]
  56. Uota, S.; Hwang, B.J.; Butcher, R.; Mullins, R.; Wachira, J.; Hijji, Y.; Abebe, F. A simple benzothiazolium-based sensor for cyanide detection: Applications in environmental analysis and bioimaging. Spectrochim. Acta Part A Mol. Biomol. Spectrosc. 2025, 326, 125155. [Google Scholar] [CrossRef]
  57. Udhayakumari, D. Chromogenic and fluorogenic chemosensors for lethal cyanide ion. A comprehensive review of the year 2016. Sens. Actuators B Chem. 2018, 259, 1022–1057. [Google Scholar] [CrossRef]
  58. Niu, H.-T.; Jiang, X.; He, J.; Cheng, J.-P. Cyanine dye-based chromofluorescent probe for highly sensitive and selective detection of cyanide in water. Tetrahedron Lett. 2009, 50, 6668–6671. [Google Scholar] [CrossRef]
  59. Barare, B.; Babahan, I.; Hijji, Y.M.; Bonyi, E.; Tadesse, S.; Aslan, K. A Highly Selective Sensor for Cyanide in Organic Media and on Solid Surfaces. Sensors 2016, 16, 271. [Google Scholar] [CrossRef]
  60. Ono, A.; Togashi, H. Highly Selective Oligonucleotide-Based Sensor for Mercury(II) in Aqueous Solutions. Angew. Chem. Int. Ed. 2004, 43, 4300–4302. [Google Scholar] [CrossRef]
  61. Tsui, Y.-K.; Devaraj, S.; Yen, Y.-P. Azo dyes featuring with nitrobenzoxadiazole (NBD) unit: A new selective chromogenic and fluorogenic sensor for cyanide ion. Sens. Actuators B Chem. 2012, 161, 510–519. [Google Scholar] [CrossRef]
  62. Wu, W.-N.; Wu, H.; Wang, Y.; Zhao, X.-L.; Xu, Z.-Q.; Xu, Z.-H.; Fan, Y.-C. A NIR sensor for cyanide detection and its application in cell imaging. Spectrochim. Acta Part A Mol. Biomol. Spectrosc. 2018, 199, 141–145. [Google Scholar] [CrossRef] [PubMed]
  63. Aduroja, O.; Shaw, R.; Uota, S.; Abiye, I.; Wachira, J.; Abebe, F. A Novel Fluorescent Chemosensor based on rhodamine Schiff base: Photophysical, computational, and bioimaging application in live cells. Inorganics 2025, 13, 5. [Google Scholar] [CrossRef]
Scheme 1. The proposed mechanism for the addition of nucleophiles to the dye.
Photochem 05 00012 sch001
Figure 1. Color changes of the dye (50 μM) under normal light (a) and a hand-held UV lamp (λ = 365 nm) (b) in 100% acetonitrile upon the addition of 20 equivalents of various TBA anions. Color changes demonstrated on cellulose disks (c). The order of vials in (b) is the same as in (a).
Photochem 05 00012 g001
Figure 2. UV−Vis spectra (a) and a bar graph (b) of the dye and dye−anion complexes (anions as TBA salts) in 100% acetonitrile.
Photochem 05 00012 g002
Figure 3. Job’s plot for dye–cyanide complex in acetonitrile at 435 nm.
Photochem 05 00012 g003
Figure 4. UV−Vis absorption spectra for cyanide titration with the dye (a). A plot of absorbance vs. cyanide concentration at 435 nm (b). The Benesi−Hildebrand plot (c).
Photochem 05 00012 g004
Figure 5. UV−Vis absorption spectra for the titration of the dye with hydroxide (a). A plot of absorbance vs. hydroxide concentration at 424 nm (b). The Benesi−Hildebrand plot (c).
Photochem 05 00012 g005
Figure 6. The UV−Vis titration of azide (0.75 µM to 55 µM) against the dye in 100% ACN (a). The azide absorbance at 400 nm from 0.75 µM to 55 µM (b).
Photochem 05 00012 g006
Figure 7. Benesi–Hildebrand plot for azide−dye interaction (a). Job’s plot for azide−dye complex in acetonitrile at 400 nm (b).
Photochem 05 00012 g007
Figure 8. The effect of anions on the color changes of dye−CN under normal light (a) and fluorescence under UV at 365 nm (b). The impact of different anions on the absorption of the dye−CN complex at 424 nm (c). The order of vials in (a) is the same as in (b).
Photochem 05 00012 g008
Figure 9. The effect of adding anions to the dye solution: the color change under normal light (a) and the fluorescence under a UV lamp at 365 nm (b) in a 75:25 (v/v) acetonitrile/water mixture. The order of vials in (b) is the same as in (a).
Photochem 05 00012 g009
Figure 10. The UV−Vis selectivity for CN- and OH- in acetonitrile/H2O (75:25) (a). A bar graph representation of the absorption of the dye–anion system at 435 nm (b).
Photochem 05 00012 g010
Figure 11. UV−Vis absorption spectra for the titration and a plot of absorbance vs. cyanide concentration with the dye in acetonitrile−H2O (75:25 v/v) (a,b). The Benesi−Hildebrand plot for the dye−CN complex (c).
Photochem 05 00012 g011
Figure 12. UV−Vis absorption spectra for the titration and a plot of absorbance vs. hydroxide concentration with the dye in acetonitrile−H2O in (75:25 v/v) (a,b). The Benesi−Hildebrand plot for the dye−hydroxide complex (c).
Photochem 05 00012 g012
Figure 13. Fluorescence emission spectra of the dye alone and dye–anion complexes (anions as TBA salts) in 100% acetonitrile at the excitation wavelength of 430 nm (a). A bar graph of the intensity of emission of the dye alone and the dye in the presence of different anions as TBA salts in acetonitrile (b).
Photochem 05 00012 g013
Figure 14. The dye’s fluorescence titration of 5.0 μM with TBA azide (a). A plot of the dye−azide complex emission intensity vs. azide concentration at 535 nm (b). The Benesi−Hildebrand plot for the dye−azide complex (c).
Photochem 05 00012 g014
Figure 15. The effect of adding anions to the dye–azide solution: the color change under normal light (a) and fluorescence under a UV lamp at 365 nm (b) in acetonitrile. A bar graph of the emission intensity of the dye–azide alone and the dye–azide in the presence of different anions as TBA salts in acetonitrile (c). The order of the vials in (a) is the same as in (b).
Photochem 05 00012 g015
Figure 16. 1H NMR spectra for dye (a), dye−CN (b), dye−OH (c), and dye−N3 (d).
Photochem 05 00012 g016
Figure 17. 13C NMR spectra for dye (a), dye–CN (b), dye–OH (c), and dye–N3 (d).
Photochem 05 00012 g017
Figure 18. Confocal fluorescence microscopy images of HeLa cells treated with dye (IR-780), showing the effect of cyanide addition, at 40× magnification.
Photochem 05 00012 g018
Table 1. 1H NMR chemical shifts (ppm) observed for dye, dye–CN, dye–OH, and dye–N3.
Dye1.68 (12H, s)4.21 (4H, t)8.72 (2H, d)6.35 (2H, d)
Dye–CN1.61 (6H, s)1.37 (3H, s)1.05 (3H, s)3.63 (2H, t)3.02(1H, dt)
2.86 (1H, dt)7.36 (1H, d)7.31 (1H, d)5.77 (1H, d)5.47 (1H, d)
Dye–OH1.50 (6H, s)1.14 (3H, s)0.94 (3H, s)3.61 (2H, t)2.99(1H, dt)
2.81 (1H, dt)7.26 (1H, d)6.47 (1H, d)5.88 (1H, d)5.49 (1H, d)
Dye–N31.60 (6H, s)1.37 (3H, s)1.10 (3H, s)3.87 (2H, t)2.82(1H, dt)
2.64 (1H, dt)----------------
complex spectra7.39 (1H, d)5.77 (1H, d)5.30----
Table 2. 13C NMR-specific significant chemical shifts were observed for dye, dye–CN, dye–OH, and dye–N3.
Chiral Carbon (New Peaks)Vinylic Carbon (New Peaks)Other Peaks
Dye172 (quaternary C)----------------
Dye–CNN/A80.7992.96119.20 for nitrile
Dye–OHN/A99.6692.95-----
Dye–N3N/A95.3192.95complex spectra
Disclaimer/Publisher’s Note: The statements, opinions and data contained in all publications are solely those of the individual author(s) and contributor(s) and not of MDPI and/or the editor(s). MDPI and/or the editor(s) disclaim responsibility for any injury to people or property resulting from any ideas, methods, instructions or products referred to in the content.

