Abstract
ZnO nanocrystals doped with Nd, Gd, and Er were synthesized using a soft chemical process in ambient atmosphere. Pseudospherical and hexagonal nanocrystals (NC) of the wurtzite phase with a mean size of (7.4 ± 1.7) nm were obtained. The presence of rare earth (RE) dopants was confirmed by X-ray fluorescence (XRF) spectroscopy. The ZnO nanocrystals exhibited simultaneously narrow excitonic- and broad trap/surface-related photoluminescence (PL), both of which were affected by doping with RE atoms. Doping reduced the total PL intensity, suppressing the excitonic emission by a greater extent than the broad band PL. Also, doping resulted in a blue shift of the trap/surface-related emission, while the energy of the excitonic peak remained unchanged. Resonant Raman spectra additionally confirmed the wurtzite phase of ZnO NCs and revealed a shift of the A1-LO mode towards lower frequency upon doping that could be caused by the mass effect of RE atoms, point defects, and increases in charge carrier concentration. Fitting of the spectra with Voigt profiles showed better results with two surface optical (SO) phonon modes that were previously theoretically predicted for the wurtzite ZnO phase. The influence of RE doping on PL and Raman spectra can be explained by the incorporation of RE ions into the ZnO nanostructures, where the dopants act as non-radiative defects.
1. Introduction
ZnO is known as an intrinsically n-type doped semiconductor that is thermodynamically stable in a hexagonal wurtzite structure (space group P63mc) under normal conditions. Bulk wurtzite ZnO exhibits a wide direct bandgap of 3.37 eV at room temperature and a large free exciton binding energy of 60 meV [1,2]. According to the effective mass approximation, the Bohr radius of the exciton for hexagonal ZnO is predicted to be in the range between 1.5 nm and 3.0 nm [2,3]. When the dimensions of the crystalline material are reduced to the nanoscale comparable to the Bohr exciton radius, quantum confinement changes its optical and electronic properties. Among other factors, the properties of quantum-sized nanostructures depend on crystallinity, crystal shape and size, the number of defects, and semiconductor composition modified by alloying or doping [4].
Due to the size effects, ZnO nanostructures offer exciton-related ultra-violet (UV)/blue light emission at room temperature [5]. In addition, the presence of deep centers stemming from intrinsic and/or extrinsic defects allows ZnO nanostructures to emit light in the violet–red spectral range, covering almost the entire visible spectral range [6]. Despite the progress in the preparation of nanostructured ZnO materials with high crystalline quality and well-defined size, the influence of synthesis/postprocessing parameters on their optical, electronic, and other properties is not fully understood and still attracts attention. As an example, the photovoltaic performance of ZnO devices suffers from charge recombination and trapping due to the existence of different kinds of defects, such as oxygen vacancies, donor–acceptor recombination [7], or antisite oxygen [8]. The incorporation of defects or impurities into the semiconductor lattice is a primary means of controlling optical, luminescent, and electrical conductivity. Doping of the ZnO crystal lattice with different elements has resulted in encouraging outcomes in terms of better control of the morphology as well as extending the bandgap into the visible spectral range [9,10,11,12]. In some reports, transition metal dopants, such as silver, increased the photoresponse of ZnO [13], while cobalt and manganese doping decreased its photoactivity [14]. The doping of bulk and micro/nanocrystalline ZnO using rare earth (RE) elements is another promising approach for tuning the PL properties and improving photocatalytic activity [15,16,17,18]. However, in contrast to bulk material, the effects of RE doping on ZnO quantum-confined nanocrystals obtained under ambient mild conditions of “green” colloidal synthesis, e.g., the DMSO solvent is low-toxic and is accepted in pharmaceuticals [19], have not received proper attention.
Here, we report on the effects of RE doping (RE = Er, Gd, and Nd) on the optical and Raman vibrational properties of ZnO nanocrystals synthesized through a soft chemical method in ambient atmosphere. While such doping does not affect the mean crystallite sizes and morphology of the ZnO nanocrystals, the ratio between the near-bandgap excitonic- and broad band defect-related PL changes in favor of the latter. Raman spectra exhibit characteristic features of the wurtzite ZnO phase and surface optical phonon modes due to the small size of the crystals. Doping shifts and broadens the resonant Raman spectra, presumably due to the mass effect of heavy RE atoms, point defects, and increases in charge carrier concentration.
2. Materials and Methods
2.1. Chemicals
Zinc acetate (anhydrous), Erbium(III) nitrate hexahydrate, Neodymium(III) nitrate hexahydrate, and Gadolinium(III) nitrate hexahydrate (all with a purity grade of 99.9%) were purchased from Sigma-Aldrich. Tetraethylammonium hydroxide (TEA-OH, 20% aqueous solution), dimethyl sulfoxide (DMSO, 99+% purity), ethanol, and tetrahydrofuran (THF) were obtained from Alfa Aesar.
2.2. Synthesis Method
Nanocrystals of RE-doped ZnO were prepared using a modified method previously described by Panasiuk et al. [20] and Bomila et al. [21]. The synthesis was performed at ambient pressure by using Zn acetate and RE nitrates in DMSO solutions and aqueous TEA-OH as a base (alkali) source. First, Zn acetate and all of RE nitrates were dissolved in DMSO to prepare solutions with concentrations of 1.0 M and 0.1 M, respectively. Then, 0.2 mL of the Zn acetate and 0.02 mL of one of the RE dopant stock solutions, which corresponded to a nominal doping level of 0.99%, were diluted in 9.63 mL of DMSO, and 0.15 mL of aqueous 20% TEA-OH was rapidly injected with magnetic stirring to this mixture. The transparent colloidal solutions obtained were subjected to heat treatment in a water bath at 80 °C for 60 min and stored for about one month in the dark at room temperature before further characterization. For transmission electron microscopy (TEM) and selected area electron diffraction (SAED) measurements, samples were purified from excess DMSO and unreacted products by adding 1 mL of THF to 0.5 mL of the ZnO colloidal solution. Afterwards, the turbid colloids were centrifuged at 5000 rpm for 5 min. The solid residues were separated from the liquid and redispersed in 0.4 mL of ethanol via sonication for 5 min. Solid residues for X-ray fluorescence (XRF) measurements were purified in a similar manner to those of TEM, while Raman, photoluminescence (PL), and optical absorption analyses were performed in the liquid phase in DMSO without purification. Additional specific details on sample preparation for each measurement are provided below.
2.3. Sample Characterization
The samples were characterized by TEM carried out on a Philips CM 20 FEG microscope at an accelerating voltage of 200 kV. In addition, the crystal phase analysis was performed using SAED patterns. For the measurements, a droplet of a highly diluted purified and freshly sonicated product was deposited onto a carbon-coated copper TEM grid and dried overnight at ambient conditions. Elemental analysis was carried out using XRF spectroscopy using a “LD Didactic” setup equipped with an X-ray source with a Mo anode, operated at a constant current of 1 mA and a voltage of 35 kV. Purified ZnO powder samples were placed on an aluminium foil and tilted at 45° with respect to the X-ray source and at 90° with respect to the detector. The spectra for stoichiometry analysis were registered for 5 min exposure for each sample. Raman spectra were recorded using a HORIBA LabRAM HR 800 spectrometer in a backscattering geometry under λ = 325 nm He-Cd laser excitation and using a 2400 lines/mm grating. In order to minimize heating effects, the laser power was kept below 50 µW under a 40x CaF2 objective. The samples were measured in the liquid phase by drop-coating a Si(111) substrate. PL measurements were registered on a Varian Cary Eclipse fluorescence spectrophotometer equipped with a Xenon flash lamp, 1200 lines/mm gratings for emission and excitation, and a default photomultiplier detector without additional sensitivity correction. To acquire PL spectra, the samples were excited by 290 nm (4.27 eV) light in standard 10.0 mm quartz cuvettes. The UV-vis absorption spectra of the samples were collected using a Specord 220 double-beam spectrophotometer in 1.0 mm standard quartz cuvettes using zinc acetate solution in DMSO as a blank reference sample.
3. Results and Discussion
3.1. Transmission Electron Microscopy and Selected Area Electron Diffraction (SAED)
The morphology and crystallinity of the nanocrystals were determined using TEM. Representative microphotographs are shown in Figure 1a,b. The high-resolution images revealed NCs of a hexagonal shape with well-defined facets and crystal lattice fringes with d = (2.82 ± 0.05) Å corresponding to the (100) planes of hexagonal (wurtzite) ZnO (highlighted in Figure 1b). In the overview image of Figure 1a, in addition to hexagonal zero-dimensional polyhedrons, pseudospherical NCs and an admixture of elongated NCs were observed.
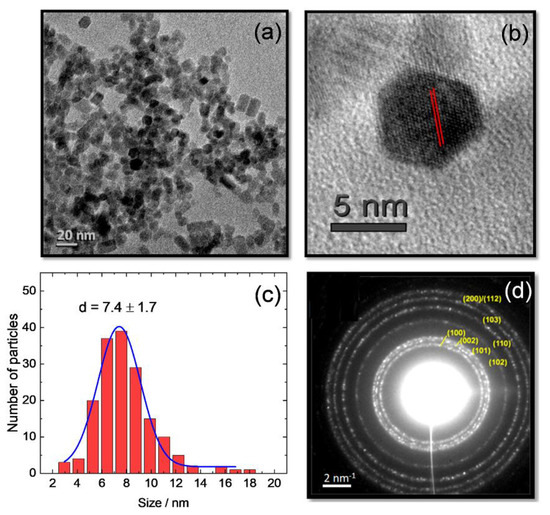
Figure 1.
(a) TEM image showing an overview; (b) TEM image showing a high-resolution image of undoped ZnO NCs. The spacing d = (2.82 ± 0.05) Å corresponds to the (100) plane of hexagonal ZnO. (c) Statistical distribution of NCs; (d) SAED pattern with characteristic reflexes of the wurtzite phase of ZnO NCs.
The average size of the NCs was around (7.4 ± 1.7) nm, calculated from the statistics for 150–160 NCs in Figure 1c and considering diameters for pseudospherical and long diagonals for hexagonal and rarely elongated NCs to take into account the morphology differences. No statistically significant changes in the TEM micrographs were observed for the RE-doped ZnO NCs compared to those of the pristine ZnO NCs in terms of shape and distribution (Figure S1).
Crystal phase analysis was performed using SAED patterns. Figure 1d shows a set of concentric rings typical for the diffraction by an ensemble of randomly oriented NCs of very small dimensions. A few intense spots indicated the presence of larger size NCs, which is consistent with the polydispersity of the particles in the TEM image of Figure 1a.
The calculated spacing distances of (2.80 ± 0.02) Å, 2.59 Å, 2.46 Å, 1.93 Å, 1.63 Å, 1.48 Å, and 1.37 Å were characteristic for the hexagonal wurtzite ZnO modification (ICDD PDF #36-1451). The spacings were assigned to the Miller indices (100), (002), (101), (102), (110), (103), and (200)/(112), respectively. Finally, the lattice parameters calculated for the hexagonal structure, a = 0.324 ± 0.002 nm and c = 0.519 ± 0.002 nm, were in good agreement with the literature data for wurtzite ZnO [10,22,23].
3.2. X-ray Fluorescence (XRF)
A qualitative elemental analysis of the NC samples was performed using XRF spectroscopy. Figure 2 shows the spectra of pristine and RE-doped ZnO NCs. All the samples revealed zinc-specific fluorescence lines: ZnKα at 8.53 keV and ZnKβ1 at 9.56 keV [24,25]. The doped NCs also revealed distinctive lines for the corresponding rare-earth materials: NdLα at 5.22 keV and NdLβ1 at 5.72 keV; GdLα at 6.05 keV and GdLβ1 at 6.75 keV; and ErLα at 6.94 keV and ErLβ1 at 7.81 keV [25]. The peak at ~11.5 keV was the AuLα line [25], occurring due to the housing of the X-ray detector. Within the accuracy of the method, no other elements were detected (including a possible aluminium signal from the sample holder). The characteristic nature of the emission peaks indicated the presence of RE elements in the examined samples.
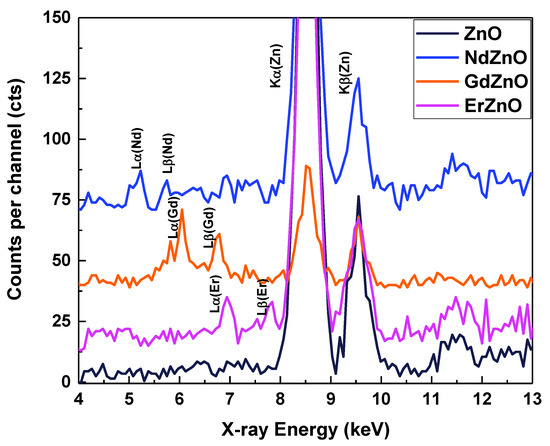
Figure 2.
XRF spectra of pristine ZnO and RE-doped ZnO NCs.
It is important to note that XRF investigations were performed on the samples after purification, suggesting co-precipitation of the RE elements together with the ZnO NCs, presumably through the incorporation of RE atoms into the ZnO NCs. Due to the significant differences in ionic radii and formal charge of Zn2+ (0.74 Å) in comparison to Nd3+ (0.98 Å), Gd3+ (0.94 Å), and Er3+ (0.89 Å) [26], RE dopants are more likely to be interstitial defects rather than substituted atoms. Furthermore, the introduction of dopant ions with larger positive charges (RE3+) into ZnO NCs compared to Zn2+ can reduce the VO+ or VO2+ oxygen vacancy concentration to maintain charge neutrality in the crystal lattice. The influence of rare earth elements on the ZnO lattice is further discussed regarding their effect on the PL, optical absorption, and Raman spectra.
3.3. Photoluminescence and Optical Absorption
3.3.1. Photoluminescence (PL)
In the PL spectra of the ZnO NCs, a narrow near-band edge emission (NBE) around 380 nm and a broad band deep-level emission (DLE) between 450 nm to 700 nm were generally observed [5,6,7,8,27]. Figure 3 shows the spectra normalized to the absorbance at λex = 290 nm. The distinct, relatively narrow peak in the UV region around 380 nm, predominant for undoped ZnO NCs, was due to free exciton recombination [28]. The decrease in the intensity of the NBE peak (Figure 3) indicated a lower exciton radiative recombination rate for the RE-doped ZnO NCs. The PL intensity of the DLE peak also decreased upon doping, showing a general suppressing of PL yield and increase in non-radiative relaxation processes [29,30]. A possible reason for PL suppression is an increase in charge carrier concentration in ZnO NCs [31]. The generation of charge carriers with RE doping is discussed in the Raman section below. The DLE type of emission is usually associated with trap states, such as vacancies, interstitials, impurities, and surface defects (e.g., OH defects attached to the surface of ZnO NCs by dangling bonds) [27,32]. The stronger suppression of the NBE band compared to the DLE band most likely indicated that RE ions acted as non-radiative defects, the origin of which was different from the radiative defects responsible for the DLE band.
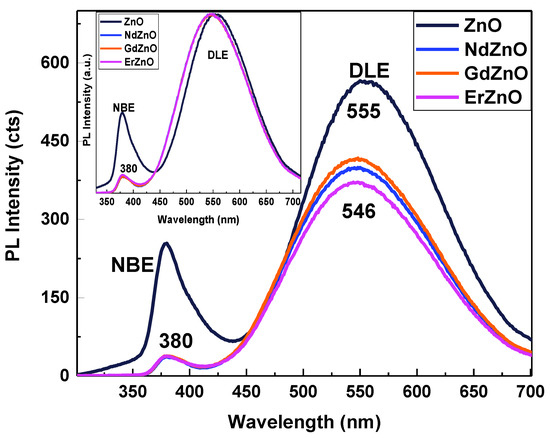
Figure 3.
PL spectra of pristine ZnO and RE-doped ZnO NCs normalized to the absorbance at λex = 290 nm and normalized to the deep-level emission (DLE) peak (insert).
Additionally, there was a clear shift of the maximum of the DLE emission peak of the ZnO NCs from 555 nm to 546 nm (Figure 3, insert) upon doping with RE elements. This may be attributed to the donor–acceptor recombination or transition from the conduction band to oxygen antisite middle-gap levels. Oxygen can act as energy storage centers that mediate the energy transfer from the ZnO host material to RE ions [33,34]. Since this type of doping influences the PL spectra, the energy levels due to RE elements may interact with the electronic structure of ZnO, which requires either embedding into the volume or at least adsorption on the surface of NCs.
3.3.2. Optical Absorption
Figure 4 shows the optical absorption spectra of pristine ZnO and RE-doped ZnO NCs. The absorption edge of the RE-doped ZnO NCs was slightly shifted toward the visible region from 368 nm for ZnO NCs to around 374 nm for RE-doped ZnO NCs. This could be attributed to a recombination of excitons from a localized level below the conduction band to the valance band [35,36,37,38,39]. Moreover, the shift toward the visible region for the RE-doped ZnO NCs could be due to the formation of oxygen vacancies and additional energy levels from the impurity atoms introduced into the wurtzite ZnO lattice. However, due to the low dopant concentration [16], the enhanced oxygen vacancies were not enough to expand the absorption of visible light to a wavelength above 374 nm. The pristine ZnO NCs exhibited well-resolved E1 and E2 excitonic transitions at 352 ± 2 nm (3.52 ± 0.01 eV) and 331 nm (3.75 eV), respectively. Optical detection of excitons at room temperature is typical for NCs under quantum confinement. The fact that for RE-doped ZnO, these peaks were poorly resolved can be explained by the trapping of excitons on RE-induced defects. This assumption is consistent with the decrease in the NBE photoluminescence peak. In turn, the intensity of the DLE peak, associated with oxygen vacancies, was less suppressed, possibly due to the localized nature of these states within the bandgap.
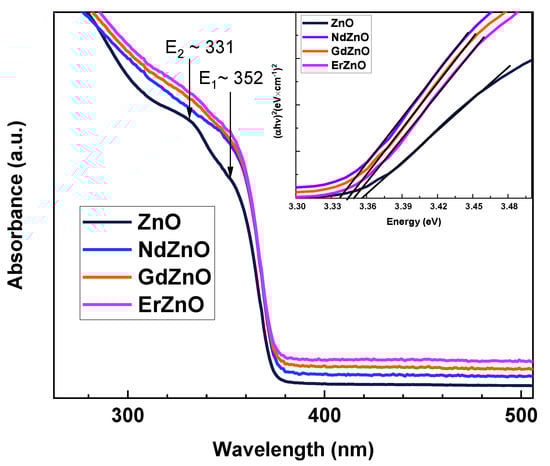
Figure 4.
Optical absorption spectra and Tauc plots (insert) of pristine ZnO and RE-doped ZnO NCs. The spectra are shifted vertically for clarity. The E1 and E2 peaks indicate excitonic transitions.
From the absorption spectra, the optical bandgap of the samples was determined by applying a linear fit in the Tauc coordinates for direct optical transitions (Figure 4, insert). The calculated values were close to each other with a small variation between 3.36 eV for pristine ZnO NCs and 3.33 eV for Nd-doped ZnO NCs. A similar “red” shift for RE-doped ZnO was also observed in the PL excitation (PLE) spectra (Figure S2). The slightly narrower bandgap of the RE-doped ZnO samples may be due to defect states of the Urbach tail or from the charge transfer between the ZnO conduction band and the 4f or 5d electrons of the RE elements that have an effective role in the electronic structure of ZnO [40,41]. Apparently, even small narrowing of the bandgap of doped ZnO should be taken into account when considering potential applications in optoelectronic devices [42].
3.4. Raman Spectroscopy
The hexagonal (wurtzite) ZnO with two formula units per primitive unit cell can exhibit up to nine optical phonon modes. The symmetry of the modes corresponded to the irreducible representation Γopt. = 1A1 (R. & IR active) + 2B1 + 1E1 (R. & IR) + 2E2 (R.), where the E-modes were doubly degenerated. Among them, the polar A1 and E1 modes were both Raman (R.)- and infrared (IR)-active, the nonpolar E2 modes were only Raman-active, and the B1-modes were Raman- and IR-silent. Due to the TO/LO splitting, the A1 and E1 modes were found in the Raman spectra of crystalline ZnO at ~380 (A1-TO), ~409 (E1-TO), ~574 (A1-LO), and ~587 cm−1 (E1-LO) [43,44,45]. The E2-low and E2-high were observed at 102 (1) cm−1 and 438 (1) cm−1, respectively [43,44,45]. The symmetry attribution in the literature was based on polarization-dependent Raman scattering and infrared ellipsometry measurements on single crystals and epitaxial thin films [43,45], and it was also supported by DFT calculations [46,47]. It should be noted that most of the Raman modes were observed under non-resonant excitation; resonant Raman spectra usually reveal a very strong A1-LO mode and its high-order overtones [48,49]. According to the phonon DOS, the frequency gap between acoustic and optical modes extended from 270 cm−1 to 410 cm−1 [46,50]. Therefore, the second-order spectra was divided into three regions: (a) the low-frequency region (160–540 cm−1) dominated by acoustic overtones, (b) the intermediate-frequency region (540–820 cm−1), where optical and acoustic phonon combinations occur, and (c) the high-frequency region (820–1120 cm−1) formed by optical overtones and optical modes combinations.
Figure 5a shows the resonant Raman spectra of the unmodified and RE-doped ZnO NCs. The pristine ZnO NCs revealed the A1-LO mode at 574 ± 2 cm−1 and its overtone at 1148 ± 4 cm−1, which were both consistent with the spectrum of ZnO [43,44,45]. A broad peak at 460–480 cm−1 had no correspondence to bulk ZnO; the nearest to it, the E2-high mode, was ~20–40 cm−1 lower. Moreover, there was a corresponding second-order feature at ~900–1000 cm−1, indicating the polar nature of the mode, while the E2 was nonpolar. Such a behavior together with the position of this feature between the TO and LO modes suggested an assignment to a surface optical (SO) phonon mode. Similar modes for low-dimensional ZnO were previously reported in [48,49,51,52]. This mode was due to the surface, the atoms of which were in a coordination and a dielectric environment different from those in the bulk crystal. The detection of the SO mode in the Raman spectra of the synthesized ZnO NCs was an additional indication of their small size. However, since the frequency of the SO mode depends not only on the size but also on the morphology and the dielectric environment of NCs [52], the frequency of this mode can hardly be used for NC size identification.
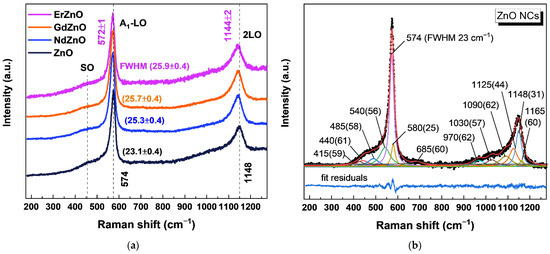
Figure 5.
(a) Raman spectra (λex = 325 nm) of pristine ZnO and RE-doped ZnO NCs; (b) Raman spectrum of pristine ZnO NCs fitted with Voigt profiles (90–95% Lorentzian) after PL background subtraction.
The contributions of different Raman peaks were discriminated by fitting with Voigt profiles, where the Lorentzian broadening was set to > 90% of the total FWHM (shown in brackets in Figure 5b). The Gaussian broadening, the contribution of which was accordingly less than 10%, was partly due to instrumental broadening and partly due to inhomogeneous broadening of the nanocrystalline sample. For the first-order peaks, the fit showed only several of the Raman-active modes of bulk ZnO, with maxima at 574 cm−1 (A1-LO), 415, 580 cm−1 (E1-TO and E1-LO, respectively), and 440 cm−1 (E2-high). It is interesting that the broad feature in the range ~400–550 cm−1 could be approximated either by one broad feature or by two peaks with maxima at 485 and 540 cm−1. The manifestation of two SO phonon modes for ZnO was suggested previously by Milekhin et al. in the theoretical calculations and was applied to fit the experimental Raman and IR spectra of ZnO [48,51]. It was assumed that the peaks were due to surface vibrations of different symmetries, namely, the A1-SO and E1-SO modes. For simplicity reasons, these peaks were designated as SO1 and SO2, respectively. Finally, to achieve a better fit, a high-frequency shoulder at ~685 cm−1 was applied by analogy to the Raman spectra of CdS and CdSe quantum dots [53,54].
The second-order peaks were fitted with overtones at 1148 cm−1 (2A1-LO), 1165 cm−1 (2E1-LO), 970 cm−1 (2SO1), and 1090 cm−1 (2SO2). To converge the fit, additional peaks were applied at 1030 cm−1 (≈ 490 + 540), which was a combination of the SO1 + SO2 modes, and at 1125 cm−1 (≈ 574 + 540), combining A1-LO and SO2 modes. It should be noted that although all the components of the model made physical sense, the fitting with 13 components had significant standard errors, which were 2–4 cm−1 for positions of the strong individual peaks and 8–10 cm−1 for low-intensity overlapping peaks. For this reason, the comparative analysis of pristine and RE-doped ZnO was focused on the shifts and broadening of the most intense first- and second-order A1-LO Raman peaks, while possible differences between the low-intensity features of pristine and RE-doped samples were indistinguishable within the error margins.
Figure 5a shows a downward shift and a broadening of the main A1-LO and 2A1-LO peaks of the RE-doped ZnO NCs compared to the pristine ZnO sample. According to Alim et al. [55], there are three main mechanisms leading to the red (downward) peak shifts of the phonon frequencies in NCs, namely, the spatial confinement within the boundaries of the nanocrystals, defects that are responsible for the phonon localization, and localized heating by the laser. Mao et al. showed that for heavily doped ZnO, the first- and second-order A1-LO modes are red-shifted due to phonon–plasmon coupling [56]. In the case of doping, a mass effect of foreign atoms and strain should be considered [57].
In our case, a very low laser power and the measurements in the liquid phase were chosen to minimize heating of the samples. According to some reports, ZnO NCs smaller than 8–11 nm [58,59] exhibit a red shift of the optical phonons in resonant as well as non-resonant Raman spectra due to the phonon confinement effect, which is in agreement with theoretical calculations [60,61]. In another report, even 4.8 nm ZnO NCs exhibited minor changes for the optical phonons, while significant shifts were observed for the acoustic phonons in the range 10–33 cm−1, which was also in agreement with theorical calculations [62]. In our study, undoped ZnO NCs with diameters of 3–7 nm exhibited an A1(LO) peak position at (574 ± 1) cm−1, which was similar to that of the A1(LO) peak in bulk ZnO [43,44,45]. Since the size of the studied pristine and RE-doped ZnO NCs in the range of the statistical distribution was the same, the size effect cannot account for the additional shift and broadening observed for the doped NCs. Large RE atoms may deteriorate the lattice and create additional defects that are partially corroborated by the decrease in the PL intensity and the shift of the absorption edge. Lattice defects are thus also one of the possible scenarios responsible for the observed broadening and shift of the Raman peaks [55,56]. The nominal doping ratio of RE/Zn was set as 1:100. A ZnO NC with the size of 5 nm possesses about 2800 Zn atoms (Table S1). If one assumes a homogeneous distribution and complete incorporation of 1% of RE atoms in the NCs, this gives about 28 atoms of RE dopant per NC. As we can see from TEM images, the doping does not deteriorate the crystal lattice, but still may induce point defects. Larger RE atoms may also cause compressive stress on the ZnO crystal lattice. Despite the fact that one could expect an upward shift of Raman modes under compressive stress, a downward shift was observed. Apparently, the small number of dopants was not enough to create high-enough stress to affect the peak position. On the other hand, it might be already sufficient to influence phonons by increasing mass. The influence of a dopant can be numerically described by a simple model, in which the RE3+ ions replace the Zn2+ (although this mechanism is only one of the possible options along with interstitial incorporation), and the bond length and reduced mass both change linearly upon doping [57]. According to the calculations (Figure S3), a shift of the A1 mode by 3 cm−1 requires anywhere from 4 to 9% of the dopant (100–250 RE atoms per ~2800 Zn atoms) that significantly exceeds the nominal content. The inclusion of such a large amount of dopant was inconsistent with the ZnO lattice, so the mass effect may have contributed to the shift, but it cannot be the sole cause. Finally, the red shift of the first A1-LO mode together with the point defects could have been caused the interaction of the longitudinal phonons with plasmons generated by free charge carriers [56]. According to the cascade model [63], impurities do not influence the second-order scattering process, but they are still affected by phonon–plasmon coupling. Therefore, the Raman shift of the 2A1-LO modes can be used for measurements of the charge carrier concentration [56]. In our case, the shift of the 2A1-LO from 1148 ± 2 to 1144 ± 2 cm−1 for the undoped and RE-doped ZnO, respectively, could be caused by an increase in the charge carrier concentration upon doping. Using the values of the shift of the 2A1-LO mode reported in [56], one can estimate the charge carrier concentration as ~8·1018 and ~4·1019 cm−3 for the pristine and RE-doped ZnO NCs, respectively. Thus, excluding factors such as laser heating, phonon confinement, and stress, the shift of the A1 mode of the RE-doped ZnO NCs (RE = Nd, Gd, and Er) can be partly explained by the mass effect of heavy RE atoms and mostly by additional point defects and charge carrier concentration increases in the ZnO NCs created by doping.
The high intensity of the characteristic A1-LO mode at 574 ± 2 cm−1 measured under a resonant excitation of 325 nm (3.81 eV) was due to the strong electron–phonon interaction of the electronic states with the electric field of the polar LO phonon mode [64,65]. The well-known effect of phonon–electron coupling can lead not only to the broadening of Raman peaks but also to increases in the intensity of overtones. The overtone intensity increases with the increase in the displacement of the equilibrium internuclear distance between the ground and excited intermediate states. Phonon–electron coupling by itself leads to the local distortion of the atoms in the lattice, especially when the long-range interaction of electrons and lattice occurs. In other words, changes in the energy separation between two electronic states, which occur due to distortion of the nuclei along a vibrational coordinate, may be related to electron−phonon coupling. In the presence of some lattice defects, the dissipation of electrons and phonons on these defects lead to the reduction in electron–phonon coupling. This means that in general, when the crystallinity of the material is not high enough, electron–phonon coupling should be small and there should be no overtones in the Raman spectra. Thus, the presence of the second-order overtone of the A1-LO mode caused by the phonon–electron coupling in our 3–7 nm ZnO NCs indicates the good crystallinity of pristine and doped ZnO NCs.
4. Conclusions
In this work, the structural and optical properties of pristine and RE-doped (RE = Nd, Gd, and Er) ZnO NCs produced using a soft chemical method were investigated. TEM measurements showed that the obtained NCs were predominantly of pseudospherical and hexagonal shape with a mean size of (7.4 ± 1.7) nm and changed insignificantly upon doping. The concentric rings from the selected area electron diffraction pattern revealed the nanocrystalline nature of the particles and confirmed the hexagonal wurtzite ZnO crystal structure with the specific lattice parameters a = 0.324 nm and c = 0.519 nm. XRF spectra confirmed the presence of RE elements in the examined NCs. The effect of RE doping on ZnO NCs upon synthesis in mild conditions deteriorated the excitonic emission, shifts, and broaden features in resonant Raman spectra, indicating an increase in the number of defects or/and reducing the crystal perfection of ZnO NCs, which is indirect evidence of RE incorporation. PL spectra revealed both excitonic and trap/surface-related PL bands at around 380 nm (near-band edge, NBE) and 550 nm (deep-level emission, DLE), respectively. Both bands were affected by RE doping with Nd, Gd and Er. The PL showed a “blue” shift for the RE-doped ZnO NCs compared to that of the pristine ZnO sample. This can be attributed to donor–acceptor recombination or to transition from the conduction band to oxygen antisites, as oxygen can act as energy trap centers that mediate energy transfer from the ZnO host material to the RE ions. Furthermore, the “red” shift in the absorption edge in the optical absorption spectra of the RE-doped ZnO samples indicated the narrowing of the bandgap originating from the formation of oxygen vacancies and additional energy levels from the impurity atoms introduced into the wurtzite ZnO lattice. The formation of oxygen vacancies also explained the defect-related peak in the PL spectra. The Raman analysis confirmed the wurtzite structure of RE-doped ZnO NCs. The good crystallinity of the ZnO NCs was proven by the presence of overtones of the main characteristic A1(LO) phonon mode in the Raman spectra. At the same time, two surface optical (SO) phonon modes, which were called A1-SO and E1-SO, confirmed the low size of the NCs. The observed downward shifting of the A1-LO mode for the ZnO NCs upon doping was explained by point defects, an increase in charge carrier concentration, and partially by a mass effect of heavy foreign atoms.
Supplementary Materials
The following supporting information can be downloaded at: https://www.mdpi.com/article/10.3390/photochem2030036/s1, Figure S1: (a,b) TEM overview and HRTEM image of Nd-doped ZnO NCs; (c) statistical distribution of ZnO:Nd NCs; (d) SAED pattern (wurtzite phase) of ZnO:Nd NCs; Figure S2: PL excitation (PLE) spectra for pristine and RE-doped ZnO NCs; Figure S3: A simplified model of the frequency shift upon doping with RE atoms; Table S1: Number of atoms per spherical ZnO NC of wurtzite phase.
Author Contributions
Conceptualization, M.T. and O.S.; methodology, O.S.; validation, D.R.T.Z. and A.P.; formal analysis, M.T., O.S. and Y.H.; investigation, M.T., O.S. and Y.H.; writing—original draft preparation, M.T.; writing—review and editing, O.S., Y.H. and D.R.T.Z.; funding acquisition, D.R.T.Z. All authors have read and agreed to the published version of the manuscript.
Funding
This research was funded by Deutsche Forschungsgemeinschaft (DFG Project ZA 146/45-1).
Data Availability Statement
The data presented in this study are available upon request from the corresponding author.
Acknowledgments
The work was partially supported by DFG (ZA 146/45-1). M.T. is grateful to Erasmus DAAD Program. Ye.H. is grateful to Alexander von Humboldt Foundation.
Conflicts of Interest
The authors declare no conflict of interest.
References
- Chou, H.-S.; Yang, K.-D.; Xiao, S.-H.; Patil, R.A.; Lai, C.-C.; Yeh, W.-C.V.; Ho, C.-H.; Liou, Y.; Ma, Y.-R. Temperature-dependent ultraviolet photoluminescence in hierarchical Zn, ZnO and ZnO/Zn nanostructures. Nanoscale 2019, 11, 13385–13396. [Google Scholar] [CrossRef]
- Singh, P.; Singh, R.K.; Kumar, R. Journey of ZnO quantum dots from undoped to rare-earth and transition metal-doped and their applications. RSC Adv. 2021, 11, 2512–2545. [Google Scholar] [CrossRef]
- Wood, A.; Giersig, M.; Hilgendorff, M.; Vilas-Campos, A.; Liz-Marzán, L.M.; Mulvaney, P. Size Effects in ZnO: The Cluster to Quantum Dot Transition. Aust. J. Chem. 2003, 56, 1051–1057. [Google Scholar] [CrossRef]
- Roduner, E. Size matters: Why nanomaterials are different. Chem. Soc. Rev. 2006, 35, 583–592. [Google Scholar] [CrossRef]
- Strano, V.; Greco, M.G.; Ciliberto, E.; Mirabella, S. ZnO microflowers grown by chemical bath deposition: A low-cost approach for massive production of functional nanostructures. Chemosensors. 2019, 7, 62. [Google Scholar] [CrossRef]
- Montenegro, D.N.; Hortelano, V.; Martínez, O.; Martínez-Tomas, M.C.; Sallet, V.; Muñoz-Sanjosé, V.; Jiménez, J. Influence of metal organic chemical vapour deposition growth conditions on vibrational and luminescent properties of ZnO nanorods. J. Appl. Phys. 2013, 113, 143513. [Google Scholar] [CrossRef]
- Schneider, L.; Halm, S.; Bacher, G.; Roy, A.; Kruis, F.E. Photoluminescence spectroscopy of single crystalline ZnO-nanoparticles from the gas phase. Phys. Status Solidi C 2006, 3, 1014–1017. [Google Scholar] [CrossRef]
- Reynolds, D.C.; Look, D.C.; Jogai, B. Fine structure on the green band in ZnO. J. Appl. Phys. 2001, 89, 6189–6191. [Google Scholar] [CrossRef]
- Zamiri, R.; Lemos, A.; Reblo, A.; Ahangar, H.A.; Ferreira, J. Effects of rare-earth (Er, La and Yb) doping on morphology and structure properties of ZnO nanostructures prepared by wet chemical method. Ceram. Int. 2014, 40, 523–529. [Google Scholar] [CrossRef]
- Liu, Y.; Luo, W.; Li, R.; Chen, X. Optical properties of Nd3+ ion-doped ZnO nanocrystals. J. Nanosci. Nanotechnol. 2010, 10, 1871–1876. [Google Scholar] [CrossRef]
- Ungureanu, M.; Schmidt, H.; von Wenckstern, H.; Hochmuth, H.; Lorenz, M.; Grundmann, M.; Fecioru-Morariu, M.; Güntherodt, G. A comparison between ZnO films doped with 3d and 4f magnetic ions. Thin Solid Film. 2007, 515, 8761–8763. [Google Scholar] [CrossRef]
- Goodall, J.B.M.; Illsley, D.; Lines, R.; Makwana, N.M.; Darr, J.A. Structure-property-composition relationships in doped zinc oxides: Enhanced photocatalytic activity with rare earth dopants. ACS Comb. Sci. 2015, 17, 100–112. [Google Scholar] [CrossRef]
- Wang, R.; Xin, J.H.; Yang, Y.; Liu, H.; Xu, L.; Hu, J. The characteristics and photocatalytic activities of silver doped ZnO nanocrystallites. Appl. Surf. Sci. 2004, 227, 312–317. [Google Scholar] [CrossRef]
- Dodd, A.; McKinley, A.; Tsuzuki, T.; Saunders, M. Tailoring the photocatalytic activity of nanoparticulate zinc oxide by transition metal oxide doping. Mater. Chem. Phys. 2009, 114, 382–386. [Google Scholar] [CrossRef]
- Cerrato, E.; Gionco, C.; Berruti, I.; Sordello, F.; Calza, P.; Paganini, M.C. Rare earth ions doped ZnO: Synthesis, characterization and preliminary photoactivity assessment. J. Solid State Chem. 2018, 264, 42–47. [Google Scholar] [CrossRef]
- Barui, S.; Gerbaldo, R.; Garino, N.; Brescia, R.; Laviano, F.; Cauda, V. Facile Chemical Synthesis of Doped ZnO Nanocrystals Exploiting Oleic Acid. Nanomaterials 2020, 10, 1150. [Google Scholar] [CrossRef]
- Erdoğan, E.; Yilmaz, M.; Aydogan, S.; Turgut, G. Investigation of neodymium rare earth element doping in spray-coated zinc oxide thin films. J. Mater. Sci. Mater. Electron. 2021, 32, 1379–1391. [Google Scholar] [CrossRef]
- Shukla, S.; Sharma, D.K. A review on rare earth (Ce and Er)-doped zinc oxide nanostructures. Mater. Today Proc. 2021, 34, 793–801. [Google Scholar] [CrossRef]
- FDA, Q3C-Tables and List Guidance for Industry Q3C-Tables and List Guidance for Industry Q3C-Tables and List Guidance for Industry 1. 2017. Available online: https://www.fda.gov/media/71737/download (accessed on 30 June 2022).
- Panasiuk, Y.V.; Raevskaya, O.E.; Stroyuk, O.; Kuchmiy, S.Y.; Dzhagan, V.; Hietschold, M.; Zahn, D.R. Colloidal ZnO nanocrystals in dimethylsulfoxide: A new synthesis, optical, photo- and electroluminescent properties. Nanotechnology 2014, 25, 75601. [Google Scholar] [CrossRef]
- Bomila, R.; Srinivasan, S.; Venkatesan, A.; Bharath, B.; Perinbam, K. Structural, optical and antibacterial activity studies of Ce-doped ZnO nanoparticles prepared by wet-chemical method. Mater. Res. Innov. 2018, 22, 379–386. [Google Scholar] [CrossRef]
- Roy, B.; Chakrabarty, S.; Mondal, O.; Pal, M.; Dutta, A. Effect of neodymium doping on structure, electrical and optical properties of nanocrystalline ZnO. Mater. Charact. 2012, 70, 1–7. [Google Scholar] [CrossRef]
- Kumar, S.; Sahare, P. Nd-doped ZnO as a multifunctional nanomaterial. J. Rare Earths 2012, 30, 761–768. [Google Scholar] [CrossRef]
- Dakhel, A.A.; El-Hilo, M. Ferromagnetic nanocrystalline Gd-doped ZnO powder synthesized by coprecipitation. J. Appl. Phys. 2010, 107, 123905. [Google Scholar] [CrossRef]
- X-ray Data Booklet. 2009. Available online: https://xdb.lbl.gov/ (accessed on 30 June 2022).
- Shannon, R.D. Revised effective ionic radii and systematic studies of interatomic distances in halides and chalcogenides. Acta Cryst. A 1976, 32, 751–767. [Google Scholar] [CrossRef]
- Barbagiovanni, E.G.; Reitano, R.; Franzò, G.; Strano, V.; Terrasi, A.; Mirabella, S. Radiative mechanism and surface modification of four visible deep level defect states in ZnO nanorods. Nanoscale 2016, 8, 995–1006. [Google Scholar] [CrossRef]
- Yang, J.; Wang, R.; Yang, L.; Lang, J.; Wei, M.; Gao, M.; Liu, X.; Cao, J.; Li, X.; Yang, N. Tunable deep-level emission in ZnO nanoparticles via yttrium doping. J. Alloy. Compd. 2011, 509, 3606–3612. [Google Scholar] [CrossRef]
- Honglin, L.; Yingbo, L.; Jinzhu, L.; Ke, Y. Experimental and first-principles studies of structural and optical properties of rare earth (RE = La, Er, Nd) doped ZnO. J. Alloy. Compd. 2014, 617, 102–107. [Google Scholar] [CrossRef]
- Kumar, S.; Sahare, P. Gd3+ incorporated ZnO nanoparticles: A versatile material. Mater. Res. Bull. 2014, 51, 217–223. [Google Scholar] [CrossRef]
- Hiller, D.; López-Vidrier, J.; Gutsch, S.; Zacharias, M.; Nomoto, K.; König, D. Defect-Induced Luminescence Quenching vs. Charge Carrier Generation of Phosphorus Incorporated in Silicon Nanocrystals as Function of Size. Sci. Rep. 2017, 7, 863. [Google Scholar] [CrossRef]
- Cajzl, J.; Nekvindova, P.; Jeníčková, K.; Jagerová, A.; Malinský, P.; Remeš, Z.; Neykova, N.; Chang, Y.; Oswald, J.; Kentsch, U.; et al. Erbium-ion implantation of single- and nano-crystalline ZnO. Nucl. Instrum. Methods Phys. Res. Sect. B Beam Interact. Mater. At. 2020, 464, 65–73. [Google Scholar] [CrossRef]
- Lang, J.; Zhang, Q.; Han, Q.; Fang, Y.; Wang, J.; Li, X.; Liu, Y.; Wang, D.; Yang, J. The study of structural and optical properties of (Eu, La, Sm) codoped ZnO nanoparticles via a chemical route. Mater. Chem. Phys. 2017, 194, 29–36. [Google Scholar] [CrossRef]
- Hastir, A.; Kohli, N.; Singh, R.C. Comparative study on gas sensing properties of rare earth (Tb, Dy and Er) doped ZnO sensor. J. Phys. Chem. Solids 2017, 105, 23–34. [Google Scholar] [CrossRef]
- Raji, R.; Gopchandran, K. ZnO nanostructures with tunable visible luminescence: Effects of kinetics of chemical reduction and annealing. J. Sci. Adv. Mater. Devices 2017, 2, 51–58. [Google Scholar] [CrossRef]
- Saboor, A.; Shah, S.M.; Hussain, H. Band gap tuning and applications of ZnO nanorods in hybrid solar cell: Ag-doped verses Nd-doped ZnO nanorods. Mater. Sci. Semicond. Process. 2019, 93, 215–225. [Google Scholar] [CrossRef]
- Zhang, L.; Yin, L.; Wang, C.; Lun, N.; Qi, Y.; Xiang, D. Origin of Visible Photoluminescence of ZnO Quantum Dots: Defect-Dependent and Size-Dependent. J. Phys. Chem. C 2010, 114, 9651–9658. [Google Scholar] [CrossRef]
- Xian, F.; Li, X. Effect of Nd doping level on optical and structural properties of ZnO:Nd thin films synthesized by the sol–gel route. Opt. Laser Technol. 2013, 45, 508–512. [Google Scholar] [CrossRef]
- Ahmad, I.; Akhtar, M.S.; Ahmed, E.; Ahmad, M.; Keller, V.; Khan, W.Q.; Khalid, N. Rare earth co-doped ZnO photocatalysts: Solution combustion synthesis and environmental applications. Sep. Purif. Technol. 2019, 237, 116328. [Google Scholar] [CrossRef]
- Layek, A.; Banerjee, S.; Manna, B.; Chowdhury, A. Synthesis of rare-earth doped ZnO nanorods and their defect–dopant correlated enhanced visible-orange luminescence. RSC Adv. 2016, 6, 35892–35900. [Google Scholar] [CrossRef]
- Babamoradi, M.; Sadeghi, H.; Azimirad, R.; Safa, S. Enhancing photoresponsivity of ultraviolet photodetectors based on ZnO/ZnO:Eu (x = 0, 0.2, 1, 5 and 20 at.%) core/shell nanorods. Optik 2018, 167, 88–94. [Google Scholar] [CrossRef]
- Mo, X.; Li, Z.; Liu, C.; Tao, X.; Zhou, Y.; Long, H.; Wang, H.; Ouyang, Y. Improving and manipulating green-light electroluminescence in solution-processed ZnO nanocrystals via Erbium doping. J. Lumin. 2019, 213, 127–132. [Google Scholar] [CrossRef]
- Ashkenov, N.; Mbenkum, B.N.; Bundesmann, C.; Riede, V.; Lorenz, M.; Spemann, D.; Kaidashev, E.M.; Kasic, A.; Schubert, M.; Grundmann, M.; et al. Infrared dielectric functions and phonon modes of high-quality ZnO films. J. Appl. Phys. 2003, 93, 126–133. [Google Scholar] [CrossRef]
- Ozgür, Ü.; Alivov, Y.I.; Liu, C.; Teke, A.; Reshchikov, M.A.; Doğan, S.; Avrutin, V.; Cho, S.-J.; Morkoç, H. A comprehensive review of ZnO materials and devices. J. Appl. Phys. 2005, 98, 041301. [Google Scholar] [CrossRef]
- Arguello, C.A.; Rousseau, D.L.; Porto, S.P.S. First-order raman effect in wurtzite-type crystals. Phys. Rev. (Ser. I) 1969, 181, 1351–1363. [Google Scholar] [CrossRef]
- Serrano, J.; Romero, A.H.; Manjón, F.J.; Lauck, R.; Cardona, M.; Rubio, A. Pressure dependence of the lattice dynamics of ZnO: An ab initio approach. Phys. Rev. B Condens. Matter Mater. Phys. Condens. Matter Mater. Phys. 2004, 69, 094306. [Google Scholar] [CrossRef]
- Wang, S.; Fan, Z.; Koster, R.S.; Fang, C.; van Huis, M.A.; Yalcin, A.O.; Tichelaar, F.D.; Zandbergen, H.W.; Vlugt, T.J.H. New ab initio based pair potential for accurate simulation of phase transitions in ZnO. J. Phys. Chem. C 2014, 118, 11050–11061. [Google Scholar] [CrossRef]
- Milekhin, A.G.; Yeryukov, N.A.; Sveshnikova, L.L.; Duda, T.A.; Zenkevich, E.I.; Kosolobov, S.S.; Latyshev, A.V.; Himcinski, C.; Surovtsev, N.V.; Adichtchev, S.V.; et al. Surface enhanced Raman scattering of light by ZnO nanostructures. J. Exp. Theor. Phys. 2011, 113, 983–991. [Google Scholar] [CrossRef][Green Version]
- Vinogradov, V.S.; Dzhagan, V.N.; Zavaritskaya, T.N.; Kucherenko, I.V.; Mel’Nik, N.N.; Novikova, N.N.; Janik, E.; Wojtowicz, T.; Plyashechnik, O.S.; Zahn, D.R.T. Optical phonons in the bulk and on the surface of ZnO and ZnTe/ZnO nanowires in Raman spectra. Phys. Solid State 2012, 54, 2083–2090. [Google Scholar] [CrossRef]
- Cuscó, R.; Alarcón-Lladó, E.; Ibáñez, J.; Artús, L.; Jiménez, J.; Wang, B.; Callahan, M.J. Temperature dependence of Raman scattering in ZnO. Phys. Rev. B Condens. Matter Mater. Phys. 2007, 75, 165202. [Google Scholar] [CrossRef]
- Milekhin, A.; Sveshnikova, L.; Duda, T.; Surovtsev, N.; Adichtchev, S.; Zahn, D. Optical Phonons in Nanoclusters Formed by the Langmuir-Blodgett Technique. Chin. J. Phys. 2011, 49, 63–70. [Google Scholar]
- Liu, H.F.; Tripathy, S.; Hu, G.X.; Gong, H. Surface optical phonon and A1(LO) in ZnO submicron crystals probed by Raman scattering: Effects of morphology and dielectric coating. J. Appl. Phys. 2009, 105, 53507. [Google Scholar] [CrossRef]
- Dzhagan, V.M.; Azhniuk, Y.M.; Milekhin, A.G.; Zahn, D.R.T. Vibrational spectroscopy of compound semiconductor nanocrystals. J. Phys. D: Appl. Phys. 2018, 51, 50. [Google Scholar] [CrossRef]
- Dzhagan, V.M.; Valakh, M.Y.; Milekhin, A.G.; Yeryukov, N.A.; Zahn, D.R.; Cassette, E.; Pons, T.; Dubertret, B. Raman-and IR-active phonons in CdSe/CdS core/shell nanocrystals in the presence of interface alloying and strain. J. Phys. Chem. C 2013, 117, 18225–18233. [Google Scholar] [CrossRef]
- Alim, K.A.; Fonoberov, V.A.; Shamsa, M.; Balandin, A.A. Micro-Raman investigation of optical phonons in ZnO nanocrystals. J. Appl. Phys. 2005, 97, 124313. [Google Scholar] [CrossRef]
- Mao, Z.; Fu, C.; Pan, X.; Chen, X.; He, H.; Wang, W.; Zeng, Y.; Ye, Z. Raman-based measurement of carrier concentration in n-type ZnO thin films under resonant conditions. Phys. Lett. A 2020, 384, 126148. [Google Scholar] [CrossRef]
- Barker, J.A.S.; Sievers, A.J. Optical studies of the vibrational properties of disordered solids. Rev. Mod. Phys. 1975, 47, S1–S179. [Google Scholar] [CrossRef]
- Cheng, H.-M.; Lin, K.-F.; Hsu, H.-C.; Lin, C.-J.; Lin, A.L.-J.; Hsieh, W.-F. Enhanced Resonant Raman Scattering and Electron−Phonon Coupling from Self-Assembled Secondary ZnO Nanoparticles. J. Phys. Chem. B 2005, 109, 18385–18390. [Google Scholar] [CrossRef]
- Yoshikawa, M.; Inoue, K.; Nakagawa, T.; Ishida, H.; Hasuike, N.; Harima, H. Characterization of ZnO nanoparticles by resonant Raman scattering and cathodoluminescence spectroscopies. Appl. Phys. Lett. 2008, 92, 113115. [Google Scholar] [CrossRef]
- Fonoberov, V.A.; Balandin, A.A. Interface and confined optical phonons in wurtzite nanocrystals. Phys. Rev. B Condens. Matter Mater. Phys. 2004, 70, 233205. [Google Scholar] [CrossRef]
- Yang, C.C.; Li, S. Size-Dependent Raman Red Shifts of Semiconductor Nanocrystals. J. Phys. Chem. B 2008, 112, 14193–14197. [Google Scholar] [CrossRef]
- Korepanov, V.I.; Chan, S.-Y.; Hsu, H.-C.; Hamaguchi, H.-O. Phonon confinement and size effect in Raman spectra of ZnO nanoparticles. Heliyon 2019, 5, e01222. [Google Scholar] [CrossRef]
- Martin, R.M.; Varma, C.M. Cascade Theory of Inelastic Scattering of Light. Phys. Rev. Lett. 1971, 26, 1241. [Google Scholar] [CrossRef]
- Geurts, J. Crystal structure, chemical binding, and lattice properties. In Springer Series in Materials Science; Springer: Berlin/Heidelberg, Germany, 2010; Volume 120, pp. 7–37. [Google Scholar] [CrossRef]
- Singh, C.; Rath, S. Spectroscopic ellipsometry and multiphonon Raman spectroscopic study of excitonic effects in ZnO films. J. Appl. Phys. 2013, 113, 163104. [Google Scholar] [CrossRef]


Publisher’s Note: MDPI stays neutral with regard to jurisdictional claims in published maps and institutional affiliations. |
© 2022 by the authors. Licensee MDPI, Basel, Switzerland. This article is an open access article distributed under the terms and conditions of the Creative Commons Attribution (CC BY) license (https://creativecommons.org/licenses/by/4.0/).