Article

Spectral Optical Properties of Rabbit Brain Cortex between 200 and 1000 nm

by
Tânia M. Gonçalves
1,
Inês S. Martins
1,2,
Hugo F. Silva
1,2,
Valery V. Tuchin
3,4,5 and
Luís M. Oliveira
1,2,*
1
Physics Department, School of Engineering, Polytechnic Institute of Porto, Rua Dr. António Bernardino de Almeida 431, 4249-015 Porto, Portugal
2
Center of Innovation in Engineering and Industrial Technology, ISEP, Rua Dr. António Bernardino de Almeida 431, 4249-015 Porto, Portugal
3
Science Medical Center, Saratov State University, 83 Astrakhanskaya Str., 410012 Saratov, Russia
4
Interdisciplinary Laboratory of Biophotonics, National Research Tomsk State University, 36 Lenin’s av., 634050 Tomsk, Russia
5
Laboratory of Laser Diagnostics of Technical and Living Systems, Institute of Precision Mechanics and Control Institute of the Russian Academy of Sciences, 24 Rabochaya Str., 410028 Saratov, Russia
*
Author to whom correspondence should be addressed.
Photochem 2021, 1(2), 190-208; https://doi.org/10.3390/photochem1020011
Submission received: 25 June 2021 / Revised: 7 August 2021 / Accepted: 9 August 2021 / Published: 11 August 2021
(This article belongs to the Special Issue Feature Papers in Photochemistry)

Abstract

:
The knowledge of the optical properties of biological tissues in a wide spectral range is highly important for the development of noninvasive diagnostic or treatment procedures. The absorption coefficient is one of those properties, from which various information about tissue components can be retrieved. Using transmittance and reflectance spectral measurements acquired from ex vivo rabbit brain cortex samples allowed to calculate its optical properties in the ultraviolet to the near infrared spectral range. Melanin and lipofuscin, the two pigments that are related to the aging of tissues and cells were identified in the cortex absorption. By subtracting the absorption of these pigments from the absorption of the brain cortex, it was possible to evaluate the true ratios for the DNA/RNA and hemoglobin bands in the cortex—12.33-fold (at 260 nm), 12.02-fold (at 411 nm) and 4.47-fold (at 555 nm). Since melanin and lipofuscin accumulation increases with the aging of the brain tissues and are related to the degeneration of neurons and their death, further studies should be performed to evaluate the evolution of pigment accumulation in the brain, so that new optical methods can be developed to aid in the diagnosis and monitoring of brain diseases.

1. Introduction

The optical properties of biological tissues are unique to those tissues and provide means for their identification. The estimation of their wavelength dependence allows the identification of biological components in tissues and the discrimination of pathologies [1]. There are various optical properties, but the most commonly used to characterize a biological tissue are the refractive index (RI), the absorption coefficient (µa), the scattering coefficient (µs) or the reduced scattering coefficient (µ′s) and the scattering anisotropy ( g ) [2,3]. The estimation of tissue’s optical properties is traditionally made using inverse simulations based on the Monte Carlo or the Adding–Doubling algorithms [3,4,5]. Due to the fact that such simulations estimate a set of optical properties for a single wavelength at a time, they are time consuming if we want to obtain such properties for a broad spectral range.
Although some diagnostic or treatment windows have been previously identified in the visible and infrared range of the electromagnetic spectrum [6,7], current biophotonics techniques can be applied within different spectral bands from the deep ultraviolet to the terahertz [8]. This means that a fast way to obtain the optical properties of a tissue for a wide spectral range is necessary. As recently published [1,9], if some spectral measurements from the tissue samples are available, certain equations can be used for a fast calculation of such properties. If the absorption properties of a tissue are considerably higher than its scattering properties, the Bouguer–Beer–Lambert law can be used to describe such an absorption-dominated medium [10]:
I ( λ ) = I 0 ( λ ) e A ( λ ) ,
where A(λ) is the absorbance of the tissue as a function of wavelength, λ, which is defined as:
A ( λ ) = l n ( I ( λ ) I 0 ( λ ) ) = μ a ( λ ) × d ,
with I0(λ) representing the excitation light intensity, I(λ) representing the transmitted light intensity and d the sample thickness [10]. This equation can be used to calculate µa(λ) from the measured transmittance spectrum.
For any slab-form tissue sample that is irradiated by a light beam of intensity I0(λ), three optical phenomena will occur [2]: transmittance, reflectance and absorbance. If we can measure the total transmittance (Tt) and total reflectance (Rt) spectra from such a sample, its A(λ) can be calculated using the following relation [1,9]:
T t ( λ ) + R t ( λ ) + A ( λ ) = 1 .
Equation (3) can be used to calculate A(λ) for any sample that contains major absorption, major scattering, or a combination of absorption and scattering properties. When combining Equations (2) and (3), it is possible to calculate µa(λ) from such Tt and Rt spectra that were measured from a tissue slab sample [1]:
μ a ( λ ) = 1 [ T t ( λ ) + R t ( λ ) ] d ,
where Tt(λ) and Rt(λ) are represented as ratios of total intensity of transmitted and reflected light measured with the corresponding integrating spheres to intensity of the incident light I0(λ), respectively; µa(λ) is calculated in cm−1 (or mm−1), depending on the units used to measure d (cm or mm).
Since biological tissues are dominated by light scattering properties, once µa(λ) is calculated with Equation (4), and if collimated transmittance (Tc) spectra from the tissue are available, then the following form of the Bouguer–Beer–Lambert law can be used to calculate µs(λ) for the same wavelength range [1,2,3]:
μ s ( λ ) = l n [ T c ( λ ) ] d μ a ( λ ) .
Spectral measurements do not usually allow to obtain µ′s directly, but since its wavelength dependence is well described for the ultraviolet-near infrared (UV-NIR), discrete values can be estimated for that spectral range through inverse adding-doubling (IAD) simulations, and then fitted with a curve as described by Equation (6) [11].
μ s ( λ ) = a × ( f Ray × ( λ 500   nm ) 4 + ( 1 f Ray ) × ( λ 500   nm ) b Mie )
In Equation (6), a represents the value of µ′s at 500 nm, fRay is the Rayleigh scattering fraction and bMie is the mean size of the Mie scatterers. These parameters can be obtained when the discrete µ′s values that were generated through IAD are fitted with Equation (6). When performing the IAD estimations to obtain the discrete µ′s values, the RI of the tissue (ntissue) at the desired wavelengths is necessary. In general, the RI of tissues is measured at discrete wavelengths with multi-wavelength refractometers [12], or using the total internal reflection method with various lasers with emission within the desired wavelength range [13]. Once those RI values are measured, the tissue dispersion for that wavelength range is calculated by fitting the experimental RI data with equations such as the Cauchy (Equation (7)), the Conrady (Equation (8)) or the Cornu (Equation (9)) equations [13,14,15]:
n tissue ( λ ) = A + B λ 2 + C λ 4 ,
n tissue ( λ ) = A + B λ + C λ 3.5 ,
n tissue ( λ ) = A + B ( λ C ) ,
where, A, B and C are the Cauchy, the Conrady or the Cornu parameters, which are obtained during the fitting of discrete experimental data. If the calculated tissue dispersion is not available for the entire wavelength range of interest, a broader dispersion can be calculated from µa(λ), using the Kramers–Kronig relations, which were developed for non-scattering materials [16]. In this calculation process, Equation (10) is the first one to be used to obtain the imaginary part of tissue dispersion (κ(λ)) [13,16]:
κ ( λ ) = λ 4 π μ a ( λ ) .
After obtaining κ(λ), the dispersion that corresponds to the real part of RI can be calculated with Equation (11) [13,16,17]:
n tissue ( λ ) = 1 + 2 π 0 λ 1 Λ × λ 1 Λ 2 λ 1 2 κ ( Λ ) d Λ ,
where Λ represents the integrating variable over the wavelength domain and λ1 is a fixed wavelength that can be adjusted for better vertical matching of the calculated dispersion to the one obtained from discrete experimental data.
Once the broad-band tissue dispersion is calculated through Equations (10) and (11), we can select discrete values from it to use in the IAD simulations. By running those simulations, the generated µ′s values are then fitted with Equation (6) to obtain µ′s(λ). Such spectrum can be combined with the µs spectrum that was calculated with Equation (5) to obtain the wavelength dependence of tissue scattering anisotropy ( g ( λ ) ) [1,2,3,18]:
g ( λ ) = 1 μ s ( λ ) μ s ( λ ) .
In general, g ( λ ) presents an increasing exponential behavior with increasing wavelength in the UV-NIR range [1], which can be described mathematically by Equation (13) [18] or Equation (14) [19].
g ( λ ) = a + b [ 1 e x p ( λ c d ) ] ,
g ( λ ) = a × e x p ( b × λ ) + c × e x p ( d × λ ) ,
where a, b, c and d are parameters that are obtained during the fitting of g data.
Such calculation procedure, which relies only on IAD simulations to obtain discrete µ′s values, is a fast way to obtain the wavelength dependency for the optical properties of a biological tissue, provided that spectral measurements from the tissue are available. A particular analysis of the calculated spectral optical properties provides information about tissue composition, contents of its biological chromophores and possibly indication of pathologies, as previously observed [1,20].
The brain is a complex organ, composed by different parts like the cortex and the cerebellum. The brain functions are complex and the incidence of brain diseases, such as Alzheimer, Parkinson or stroke have increased significantly in the past 30 years [21]. Such diseases occur as a natural consequence of the aging process, and are principally due to the degeneration and death of neurons [22,23,24]. A monitoring procedure to evaluate neuron aging, degeneration and death would be helpful to prevent these diseases. To develop such procedure with optical methods, the knowledge of the optical properties of the brain tissues is necessary. Only by knowing the spectral optical properties in a wide spectral range it will be possible to develop optimized optical imaging and spectroscopic methods to evaluate the health of superficial brain tissues, or to develop in-depth monitoring procedures with the combination of optical clearing treatments [2,25,26]. With the objective of obtaining the spectral optical properties of the brain cortex, we performed spectral measurements from ex vivo rabbit tissues. The methodology used in this study is described in Section 2 and the results are presented in Section 3.

2. Materials and Methods

The present study involves measurements from ex vivo animal tissues. The research follows the Declaration of Helsinki and was approved by the research review board in biomedical engineering of the Center of Innovation in Engineering and Industrial Technology (CIETI), in Porto, Portugal. Such approval has the number CIETI/Biomed_Research_2021_01.
In this study, brain cortex samples from recently sacrificed rabbits were prepared to conduct the experimental measurements. Such experimental studies consisted on RI measurements at discrete wavelengths and spectral measurements to calculate the optical properties between the UV and the NIR. Section 2.1 describes the tissue collection and preparation procedure, Section 2.2 describes the setup and measuring procedure used to obtain the discrete RI values and Section 2.3 describes the setups and measuring procedures to acquire the spectral measurements. Section 2.4 describes the calculations made to obtain tissue dispersion and the spectral optical properties of the brain cortex.

2.1. Tissue Collection and Sample Preparation

Five adult rabbits were acquired from a local breader that sells them for consumption. The animals were sacrificed on different days and the brain from each one was frozen for 12 h after dissecting it from within the skull. A cryostat (LeicaTM, Wetzlar, Germany, model CM1860 UV) was used to prepare tissue slices from the brain cortex. For the RI measurements, three samples were prepared in the cryostat with 3 mm thickness and an approximated square superficial area of about 1 cm × 1 cm. For the spectral measurements, ten samples were prepared with 0.5 mm thickness and an approximated circular form (~1 cm in diameter).

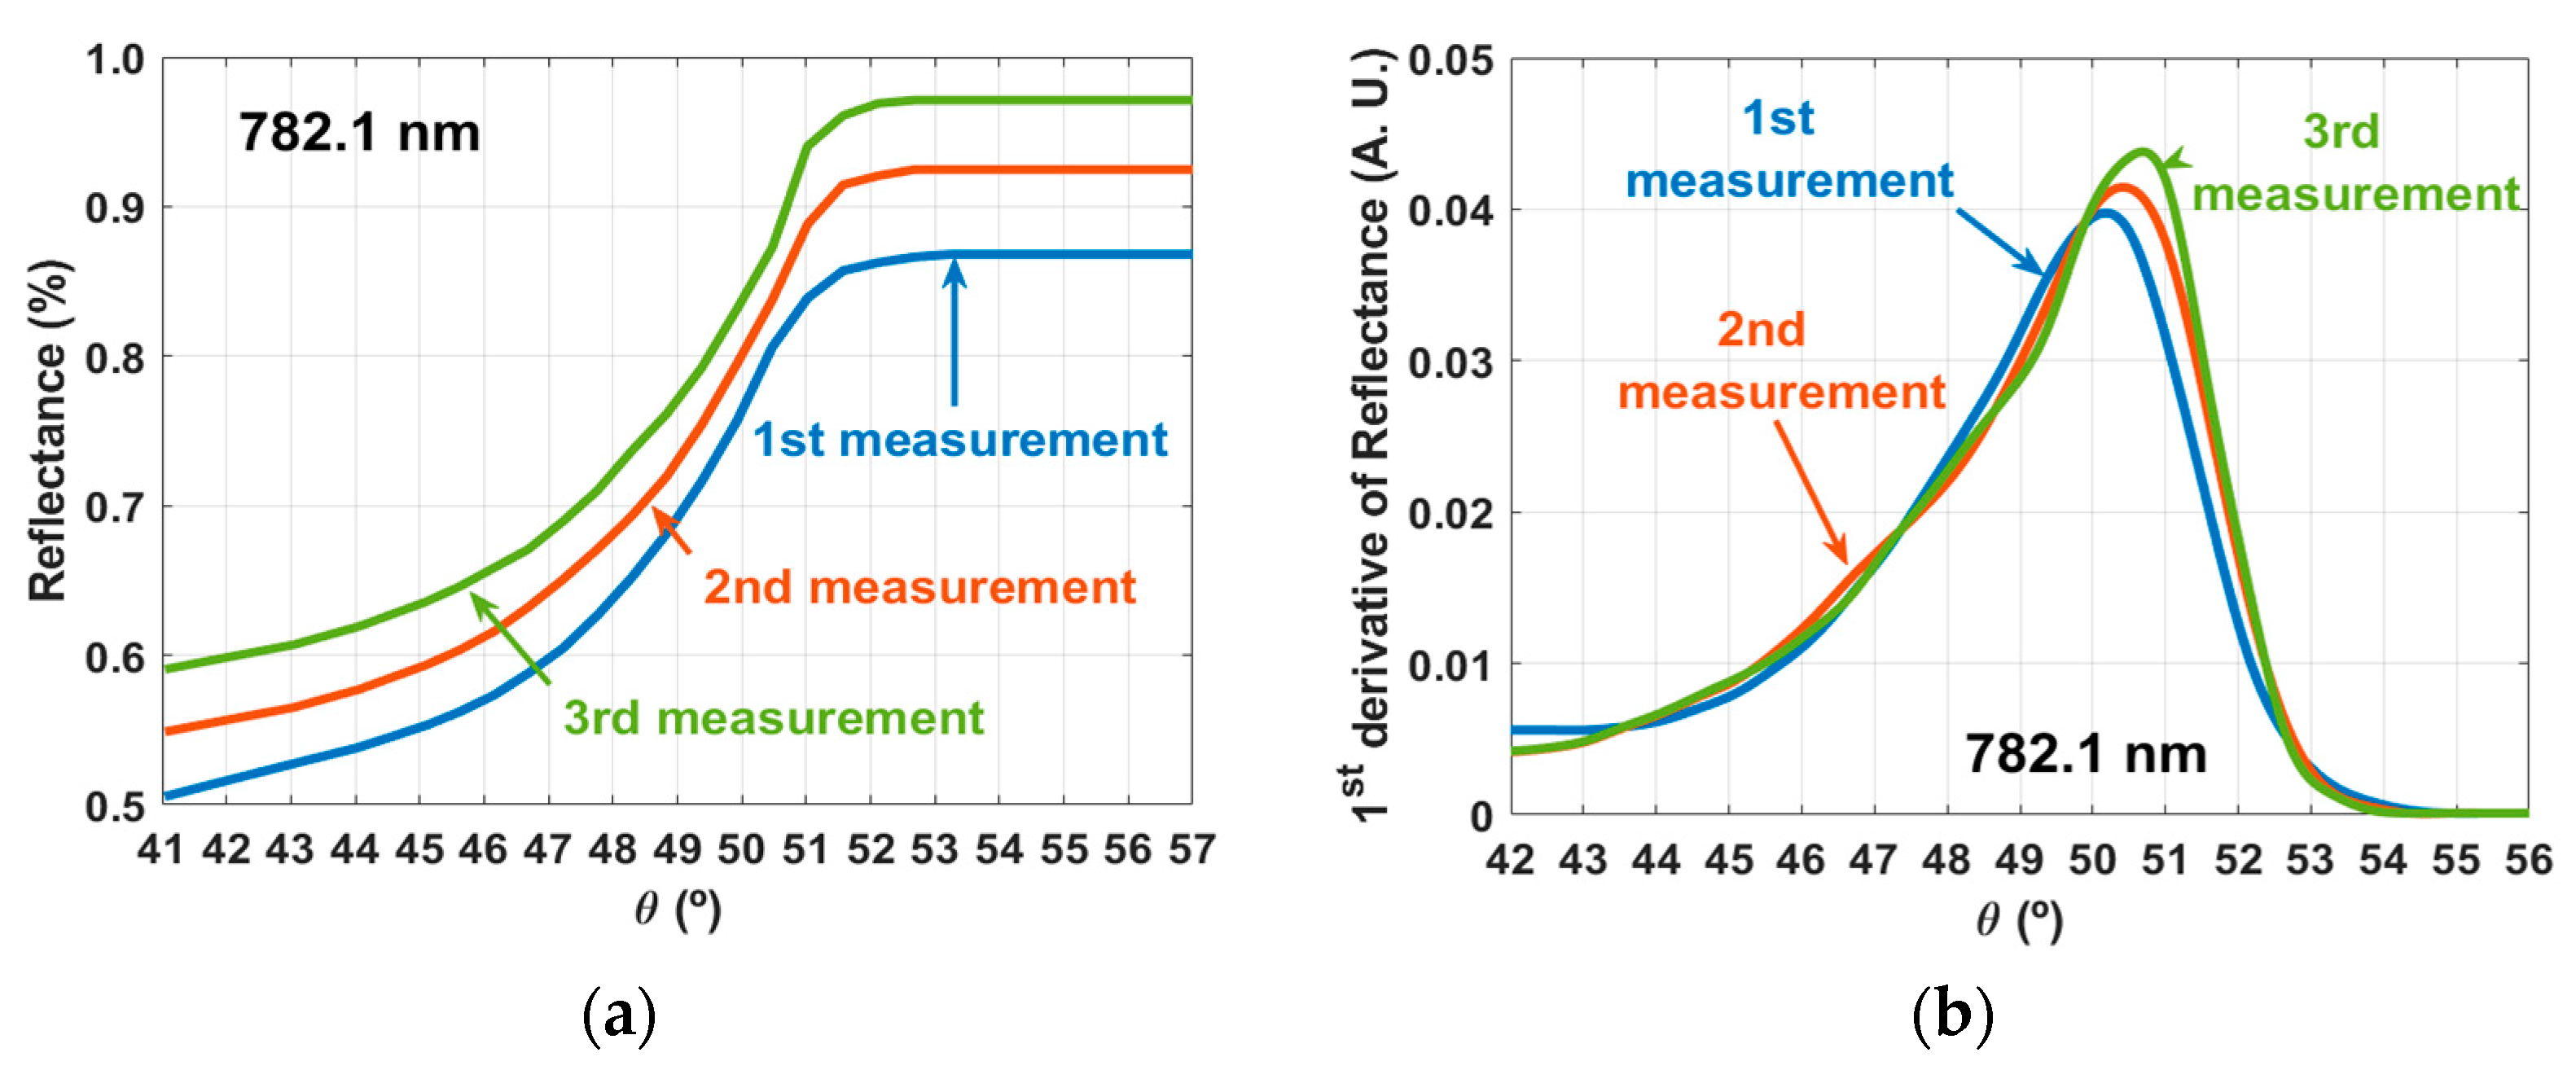
2.2. RI Measurements

To perform the RI measurements, the total internal reflection method was used [13,27,28,29]. The setup used for these measurements was constructed in our lab and is represented in Figure 1.
To obtain the RI values of the cortex at discrete wavelengths in the visible and NIR range, each of the three tissue samples that were prepared for this purpose was submitted to measurements with different lasers in the setup presented in Figure 1. The lasers used in these measurements had emission wavelengths at 401.4, 534.6, 626.6, 782.1, 820.8 and 850.7 nm. These lasers are laser diodes that were acquired from Edmund Optics, with the exception of the lasers that emit at 534.6 nm and at 626.6 nm, which were acquired from Kvant (Bratislava, Slovakia) and from Pasco (Roseville, CA, USA), respectively. The emmiting power of all lasers was 5 mW or less and their emmiting wavelengths were verified with a spectrometer from Avantes (Apeldoorn, Netherlands).
The dispersion prism presented in Figure 1 is a SCHOTT N-SF11 prism acquired from Edmund Optics, with an RI dependence on wavelength, as presented in Figure 2.
The curve represented in Figure 2 is described by the Sellmeier equation [30], at 20 °C:
n prism 2 1 = K 1 λ 2 λ 2 L 1 + K 2 λ 2 λ 2 L 2 + K 3 λ 2 λ 2 L 3 ,
where the Sellmeier coefficients have the following values for the SCHOTT N-SF11 glass: K1 = 1.7376, K2 = 0.3137, K3 = 1.8988, L1 = 0.0132, L2 = 0.023, and L3 = 155.2363. Acording to Ref. [30], since λ is represented in µm in Equation (15), K1, K2 and K3 are dimentionless coefficients, while L1, L2 and L3 are represented in µm2. Three sets of measurements were made with each laser, one set per tissue sample. Temperature was kept at 20 ± 1 °C and the following procedure was followed for each set of measurements:
  • The sample was placed in perfect contact with the base of the prism (see Figure 1).
  • Illumination of the setup was made with the laser beam through one side of the prism.
  • The reflected beam was collected with a photocell (a laser power meter from Coherent with spectral resolution from 0.15 μm to 11 μm), connected to a voltmeter (from Wavetek Meterman) to read the electrical potential.
  • This measuring procedure was repeated for several incidence angles (α) between the incident laser beam and the normal to the air/prism interface. The angular resolution for these measurements was 1°.
Such procedure was repeated for the other lasers. To obtain the RI of the brain cortex at the laser wavelengths, the collected data from each set of measurements needed to be submitted to calculations, which are described in Section 2.4.

2.3. Spectral Measurements

To perform the spectral measurements, which are necessary to calculate the spectral optical properties of the brain cortex, ten ex vivo tissue samples were used. All these samples were sequentially submitted to measurements with the setups presented in Figure 3 to acquire Tt(λ), Rt(λ) and Tc(λ).
In the measurements with the Tt setup, a collimated beam 6 mm in diameter from a Xenon lamp crosses the sample before entering the integrating sphere. The transmitted beam undergoes several reflections and integration inside the sphere, before being delivered to the spectrophotometer through an optical fiber cable. The Rt setup is similar to the one used to acquire Tt, but the beam from the lamp interacts with the tissue sample in a reflection mode. Such beam enters the integrating sphere at 8° with the vertical axis of the sphere. The reflected beam that leaves the tissue sample is reflected and integrated inside the sphere before being delivered to the spectrophotometer. In the case of Tc measurements, a beam from a deuterium-halogen lamp is delivered to the lower part of the sample cuvette through an optical fiber cable, a collimating lens and a pinhole, which collimate the beam and reduce its diameter to 1 mm. The unscattered transmitted beam is collected by another collimating lens into another optical fiber cable to be delivered to the spectrophotometer. Once ten spectra were collected from the brain cortex samples with all the setups presented in Figure 3, calculations, as described in Section 2.4, were performed to obtain the wavelength dependence of the optical properties of this tissue.

2.4. Calculations

After ending all experimental measurements, certain calculations were necessary to obtain the spectral optical properties of the brain cortex.
Regarding the RI measurements, and since the incident and reflected angles for the beam can only be measured outside the prism, at the air/prism interfaces, we needed to use the Snell–Descartes equation to convert the angle of the incident (or reflected) beam as measured outside the prism (α) to the incident (or reflected) angle at the prism/tissue interface (θ) [13,31]:
θ = β a r c s i n [ 1 n prism × s i n ( α ) ] ,
where β represents the internal angle of the prism (60° for the prism we used) and nprism represents the RI of the prism at the wavelength of the laser, which can be retrieved from Figure 2. To calculate the reflectance curve at the prism/tissue interface for each set of measurements, we performed the following calculation [13,15]:
R ( θ ) = V ( θ ) V noise V laser V noise ,
with V(θ) representing the electrical potential measured for an incident (or reflected) angle θ at the prism/tissue interface, Vnoise representing the potential measured with only background light and Vlaser representing the potential measured directly from the laser.
The reflectance curves obtained from each set of measurements, as calculated with Equation (17), contain information about the critical angle of reflection, but to obtain such angle with precision, the first derivative of each curve needed to be calculated. Such calculation was made according to [13,15]:
d e r i v ( θ ) = R ( θ i ) R ( θ i 1 ) θ i θ i 1 ,
where θi and θi−1 represent the consecutive angles of measurement and R(θi) and R(θi−1) represent the corresponding reflectances measured at those angles. As previously observed in other studies [13,32,33], those derivatives present a strong peak, whose central angle corresponds to the critical angle of reflection (θc) at the prism/tissue interface.
For each set of measurements with a particular laser, by representing the curve for the first derivative of the reflectance as a function of the angle θ, we could identify the value of θc, which was then used in Equation (19) to calculate the RI of the tissue at the laser wavelength [13,14].
n tissue ( λ ) = n p r i s m ( λ ) × sin ( θ c ) .
In Equation (19), ntissue(λ) represents the RI of the tissue at the laser wavelength and nprism(λ) represents the RI of the prism at the same wavelength as retrieved from Figure 2. Three sets of measurements were performed with each laser, meaning that three ntissue values were obtained for each laser wavelength. The mean and standard deviation (SD) for the tissue RI were calculated for each laser wavelength to provide higher accuracy and data dispersion between the samples analyzed. The mean RI values of the rabbit cortex were fitted with Equations (7)–(9) to check which one provides a better fitting. It was verified that the Cauchy equation (Equation (7)) provides the best fit (R2 = 0.9793) within the wavelength range of the lasers used (400–850 nm). When performing that fit, we obtained the A, B and C parameters indicated in Equation (7), as represented next:
n tissue ( λ ) = 1.353 + 5420 λ 2 + 0.3521 λ 4 .
All graphs that result from these calculations are presented in Section 3.
Considering the spectral measurements, the first calculation was made with Equation (4) to obtain μa(λ). Such calculation was made ten times, using the ten pairs of Tt and Rt spectra that were measured from the samples, resulting in mean and SD for μa(λ).
To obtain the real part of the RI for the cortex as a function of wavelength, the ten μa spectra were first used in Equation (10) to calculate ten κ(λ). The resulting imaginary dispersions were then used in Equation (11), which through adjustment of the λ1 parameter allowed obtaining the real part of the RI for the cortex with optimized vertical matching to the curve described by Equation (20). Since ten ntissue dispersions were obtained in this calculation, mean and SD data were calculated between 200 and 1000 nm.
After calculating μa(λ) and ntissue(λ) for the cortex, calculations were performed with Equation (5) to obtain the mean and SD for μs(λ). To obtain μ′s(λ), ten IAD simulations with data from each individual sample were made at discrete wavelengths, with 50 nm increments between 200 and 1000 nm. For each of the ten sets of simulations (with data from a particular sample), the resulting μ′s values were fitted by a curve described by Equation (6) to obtain its wavelength dependence. Ten calculated curves were used to obtain the mean and SD for μ′s(λ).
Using the calculated values of μs(λ) and μ′s(λ) in Equation (12), mean and SD of g ( λ ) were obtained. Finally, using the individual μa and μ′s spectra in Equation (21) [2,34], the mean and SD of light penetration depth in diffusion approximation (δ(λ)) was obtained for the cortex:
δ ( λ ) = 1 3 μ a ( λ ) ( μ a ( λ ) + μ s ( λ ) ) .
All the results from these calculations are presented in Section 3.

3. Results

3.1. RI Measurements

As a result of the calculations described in Section 2.4, which are necessary to obtain the RI of the cortex, the first step consisted on obtaining the reflectance curves for each set of measurements with a particular laser. The second step consisted on calculating the 1st derivative curves of those reflectance curves. The reflectance curves were calculated for each set of measurements with Equation (17) and the 1st derivative curves were obtained with Equation (18). Figure 4 presents such results for the 782.1 nm laser.
Similar curves to the ones presented in panels of Figure 4 were calculated for the measurements with the other lasers. The θc values were retrieved from the curves in Figure 4b and others like those that were obtained for the other lasers. These θc values were used in Equation (19) to calculate the corresponding RI values of the brain cortex at the laser wavelengths. Table 1 presents the results of these calculations, their mean and SD.
As indicated in Section 2.4, the mean RI values presented in Table 1 were submitted to fitting tests to check which of the curves described by Equations (7)–(9) provided a better dispersion curve. In these tests we verified that the best fitting was obtained with the Cauchy equation (Equation (7)). Equation (20), which is represented in Figure 5 along with the mean experimental RI values and the SD bars, describes such calculated dispersion for the rabbit brain cortex.
To compare our experimental data with other data for the brain cortex in literature and to use it later in the calculation of the cortex dispersion in the spectral range between 200 and 1000 nm from μa(λ), we extended the curve in Figure 5 to a lower wavelength of 200 nm and to a longer wavelength of 1200 nm. Ref. [35] indicates that the RI of human grey matter (cortex included) is 1.36 for the 456–1064 nm range. In our case and considering the same spectral range, we see that the rabbit brain cortex presents RI values between 1.35 and 1.38. On the other hand, it was reported by the authors of Ref. [36] that the rat brain cortex presents a RI of 1.3526 at 1100 ± 100 nm, and from our curve, we see that it is 1.3520 in that range. Authors of Ref. [37] reported that the cortex in rat brain presents an average RI value of 1.369, but no reference wavelength has been indicated for this value. We have obtained that value near 600 nm.
Considering that our experimental measurements to obtain the RI of rabbit brain cortex are accurate and also assuming that the calculated dispersion is valid outside the spectral range that corresponds to our measurements, we will now present the spectral measurements and calculations to obtain the spectral optical properties for this tissue.

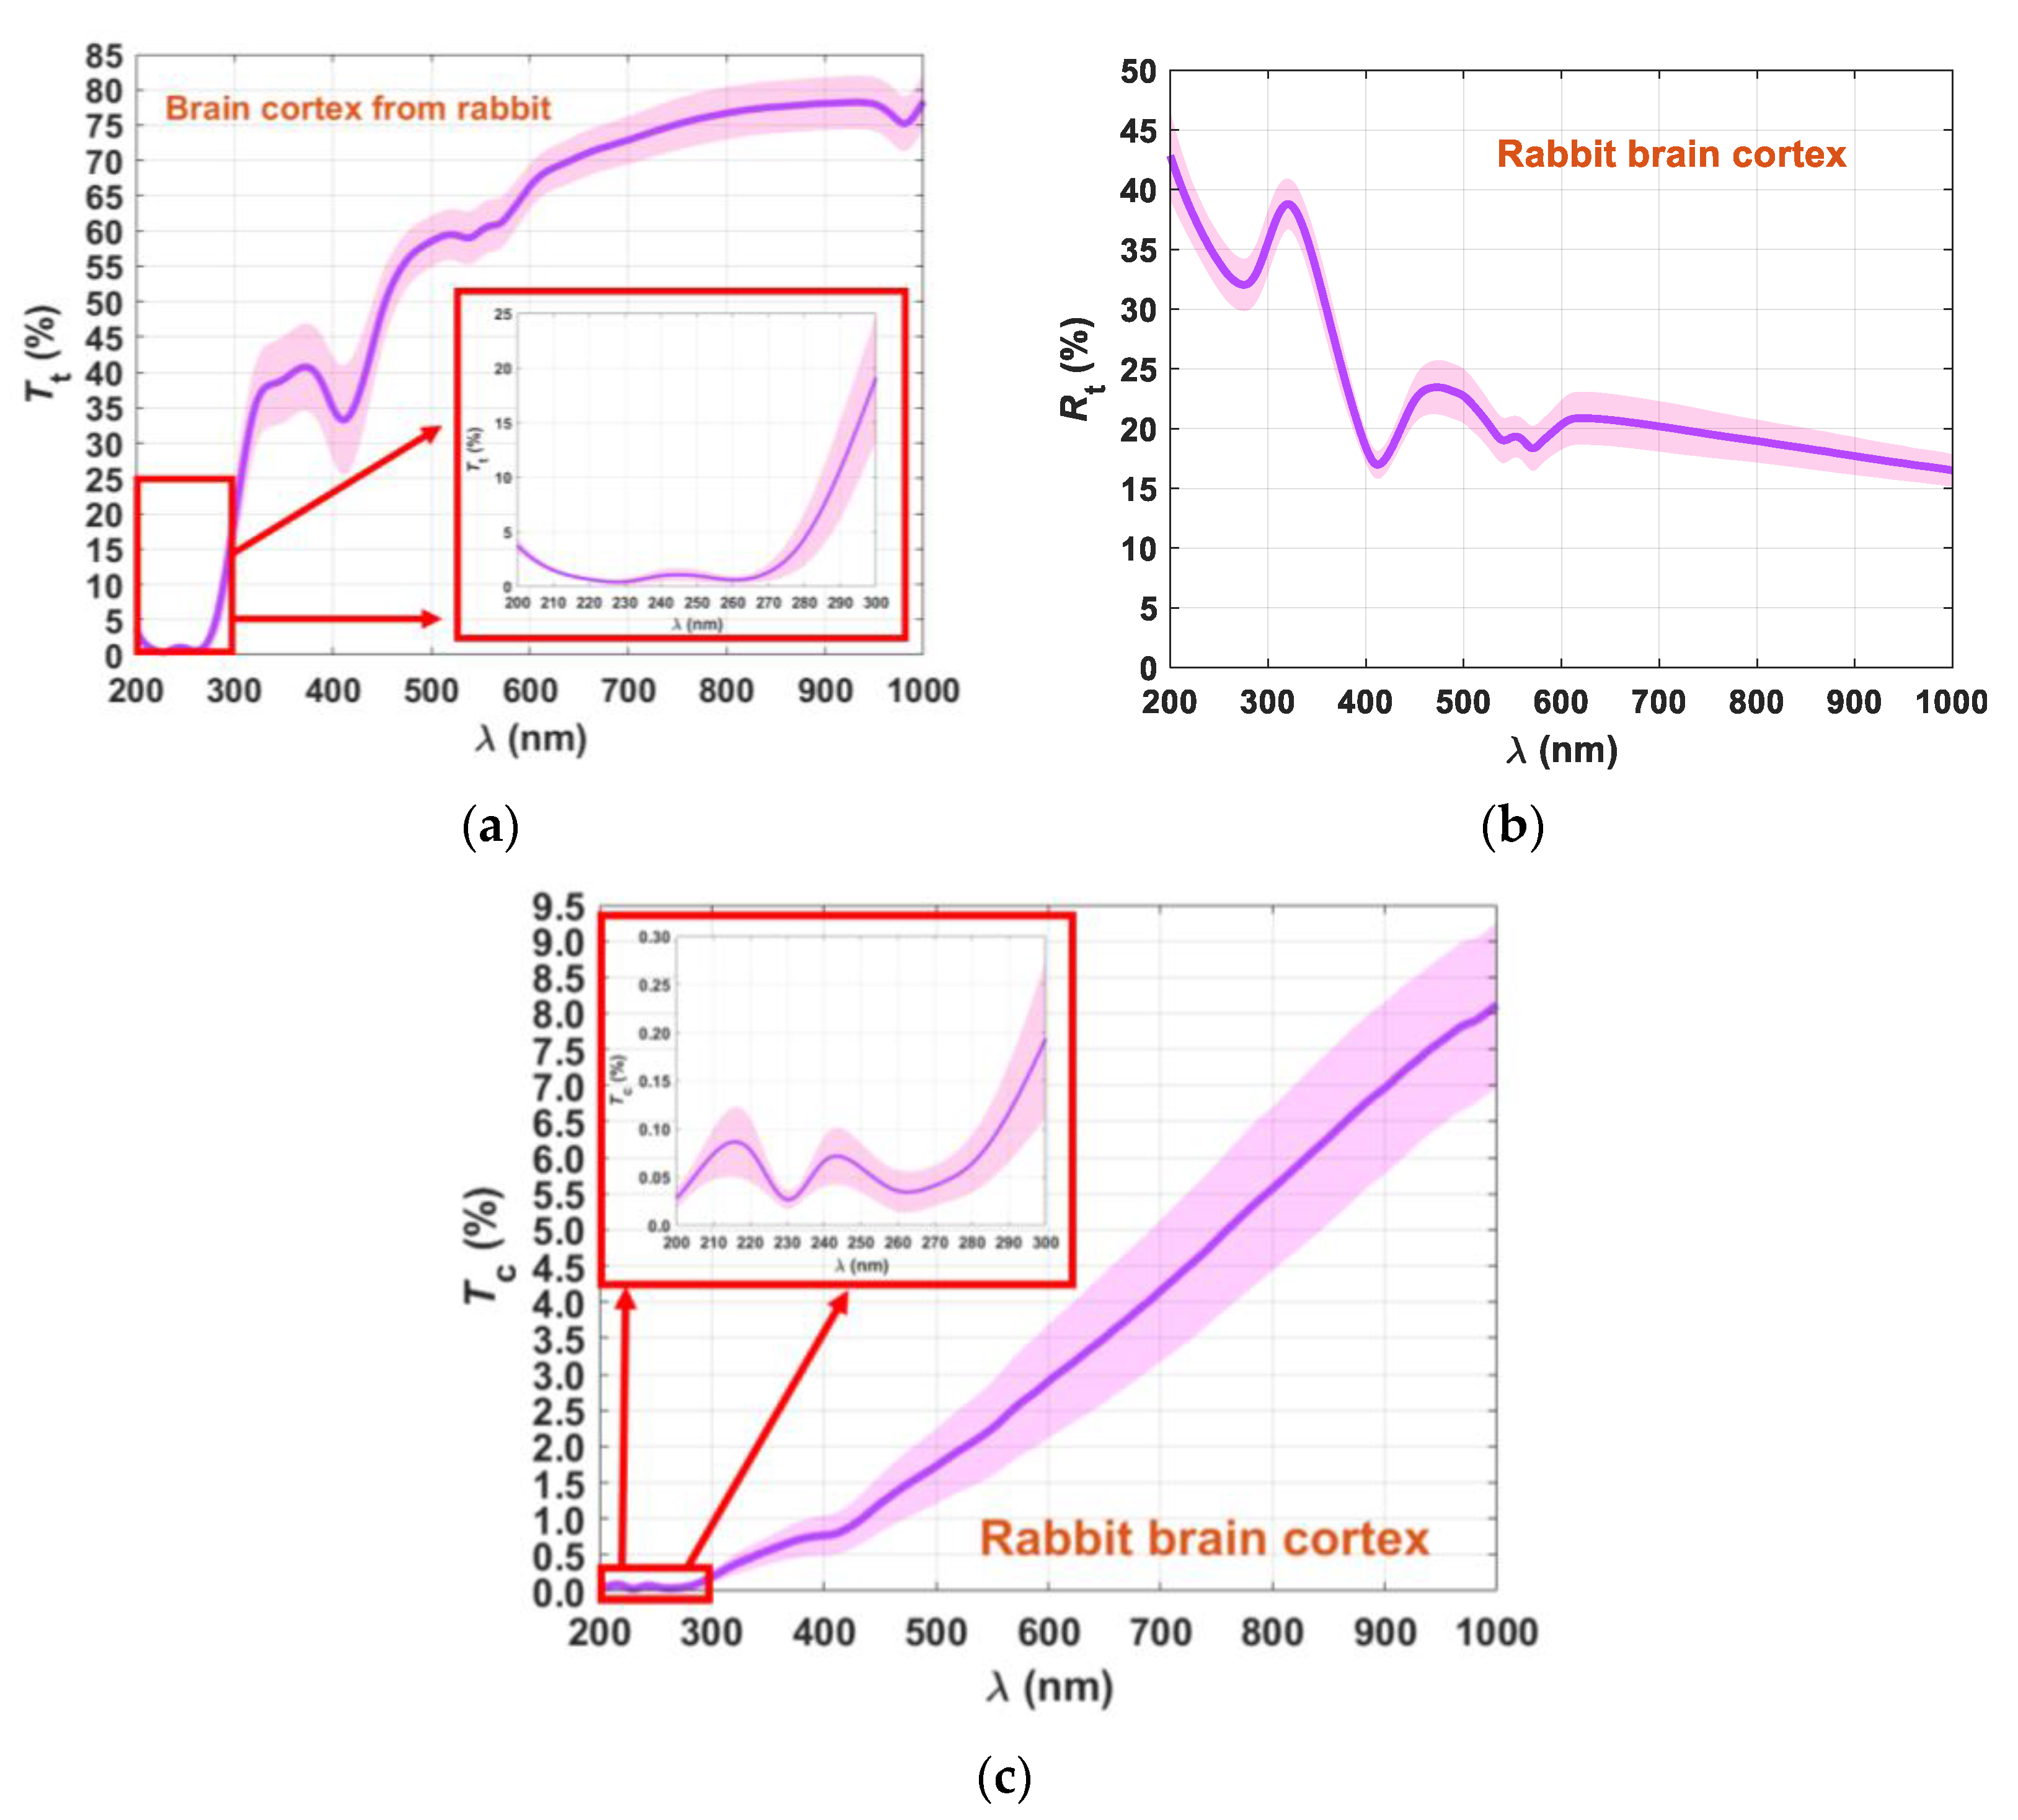
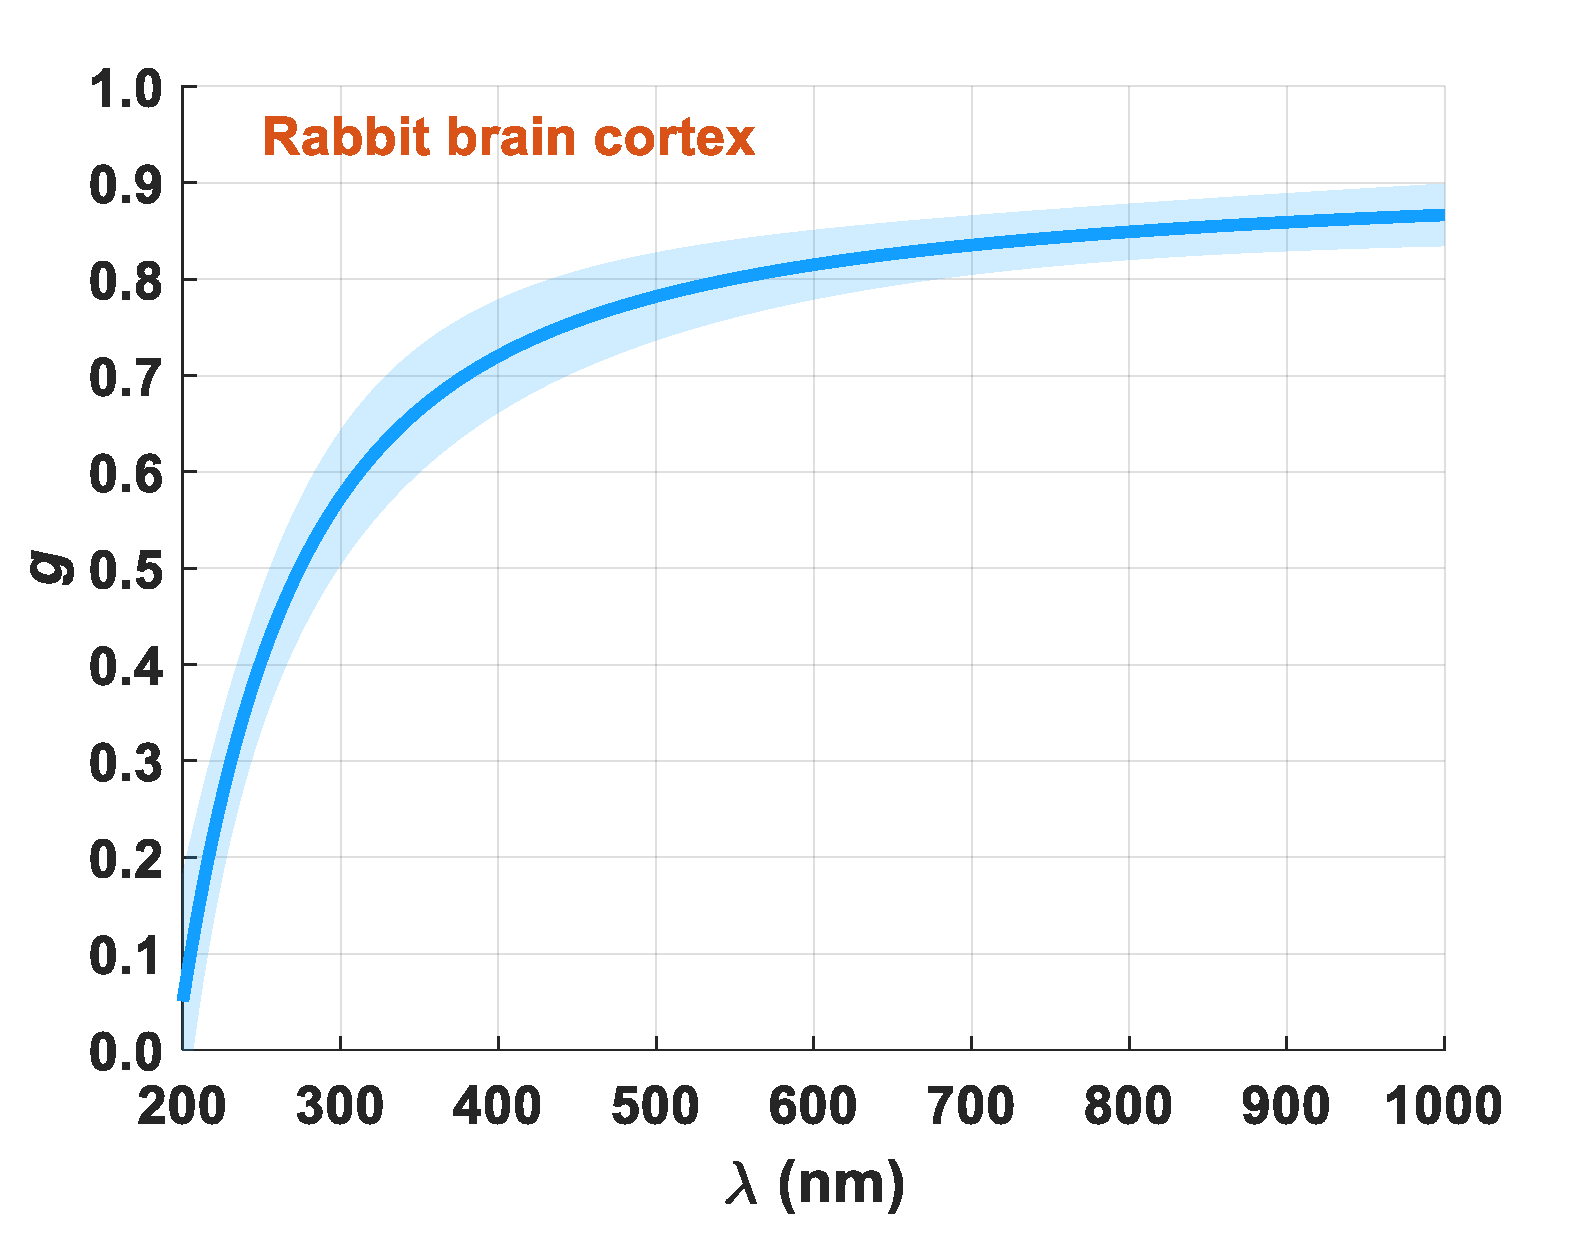
3.2. Spectral Measurements and Calculated Spectral Optical Properties

We initiated the spectral measurements by acquiring the Tt spectra from all ten samples. As explained in Section 2.3, we used the setup presented in Figure 3a to perform these measurements. Using the setup presented in Figure 3b, we acquired the Rt spectra from the same ten samples, which were also submitted to measurements with the setup presented in Figure 3c to acquire the Tc spectra. The mean and SD for these measurements are presented in Figure 6.
Although the Rt spectrum presented in Figure 6b shows small magnitude in the SD (less spreading between samples) for the entire spectral range, the tendency for Tt and Tc spectra is that the magnitude of the SD increases with increasing wavelength. Such a fact shows that different tissue samples present different transparency for the longer wavelengths, but for shorter wavelengths they are very similar.
Using the Tt and Rt spectra in Equation (4), we calculated μa(λ), and once it was calculated, Equations (10) and (11) were used to obtain ntissue(λ) for the cortex. Both these graphs are presented in Figure 7.
As a result of the calculations made with Equation (4), μa(λ) presents increasing magnitude for the SD with increasing wavelength. In this graph (Figure 7a), we see several absorption peaks. The first one occurs at 230 nm, which correspond to amino acid connections of tyrosine and tryptophan in proteins [38,39]. The brain and especially the cortex contains several proteins, such as actin, albumin, α-tubulin, β-tubulin, neuron-specific enolase (NSE), and vimentin [40]. The second band occurs at 267 nm, showing a combination of the absorption band of DNA/RNA at 260 nm with the one of hemoglobin at 274 nm [41]. We see also the other absorption bands of oxygenated hemoglobin in the visible range—411 nm (Soret band) and 540/570 nm (Q bands) [41]. The graph in Figure 7a also shows the absorption band of water at 980 nm [41].
Considering the RI data presented in Figure 7b, we see that there is a good matching between the cortex dispersions that were calculated with the Kramers–Kronig relations and with the Cauchy equation in the entire spectral range. An exception to this good matching occurs in the locations that correspond to the absorption bands of oxygenated hemoglobin. Such poor matching at these spectral locations is due to the lack of hemoglobin sensitivity in the total reflection method that resulted in the Cauchy curve in Figure 7b.
The following step consisted on performing the IAD simulations to obtain discrete values of μ′s. Such simulations were also performed ten times, considering the experimental measured spectra from the ten samples. On the other hand, using the calculated μa spectra in Equation (5), we calculated ten spectra for μs. The mean spectra and SD data for μ′s and μs are presented in Figure 8.
We can see from Figure 8 that as a result of fitting all μ′s and μs estimations with Equation (6), both curves have a smooth decreasing exponential behavior with increasing wavelength. Both curves approach each other at lower wavelengths, and as the wavelength grows they tend to differ, as previously observed for other studies [1,9]. Considering the wavelengths 635, 671, and 808 nm, we see that the average μ′s data in Figure 8 is 9.3, 8.6, and 6.8 cm−1. The authors of Ref. [42] also presented μ′s data for the rabbit brain after freezing at −20 °C. Although the data in that study were not specifically referring to the brain cortex, their results are not too dissimilar from ours: 11.2, 9.2, and 5.7 cm−1. Using the data in Figure 8, we calculated g ( λ ) with Equation (12). Figure 9 presents the result of this calculation.
The wavelength dependence presented for the g -factor in Figure 9 shows the expected behavior for a biological tissue— g increases with increasing wavelength due to predominant Rayleigh scattering [1,9,11]. To finalize the calculation of the optical properties of the brain cortex, we used the μa and μ′s spectra in Equation (21) to calculate δ(λ). Figure 10 presents the result of these calculations.
Once again, the wavelength dependence presented in Figure 10 is according to what is described in literature for biological tissues—δ increases with wavelength. We also see that such increase seems to saturate near 800 nm. The existence of absorption bands in the graph presented in Figure 10 is due to the dependence of δ on μa.
As a final discussion and interpretation of results, we performed an additional analysis on μa(λ), which is presented in Figure 7a. As previously described in the literature [1], by evaluating the ratios for the absorption bands in the μa spectrum, we can estimate a measure of the blood content and possibly of other absorbers in the tissue. Looking into Figure 7a, it seems that μa shows a baseline with some exponential decreasing dependency with increasing wavelength in the entire spectral range. Such behavior was previously observed for human colorectal tissues, where a discriminated content of a pigment (lipofuscin) was detected for normal and pathological mucosa [1,20].
The brain tissues are known to accumulate some particular pigments, such as hemosiderin [43], which is a microscopically visible granular iron pigment that emerges after rapid hemoglobin destruction or due to a fast and excessive iron deposition [44]. Another type of pigments that have been reported to accumulate in brain tissues are the carotenoid-type pigments, such as β-cryptoxanthin, lutein, and zeaxanthin, which contain oxygen atoms as hydroxyl, carbonyl, aldehyde, carboxylic, epoxide, and furanoxide groups in their molecules [45]. In addition to these pigments, the most common to accumulate in the brain, and in particular in the cortex are melanin and lipofuscin [46]. These two pigments originate from precursors, such as L-tyrosine, L-cysteine, and dopamine (in the case of melanin) [47] and from cell organelles, such as mitochondria, Golgi apparatus, and lysosomes (in the case of lipofuscin) [48,49,50]. Such precursors can easily associate with metals, particularly iron, to form melanin and lipofuscin [23].
Different mathematical equations that describe the wavelength dependence of μa for melanin and lipofuscin have been reported [51]:
μ a melanin ( λ ) = A × λ B ,
μ a lipofuscin ( λ ) = e ( C D × λ ) ,
where A, B, C and D are numerical parameters that can be determined when fitting experimental data. According to Ref. [51], these equations are valid for the range between the visible and the near infrared range (450–900 nm). In our case, and since we performed our studies between 200 and 1000 nm, Equations (22) and (23) might not be suitable to describe the wavelength dependencies for melanin and lipofuscin. Looking in the literature to find broader spectra for these pigments, we found graphical data [52,53], which we have reconstructed, as presented in Figure 11.
As represented in Figure 11, lipofuscin does not have a wavelength dependence as described by Equation (23), especially in the deep-UV range. Regarding melanin, we tried to fit the data in Figure 11 with a curve as described by Equation (22) and found that such an equation only provides a good fitting between 450 and 900 nm. Indeed, for an extended wavelength range, such as 200–1000 nm as we are using in our study, we need to avoid using Equations (22) and (23). This way, we used the numerical data from Figure 11 to reconstruct the accumulation of these pigments in the tissues used in our study. Such accumulation was found to be described as:
μ a pigment ( λ ) = 3.5 × M ( λ ) + 1.9 × L ( λ ) ,
with M(λ) and L(λ) representing the wavelength dependencies of the absorption coefficient of melanin and lipofuscin, respectively, as presented in Figure 11. Equation (24) describes well the decreasing behavior of the baseline observed for the μa of the cortex that is presented in Figure 7a, but some contribution of other pigments or the precursors of melanin and lipofuscin may be included in that absorption spectrum. For instance, hemosiderin shows a wavelength dependence for μa, which is similar to the one of melanin that we have represented in Figure 11 [54]. Since there was no suspicion of rapid hemoglobin destruction or fast and excessive iron deposition in the cortex of the animals used in the study, we have neglected the absorption of hemosiderin in the calculation of μa-pigment(λ) in Equation (24). The carotenoid-type pigments, β-cryptoxanthin, lutein and zeaxanthin, all have a similar absorption spectrum, with low absorption in the UV and null absorption for wavelengths above ~500 nm. Between 400 and 500 nm, these carotenoid-type pigments present three absorption peaks, being β-cryptoxanthin the one with peaks of higher magnitude [55]. Since those absorption bands occur between 420 and 476 nm [55], they seem to have no influence in the resulting μa spectrum of the cortex. Looking into that spectrum in Figure 7a, between 400 and 500 nm we see only a well-defined Soret band, with center wavelength at 411 nm.
Regarding the melanin precursors, their absorption is mainly characterized by UV-bands, with zero absorption above 300 nm. In the case of L-cysteine, its absorption spectrum is the combination and overlapping of two bands, the one with higher-magnitude centered near 230 nm and the one with lower-magnitude centered near 280 nm [56]. This means that the absorption band that we see in Figure 7a at 230 nm may not be only due to the amino acid connections in proteins. It may also indicate the presence of L-cysteine in the cortex samples we used. No evidence of the 280 nm band was observed in the spectrum in Figure 7a, but due to the strong band at 267 nm that results from the combination of the DNA/RNA band at 260 nm and the hemoglobin band at 274 nm, the 280 nm band of L-cysteine can be masked. The absorption spectrum of L-tyrosine is the combination of two bands with a small overlapping, the higher-magnitude being centered at a wavelength smaller than 240 nm and the one with lower-magnitude being centered near 285 nm [57]. In the case of dopamine, a single absorption band occurs, with a central wavelength near 280 nm [58]. For the same reasons presented above for L-cysteine, the absorption bands of L-tyrosine and dopamine can be masked by the absorption bands of the amino acid connections in proteins and the one that results from the combination of DNA/RNA and hemoglobin. This means that melanin precursors may also be present in the samples used in this study.
For the case of the lipofuscin precursors, we found only the absorption spectrum of mitochondria. Similar to the case of the melanin precursors, such absorption is limited in the UV, with zero absorption for wavelengths longer than 400 nm. Mitochondria present a single absorption band between 300 and 400 nm, with a central wavelength near 360 nm [59]. Looking into the absorption spectrum presented in Figure 7a, the absorption band of mitochondria can be masked by the Soret band, which extends to a lower wavelength close to 320 nm.
Considering this discussion and assuming that only melanin and lipofuscin contribute the decaying baseline observed in the absorption spectrum of the brain cortex, we subtracted the curve described by Equation (24) to that spectrum. Figure 12 presents the μa(λ) of the rabbit brain cortex (the same as in Figure 7a), the μa-pigment(λ) as described by Equation (24) and a third curve, which represents the difference of the previous two. We have also presented in Figure 12 the ratios for the most significant absorption bands—DNA/RNA (260 nm) and oxygenated hemoglobin (Soret and Q-bands at 411 and 555 nm). The ratios that are presented in blue were calculated for the peaks in the original μa(λ), considering the μa-pigment(λ) curve as baseline. The ratios that are presented in green were calculated in the same manner, but now considering the peaks in μa(λ) after subtracting the curve for μa-pigment(λ). In this case, the baseline is the horizontal black line that was fixed at the minimum value of the green curve, which occurs at 804 nm.
In the first analysis of the data in Figure 12, we see that by subtracting the absorption of the pigments from the calculated μa, a decrease occurred in the entire spectral range. Performing a similar comparison with literature data as the one made for the μ′s data in Figure 8, we see some similarity between the corrected μa data in Figure 12 and that reported in Ref. [42] for rabbit brain after freezing at −20 °C. Considering once again the wavelengths 635, 671, and 808 nm, the corrected μa spectrum in Figure 12 presents the values: 0.8, 0.6, and 0.3 cm−1, while in Ref. [42] the values of 0.8, 0.5, and 0.4 cm−1 were reported at those wavelengths.
Considering now the ratios presented in Figure 12 and comparing between the values obtained before and after subtracting the absorption of the pigments, we see that both melanin and lipofuscin were camouflaging the real content of both DNA/RNA and hemoglobin in the rabbit brain. Such contents were not only low but deceiving, since from the blue curve in Figure 12 we see a higher ratio at the Soret band than at the DNA/RNA band. After subtracting the absorption of the pigments from the μa of the cortex, we see that in reality the DNA/RNA band presents a higher ratio than the one observed at the Soret band.
According to Double et al. [23], both melanin and lipofuscin are two pigments that are produced within the brain and accumulate there at a slow pace from the early years of life. Lipofuscin accumulation in the brain has been associated with the brain cell aging process [23,60,61,62], while melanin has been suggested to be produced by brain cells as an iron-regulatory molecule with protective functions. A more recent review was published by Moreno-García et al. [24], where new findings on the melanin and lipofuscin accumulation in the brain and their interrelation is discussed. According to these authors, and considering the human brain, catecholaminergic neurons are characterized by an age-related accumulation of melanin. When a neuron degenerates, it releases melanin and other products such undegraded cell components or lipids, a process that contributes to initiating and worsening an eventual immune response, which ultimately leads to the neurodegenerative process. These authors also reported that the accumulation of lipofuscin aggregates in the brain during the normal aging process leads to striking morphological changes in neurons. Lipofuscin is described as an undigested bioproduct of central processes of cellular detoxification of autophagy, which is associated with both the aging and the neurodegeneration processes in the brain. It is also noted that the colocalization of both melanin and lipofuscin may produce a redox crosstalk between them. Such crosstalk, under certain conditions, may induce the production of melanin from melanized lipofuscin and under the presence of ferrous sulfide, lipofuscin can be transformed into melanin after a pseudoperoxidation process [24]. We remember that the tissue samples used for our study were retrieved from adult rabbits, meaning that the accumulation of such pigments should be expected in our study. Other authors have also reported that such pigment accumulation is related to tissue and cell degeneration as a consequence of the aging process [60,63,64]. It has also been reported that lipofuscin is able to aggregate transition metals, such as iron and copper, which turn this pigment cytotoxic, changing the oxidation of cellular components such as proteins, lipids and RNA/DNA [62]. In the case of brain tissues, such cellular changes may be at the basis of the degeneration and death of neurons has reported in Ref. [22], and may be the primary responsible for the occurrence of Alzheimer, Parkinson, and stroke diseases.
To prevent the development of such diseases, it is necessary to develop a noninvasive method to evaluate the accumulation of such age-related pigments in brain tissues. Since in our study we were able to detect the presence of such pigments from the μa(λ) of the brain cortex, possibly the application of noninvasive diffuse reflectance (Rd) measurements can be used to develop such method. As recently reported [20], such measurements can be combined with a machine learning approach to reconstruct μa(λ) and allow to monitor pigment accumulation.

4. Conclusions

In this study, we used spectral measurements from ex vivo brain cortex samples from adult rabbits to calculate the wavelength dependencies of tissues optical properties. The results obtained in this study are accordingly to others that have been reported for different biological tissues. An analysis on the absorption of the cortex showed that it contains some pigments, namely melanin and lipofuscin, which hides the true content of other biological absorbers that the tissue contains. By reconstructing the exponential decreasing absorption with increasing wavelength of these pigments we were able to subtract it from the calculated absorption coefficient of the cortex and such procedure permitted the correct evaluation of the blood and DNA/RNA contents in the rabbit brain.
The accumulation of melanin and lipofuscin has been described to be related to the degeneration processes that occur in tissues and cells as a consequence of the ageing process. In the case of the brain, such degeneration and consequent neuron death has been connected to the development of certain pathologies, such as Alzheimer, Parkinson, and stroke. Due to this relation, it would be interesting to evaluate the content of melanin and lipofuscin in brain tissues from animal specimens at different ages to monitor its progress. Such evaluation could also be performed in humans to identify the pigment accumulation as a function of age and try to relate it with the development of brain diseases. To perform such evaluation in humans in vivo using a noninvasive procedure, diffuse reflectance spectra could be acquired and processed with machine learning algorithms to reconstruct the absorption spectra of the brain tissues. There are several ethical and experimental issues associated with such research in humans, but if the absorption spectra that quantifies pigment accumulation can be calculated from animal models, a method could be developed to diagnose and monitor the development of age-related brain diseases.

Author Contributions

Conceptualization, L.M.O. and V.V.T.; methodology, L.M.O.; software, T.M.G. and I.S.M.; validation, L.M.O.; investigation, T.M.G., H.F.S. and I.S.M.; writing—original draft preparation, L.M.O.; writing—review and editing, T.M.G., H.F.S., I.S.M. and V.V.T. All authors have read and agreed to the published version of the manuscript.

Funding

The work of L.M.O. was supported by the Portuguese Science Foundation, Grant No. FCT-UIDB/04730/2020. The work of V.V.T. was supported by the Government of the Russian Federation (project No. 075-15-2019-1885 to support scientific research projects implemented under the supervision of leading scientists at Russian institutions, Russian institutions of higher education).

Institutional Review Board Statement

The present study involves measurements from ex vivo animal tissues. The research follows the Declaration of Helsinki and was approved by the research review board in biomedical engineering of the Center of Innovation in Engineering and Industrial Technology (CIETI), in Porto, Portugal. Such approval has the number CIETI/Biomed_Research_2021_01.

Informed Consent Statement

Not applicable.

Data Availability Statement

The data that supports the findings of this study are available from the corresponding author upon reasonable request.

Conflicts of Interest

The authors declare no conflict of interest.

References

  1. Carvalho, S.; Carneiro, I.; Henrique, R.; Tuchin, V.V.; Oliveira, L. Lipofuscin-type pigment as a marker of colorectal cancer. Electronics 2020, 9, 1805. [Google Scholar] [CrossRef]
  2. Oliveira, L.M.; Tuchin, V.V. The Optical Clearing Method—A New Tool for Clinical Practice and Biomedical Engineering; Springer: Cham, Switzerland, 2019; pp. 1–106. [Google Scholar]
  3. Tuchin, V.V. Tissue Optics: Light Scattering Methods and Instruments for Medical Diagnostics, 3rd ed.; SPIE Press: Bellingham, WA, USA, 2015; pp. 245–358. [Google Scholar]
  4. Wang, L.; Jacques, S.L.; Zheng, L. MCML-Monte Carlo modeling of light transport in multi-layered tissues. Comp. Method Prog. Biomed. 1995, 47, 131–146. [Google Scholar] [CrossRef]
  5. Prahl, S.A.; van Gemert, M.J.C.; Welch, A.J. Determining the optical properties of turbid media by using the adding-doubling method. Appl. Opt. 1993, 32, 559–568. [Google Scholar] [CrossRef]
  6. Sordillo, D.C.; Sordillo, L.A.; Sordillo, P.P.; Shi, L.; Alfano, R.R. Short wavelength infrared optical windows for evaluation of benign and malignant tissues. J. Biomed. Opt. 2017, 22, 45002. [Google Scholar] [CrossRef]
  7. Shi, L.; Sordillo, L.A.; Rodríguez-Contreras, A.; Alfano, R. Transmission in near-infrared optical Windows for deep-brain imaging. J. Biophotonics 2016, 9, 38–43. [Google Scholar] [CrossRef]
  8. Oliveira, L.M.; Zaytsev, K.I.; Tuchin, V.V. Improved biomedical imaging over a wide spectral range from UV to THz towards multimodality. In Proceedings of the Third International Conference on Biophotonics Riga 2020, Riga, Latvia, 24–25 August 2020; Spigulis, J., Ed.; SPIE: Bellingham, WA, USA, 2020; Volume 11585, p. 11585. [Google Scholar]
  9. Carneiro, I.; Carvalho, S.; Henrique, R.; Oliveira, L.; Tuchin, V. Measurement of optical properties of normal and pathological human liver tissue from deep-UV to NIR. In Proceedings of the Photonics Europe: Tissue Optics and Photonics, Online Conference, 2 April 2020; Tuchin, V.V., Blondel, W., Zalevsky, Z., Eds.; SPIE: Bellingham, WA, USA, 2020; Volume 11363, p. 113630G. [Google Scholar]
  10. Backman, B.; Wax, A.; Zhang, H. A Laboratory Manual in Biophotonics; CRC Press: Boca Raton, FL, USA, 2018; p. 100. [Google Scholar]
  11. Jacques, S.L. Optical properties of biological tissues: A review. Phys. Med. Biol. 2013, 58, R37–R61. [Google Scholar] [CrossRef]
  12. Yanina, I.Y.; Lazareva, E.N.; Tuchin, V.V. Refractive index of adipose tissue and lipid droplet measured in wide spectral and temperature ranges. Appl. Opt. 2018, 57, 4839. [Google Scholar] [CrossRef]
  13. Martins, I.; Silva, H.; Tuchin, V.V.; Oliveira, L. Estimation of rabbit pancreas dispersion between 400 and 1000 nm. J. Biomed. Phot. Eng. 2021, 7, 020303. [Google Scholar]
  14. Lazareva, E.N.; Oliveira, L.; Yanina, I.Y.; Chernomyrdin, N.V.; Musina, G.R.; Tuchina, D.K.; Bashkatov, A.N.; Zaytsev, K.I.; Tuchin, V.V. Refractive index measurements of tissue and blood and OCAs in a wide spectral range. In Tissue Optical Clearing: New Prospects in Optical Imaging; Zhu, D., Genina, E., Tuchin, V., Eds.; CRC Press: Boca Raton, FL, USA, to be published.
  15. Carneiro, I.; Carvalho, S.; Henrique, R.; Oliveira, L.; Tuchin, V.V. Simple multimodal optical technique for evaluation of free/bound water and dispersion of human liver tissue. J. Biomed. Opt. 2017, 22, 125002. [Google Scholar] [CrossRef]
  16. Sydoruk, O.; Zhernovaya, O.; Tuchin, V.V.; Douplik, A. Refractive index of solutions of human hemoglobin from the near-infrared to the ultraviolet range: Kramers-Kronig analysis. J. Biomed. Opt. 2012, 17, 115002. [Google Scholar] [CrossRef]
  17. Gienger, J.; Groβ, H.; Neukammer, J.; Bär, M. Determining the refractive index of human hemoglobin solutions by Kramers-Kronig relations with an improved absorption model. Appl. Opt. 2016, 55, 8951–8961. [Google Scholar] [CrossRef]
  18. Bashkatov, A.N.; Genina, E.A.; Kozintseva, M.D.; Kochubei, V.I.; Gorodkov, S.Y.; Tuchin, V.V. Optical properties of peritoneal biological tissues in the spectral range of 350–2500 nm. Opt. Spectrosc. 2016, 120, 6–14. [Google Scholar] [CrossRef]
  19. Carvalho, S.; Gueiral, N.; Nogueira, E.; Henrique, R.; Oliveira, L.; Tuchin, V. Comparative study of the optical properties of colon mucosa and colon precancerous polyps between 400 and 1000 nm. In Proceedings of the BIOS-Photonics West 2017: Dynamics and Fluctuations in Biomedical Photonics, San Francisco, CA, USA, 28 January–2 February 2017; Tuchin, V.V., Larin, K.V., Leahy, M.J., Wang, R.K., Eds.; SPIE: Bellingham, WA, USA, 2017; Volume 10063, p. 100631L. [Google Scholar]
  20. Fernandes, L.; Carvalho, S.; Carneiro, I.; Henrique, R.; Tuchin, V.V.; Oliveira, H.; Oliveira, L. Diffuse reflectance and machine learning techniques to differentiate colorectal cancer ex vivo. Chaos 2021, 31, 053118. [Google Scholar] [CrossRef] [PubMed]
  21. GBD 2016 Neurology Collaborators. Global, regional, and national burden of neurological disorders, 1990–2016: A systematic analysis for the global burden of disease study 2016. Lancet Neurol. 2019, 18, 459–480. [Google Scholar] [CrossRef] [Green Version]
  22. Mattson, M.P.; Duan, W.; Pedersen, W.A.; Culmsee, C. Neurodegenerative disorders and ischemic brain diseases. Apoptosis 2001, 6, 69–81. [Google Scholar] [CrossRef] [PubMed]
  23. Double, K.L.; Dedov, V.N.; Fedorow, H.; Kettle, E.; Halliday, G.M.; Garner, B.; Brunk, U.T. The comparative biology of neuromelanin and lipofuscin in the brain. Cell Mol. Life Sci. 2008, 65, 1669–1682. [Google Scholar] [CrossRef] [PubMed]
  24. Moreno-García, A.; Kun, A.; Calero, M.; Calero, O. The neuromelanin paradox and its role in oxidative stress and neurodegeneration. Antioxidants 2021, 10, 124. [Google Scholar] [CrossRef]
  25. Tuchin, V.V. Optical Clearing of Tissues and Blood; SPIE Press: Bellingham, WA, USA, 2005; p. 79. [Google Scholar]
  26. Sdobnov, A.Y.; Darvin, M.; Genina, E.A.; Bashkatov, A.N.; Lademann, J.; Tuchin, V.V. Recent progress in tissue optical clearing for spectroscopic application. Spectrochim. Acta Part A Biomol. Spectrosc. 2018, 197, 216–229. [Google Scholar] [CrossRef]
  27. Li, H.; Xie, S. Measurement method of the refractive index of biotissue by total internal reflection. Appl. Opt. 1996, 35, 1793–1975. [Google Scholar] [CrossRef]
  28. Ding, H.; Lu, J.Q.; Jacobs, K.M.; Hu, X.H. Determination of refractive indices of porcine skin tissues and intralipid at eight wavelengths between 325 and 1557 nm. J. Opt. Soc. Am. A 2005, 22, 1151–1157. [Google Scholar] [CrossRef] [Green Version]
  29. Deng., Z.; Wang, J.; Ye, Q.; Sun, T.; Zhou, W.Y.; Mei, J.; Zhang, C.; Tian, J. Determination of continuous complex refractive index dispersion of biotissue based on internal reflection. J. Biomed. Opt. 2016, 21, 015004. [Google Scholar] [CrossRef] [Green Version]
  30. Refractive Index Database. Available online: https://refractiveindex.info/ (accessed on 1 June 2021).
  31. Song, Q.W.; Ku, C.Y.; Zhang, C.; Gross, R.B.; Birge, R.R.; Michalak, R. Modified critical angle method for measuring the refractive index of bio-optical materials and its application to bacteriorhodopsin. J. Opt. Soc. Am. B 1995, 12, 797–803. [Google Scholar] [CrossRef] [Green Version]
  32. Carneiro, I.; Carvalho, S.; Henrique, R.; Oliveira, L.; Tuchin, V.V. Water content and scatterers dispersion evaluation in colorectal tissues. J. Biomed. Phot. Eng. 2017, 3, 040301. [Google Scholar] [CrossRef] [Green Version]
  33. Carvalho, S.; Gueiral, N.; Nogueira, E.; Henrique, R.; Oliveira, L.; Tuchin, V.V. Wavelength dependence of the refractive index of human colorectal tissues: Comparison between healthy mucosa and cancer. J. Biomed. Phot. Eng. 2016, 2, 040307. [Google Scholar] [CrossRef] [Green Version]
  34. Bashkatov, A.N.; Genina, E.A.; Kochubey, V.I.; Tuchin, V.V. Optical properties of the subcutaneous adipose tissue in the spectral range 400–2500 nm. Opt. Spectrosc. 2005, 99, 836–842. [Google Scholar] [CrossRef]
  35. Roggan, A.; Dörschel, K.; Minet, O.; Wolff, D.; Müller, G. The optical properties of biological tissue in the near infrared wavelength range—Review and measurements. In Laser-Induced Interstitial Thermotherapy; Müller, G., Roggan, A., Eds.; SPIE Press: Bellingham, WA, USA, 1995; pp. 10–44. [Google Scholar]
  36. Binding, J.; Arous, J.B.; Léger, J.F.; Gigan, S.; Boccara, C.; Bourdieu, L. Brain refractive index measured in vivo with high-NA defocus-corrected full-field OCT and consequences for two-photon microscopy. Opt. Express 2011, 19, 4833–4847. [Google Scholar] [CrossRef] [Green Version]
  37. Sun, J.; Lee, S.J.; Wu, L.; Sarntinoranont, M.; Xie, H. Refractive index measurement of acute rat brain tissue slices using optical coherence tomography. Opt. Express 2012, 20, 1084–1095. [Google Scholar] [CrossRef]
  38. Fasman, G.D. Ultraviolet spectra of derivatives of cysteine, cysteine, histidine, phenylalanine, tyrosine, and tryptophan. In Handbook of Biochemistry and Molecular Biology, 3rd ed.; Fasman, G.D., Ed.; CRC Press: Boca Raton, FL, USA, 2018; Volume 1, Chapter 17. [Google Scholar]
  39. Wetlaufer, D.B. Ultraviolet spectra of proteins and amino acids. In Advances in Protein Chemistry; Afinsen, C.B., Jr., Ed.; Academic Press: London, UK, 1962; Chapter 6; Volume 17. [Google Scholar]
  40. Narayan, R.K.; Heydon, W.E.; Creed, G.J.; Jacobowitz, D.M. Identification of major proteins in human cerebral cortex and brain tumors. J. Protein Chem. 1985, 4, 375–389. [Google Scholar] [CrossRef]
  41. Zhou, Y.; Yao, J.; Wang, L.V. Tutorial on photoacoustic tomography. J. Biomed. Opt. 2016, 21, 061007. [Google Scholar] [CrossRef] [Green Version]
  42. Pitzschke, A.; Lovisa, B.; Seydoux, O.; Haenggi, M.; Oertel, M.F.; Zellweger, M.; Tardy, Y.; Wagnières, G. Optical properties of rabbit brain in the red and near-infrared: Changes observed under in vivo, postmortem, frozen, and formalin-fixated conditions. J. Biomed. Opt. 2015, 20, 025006. [Google Scholar] [CrossRef] [PubMed]
  43. Koeppen, A.H.; Dentinger, M.P. Brain hemosiderin and superficial siderosis of the central nervous system. J. Neuropathol. Exp. Neurol. 1988, 47, 249–270. [Google Scholar] [CrossRef]
  44. Granick, S. Ferritin: Its properties and significance for iron metabolism. Chem. Rev. 1946, 38, 379–403. [Google Scholar] [CrossRef] [PubMed]
  45. Maoka, T. Carotenoids as natural functional pigments. J. Nat. Med. 2020, 74, 1–16. [Google Scholar] [CrossRef] [Green Version]
  46. Johansson, J. Spectroscopic method for determination of the absorption coefficient in brain tissue. J. Biomed. Opt. 2010, 15, 057005. [Google Scholar] [CrossRef] [PubMed] [Green Version]
  47. Wakamatsu, K.; Murase, T.; Zucca, F.A.; Zecca, L.; Ito, S. Biosynthetic pathway to measure neuromelanin and its aging process. Pigment. Cell Melanoma Res. 2012, 25, 792–803. [Google Scholar] [CrossRef] [PubMed]
  48. Gilissen, E.P.; Staneva-Dobrovski, L. Distinct types of lipofuscin pigment in the hippocampus and cerebellum of aged cheirogaleid primates. Anat. Rec. 2013, 296, 1895–1906. [Google Scholar] [CrossRef]
  49. Heinsen, H. Lipofuscin in the cerebellar cortex of albino rats: An electron microscopic study. Anat. Embryol. 1979, 115, 333–345. [Google Scholar] [CrossRef] [Green Version]
  50. Ivy, G.O.; Kanai, S.; Ohta, M.; Smith, G.; Sato, Y.; Kobayashi, M.; Kitani, K. Lipofucin-like substances accumulate rapidly in brain, retina and internal organs with cysteine protease inhibition. Adv. Exp. Med. Biol. 1989, 266, 31–45. [Google Scholar]
  51. Johansson, J.D.; Wårdell, K. Intracerebral quantitative chromophore estimation from reflectance spectra captured during deep brain stimulation implantation. J. Biophot. 2013, 6, 435–445. [Google Scholar] [CrossRef] [PubMed] [Green Version]
  52. Różanowska, M.B.; Pawlak, A.; Różanowski, B. Products of docosahexaenoate oxidation as contributors to photosensitizing properties of retinal lipofuscin. Int. J. Mol. Sci. 2021, 22, 3525. [Google Scholar] [CrossRef]
  53. Zonios, G.; Dimou, A.; Bassukas, I.; Galaris, D.; Tsolakidis, A.; Kaxiras, E. Melanin absorption spectroscopy: New method for noninvasive skin investigation and melanoma detection. J. Biomed. Opt. 2008, 13, 014017. [Google Scholar] [CrossRef] [PubMed] [Green Version]
  54. Zhang, L.; Zou, X.; Zhang, B.; Cui, L.; Zhang, J.; Mao, Y.; Chen, L.; Ji, M. Label-free imaging of hemoglobin degradation and hemosiderin formation in brain tissues with femtosecond pump-probe microscopy. Theranostics 2018, 8, 4129–4140. [Google Scholar] [CrossRef] [PubMed]
  55. Zaghdoudi, K.; Ngomo, O.; Vanderesse, R.; Anoux, P.; Myrzakhmetov, B.; Frochot, C.; Guiavarch, Y. Extraction, identification and photo-physical characterization of persimmon (Diospyros kaki L.) carotenoids. Foods 2017, 6, 4. [Google Scholar] [CrossRef] [PubMed] [Green Version]
  56. Raja, A.S.; Sathiyabama, J.; Venkatesan, R.; Prathipa, V. Corrosion control of carbon steel by eco-friendly inhibitor L-Cysteine-Zn2+ system in acqueous medium. J. Chem. Biol. Phys. Sci. 2014, 4, 3182–3189. [Google Scholar]
  57. Hazra, C.; Samanta, T.; Mahalingam, V. A resonance energy transfer approach for the selective detection of aromatic amino acids. J. Mater. Chem. C 2014, 2, 10157–10163. [Google Scholar] [CrossRef]
  58. Lin, J.-H.; Yu, C.-J.; Yang, Y.-C.; Tseng, W.-L. Formation of fluorescence polydopamine dots from hydroxyl radical-induced degradation of polydopamine nanoparticles. Phys. Chem. Chem. Phys. 2015, 17, 15124. [Google Scholar] [CrossRef]
  59. Feng, S.; Harayama, T.; Montessuit, S.; David, F.P.; Winssinger, N.; Martinou, J.-C.; Riezman, H. Mitochondria-specific photoactivation to monitor local sphingosine metabolism and function. Elife 2018, 7, e34555. [Google Scholar] [CrossRef]
  60. Jung, T.; Bader, N.; Grune, T. Lipofuscin: Formation, distribution, and metabolic consequences. Ann. N. Y. Acad. Sci. 2007, 1119, 97–111. [Google Scholar] [CrossRef]
  61. Katz, M.L.; Robinson, W.G., Jr. What is lipofuscin? Defining characteristics and differentiation from other autofluorescent lysosomal storage bodies. Arch. Gerontol. Geriatr. 2002, 34, 169–184. [Google Scholar] [CrossRef]
  62. Höhn, A.; Jung, T.; Grimm, S.; Grune, T. Lipofuscin-bound iron is a major intracellular source of oxidants: Role in senescent cells. Free Rad. Biol. Med. 2010, 48, 1100–1108. [Google Scholar] [CrossRef]
  63. Hunter, J.J.; Morgan, J.I.W.; Merigan, W.H.; Sliney, D.H.; Sparrow, J.R.; Williams, D.R. The susceptibility of the retina to photochemical damage from visible light. Prog. Retin Eye Res. 2012, 31, 28–42. [Google Scholar] [CrossRef] [Green Version]
  64. Gosnell, M.E.; Anwer, A.G.; Cassano, J.C.; Sue, C.M.; Goldys, E.M. Functional hyperspectral imaging captures subtle details of cell metabolism in olfactory neurosphere cells, disease-specific models of neurodegenerative disorders. Biochim. Biophys. Acta 2016, 1863, 56–63. [Google Scholar] [CrossRef] [Green Version]
Figure 1. Total internal reflection setup for the RI measurements.
Photochem 01 00011 g001
Figure 2. Wavelength dependence for the RI of the N-SF11 dispersion prism.
Photochem 01 00011 g002
Figure 3. Experimental setups to measure: Tt(λ) (a), Rt(λ) (b) and Tc(λ) (c).
Photochem 01 00011 g003
Figure 4. Curves calculated with the RI measurements for the 782.1 nm laser: reflectance curves (a) and 1st derivative curves (b).
Photochem 01 00011 g004
Figure 5. Experimental RI values for the rabbit cortex and calculated dispersion.
Photochem 01 00011 g005
Figure 6. Mean spectra and SD of the rabbit brain cortex: Tt(λ) (a), Rt(λ) (b) and Tc(λ) (c).
Photochem 01 00011 g006
Figure 7. Spectral curves of μa(λ) (a) and ntissue(λ) (b) for the rabbit brain cortex.
Photochem 01 00011 g007
Figure 8. Spectral curves of μ′s(λ) and μs(λ) for the rabbit brain cortex.
Photochem 01 00011 g008
Figure 9. Spectral curve of g ( λ ) for the rabbit brain cortex.
Photochem 01 00011 g009
Figure 10. Spectral curve of δ(λ) for the rabbit brain cortex.
Photochem 01 00011 g010
Figure 11. Spectral curves of μa(λ) for melanin and lipofuscin.
Photochem 01 00011 g011
Figure 12. Wavelength dependencies of μa for the melanin and lipofuscin pigments and for the rabbit brain cortex, before (blue line) and after (green line) subtracting the absorption of the pigments.
Photochem 01 00011 g012
Table 1. RI values of the brain cortex at the laser wavelengths.
LaserntissueMeanSD
1.3883
401.4 nm1.38771.38500.0053
1.3789
1.3679
534.6 nm1.37351.37360.0058
1.3794
1.3632
626.6 nm1.36861.36800.0045
1.3721
1.3562
782.1 nm1.36091.36110.0050
1.3662
1.3552
820.8 nm1.35661.35970.0066
1.3673
1.3516
850 nm1.35831.35890.0076
1.3667
Publisher’s Note: MDPI stays neutral with regard to jurisdictional claims in published maps and institutional affiliations.

