Article

Multimodal Feature Inputs Enable Improved Automated Textile Identification

Department of Mechanical Engineering, Faculty of Engineering, Computing and the Environment, Kingston University, Roehampton Vale, London SW15 3DW, UK
*
Author to whom correspondence should be addressed.
Textiles 2025, 5(3), 31; https://doi.org/10.3390/textiles5030031
Submission received: 3 June 2025 / Revised: 22 July 2025 / Accepted: 25 July 2025 / Published: 2 August 2025

Abstract

This study presents an advanced framework for fabric texture classification by leveraging macro- and micro-texture extraction techniques integrated with deep learning architectures. Co-occurrence histograms, local binary patterns (LBPs), and albedo-dependent feature maps were employed to comprehensively capture the surface properties of fabrics. A late fusion approach was applied using four state-of-the-art convolutional neural networks (CNNs): InceptionV3, ResNet50_V2, DenseNet, and VGG-19. Excellent results were obtained, with the ResNet50_V2 achieving a precision of 0.929, recall of 0.914, and F1 score of 0.913. Notably, the integration of multimodal inputs allowed the models to effectively distinguish challenging fabric types, such as cotton–polyester and satin–silk pairs, which exhibit overlapping texture characteristics. This research not only enhances the accuracy of textile classification but also provides a robust methodology for material analysis, with significant implications for industrial applications in fashion, quality control, and robotics.

Graphical Abstract

1. Introduction

Fabric texture analysis is currently receiving a large amount of attention since it is vital for industries such as textiles and fashion, and it involves modern techniques such as automation and quality control [1,2]. Fabric texture recognition has numerous applications for robotics, allowing robots to handle and manipulate materials, thereby broadening the range of human–machine interactions [3].
Traditional methods, such as the use of a gray-level co-occurrence matrix (GLCM) and local binary patterns (LBPs) in standard image processing, have been widely used for texture feature extraction [4,5], in differentiating textures in medical imaging and remote sensing [6], and for tasks requiring high precision [7].
These traditional methods, however, fail to capture texture features across multiple scales, limiting their effectiveness for complex textures [8,9]. These limitations underline the importance of choosing appropriate techniques based on specific application needs.
Recent developments in deep learning, particularly convolutional neural networks (CNNs), have revolutionized texture analysis by enabling automatic feature extraction and classification with unprecedented accuracy [10].
CNNs use local receptive fields to analyze small, specific regions of an image, enabling them to capture spatial hierarchies and effectively distinguish subtle texture variations among different textiles [11]. However, the integration of multimodal inputs—such as combining traditional texture descriptors (GLCMs, LBPs) with advanced albedo-based feature maps—remains underexplored. Moreover, the ability of CNNs to handle the complexities of fabric textures, such as overlapping macro- and microstructures or materials with similar spectral properties, needs to be thoroughly investigated.
This study addresses several research gaps by focusing on key areas of improvement in fabric texture classification. First, it explores the integration of multimodal data, combining traditional handcrafted features such as GLCMs and LBPs with deep-learning-based albedo-dependent feature maps to enhance classification accuracy. Second, it investigates the challenge of handling complex texture variability, particularly for fabrics with similar spectral properties, like cotton–polyester or satin–silk pairs, which often lead to misclassification due to overlapping frequency distributions. Lastly, the study emphasizes the practical applicability of its methods by testing them on datasets that reflect real-world lighting and material reflectivity conditions, addressing limitations in many existing approaches.
A systematic review conducted in [11] explores how AI can help to make the fashion and textile industries more sustainable, focusing on the transition to a circular economy. This confirms the relevance of research on the potential of AI, especially in the field of the recycling and sorting of clothing. There is great potential, but larger and better datasets, as well as interdisciplinary collaboration, are needed. Among the current trends in textile analysis, object detection models based on the YOLO architecture have attracted considerable attention, demonstrating high potential for real-time fabric defect recognition tasks. In particular, in [12], a YOLOv8-based approach was proposed for fabric defect detection in collaborative human–robot interaction, which provides high accuracy and a low inference time. Although this study focused on fabric classification using multimodal surface features and deep learning, recent advances in real-time fabric defect detection, such as YOLOv8-based models, show promising results in related tasks.
CNNs have proven highly effective in visual pattern recognition tasks and have become the dominant approach in modern computer vision. Their layered architecture allows for automatic feature extraction and spatial hierarchy learning through backpropagation [13]. AI can be the key to circular fashion if adapted to the real needs of industry. This study aims to develop a robust pipeline for fabric texture classification that leverages the strengths of multimodal data integration and advanced CNN architectures. By combining traditional texture descriptors with albedo-based feature maps and training CNNs, this research seeks to improve classification accuracy and provide deeper insights into fabric texture variability.

2. Materials and Methods

2.1. Dataset and Preprocessing Pipeline

In this study, we use The Fabrics Dataset from [14], which comprises over 2000 samples of garments and fabrics (Table 1). The dataset has been collected in real-world environments, ensuring that it accurately reflects the natural distribution of textiles. The images in the dataset were acquired using a portable photometric stereo sensor equipped with four directional white LED arrays. Each surface patch was imaged under four illumination angles. Although exact spectral profiles and intensity values are not provided in the dataset documentation, the lighting setup ensures high contrast and shadow diversity required for photometric stereo. Illumination calibration was performed using a chrome sphere and a flat surface with known albedo, enabling the recovery of light vectors and image normalization, respectively. For our research the dataset was split into training, test, and unseen subsets for each fabric type. The unseen set includes samples not previously used in model development, allowing for the evaluation of generalization performance.
Although direct measurements of surface roughness were not performed, the dataset used in our study provides micro-geometry information through photometric stereo. This technique captures surface normals and fine topographic details, which are highly correlated with tactile roughness. The deep learning model operates on reflectance and texture cues derived from this setup, allowing it to distinguish between subtle material differences. Therefore, while we cannot present quantitative surface roughness validation, the model’s decisions are indirectly grounded in geometry-based roughness information.
Table 2 provides additional characterization of each fabric group regarding observed textile weaves, dominant weave type, and typical fiber compositions.
To ensure high accuracy of textile texture analysis, a methodology combining classical approaches to feature extraction with modern deep learning methods was used. To capture and analyze complex surface textures from images accurately, the following feature extraction pipeline was designed (Figure 1). This pipeline outputs pre-processed images optimized for training CNNs. Figure 1 illustrates the steps and methodologies used in developing the feature extraction pipeline. The resulting data is presented in a format that is suitable for benchmarking. As can be seen from Figure 1, textural feature extraction is executed with a GLCM for capturing overarching patterns, and LBPs for revealing fine micro-textures. Three-dimensional surface reconstruction is carried out with a Poisson distribution method, and photometric stereo techniques enhance depth perception and surface detail. Albedo mapping is used for analyzing light distribution and reflectance, analyzed through hue, saturation, and value, and the creation of detailed feature maps reflecting surface properties. Fourier transform and fractal analysis quantify and benchmark texture structures with precision for texture analysis metrics. Spectral variations are analyzed across channels to differentiate complex surface textures for multi-channel analysis.

2.2. Traditional Image Processing Methods

Feature extraction is carried out with the GLCM for extracting global texture patterns, and LBPs for identifying fine-grained texture details.
The GLCM method calculates the frequency with which a pixel of intensity i appears in a specific spatial relationship with a pixel of intensity j, creating a matrix that captures large-scale fabric patterns. Homogeneity and key texture features such as contrast, correlation, and energy can be derived by analyzing the GLCM. Contrast measures the intensity difference between neighboring pixels and energy quantifies the uniformity of the texture [15].
The local binary pattern (LBP) method is a simple yet effective technique for extracting micro-textures. It evaluates the local neighborhood of each pixel by encoding the intensity relationships between a center pixel (pc) and its neighboring pixels (pn) within a specified radius (R). The LBP encodes the local texture of each pixel into a binary pattern, which can be used to generate a histogram representing the texture distribution in the image. This histogram provides a detailed description of micro-level surface variations, making the LBP a powerful tool for capturing details of fine-grained texture [16].
Performing 3D image reconstruction using extracted macro- and micro-textures begins by separately computing the gradients for both texture types. These gradients form a unified field used to solve the Poisson equation:
Δ S = d i v g ,
where S represents the surface to be reconstructed and g represents the gradient field derived from the image data. Solving this equation gives a surface that aligns with the observed texture gradients, allowing for accurate 3D reconstruction.
Surface normal extraction is a method in photometric stereo used to determine the orientation of surface elements by analyzing changes in light intensity. By capturing images of a surface under varying lighting conditions, it becomes possible to calculate surface normals, which play a crucial role in reconstructing the surface’s 3D geometry [17]. The obtained surface normals can be used to construct the three-dimensional geometry of the samples using modern reconstruction approaches such as 3D Gaussian splatting [18]. This method allows for integrating the surface orientation into the spatial model, providing a realistic reproduction of the shape and relief of the object with the possibility of further rendering from different viewing angles. Although this approach was not used in this study, methods such as 3D Gaussian splatting are of interest for the further improvement of three-dimensional reconstruction based on surface normals.
The albedo-dependent feature map analyzes light distribution across a material’s surface while minimizing lighting effects. The image is converted from RGB to HSV color space, separating color (hue, saturation) from intensity (value) for better texture analysis [19].
Means and standard deviations are calculated for each channel, followed by normalization (channel value-mean)/(std + 1 × 10⁻⁵). The small value 1 × 10⁻⁵ is added to prevent division by zero.
Normalized values are scaled to [0, 1] and combined into a single map that encodes texture information from all HSV components. This feature map, sensitive to surface reflectance, effectively captures texture characteristics for fabric analysis.
To convert spatial data into the frequency domain, the fast Fourier transform (FFT) is commonly used in signal and image processing. The FFT is an efficient algorithm used to compute the discrete Fourier transform (DFT) of a sequence. Applying an FFT to the GLCM enables frequency analysis of texture patterns and periodic structures. The FFT of the GLCM reveals texture frequency components, where peaks in the spectrum highlight dominant patterns, which are high frequencies that represent fine textures and low frequencies that correspond to coarse textures [20].
Applying an FFT to the LBP histogram helps to determine the frequency of texture patterns across the image. The FFT of the LBP histogram provides insight into the periodic nature of texture patterns. Peaks in the frequency domain indicate recurring textures. The distribution of energy across frequencies helps to distinguish between different types of micro-textures. Since the LBP encodes local variations in intensity, the combination of an FFT with an LBP enables a more robust differentiation of textures, particularly for materials with periodic or quasi-periodic patterns. This analysis is crucial for micro-texture recognition tasks [21,22].
The albedo-dependent feature map consists of multiple channels (hue, saturation, and value) obtained from the HSV color space. Applying FFTs to each of these channels allows for a frequency-based analysis of the texture’s periodicity and orientation. The combined FFT of these channels can be represented as follows:
F F T H u e u ,   v +   F F T S a t u r a t i o n u ,   v +   F F T V a l u e u ,   v
The combined FFT output provides a comprehensive frequency-based analysis of the texture, incorporating both chromatic and luminance information:
  • Hue Channel: Peaks may correspond to color patterns.
  • Saturation Channel: Peaks reveal color intensity variations.
  • Value Channel: Peaks reflect texture variations.
Analyzing these peaks enables a deeper understanding of the texture’s albedo-dependent properties, facilitating more detailed and accurate texture interpretation.
The fractal dimension is a statistical measure that quantifies the complexity of a texture by evaluating how detail changes with scale. It measures textures’ self-similarity and roughness [23]. The fractal dimension D is computed using the box-counting method, where N(ε) represents the number of covering elements (boxes) needed at scale ε. The ratio of logarithms determines how detail changes with scale, providing a statistical measure of texture complexity:
D   = lim ε 0   log N ε log 1 ε .
The process involves applying FFTs to the GLCM and LBP histogram for frequency analysis and identifying dominant frequencies. FFTs are also computed for the HSV channels of the albedo feature map, with outputs combined for a comprehensive texture representation. The fractal dimension of the GLCM is calculated using the box-counting method, while the LBP fractal dimension is derived from histogram entropy, aiding in detailed texture interpretation. Histogram entropy is a measure of randomness or complexity in an image’s texture. It quantifies how uniformly or diversely pixel intensity values, or texture features, are distributed.

2.3. Deep-Learning-Based Texture Classification

Four modern CNN architectures were selected for their proven ability to capture spatial hierarchies in texture data.
InceptionV3 is known for its multi-scale feature extraction through parallel convolutional filters, leveraging factorized and asymmetric convolutions. It was chosen to identify textures at varying scales, particularly in fabrics with intricate patterns. ResNet50_V2, which uses deep residual connections, enables efficient learning by addressing the vanishing gradient problem. These residual connections allow the network to bypass layers through shortcut connections, preserving important texture information across deeper layers. This enhances the ability to capture complex hierarchical features, particularly beneficial for distinguishing fabrics with overlapping spectral properties. DenseNet, selected for its efficient feature reuse through densely connected layers, shows good results in capturing fine-grained textures, such as polyester weaves. VGG-19’s sequential architecture provided strong baseline accuracy for textile classification tasks, making it a reliable benchmark [24,25,26].
These four models were used for fabric texture classification using two-modality late fusion models, emphasizing the comparison between different models’ performance, focusing on the layer types, output shapes, parameter numbers, and how these layers are connected. Late fusion is a technique in deep learning where different modalities or input types are processed separately through their neural network branches and then fused at a later stage, typically before the final classification layers. This approach is particularly beneficial when dealing with multimodal data, such as in this case, combining local binary pattern (LBP) features with albedo-dependent feature maps. By processing each input modality independently, the network can learn specialized features from each input type, which are then integrated to improve the overall classification accuracy.
This strategy allowed the network to specialize in feature extraction for each modality, improving classification accuracy for challenging fabric pairs.
To capture both macro- and micro-textures, we combined the GLCM for spatial intensity relationships and the LBP for fine-grained texture patterns. The GLCM was constructed, normalized, and used to compute key descriptors like contrast and energy, characterizing large-scale texture structures. The LBP encoded local intensity differences, generating a histogram that represents micro-texture distribution.
To minimize lighting effects, an albedo-dependent feature map was created by converting images to the HSV color space, normalizing each channel, and merging them into a unified representation of surface reflectance properties.
For frequency-domain analysis, FFT was applied to the GLCM, LBP histograms, and HSV channels, identifying dominant frequencies linked to texture periodicity. Additionally, fractal dimension analysis quantified texture complexity: the box-counting method assessed GLCM fractality while LBP entropy measured micro-texture variability. These features provided a robust basis for classification and texture differentiation.
The data preprocessing pipeline was designed to handle two types of images: LBP images and albedo-dependent feature maps. A dual-input approach was implemented for the late fusion model, where images were paired based on filename prefixes to ensure correct alignment. Each image was resized to 224 × 224 pixels and normalized to [0, 1] for compatibility with VGG−19 and other deep learning models.
The optimal hyperparameters from Table 3 are used to train every model during experimentation.

3. Results and Discussion

3.1. Macro- and Micro-Texture Analysis

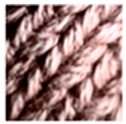
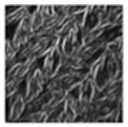
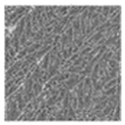
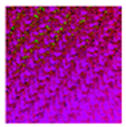
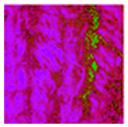
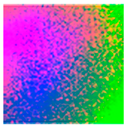
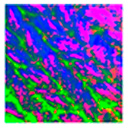
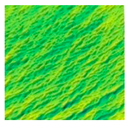
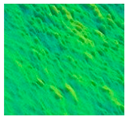
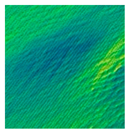
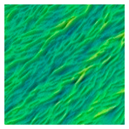
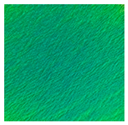
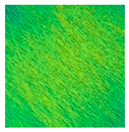
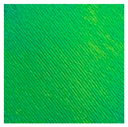
The outcomes of macro- and micro-texture extraction and the generation of albedo-dependent feature maps for four fabric types—denim, acrylic, nylon, and cotton—are presented in Table 4. Macro-textures were analyzed using the GLCM, while the LBP captured fine-grained micro-textures. Albedo-based feature maps further highlight variations in surface reflectance across the fabrics.
Additionally, 3D reconstructions of these textures provided a detailed view of the surface characteristics and structural properties of each material. The results demonstrate the effectiveness of the proposed methods in accurately capturing both texture details and material-specific properties, validating the robustness of the approach.
As shown in Table 4, the GLCM and LBP analyses highlight distinct differences in texture details between textile samples. The GLCM captures macro-textures, represented by broader, overarching patterns evident in the 3D reconstructions. The 3D reconstruction shows the relief of the texture, providing a deeper understanding of its structure. In contrast, the LBP focuses on finer micro-textures, offering a detailed view of the fabric’s intricate structure. The albedo-dependent feature maps further reveal reflectivity differences, e.g., the cotton sample exhibiting lower reflectivity than nylon (Table 4), showcasing the pipeline’s ability to capture surface variations for material classification accurately.

3.2. Frequency Domain Analysis via FFT

The graphs in Figure 2 show the spectral analysis of fabric textures using FFT applied to the albedo-dependent feature map. They show the distribution of frequency components for the RGB channels.
In Figure 2a, the FFT peaks for the RGB channels are compact and closely aligned, with similar magnitudes near the center, indicating a uniform surface reflectivity. In Figure 2b, although the FFT across the channel numbers appears to be smoother, e.g., for the blue channel, the envelope that contains all the channels is rather broad overall. Specifically, the amplitude difference between the blue and green channels is approximately 0.5, while, between the blue and red channels, it reaches 4. This suggests that the nylon sample has higher reflectivity variability and more pronounced surface irregularities. These findings confirm that FFT effectively captures and differentiates material properties based on frequency domain analysis.
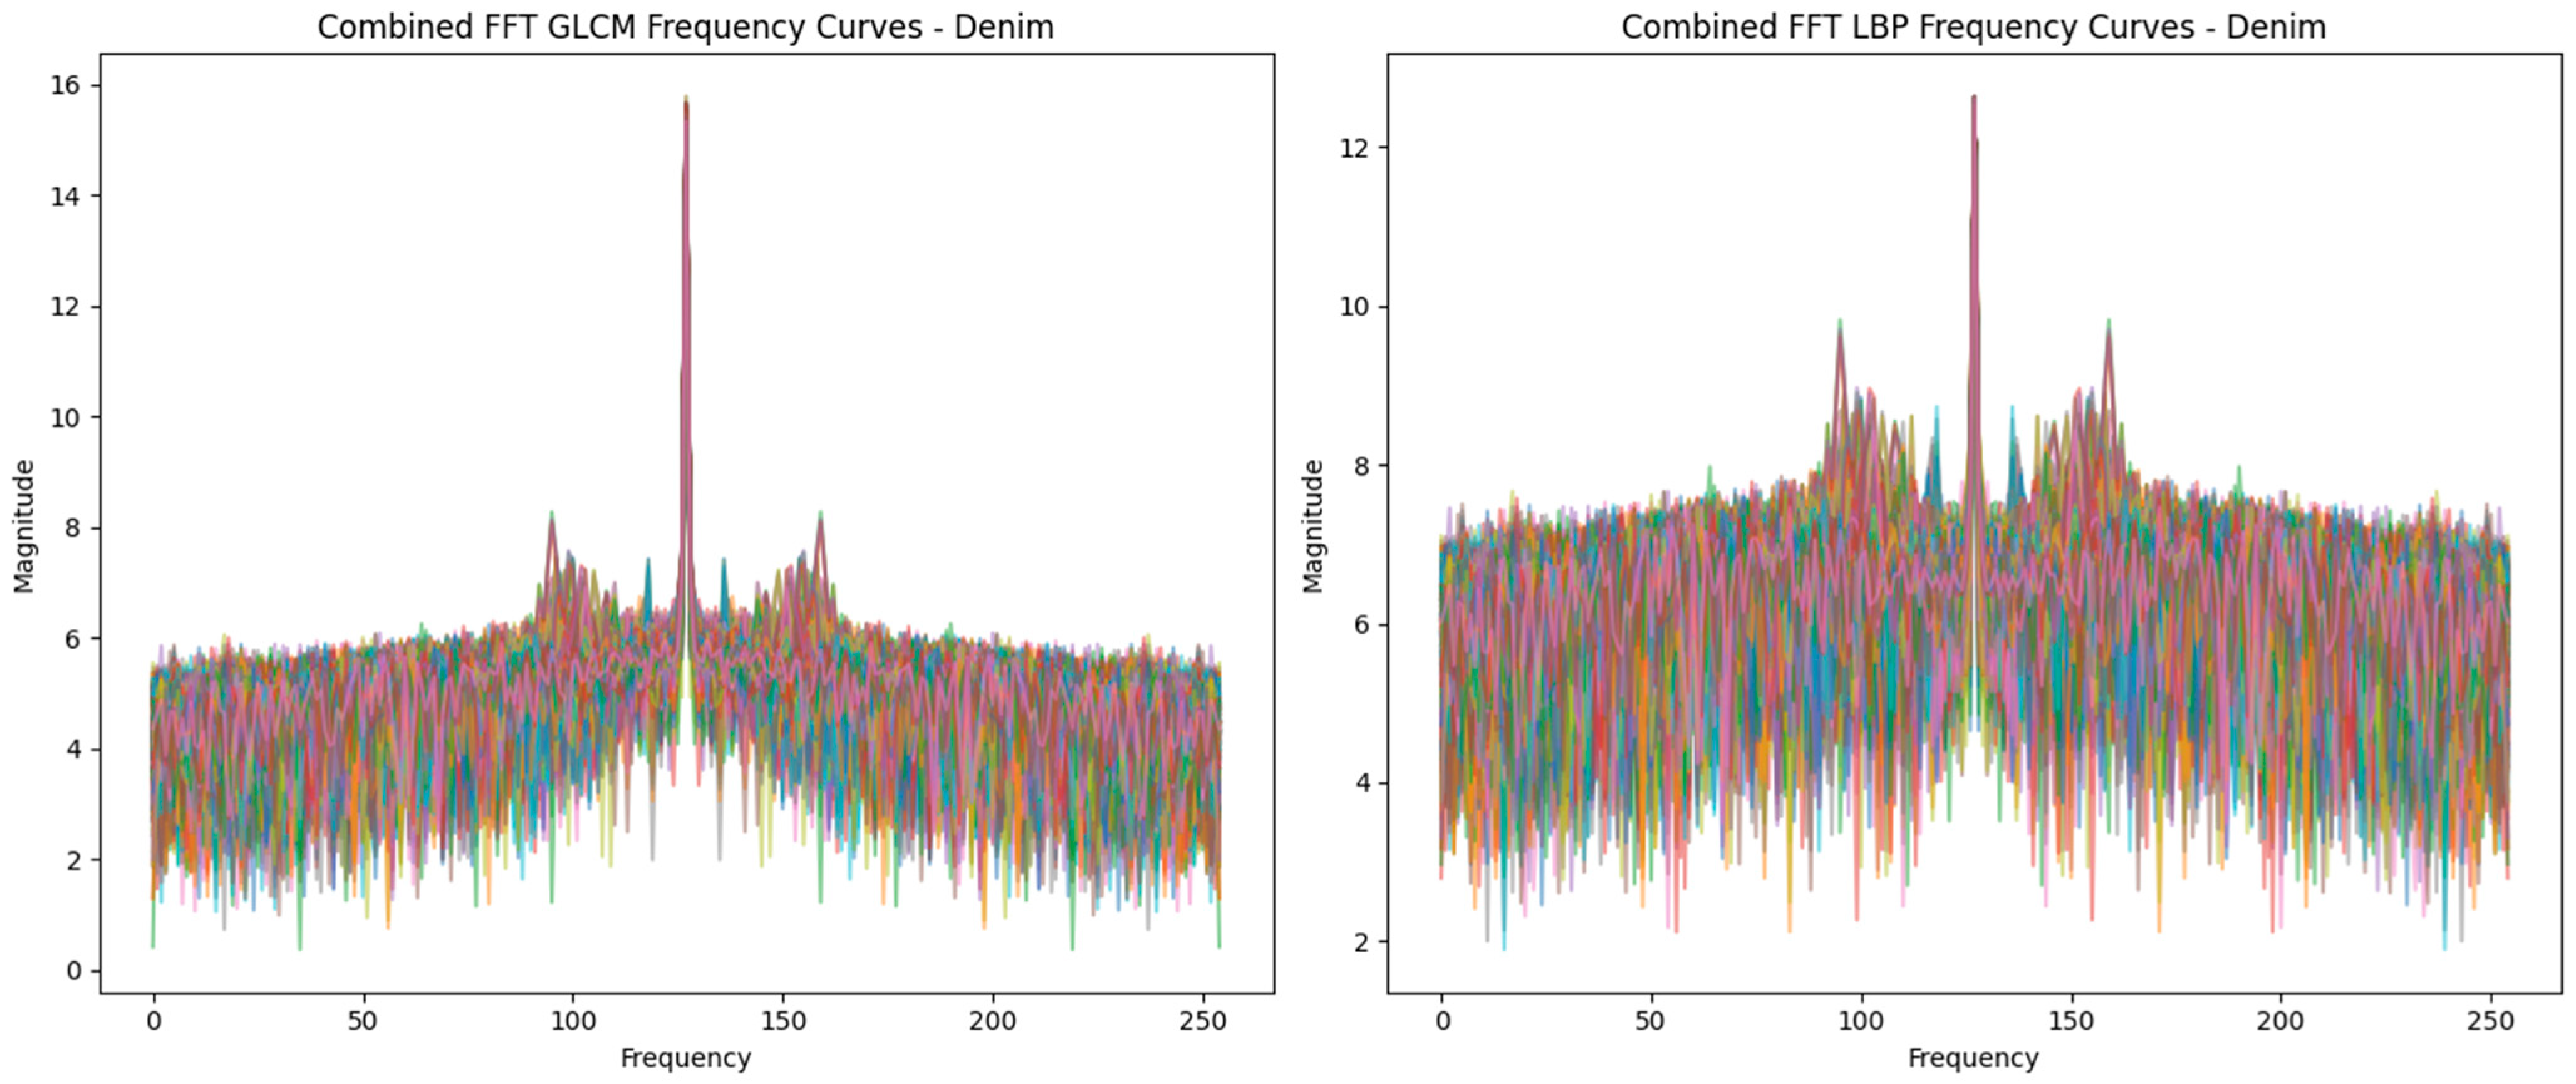
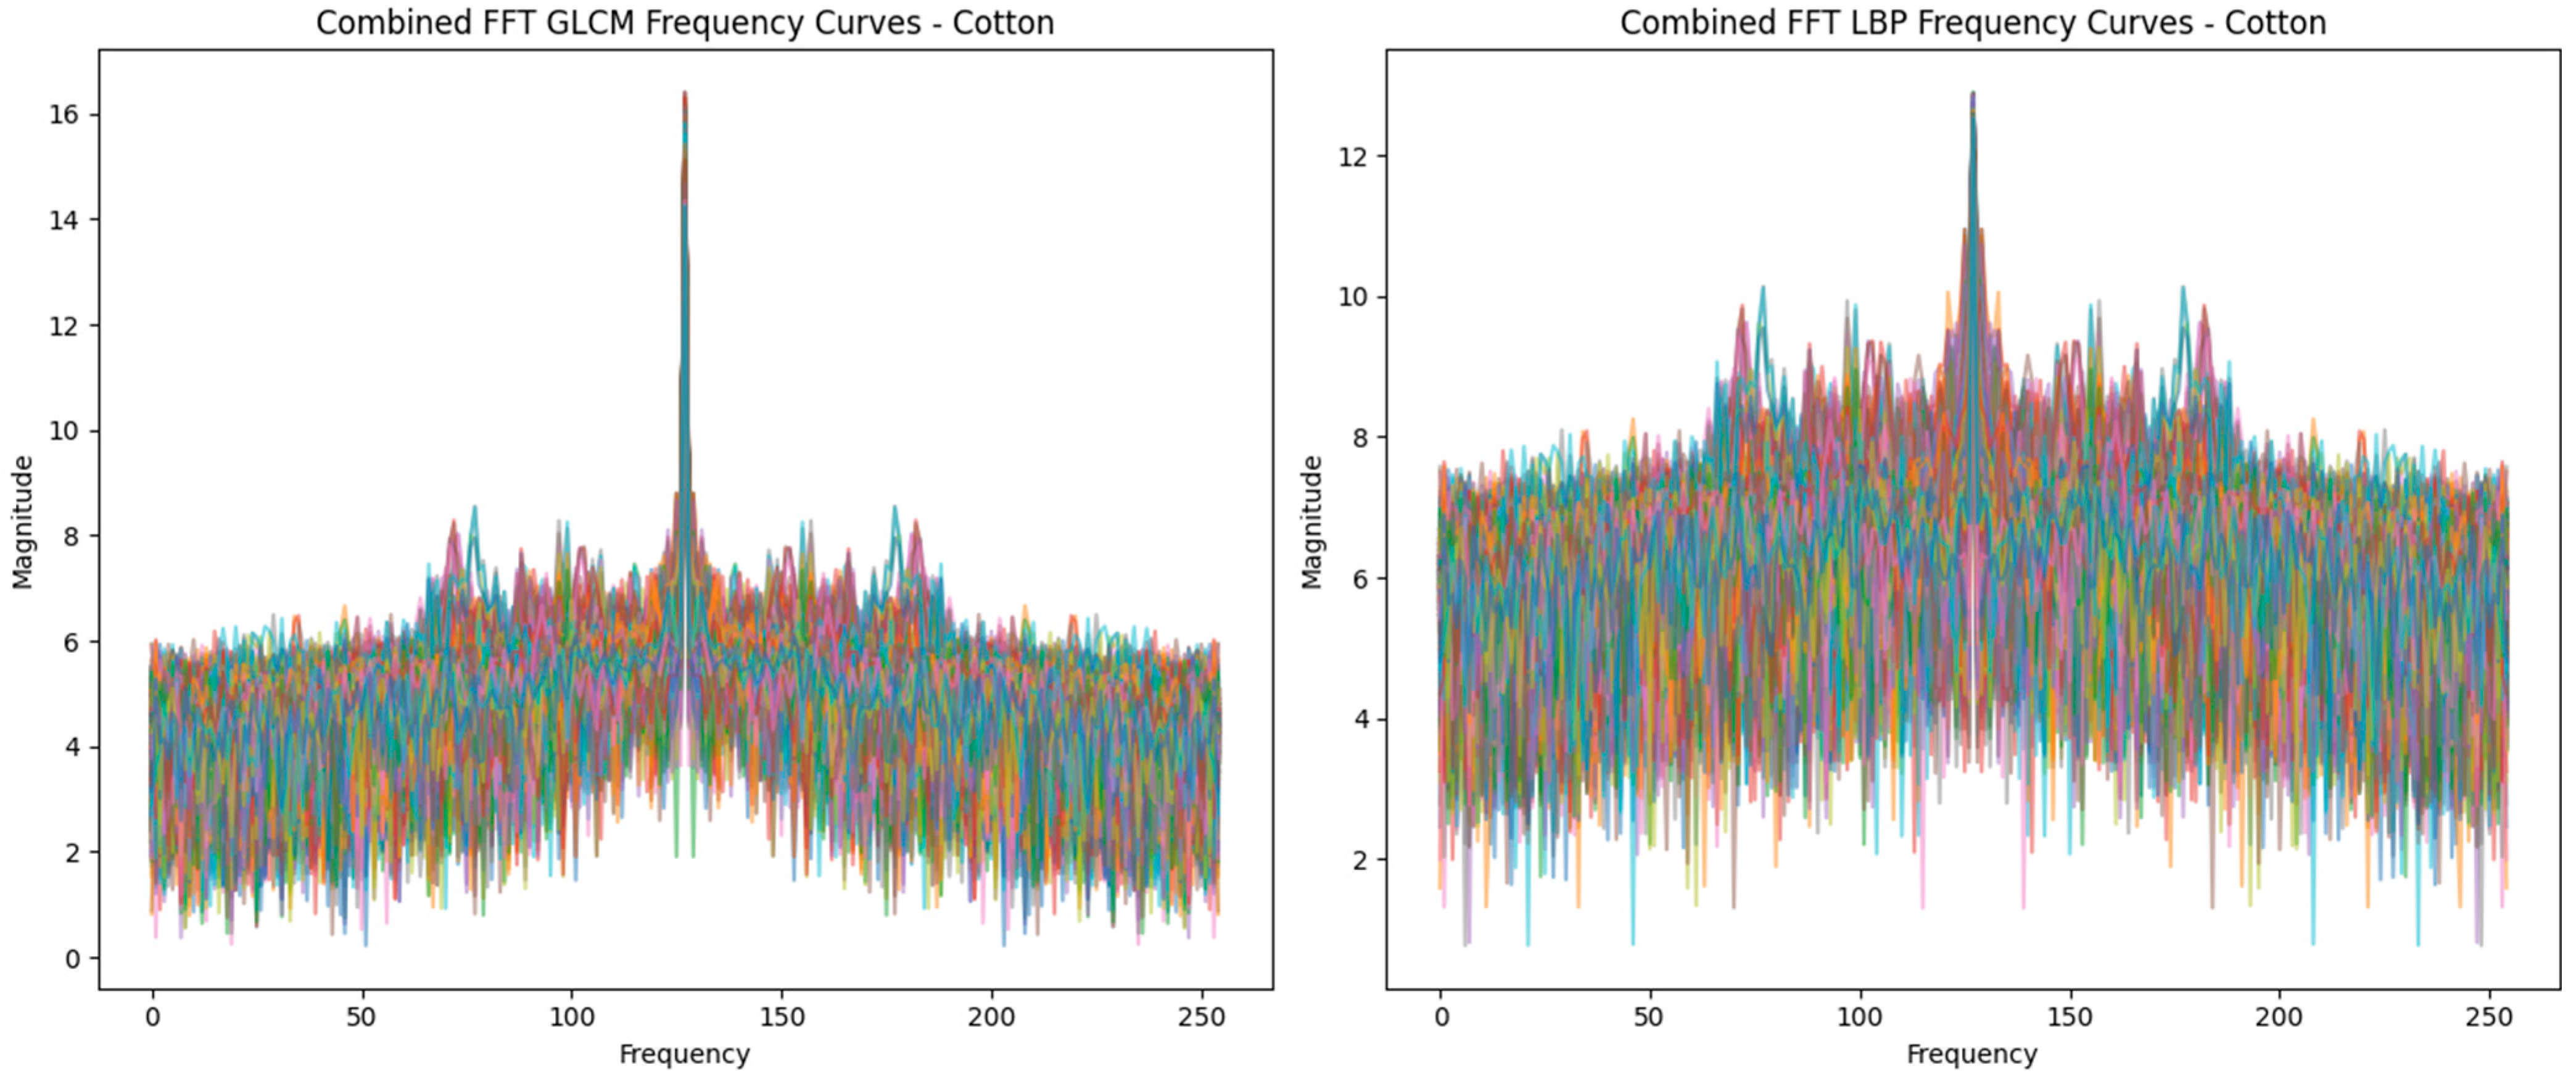
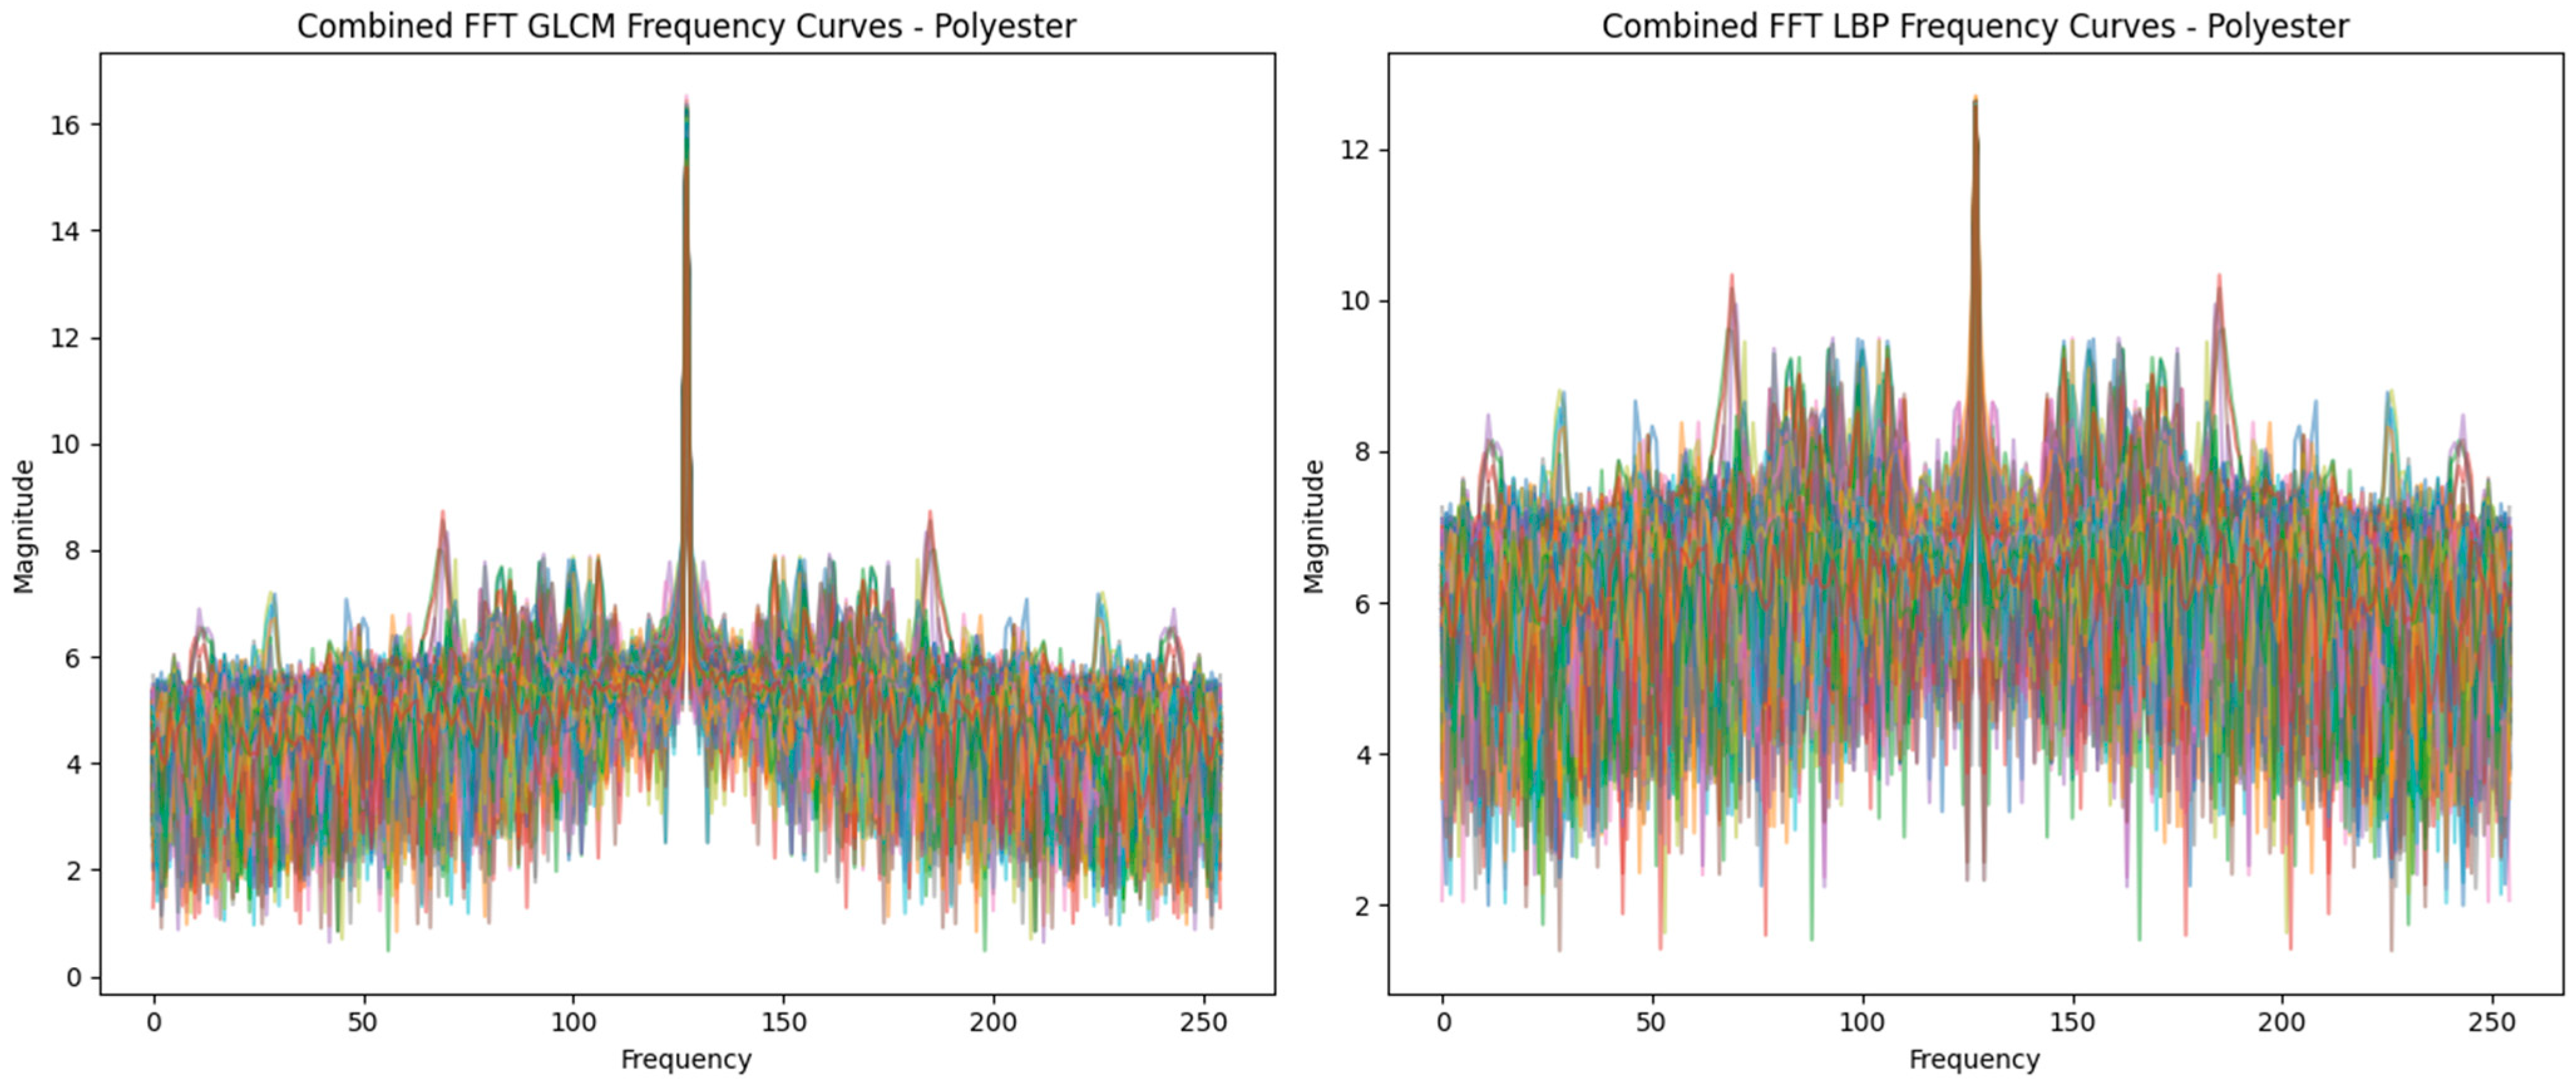
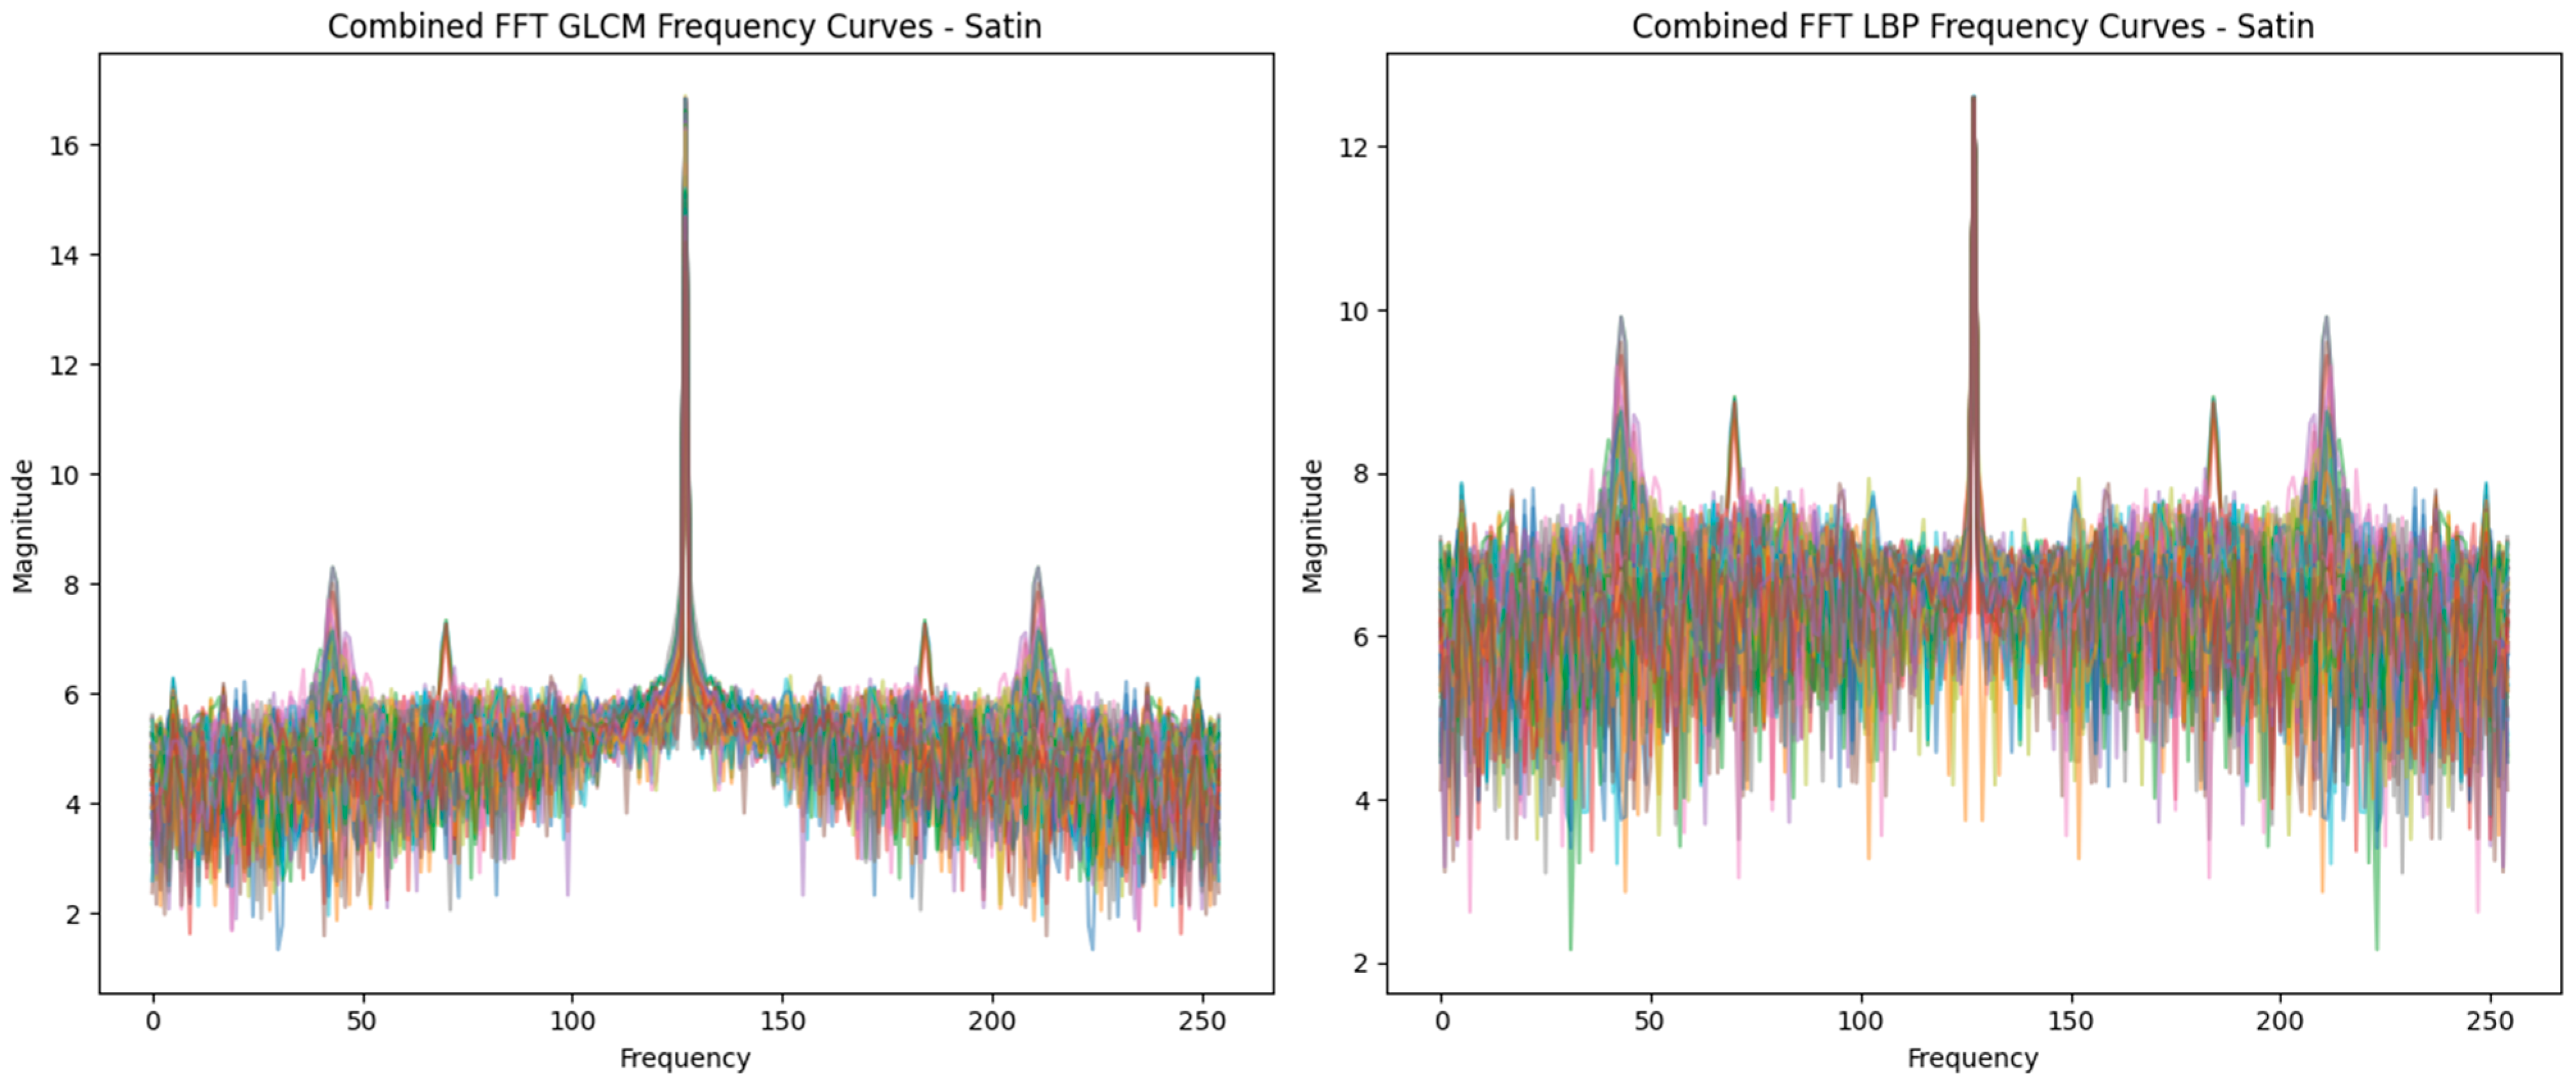
The combined FFT analysis of GLCM and LBP features reveals key differences across fabrics. For example, Figure 3 (denim sample) shows a well-defined 3-fold spatial periodicity with peaks at 100 Hz, 125 Hz, and 150 Hz. In contrast, Figure 4 (cotton sample) exhibits multifold periodicity, with peak ranges between 65 and 120 Hz and 130 and 175 Hz, reflecting greater texture complexity. In Figure 5, for the polyester sample, a pronounced dominant peak is observed in the FFT spectra for both the GLCM and LBP at approximately 125 Hz, indicating the presence of pronounced spatial periodicity of the texture.
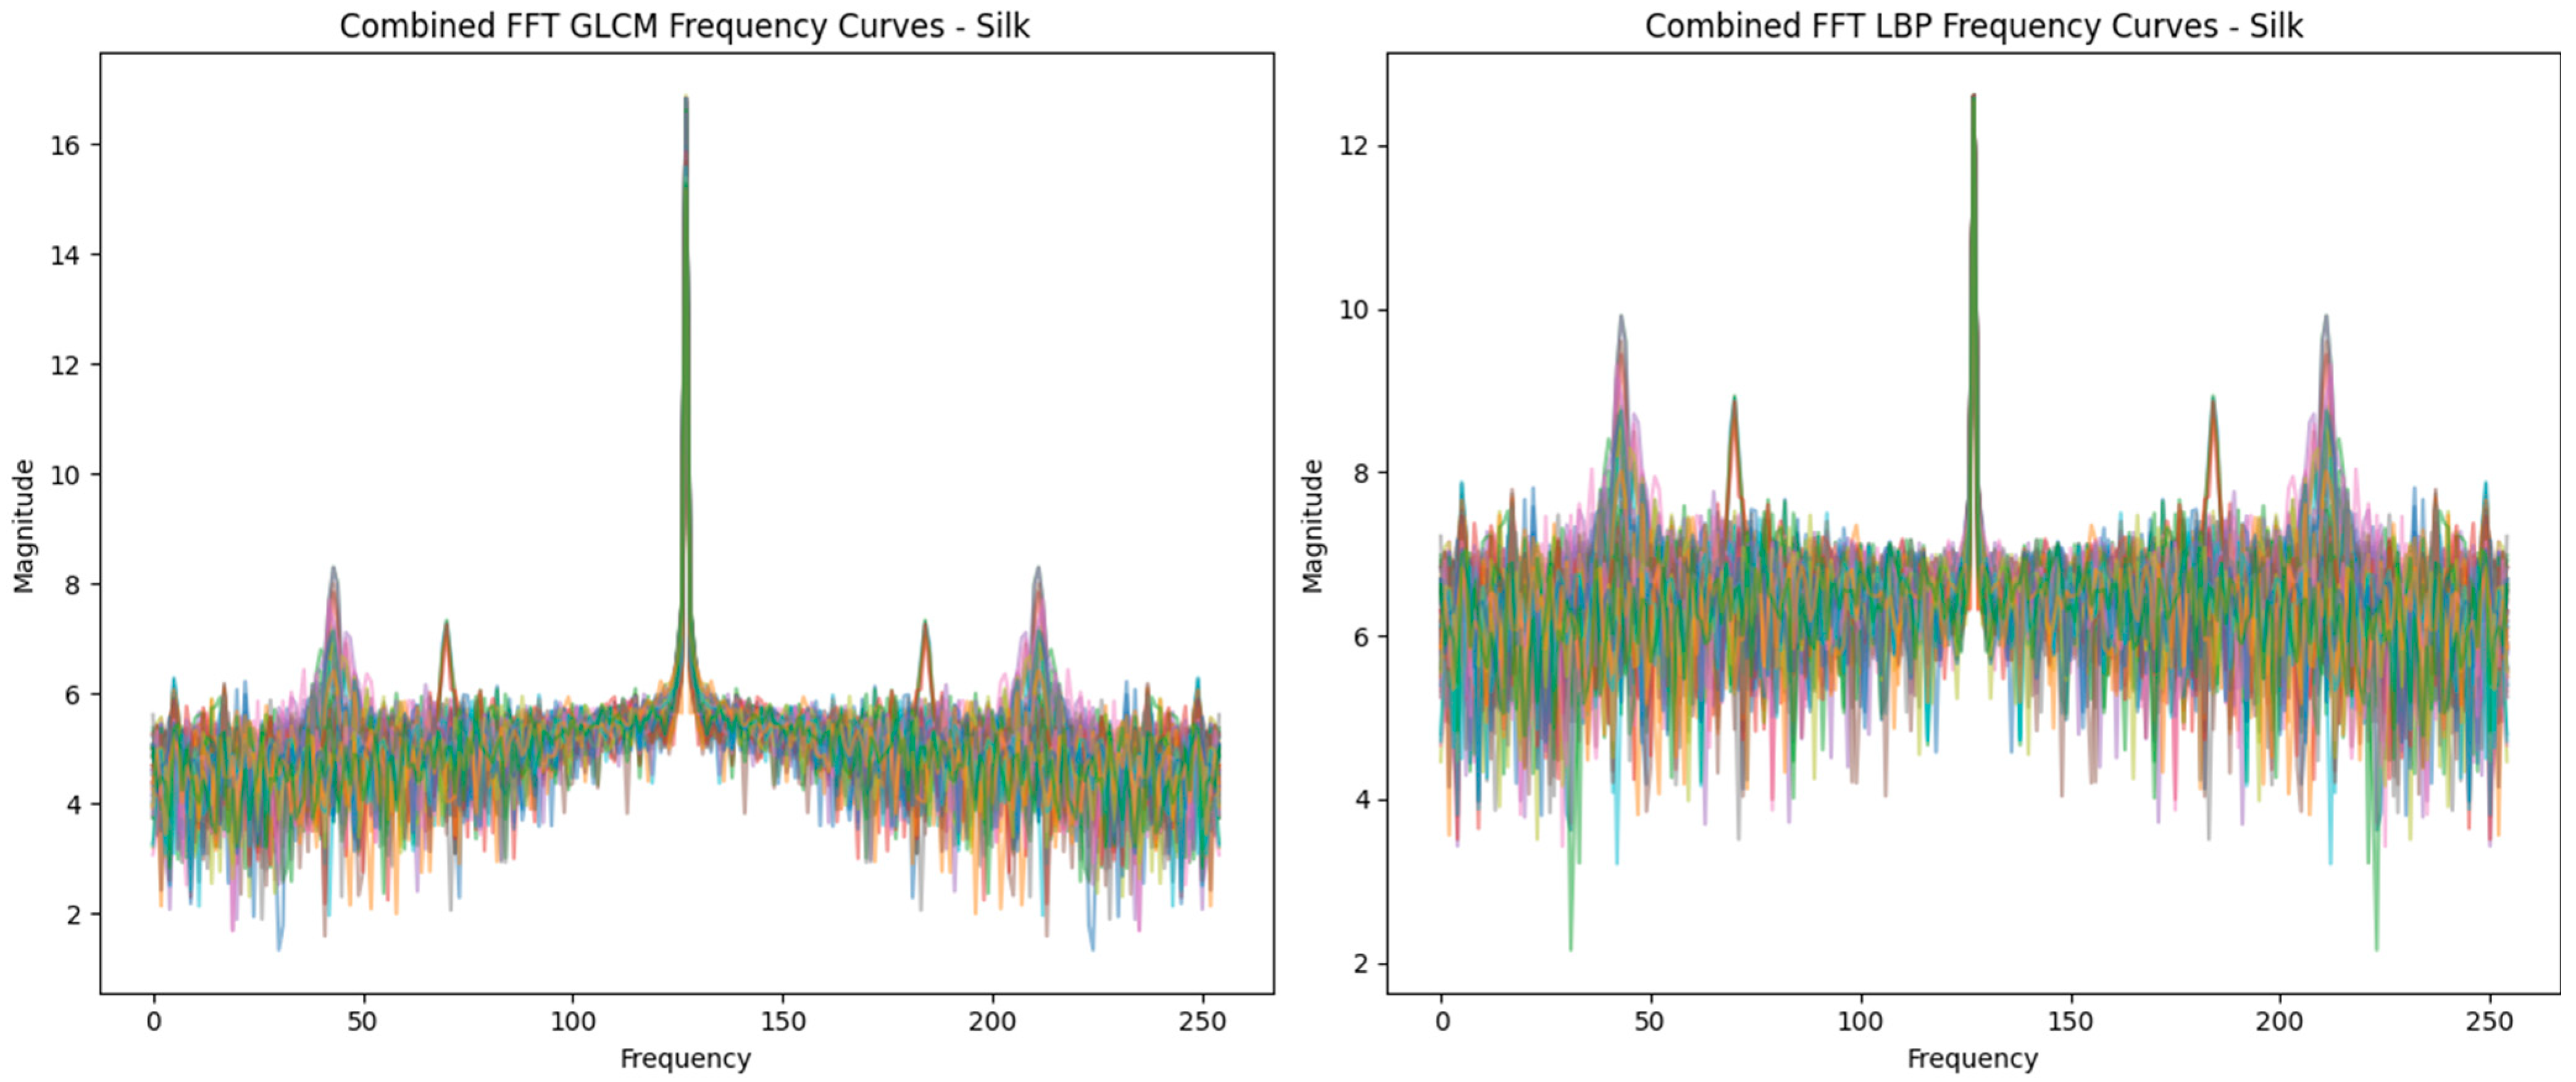
Figure 6 (silk) and Figure 7 (satin) exhibit similar FFT distributions, reflecting their shared smooth surface properties. However, differences in periodicity highlight distinct material structures. The FFT spectra show a dominant peak around the central frequency, with fewer secondary peaks, indicating a more uniform and regular surface texture, but the spectra are both rich and sufficiently complex to indicate a greater variation in texture due to differences in the weave patterns. These variations in periodicity and spectral distribution confirm that while both materials share similar optical properties, their underlying surface structures differ.
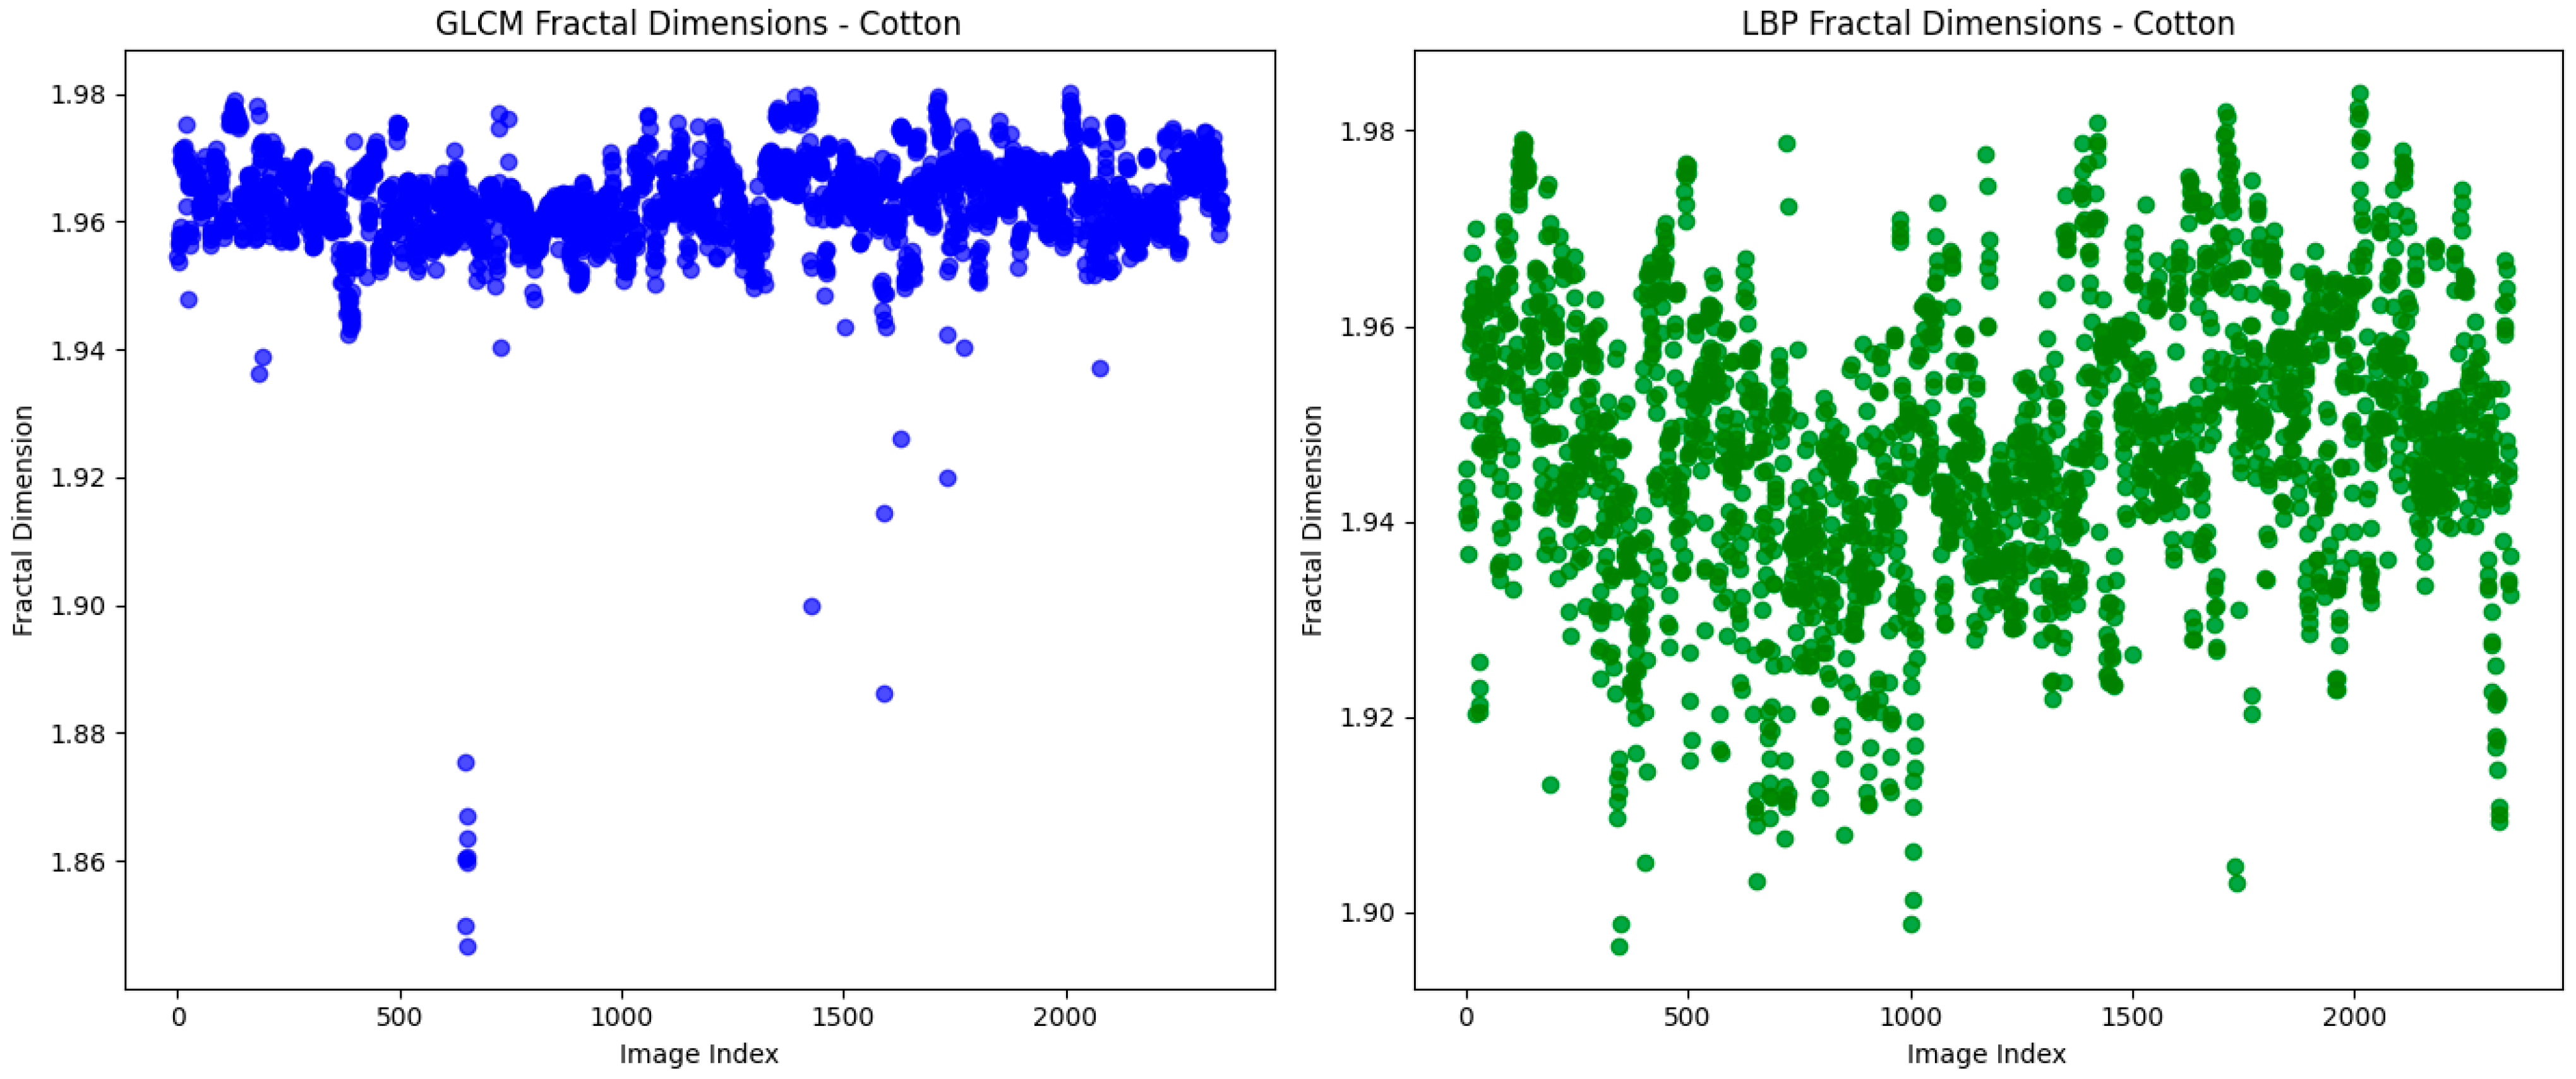
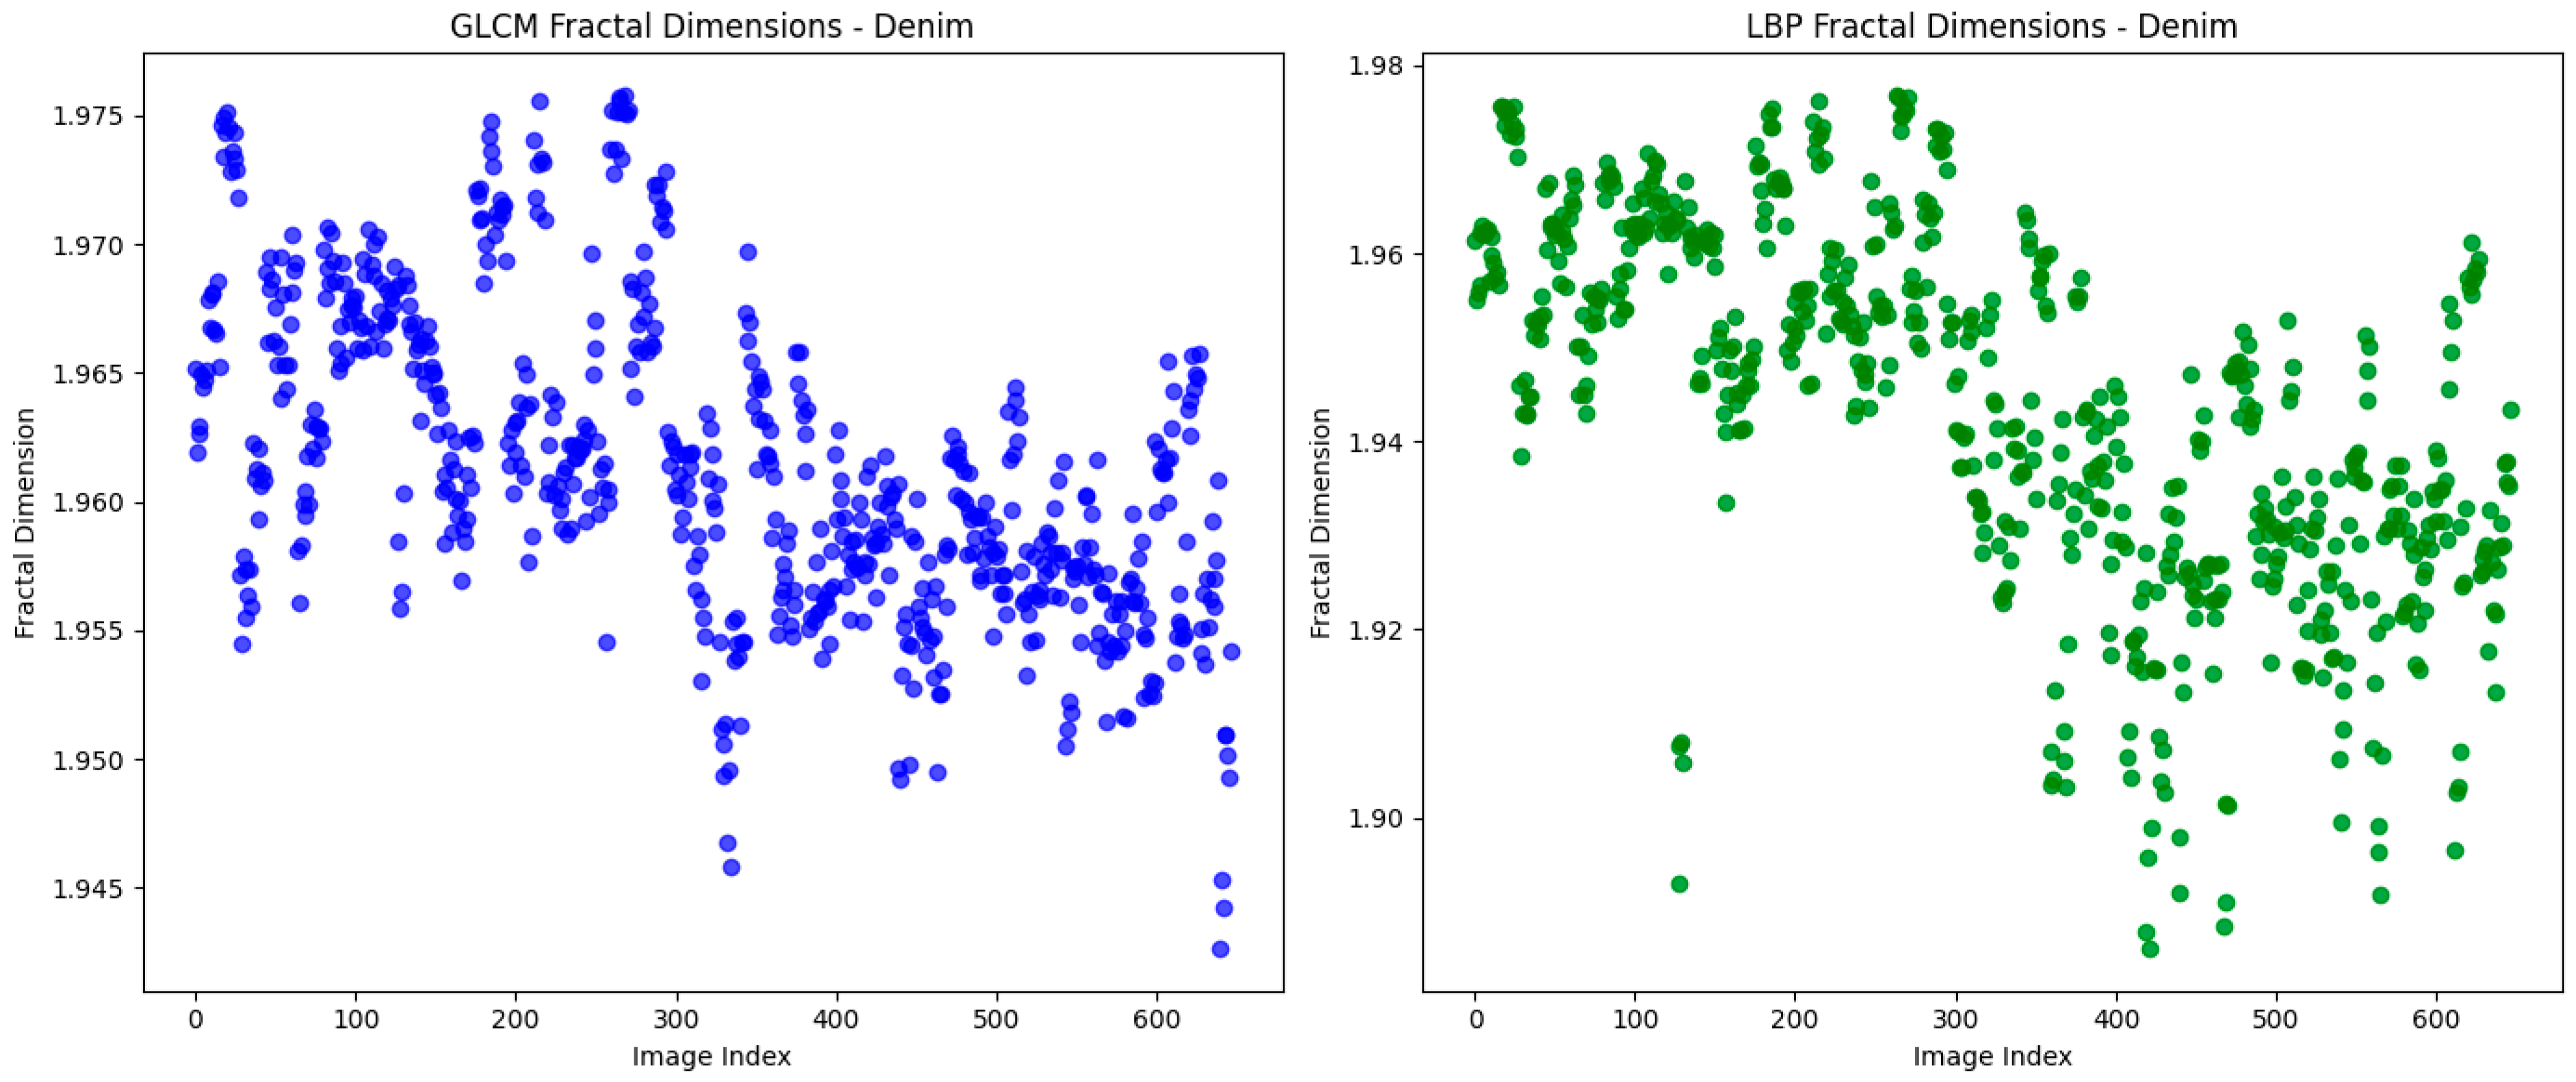
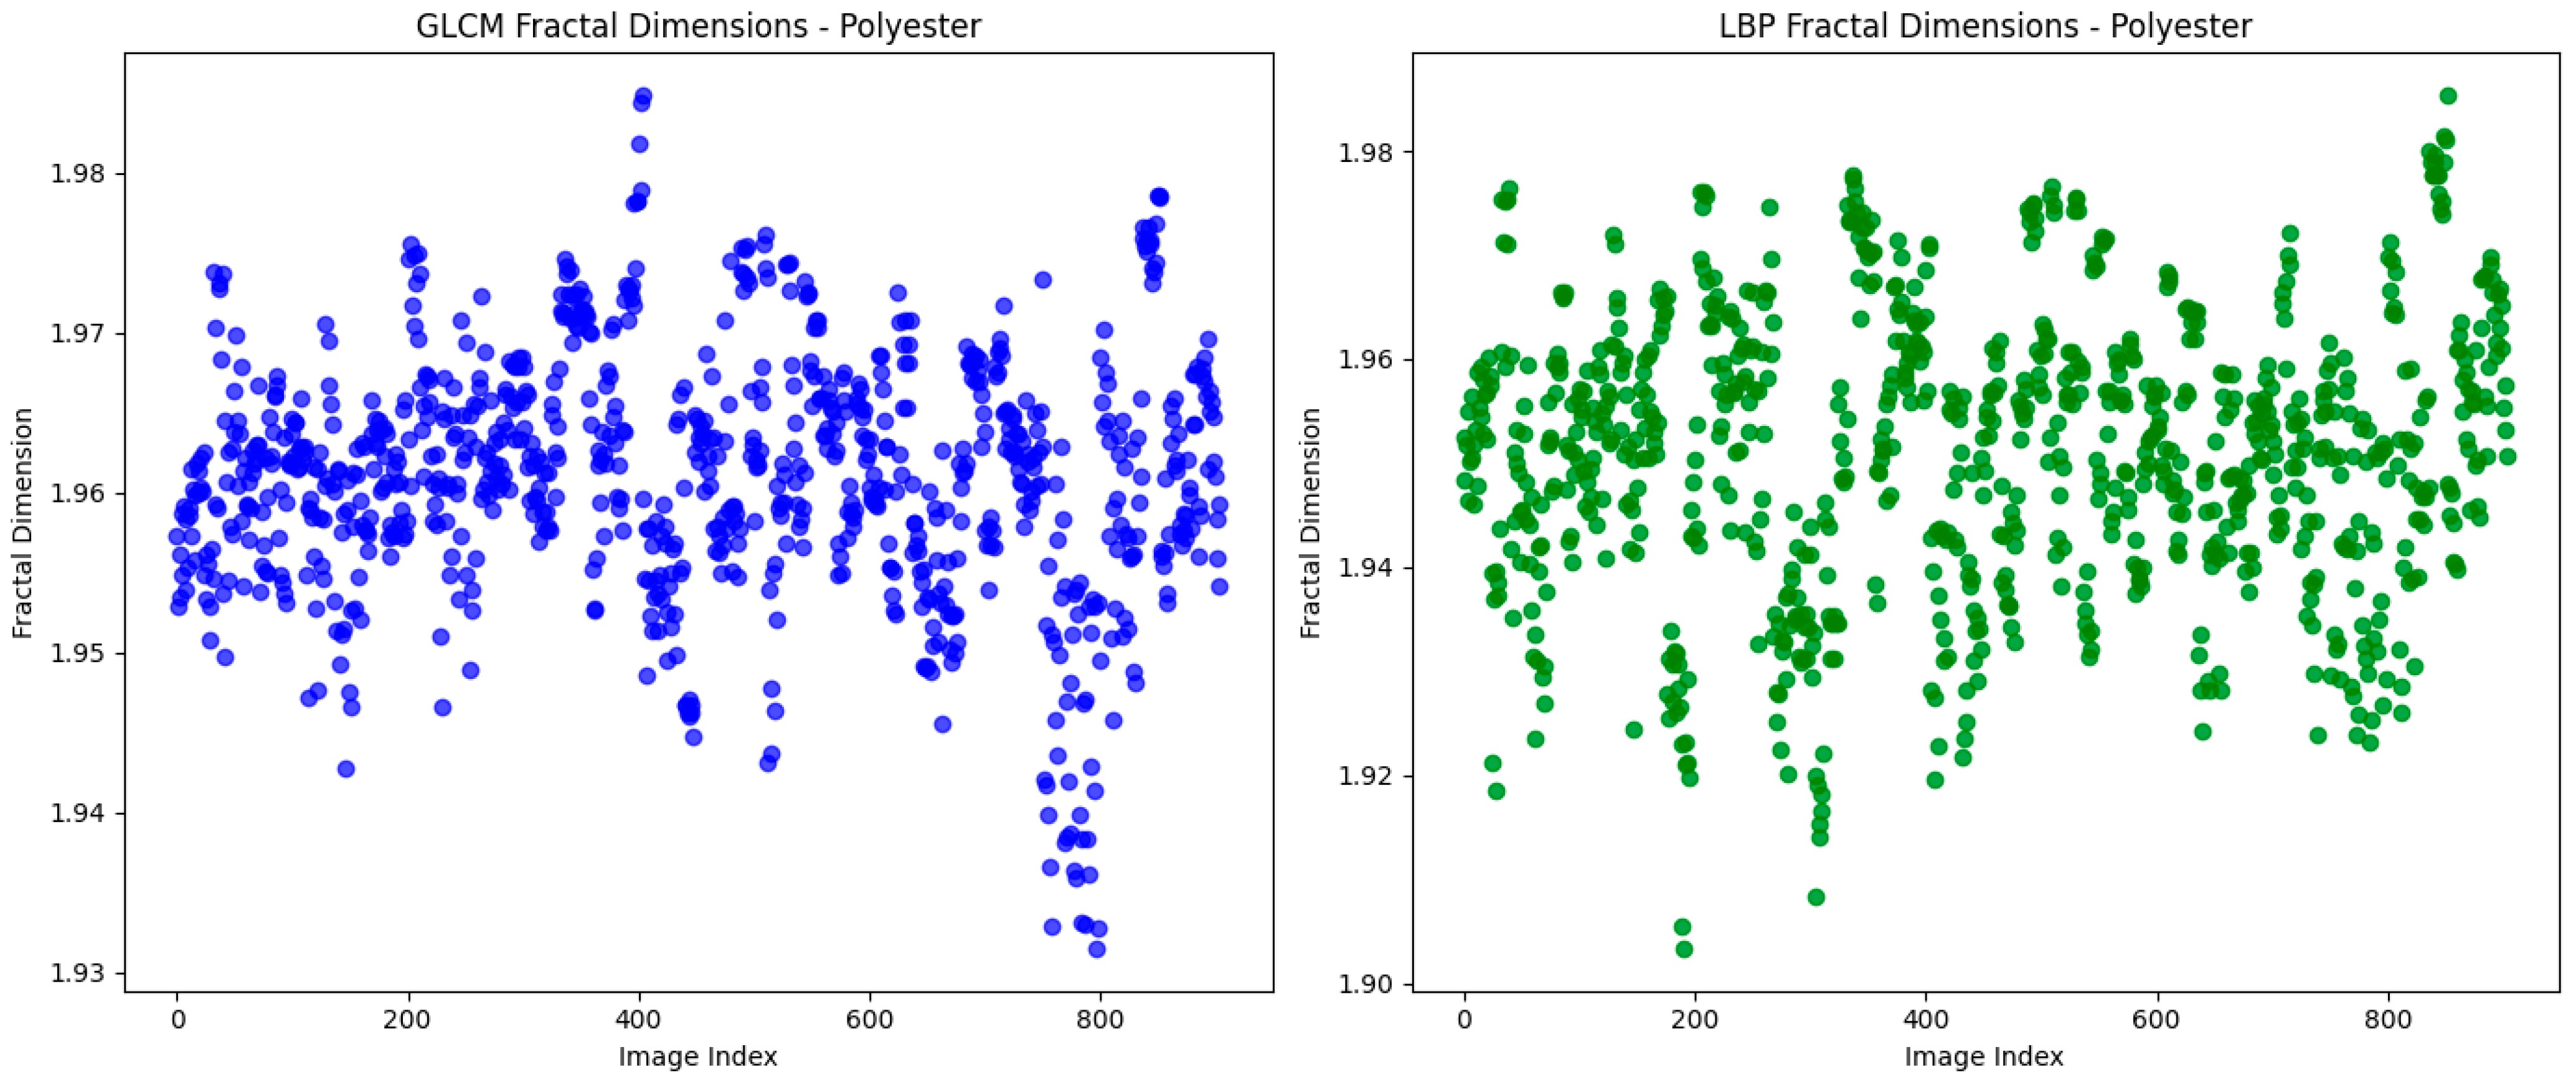
The fractal dimension analysis provides additional insights (Figure 8, Figure 9 and Figure 10). While a clear numerical correlation with FFT results has not been established, both analyses highlight complementary aspects of texture characterization. The results in Figure 8 indicate that cotton exhibits the highest variation in fractal dimension (~1.94), reflecting its complex and irregular texture. Polyester (Figure 10) demonstrates a more uniform structure, with an average fractal dimension of ~1.943 and minimal fluctuations. Denim (Figure 9) occupies an intermediate position, with GLCM values close to polyester (~1.96), while its LBP fractal dimension (~1.93) indicates localized variations due to the fabric’s twill weave. These findings emphasize the complementary role of FFT and fractal dimension analyses in capturing diverse texture properties.

3.3. CNN-Based Fabric Classification

Comparative Analysis of CNN Model Performance

The results obtained from CNN training for fabric texture classification using two-modality late fusion models allow us to compare their performance and behavior.
The results of training deep learning models for tissue texture classification within the framework of bimodal late fusion showed significant differences in the performance of different architectures. The studied models—InceptionV3, ResNet50_V2, DenseNet, and VGG-19—demonstrate different trends in convergence, generalization, and stability.
InceptionV3 is characterized by a rapid increase in accuracy during the training phase, which indicates a rapid assimilation of patterns in the data. However, this behavior is accompanied by an increased risk of overtraining, which requires limiting the number of epochs or applying additional regularization methods.
ResNet50_V2 achieves high accuracy with a moderate level of missing values on the validation set, indicating a good balance between training speed and generalization. Thanks to residual connections, this model effectively extracts deep features of tissue texture, making it one of the most productive in the classification task.
DenseNet exhibits stable loss and accuracy curves, which confirms the effectiveness of the feature reuse mechanism in deep layers. Despite the slightly lower learning rate, this architecture provides high generalized performance, which makes it particularly suitable for tasks with a high texture variability.
VGG-19, compared to other models, demonstrates gradual and uniform learning. The slower increase in accuracy indicates a relatively lower probability of overtraining, which can provide better generalization to new samples. The high stability of this model makes it competitive in texture classification tasks.
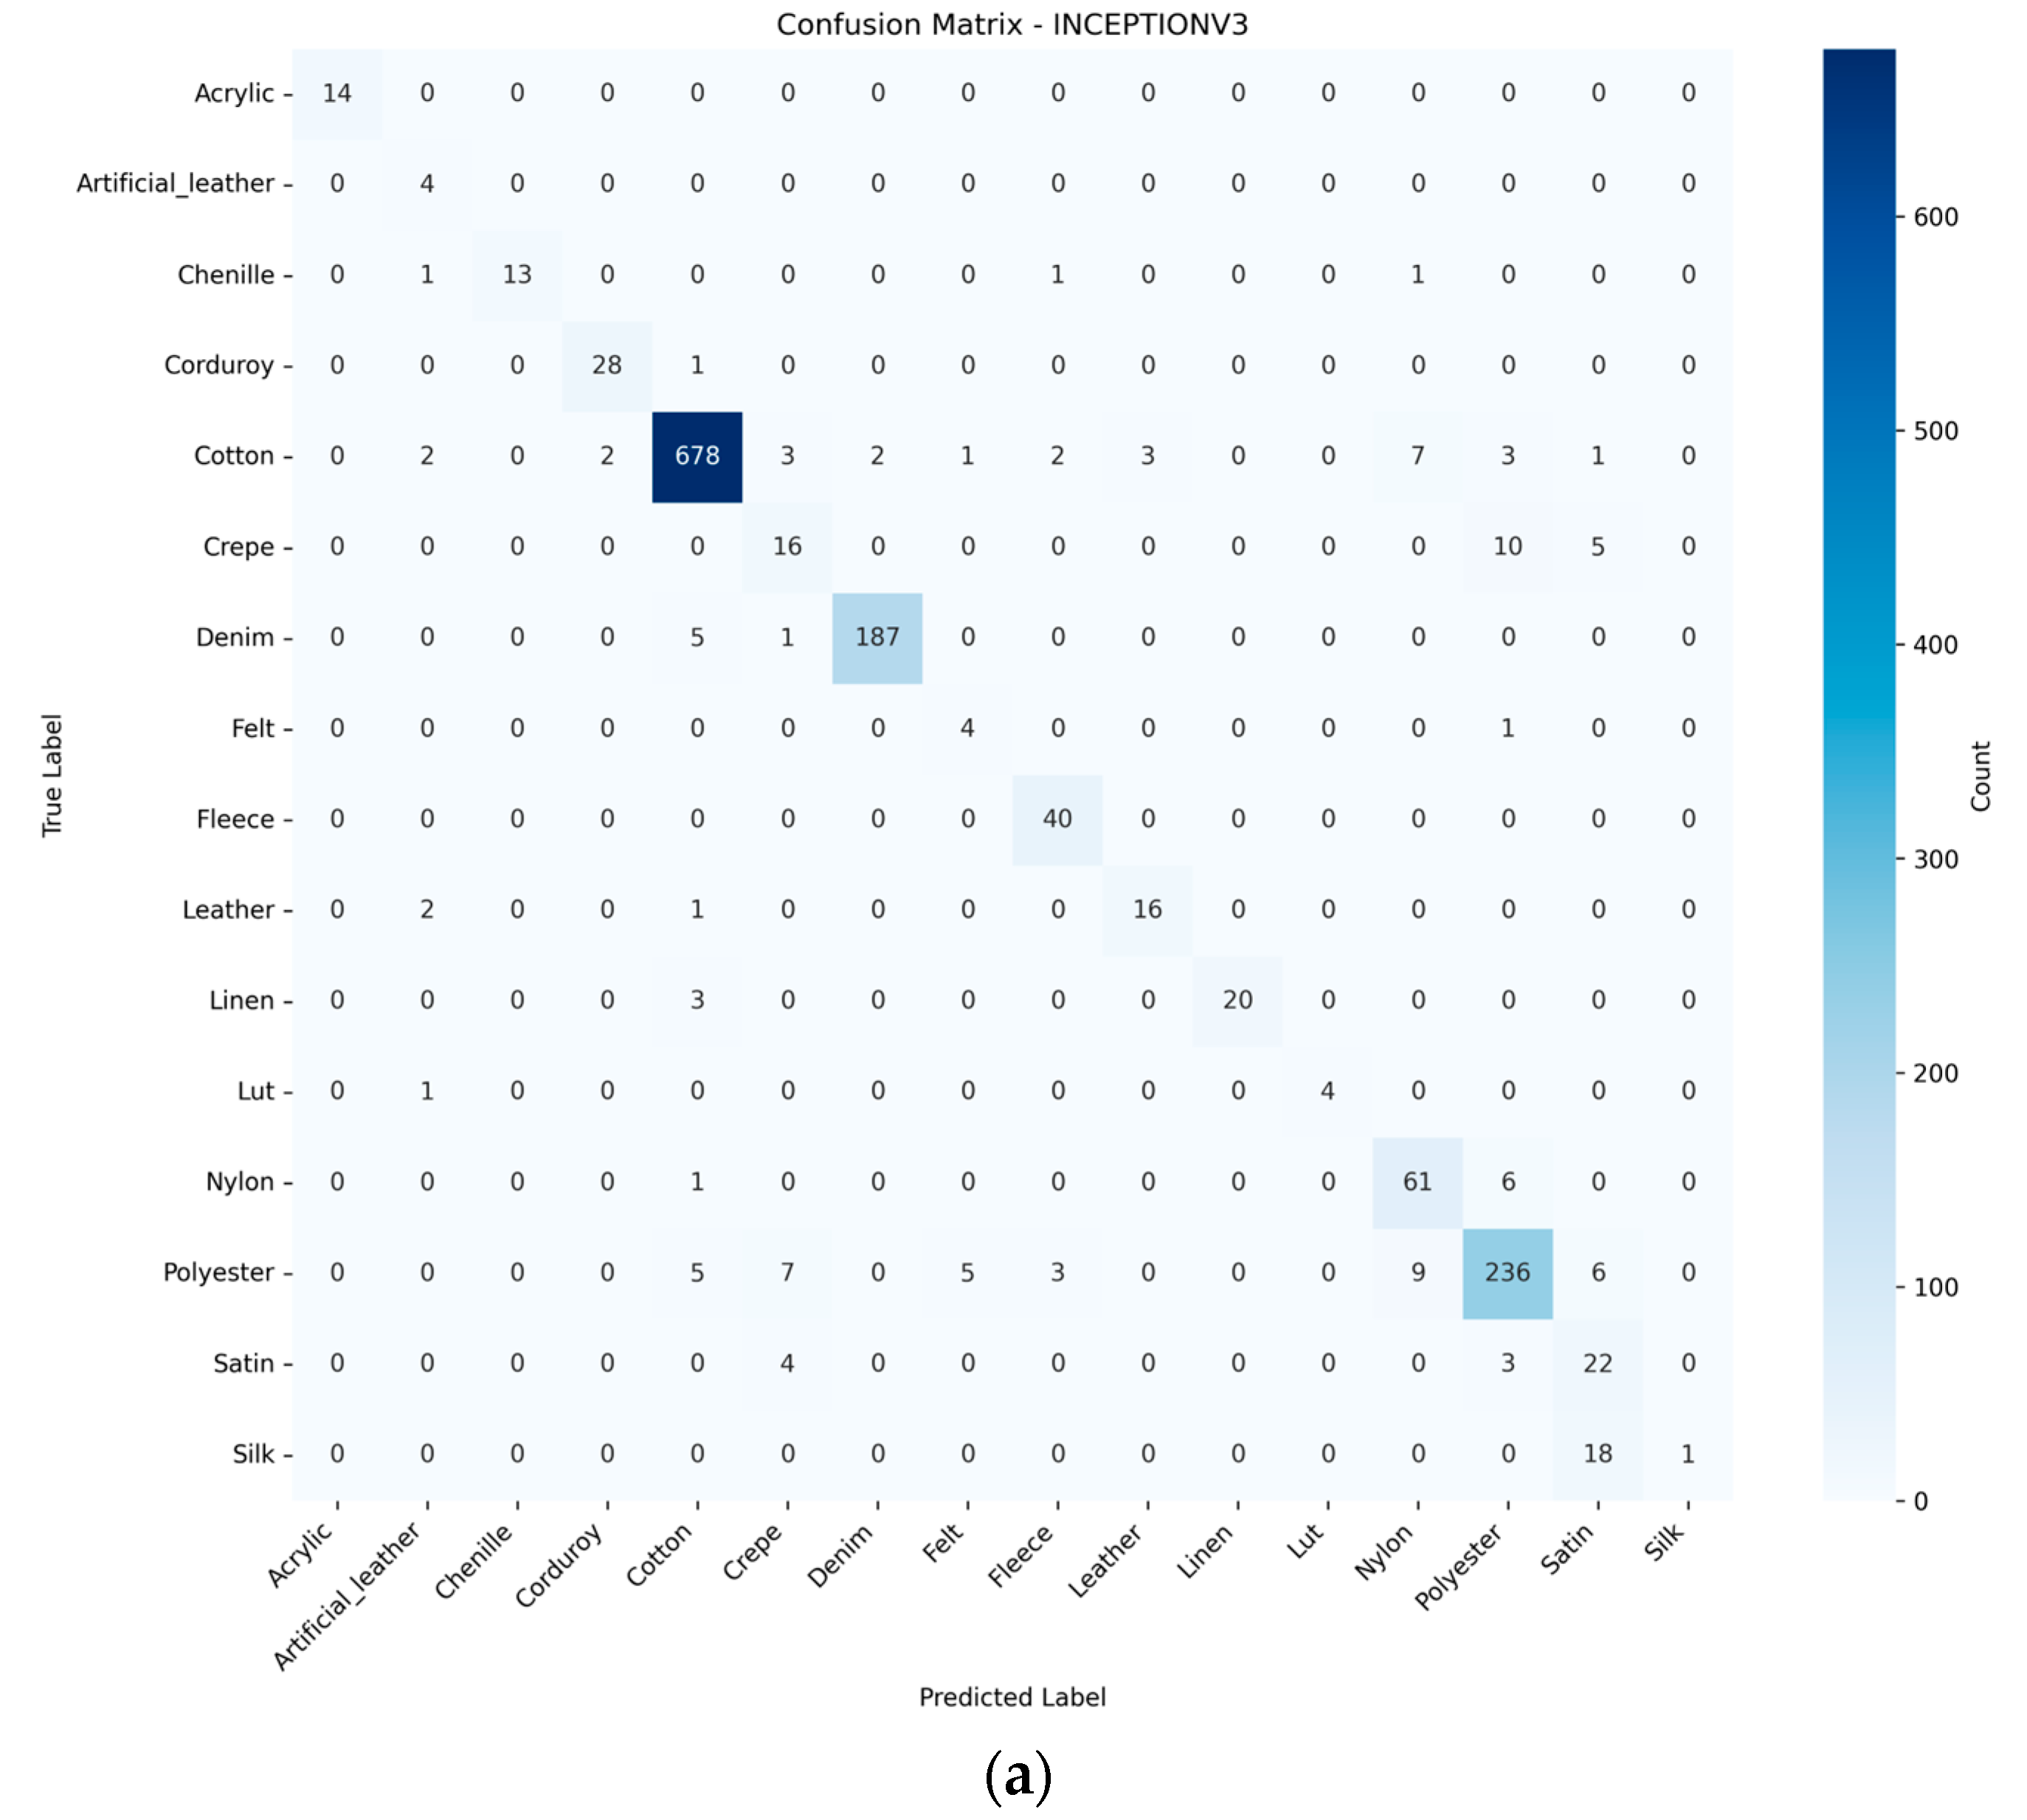
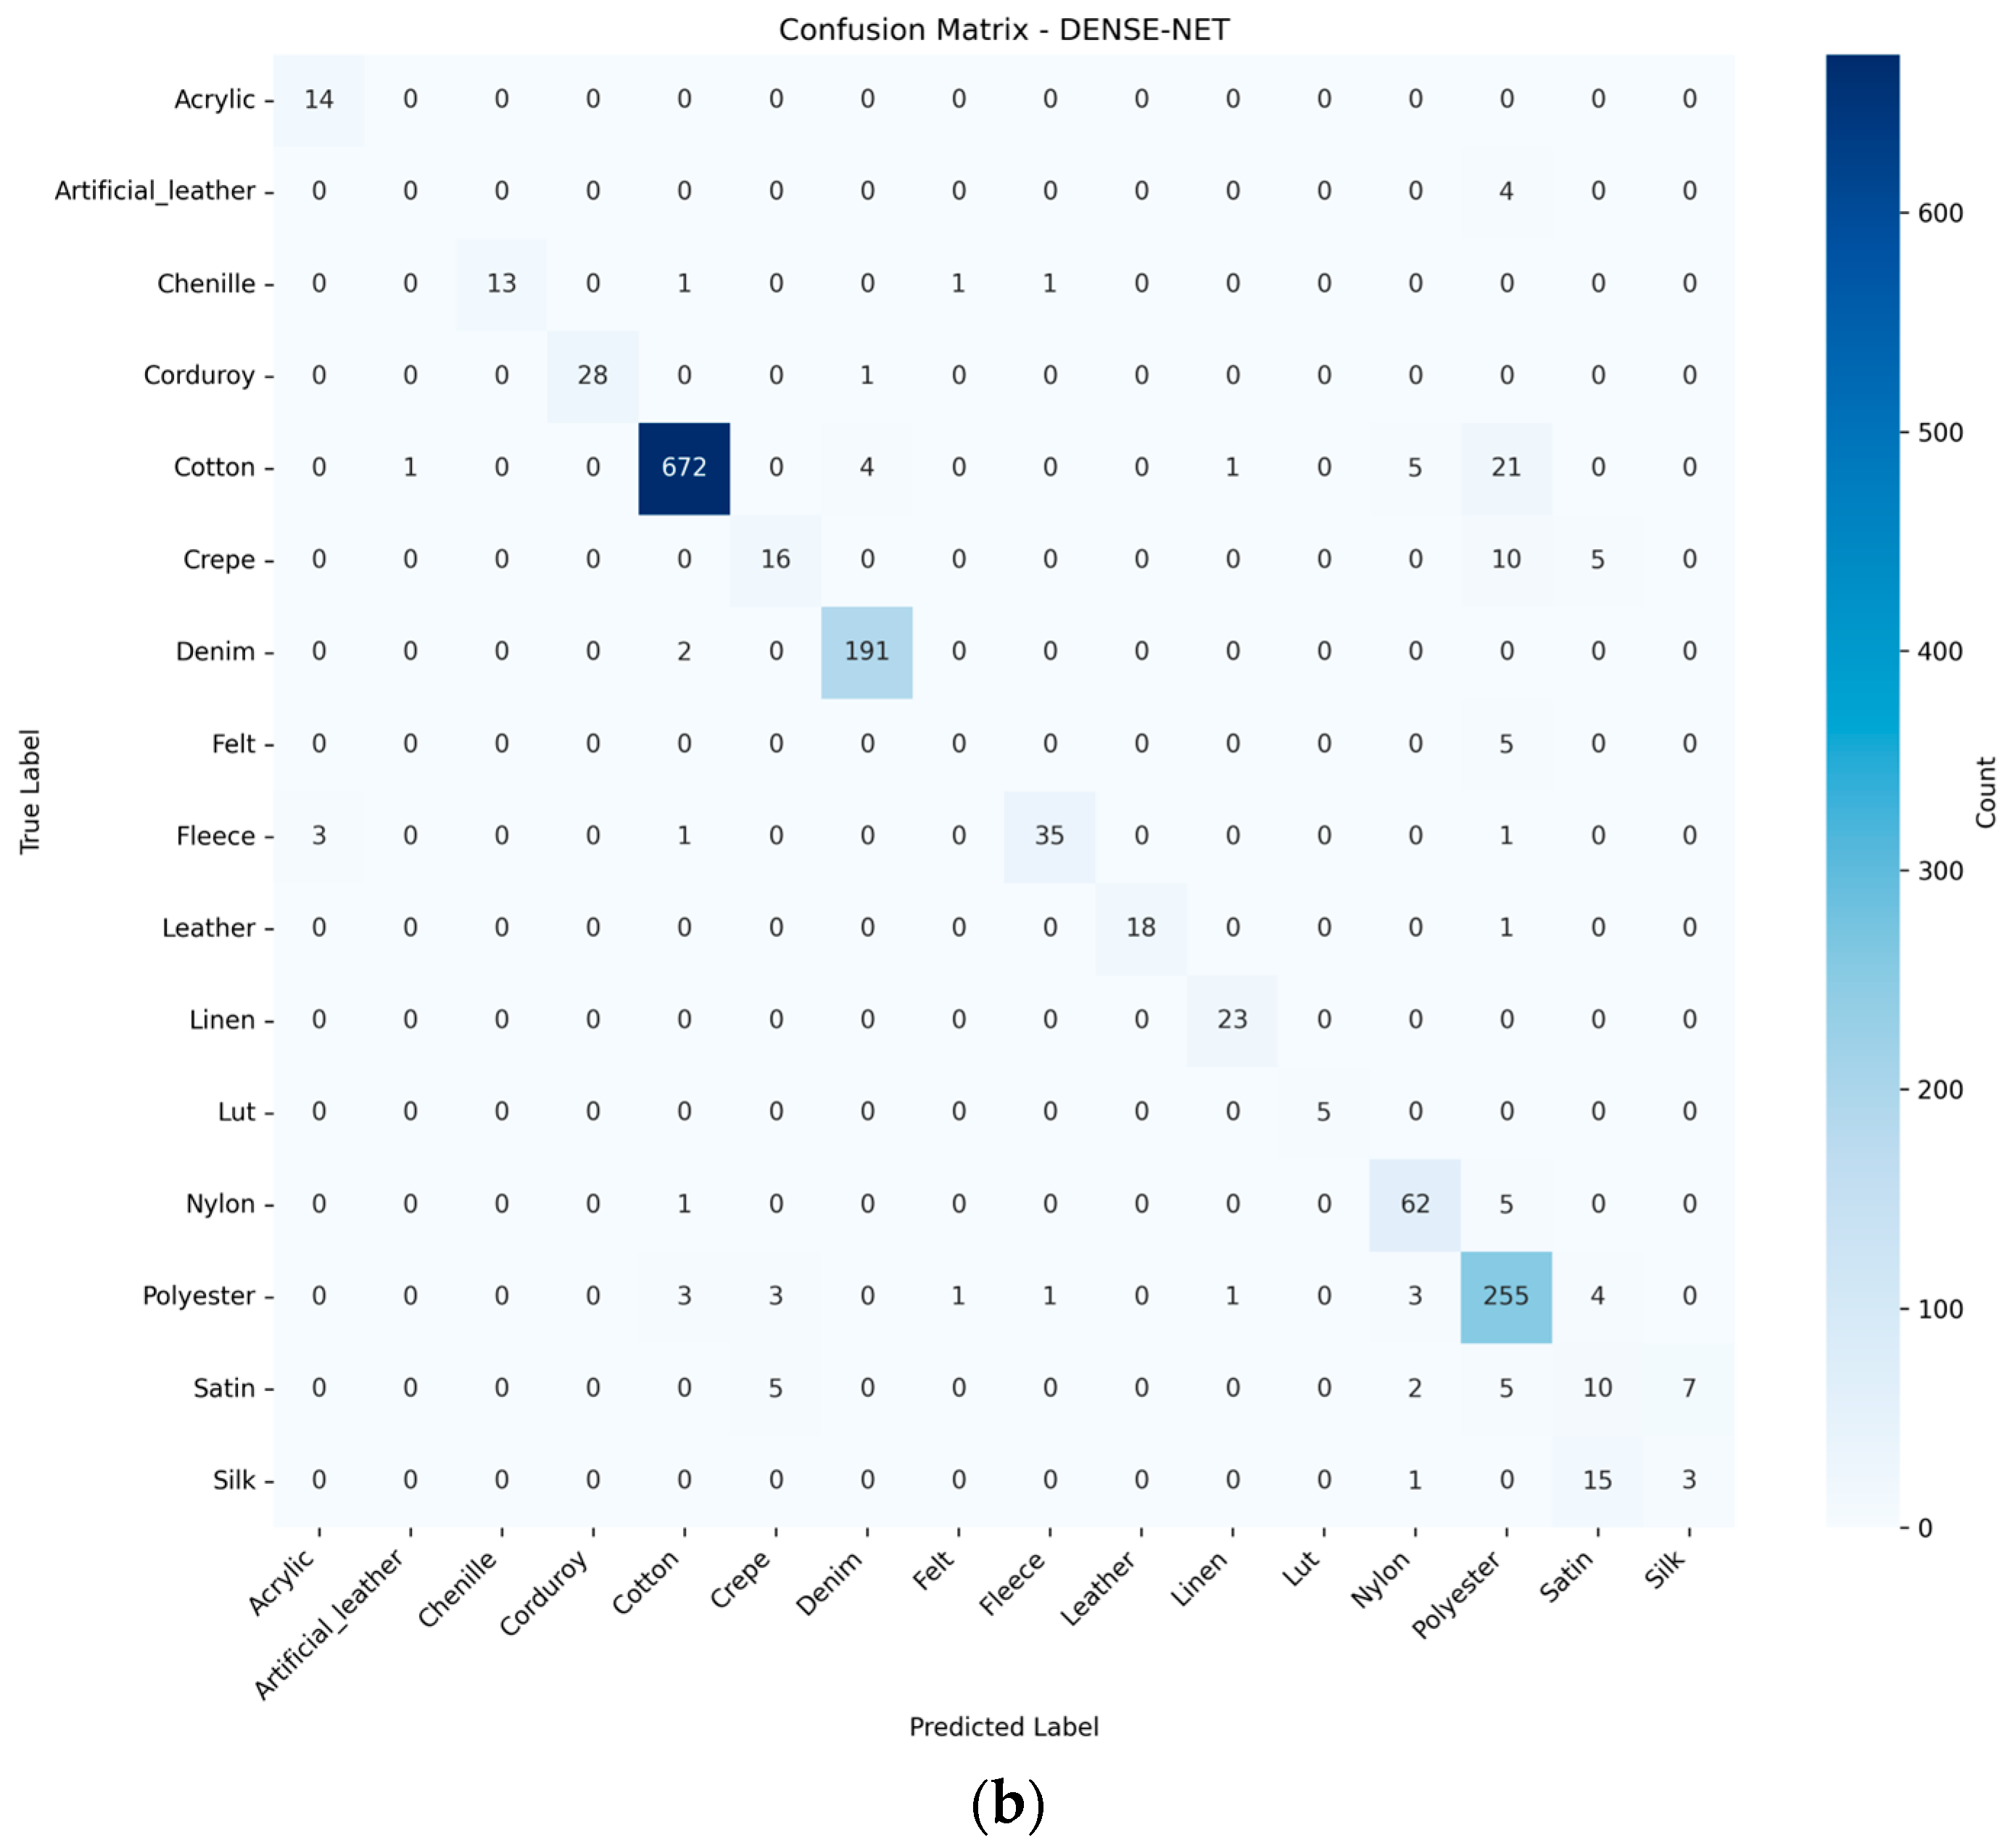
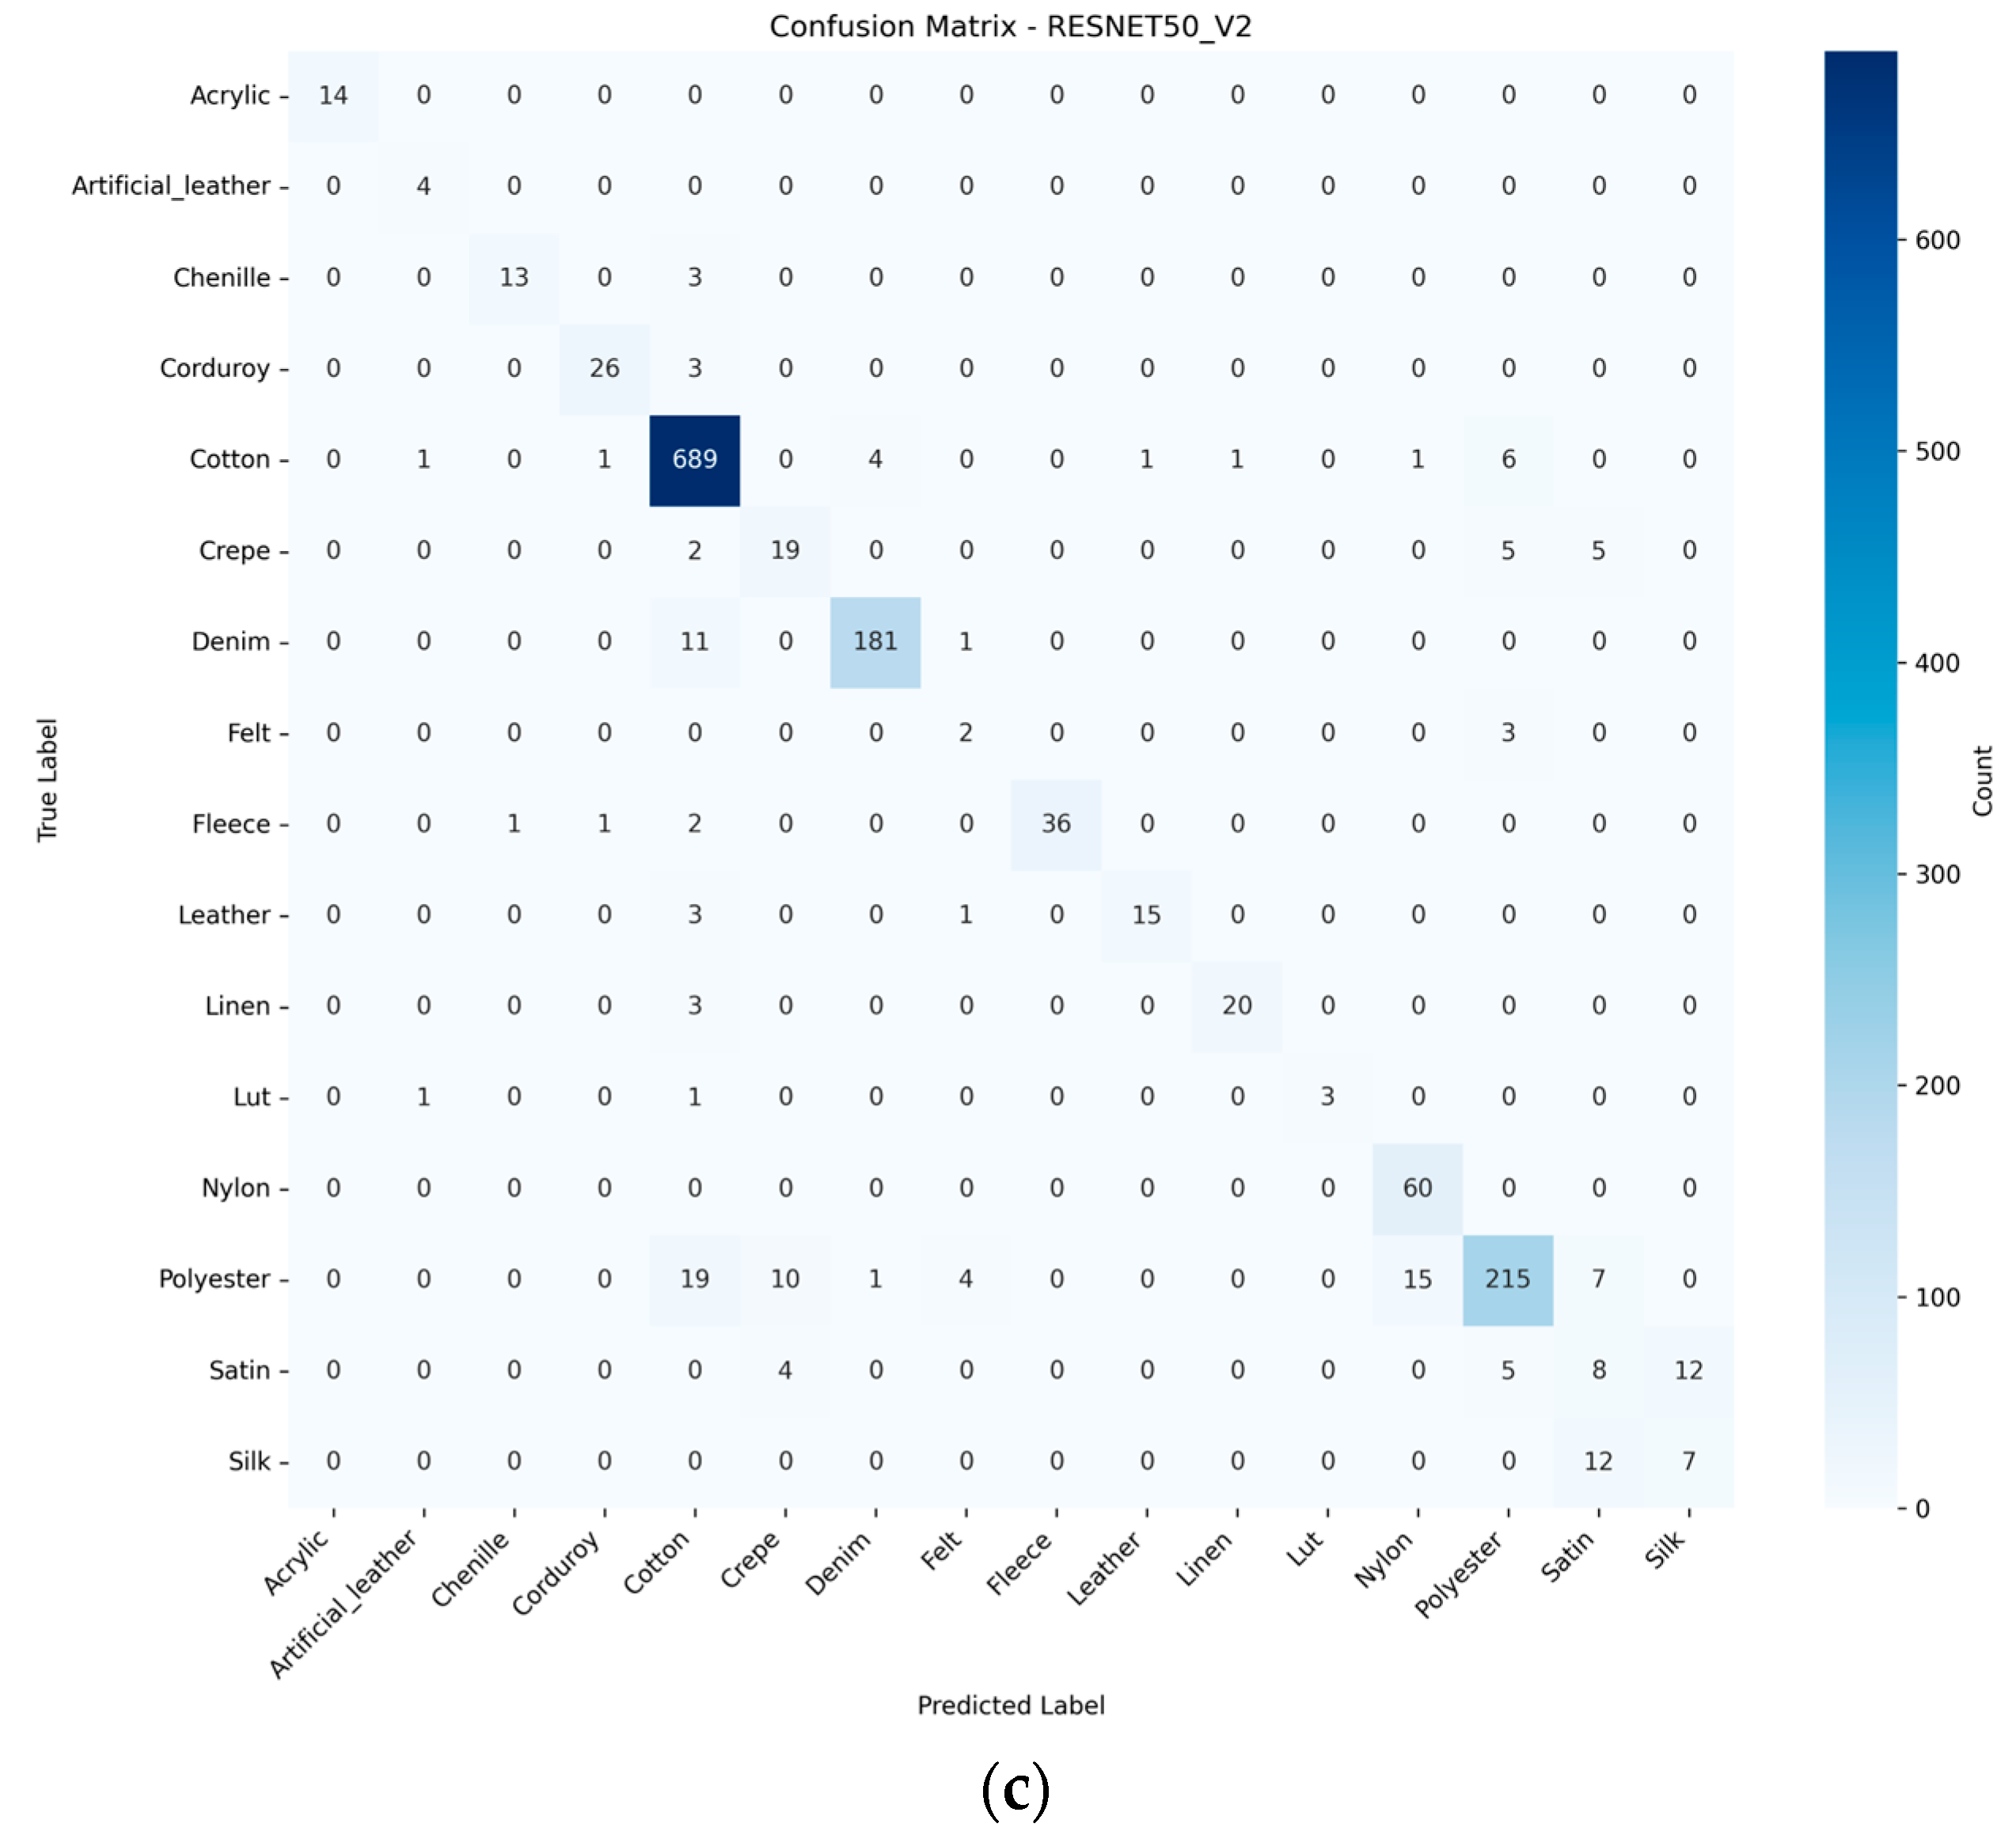
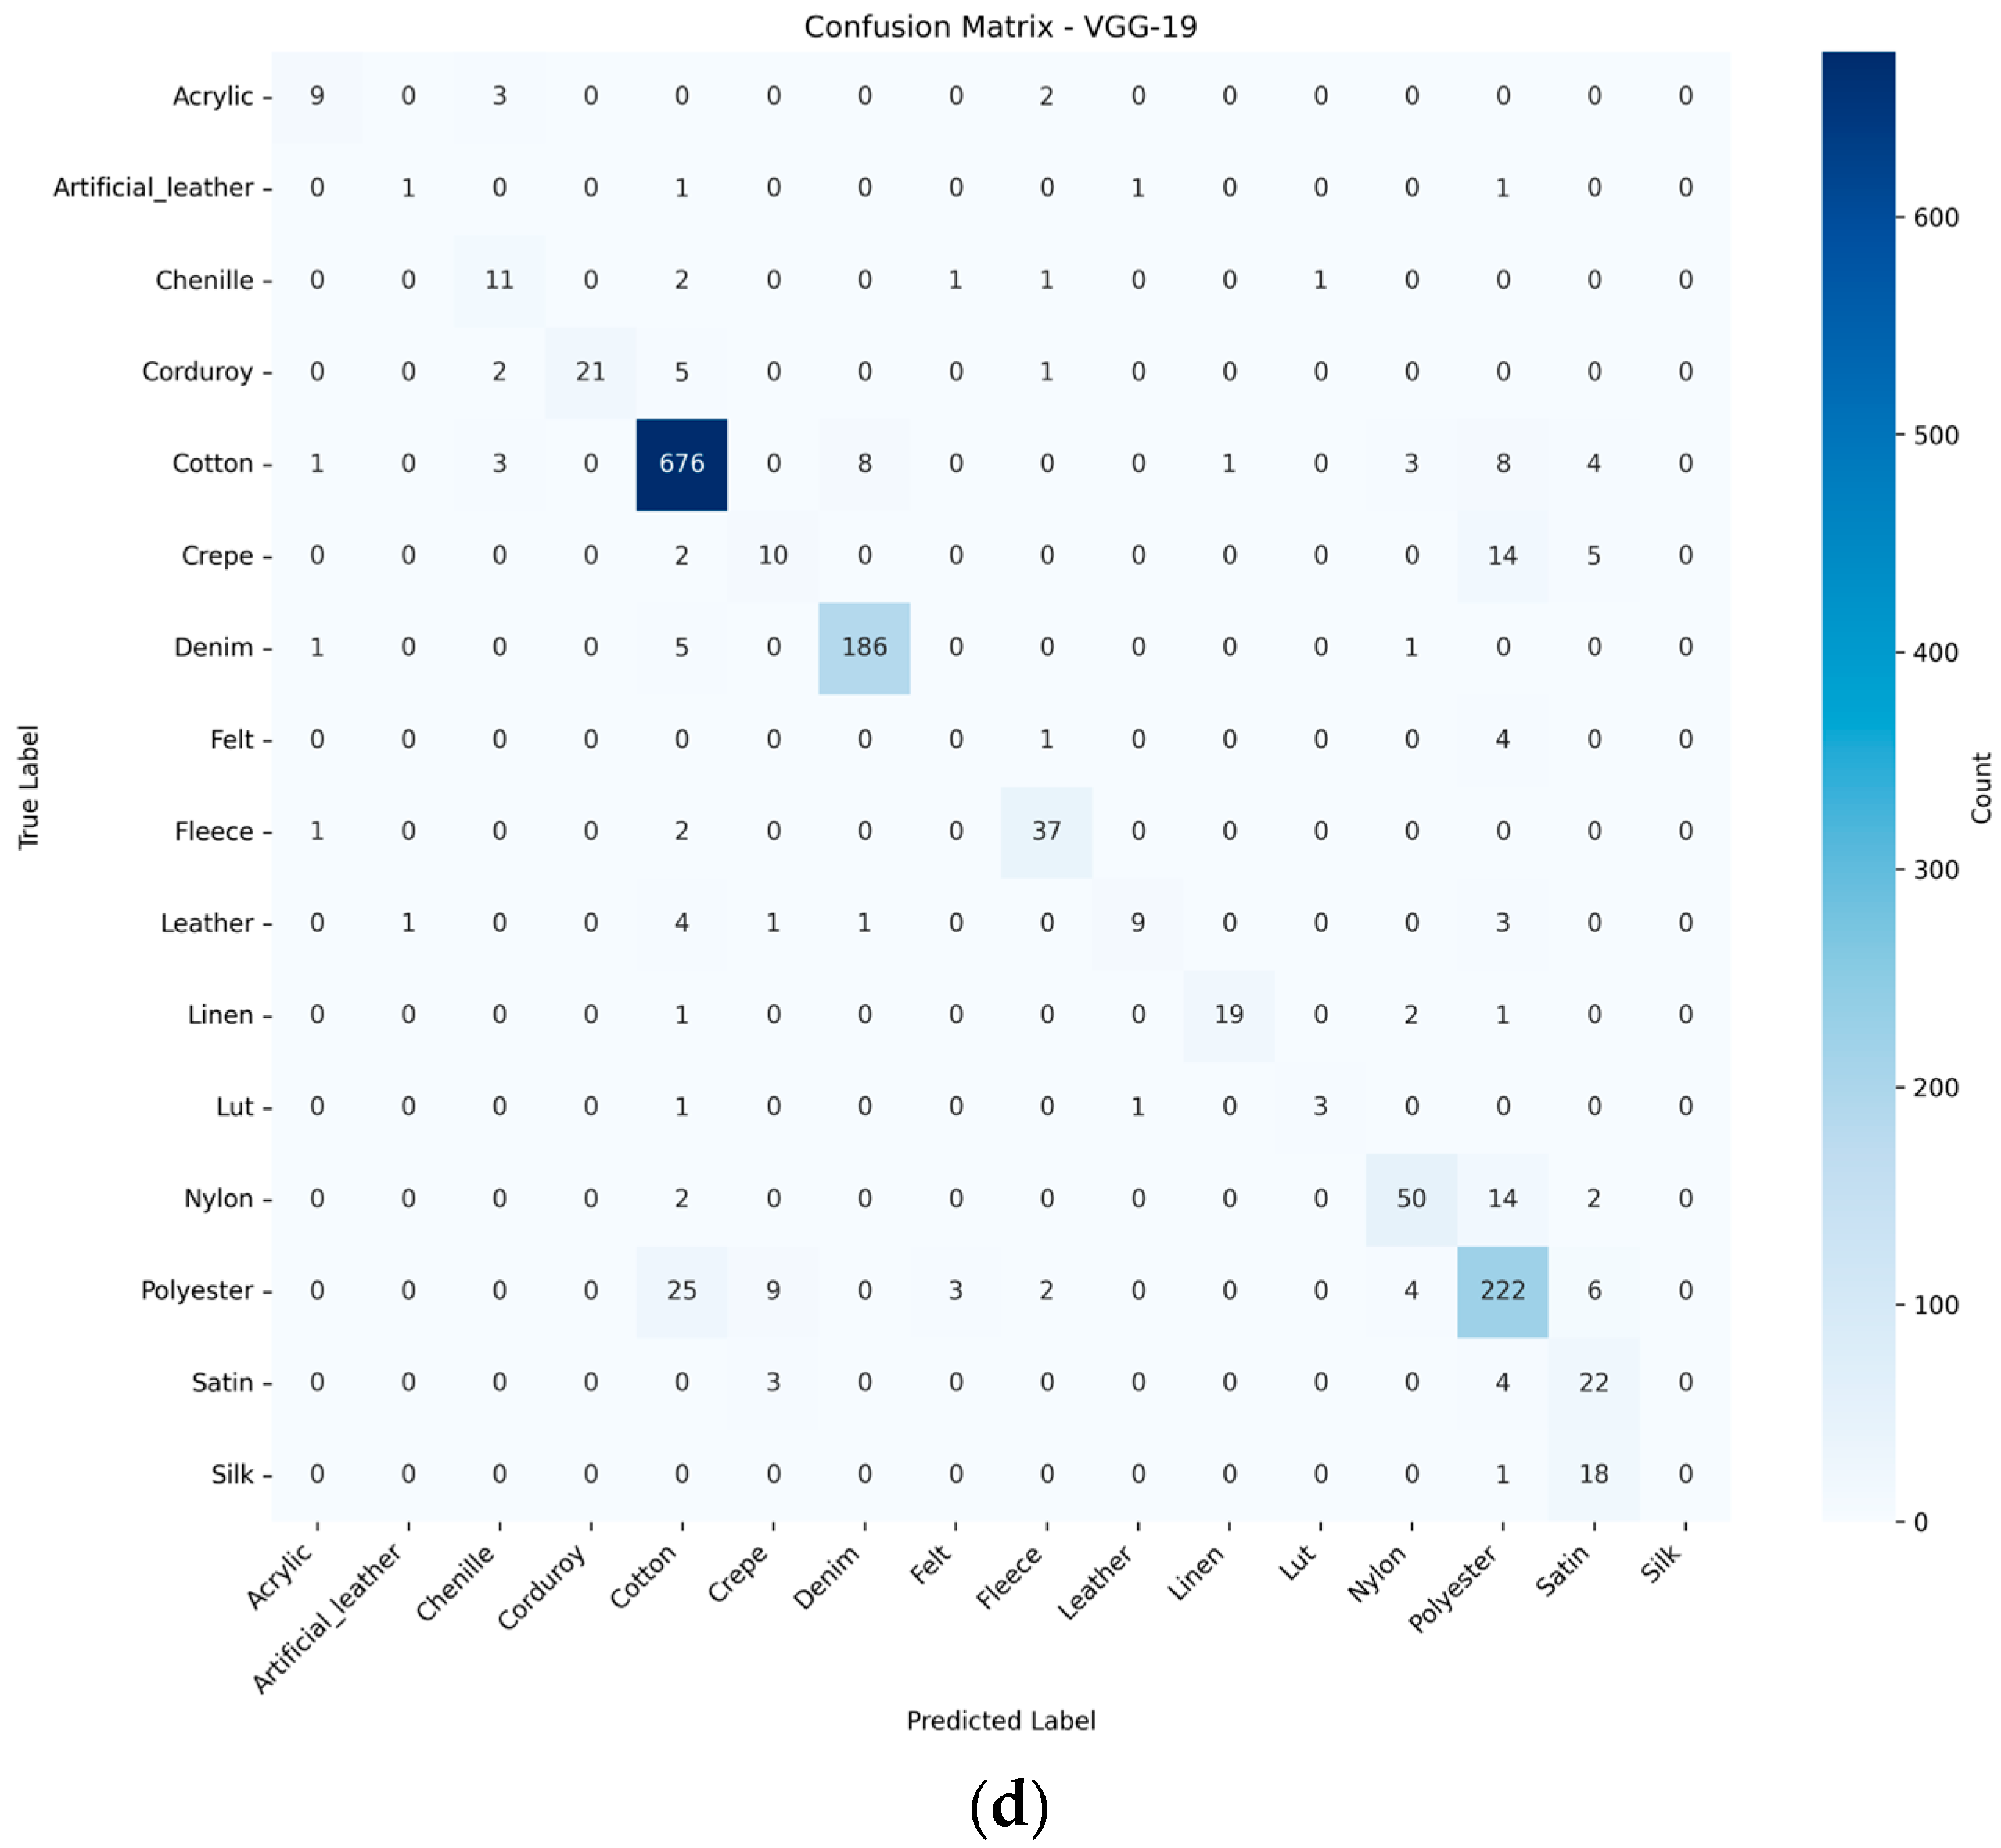
Analyzing the confusion matrices (Figure 11) revealed that the models exhibited the highest misclassification rates for cotton–polyester and satin–silk pairs. This correlates with earlier FFT results, where cotton and polyester (Figure 3 and Figure 5) both exhibited multifold spatial periodicity, with peak ranges between 65 and 120 Hz and 130 and 175 Hz. Similar frequency distributions in these fabrics may explain the difficulty in distinguishing them. Similarly, satin and silk (Figure 6 and Figure 7) show shared spectral properties, leading to classification challenges.
The FFT analysis suggests that spectral information alone may not be sufficient for accurately distinguishing these fabrics in deep learning models. Future research could explore additional input modalities, such as texture flow or thermal imaging, to improve classification accuracy for challenging fabric pairs.
When examining individual model performance (Figure 11c), ResNet50_V2 demonstrated a superior ability to classify cotton textures, while DenseNet (Figure 11b) excelled in classifying polyester. This could be attributed to ResNet50_V2′s deep residual blocks, which effectively capture complex hierarchical texture features. Dense-Net’s feature reuse capability allows for the better capture of finer details such as in polyester’s texture. InceptionV3 (Figure 11a) has slightly lower results, which indicates a slight decrease in accuracy, and VGG-19 (Figure 11d) has the worst classification performance as it often makes mistakes between similar materials.
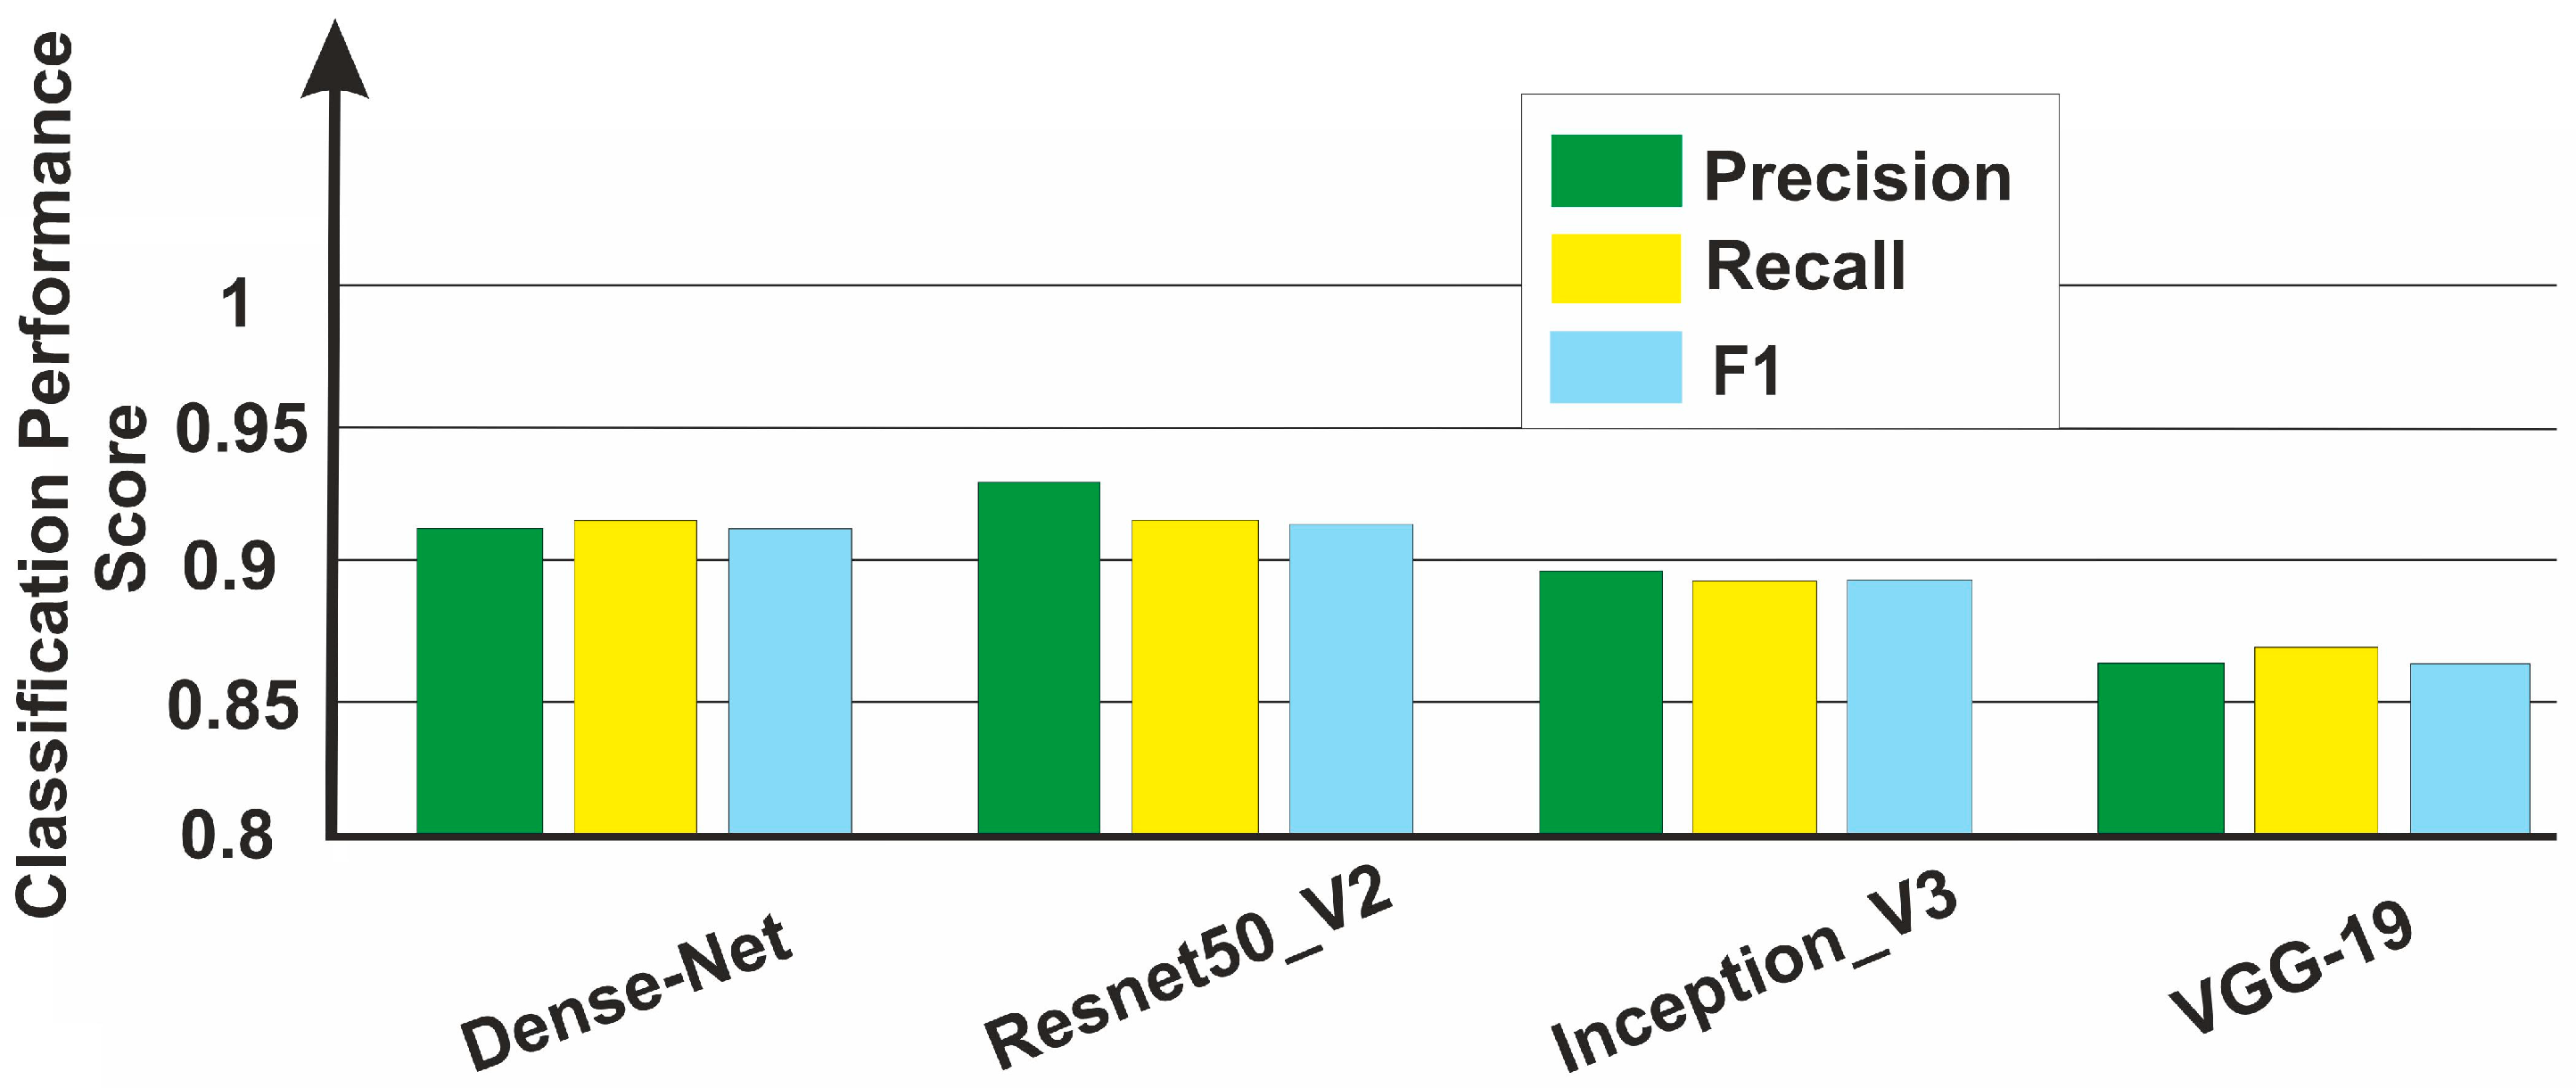
The training results are presented in Figure 12. The precision score for VGG-19 reached 0.863, surpassing the 79.6% reported in previous studies [14]. This improvement highlights the effectiveness of two-modality inputs, specifically the combination of LBPs and albedo maps, which capture detailed fabric features. The best-performing model Resnet50_v2 achieved a precision of 0.929, recall of 0.914, and F1 score of 0.913, demonstrating strong accuracy and a balance between minimizing false positives and false negatives.
This analysis underscores the importance of architectural choice and input modality selection in achieving accurate fabric texture classification. These results confirm that incorporating LBPs and albedo maps enhances fabric texture classification by capturing finer details, improving both accuracy and generalization. The comparison of precision, recall, and F1 scores across models in Figure 7 highlights the effectiveness of different architectures, with ResNet50_V2 demonstrating the highest overall performance. The results indicate that selecting an optimal CNN architecture depends on balancing learning speed, generalization ability, and computational efficiency.

4. Conclusions

This study presented a comprehensive approach to fabric texture analysis by integrating traditional feature extraction techniques with modern deep learning methods. The developed feature extraction pipeline effectively captured macro- and micro-textures using GLCMs and LBPs, which were evident in the 3D surface reconstructions. These reconstructions demonstrated the ability to differentiate between fabric types by highlighting both large-scale patterns and intricate surface details.
It should be noted that, within the framework of this study, a direct comparison of the macrostructures obtained using deep learning methods with the real surface roughness parameters of the samples was not carried out, since the roughness parameters were not measured experimentally. At the same time, texture analysis using the GLCM, as well as frequency analysis (FFT), allowed us to detect pronounced periodic components in a number of samples, indicating the structuredness of the surface. This creates a basis for further investigation of the potential correlation between the obtained macrostructures and the physical characteristics of the roughness.
The integration of Poisson distributions and albedo-dependent feature maps contributed to texture representation refinement, though further evaluation is needed to quantify their impact on classification performance. Notably, the precision score for VGG-19 reached 0.863, surpassing 79.6% reported in previous studies [14], indicating that the proposed enhancements positively influenced model performance.
To further enhance fabric classification, state-of-the-art methods were employed, leveraging late fusion techniques for multimodal data integration. ResNet50_V2 demonstrated the highest precision score of 0.929, particularly excelling in distinguishing structured textures like cotton. However, DenseNet exhibited a more balanced classification across multiple fabric types, making it more robust in general cases.
The incorporation of multimodal representations provided deeper insights into fabric textures. However, certain material pairs (e.g., cotton–polyester, satin–silk) remained challenging due to overlapping spectral properties, suggesting a need for further feature integration.
The evaluation of DenseNet, InceptionV3, and VGG-19 further confirmed the importance of hierarchical feature extraction in texture classification. Notably, ResNet50_V2 outperformed other architectures in precision due to its ability to efficiently capture and process complex fabric textures through residual learning. Additionally, rigorous hyperparameter tuning—including an optimized learning rate, a batch size of 32, and 50 training epochs—ensured model stability and convergence. These findings highlight the advantages of CNN-driven approaches for precise and scalable textile classification, particularly when integrating complementary feature representations through multimodal fusion.
Future research can be directed to the integration of additional modalities, such as texture flow, which captures directional surface variations, and thermal imaging, which may enhance the differentiation of synthetic and natural fabrics.
Expanding dataset embedding techniques will refine CNN performance, ensuring better generalization for unseen or blended textile samples.
For synthetic texture generation, conditional GANs (cGANs) will be employed to generate fabric textures with greater structural fidelity. ProGAN will be further explored to improve periodicity and coherence in synthetic textures.
These advancements are aimed at strengthening automated textile classification, synthetic texture modeling, and multimodal data integration, creating a scalable and robust framework for future research.

Author Contributions

Conceptualization, M.G.E.G., O.D. and A.T.A.; methodology, M.G.E.G.; investigation, M.G.E.G., O.D. and A.T.A.; validation, O.L. and S.L.; data curation, O.L.; writing—original draft preparation, O.L.; writing—review and editing, O.L. and S.L.; supervision, O.D. and A.T.A. All authors have read and agreed to the published version of the manuscript.

Funding

This research received no external funding.

Data Availability Statement

The data that support the findings of this study are available from the corresponding author upon reasonable request. No publicly available datasets were created or analyzed during the current study.

Acknowledgments

OL and SL acknowledge support from the British Academy Researchers at Risk Programme (RaR100790 and RaR100791).

Conflicts of Interest

The authors declare no conflicts of interest. The funders had no role in the design of the study; in the collection, analyses, or interpretation of data; in the writing of the manuscript; or in the decision to publish the results.

Abbreviations

The following abbreviations are used in this manuscript:
AIArtificial Intelligence
CNNConvolutional Neural Network
GANGenerative Adversarial Network
ProGANProgressive Growing of GANs

References

  1. Tian, Y.; Zhu, F. Application of computer vision algorithm in ceramic surface texture analysis and prediction. Intell. Syst. Appl. 2025, 25, 200482. [Google Scholar] [CrossRef]
  2. Neto, A.T.; São Mamede, H.; Duarte dos Santos, V. Industrial anomaly detection on textures: Multilabel classification using MCUs. Procedia Comput. Sci. 2024, 239, 498–505. [Google Scholar] [CrossRef]
  3. Xu, J.; Xu, B.; Zhan, H.; Xie, Z.; Tian, Z.; Lu, Y.; Wang, Z.; Yue, H.; Yang, F. A soft robotic system imitating the multimodal sensory mechanism of human fingers for intelligent grasping and recognition. Nano Energy 2024, 130, 110120. [Google Scholar] [CrossRef]
  4. Mohammed, K.M.C.; Kumar, S.S.; Prasad, G. Defective texture classification using optimized neural network structure. Pattern Recognit. Lett. 2020, 135, 228–236. [Google Scholar] [CrossRef]
  5. Chang, I.; Ji, L.; Zhu, J. Multi-scale LBP fusion with the contours from deep CellNNs for texture classification. Expert Syst. Appl. 2024, 238, 122100. [Google Scholar] [CrossRef]
  6. Prakash, K.; Saradha, S. Efficient prediction and classification for cirrhosis disease using LBP, GLCM and SVM from MRI images. Mater. Today Proc. 2023, 81, 383–388. [Google Scholar] [CrossRef]
  7. Gan, Y.; Huang, L.; Ning, Q.; Guo, Y.; Li, Y. Enhanced detection of measurement anomalies in cartridge cases using 3D gray-level co-occurrence matrix. Forensic Sci. Int. 2025, 367, 112366. [Google Scholar] [CrossRef] [PubMed]
  8. Ataky, S.T.M.; Saqui, D.; de Matos, J.; de Souza, A.B.J.; Koerich, A.L. Multiscale analysis for improving texture classification. Appl. Sci. 2023, 13, 1291. [Google Scholar] [CrossRef]
  9. Honeycutt, C.E.; Plotnick, R. Image analysis techniques and gray-level co-occurrence matrices (GLCM) for calculating bioturbation indices and characterizing biogenic sedimentary structures. Comput. Geosci. 2008, 34, 1461–1472. [Google Scholar] [CrossRef]
  10. Wang, X.; Wu, G.; Zhong, Y. Fabric Identification Using Convolutional Neural Network. In Proceedings of the Artificial Intelligence on Fashion and Textiles (AIFT) Conference 2018, Hong Kong, 3–6 July 2018; Advances in Intelligent Systems and Computing; Wong, W., Ed.; Springer: Cham, Switzerland, 2019; Volume 849. [Google Scholar]
  11. Nisa, H.; Van Amber, R.; English, J.; Alavi, A. A systematic review of reimagining fashion and textiles sustainability with AI: A circular economy approach. Appl. Sci. 2025, 15, 5691. [Google Scholar] [CrossRef]
  12. Hassan, S.A.; Beliatis, M.J.; Radziwon, A.; Menciassi, A.; Oddo, C.M. Textile fabric defect detection using enhanced deep convolutional neural network with safe human–robot collaborative interaction. Electronics 2024, 13, 4314. [Google Scholar] [CrossRef]
  13. Yamashita, R.; Nishio, M.; Do, R.K.G.; Togashi, K. Convolutional neural networks: An overview and application in radiology. Insights Imaging 2018, 9, 611–629. [Google Scholar] [CrossRef] [PubMed]
  14. Kampouris, C.; Zafeiriou, S.; Ghosh, A.; Malassiotis, S. Fine-Grained Material Classification Using Micro-Geometry and Reflectance. In Proceedings of the 14th European Conference on Computer Vision (ECCV), Amsterdam, The Netherlands, 11–14 October 2016. [Google Scholar]
  15. Mohanaiah, P.; Sathyanarayana, P.; GuruKumar, L. Image Texture Feature Extraction Using GLCM Approach. Int. J. Sci. Res. Publ. 2013, 3, 1–5. [Google Scholar]
  16. Chen, X.; Wang, B. Symmetry-constrained linear sliding co-occurrence LBP for fine-grained leaf image retrieval. Comput. Electron. Agric. 2024, 218, 108741. [Google Scholar] [CrossRef]
  17. Iwaguchi, T.; Kawasaki, H. Surface Normal estimation from optimized and distributed light sources using DNN-based photometric stereo. In Proceedings of the IEEE/CVF Winter Conference on Applications of Computer Vision (WACV) 2023, Waikoloa, HI, USA, 2–7 January 2023; pp. 311–320. [Google Scholar]
  18. Feng, X.; Feng, Y.; Shang, Y.; Jiang, Y.; Yu, C.; Zong, Z.; Shao, T.; Wu, H.; Zhou, K.; Jiang, C.; et al. Gaussian Splashing: Unified Particles for Versatile Motion Synthesis and Rendering. arXiv 2024, arXiv:2401.15318. [Google Scholar] [CrossRef]
  19. Yang, M.; Guo, J.; Zhang, X.; Cheng, Z. Self-supervised reconstruction of re-renderable facial textures from single image. Comput. Graph. 2024, 124, 104096. [Google Scholar] [CrossRef]
  20. Bharati, M.H.; Liu, J.J.; MacGregor, J.F. Image texture analysis: Methods and comparisons. Chemom. Intell. Lab. Syst. 2004, 72, 57–71. [Google Scholar] [CrossRef]
  21. Bharathi, P.; Reddy, K.R.; Srilakshmi, G. Medical Image Retrieval based on LBP Histogram Fourier features and KNN classifier. In Proceedings of the International Conference on Advances in Engineering & Technology Research, Unnao, India, 1–2 August 2014; pp. 1–4. [Google Scholar]
  22. Ahonen, T.; Matas, J.; He, C.; Pietikäinen, M. Rotation Invariant Image Description with Local Binary Pattern Histogram Fourier Features. In Image Analysis; SCIA 2009; Lecture Notes in Computer Science; Salberg, A.B., Hardeberg, J.Y., Jenssen, R., Eds.; Springer: Berlin/Heidelberg, Germany, 2009; Volume 5575. [Google Scholar]
  23. Navas, W.; Vásquez Espinosa, R. Analysis of Texture Using the Fractal Model; NASA Technical Reports Server (NTRS): Washington, DC, USA, 1997. [Google Scholar]
  24. Shah, S.R.; Qadri, S.; Bibi, H.; Shah, S.M.W.; Sharif, M.I.; Marinello, F. Comparing Inception V3, VGG 16, VGG 19, CNN, and ResNet 50: A Case Study on Early Detection of a Rice Disease. Agronomy 2023, 13, 1633. [Google Scholar] [CrossRef]
  25. Tan, L.; Fu, Q.; Li, J. An Improved Neural Network Model Based on DenseNet for Fabric Texture Recognition. Sensors 2024, 24, 7758. [Google Scholar] [CrossRef] [PubMed]
  26. Hameed, M.; Al-Wajih, A.; Shaiea, M.; Rageh, M.; Alqasemi, F.A. Clothing image classification using VGG-19 deep learning model for e-commerce web application. In Proceedings of the 2024 4th International Conference on Emerging Smart Technologies and Applications (eSmarTA)(IEEE), Sana’a, Yemen, 6–7 August 2024; pp. 1–7. [Google Scholar]
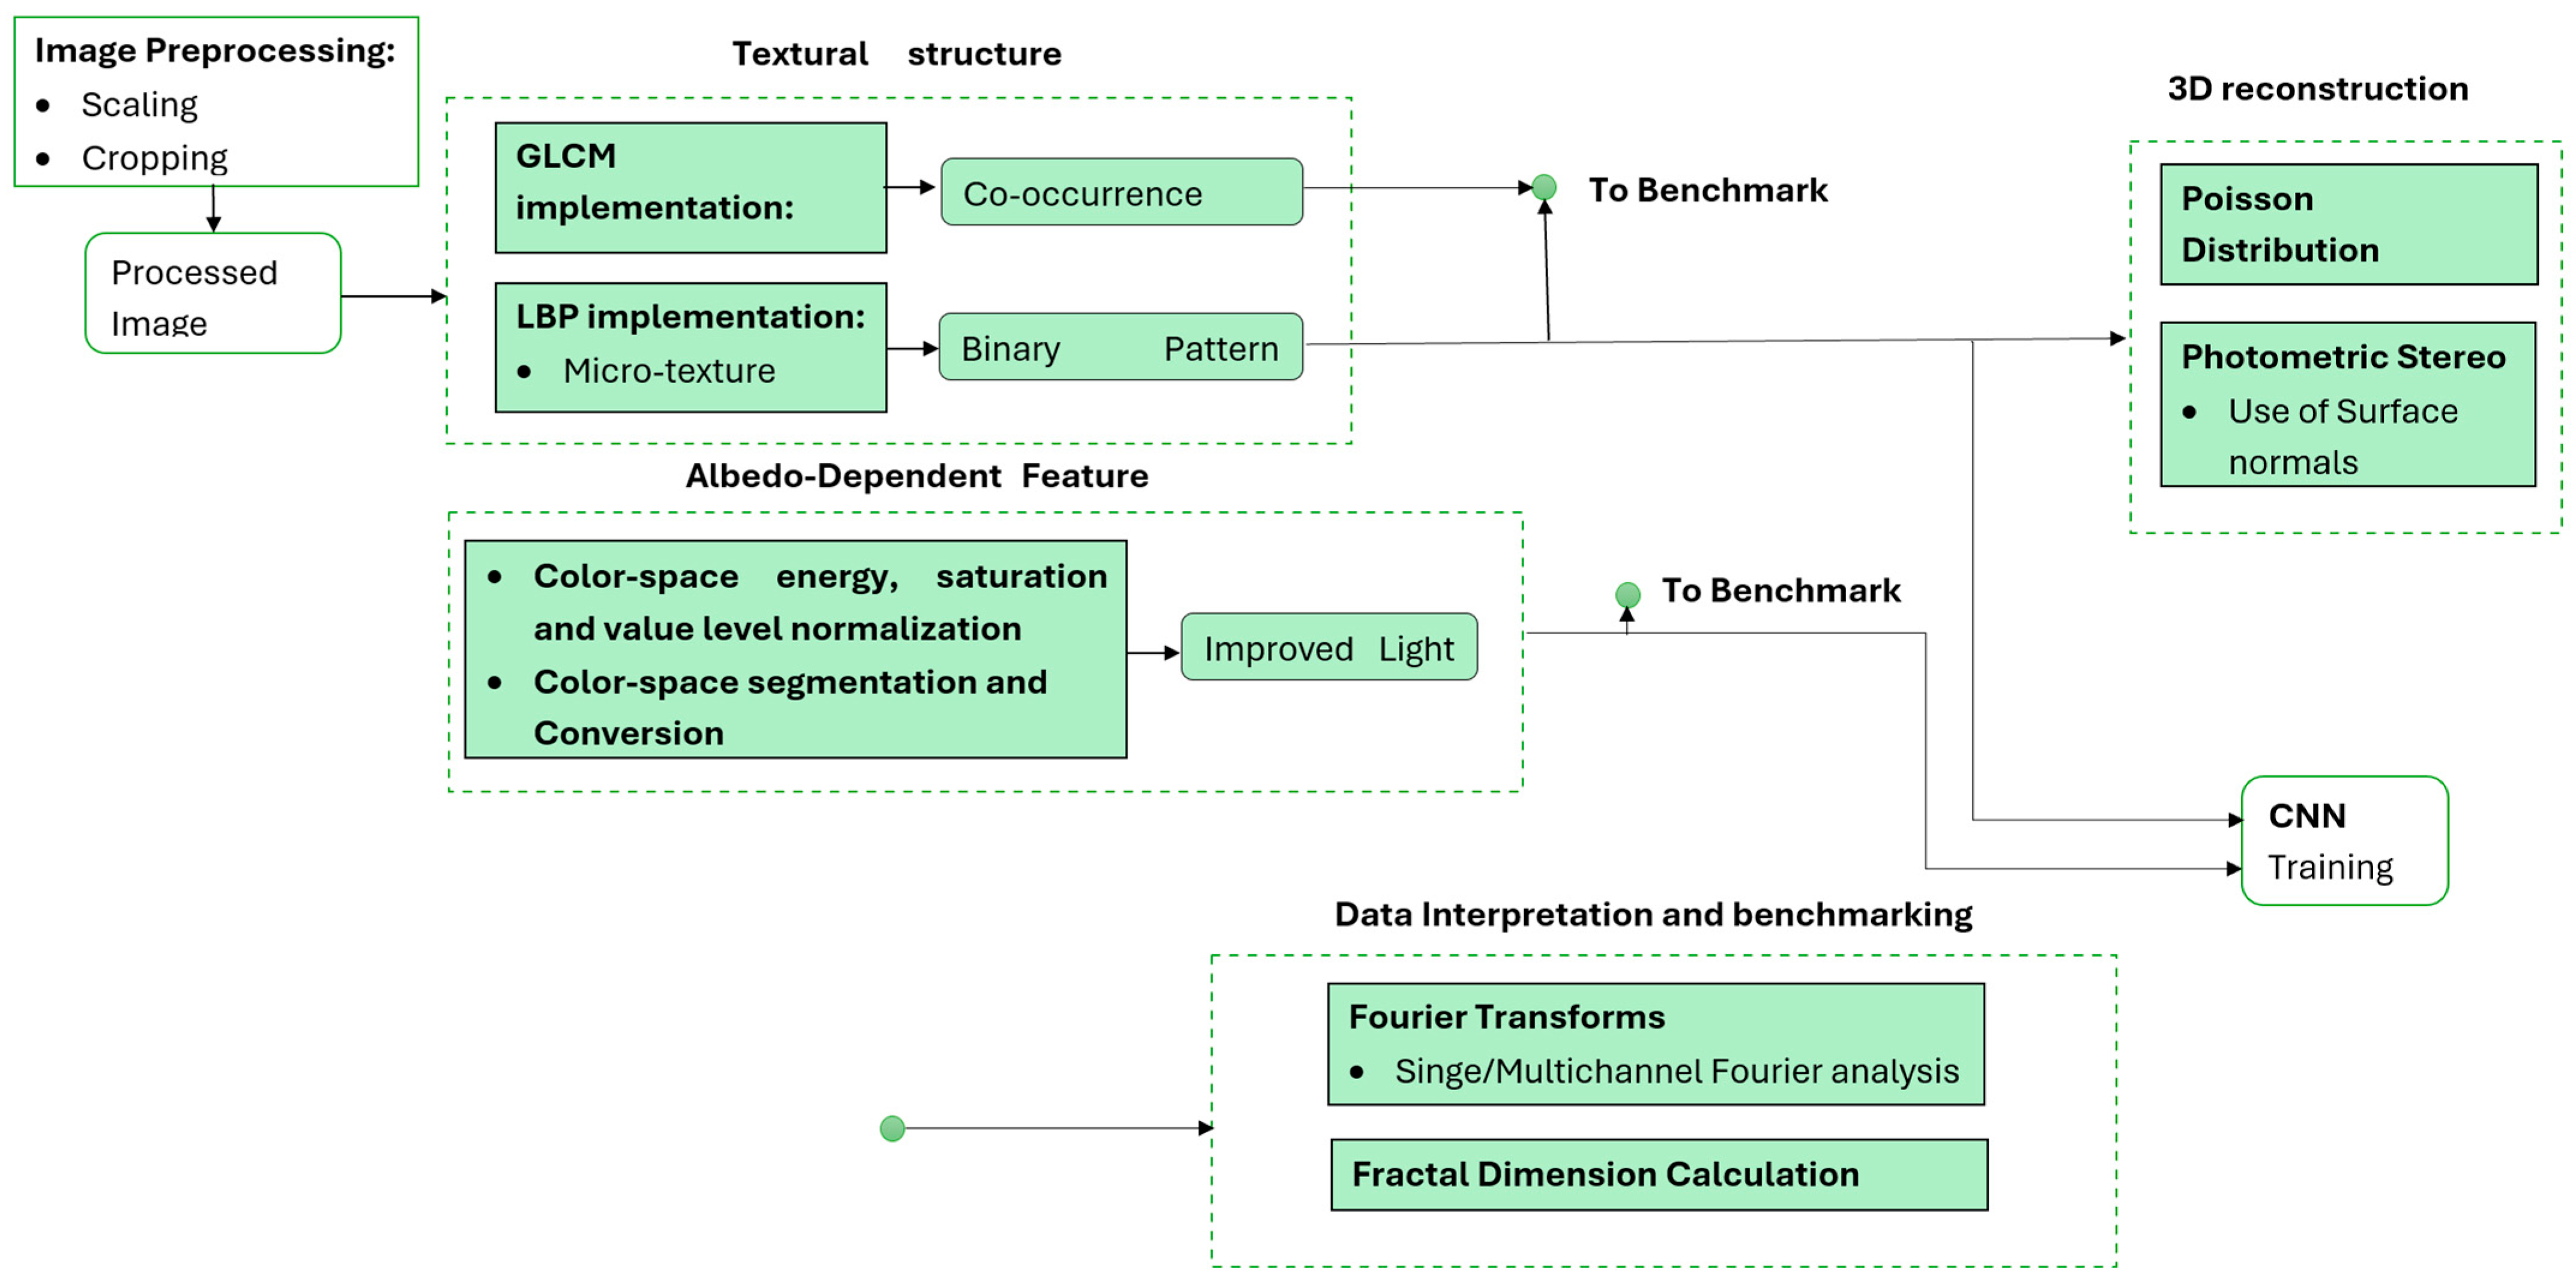
Figure 1. Image processing feature extraction pipeline.
Textiles 05 00031 g001
Figure 2. Albedo-dependent feature map FFT for (a) denim sample and (b) nylon sample.
Textiles 05 00031 g002
Figure 3. Combined FFT plots for denim.
Textiles 05 00031 g003
Figure 4. Combined FFT plots for cotton.
Textiles 05 00031 g004
Figure 5. Combined FFT plots for polyester.
Textiles 05 00031 g005
Figure 6. Combined FFT plots for silk.
Textiles 05 00031 g006
Figure 7. Combined FFT plots for satin.
Textiles 05 00031 g007
Figure 8. Combined fractal analysis results for cotton.
Textiles 05 00031 g008
Figure 9. Combined fractal analysis results for denim.
Textiles 05 00031 g009
Figure 10. Combined fractal analysis results for polyester.
Textiles 05 00031 g010
Figure 11. Confusion matrix for (a) InceptionV3; (b) Dense-Net; (c) RESNET50_v2; (d) 30 VVG-19.
Textiles 05 00031 g011aTextiles 05 00031 g011bTextiles 05 00031 g011cTextiles 05 00031 g011d
Figure 12. Benchmarking scores for trained models.
Textiles 05 00031 g012
Table 1. Dataset composition by fabric type and data split for testing purposes.
Fabric TypeTraining Set
(Images, %)
Test Set
(Images, %)
Unseen Set
(Images, %)
Total Samples
Cotton1478 (62.97%)634 (27.02%)235 (10.02%)2347
Polyester569 (62.94%)244 (27.00%)91 (10.07%)904
Denim404 (62.85%)174 (27.06%)65 (10.11%)643
Nylon143 (62.72%)62 (27.19%)23 (10.09%)228
Fleece82 (62.12%)36 (27.27%)14 (10.61%)132
Crepe65 (62.50%)28 (26.92%)11 (10.58%)104
Corduroy60 (62.50%)26 (27.08%)10 (10.42%)96
Satin60 (62.50%)26 (27.08%)10 (10.42%)96
Linen47 (61.84%)21 (27.63%)8 (10.53%)76
Leather39 (60.94%)18 (28.12%)7 (10.94%)64
Silk39 (61.90%)17 (26.98%)7 (11.11%)63
Acrylic30 (62.50%)13 (27.08%)5 (10.42%)48
Chenille32 (61.54%)14 (26.92%)6 (11.54%)52
Table 2. Textile weave type and fiber composition data for each material class.
Fabric TypeWeave TypeDominant WeaveFiber Compositions
Cottonplain, twill, satinplain (51.13%)Cotton (92–100% or blends with elastane ≤ 7%, polyester ≤ 6%)
Polyesterplain, twill, satinplain (49.78%)Polyester (100% or blends + elastane/viscose ≤ 8%)
Denimplain, twill, satintwill (90.41%)Cotton (100% or blends with
polyester ≤ 34%, viscose ≤ 13%, elastane ≤ 2%)
Nylonplain, twill, satinplain (52.63%)Polyamide (nylon) (100% or blends with elastane ≤ 7%)
Fleeceplain, twill, satinplain (71.97%)100% Polyester
Crepeplain, twill, satinplain (43.27%)Polyester (65–100% or blends with viscose ≤ 30%, elastane ≤ 6%)
Corduroyplain, twill, satintwill (78.13%)Cotton (84–100% or blends with polyester ≤ 15%, elastane ≤ 2%)
Satinplain, twill, satinsatin (79.17%)100% silk, 100% polyester
Linenplain, twill, satinplain (65.79%)100% linen
Leatherplain, twill, satinplain (70.31%)100% leather
Silkplain, twill, satintwill (41.67%)100% silk
Acrylicplain, twill, satinplain (62.5%)100% acrylic, 98% acrylic 2% elastane
Chenilleplain, twill, satinplain (67.31%)100% cotton
Table 3. CNN ideal model training parameters.
ModelsLearningBatch SizeEpochsDevice
All1 × 10−43250CPU
Table 4. Feature analysis and image reconstruction.
MethodDenimAcrylicNylonCotton
Original imageTextiles 05 00031 i001Textiles 05 00031 i002Textiles 05 00031 i003Textiles 05 00031 i004
GLCM feature mapTextiles 05 00031 i005Textiles 05 00031 i006Textiles 05 00031 i007Textiles 05 00031 i008
LBP (underlying textures)Textiles 05 00031 i009Textiles 05 00031 i010Textiles 05 00031 i011Textiles 05 00031 i012
Albedo-dependent mapTextiles 05 00031 i013Textiles 05 00031 i014Textiles 05 00031 i015Textiles 05 00031 i016
Relative 3D height map constructed from GLCMTextiles 05 00031 i017Textiles 05 00031 i018Textiles 05 00031 i019Textiles 05 00031 i020
Relative 3D height map constructed from LBPTextiles 05 00031 i021Textiles 05 00031 i022Textiles 05 00031 i023Textiles 05 00031 i024
Disclaimer/Publisher’s Note: The statements, opinions and data contained in all publications are solely those of the individual author(s) and contributor(s) and not of MDPI and/or the editor(s). MDPI and/or the editor(s) disclaim responsibility for any injury to people or property resulting from any ideas, methods, instructions or products referred to in the content.