All articles published by MDPI are made immediately available worldwide under an open access license. No special
permission is required to reuse all or part of the article published by MDPI, including figures and tables. For
articles published under an open access Creative Common CC BY license, any part of the article may be reused without
permission provided that the original article is clearly cited. For more information, please refer to
https://www.mdpi.com/openaccess.
Feature papers represent the most advanced research with significant potential for high impact in the field. A Feature
Paper should be a substantial original Article that involves several techniques or approaches, provides an outlook for
future research directions and describes possible research applications.
Feature papers are submitted upon individual invitation or recommendation by the scientific editors and must receive
positive feedback from the reviewers.
Editor’s Choice articles are based on recommendations by the scientific editors of MDPI journals from around the world.
Editors select a small number of articles recently published in the journal that they believe will be particularly
interesting to readers, or important in the respective research area. The aim is to provide a snapshot of some of the
most exciting work published in the various research areas of the journal.
Catherine P. Barry is a Postdoctoral Research Associate at the University of Massachusetts Lowell. a [...]
Catherine P. Barry is a Postdoctoral Research Associate at the University of Massachusetts Lowell. Her current research focuses on the mechanical behavior of knit structures for military footwear, which is in collaboration with the Combat Capabilities Development Command Soldier Center. She earned her Ph.D. in Mechanical Engineering from UMass Lowell in 2024, where she studied the mechanical behavior and fluid-structure interaction of parachute suspension lines. Her work combines experimental characterization, finite element analysis (FEA), and computational fluid dynamics (CFD) to study textile-based systems for defense and aerospace applications. She has collaborated with NASA and the U.S. Army to enhance parachute modeling techniques. In addition to publishing journal and conference papers, she holds a U.S. patent related to polymer adhesives. Her work was recognized with second place in the Aerodynamic Decelerator Systems Student Paper Award at the AIAA Aviation Forum. She is a member of the Society for the Advancement of Material and Process Engineering (SAMPE) and the American Institute of Aeronautics and Astronautics (AIAA).
Parachute suspension lines shed vortices during descent, and these vortices develop oscillating aerodynamic forces that can induce forced parasitic vibrations of the lines, which can have an adverse impact on the parachute system. Understanding the line’s mechanical behavior can assist in studying the vibrations experienced by the suspension lines. A well-calibrated structural model of the suspension line could be used to help to identify how the braid’s architecture contributes to its mechanical behavior and to explore if and how a suspension line can be designed to mitigate these parasitic vibrations. In the current study, a mesomechanical finite element model of a polyester braided parachute suspension line was constructed. The line geometry was built in the Virtual Textile Morphology Suite (VTMS), and a user material model (UMAT) was implemented in LS-DYNA® release 14 to describe the material behavior of the individual tows. The material properties were initially calibrated using experimental tension tests on individual tows, which exhibited an initial modulus of ~4100 MPa before transitioning to ~3200 MPa at a stress of 30 MPa. When these properties were applied to the full braid model, slight adjustments were made to account for geometric complexities in the braid structure, improving the correlation between the model and experimental tensile tests. The final calibrated model captured the bilinear tensile behavior of the braid, with an initial modulus of 2219 MPa and a secondary modulus of 1350 MPa, compared to experimental values of 2253 MPa and 1420 MPa, respectively, showing 2% and 5% differences. The calibrated model of the braided cord was then subjected to torsion, and the results showed good agreement with dynamic and static experimental torsion tests, with a difference of 8–19% for dynamic tests and 13–27% for static tests when compared to experimental values. The availability of virtual models of suspension lines can ultimately assist in the design of suspension lines that mitigate flow-induced vibration.
GPS-guided parachutes are used by the military to deliver supplies to personnel in the field. A canopy, braided polyester suspension lines, and a payload make up these GPS-equipped systems [1]. During descent, the suspension lines vibrate, and these vibrations degrade the flight performance of the parachute system and can challenge the ability of the system to land on target. The mechanical behavior of the braided suspension line contributes to this vibration. Braided cords, such as parachute suspension lines, are textile structures, and textile structures have a hierarchal form. For the braid, the smallest level is the fiber. A bundle of straight fibers creates a tow, and the tows are then intertwined to create a braided cord or twisted rope. This multi-level architecture dictates the mechanical behavior of the suspension line. A fundamental understanding of the association between the braid design and the resulting mechanical behavior of these braided cords could provide insight for changes in braid architecture to mitigate these vibrations.
There have been studies on braided and twisted cords examining how their architecture affects their mechanical behavior. Omeroglu [2] investigated the effects of braid pattern and take-up rate (which controls the braid angle) on the mechanical properties of tubular braided polypropylene rope. That investigation showed that a braid with an “over two under two” pattern, low braid angle and pick count had the highest tenacity (load/linear density) and modulus. Raoof et al. [3] studied the bending stiffness of individual spiral strands that create a twisted rope. An increase in the bending stiffness was observed between the first and second loading runs, and attributed to nesting, where the tows settle and lock into position. Chiang [4] characterized wire cables under axial loading. Chiang found that boundary conditions and helical angle had the largest influence on axial stiffness: free rotation at the loaded end or a large helical angle significantly reduced the axial stiffness. Hussain et al. [5] characterized the torsional properties of low-stiffness resilience shaft (LSRS) wire ropes, and that the torsional stiffness increased as the wire rope length decreased, analogous to the relationship between length and torsional stiffness of a solid circular rod. Shi et al. [6] investigated the interlaminar shear behavior of basalt fiber-reinforced polymer (FRP) tendons, which are high-strength fiber-reinforced elements similar in function to tensioned fiber ropes. Their study examined how prestress, grout, and seawater exposure influenced shear resistance, finding that increased prestress enhanced shear strength, but exposure to grout and seawater led to degradation over time.
Each of these past experimental studies showed that the effective axial, torsional and bending stiffnesses are a result of a combination of factors, e.g., diameter of the tows, overall free length, braid/twist angle, and axial tension. A robust model of the braided cord or of the twisted rope or cable could be used to examine the respective contribution of each of these factors on the effective stiffness. Such a fundamental understanding of the relative importance of each factor could then be used to guide in the design of the architecture to achieve a desired mechanical behavior.
When creating a model of a textile rope, there are three approaches of varying fidelity due to their hierarchical structure: macromechanical, mesomechanical, and micromechanical modeling. Each of these approaches has been used to study the mechanical behaviors of braided and woven textiles because of their hierarchal structure (fiber; tow/yarn; and braid, twisted or woven textile). Macromechanical modeling represents the textile as a solid part with the material properties tuned to experimental tests, making it computationally efficient for studies of general textile behavior [7,8,9,10,11,12]. Mesomechanical modeling explicitly models the tows or yarns as a homogenous continuum. The appropriate material models are applied to capture fiber bundle behavior and tow-to-tow interactions are defined [13,14,15,16,17,18,19,20,21,22,23]. Lastly, micromechanical modeling is the most detailed and accurate representation since individual fibers and their interactions are modeled explicitly, allowing for a comprehensive understanding of the textile mechanics [24,25,26,27]. This multi-level modeling approach has been applied to ropes, as evidenced by the few meso- and microscale models of twisted and braided ropes [28,29,30,31,32,33,34,35].
Xiang et al. [28] created a model of a multistrand wire rope to characterize its response to axial tension and torsion. They modeled each of the wires that were twisted together to make strands which were then twisted around a core strand to create a wire rope. The model specifically considered local bending and torsional deformation of each wire. The axial and torsional stiffnesses of the rope were able to be predicted by the model. The model also found that the different friction states between the wires lead to different distributions of local bending and torsion deformation of the double helix wire. Zhang et al. [29] used a finite element model to investigate the bending stiffness of twisted wire ropes. The model considered the effects of the tension level, the friction coefficient between tows, and the contact types and how they affected the bending stiffness. Bending moments were applied about the ends of the rope while axial tension was applied. They found that the bending stiffness increased as the tension and friction increased and as the curvature decreased. While these studies focused on multi-level modeling of ropes to understand the behavior of their components and how they affect the overall mechanical behavior of the rope, they do not discuss the multilevel modeling of polyester fiber braided ropes. This is crucial because polyester fiber braided ropes can exhibit very different behavior, and understanding this is essential for understanding the behavior of parachute suspension lines.
Ghoreishi et al. [30] investigated a twisted synthetic fiber rope used for offshore applications. For this finite element model, the constitutive material behavior was assumed to be non-linear elastic, and the fiber-to-fiber friction was not considered. The results showed good agreement with models in the literature of a 205 T aramid cable; however, the torsional stiffness prediction of the model was different from literature. Ghoreishi et al. also performed tension tests on aramid fiber assemblies with two structures, and the axial stiffness was obtained. These experimental tests showed good correlation with the model. This model is slightly closer to what is needed to understand the behavior of parachute suspension lines as it is a multilevel model of a polymer rope; however, the suspension lines are braided not twisted and as has been shown both the material and the architecture affect the overall behavior of the rope.
Vu et al. [31] investigated creating a model of braided fiber ropes used for deep sea handling systems. Their model considered the textile yarns at the lowest level, i.e., fibers twisted into yarns which are then braided into a rope. The goal was to determine the mechanical equilibrium of the braided rope structure focusing on the yarn-to-yarn contact friction interaction. The geometrical features of the model compared well with the dimensions on the real sample. Good agreement was found between the simulation and experimental tests for a rope in tension. While this model is a multi-level model of a braided polymer rope its more focused on a rope used for marine applications which has a different architecture and different polymer fibers than a parachute suspension line. This emphasizes the need for a mesomechanical model of a parachute suspension line to understand the relationship between its architecture and overall mechanical behavior.
All of these modeling studies demonstrate the value of simulation to assist in understanding the relationship between rope architecture and the mechanical behavior of the rope; however, no modeling studies have been conducted to investigate the tensile and torsional stiffness properties of braided parachute suspension lines.
The current research addresses the void of modeling studies of parachute suspension lines by developing a calibrated finite element model of a braided parachute suspension line at the mesoscopic level, i.e., the level of the tows. The novelties of the research are the inclusion of the manufacturing steps in the development of the braid geometry and the development of a user-defined material model for the tows. The geometry of the braid is created using the Virtual Textile Morphology Suite (VTMS) and it was analyzed in LS-DYNA. The model was pulled in tension and compared to experimental tension tests for validation purposes. The model was then further validated by subjecting it to torsion under tension and comparing it to experimental torsion tests. The model results were found to compare well to experimental tension and torsion data. The current research contributes to the ultimate goal of having a modeling approach that can be used to predict the macroscopic tensile and torsional stiffnesses of multiple designs of a braided parachute suspension line and the associated change in surface topology as a function of the state of axial loading.
2. Materials and Methods
2.1. Material System
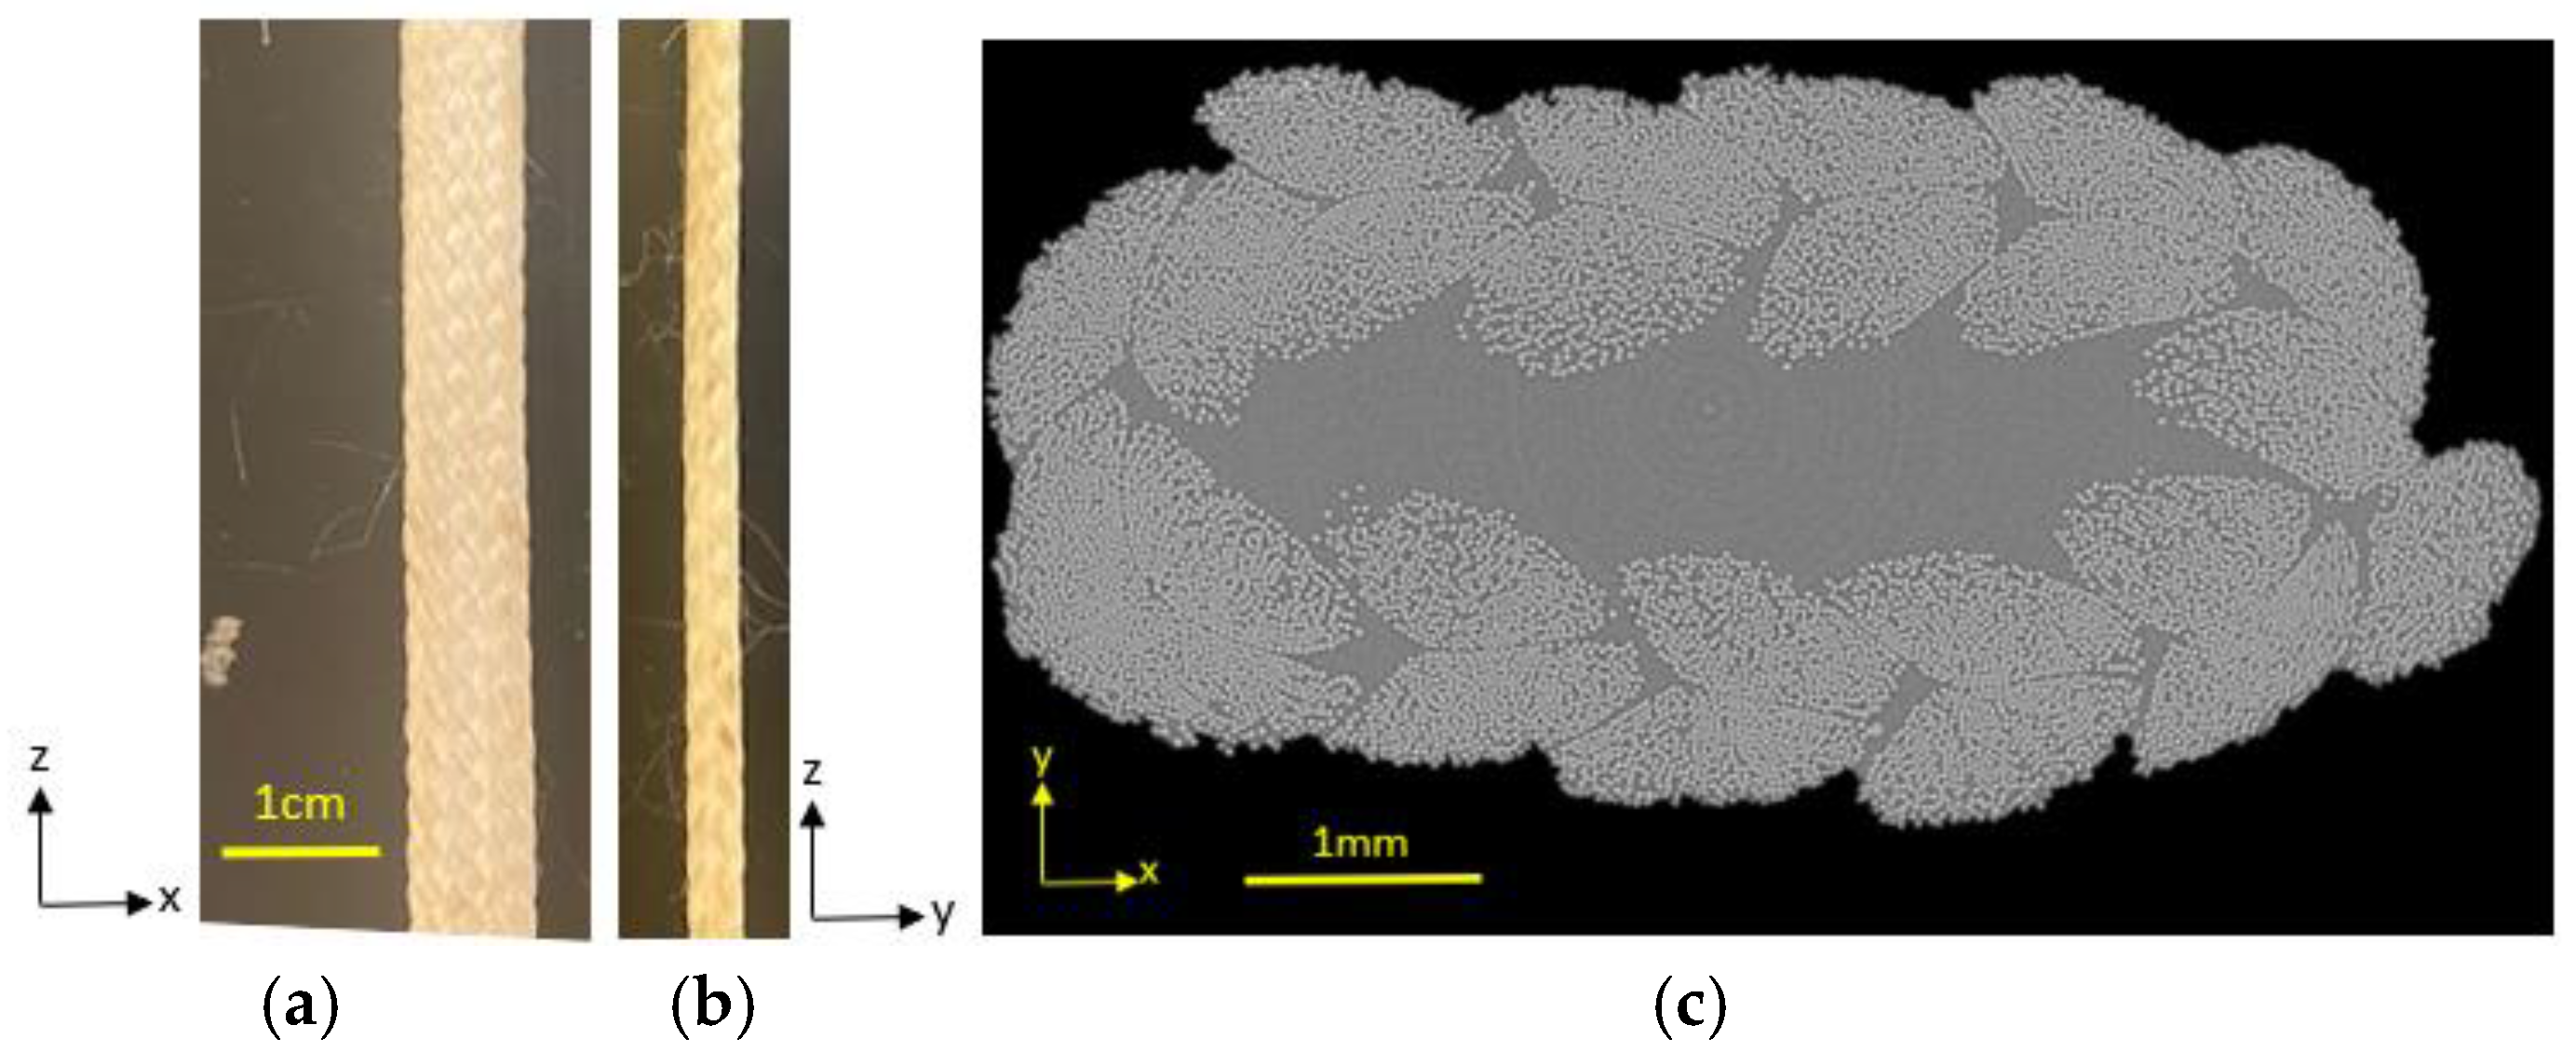
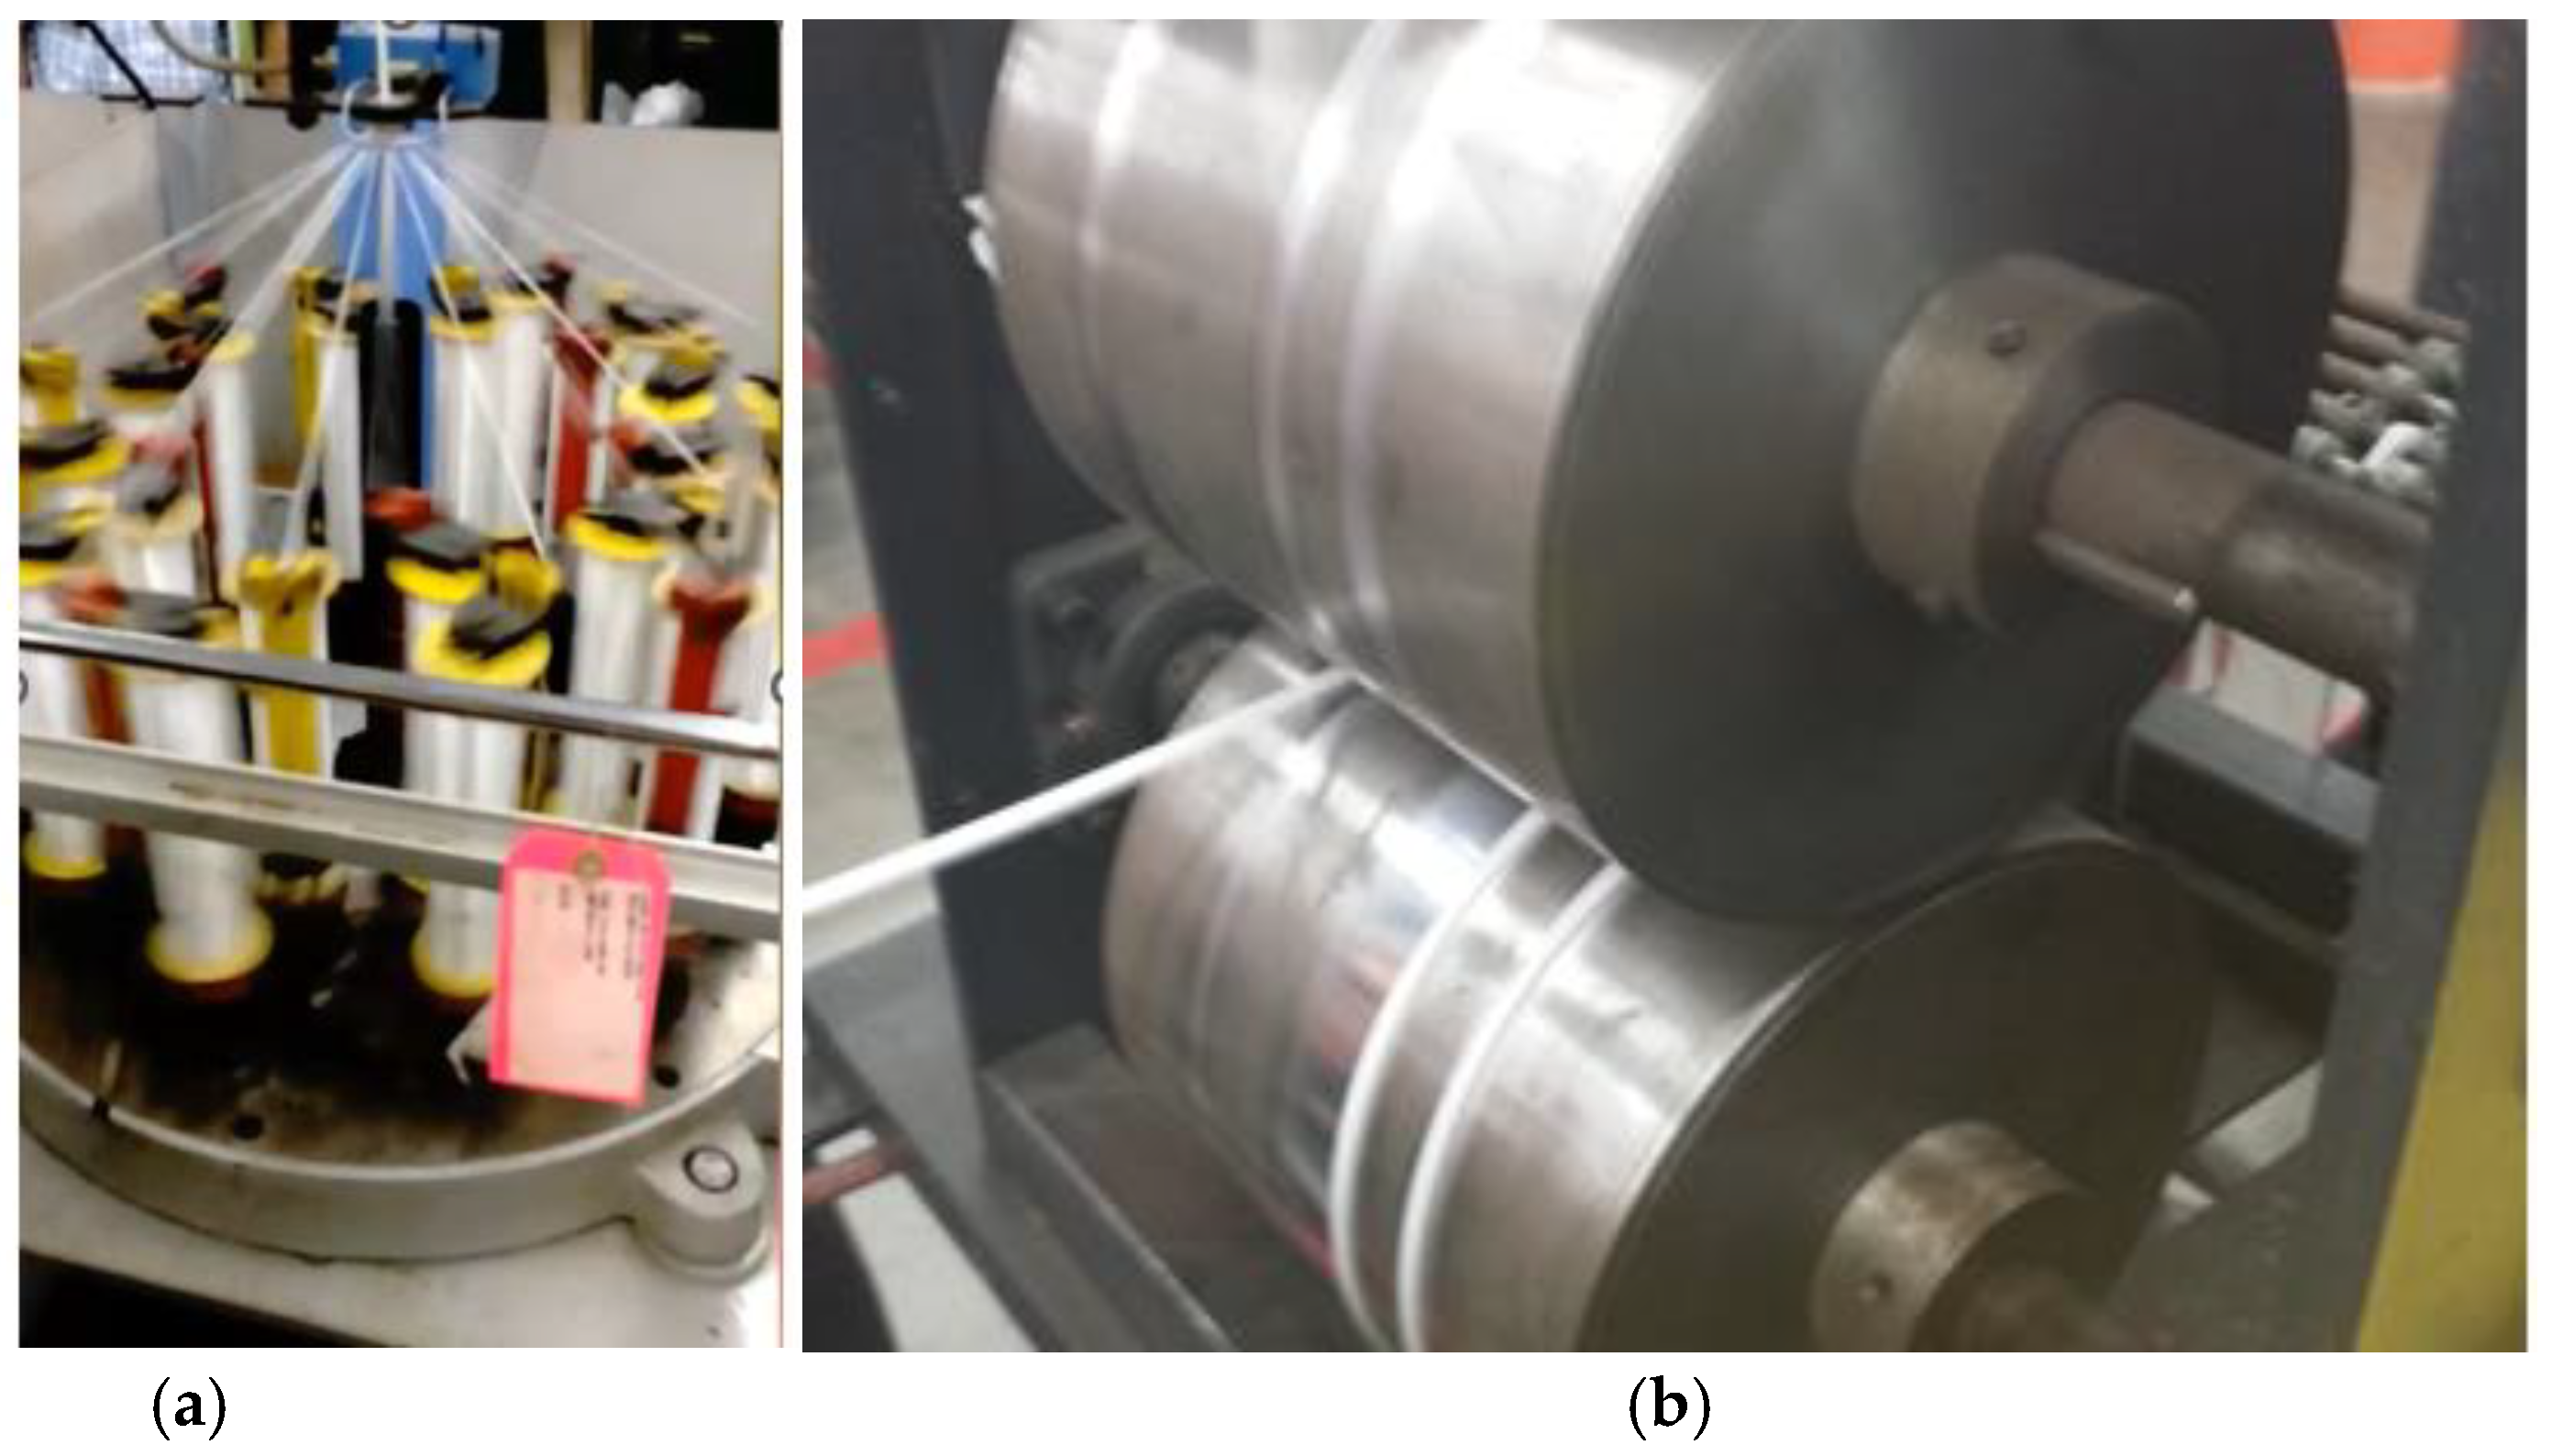
The cord selected for this study was a 24-tow Dacron 1000-lb (spec breaking strength) suspension line (PIA C 2754 Type II) (Figure 1). The tows were braided in an “over two under two” fashion creating a tubular braided structure. After braiding, the tubular cord was flattened between rollers (Figure 2b) to develop a “rounded rectangle” shape, i.e., rectangle with rounded ends (Figure 1c), and wound onto a spool. The specifications of the 24-tow Dacron 1000-lb braided cord are presented in Table 1 [36].
2.2. Single-Tow Tension Tests
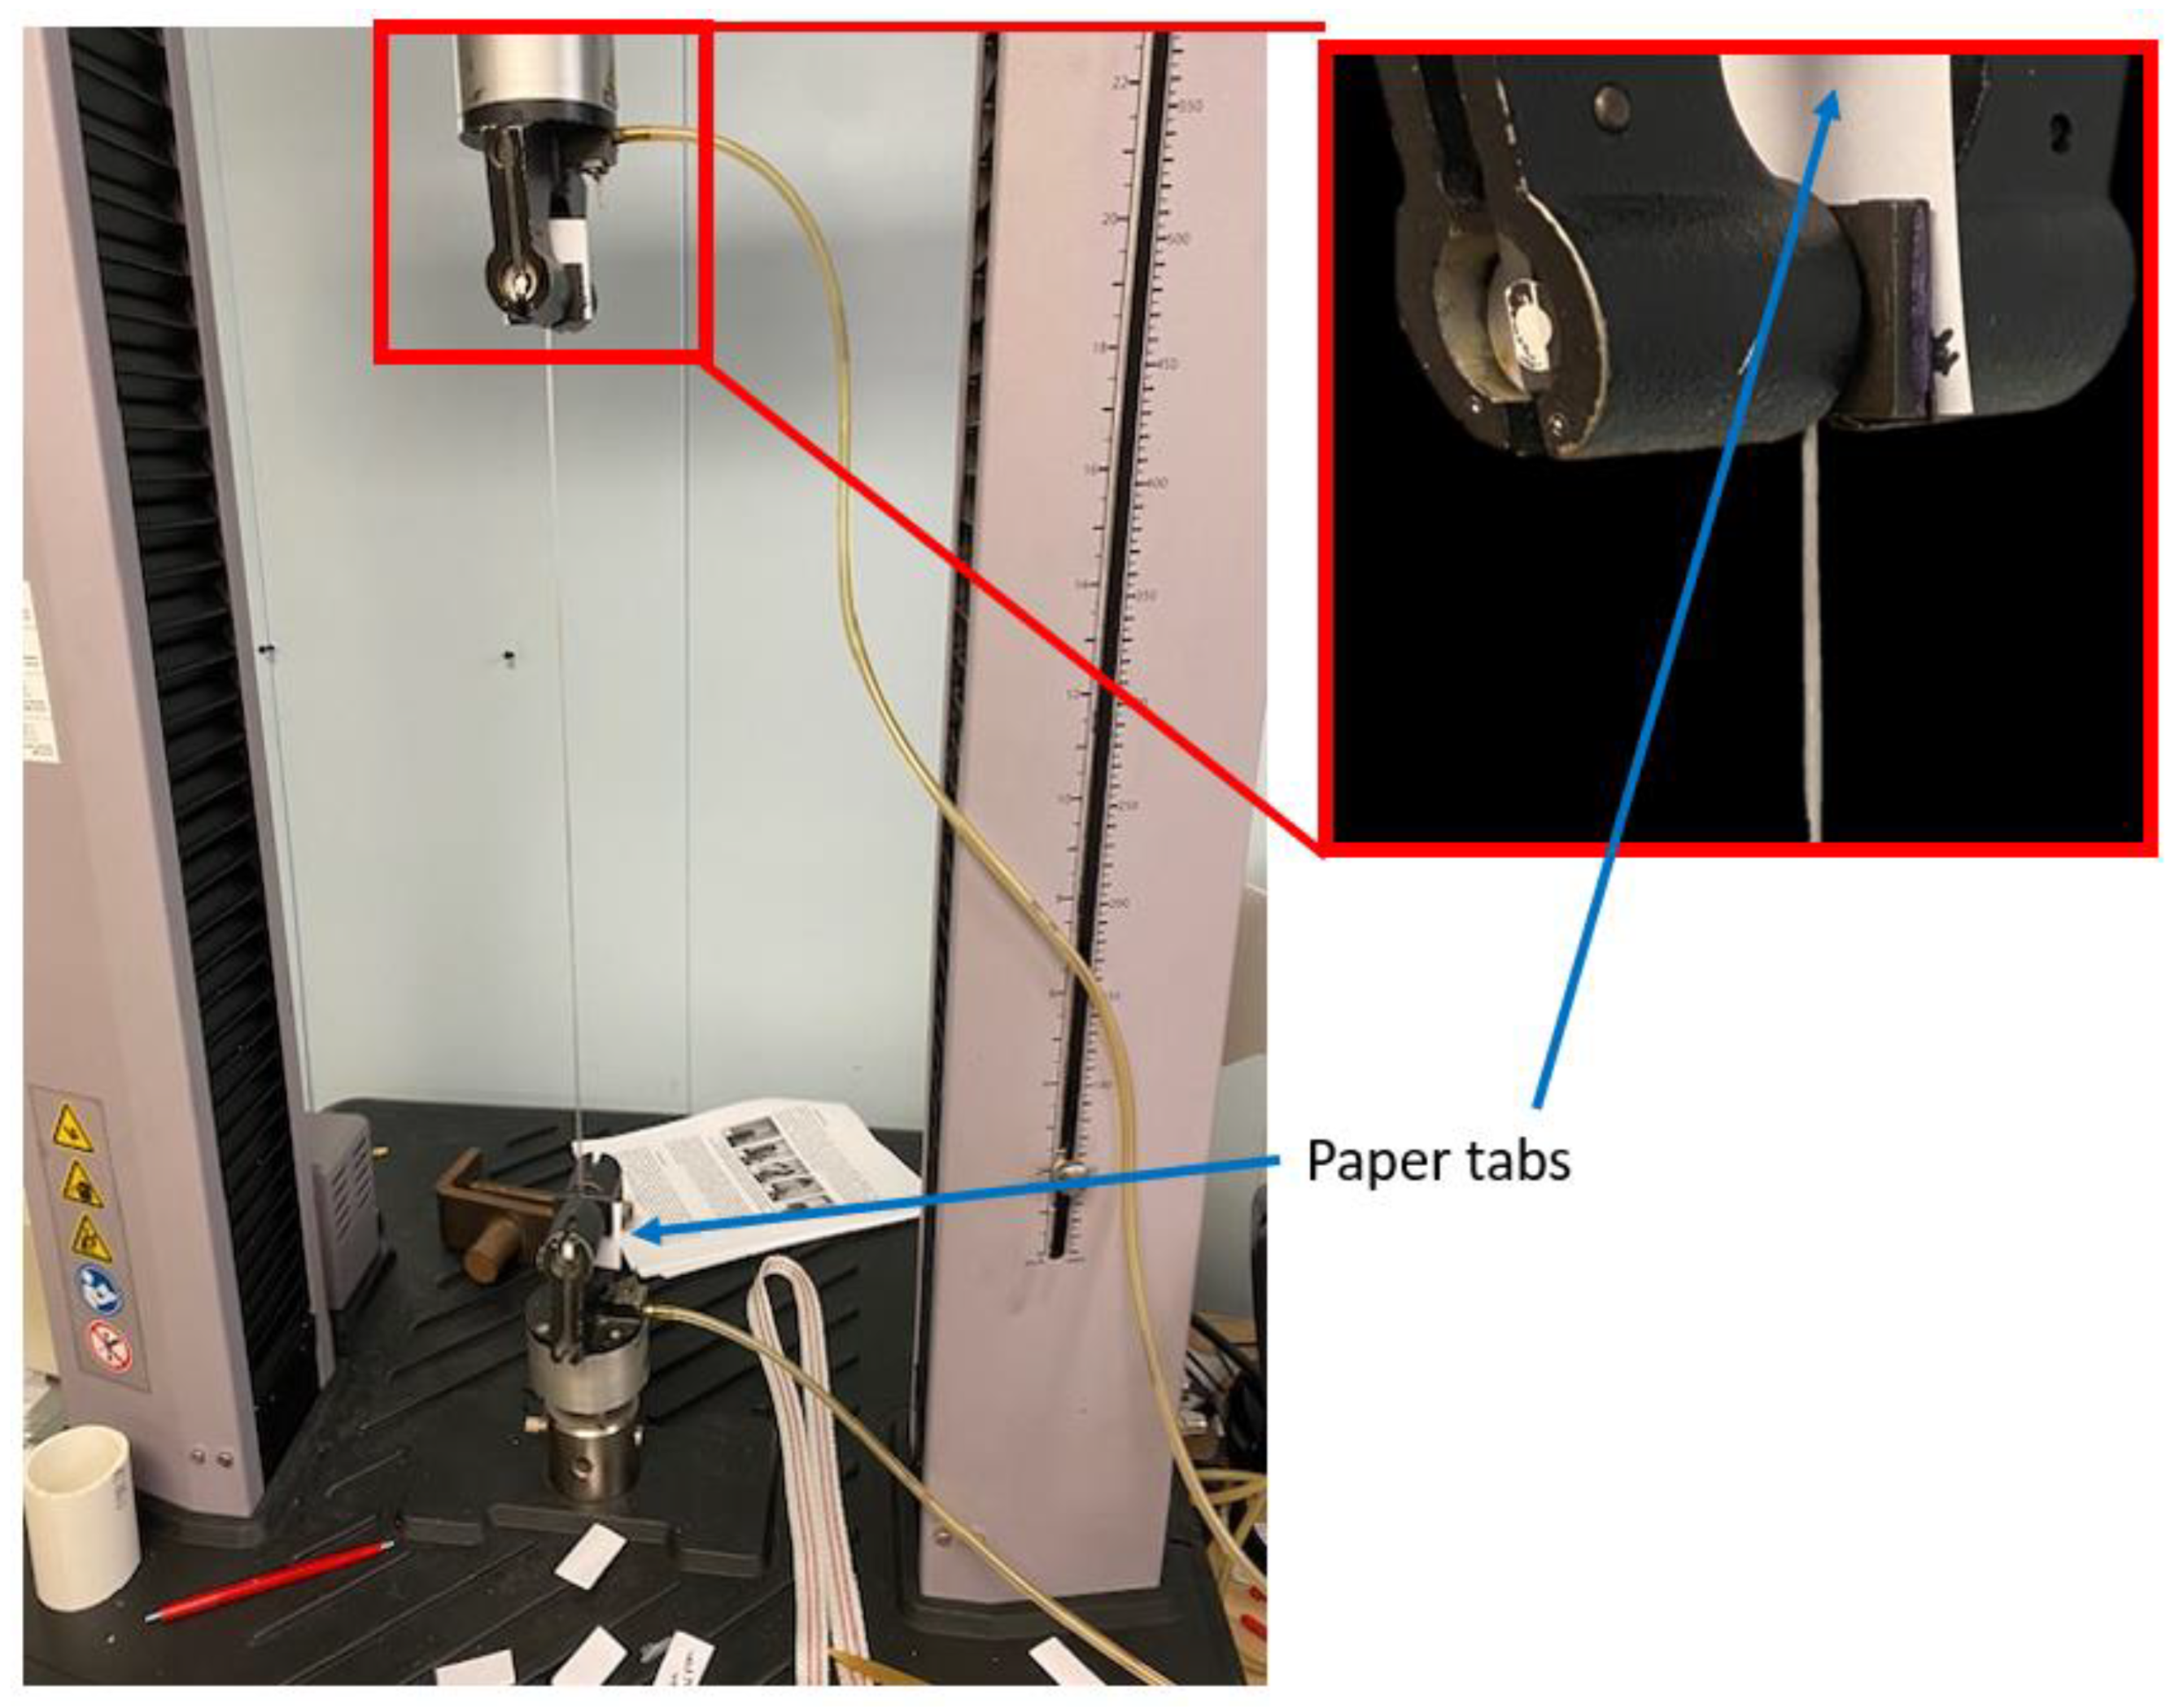
The tensile behaviors of individual tows were characterized to find the axial modulus. The axial elastic modulus was determined from the load–displacement response of pulling a tow in a Universal Testing Machine (Figure 3). A 0.508 m (20-in) gauge length was used to mitigate the effects of the boundary conditions. The crosshead speed was 25.4 cm/min (10 in/min) (strain rate: 0.008/s). To prevent slipping of the specimen in the pressurized clamps, the ends of the tows were adhered to square paper tabs to increase the surface area in the clamps (Figure 3). The load–displacement was recorded and converted to stress–strain. The cross-sectional area was calculated for each specimen by measuring the width and height at the end of the tow, where the fibers were securely glued together, ensuring minimal movement and facilitating precise measurements with calipers. The area was calculated for each and averaged to approximately 9 × 10⁻⁷ m2.
2.3. Braid Geometry: Dimensions and Features
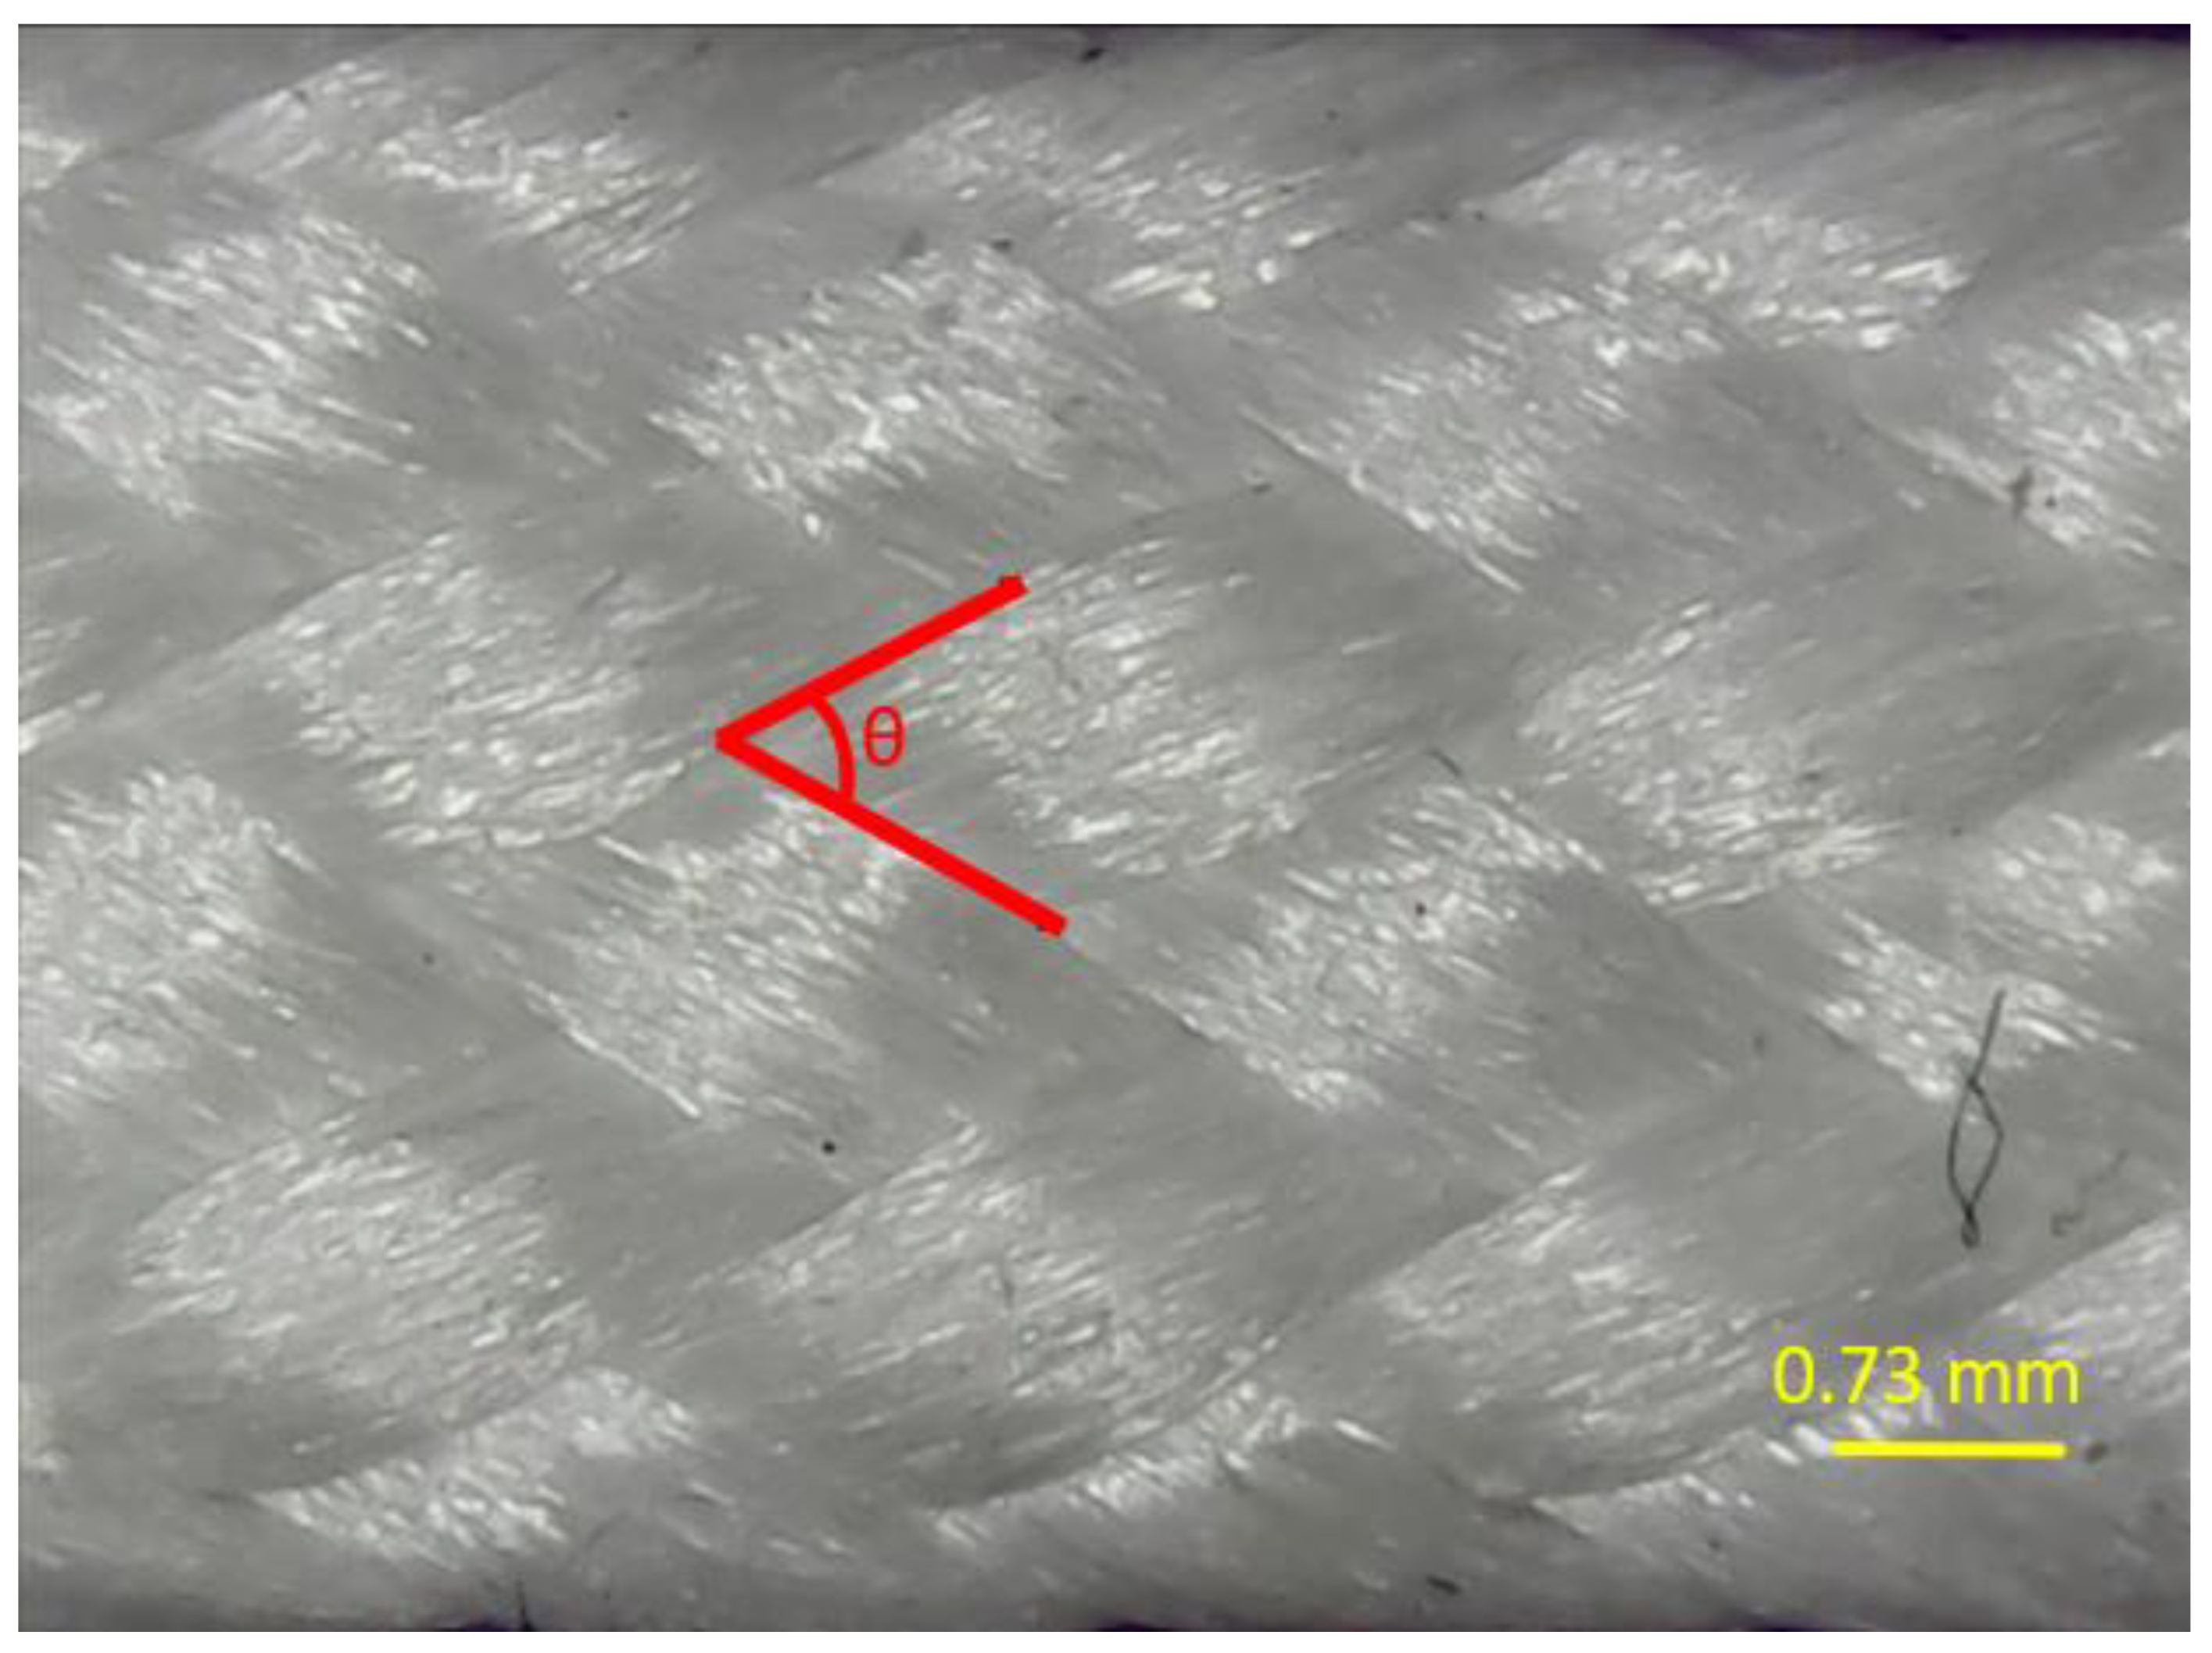
The geometric features such as the tow area, braid diameter, and braid angle of the suspension line were quantified. A digital microscope (Microware USB 1000X) was used to capture five images of five tows encased in resin to freeze the movement of the fibers for the measuring process, and diameters were measured using ImageJ2 [37]. Five images were also taken of the braid, and five angles of the braided fiber tows were measured in five different areas of the images (Figure 4). All angles were measured using ImageJ.
As noted in Section 2.1, the suspension line is first produced as a braided circular cord and then flattened between two rollers. The cross-section of the flattened line can be described as a rounded rectangle (Figure 1c). Assuming the rolling process does not change the length of the perimeter of the cord as it is morphed from a circle to the rounded rectangle, then the initial diameter of the cord can be back-calculated from the perimeter of the flattened suspension line. The width and height were carefully measured using calipers, and the perimeter of the rounded rectangle was calculated. The perimeter was then divided by π to obtain the effective circular braid outer diameter.
2.4. Braid Geometry: Modeling
The Virtual Textile Morphology Suite (VTMS) was used to build the geometry of the circular braided cord. VTMS v3.0 [27] is a software to build CAD models of textile structures which can then be used to create a finite element mesh. VTMS was developed and is maintained by the Air Force Research Laboratory (Wright-Patterson AFB; Fairborn, OH, USA) and the University of Dayton Research Institute (Dayton, OH, USA).
The braided cord model was developed in VTMS, beginning with the creation of a tubular biaxial braid for a 24-tow Dacron 1000-lb suspension line (PIA C 2754 Type II). A braid with a length of three unit cells (tow path pattern repetition) was initially built so that one unit cell could be cut from the center, ensuring that the ends were flat for application of boundary conditions. Design inputs like the 2 × 2 braid pattern, tow diameter, and braid angle were used. Because VTMS assumes the tows are perfect circles, this assumption led to significant penetrations between the tows. These penetrations were addressed by reducing the input tow diameter and slightly increasing the input braid diameter, resulting in reduced penetrations.
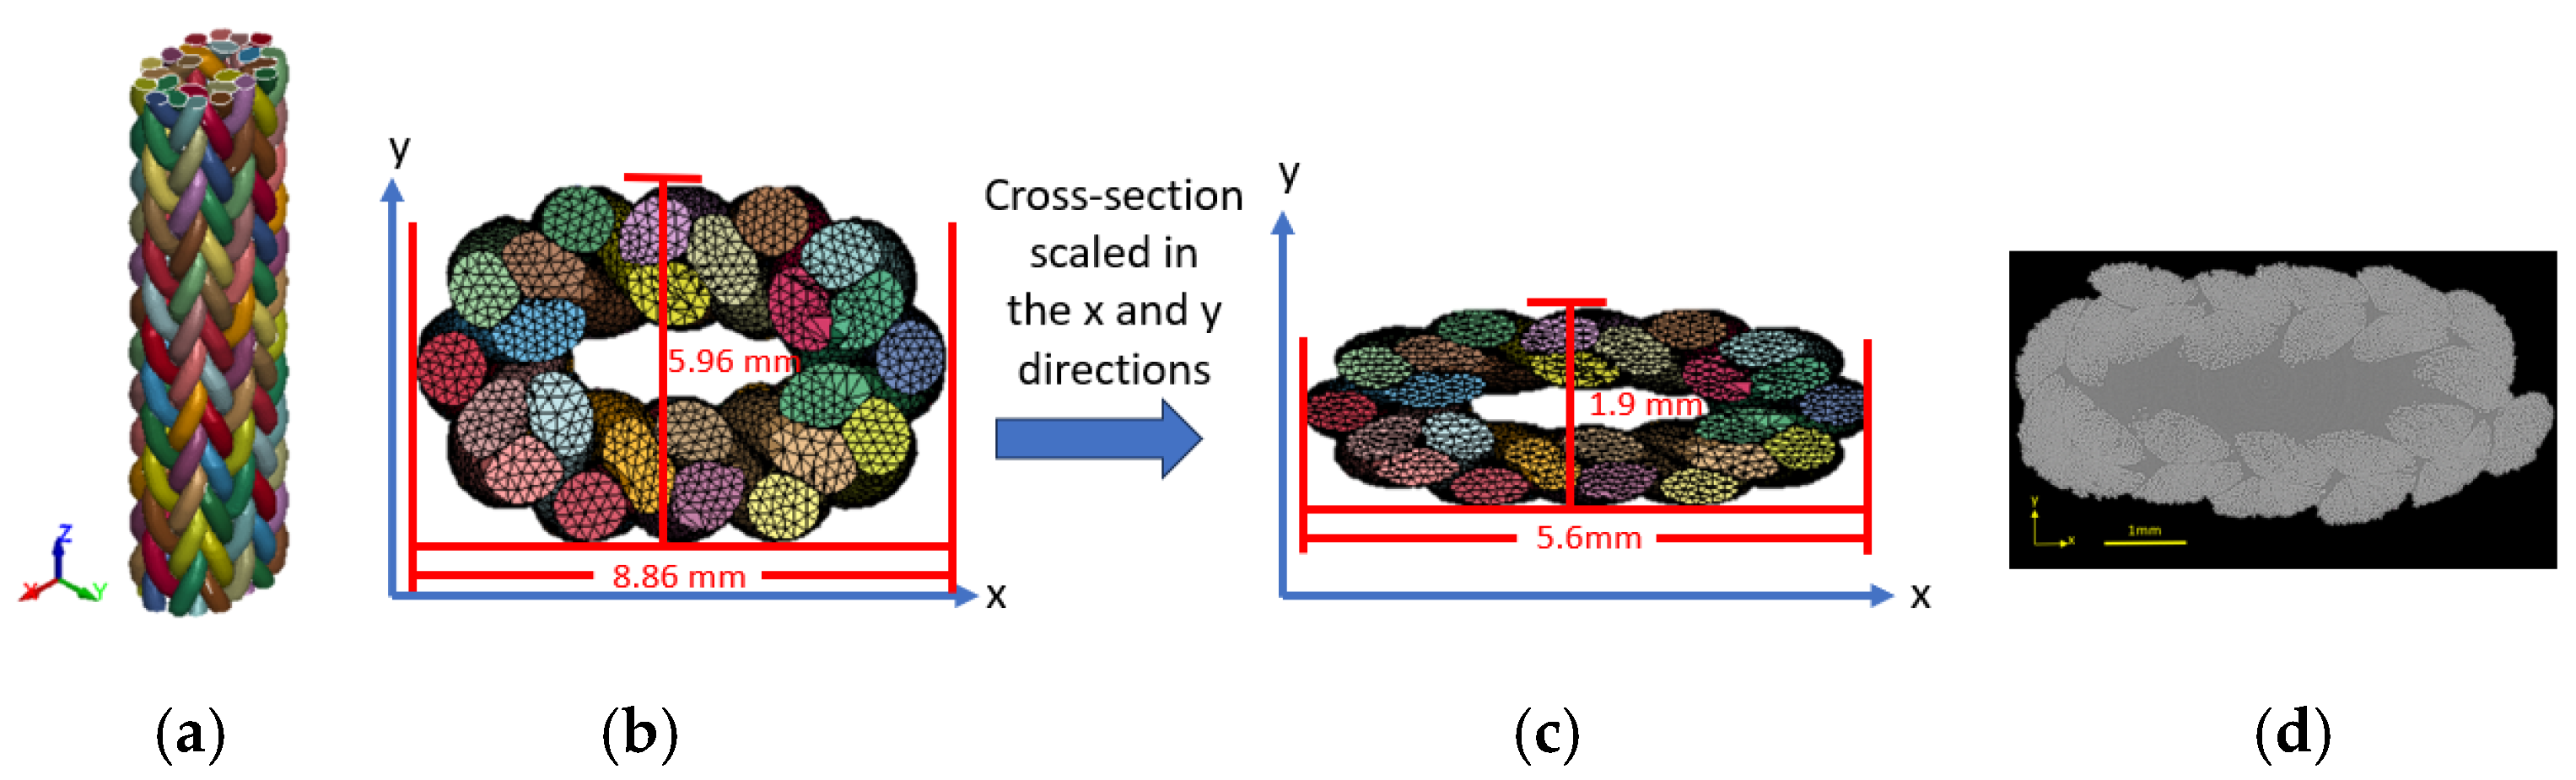
The braid was then flattened using the VTMS Relaxation module, where two plates compressed the braid to simulate the real-world deformation that occurs during the manufacturing process, i.e., the braid being flattened between rollers. Further penetrations were reduced, and the tows were fiberized (the homogenized solid tow was broken up into a specified amount of smaller circles to represent fibers that make up a tow) to reflect their actual as-manufactured shapes (i.e., the cross-sectional area of each tow can deform). The fiberized geometry was captured and converted back to the meso-scale, and the center section of this three-unit-cell length was taken to obtain one unit cell. This geometry creation process can be seen in Figure 5. The model was meshed in Altair HyperMesh and transferred to LS-PrePost.
Finally, the model’s cross-section had to be scaled in both the x and y directions because the adjustments made in VTMS to avoid penetration issues resulted in a slightly larger cross-section than the actual suspension line. To match the real braid dimensions (height of 1.9 mm and base of 5.6 mm), the cross-section was scaled. This adjustment also required modifying the braid length to maintain the correct braid angle (~56°), ensuring an accurate representation of the physical braid. The meshed braid and cross-section adjustment and its comparison to the real-life braid cross-section can be seen in Figure 6. The model cross-section compares well to that of the actual braid cross-section.
2.5. Material Model
The constitutive behavior of a tow in the braid was assumed to be transversely isotropic as a result of the bundles of fibers exhibiting distinctly different axial and transverse behaviors. This constitutive behavior was incorporated into LS-DYNA® release 14 as a user-defined material model (UMAT). Under the solid element section of the UMAT, equations to calculate the state of stress were inserted based on the stiffness matrix of a transversely isotropic material (Equation (1)). In this formulation, E1 and E2 are the Young’s moduli in the 1 and 2 directions, G12 and G2 are the shear moduli in the 1-2 plane and the 2-3 plane, respectively, σij is the stress in the ij-direction, εij is the strain in the ij-direction, and ν12, ν21, ν2 are the Poisson ratios in the 1-2, 2-1 and 2-3 planes.
For this material model, the 1-direction corresponds to the axial direction of the tow and the 2 and 3-directions correspond to the transverse directions of the tow. Because it is difficult for a bundle of fibers to support a compressive load in the axial direction, a criterion was included to specify that the stress at an integration point in the 1-direction was prescribed to be zero when there was a negative strain detected in the 1-direction (Equation (2)). The material direction 1 was prescribed for each element by using a curve of the centerline of each of the tows (Figure 7a)
The material properties E1, E2, G12, G2, ν12, ν21 and ν2 were derived from experimental test data. The modulus E1 was found using the experimental single-tow tension tests that were described in Section 2.2. The values of E2, G12, G2, ν12, ν21, and ν2 were all back-calculated from the testing of the full braid with the objective to have a set of material properties that gave a mesoscale finite element model which correlated well with experimental tensile tests of the full braid. The experimental program used to find these material properties is presented in Barry et al. [38].
2.6. Single-Tow Model
To verify that the material model represented the behavior of a single tow, a solid cylinder was created with a length of 34 mm and a cross-section comparable to a tow pulled from the braided suspension line. The tow was fixed on one end, and an axial displacement of 2.38 mm was prescribed in the 1-direction. The load vs. displacement was tracked and converted to stress–strain to compare with experimental single-tow tension tests.
2.7. Model of the Tensile Test of the Full Braid
The finite element model of the representative unit cell of the full braid subjected to uniaxial tension is shown in Figure 7b. Contact was defined such that each tow could interact with the other 23 tows of the 24-tow braid—resulting in 276 contact definitions (this is a common combinations problem, taking 24 parts and obtaining all of their different combinations of pairings). The contact definitions used the *CONTACT_SURFACE_TO_SURFACE keyword which uses a penalty-based contact method. To simulate a tensile test of the suspension line, the bottom of the braid was completely fixed, and a displacement was prescribed to the top (the nodes on top were restricted to only move in the z-direction). The model was run using the implicit non-linear solver, and the load–displacement was tracked. Results from the model were compared with tensile tests of the suspension line as presented by Barry et al. [38]. The finite element model’s braid geometry did not exactly replicate the fully nested physical configuration of the cord (i.e., when the tows are fully settled and locked into position) because adjustments were necessary in the model geometry to reduce tow-to-tow penetration (Section 2.4). The loose structure of the braid rendered any addition of friction to this model insignificant, as there was not enough normal force between the tows to make a difference. Therefore, it was hypothesized that slight adjustments to the material behavior of the tow within the braid configuration were needed to accurately represent the tensile behavior of the braid in its fully nested state. Because of this nesting phenomenon, a parametric study was carried out so that material properties E1, E2, G12, G2, ν12, ν21, and ν2 were tuned to give good correlation between the model and tensile test data. The set of properties that correlated well with the single-tow tension test provided a good starting point to use with this parametric study to tune material properties to match experimental tensile test results. The model was run in LS-DYNA®.
2.8. Modeling of the Torsion Test of the Full Braid
The finite element model of the representative unit cell of the full braid subjected to combined tension torsion is shown in Figure 7c. The bottom of the braid was fixed. A rigid circular plate was placed on the top, and the nodes on the top of the braid were tied to the plate surface using the keyword *CONTACT_TIED_NODES_TO_SURFACE. To induce a tension in this model of the suspension line, an axial load (Pz) was prescribed to the plate for the first step, and this tension was held constant for the second (torque) step in the model solution. During Step 2, an angular displacement (θ) was prescribed to the plate. This modeling approach was used to investigate the torsional behavior of the braid as a function of the axial tension.
The model was analyzed using an implicit solver, and the reaction forces of the rigid plate were measured. The value of the torque (T) was used to calculate the effective GJ in
where θ is the angular displacement, L is the length of the braid, GJ is the effective shear modulus and polar moment of inertia of the braid. The calculated GJ of the model was compared with the calculated GJ from torsional experiments because GJ should be the same regardless of length for a given tension (Barry et al. [38]). To obtain the GJ from the experiments, the kT (torsional stiffness) was obtained from Barry et al. [38] and Equation (4) was used.
When kT is multiplied by the length (L), the result is GJ.
3. Results and Discussion
3.1. Braid Geometry: Dimensions and Features
The results from the measured braid parameters are listed in Table 2.
3.2. Single-Tow Tension Tests
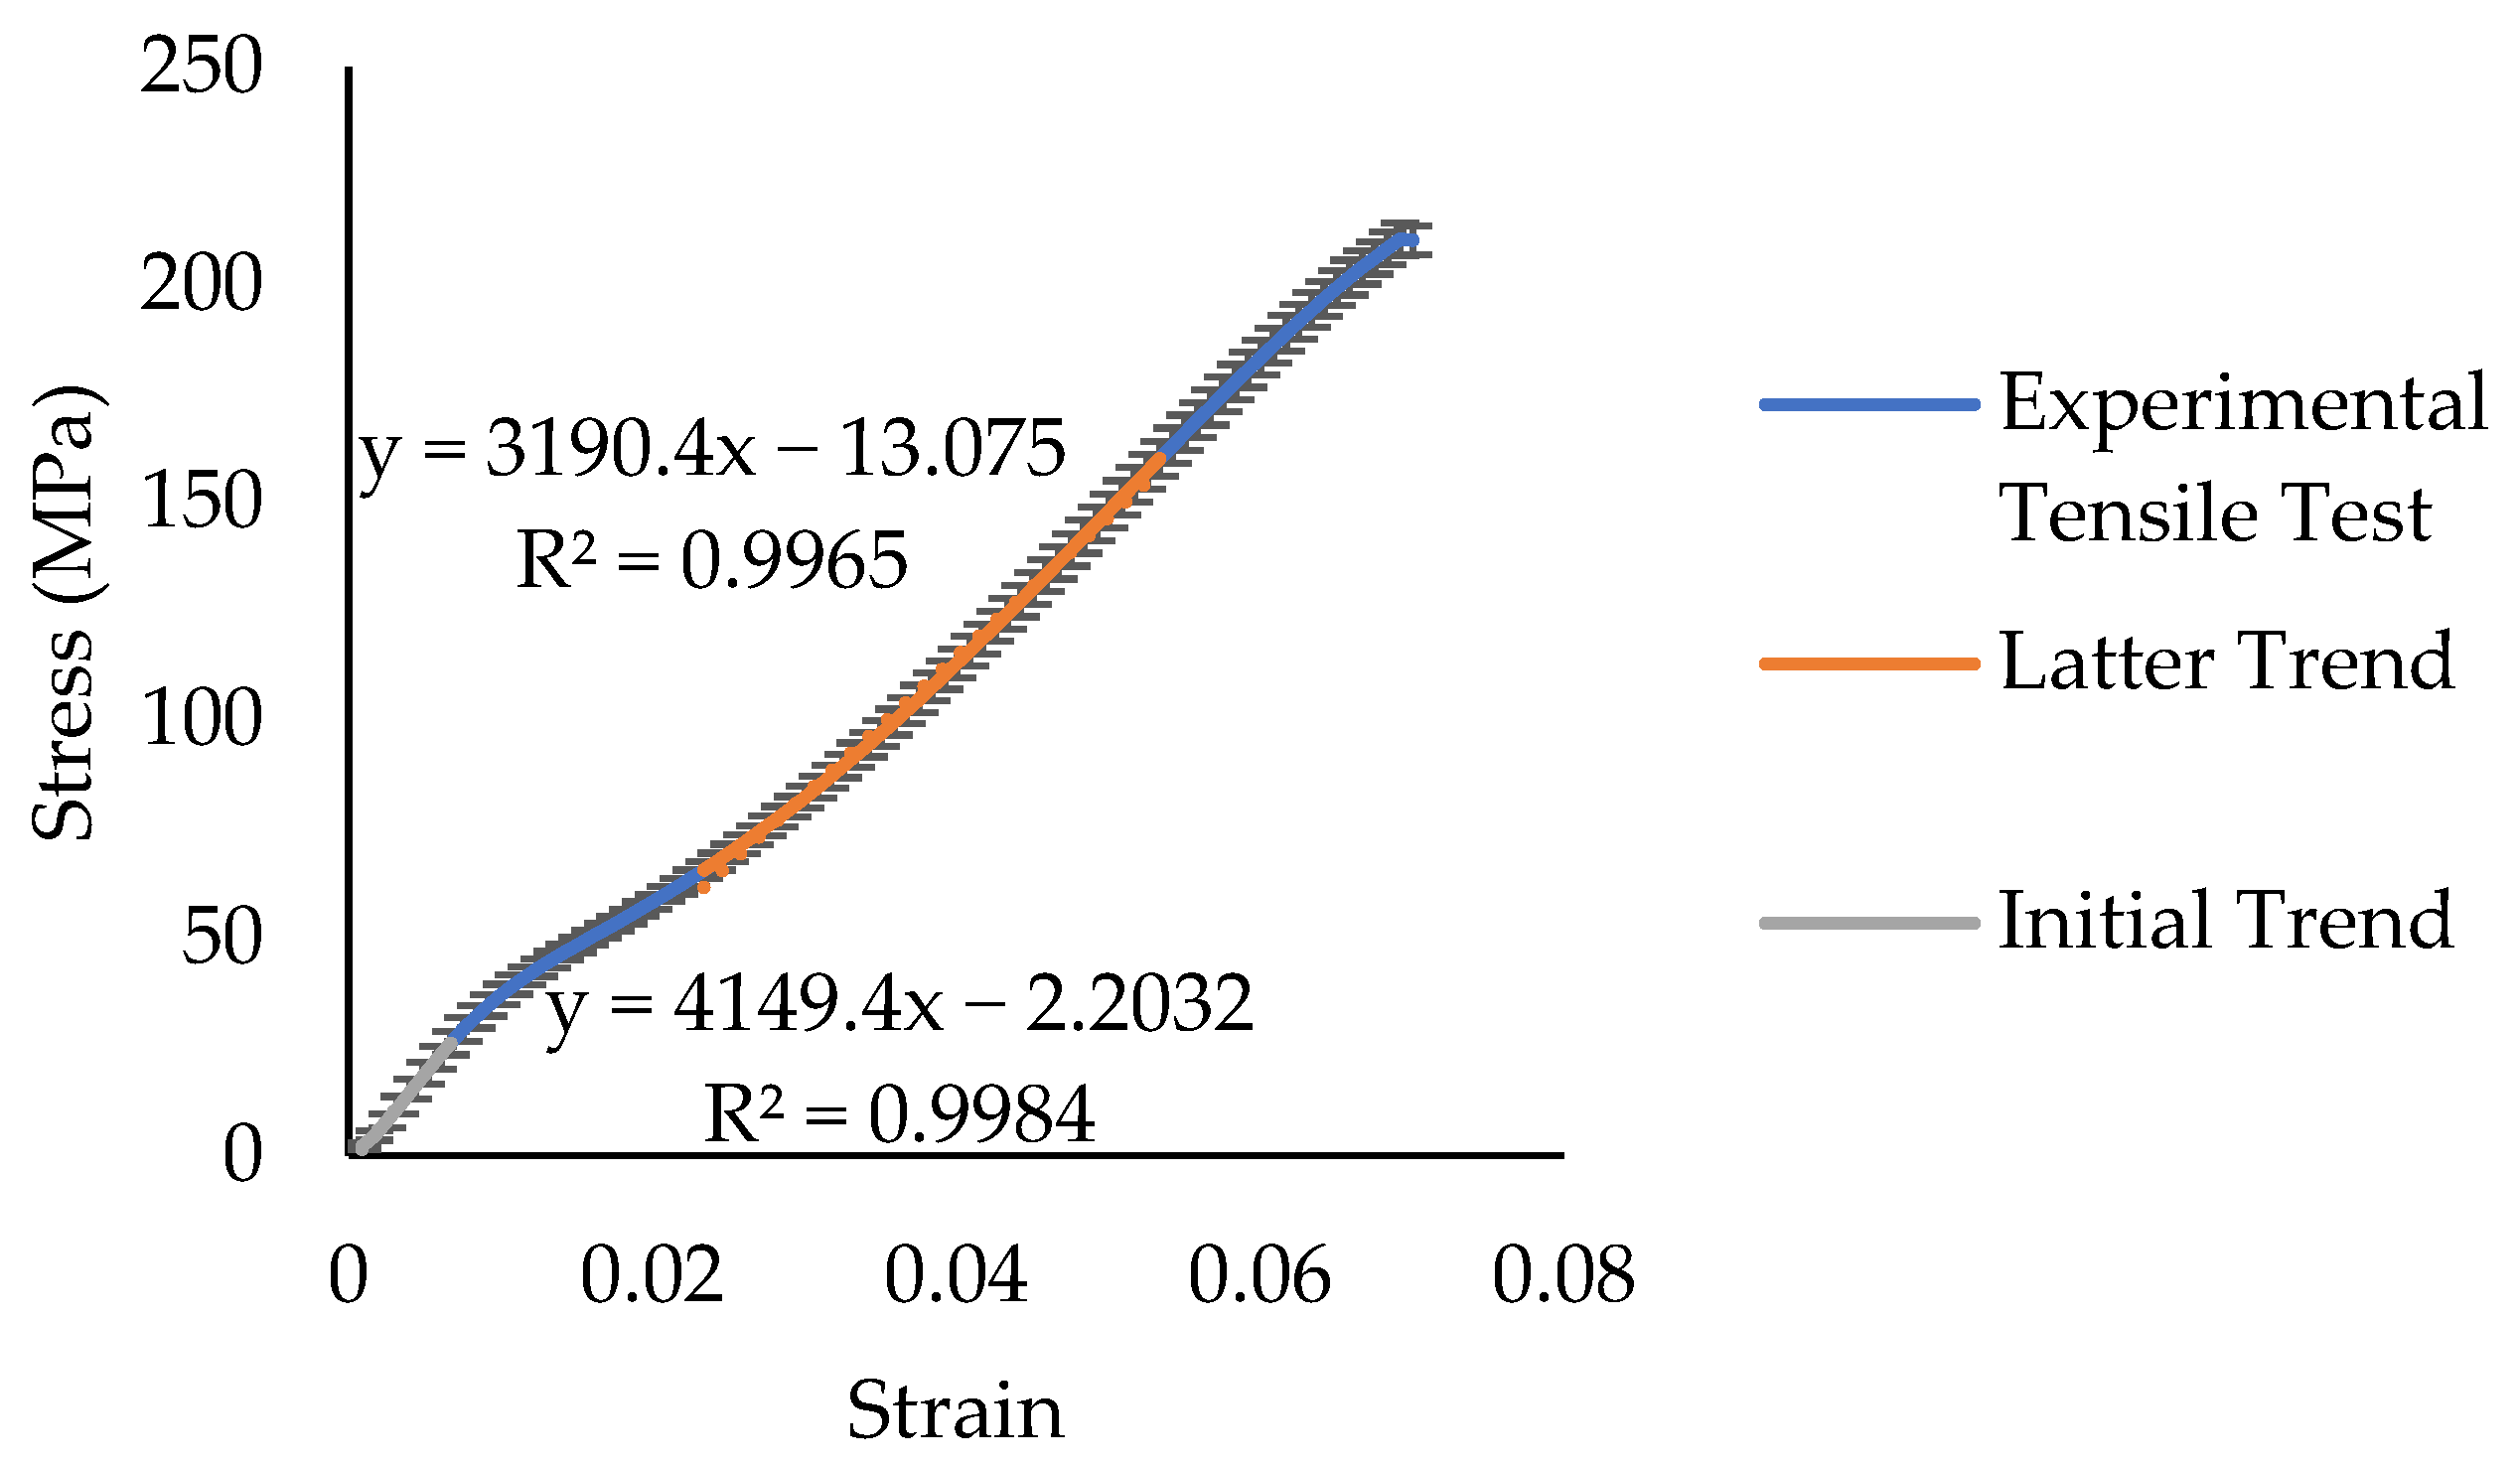
The average stress–strain curve of five tests of single tows is shown in Figure 8. The error bars are for one standard deviation. It can be seen in the graph that the axial behavior can be described as essentially bilinear, and the data exhibit two different moduli as a function of the stress–strain state. It is hypothesized that this could be the non-linear behavior of the polymer fibers (polyethylene terephthalate, Dacron). The initial modulus is ~4100 MPa. At a stress of about 30 MPa, the modulus decreases to ~3200 MPa. These moduli were estimated from trend lines that were created from the data in regions that were observed to be the two different linear regions. While the experimental data suggests an additional transition near 70 MPa, the tow behavior was approximated as bilinear for simplicity and practicality. Given the inherent nonlinearity of polymer fibers, capturing at least two distinct stiffness regions was necessary to represent the key material transitions while avoiding excessive complexity. This bilinear assumption allowed for a manageable yet accurate representation of the tow response within the scope of this study. Future work could refine the tow response model to account for more transitions as the tow is pulled.
3.3. Single-Tow Finite Element Model
A finite element model of a solid cylinder was used to investigate if the UMAT was properly capturing the constitutive behavior of the tows. The UMAT was coded to accommodate the bilinear behavior by dropping the initial value of E1 to a lower value (3200 MPa) when the effective stress in the element exceeded the threshold of 30 MPa. The initial E1 was set to be 4100 MPa to match the first slope observed in the single-tow tension tests.
Attempts were made to characterize the lateral compressive modulus of the individual tows by compressing a bundle of fibers between two plates. However, because the fibers were not twisted into a yarn, there was nothing holding the fibers together. Thus, the fibers spread apart when compressed, thereby making it challenging to conclude a reliable value of the lateral compressive modulus. A second attempt to measure this property combined multiple tows and two weights were tied at the ends on both sides. This grouping was positioned on the compression plate with the weights hanging off the ends; however, this test configuration resulted in a large spread of data making the test also unreliable. It is recommended that any future work on the characterization of the lateral compressive modulus of the individual tows explore a more reliable and repeatable methodology.
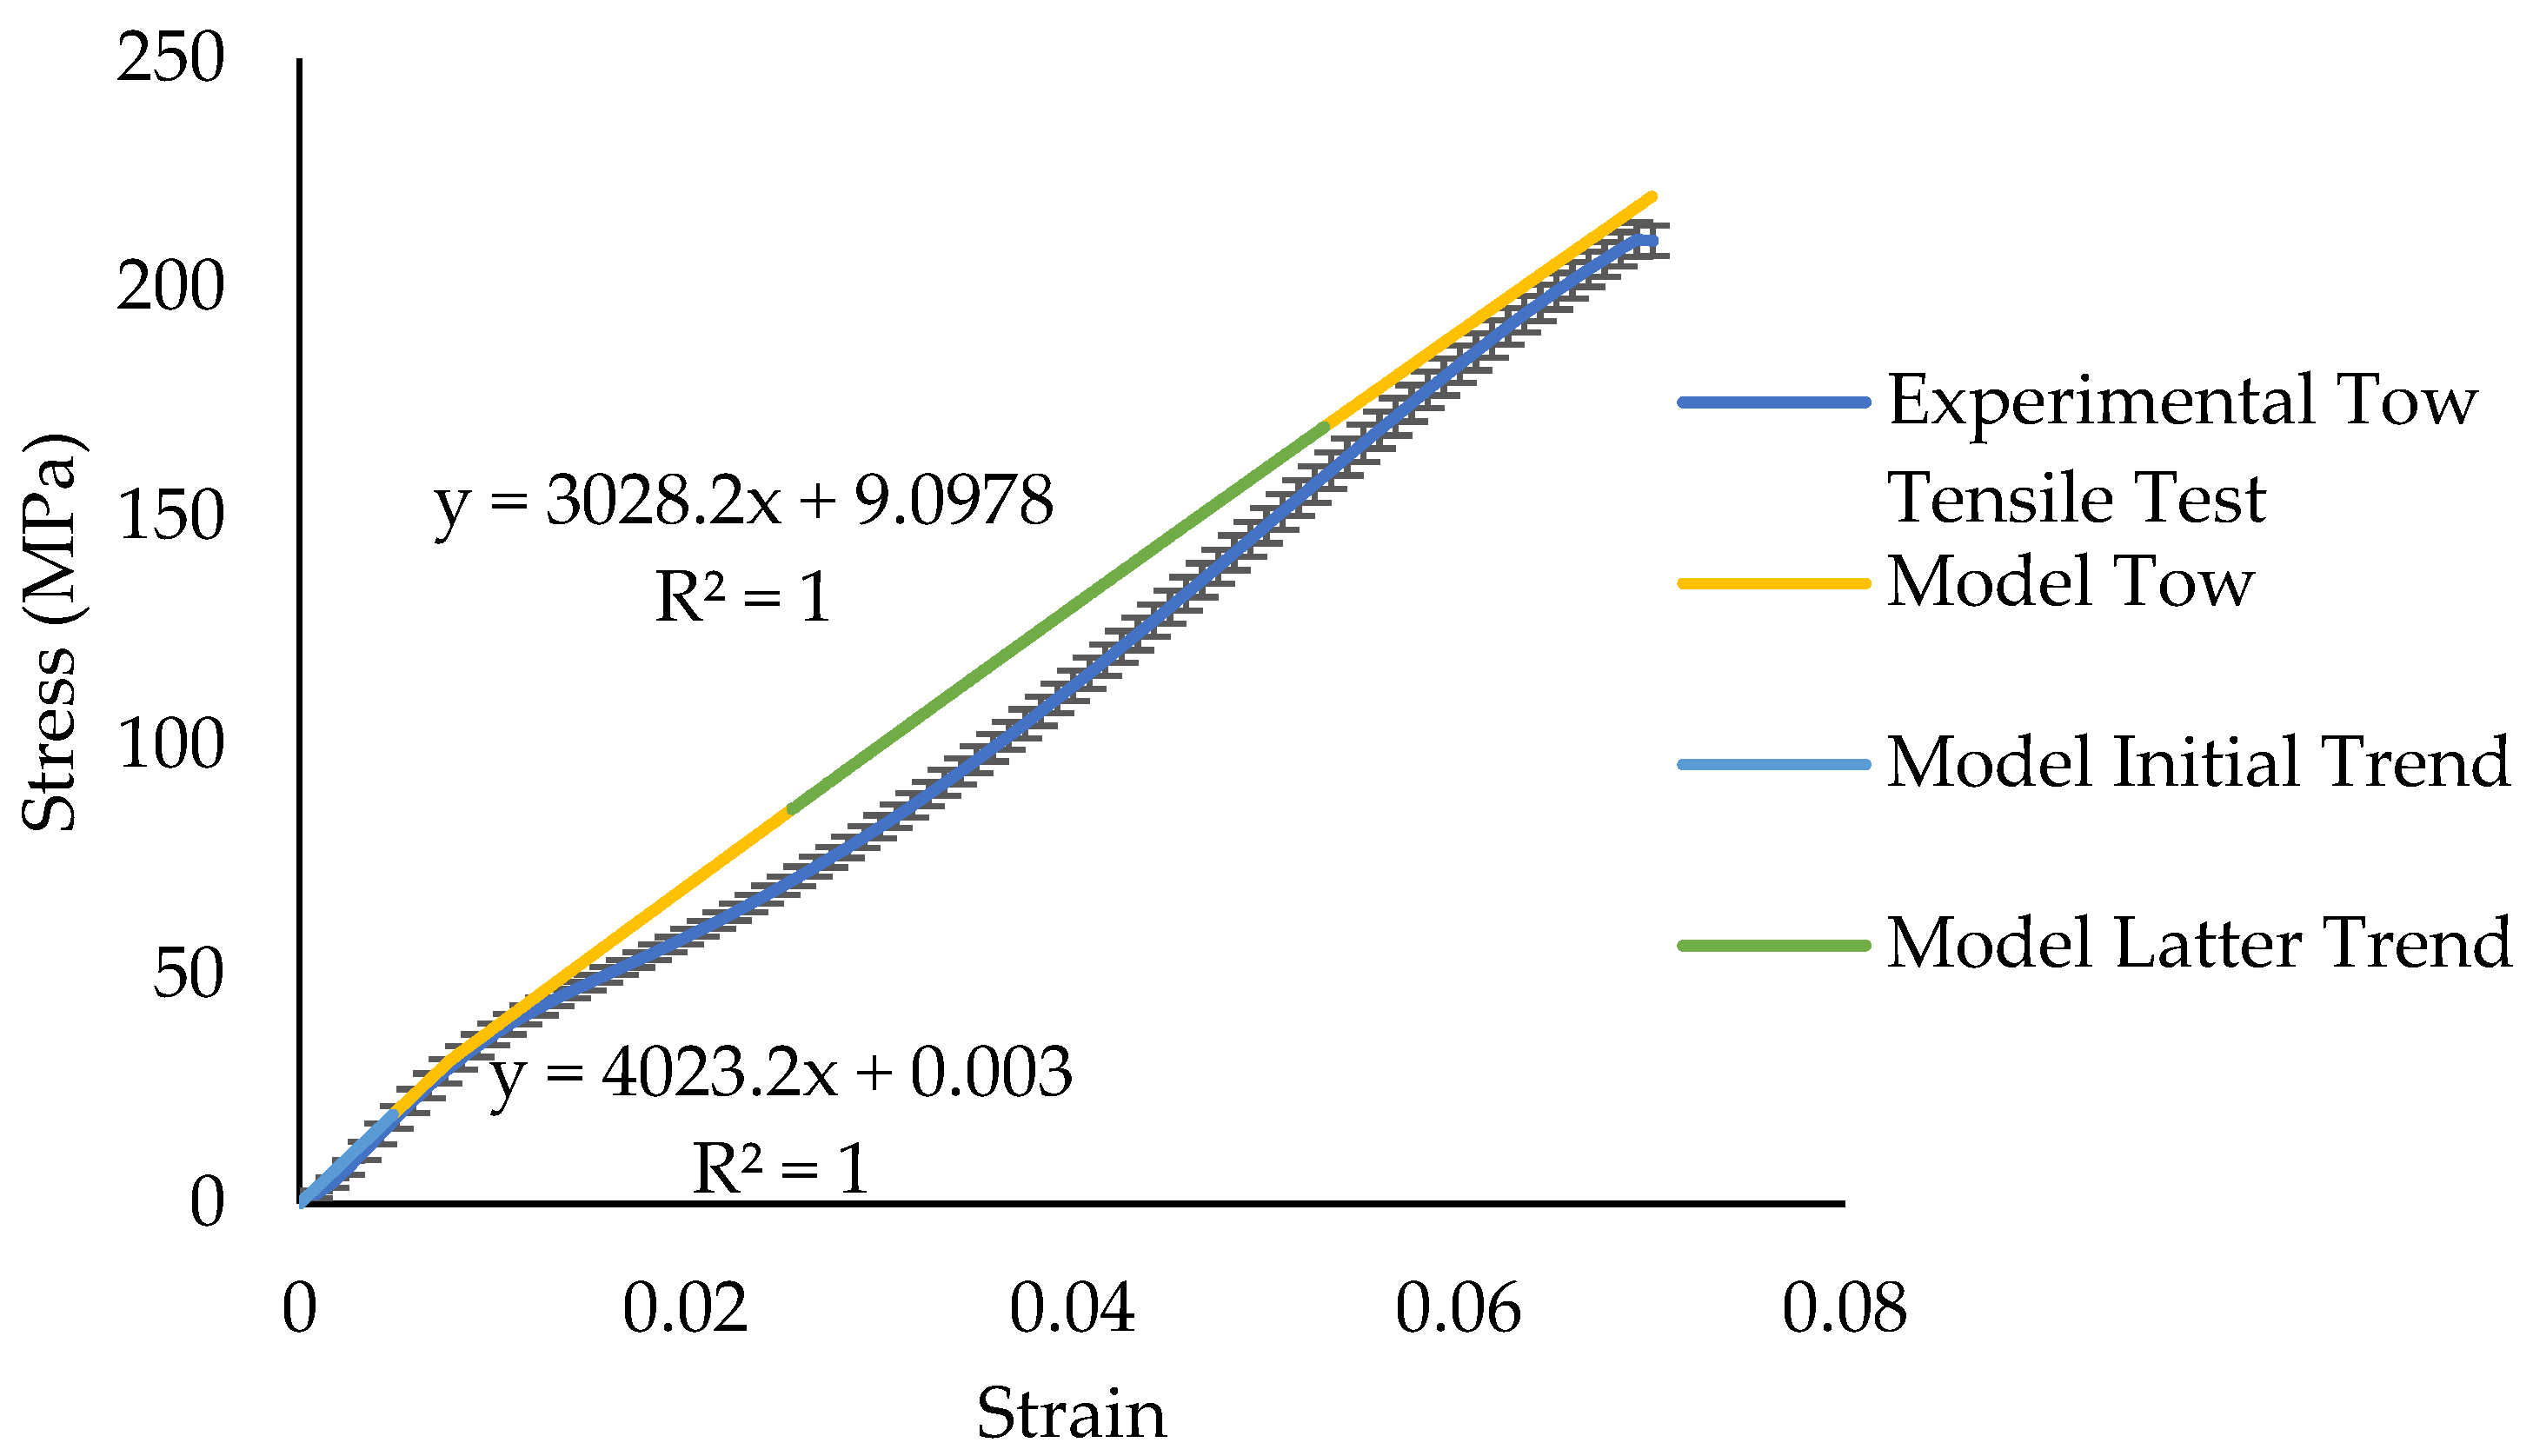
The rest of the material properties were estimated using reasonable assumptions assuming linear elastic material behavior. E2 (the behavior perpendicular to the direction of the fibers) was estimated to be 5000 MPa because it was slightly higher than the axial modulus; when the tows come into contact with one another in the model, the transverse properties will need to be stiff enough to help with the contact and to avoid element distortion. Assuming the lateral compaction state of the tows was such that they were in a state of incompressibility, ν2 was set equal to 0.49 and because of this the G2 was estimated to be 1677.85 MPa. This transverse behavior of the tow was kept the same regardless of the state of stress in the elements. For the behavior in the direction of the fibers of the tow, the tow bundle is assumed to consist of independent fibers, which ensures that it will not contract inward significantly when subjected to a tensile force along the fibers. As a result, the values of ν21 and ν12 were assumed to be zero. Because of this assumption, the G12 was estimated to be half of the E1 modulus, i.e., 2050 MPa. The same logic applied to G12 after the threshold stress of 30 MPa was reached resulting in it being 1600 MPa. A summary of these properties is given in Table 3. Figure 9 shows a comparison of the stress–strain results from the model and the experimental data. The bilinear stress–strain behavior is captured well.
3.4. Modeling of the Tensile Test of the Braided Cord
The mesomechanical model of the braid is shown in Figure 7b. This model was built such that the tows represent the braid in the fully nested configuration as a result of loading the braid in tension following the manufacturing process. To achieve this nested configuration, the complex geometry of the braid was manually built to avoid initial tow-to-tow penetrations.
3.4.1. Initial Tensile Model Run
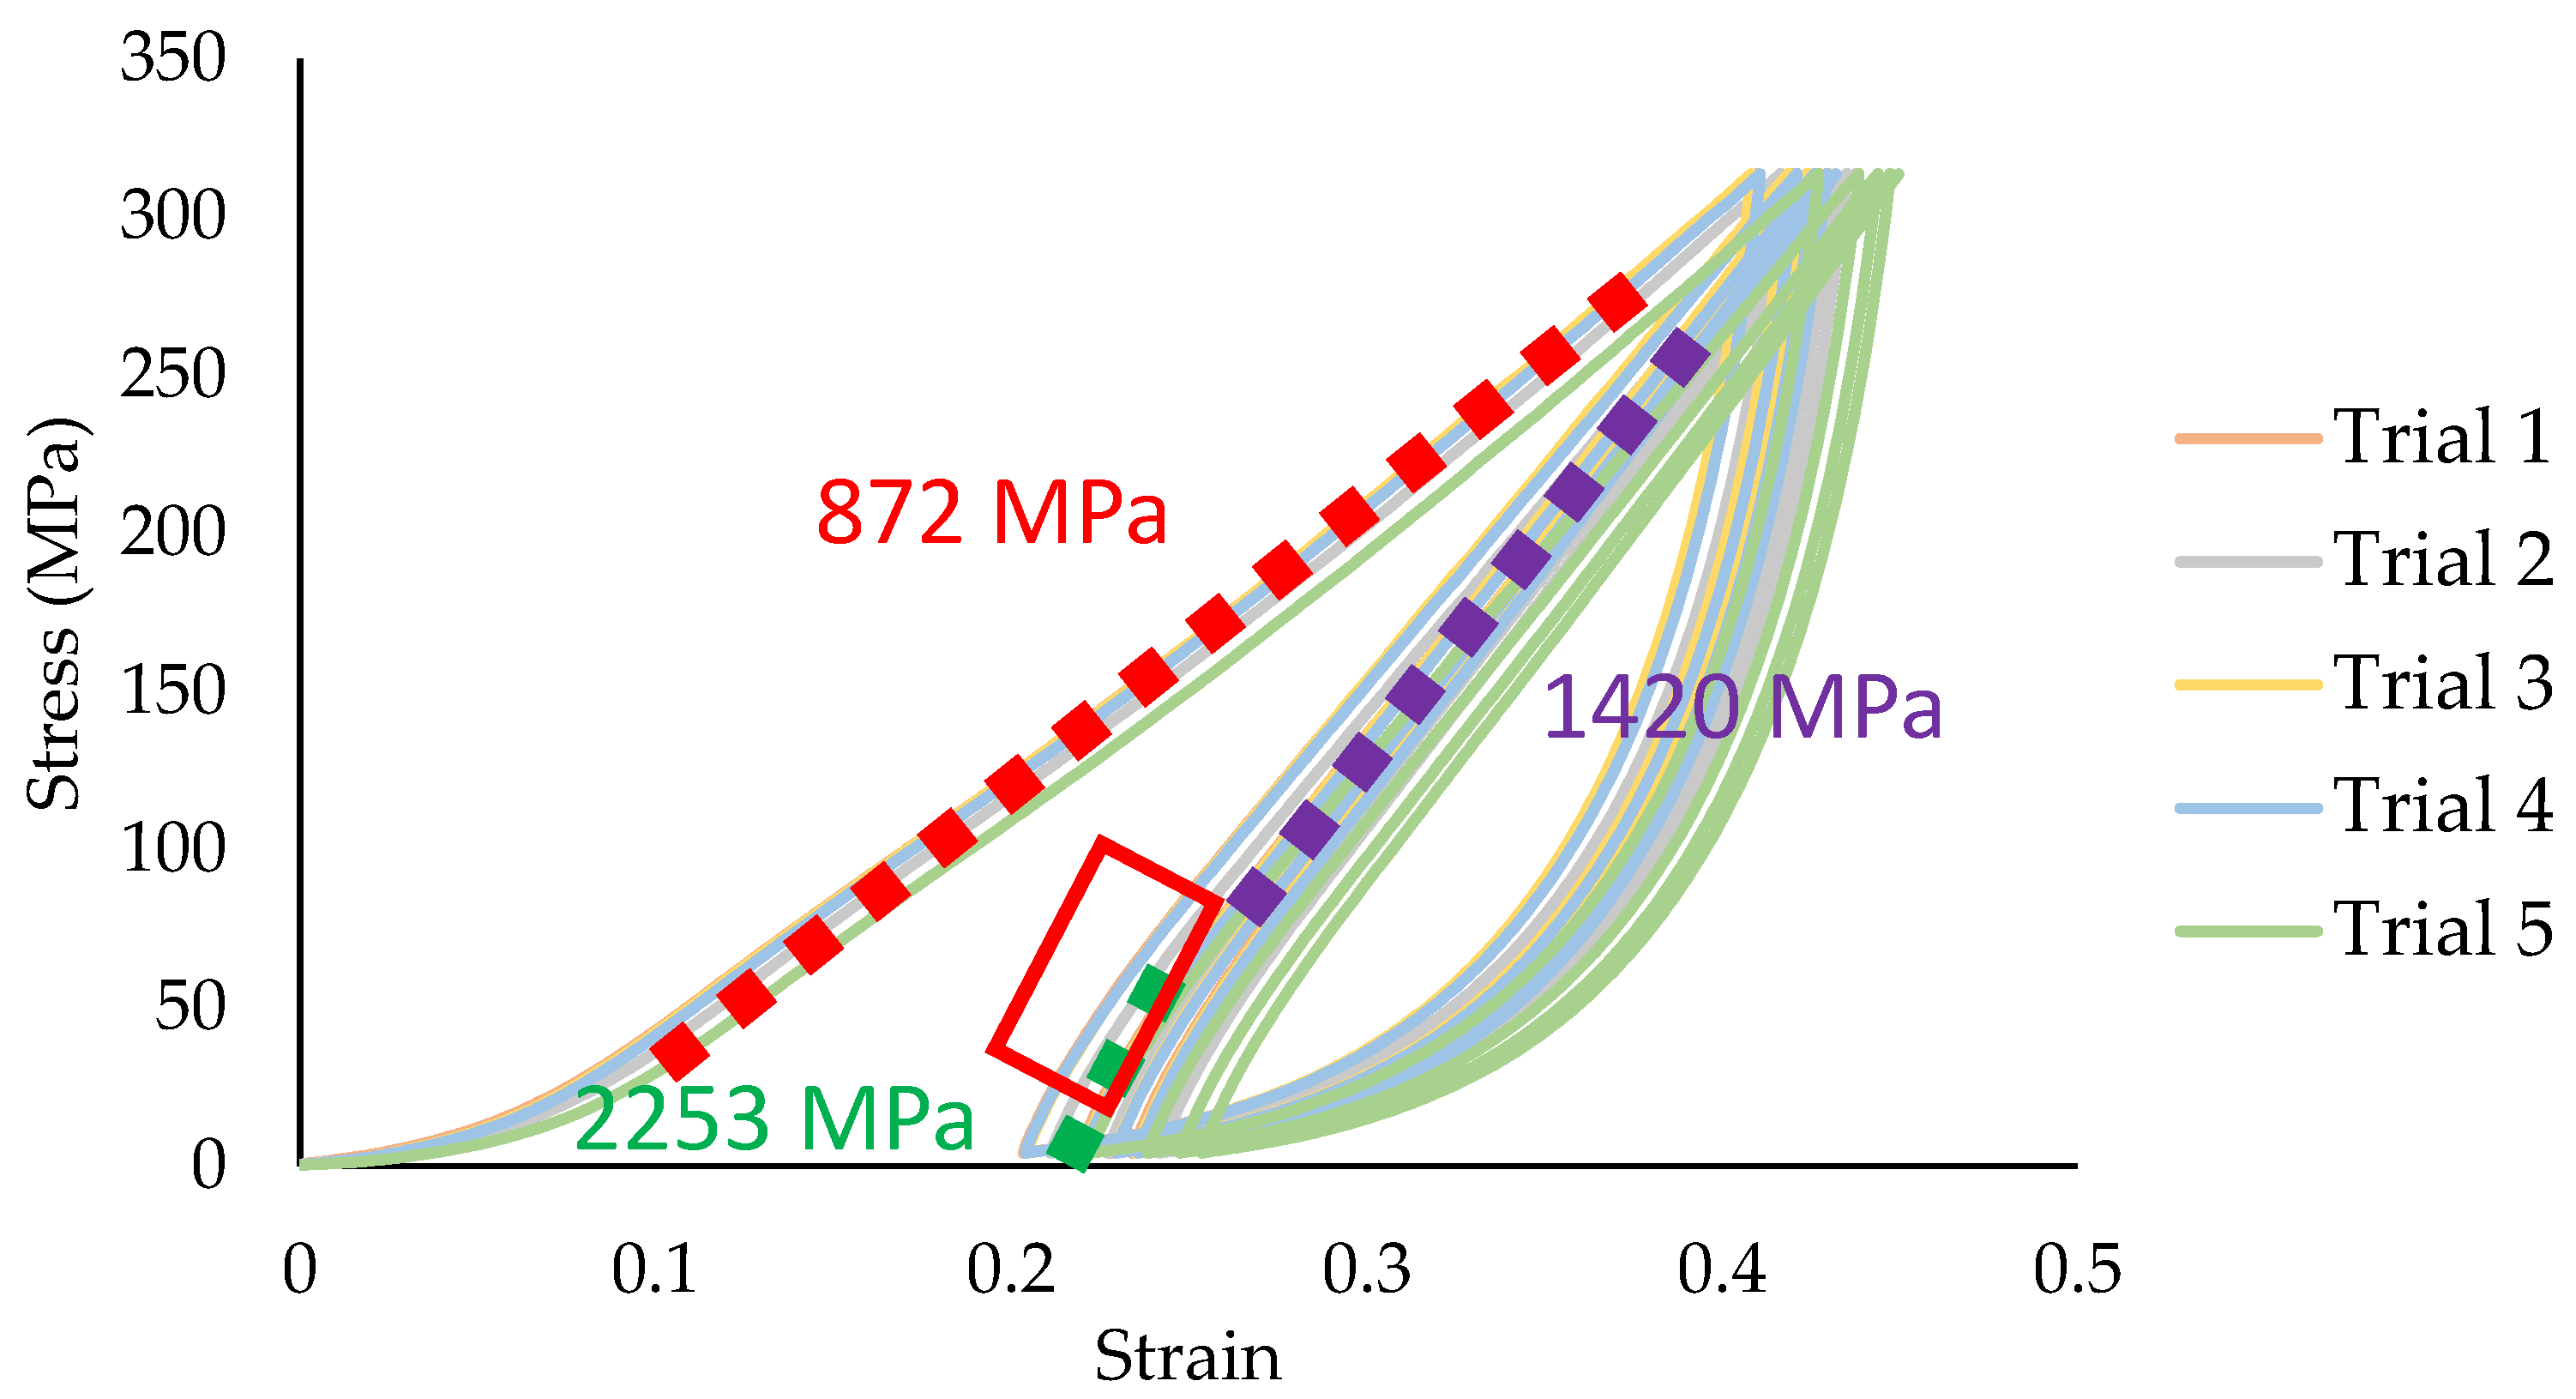
The results from the experimental cyclic testing of the braid are shown in Figure 10. It can be seen in Figure 10 that the effective tensile modulus of the suspension line as the load is being increased is lower for the first cycle (872 MPa) in comparison to the loading modulus for the next four cycles. This increase in stiffness for the next four cycles is a consequence of the tows nesting into position during the first cycle. In the current study, the tensile behavior after the first cycle is the response that is being simulated by the mesomechanical model of the braid. It can be seen in Figure 10 that the fully nested braid exhibits a bilinear behavior as was observed in the single-tow tension tests, and the respective initial (2253 MPa) and secondary (1420 MPa) moduli for the experimental pull of the full braid are denoted on Figure 10.
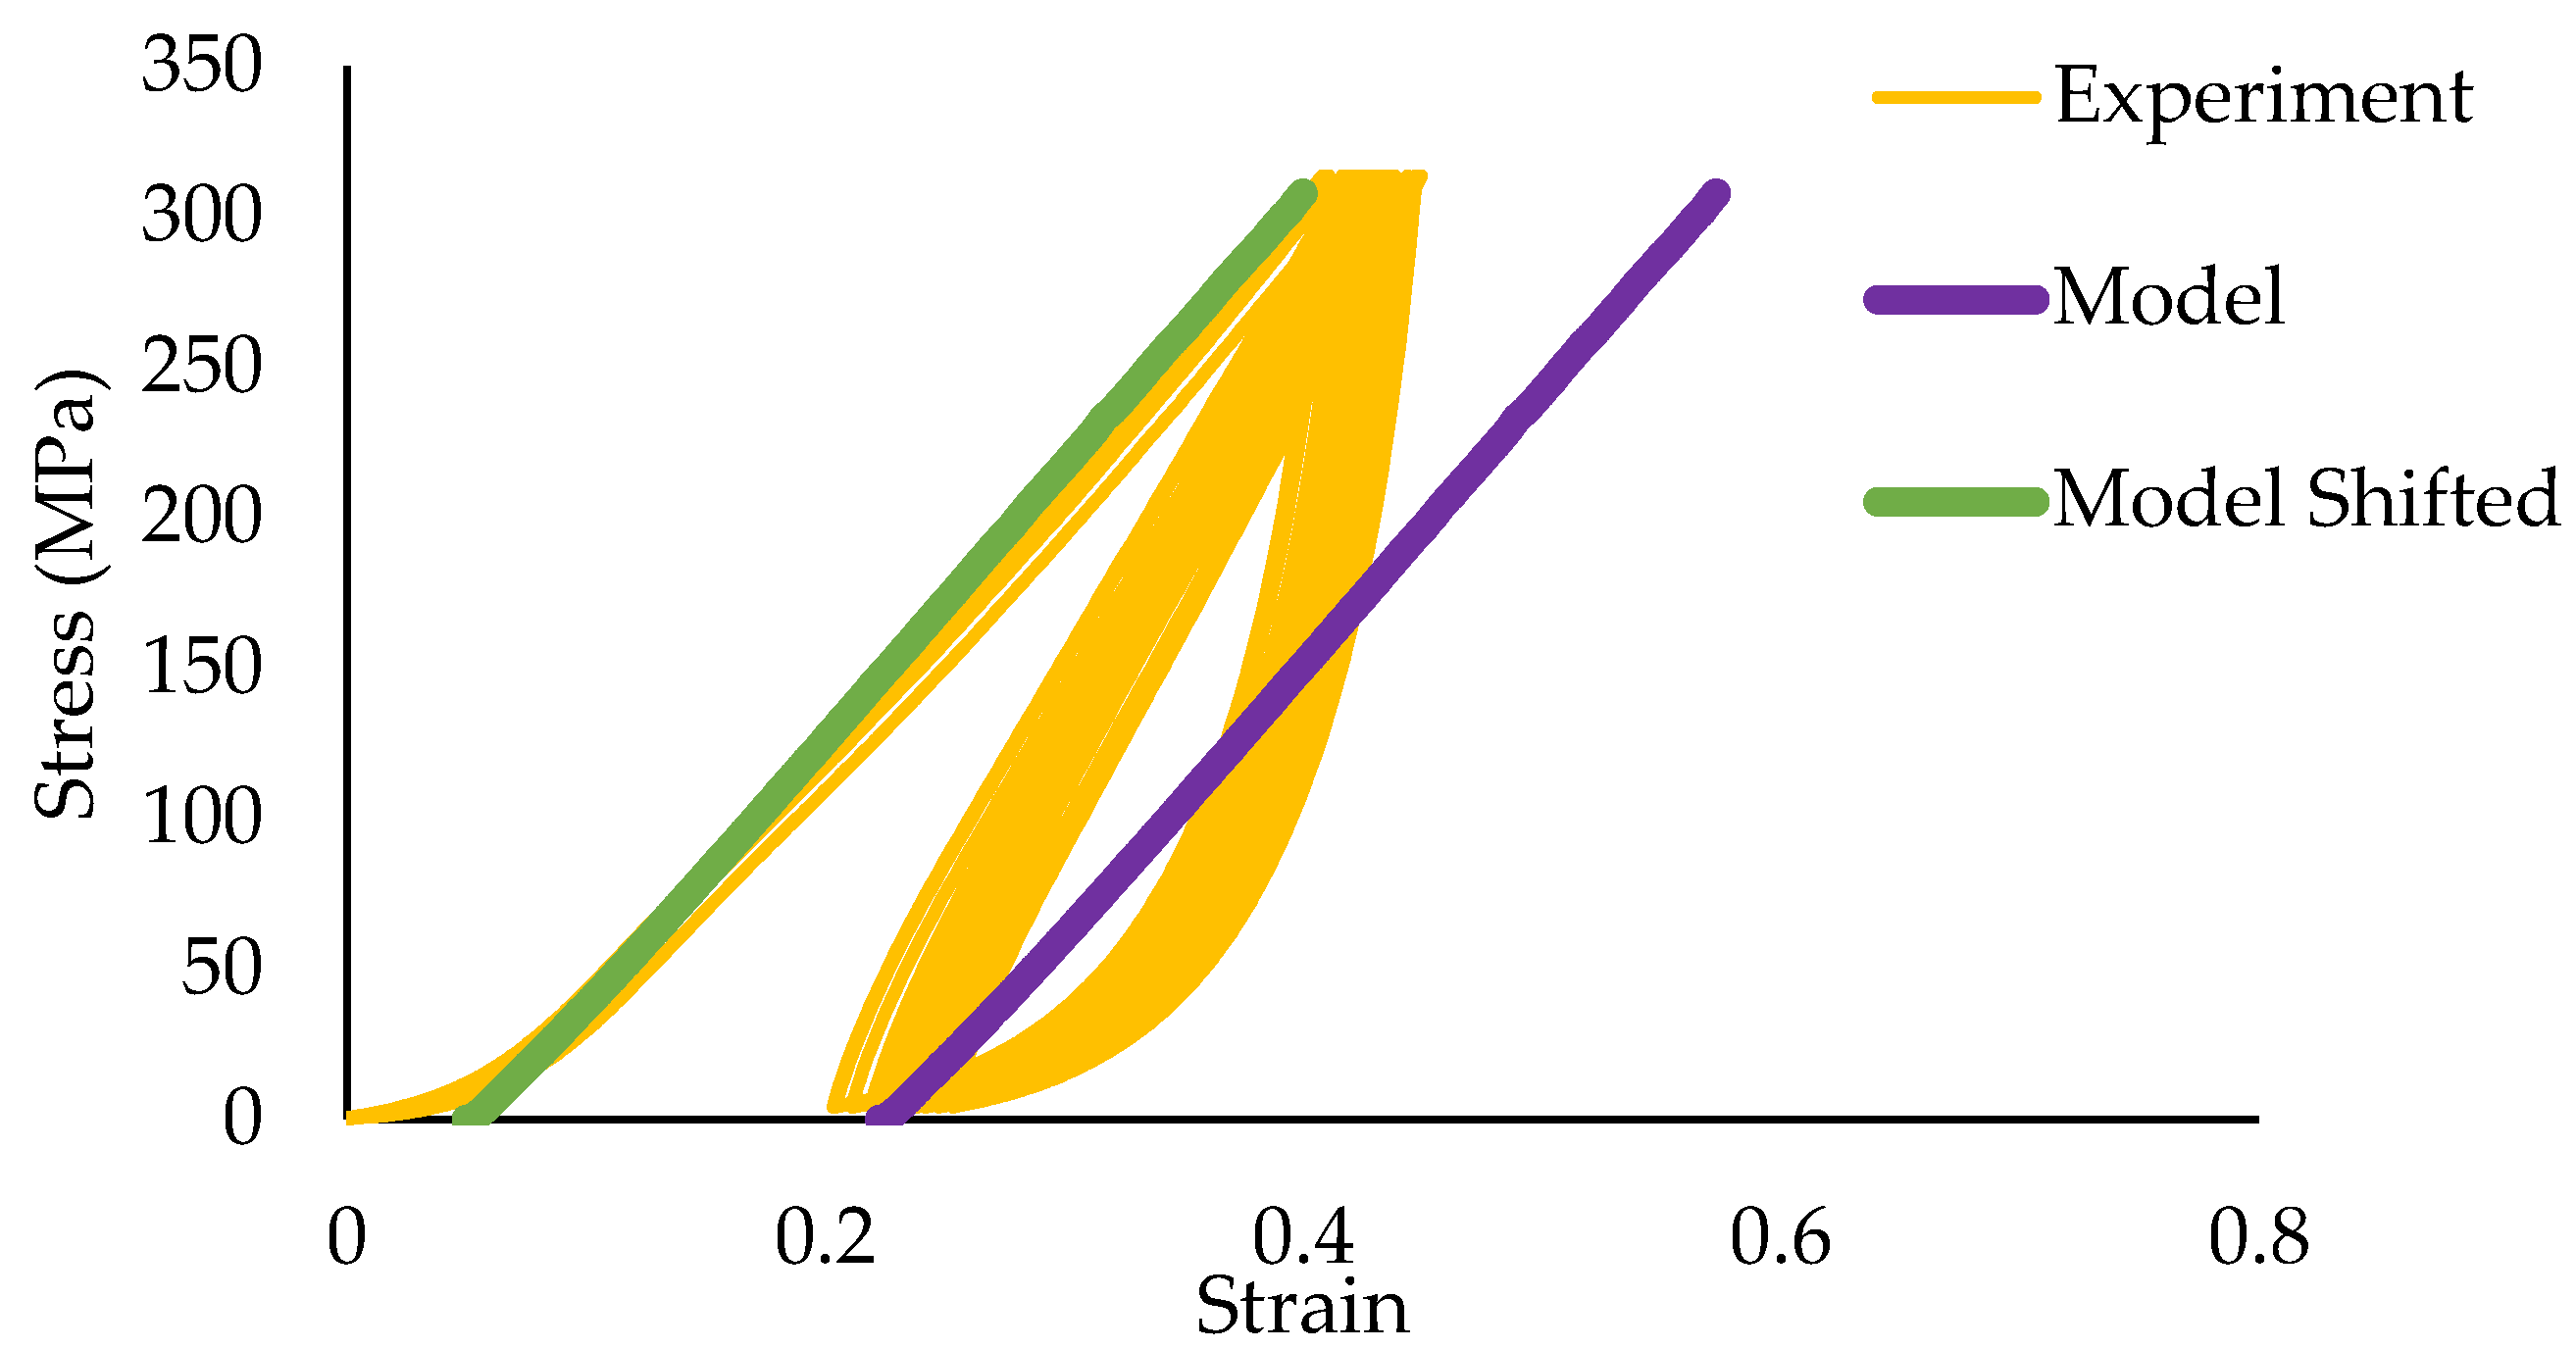
The material properties that were concluded for the single-tow finite element model were used for the 24 tows in the mesomechanical model of the braided cord. The model was compared to the last four loading cycles in Figure 11 (purple) and it was found that it did not correlate well with that part of the experiment. However, when the model is shifted to the left (green) in Figure 11 it can be seen that the slope of the stress–strain curve for the model is closer to the slope for the initial loading cycle of the experiment then it is for the second loading cycle. This lack of correlation in slopes between the model and the experiment was not unexpected considering that this model is not an exact replica of the braided cord. However, it is noted that while it does not correlate well with the slope of the last four loading cycles it does correlate well with the initial load-up (first cycle). It is possible that the model braid geometry is loose; therefore, the braid cannot lock (is not fully nested) and the tows can move around and therefore the model resembles the initial load up situation. As a result, no tow-to-tow contact forces were developed in the braid and there was minimal normal force between contacting tows. Thus, the effect of inter-tow friction on the macroscopic behavior of the braid could not be explicitly included in the model.
The lack of correlation of the model (which was built to be in the fully nested state) result with the fully nested configuration experimental curves was thought to be (1) that a tow behaves differently in a braided configuration from that of a single-tow pull and/or (2) that this model of the braided cord does not adequately capture all the different aspects of the tow-to-tow interactions. A parametric study was conducted to explore the possible sources for the lack of correlation.
3.4.2. Parametric Study
The first material property that was investigated in the parametric study was the threshold stress where E1 and G12 decrease from their initial values. A series of models were run to observe how changes in the threshold stress affected changes in the initial stiffness of the braided cord during loading. It was concluded that a threshold stress of 140 MPa was required to obtain a good correlation between the model and the experiment for the initial loading region. This 140 MPa for a tow in the braid compares to the 30 MPa for the single-tow pull test. This region of the braid stress–strain curve is denoted in Figure 10. This increase in the threshold stress from that of the single tow may be a consequence of friction between the tows in the braid and/or the initial stresses that result from the braiding process. Neither of these items was explicitly included in the model. It is also thought that the increase in the modulus could be due to the geometric complexities of the model (the geometry being too “loose” to model the fully nested configuration). This increase in the threshold stress improved the correlation as to when there was a drop in the slope, but there was still a discrepancy between the stress–strain curves for the model and the experiment with respect to the initial slope.
The next material property that was explored in the parametric study was E1 for the initial slope region of the braid. This modulus was increased from 4100 MPa to 12,000 MPa. Because the ν21 and ν12 stayed the same (0), the shear modulus G12 was adjusted to be half of E1, i.e., 6000 MPa. Again, it is believed that these adjustments had to be made to account for geometric complexities and friction that is not present in the model. The E2 and the G2 were concluded to remain the same as they were in the single-tow model at 5000 MPa and 1677.85 MPa, respectively.
The next step in the parametric study was to explore the material properties that were needed to capture the stress–strain response after the threshold stress of 140 MPa. The modulus E1 was concluded to be the same as with the single-tow tension tests (3200 MPa); however, G12 had to be increased to 42,000 MPa. This significant increase is interpreted to be a consequence of the state of constraint on the motion of the tows within the braid. The ability of the tows to move within the braid decreases as the tensile load increases, i.e., locks the tows into position, thereby leading to an increase in the shear behavior between the fibers in each tow because they are in a very compact state. This phenomenon can be considered a form of jamming. Jamming occurs when low stiffness elements such as fibers are subjected to a pressure gradient; the pressure increases the kinematic and frictional coupling of the elements altering the effective mechanical behavior [39]. Although the structure can be considered jammed, giving reasoning for the increase in the shear modulus, it is recognized that the value of the shear needed to achieve good correlation is relatively high for a bundle of fibers. It is hypothesized that this high value is numerically needed because when the fibers are jammed it is possible that they reach a state of incompressibility and the high number is needed to make the tows in the model incompressible. It is thought that this high value also accounts for not only the jamming that is occurring but also geometric complexities and the lack of friction present in the model. The E2 and the G2 had to increase as well to 100,000 MPa and 33,557.05 MPa, respectively. These increases further give evidence that the tows are being jammed and reaching a state of incompressibility. The compaction of the fibers increases within each tow resulting in the transverse stiffness increasing and likewise the transverse shear. The Poisson ratios were found to remain the same as they were with the single-tow model; ν2 = 0.49, ν21 = 0, ν12 = 0.
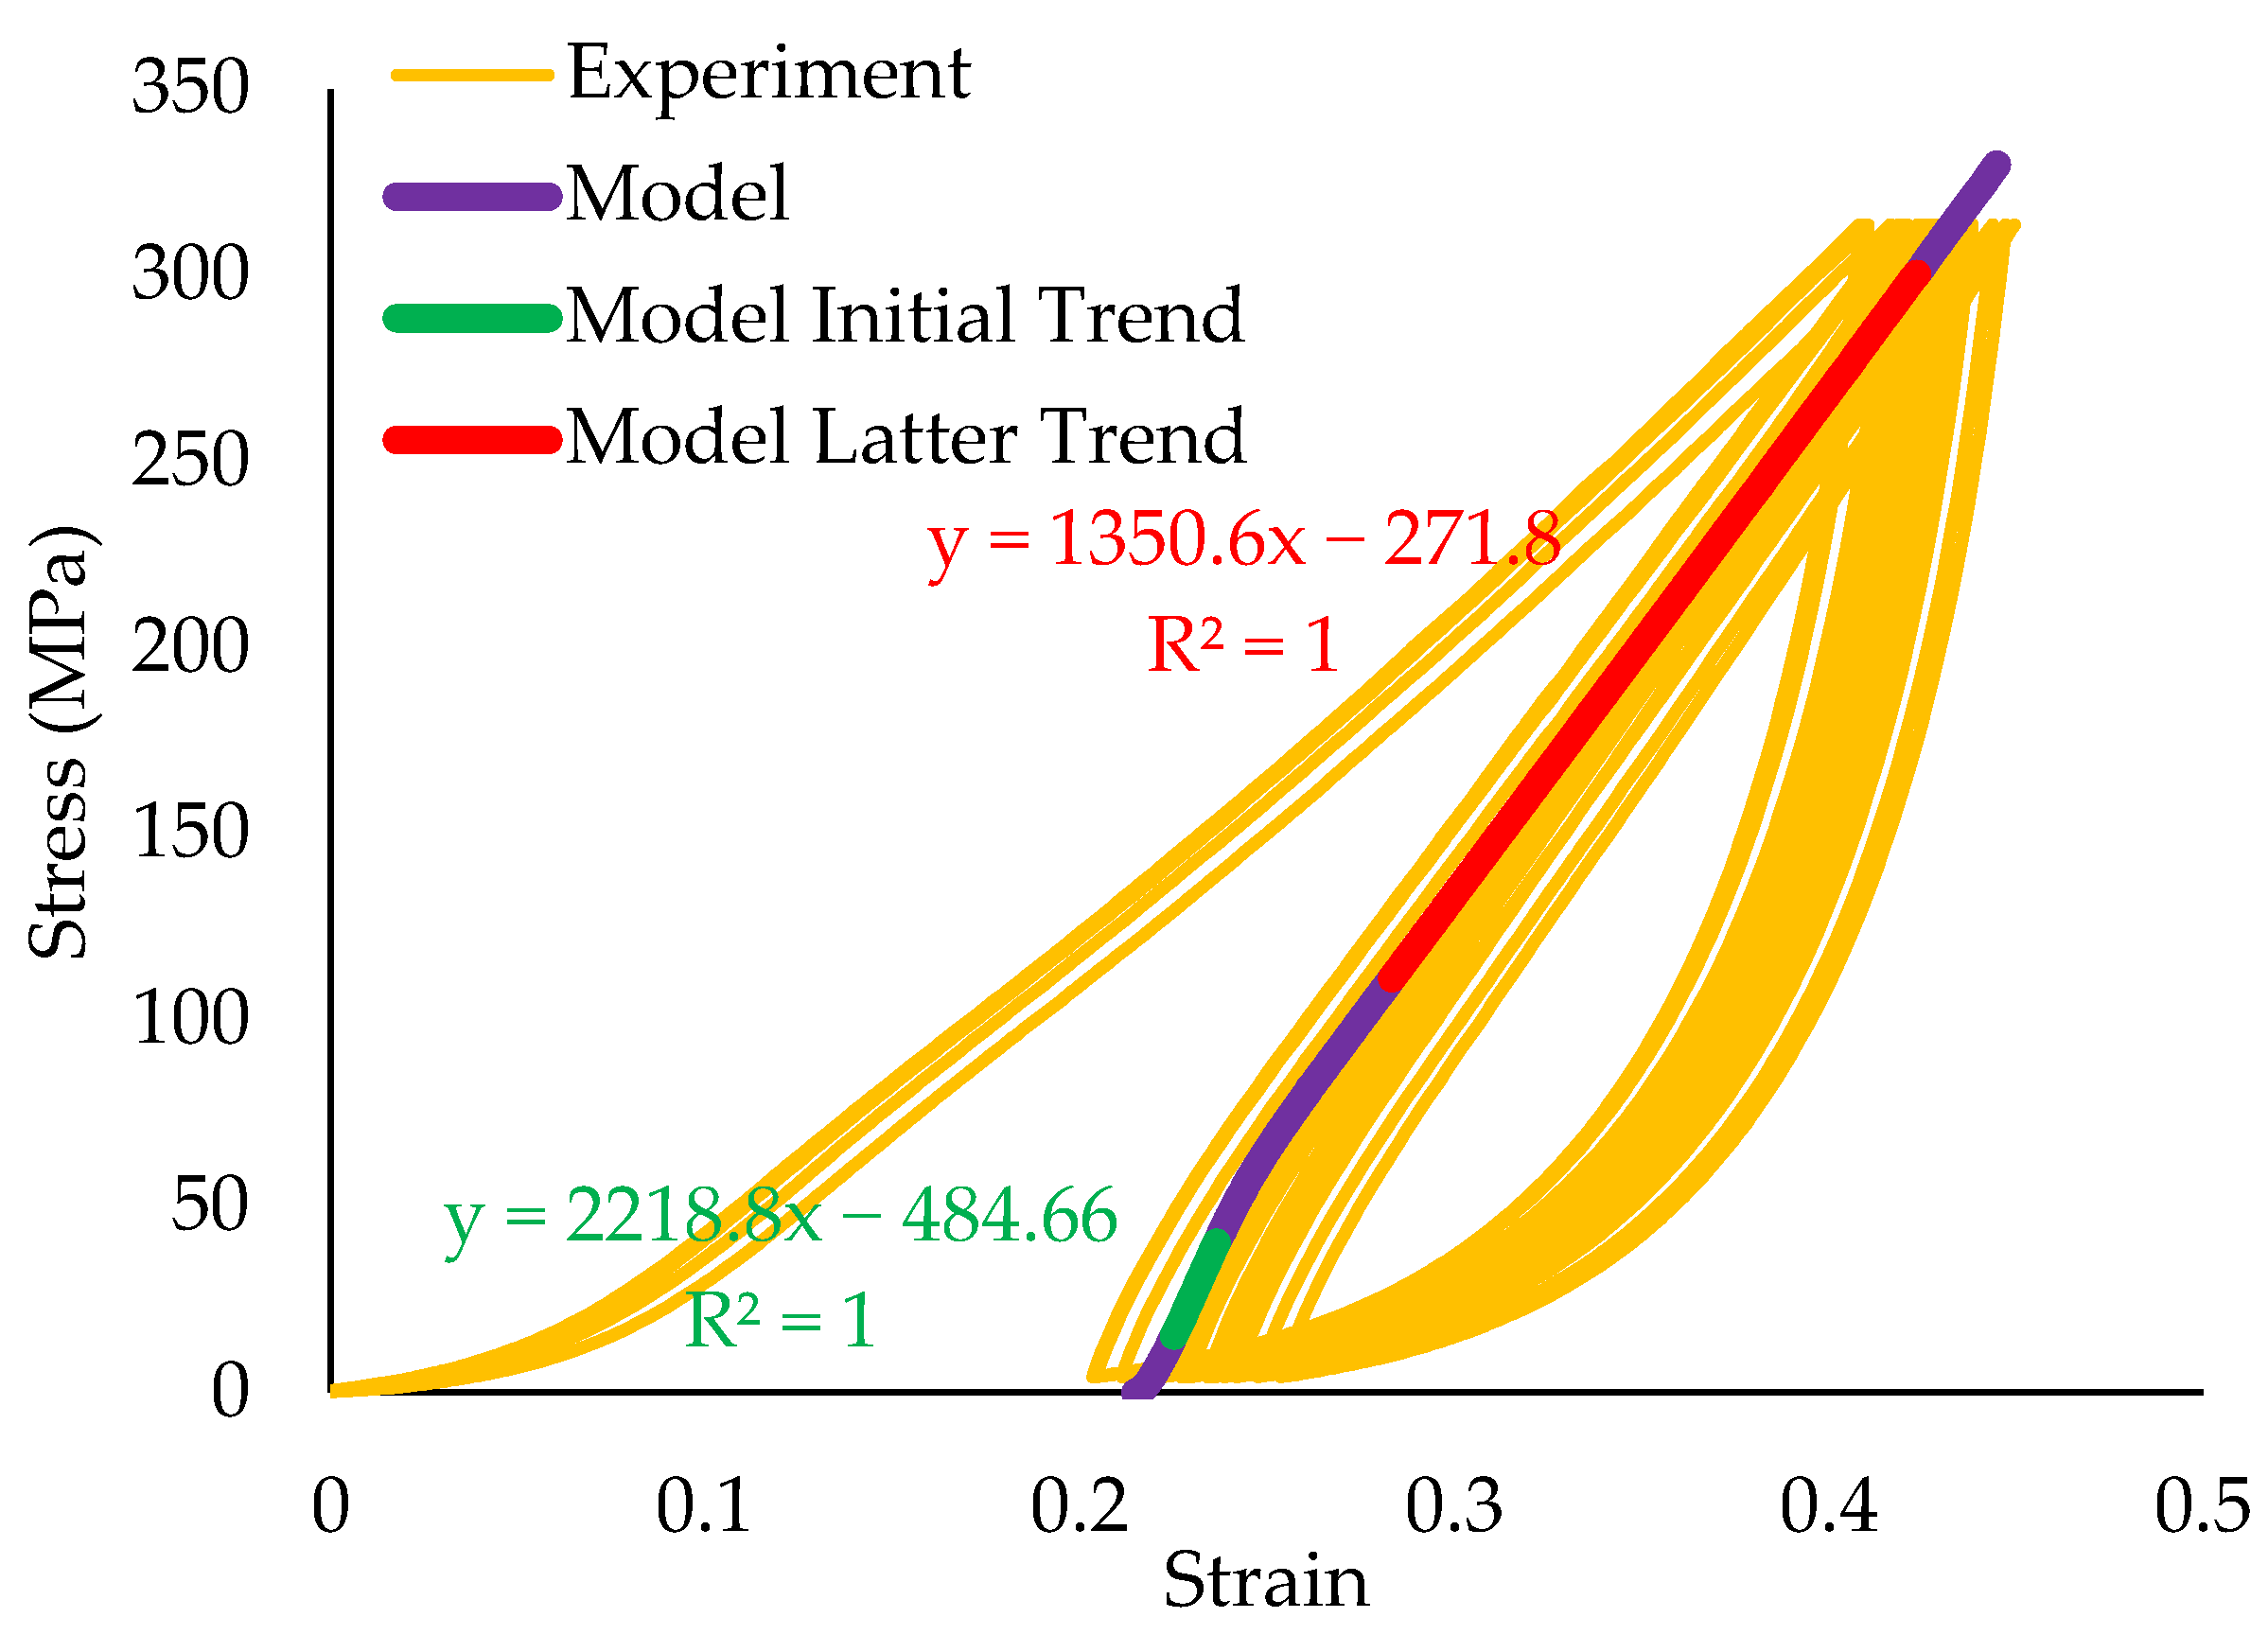
A summary of the material properties that were concluded from the parametric studies for the braided cord is provided in Table 4. Figure 12 shows that these properties result in good correlation between the model and the experimental stress–strain curves for the loading portion of a line that has been subjected to one loading and unloading cycle. The figure also highlights two distinct moduli captured by the braid model: an initial modulus of 2219 MPa and a subsequent modulus of 1350 MPa. These moduli were compared to experimental values of 2253 MPa and 1420 MPa, respectively. The 2% and 5% difference between the experimental and model moduli reinforces the good correlation. The modeling of the unloading section of the hysteresis loop was beyond the scope of the current study.
3.4.3. Sensitivity Study
Further sensitivity analyses were conducted on the refined model to assess the impact of each tuned material property of the tow on the overall behavior of the braided cord model. Each tuned property (Table 4) was individually doubled and halved, and the cord was subjected to tensile loading to observe the resulting changes in the stress–strain curve. This process generated 10 additional tensile models; two models with doubled and halved cut-off stresses, two with doubled and halved values of E1 and G12 before reaching the cut-off stress, two with doubled and halved values of E2 and G2 before reaching the cut-off stress, two with doubled and halved values of G12 after reaching the cut-off stress, and two with doubled and halved values of E2 and G2 after reaching the cut-off stress.
Figure 13 shows the effects of doubling and halving the cut-off stress parameter in the models and compares the results to experimental data. Altering this parameter has minimal impact on the slopes of the curves, but it does affect the stress level at the transition point (where the model and experiment shift from stiff to less stiff behavior). Looking at the experimental data, the transition point is estimated to be approximately 65 MPa. Doubling the cut-off stress from 140 to 280 MPa shifts the transition point of the model to around 100 MPa (Figure 13). Conversely, halving the cut-off stress from 140 to 70 MPa reduces the transition point of the model to around 30 MPa. This observation emphasizes the critical role of accurately determining the cut-off stress parameter in the model. Even slight changes in this parameter result in poor correlation with the experimental data and fail to accurately capture the behavior of the suspension line. It highlights the necessity for precise determination of this parameter to ensure reliable simulations that represent the suspension line’s behavior.
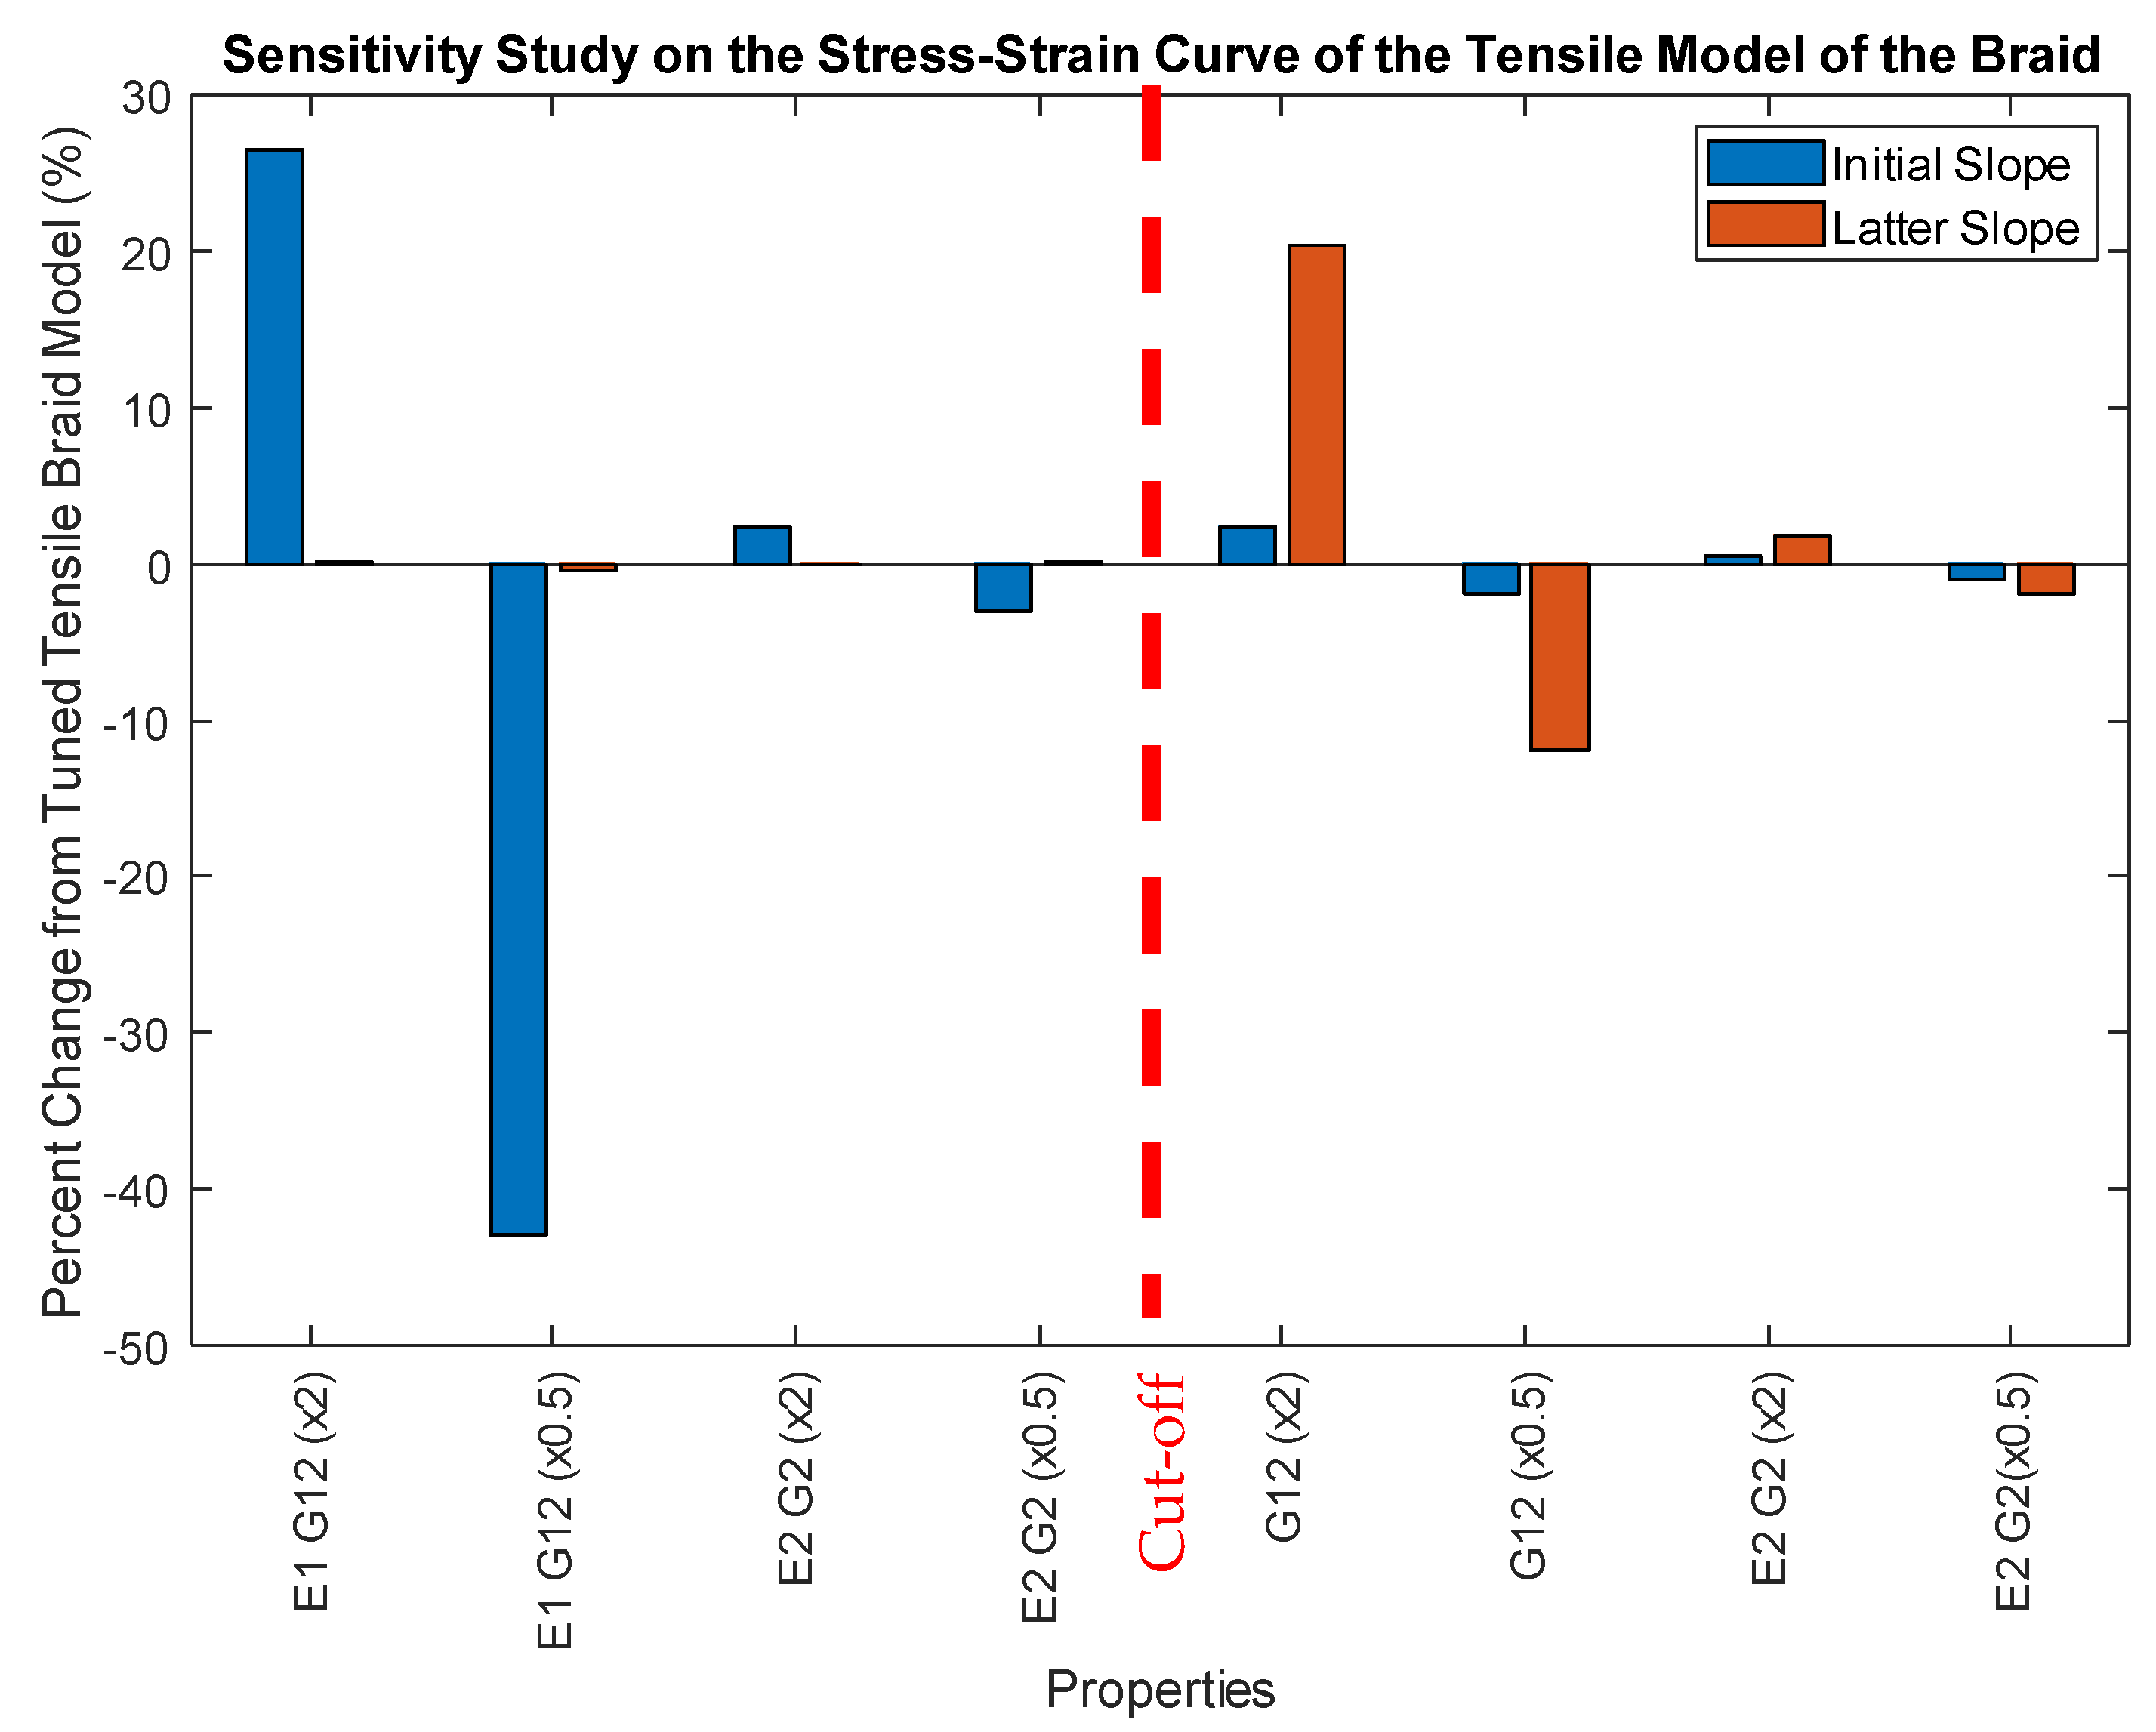
Figure 14 shows the effects of doubling and halving the properties that were tuned to match the experimental stress–strain tensile curve of the suspension line (Figure 12). The initial and latter slopes from each of the last eight models were calculated and the percent change of each was calculated based on the slopes that the tuned model produced (Figure 12).
The bar graph (Figure 14) demonstrates that doubling and halving the E1 and G12 before the cut-off stress of 140 MPa has the greatest effect on the initial slope and little to no effect on the latter slope. Doubling them increases the initial slope about 26%, while halving them decreases the initial slope about 43%. This highlights the substantial impact of these axial behaviors of the tow before the cutoff stress on the overall behavior of the braid. Accurate tuning of these properties is crucial for capturing the braid’s behavior effectively.
In contrast, doubling or halving E2 and G2 before the cutoff stress has minimal effect on both the initial and latter slopes of the model. This suggests that these properties are less sensitive compared to E1 and G12 before the cutoff stress, possibly due to the complexity of the braid geometry, particularly its loose structure, which minimizes the impact of transverse properties.
After the cut-off stress, the doubling and halving of the shear modulus (G12) has the largest impact on the latter slope as doubling increases the slope by about 20% and halving it decreases the slope about 10%. However, it has little to no effect on the initial slope. This underscores the importance of the shear modulus in the 1-2 direction of the tow after the cut-off stress as it greatly influences the overall behavior of the braid model. This makes sense as the jamming of the fibers of the tow contribute to increased shear behavior.
The E2 and G2 after the cut-off stress have a small effect on the latter slope but little to no effect on the initial slope, indicating a lower sensitivity to changes in these properties. However, further increases or decreases could potentially have a more significant impact on the braid because there is still a contact force between the tows that is contributing to the behavior of the braid.
This sensitivity study contributes to the understanding of the mesomechanical model of the braided suspension line by exploring how altering the material properties of individual tows impacts its overall behavior. Additionally, it offers insights into potential areas for model enhancement, including model geometry improvement and addressing friction-related factors. These findings guide improvements in simulations and enhance predictive capabilities for modeling parachute suspension line behavior under varying conditions.
3.5. Modeling of the Torsion Test
The mesomechanical model was next used to simulate the braided cord subject to four combinations of axial force and torsional displacement. These tension/torsion models used the same material properties for the individual tows that were ultimately concluded for the calibrated tension tests, i.e., Table 4. The value of GJ associated with each combination of tension/torsion loading was calculated using Equation (3), and these GJ values were compared to the values of the same tensions obtained from the experimental dynamic and static torsion tests.
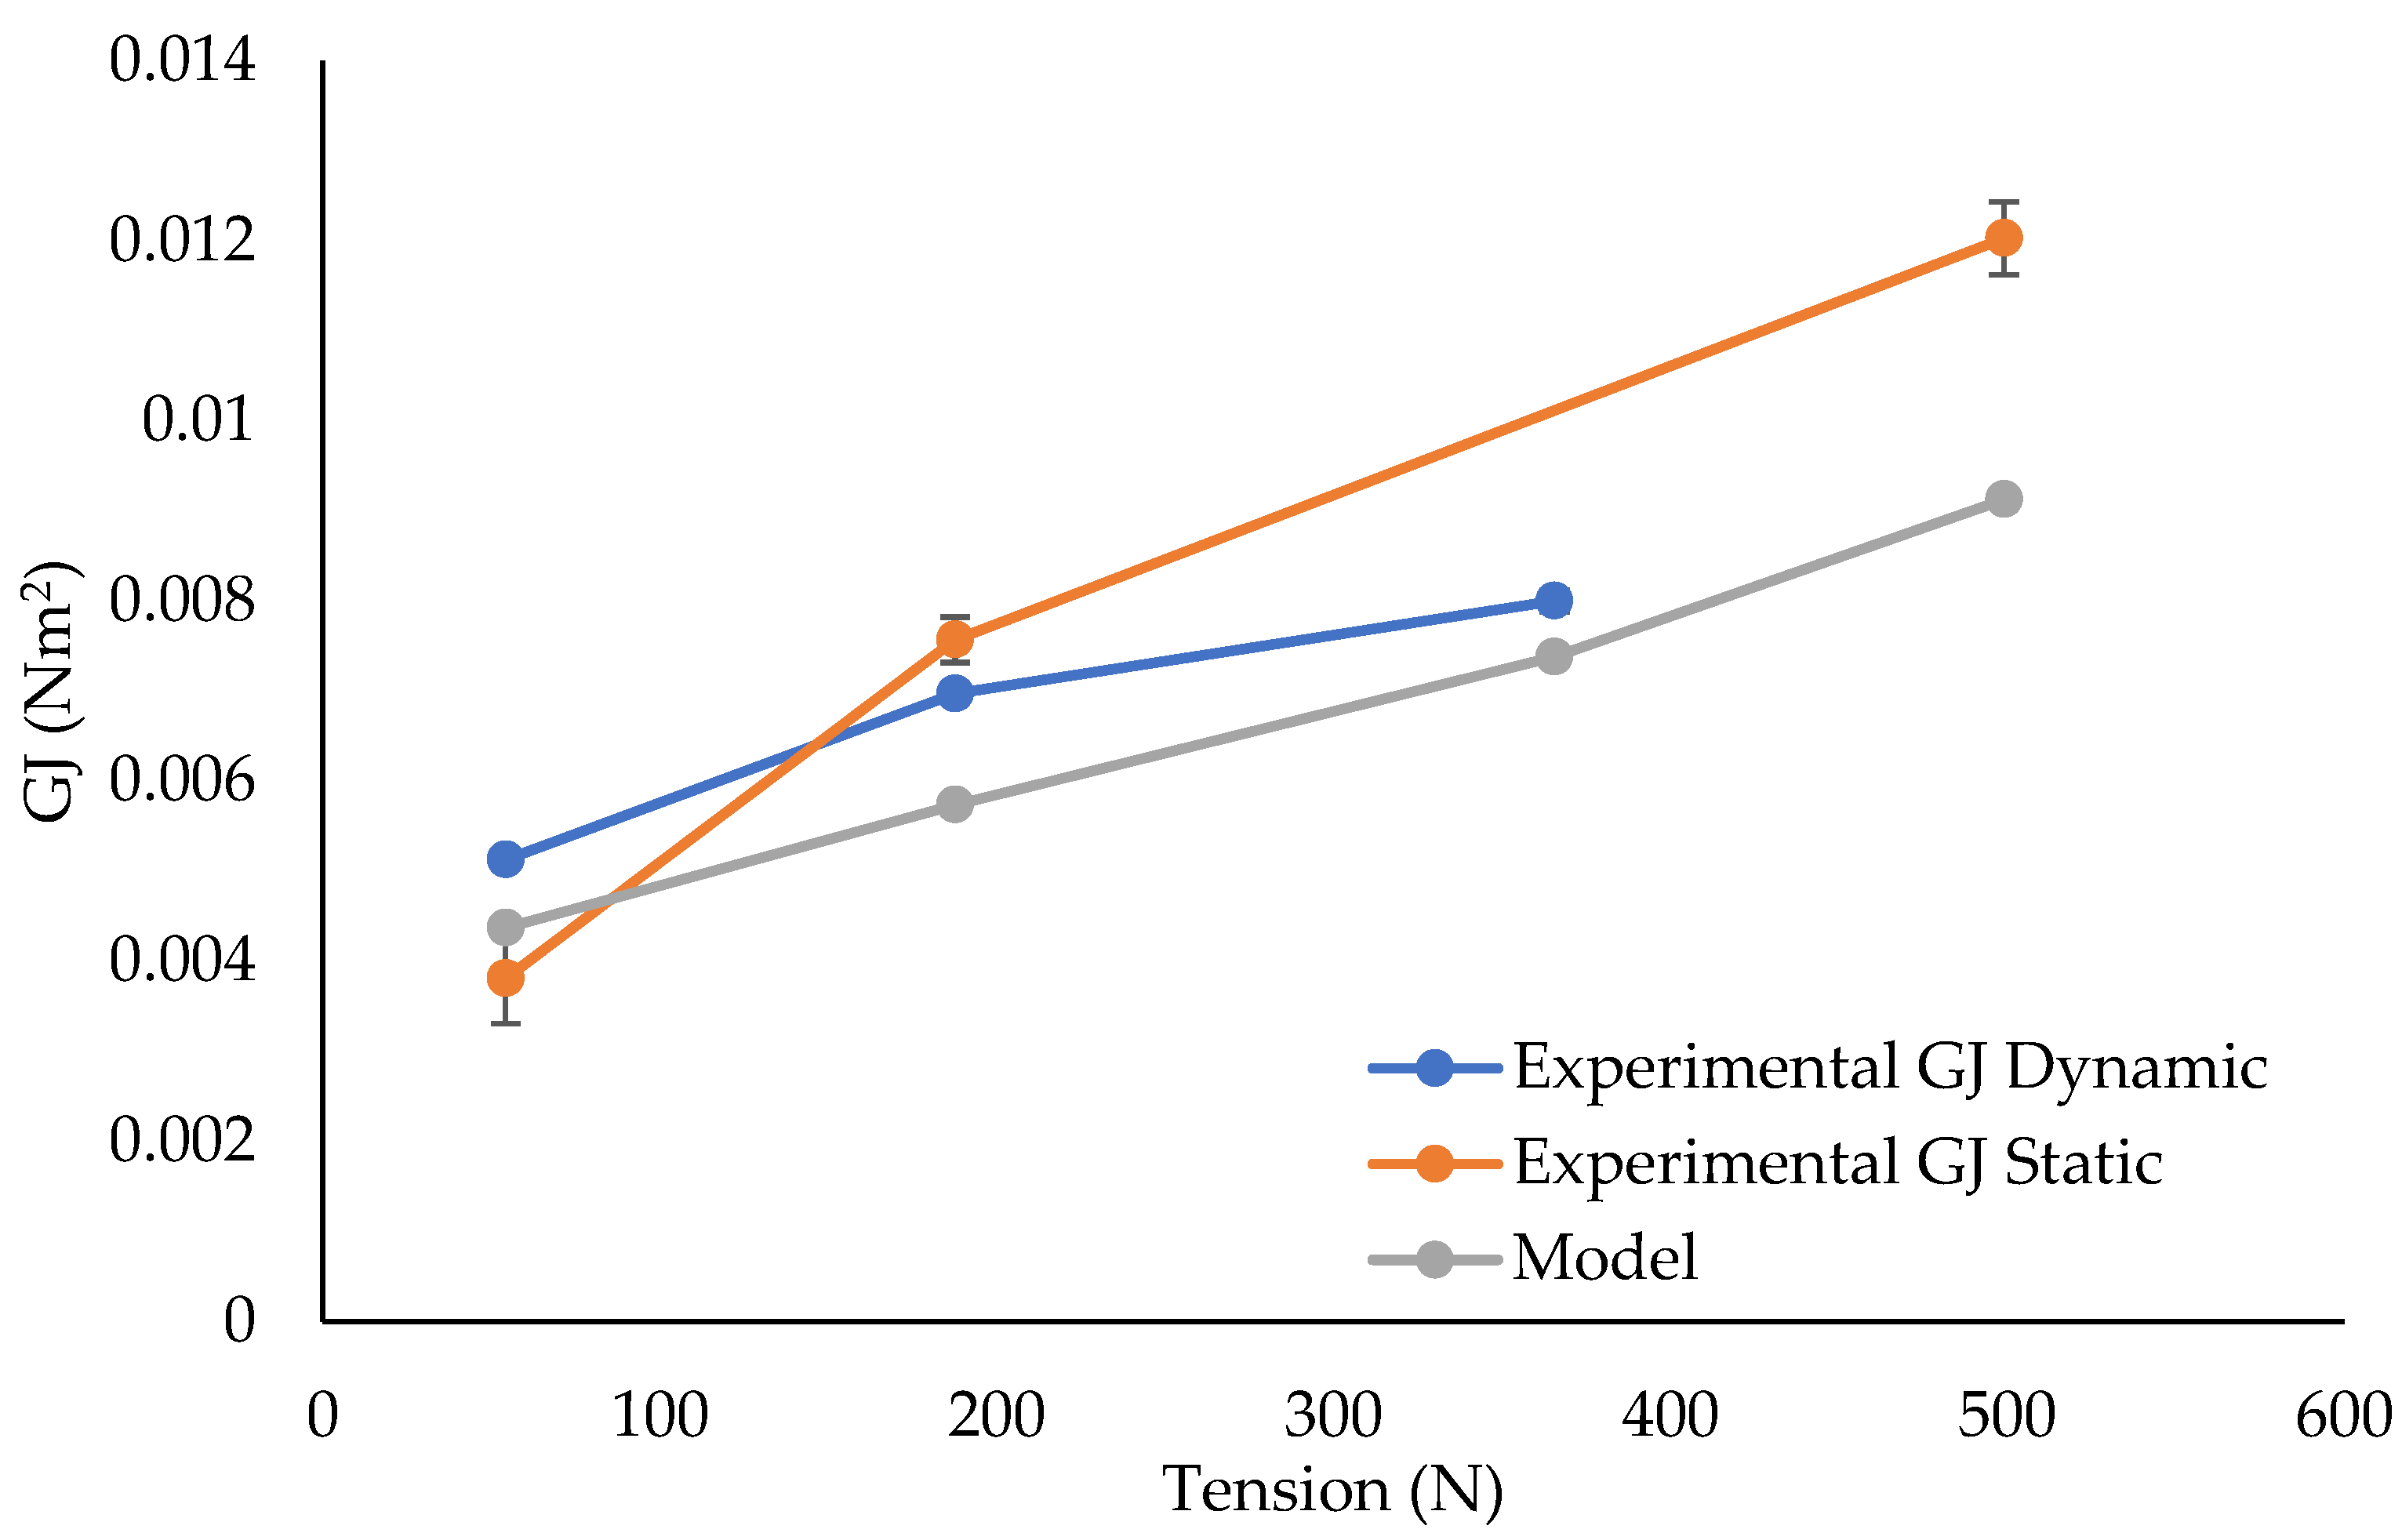
Figure 15 shows the comparison of the GJ values derived from the dynamic and static experimental torsion test data compared to the GJ values as calculated from the mesomechanical model. The three tensile loads for the dynamic experimental tests were 54, 188, and 366 N and the three tensile loads for the static experimental tests were 54, 188, and 500 N. The dynamic experimental results show the same rate of increase in GJ with increasing tension as in the model, and the model and experimental GJ values are fairly close to one another, ranging between differences of 8 and 19%. For the static test, the same rate of increase in GJ with tension is observed; however, there is a slightly larger difference in the values than with the dynamic tests (13–27% difference). Even though the difference is slightly larger, the trend is the same and the values are in the same order of magnitude.
The difference between the effective torsional stiffnesses as measured between the static and dynamic test methods may be either a consequence of the difference in the mechanical response of the line to dynamic and static conditions or it may be a consequence of the ability of the used techniques to measure the effectively small torsional stiffnesses. Irrespective of what differences may exist between the two testing approaches, the mesomechanical model is able to estimate the torsional stiffness in the same order of magnitude as the tests for a range of tensile loads that can occur for a suspension line in service.
4. Conclusions
A mesomechanical finite element model of a representative unit cell of the braided suspension line was created using VTMS and LS-DYNA® release 14. A user-defined material subroutine (UMAT) was implemented in LS-DYNA to capture the transversely isotropic material behavior of the tows in this braid. The UMAT was validated by showing good correlation of a model of a tensile test of a single tow with experimental data. The mesomechanical model of the full braid was pulled in tension, and it was found that the material properties developed for the single-tow model did not give a similarly good correlation between the model and the experimental data for the braid. A parametric study was conducted to tune the tow properties to achieve a good correlation between the mesomechanical model and experimental data for the braid. This change in effective material properties was interpreted to be a consequence of the restrained movement of the fibers in a braid as compared to the free movement of the fibers in a single-tow test. These updated properties were then used in a combined tension–torsion model of the suspension line, and that combined loading model showed good correlation with experimental data. The results of the modeling of this one suspension line show promise for the development of a virtual approach to characterize the tensile and torsional stiffnesses of a parachute suspension line design. These stiffnesses can then be used in numerical FSI studies to investigate how they can assist in mitigating the flow-induced vibration that is exhibited during descent.
Key Quantitative Results
Single-tow model validation: the model produced an initial modulus of ~4100 MPa, decreasing to ~3200 MPa after a transition stress of 30 MPa, closely aligning with single-tow experimental data.
Braid model validation: adjusted properties from the parametric study captured an initial modulus of 2219 MPa and a secondary modulus of 1350 MPa, closely matching experimental values of 2253 MPa and 1420 MPa (2% and 5% difference).
Torsional stiffness (GJ): the tuned tensile model, when subjected to combined tensile–torsion loading, showed 8–19% differences for dynamic tests and 13–27% differences for static tests compared to experimental results.
Author Contributions
Conceptualization, K.B. and J.A.S.; methodology, C.P.B., J.A.S., S.E.S., D.J.W., K.B., G.N. and C.C.; software, S.E.S., C.P.B. and J.A.S.; validation, C.P.B., J.A.S. and S.E.S.; formal analysis, C.P.B. and J.A.S.; investigation, C.P.B. and J.A.S.; resources, K.B.; data curation, C.P.B.; writing—original draft preparation, C.P.B.; writing—review and editing, J.A.S., S.E.S., D.J.W., K.B. and C.P.B.; visualization, C.P.B., J.A.S. and S.E.S.; supervision, J.A.S., K.B., S.E.S., D.J.W., G.N. and C.C.; project administration, J.A.S. and K.B.; funding acquisition, J.A.S. and K.B. All authors have read and agreed to the published version of the manuscript.
Funding
This research was funded by the U.S. Army Combat Capabilities Development Command Soldier Center, grant number W911QY-15-2-0002.
Data Availability Statement
The raw data supporting the conclusions of this article will be made available by the authors on request.
Acknowledgments
The authors thank Patrick Drane of the University of Massachusetts Lowell for his assistance and advice on the experimental testing of the single tow of the line. The authors also thank Matt Schey and George Barlow of the University of Massachusetts Lowell, Eric Zhou of the University of Dayton Research Institute, and David Mollenhauer of the U.S. Air Force Research Laboratory for their assistance and guidance on using the VTMS software. Lastly, the authors thank Kari White of the University of Massachusetts Lowell for her guidance and advice on LS-DYNA® release 14 FEA modeling.
Conflicts of Interest
The authors declare no conflicts of interest.
References
Lingard, S. Basic Analysis of Ram-Air Parachute. In Precision Aerial Delivery Systems: Modeling, Dynamics, and Control; Progress in Astronautics and Aeronautics; American Institute of Aeronautics and Astronautics, Inc.: Reston, VA, USA, 2015; pp. 73–125. [Google Scholar]
Omeroglu, S. The effect of braiding parameters on the mechanical properties of braided ropes. Fibres Text. East. Eur.2006, 14, 53–57. [Google Scholar]
Raoof, M.; Davies, T. Determination of the bending stiffness for a spiral strand. J. Strain Anal. Eng. Des.2004, 39, 1–13. [Google Scholar] [CrossRef]
Hussain, N.; Baharom, M.B. Analysis of optimum wire rope configuration for equal unidirectional torsional stiffness for flexible steering shaft. In MATEC Web of Conferences; EDP Sciences: Les Ulis, France, 2016; Volume 74, p. 00017. [Google Scholar]
Shi, J.; Qin, T.; Zhou, J.; Zhao, H.; Wang, H.; Fu, J.; Jin, L. Interlaminar shear behavior of basalt fiber-reinforced polymer tendons subjected to a combined effect of prestress, grout and seawater. Constr. Build. Mater.2025, 462, 139982. [Google Scholar]
Goldberg, R.K.; Blinzler, B.J.; Binienda, W.K. Modification of a Macromechanical Finite Element–Based Model for Impact Analysis of Triaxially Braided Composites. J. Aerosp. Eng.2011, 25, 383–394. [Google Scholar]
King, M.J.; Jearanaisilawong, P.; Socrate, S. A continuum constitutive model for the mechanical behavior of woven fabrics. Int. J. Solids Struct.2005, 42, 3867–3896. [Google Scholar] [CrossRef]
Peng, X.; Cao, J. A continuum mechanics-based non-orthogonal constitutive model for woven composite fabrics. Compos. Part A Appl. Sci. Manuf.2005, 36, 859–874. [Google Scholar]
Shahkarami, A.; Vaziri, R. A continuum shell finite element model for impact simulation of woven fabrics. Int. J. Impact Eng.2007, 34, 104–119. [Google Scholar] [CrossRef]
Xue, P.; Peng, X.; Cao, J. A non-orthogonal constitutive model for characterizing woven composites. Compos. Part A Appl. Sci. Manuf.2003, 34, 183–193. [Google Scholar]
Yu, W.R.; Pourboghrat, F.; Chung, K.; Zampaloni, M.; Kang, T.J. Non-orthogonal constitutive equation for woven fabric reinforced thermoplastic composites. Compos. Part A Appl. Sci. Manuf.2002, 33, 1095–1105. [Google Scholar] [CrossRef]
Zhang, C.; Curiel-Sosa, J.L.; Bui, T.Q. Meso-scale progressive damage modeling and life prediction of 3D braided composites under fatigue tension loading. Compos. Struct.2018, 201, 62–71. [Google Scholar] [CrossRef]
Zhang, C.; Binienda, W.K.; Goldberg, R.K.; Kohlman, L.W. Meso-scale failure modeling of single layer triaxial braided composite using finite element method. Compos. Part A Appl. Sci. Manuf.2014, 58, 36–46. [Google Scholar] [CrossRef]
Wu, L.; Gu, B. Fatigue behaviors of four-step three-dimensional braided composite material: A meso-scale approach computation. Text. Res. J.2014, 84, 1915–1930. [Google Scholar] [CrossRef]
Tabatabaei, S.A.; Lomov, S.V. Eliminating the volume redundancy of embedded elements and yarn interpenetrations in meso-finite element modelling of textile composites. Comput. Struct.2015, 152, 142–154. [Google Scholar] [CrossRef]
Nguyen, Q.T.; Vidal-Sallé, E.; Boisse, P.; Park, C.H.; Saouab, A.; Bréard, J.; Hivet, G. Mesoscopic scale analyses of textile composite reinforcement compaction. Compos. Part B Eng.2013, 44, 231–241. [Google Scholar] [CrossRef]
Lomov, S.V.; Ivanov, D.S.; Verpoest, I.; Zako, M.; Kurashiki, T.; Nakai, H.; Hirosawa, S. Meso-FE modelling of textile composites: Road map, data flow and algorithms. Compos. Sci. Technol.2007, 67, 1870–1891. [Google Scholar] [CrossRef]
Lomov, S.V.; Gusakov, A.V.; Huysmans, G.; Prodromou, A.; Verpoest, I. Textile geometry preprocessor for meso-mechanical models of woven composites. Compos. Sci. Technol.2000, 60, 2083–2095. [Google Scholar] [CrossRef]
Li, D.-S.; Fang, D.-N.; Jiang, N.; Xuefeng, Y. Finite element modeling of mechanical properties of 3D five-directional rectangular braided composites. Compos. Part B Eng.2011, 42, 1373–1385. [Google Scholar] [CrossRef]
Grail, G.; Hirsekorn, M.; Wendling, A.; Hivet, G.; Hambli, R. Consistent Finite Element mesh generation for meso-scale modeling of textile composites with preformed and compacted reinforcements. Compos. Part A Appl. Sci. Manuf.2013, 55, 143–151. [Google Scholar] [CrossRef]
Doitrand, A.; Fagiano, C.; Irisarri, F.X.; Hirsekorn, M. Comparison between voxel and consistent meso-scale models of woven composites. Compos. Part A Appl. Sci. Manuf.2015, 73, 143–154. [Google Scholar] [CrossRef]
Badel, P.; Vidal-Sallé, E.; Maire, E.; Boisse, P. Simulation and tomography analysis of textile composite reinforcement deformation at the mesoscopic scale. Compos. Sci. Technol.2008, 68, 2433–2440. [Google Scholar] [CrossRef]
Durville, D. Simulation of the mechanical behaviour of woven fabrics at the scale of fibers. Int. J. Mater. Form.2010, 3, 1241–1251. [Google Scholar] [CrossRef]
Grujicic, M.; Hariharan, A.; Pandurangan, B.; Yen, C.F.; Cheeseman, B.A.; Wang, Y.; Miao, Y.; Zheng, J.Q. Fiber-Level Modeling of Dynamic Strength of Kevlar® KM2 Ballistic Fabric. J. Mater. Eng. Perform.2012, 21, 1107–1119. [Google Scholar] [CrossRef]
Zhou, G.; Sun, X.; Wang, Y. Multi-chain digital element analysis in textile mechanics. Compos. Sci. Technol.2004, 64, 239–244. [Google Scholar] [CrossRef]
Xiang, L.; Wang, H.Y.; Chen, Y.; Guan, Y.J.; Wang, Y.L.; Dai, L.H. Modeling of multi-strand wire ropes subjected to axial tension and torsion loads. Int. J. Solids Struct.2015, 58, 233–246. [Google Scholar] [CrossRef]
Zhang, D.; Ostoja-Starzewski, M. Finite Element Solutions to the Bending Stiffness of a Single-Layered Helically Wound Cable With Internal Friction. J. Appl. Mech.2015, 83, 031003. [Google Scholar] [CrossRef]
Ghoreishi, S.R.; Cartraud, P.; Davies, P.; Messager, T. Analytical modeling of synthetic fiber ropes subjected to axial loads. Part I: A new continuum model for multilayered fibrous structures. Int. J. Solids Struct.2007, 44, 2924–2942. [Google Scholar] [CrossRef]
Vu, T.D.; Durville, D.; Davies, P. Finite element simulation of the mechanical behavior of synthetic braided ropes and validation on a tensile test. Int. J. Solids Struct.2015, 58, 106–116. [Google Scholar] [CrossRef]
Stanova, E.; Fedorko, G.; Fabian, M.; Kmet, S. Computer modelling of wire strands and ropes part II: Finite element-based applications. Adv. Eng. Softw.2011, 42, 322–331. [Google Scholar] [CrossRef]
Nawrocki, A.; Labrosse, M. A finite element model for simple straight wire rope strands. Comput. Struct.2000, 77, 345–359. [Google Scholar] [CrossRef]
Li, Z.; Shang, Z.; Zappa, E.; Van Langenhove, L.; Malengier, B. Yarn level finite element method simulation for bending over sheaves of braided ropes. J. Ind. Text.2023, 53, 15280837231189891. [Google Scholar]
Ding, X.; Liu, J.; Ju, A.; Sun, Y.; Chen, L. Fiber-level FE simulation of the braiding process for geometry prediction of braided ropes. Int. J. Solids Struct.2024, 301, 112937. [Google Scholar]
PIA-C-2754C; Cord, Polyester, Coreless. Parachute Industry Association: Gold Canyon, AZ, USA, 2011.
Schneider, C.A.; Rasband, W.S.; Eliceiri, K.W. NIH Image to ImageJ: 25 years of image analysis. Nat. Methods2012, 9, 671–675. [Google Scholar] [PubMed]
Barry, C.P.; Olson, B.G.; Willis, D.J.; Bergeron, K.; Charrette, C.; Noetscher, G.M.; Amirkhizi, A.; Sherwood, J.A. The experimental characterization of the torsional and transverse stiffnesses of a braided parachute suspension line. J. Eng. Fibers Fabr.2024, 19, 15589250241291167. [Google Scholar]
Figure 1.
Suspension line: (a) front view, (b) side view, and (c) cross-section (rounded rectangle) of the suspension line (CT scan image by Aya Takase from Rigaku Corporation).
Figure 1.
Suspension line: (a) front view, (b) side view, and (c) cross-section (rounded rectangle) of the suspension line (CT scan image by Aya Takase from Rigaku Corporation).
Figure 2.
Suspension line manufacturing: (a) braiding of the 24 tows and (b) subsequent flattening between two rollers before being wound onto a spool.
Figure 2.
Suspension line manufacturing: (a) braiding of the 24 tows and (b) subsequent flattening between two rollers before being wound onto a spool.
Figure 3.
Dacron tow clamped into tensile testing machine.
Figure 3.
Dacron tow clamped into tensile testing machine.
Figure 4.
Close-up view of Dacron braid used to measure braid angle (highlighted in red).
Figure 4.
Close-up view of Dacron braid used to measure braid angle (highlighted in red).
Figure 5.
Braid geometry creation process.
Figure 5.
Braid geometry creation process.
Figure 6.
Meshed braid geometry and cross-section adjustment: (a) isometric view of meshed geometry from VTMS, (b) top view of meshed geometry from VTMS, (c) top view of scaled cross-section, and (d) CT scan of cross-section of suspension line for comparison.
Figure 6.
Meshed braid geometry and cross-section adjustment: (a) isometric view of meshed geometry from VTMS, (b) top view of meshed geometry from VTMS, (c) top view of scaled cross-section, and (d) CT scan of cross-section of suspension line for comparison.
Figure 7.
Braid meso-scale model details, loading and boundary conditions. (a) Prescribing the local material directions for each element in a tow (red arrows signify the 1-direction (axial direction), green arrows signify the 2 or 3 direction). (b) Boundary conditions of the model to represent experimental tension tests. (c) Boundary conditions of the combined tension torsion model.
Figure 8.
Average stress–strain plot of single-tow tension tests (five tests with one standard deviation indicated). Initial and latter slopes are indicated on the plot.
Figure 8.
Average stress–strain plot of single-tow tension tests (five tests with one standard deviation indicated). Initial and latter slopes are indicated on the plot.
Figure 9.
Single cylindrical tow model tensile stress–strain data compared with experimental single-tow tensile stress–strain data.
Figure 9.
Single cylindrical tow model tensile stress–strain data compared with experimental single-tow tensile stress–strain data.
Figure 10.
Experimental stress vs. strain response of the 24-tow Dacron braid with the initial load-up (red) and the bilinear behavior of the subsequent four cycles of the nested braid configuration (green and purple) [38]. The red box with the green line denotes the initial loading stiffness.
Figure 10.
Experimental stress vs. strain response of the 24-tow Dacron braid with the initial load-up (red) and the bilinear behavior of the subsequent four cycles of the nested braid configuration (green and purple) [38]. The red box with the green line denotes the initial loading stiffness.
Figure 11.
Full braid tensile model with single-tow material properties compared with the initial loading (green) and the subsequent four loading cycles (purple).
Figure 11.
Full braid tensile model with single-tow material properties compared with the initial loading (green) and the subsequent four loading cycles (purple).
Figure 12.
Stress vs. strain of mesomechanical model of braid compared with experimental tensile stress vs. strain.
Figure 12.
Stress vs. strain of mesomechanical model of braid compared with experimental tensile stress vs. strain.
Figure 13.
Stress vs. strain of experimental data compared with the model with a cut-off stress of 280 (purple) and a model with cut-off stress of 70 (blue).
Figure 13.
Stress vs. strain of experimental data compared with the model with a cut-off stress of 280 (purple) and a model with cut-off stress of 70 (blue).
Figure 14.
Percent change of the two slopes (initial and latter) from the stress strain curve of the braid model with the tuned properties when doubling and halving those tuned properties.
Figure 14.
Percent change of the two slopes (initial and latter) from the stress strain curve of the braid model with the tuned properties when doubling and halving those tuned properties.
Figure 15.
GJ vs. tension; mesomechanical model data compared with dynamic and static experimental torsion test data.
Figure 15.
GJ vs. tension; mesomechanical model data compared with dynamic and static experimental torsion test data.
Table 1.
Specifications of the Dacron suspension line.
Table 1.
Specifications of the Dacron suspension line.
Characteristic
PIA C 2754 Type II
Description
Number of carriers
24
Number of spools (bobbins) feeding yarn into the braid
Ends per carrier
3
Each carrier holds a bobbin with 3 single-ply yarns that are plied together before braiding
Total ends
72
The total number of individual yarns in the braid (24 carriers × 3 yarns per carrier)
Basic yarn denier
1100
Mass per unit length of a single yarn (grams per 9000 m)
Yarn ply
Single
Each individual yarn is a single strand before being plied together at the bobbin stage
Picks per inch
10–12
Number of braid crossovers per inch
Length per pound, feet (minimum)
120
Feet of braid produced per pound
Breaking strength, pounds (minimum)
1000
Minimum force required to break the suspension line.
Elongation percent (at 75% of the specified breaking strength)
Minimum
7
Stretching percentage when loaded to 75% of its breaking strength.
Maximum
11
Table 2.
Measured braid parameters of a Dacron suspension line.
Table 2.
Measured braid parameters of a Dacron suspension line.
Braid Parameter
Value
Tow Diameter
1.57 ± 0.12 mm
Braid Angle
56.14 ± 5.48°
Braid Diameter
5.58 mm
Table 3.
Summary of material properties used with the single-tow model.
Table 3.
Summary of material properties used with the single-tow model.
σ < 30 MPa
σ > 30 MPa
All σ
E1 (MPa)
4100
E1 (MPa)
3200
ν2
0.49
G12 (MPa)
2050
G12 (MPa)
1600
ν21
0
E2 (MPa)
5000
E2 (MPa)
5000
ν12
0
G2 (MPa)
1678
G2 (MPa)
1678
Table 4.
Summary of tuned properties used for the full braid meso-model.
Table 4.
Summary of tuned properties used for the full braid meso-model.
σ < 140 MPa
σ > 140 MPa
All σ
E1 (MPa)
12,000
E1 (MPa)
3200
ν2
0.49
G12 (MPa)
6000
G12 (MPa)
42,000
ν21
0
E2 (MPa)
5000
E2 (MPa)
100,000
ν12
0
G2 (MPa)
1678
G2 (MPa)
33,557
Disclaimer/Publisher’s Note: The statements, opinions and data contained in all publications are solely those of the individual author(s) and contributor(s) and not of MDPI and/or the editor(s). MDPI and/or the editor(s) disclaim responsibility for any injury to people or property resulting from any ideas, methods, instructions or products referred to in the content.
Barry, C.P.; Bergeron, K.; Stapleton, S.E.; Willis, D.J.; Noetscher, G.; Charrette, C.; Sherwood, J.A.
The Investigation of the Mechanical Behavior of a Braided Parachute Suspension Line Using a Mesomechanical Finite Element Model. Textiles2025, 5, 10.
https://doi.org/10.3390/textiles5020010
AMA Style
Barry CP, Bergeron K, Stapleton SE, Willis DJ, Noetscher G, Charrette C, Sherwood JA.
The Investigation of the Mechanical Behavior of a Braided Parachute Suspension Line Using a Mesomechanical Finite Element Model. Textiles. 2025; 5(2):10.
https://doi.org/10.3390/textiles5020010
Chicago/Turabian Style
Barry, Catherine P., Keith Bergeron, Scott E. Stapleton, David J. Willis, Gregory Noetscher, Christine Charrette, and James A. Sherwood.
2025. "The Investigation of the Mechanical Behavior of a Braided Parachute Suspension Line Using a Mesomechanical Finite Element Model" Textiles 5, no. 2: 10.
https://doi.org/10.3390/textiles5020010
APA Style
Barry, C. P., Bergeron, K., Stapleton, S. E., Willis, D. J., Noetscher, G., Charrette, C., & Sherwood, J. A.
(2025). The Investigation of the Mechanical Behavior of a Braided Parachute Suspension Line Using a Mesomechanical Finite Element Model. Textiles, 5(2), 10.
https://doi.org/10.3390/textiles5020010
Article Metrics
No
No
Article Access Statistics
For more information on the journal statistics, click here.
Multiple requests from the same IP address are counted as one view.
Barry, C.P.; Bergeron, K.; Stapleton, S.E.; Willis, D.J.; Noetscher, G.; Charrette, C.; Sherwood, J.A.
The Investigation of the Mechanical Behavior of a Braided Parachute Suspension Line Using a Mesomechanical Finite Element Model. Textiles2025, 5, 10.
https://doi.org/10.3390/textiles5020010
AMA Style
Barry CP, Bergeron K, Stapleton SE, Willis DJ, Noetscher G, Charrette C, Sherwood JA.
The Investigation of the Mechanical Behavior of a Braided Parachute Suspension Line Using a Mesomechanical Finite Element Model. Textiles. 2025; 5(2):10.
https://doi.org/10.3390/textiles5020010
Chicago/Turabian Style
Barry, Catherine P., Keith Bergeron, Scott E. Stapleton, David J. Willis, Gregory Noetscher, Christine Charrette, and James A. Sherwood.
2025. "The Investigation of the Mechanical Behavior of a Braided Parachute Suspension Line Using a Mesomechanical Finite Element Model" Textiles 5, no. 2: 10.
https://doi.org/10.3390/textiles5020010
APA Style
Barry, C. P., Bergeron, K., Stapleton, S. E., Willis, D. J., Noetscher, G., Charrette, C., & Sherwood, J. A.
(2025). The Investigation of the Mechanical Behavior of a Braided Parachute Suspension Line Using a Mesomechanical Finite Element Model. Textiles, 5(2), 10.
https://doi.org/10.3390/textiles5020010


 ,
, 


