1. Introduction
Strength is one of the essential physical properties of textile cotton fibers. Its measurement can be categorized into a single fiber test or a bundle fiber test. The methods for a single fiber strength measurement involve the Mantis single-fiber tester [
1,
2], the Instron tensile tester [
3], and the Favimat single-fiber tester [
4,
5], whereas the techniques for a bundle fiber strength measurement include the Stelometer bundle tester [
6], Fibrotest [
7], and the high volume instrument (HVI) [
8]. Researchers have attempted to relate one strength test to another [
2,
4,
7]. For example, Thibodeaux et al. [
2] examined the relationship between the single-fiber strength from the Mantis test and bundle fiber strength from the Stelometer and HVI and observed that both the Stelometer and HVI bundle strength were linearly proportional to the ratio of the average Mantis breaking load to the square of the average fiber ribbon width. Delhom et al. [
4] found that the single-fiber test produced higher mean values than the bundle test on the basis of the single-fiber test from the Favimat and bundle fiber measurements from the Stelometer and HVI. Cui et al. [
7] studied the relationship between Fibrotest and HVI strengths on 12 cotton samples with different micronaire (MIC) values and noted an insignificant effect of the MIC value on the strength difference between the two measurements. Also, they observed low Fibrotest strengths compared to the Stelometer strength for the three international calibration cottons that had standard Stelometer strength values.
From the perspective of cotton research for better fiber quality measurement and enhancement, there is still an interest in how cotton fiber strength relates to fiber structure. Given the complexity of both fiber strength measurement and structure determination, researchers have taken different strategies. For example, Benedict et al. [
9] reported a correlation of 0.94 between the average length of the cellulose chains in the crystalline cellulose and the HVI bundle fiber strength after analyzing the crystalline microfibrillar fragments by
13C-nuclear magnetic resonance (NMR) spectroscopy. Hsieh’s group [
1,
3,
10] developed the ‘‘XRAY’’ X-ray diffraction (XRD) analysis program to assess the crystallite size and crystallinity parameters of dried developing cotton fibers from the wide-angle XRD pattern and further correlated the crystallite size and crystallinity with fiber-breaking force and tenacity (or strength) that were measured from a Mantis single fiber tester or an Instron tensile tester. The results indicated that the single fiber breaking forces were positively related to both crystallite size and crystallinity, and the breaking force and tenacity increase appeared to be related more to crystallite size than to crystallinity. In addition, the pattern of single-fiber breaking tenacities against fiber crystallinity differed between cotton fibers from two genotypes of SJ-2 and Maxxa. They found that other structural parameters than the crystallite sizes and crystallinity, such as fibril orientation and residual stress, may play important roles in impacting the single fiber strength of cotton fibers. Using a different approach, Liu et al. [
11] estimated the fiber infrared maturity (
MIR) and infrared crystallinity (
CIIR) of Upland and Pima cotton fibers from attenuated total reflection Fourier transform infrared (ATR FT-IR) spectroscopy in an effort to relate both
MIR and
CIIR values to Stelometer tenacity (STE
ten) and elongation (STE
elo) properties. The uniqueness of this work was the capability of the ATR FT-IR method to scan tiny Stelometer breakage specimens (2~5 mg), which cannot be readily analyzed by a conventional XRD measurement or by chemical extraction and identification analysis. Compared to an increase in fiber STE
ten with either
MIR or
CIIR for Pima fibers, there was an unclear trend between the two for the combined Upland fiber set from the U.S. (two varieties) and outside of the U.S. (14 varieties from 2 Asian and 2 African countries). Based on comprehensive measurements from HVI, cross-sectional image analysis, Cottonscope, and Favimat, Kim et al. [
12] investigated the effect of fiber maturity on the bundle and single fiber strength of Upland cotton constructed from a genetic approach. They showed significant and positive correlations between MIC and HVI bundle fiber strength or elongation value, and also between MIC or maturity ratio value and single fiber breaking force rather than with single fiber strength. Overall, making a direct comparison between these studies is challenging because of differences in bundle/single fiber strength measurement methods (Stelometer, HVI, Instron tensile tester, and Favimat), fiber crystallinity/maturity determination methods (XRD,
13C NMR, ATR FT-IR, HVI, cross-sectional image analysis, and Cottonscope), and fiber sources (field-grown or greenhouse-grown).
Both fiber STE
ten and HVI strength (HVI
str) reflect the external force-induced breaking of cotton bundle fibers, but the values have been calculated differently. Unlike the Stelometer test, which uses the weight of a broken bundle beard to normalize the breaking force for assessing the STE
ten, the HVI test uses a fiber MIC as the mass substitute for HVI
str. Other factors such as fiber sample size, fiber bundle orientation, pre-tension, speed of the break, and clamp placement influence the STE
ten and HVI
str values [
13]. In an earlier investigation, Liu et al. [
11] examined the relationship between the STE
ten or STE
elo property and the
MIR or
CIIR index on a combined Upland fiber set, including two U.S. varieties. Taking a similar approach, this study related STE
ten and STE
elo properties as well as HVI MIC and HVI
str properties to
MIR or
CIIR values on six U.S. Upland cultivars. The main objectives of this study were: (1) to evaluate the bundle strength agreement between HVI
str and STE
ten measurements on six Upland cotton cultivars and (2) to correlate the STE
ten and STE
elo properties as well as HVI MIC and HVI
str properties with
MIR and
CIIR indices from ATR FT-IR measurements on Stelometer fiber breakage specimens of these fibers. As a comparison to Upland cultivars, Pima cottons were included in the analysis.
2. Materials and Methods
2.1. Cotton Lint Samples
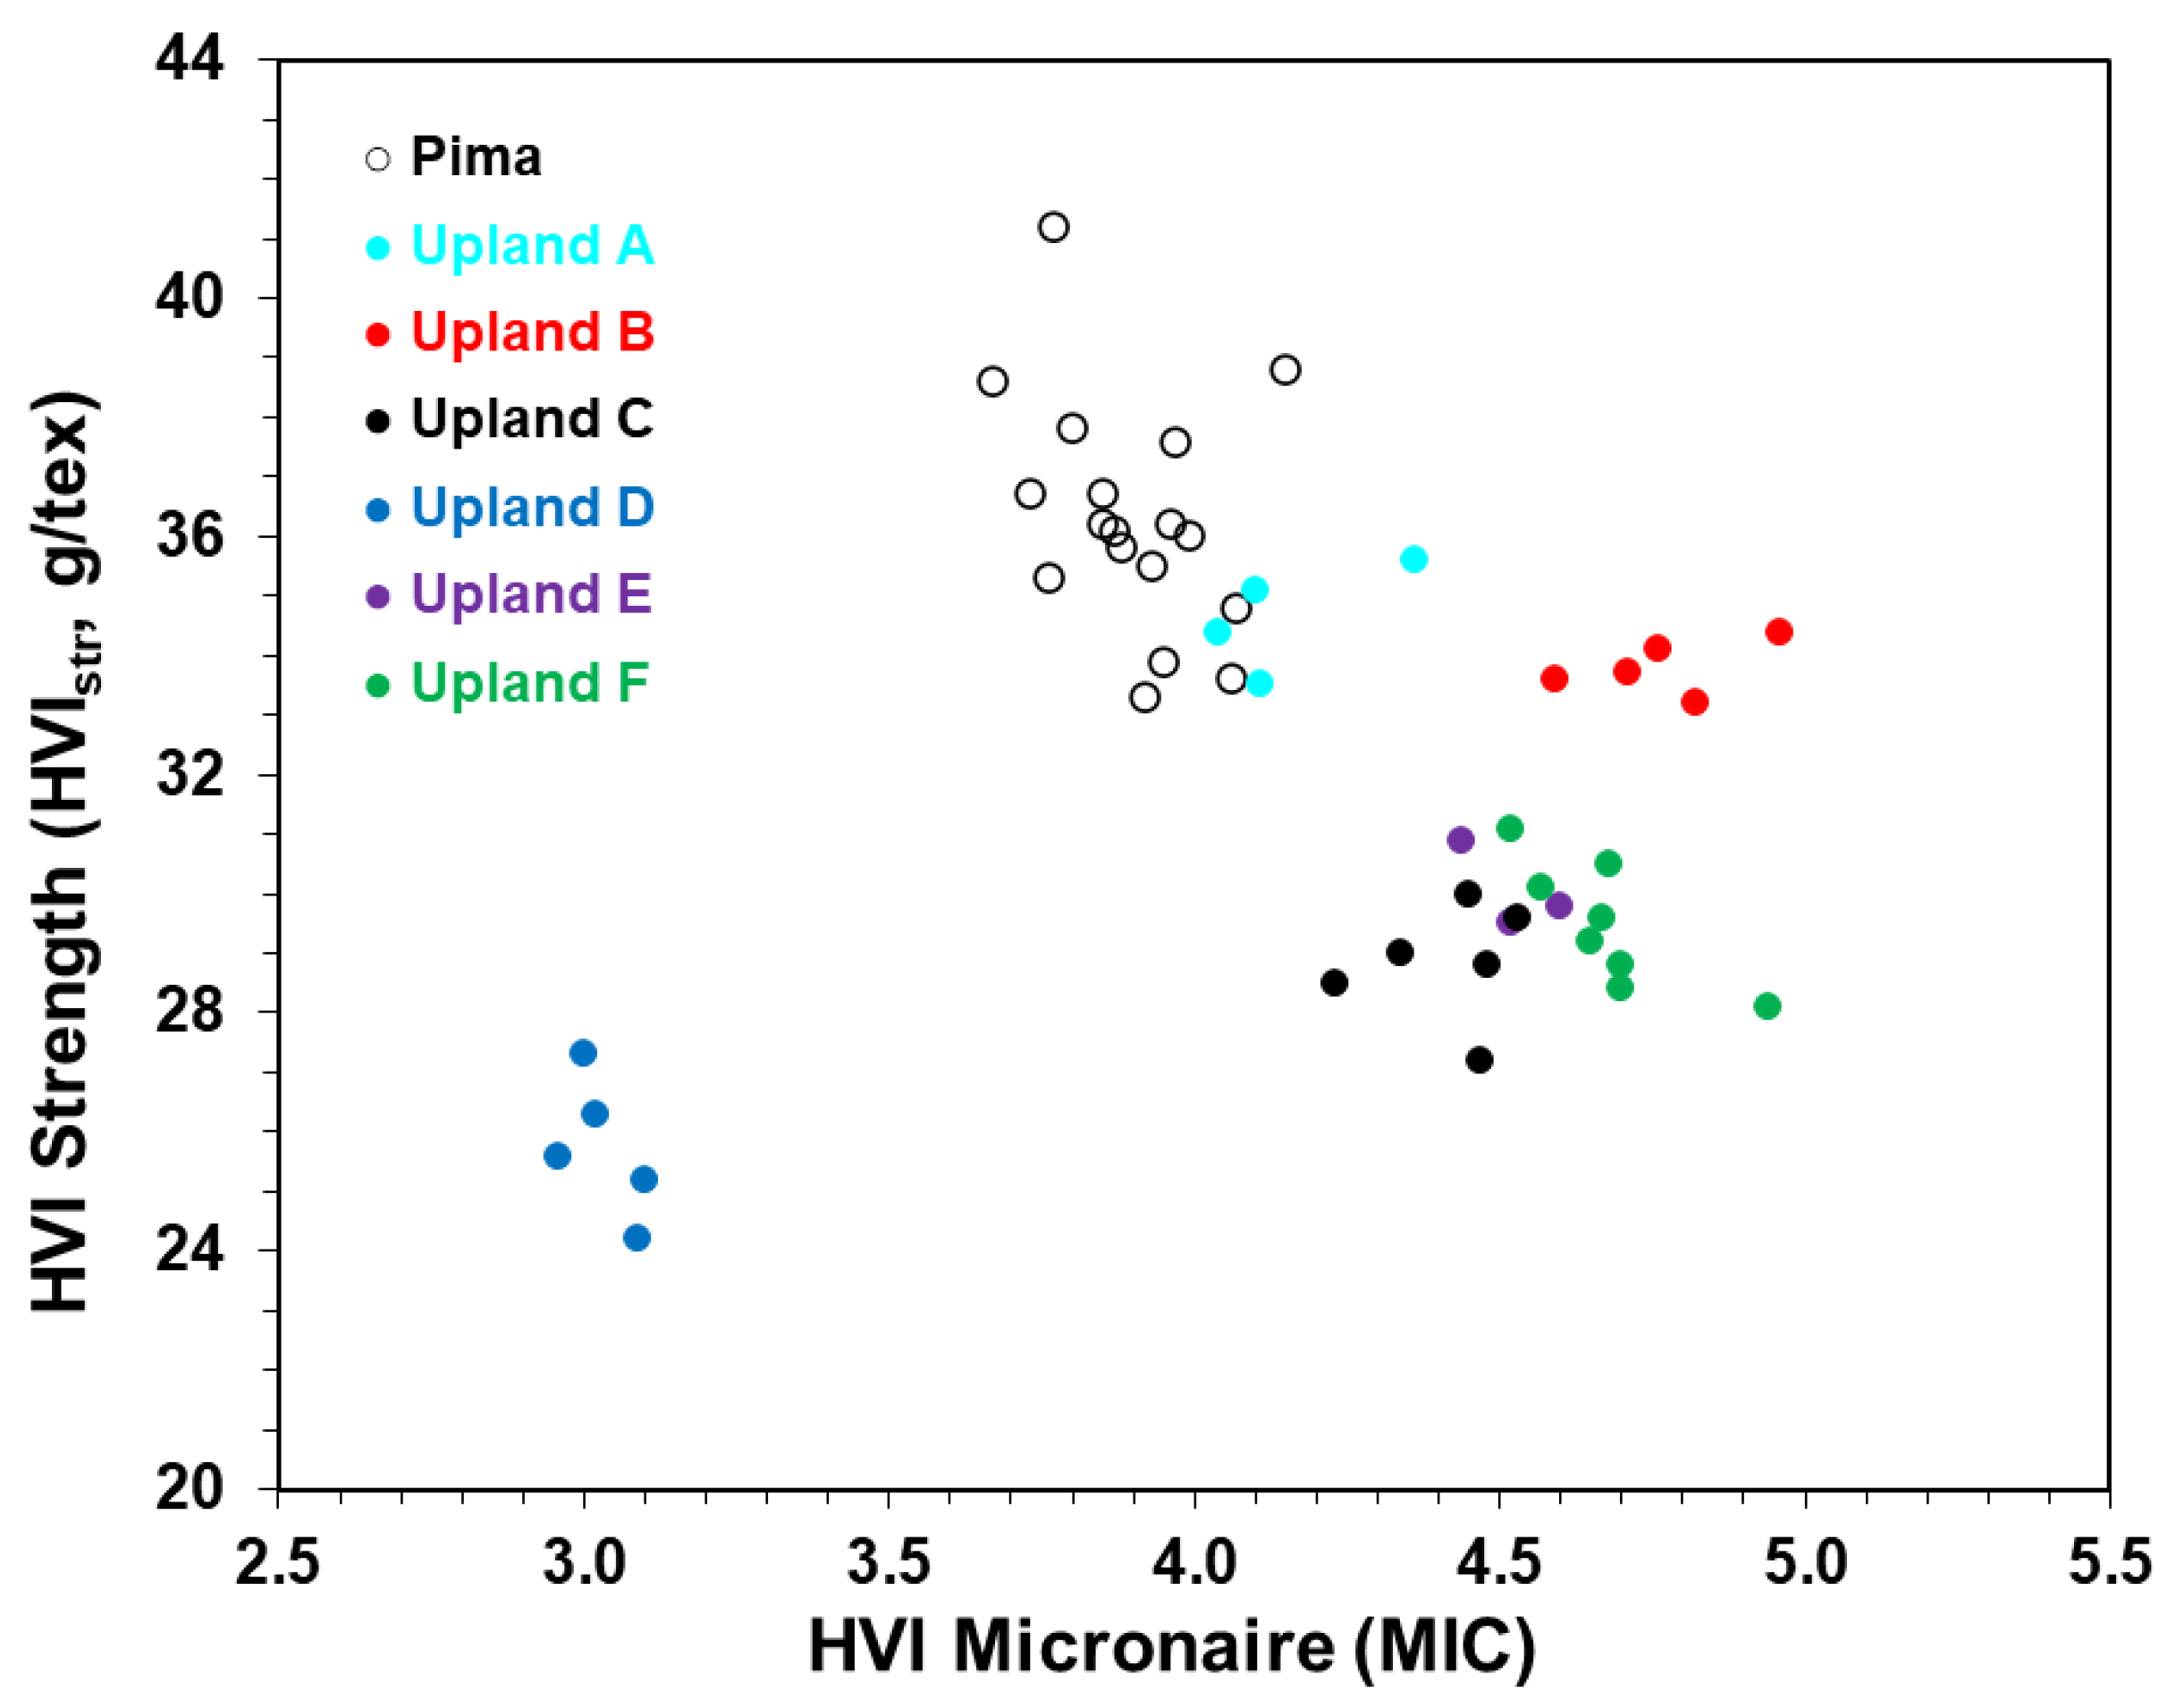
A total of 31 Upland lot samples representing 6 Upland cotton cultivars and 18 Pima fiber samples from 1 Pima cultivar were collected randomly. These cotton fibers were grown in the U.S., but their specific geographic origins and crop years were not available. There were 4, 5, 6, 5, 3, and 8 fiber lots in respective Upland A, B, C, D, E, and F cultivars, and samples in a cultivar were replicated field lots from the same location. They were well conditioned at a constant relative humidity of 65 ± 2% and a temperature of 21 ± 1 °C for at least 48 h prior to routine HVI and Stelometer testing as well as the ATR FT-IR spectral acquisition.
2.2. Fiber HVI and Stelometer Property Measurement
Average HVI
str and MIC properties were obtained from five replicates on each sample by an Uster HVI 900A system (Zellweger Uster Inc., Knoxville, TN, USA). Mean STE
ten and STE
elo values were determined from three replicates on individual samples by the use of a Stelometer flat bundle tester (Spinlab, Knoxville, TN, USA) with 1/8 inch (3.2 mm) clamp spacing as detailed previously [
11]. All broken bundles free of any impurities (or non-lint materials) were retained for subsequent ATR FT-IR spectral scans.
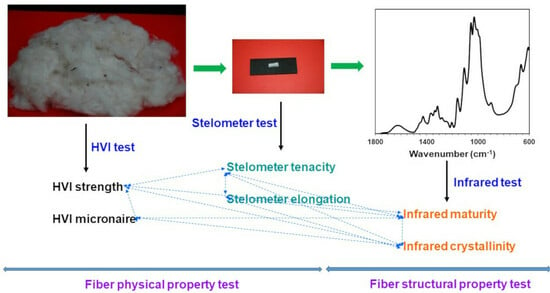
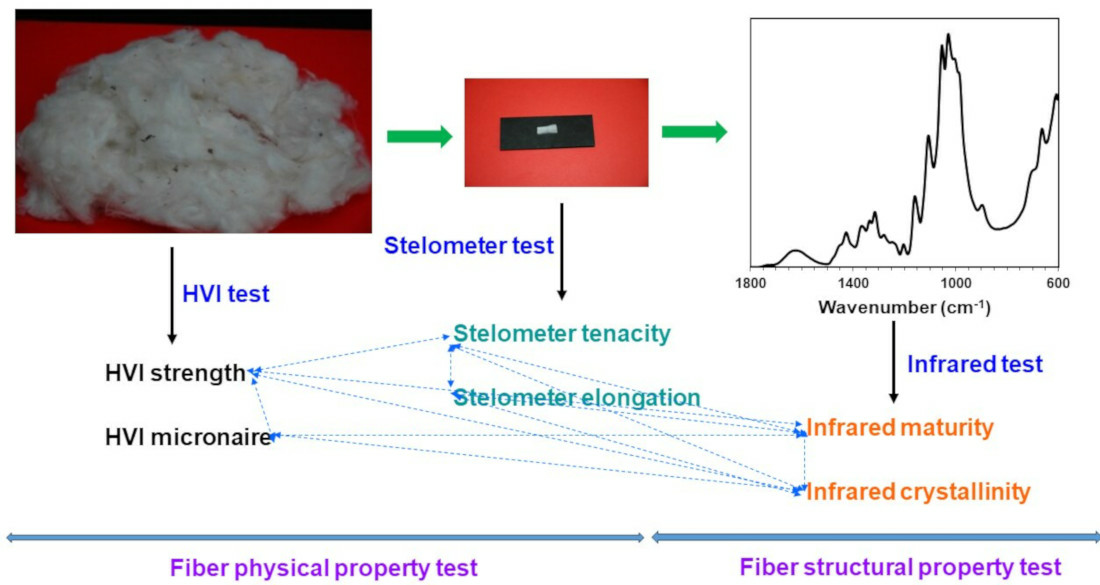
2.3. Fiber MIR and CIIR Calculation
Fiber
MIR and
CIIR values were estimated by applying simple algorithmic analysis to the ATR FT-IR spectra, as shown in
Figure 1, with the proposed procedure [
14]. Briefly, after the spectra were exported into Microsoft Excel, the first algorithmic
R1 equation below was used to calculate the
R1 value:
where
I1500,
I1032, and
I956 are each a three-point intensity average at respective wavenumbers. The
I1032 characterized the large and positive intensity variation, while the
I956 represented the large and negative intensity variation in the difference spectrum between immature and mature cotton. The
I1500 was used to offset two readings because of its minimum absorbance.
Next, the second algorithm,
MIR, was used to convert the
R1 value into the
MIR index:
in which
R1,
R1,lr, and
R1,sm are the
R1 values for the unknown sample, the largest
R1, and the smallest
R1, respectively. The
R1,sm and
R1,lr values were determined to be 0.14 and 0.59.
Similarly,
CIIR was computed using two algorithms, with the first algorithm
R2 utilizing three respective IR intensities at 800, 730, and 708 cm
−1, and the second algorithm
CIIR (%) changing the
R2 values into fiber
CIIR.
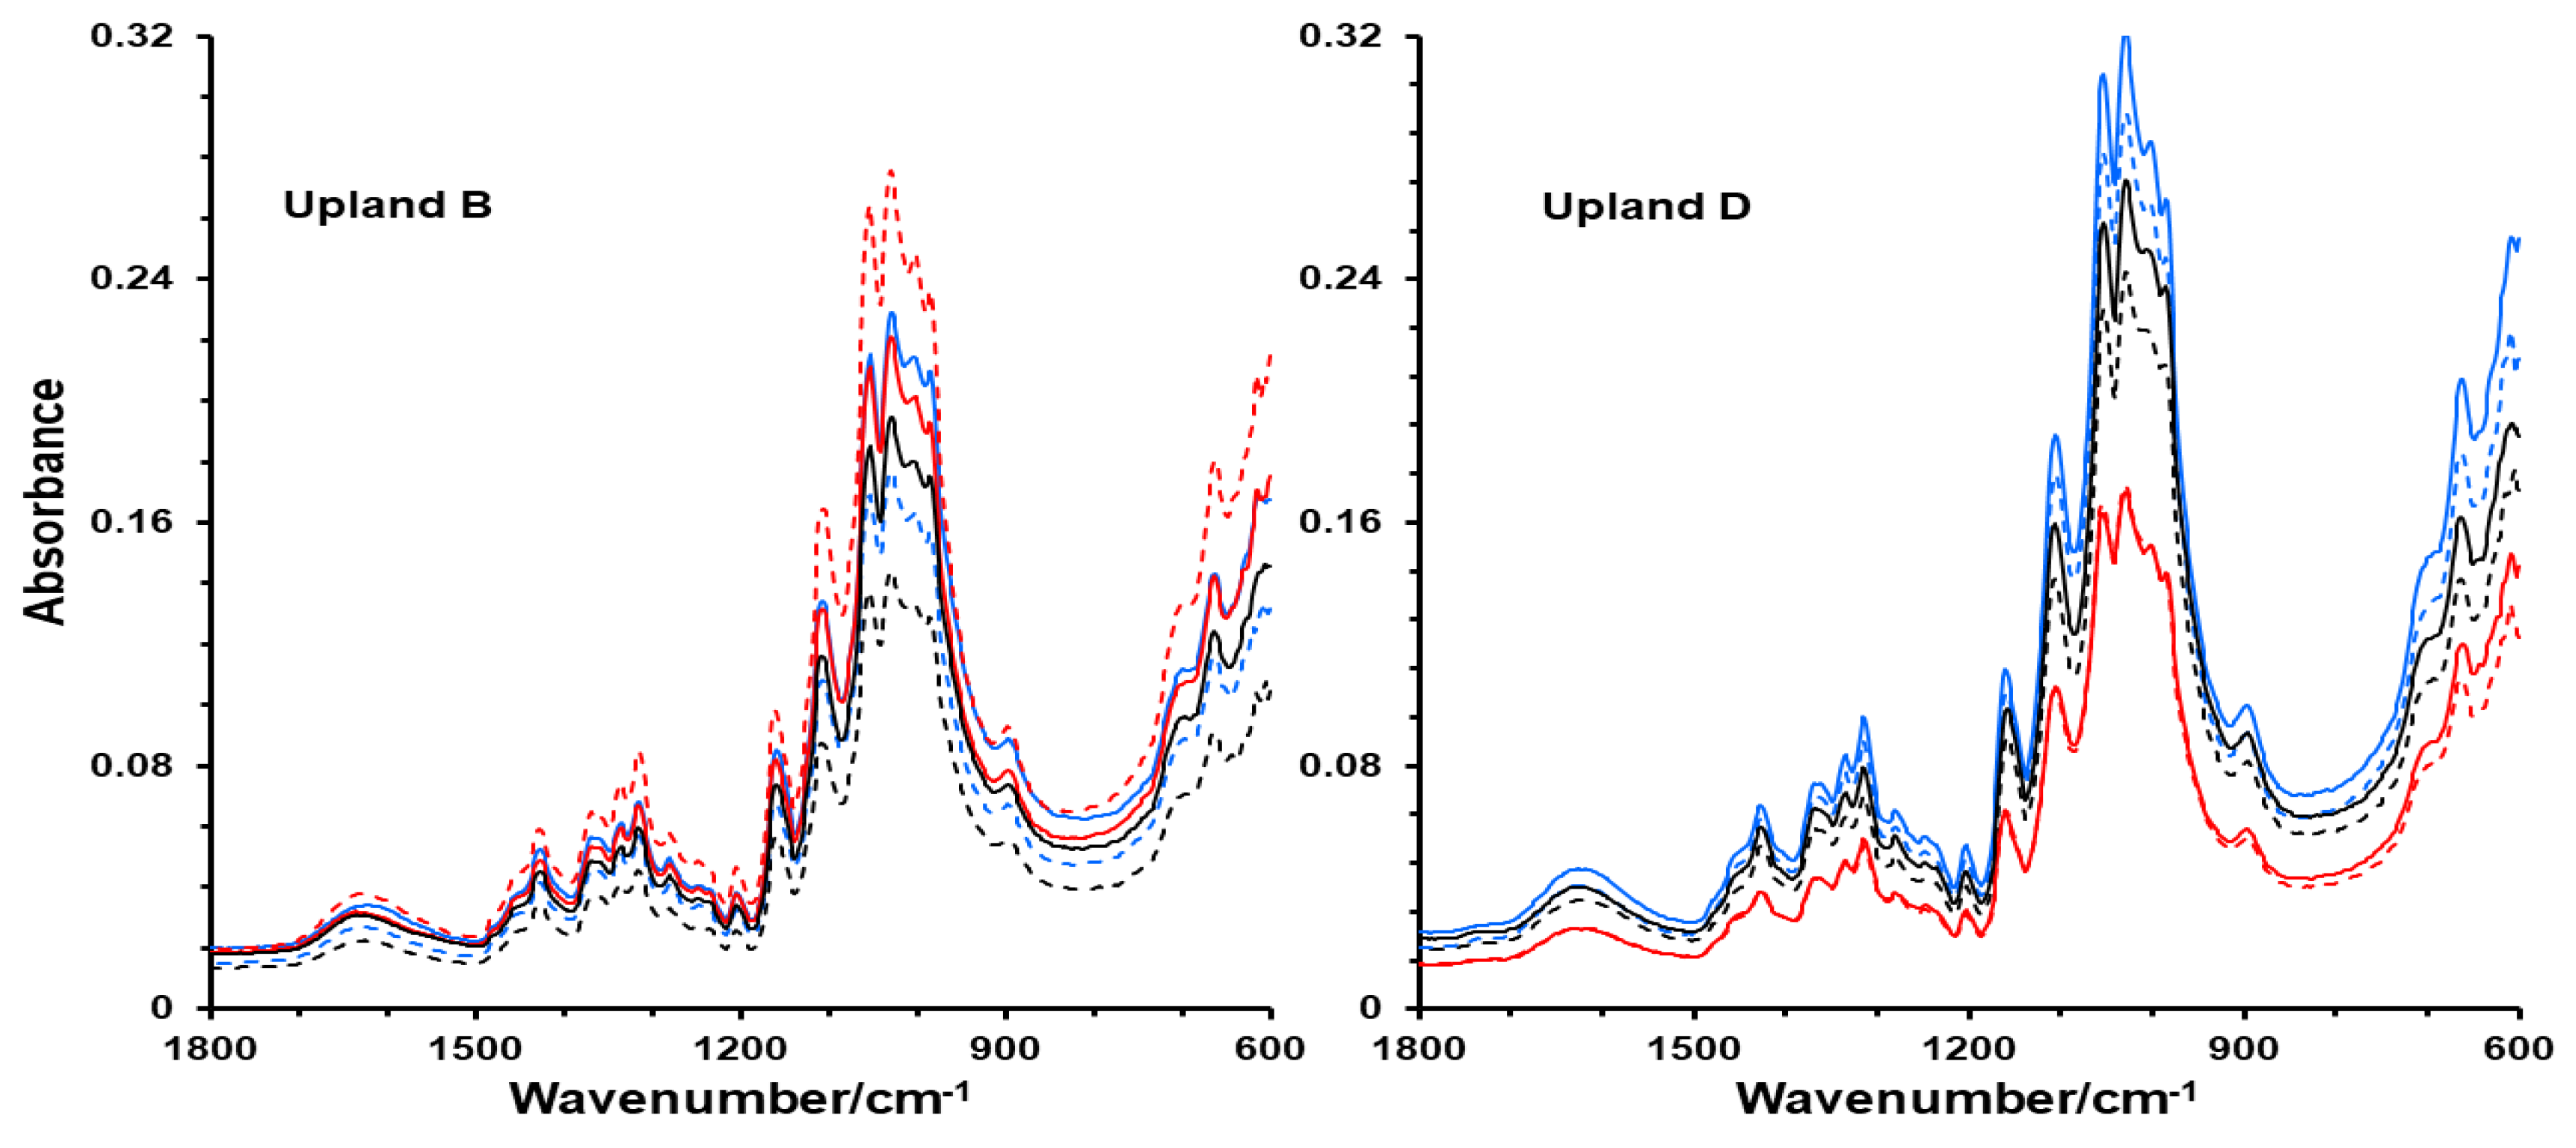
To collect the spectra, an FTS 3000MX Fourier transform IR spectrometer (Varian Instruments, Randolph, MA, USA) equipped with a ceramic source, KBr beam splitter, deuterated triglycine sulfate (DTGS) detector, and an ATR attachment was used. Two spectra in the absorbance unit were collected for each broken bundle over the range of 4000–600 cm−1 at 4 cm−1 with 32 co-added scans, and the mean spectra for each sample were exported into Microsoft Excel 2016 to assess fiber CIIR and MIR indices.
The sampling depth of the ATR device is from 2 to 15 μm, depending on the ATR crystal materials and wavenumber range [
15,
16], while the thickness of the secondary cell wall (SCW) in mature cotton fibers varies from 2 to 7 μm [
17]. Therefore, the ATR FT-IR method is capable of representing the information inside mature cotton fibers by the use of both a low refractive index crystal (ZnSe or diamond) and a low spectral region (1100 to 600 cm
−1). Overall, the use of the ATR device greatly facilitates the sampling procedure and is also time-efficient for a large number of sample analyses.
2.4. Mathematical and Statistical Analysis
Mathematical and statistical analyses were conducted using Microsoft Excel 2016. For mathematical analysis, Pearson correlation coefficient (
r), slope, and coefficient of determination (R
2) were acquired from the relationships among fiber Stelometer, HVI, and spectral values by fitting the data into a linear regression trendline option. When the ׀
r׀ value is less than 0.3, between 0.3 and 0.7, or greater than 0.7, a weak, moderate, or strong (either positive or negative) linear correlation exists between the two variables [
18]. For statistical analysis,
p-values among a pair of fibers’ physical and structural properties were calculated using the Excel regression function under Data Analysis. The
p-value cutoff for significance was 0.05, with three levels at 0.05~0.01 (*), 0.01~0.001 (**), and <0.001 (***).
4. Conclusions
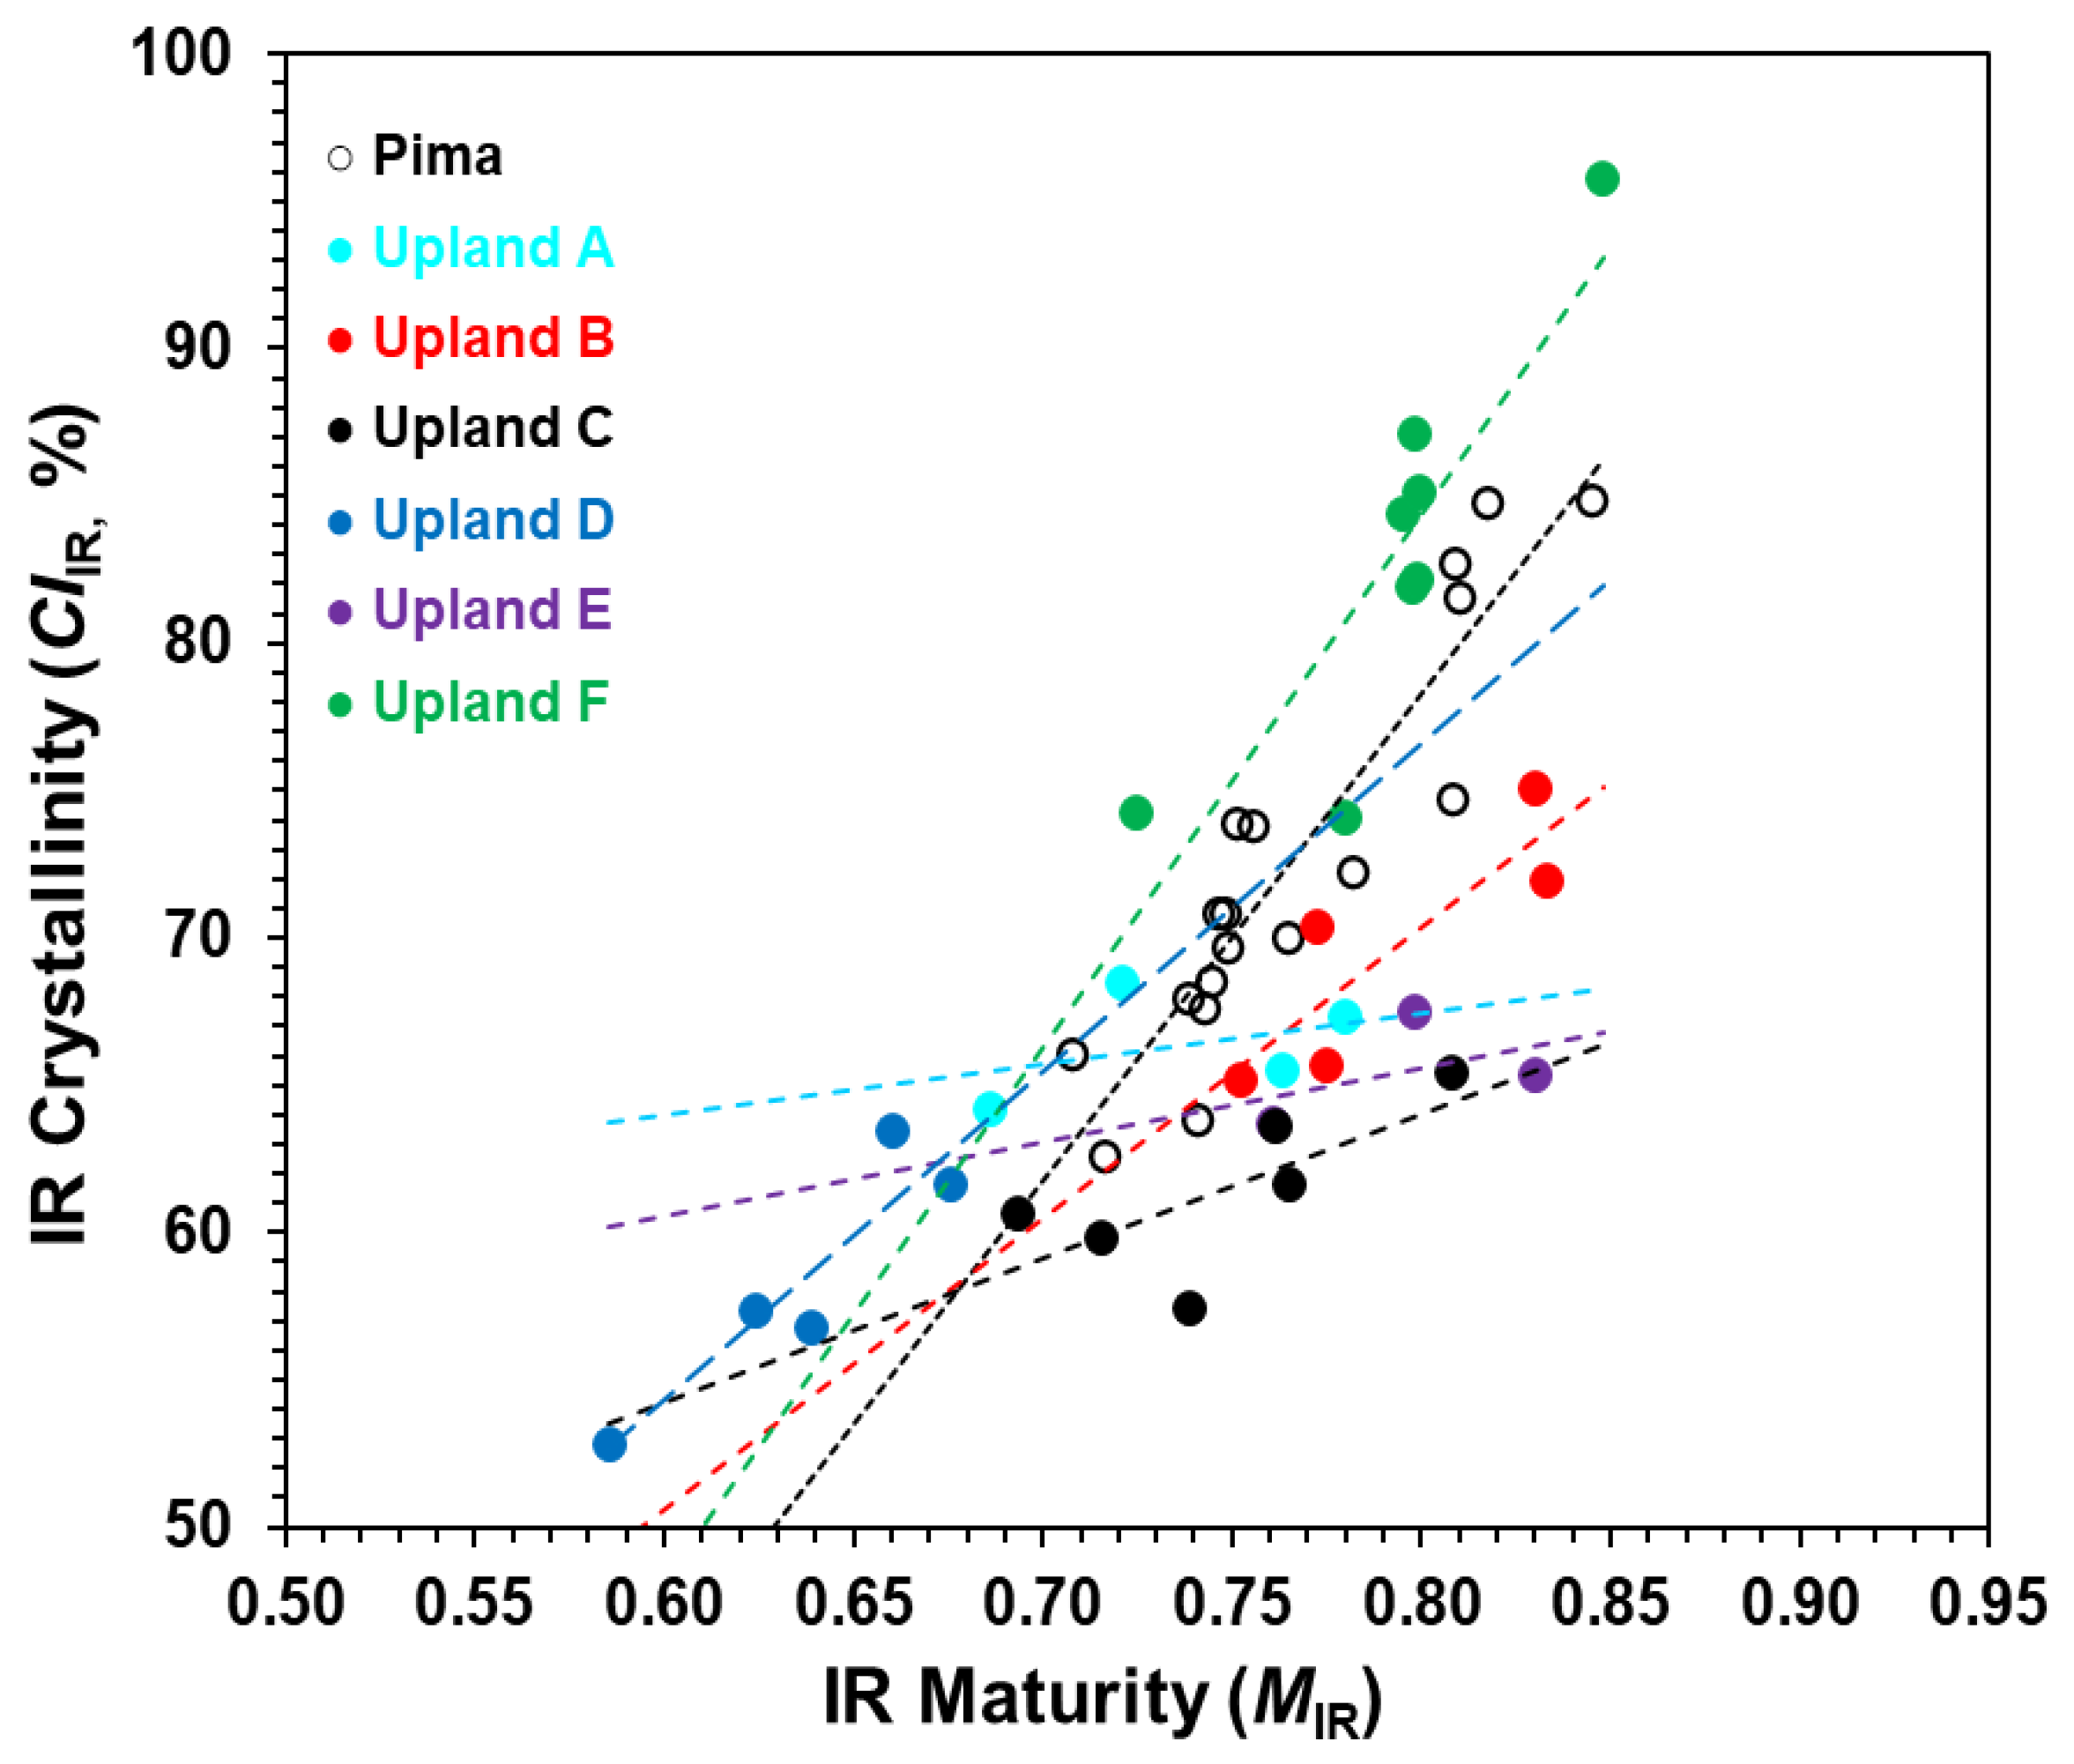
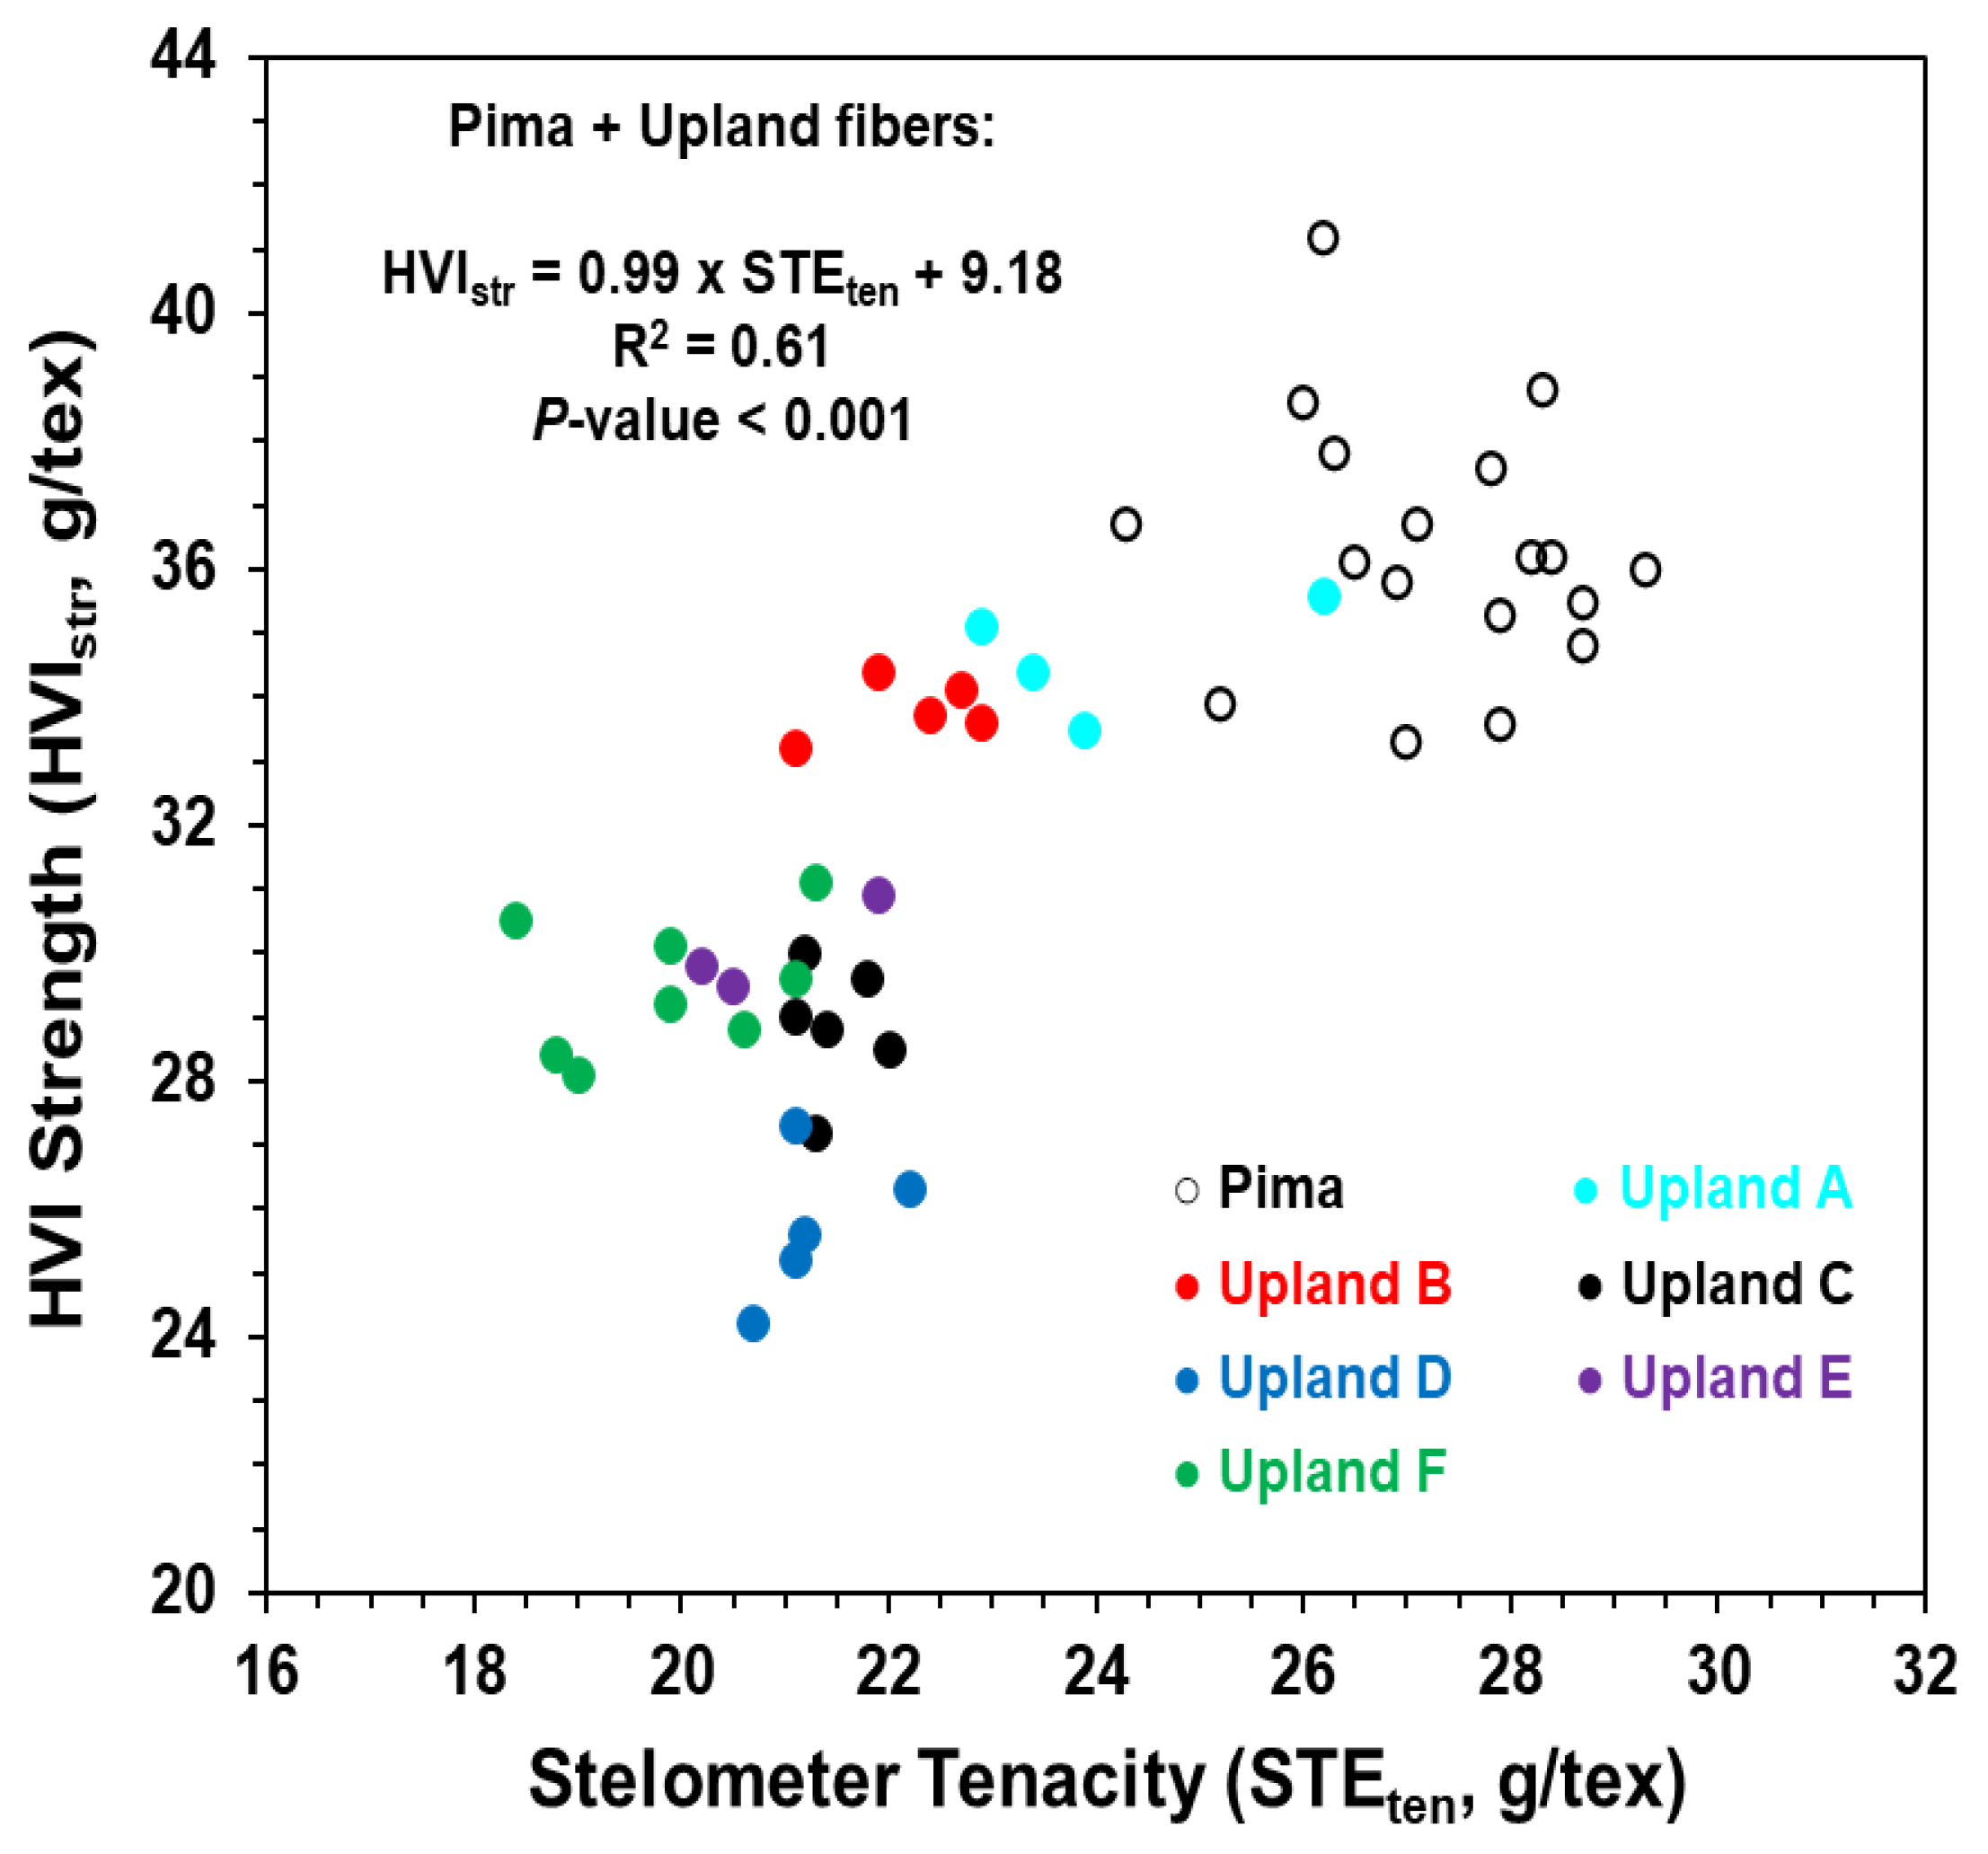
This study linked fiber Stelometer and HVI properties to fiber crystallinity and maturity indices determined by analyzing ATR FT-IR spectra of tiny Stelometer breakage specimens, aiming to examine the relationships between fiber physical and structure properties among six Upland and one Pima cotton cultivar. Although the plot of STEten against HVIstr implied a reasonable agreement between two strength measurements (r = 0.57 ***), the Upland D cultivar (immature with the smallest MIC, MIR, and CIIR values) was observed to show the lowest HVIstr value (=25.7) but a relatively larger STEten value (=21.3). In contrast, the Upland F cultivar (having the greater CIIR index) showed the smallest STEten value (=19.9) but a relatively larger HVIstr value (=29.5).
A comprehensive examination of multiple relationships on individual Upland cultivars suggested strong and significant correlations between CIIR and STEelo for the Upland A fibers (r = 0.99 *), between MIR and STEten for the Upland C fibers (r = 0.90 *), between MIR and HVIstr for the Upland D fibers (r = 0.98 **), and also between MIR and MIC (r = 0.99*), as well as between MIR and STEelo (r = 0.99 *) for the Upland E fibers. Relatively, there existed a moderate and significant correlation between CIIR and STEten for Pima fibers (r = 0.58 *). Different responses underscored the importance of experimental design and data analysis in understanding the unique response among any pair of fiber MIC, HVIstr, STEten, STEelo, MIR, and CIIR values, even within one cultivar. Beyond the approach reported here, other strategies might be explored with the ultimate purpose of improving fiber strength or elongation measurement, unraveling fiber strength or elongation’s response to fiber structure, and enhancing fiber utilization and processing efficiency.


