
Biosynthesis of Gold- and Silver-Incorporated Carbon-Based Zinc Oxide Nanocomposites for the Photodegradation of Textile Dyes and Various Pharmaceuticals


Abstract
1. Introduction
2. Experimental
2.1. Chemicals and Materials
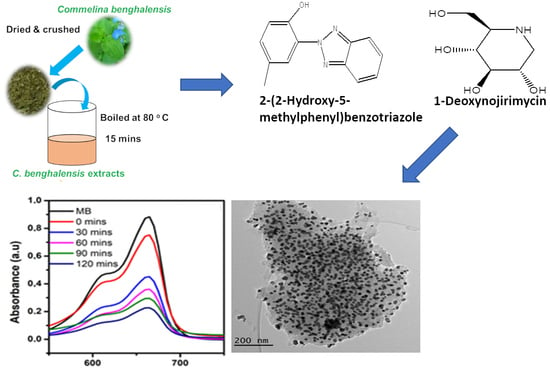
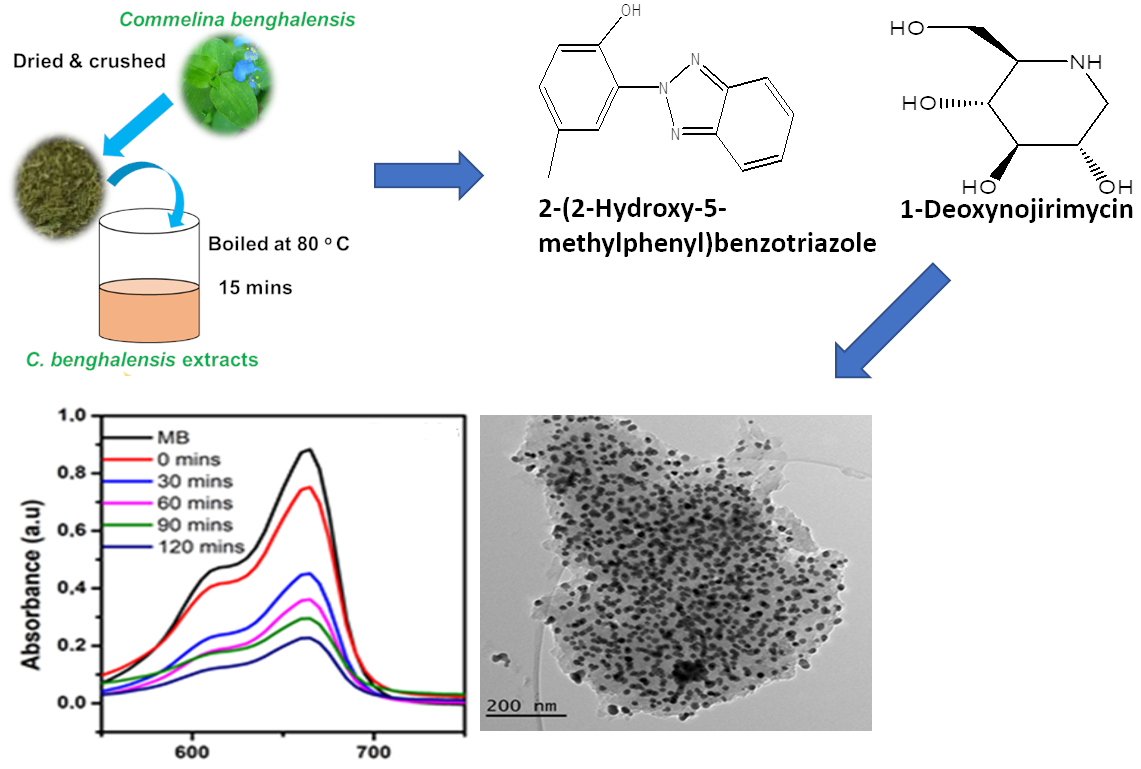
2.2. Preparation of Plant Extracts
2.3. Phytochemical Characterisations Using the LC-MS Technique
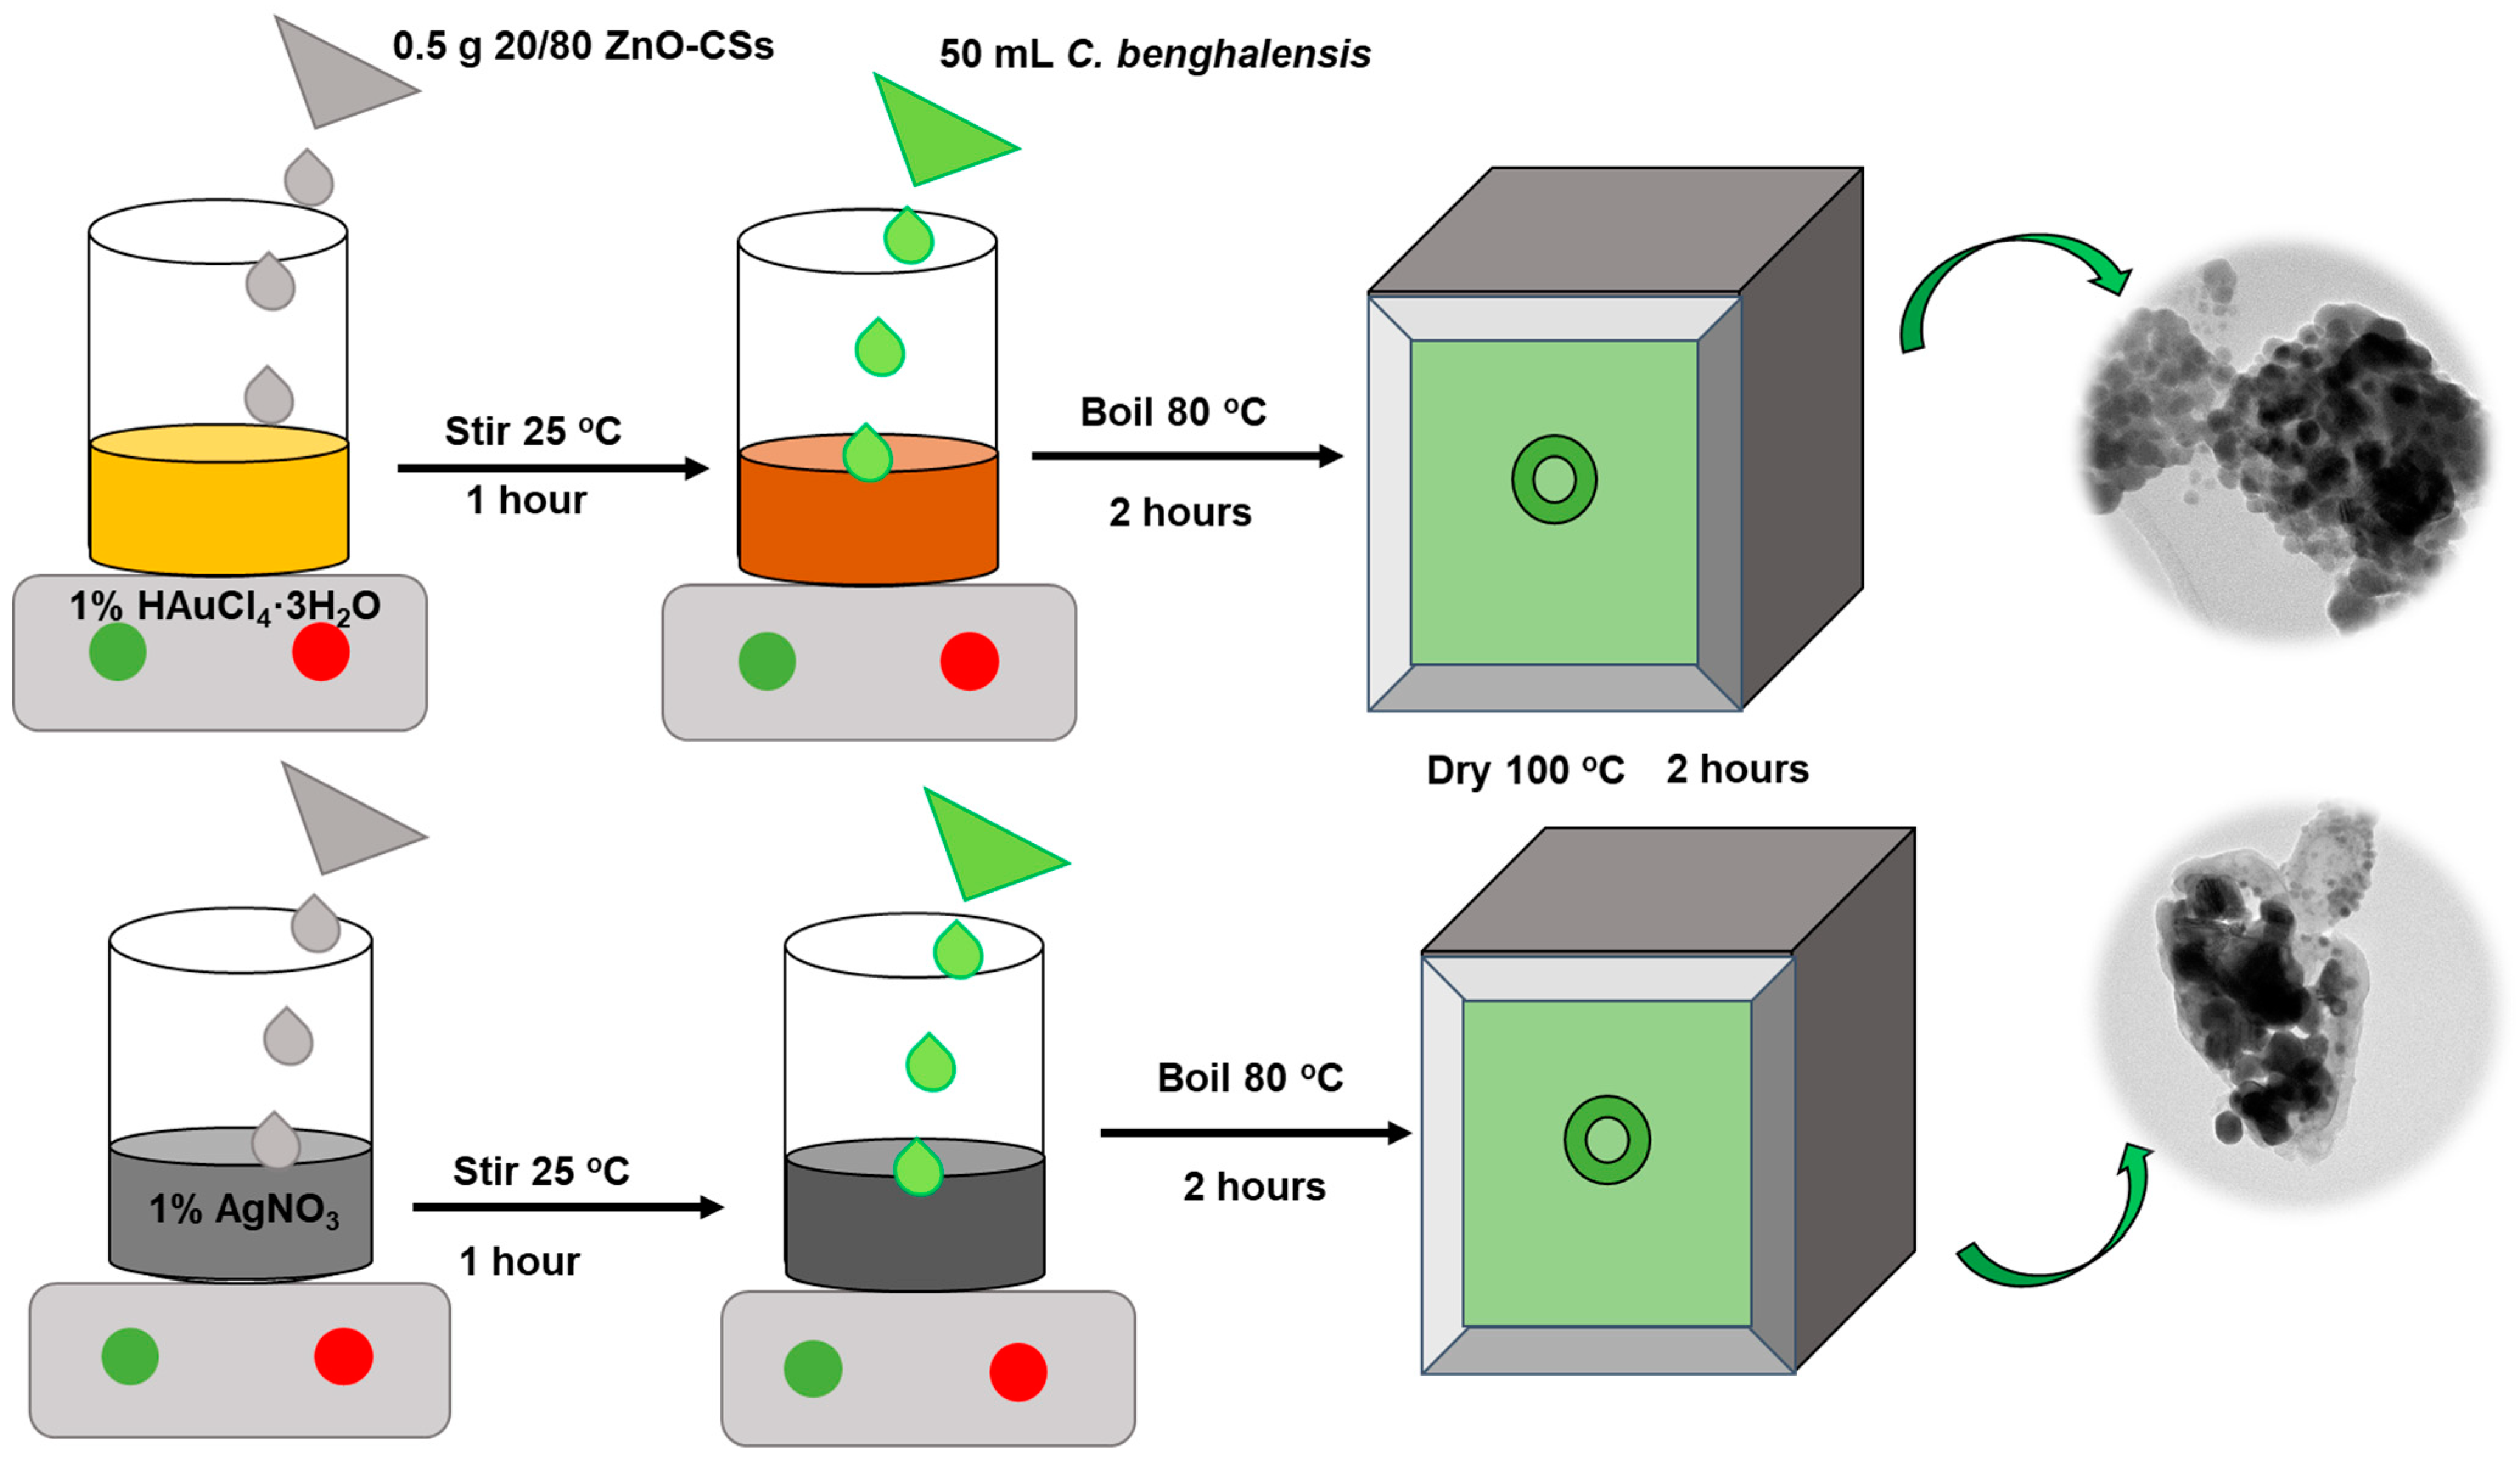
2.4. C. benghalensis-Mediated ZnO Nanoparticle Synthesis
2.5. Preparation of Carbon Spheres (CSs)
2.6. Preparation of Carbon Spheres-Incorporated (ZnO–CSs) Nanocomposites
2.7. Preparation of Metal-Doped ZnO–CSs Composites
2.8. Analysis of Materials
2.9. Photocatalytic Decomposition of MB Dye
2.9.1. Reusability
2.9.2. Trapping Studies
2.10. Photocatalytic Degradation of Pharmaceuticals
3. Results and Discussion
3.1. Plant Extract Analysis by LC-MS
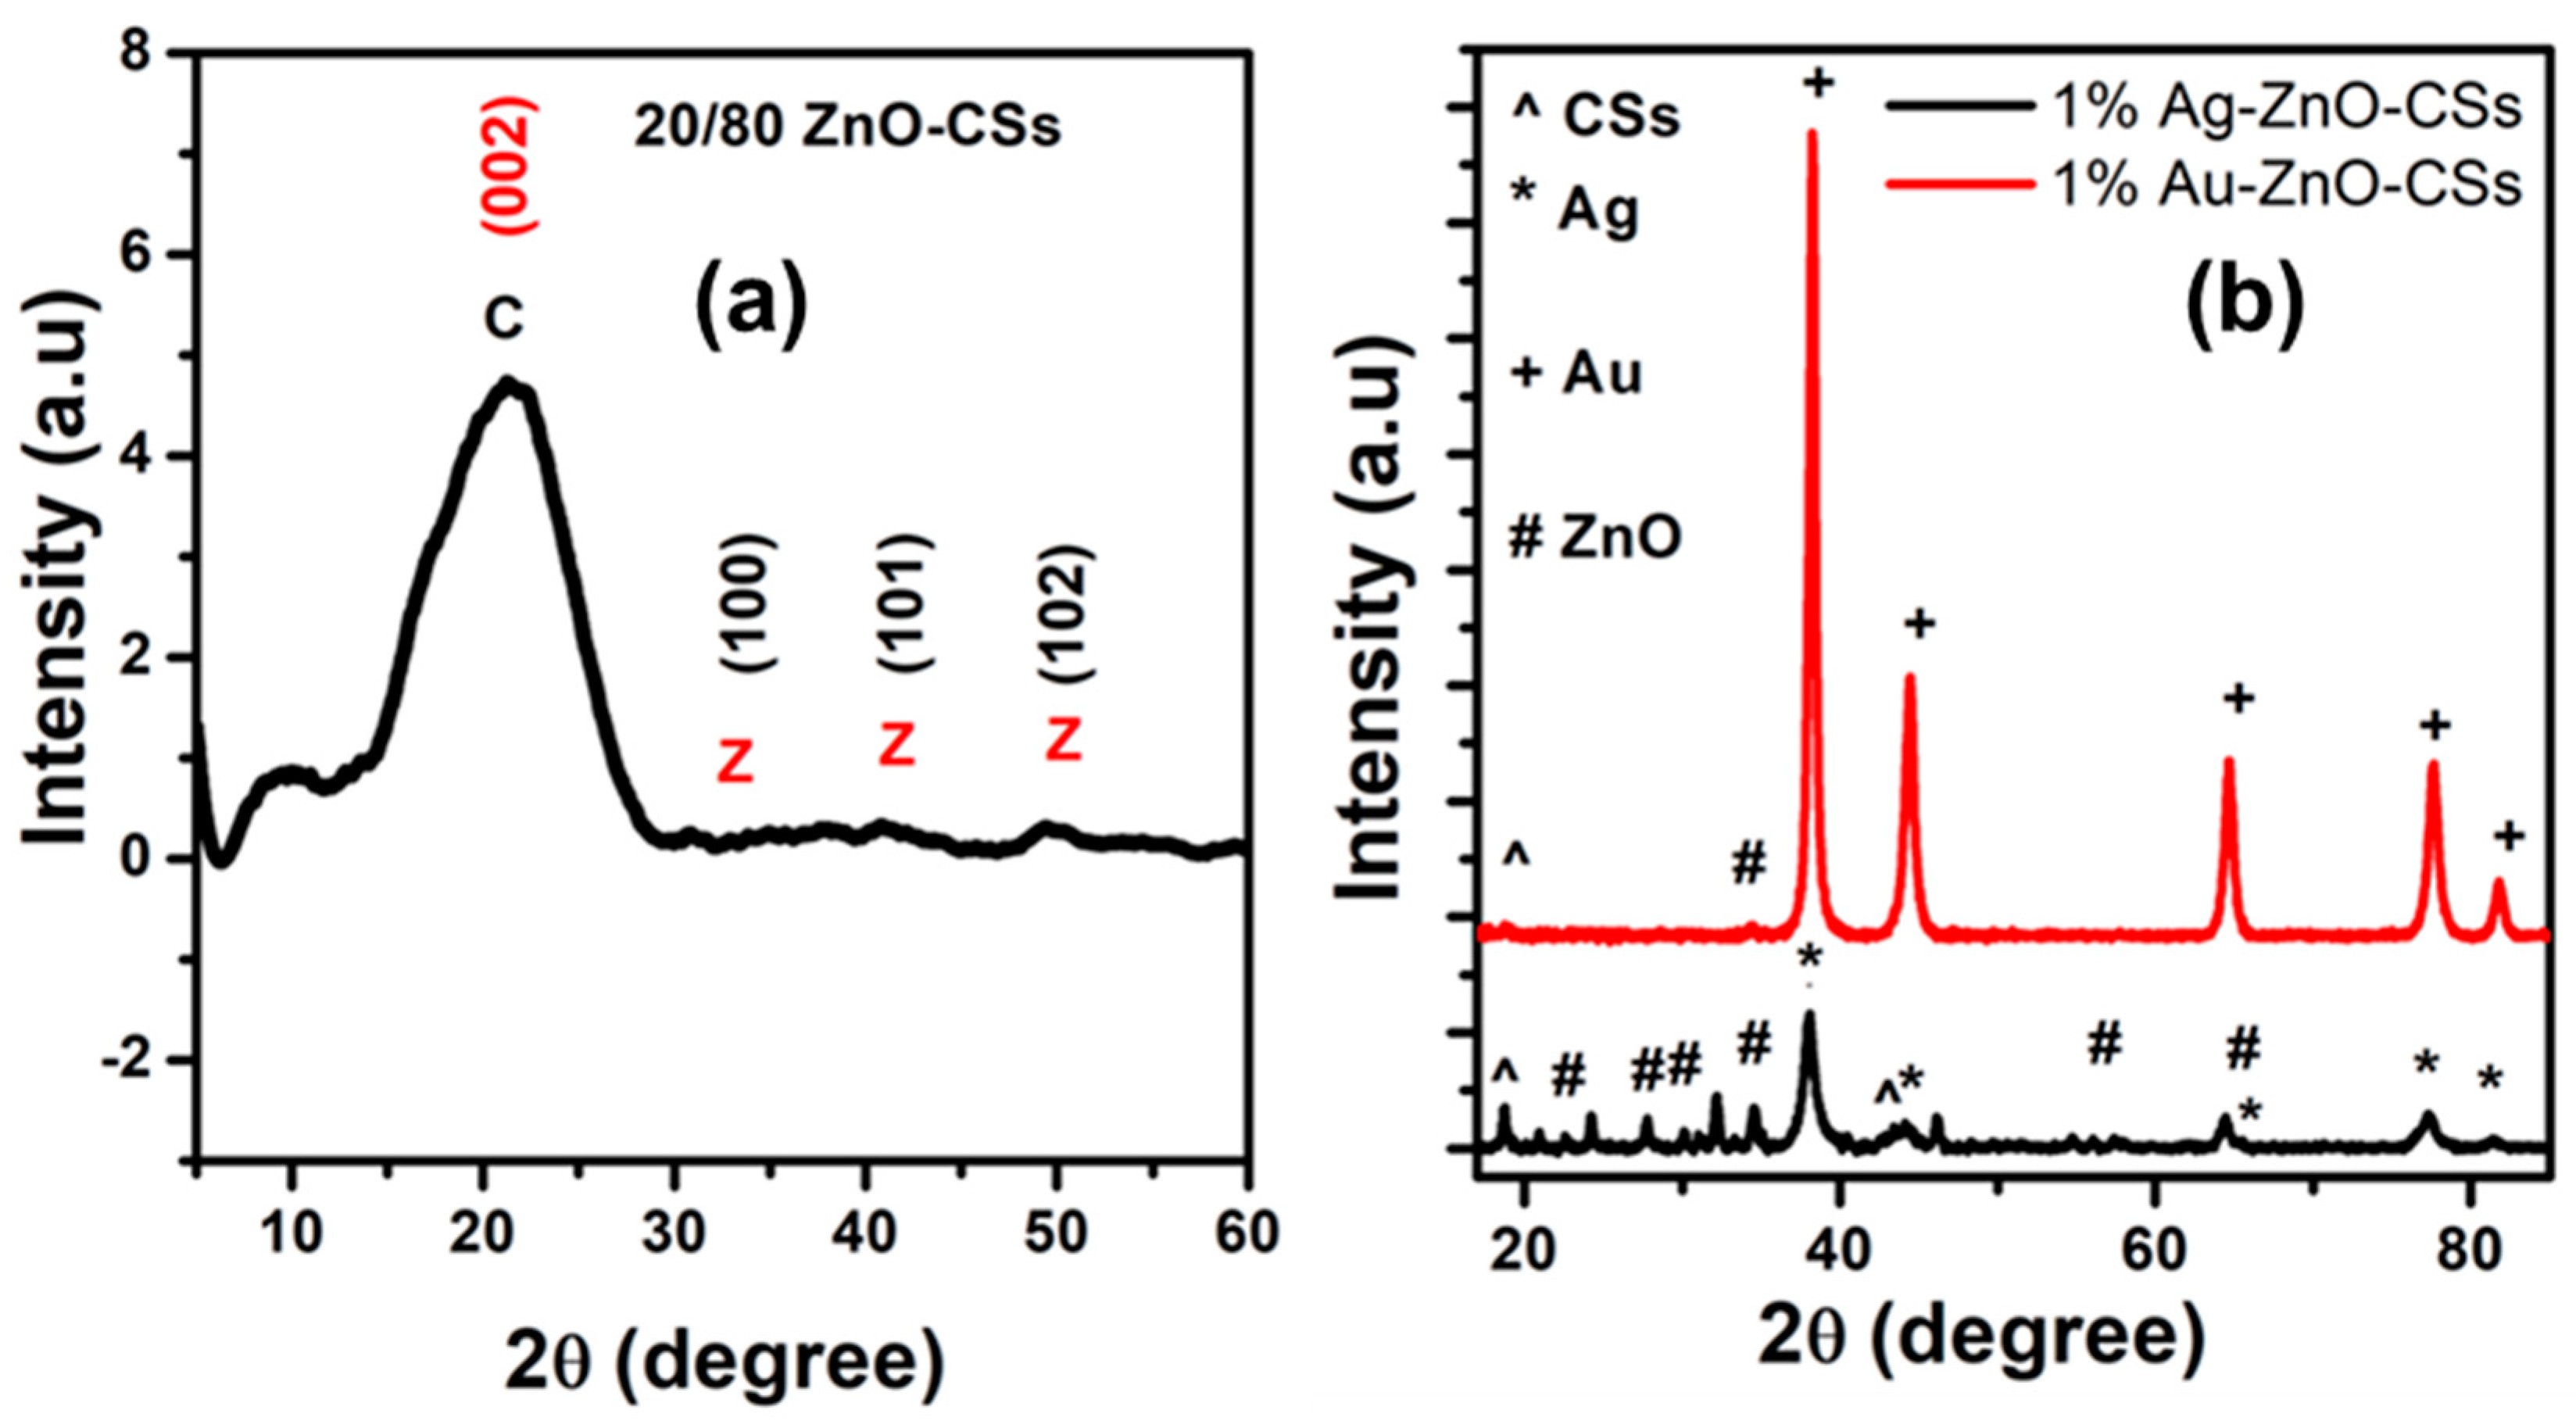
3.2. Structural Analysis
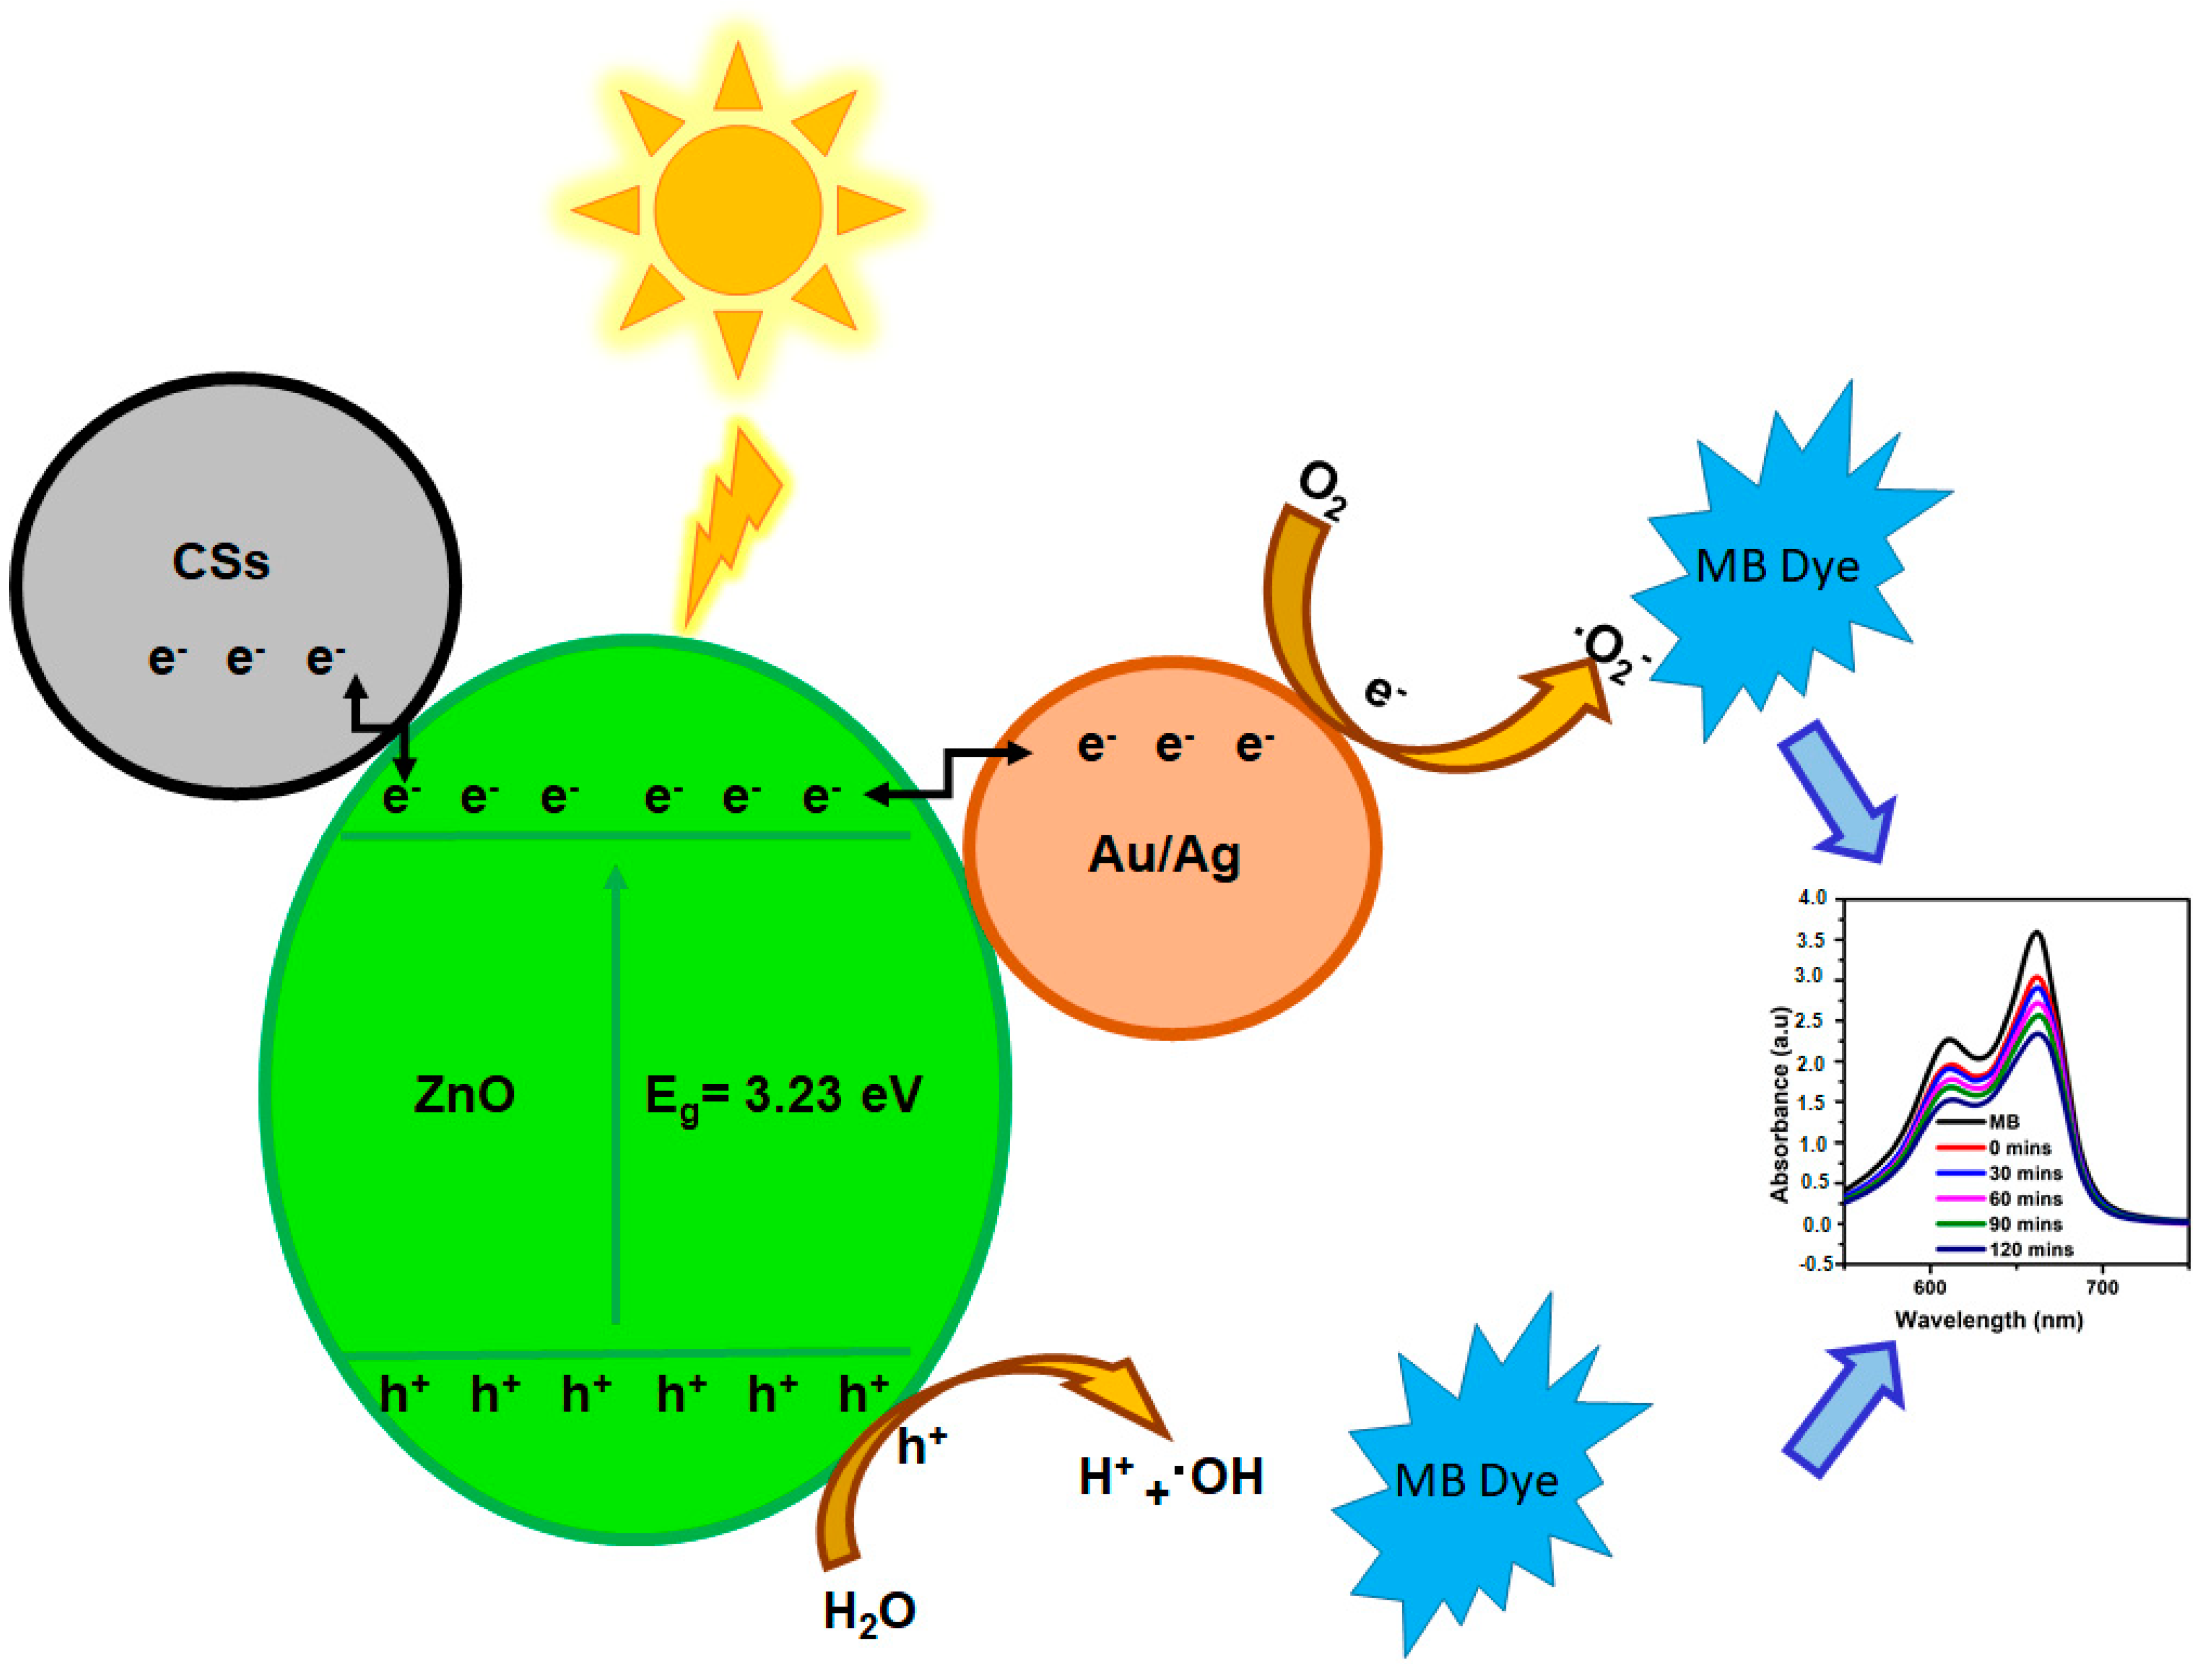
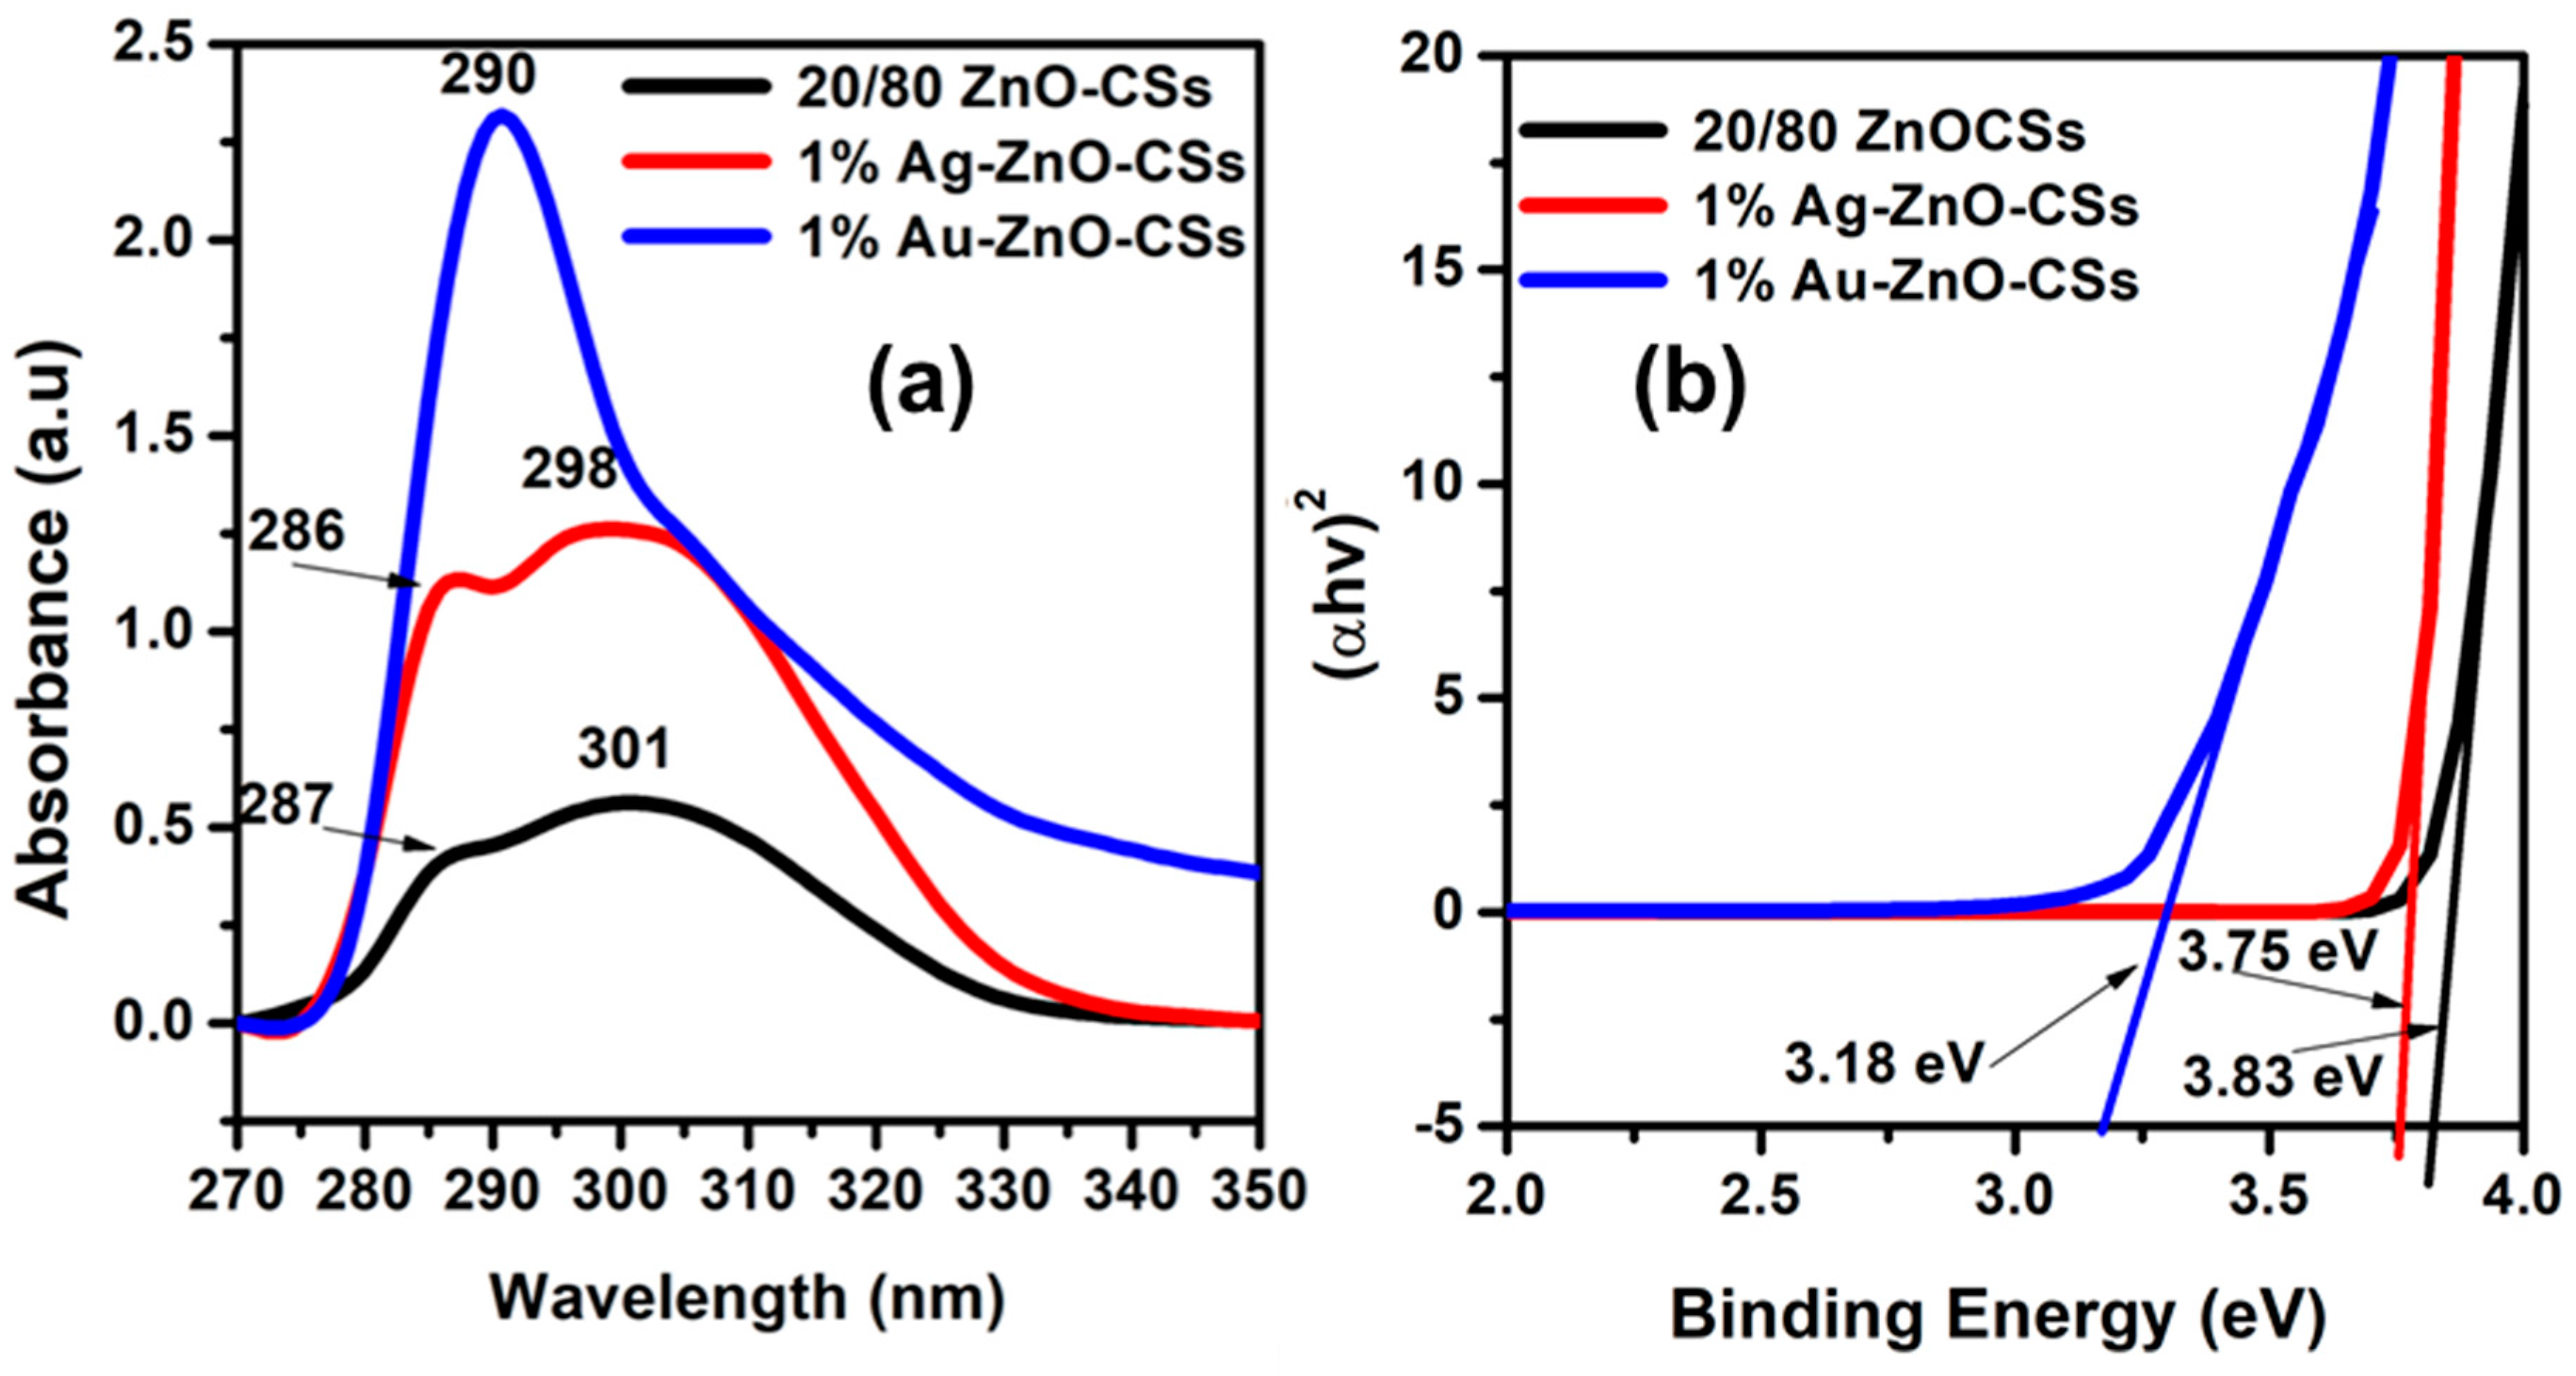
3.3. Optical Properties
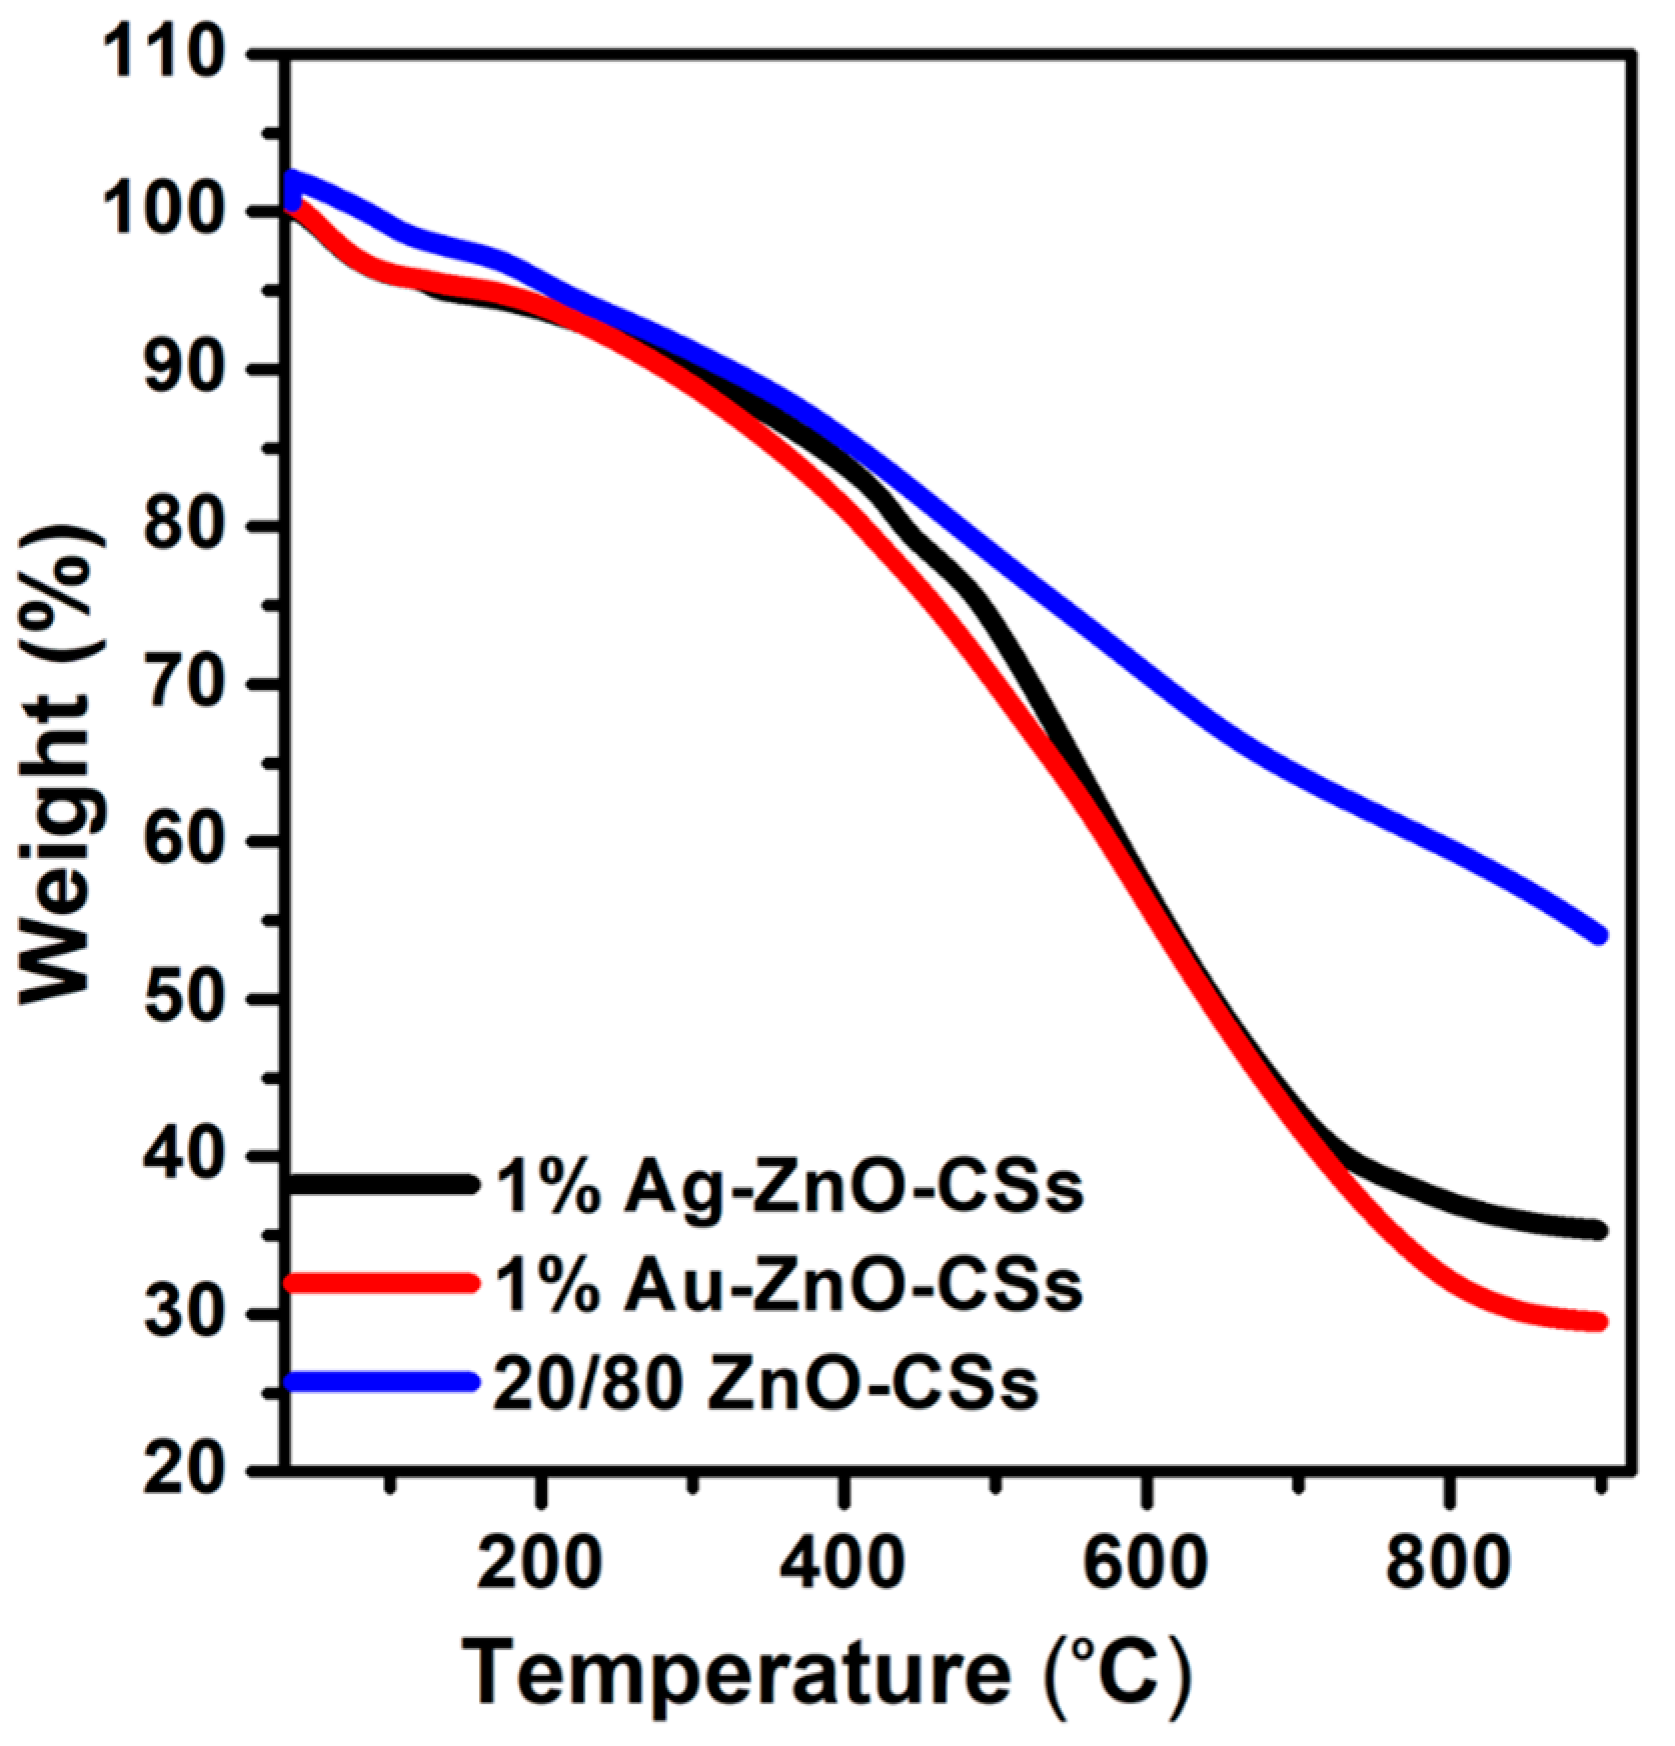
3.4. TGA Analysis
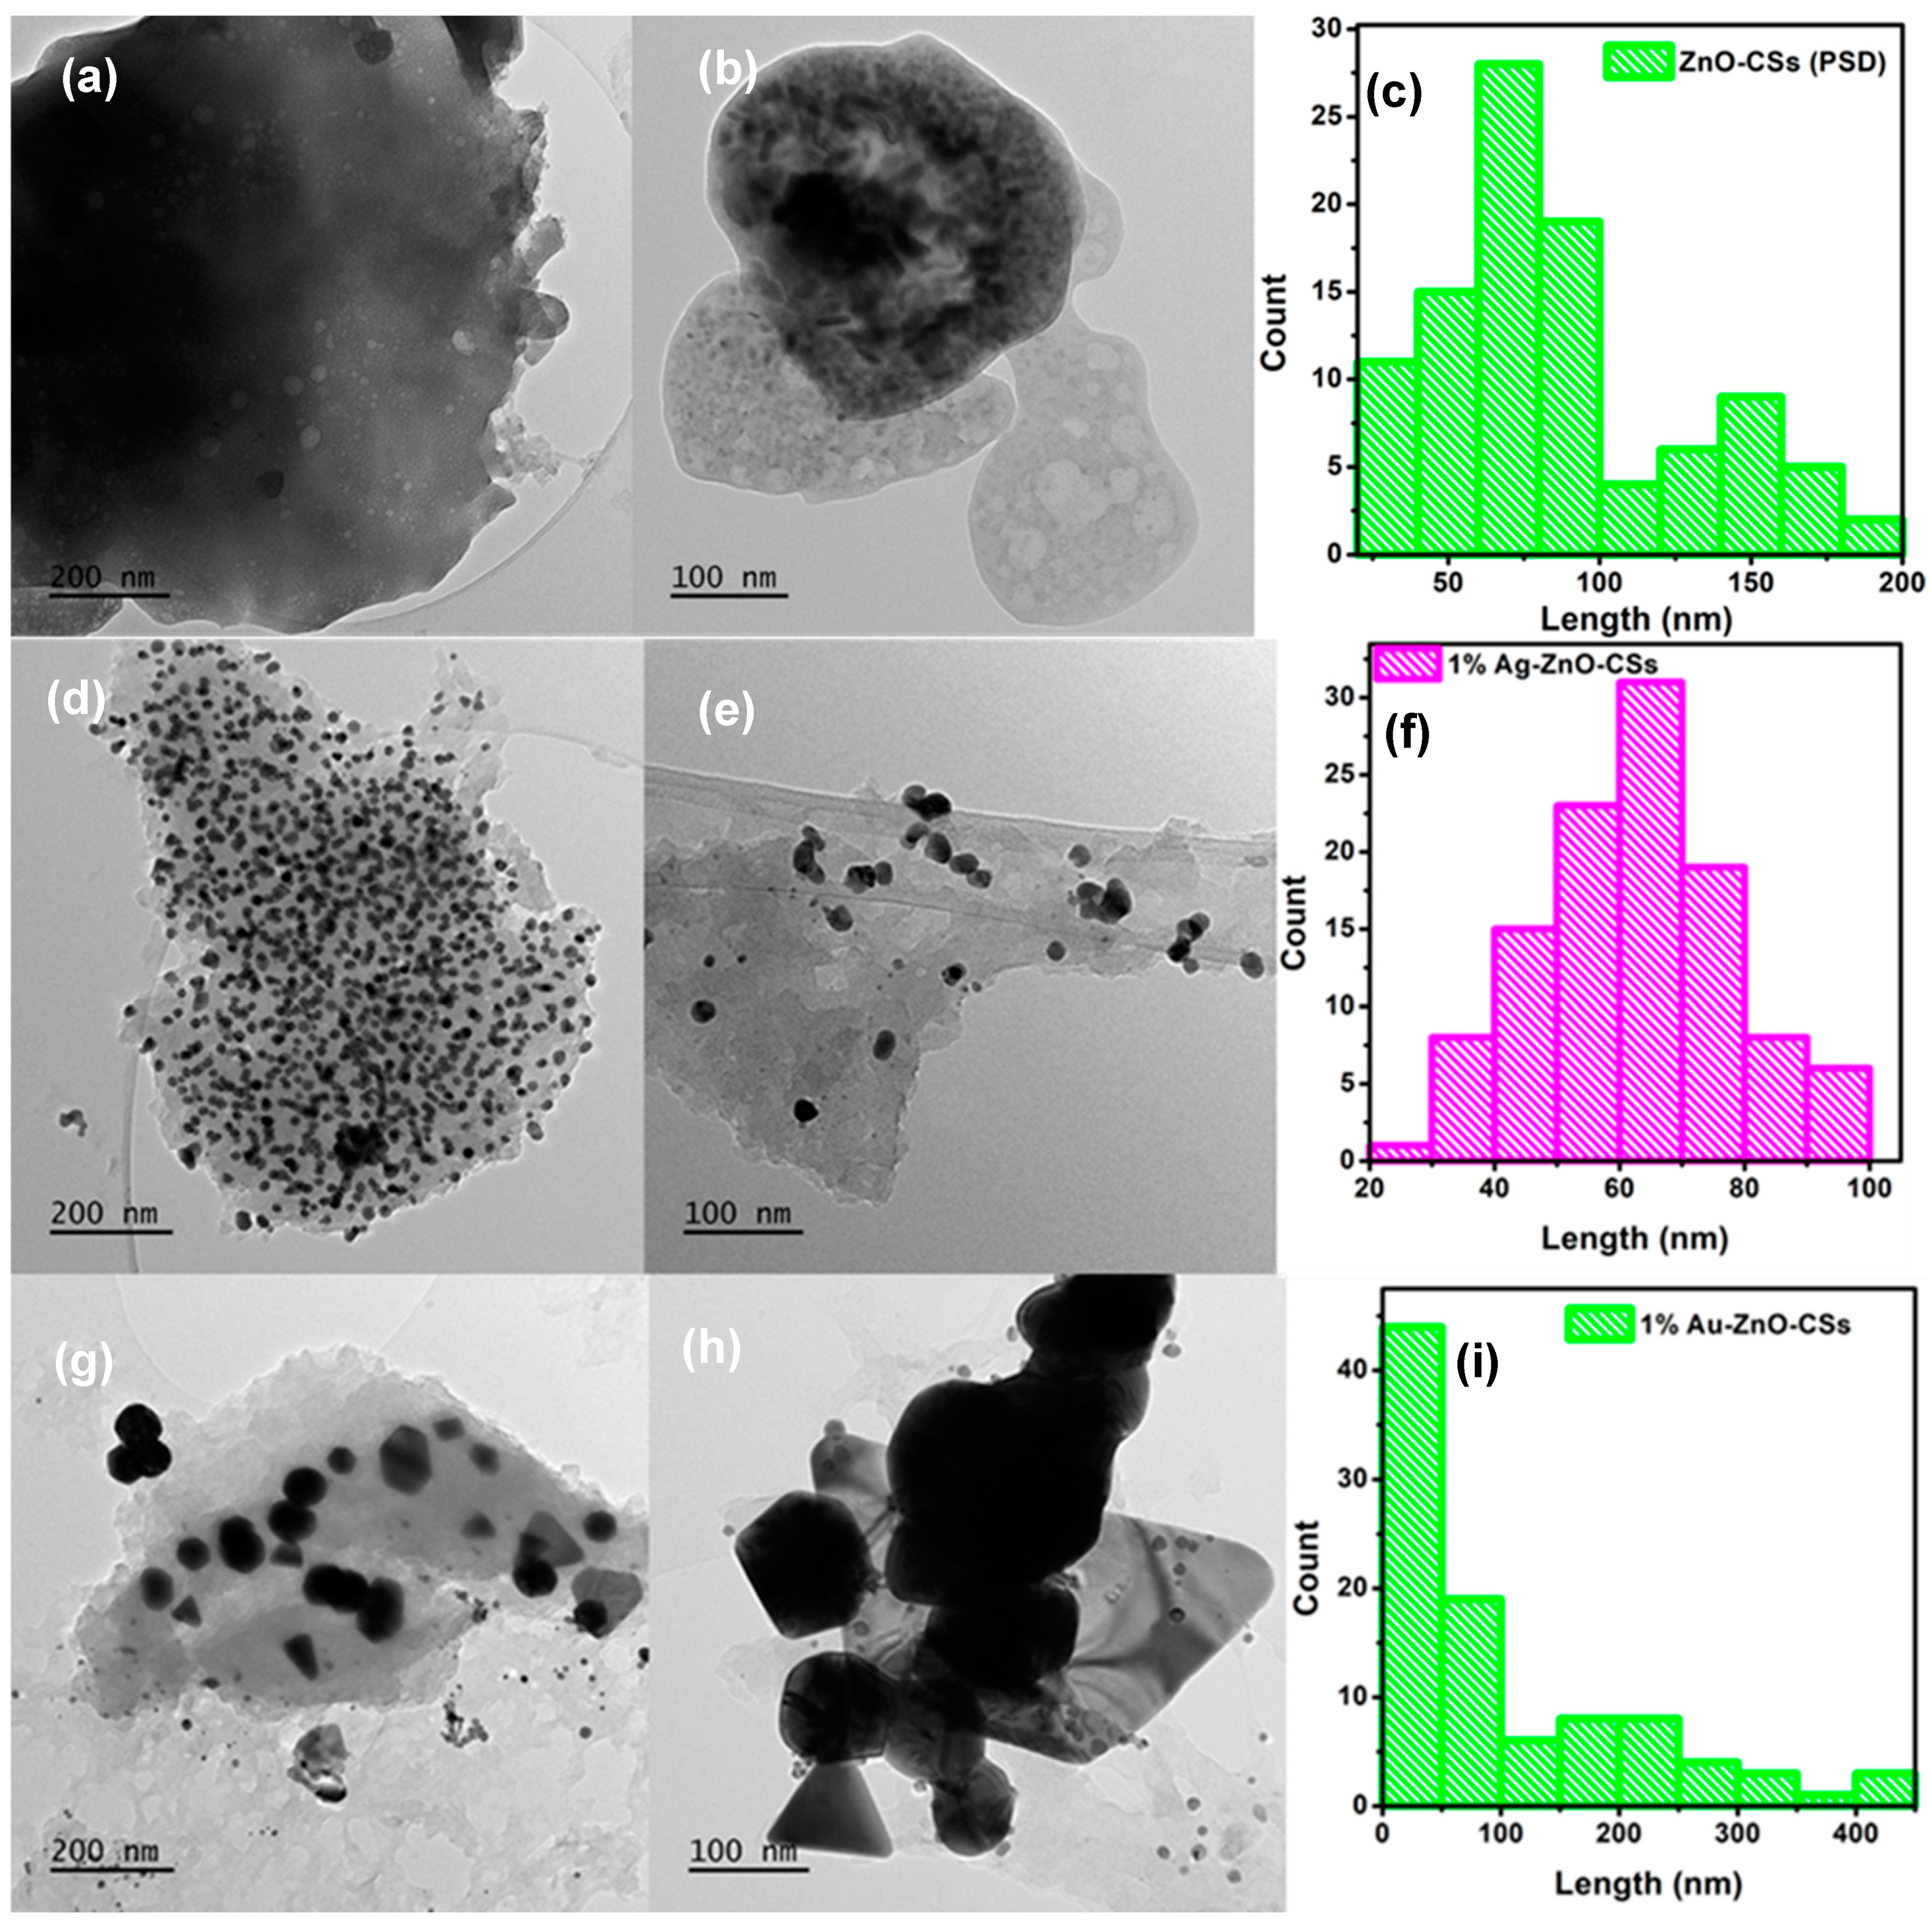
3.5. Morphological and Elemental Analysis of Nanocomposites
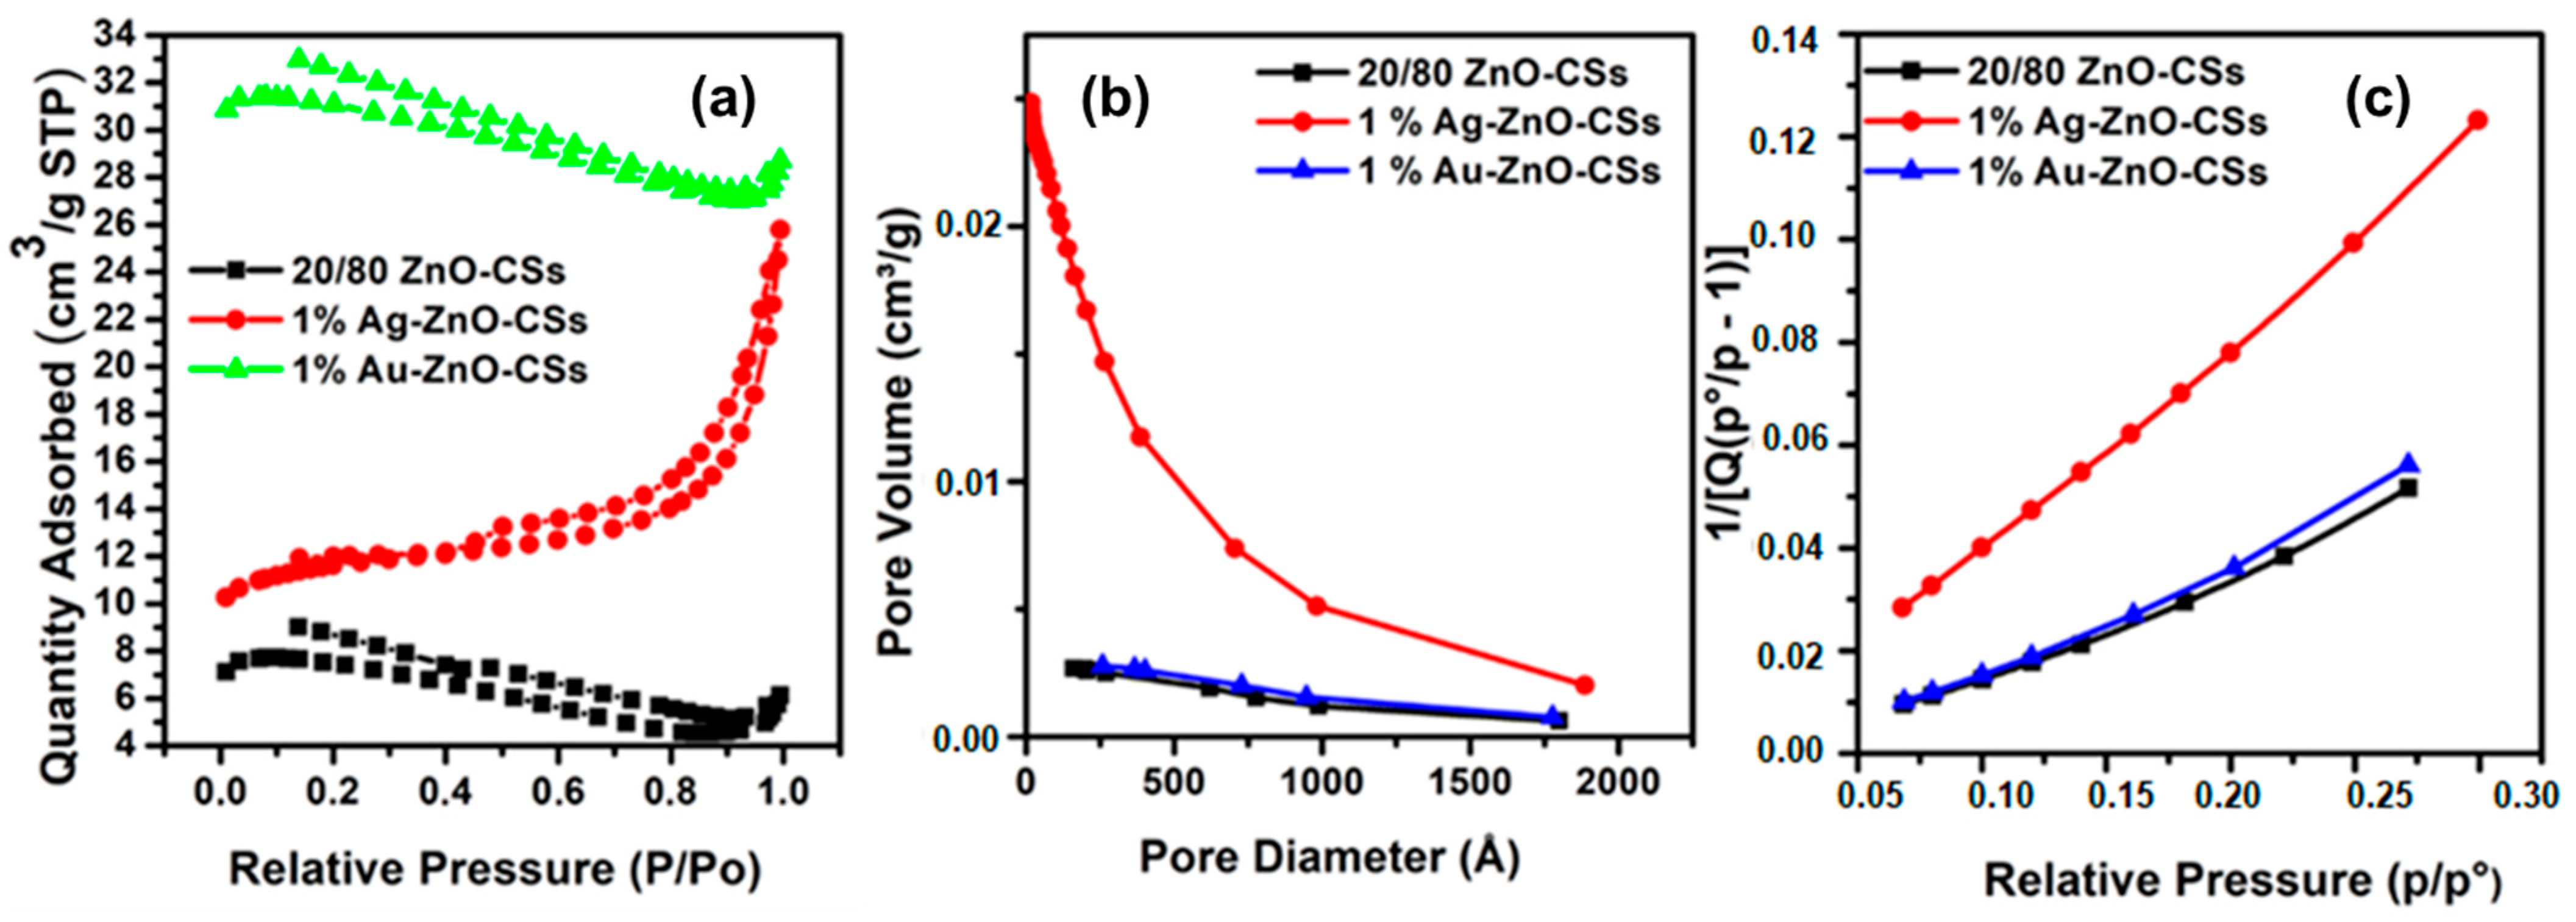
3.6. N2 Adsorption–Desorption Studies, BJH Pore Volume, and BET Surface Area
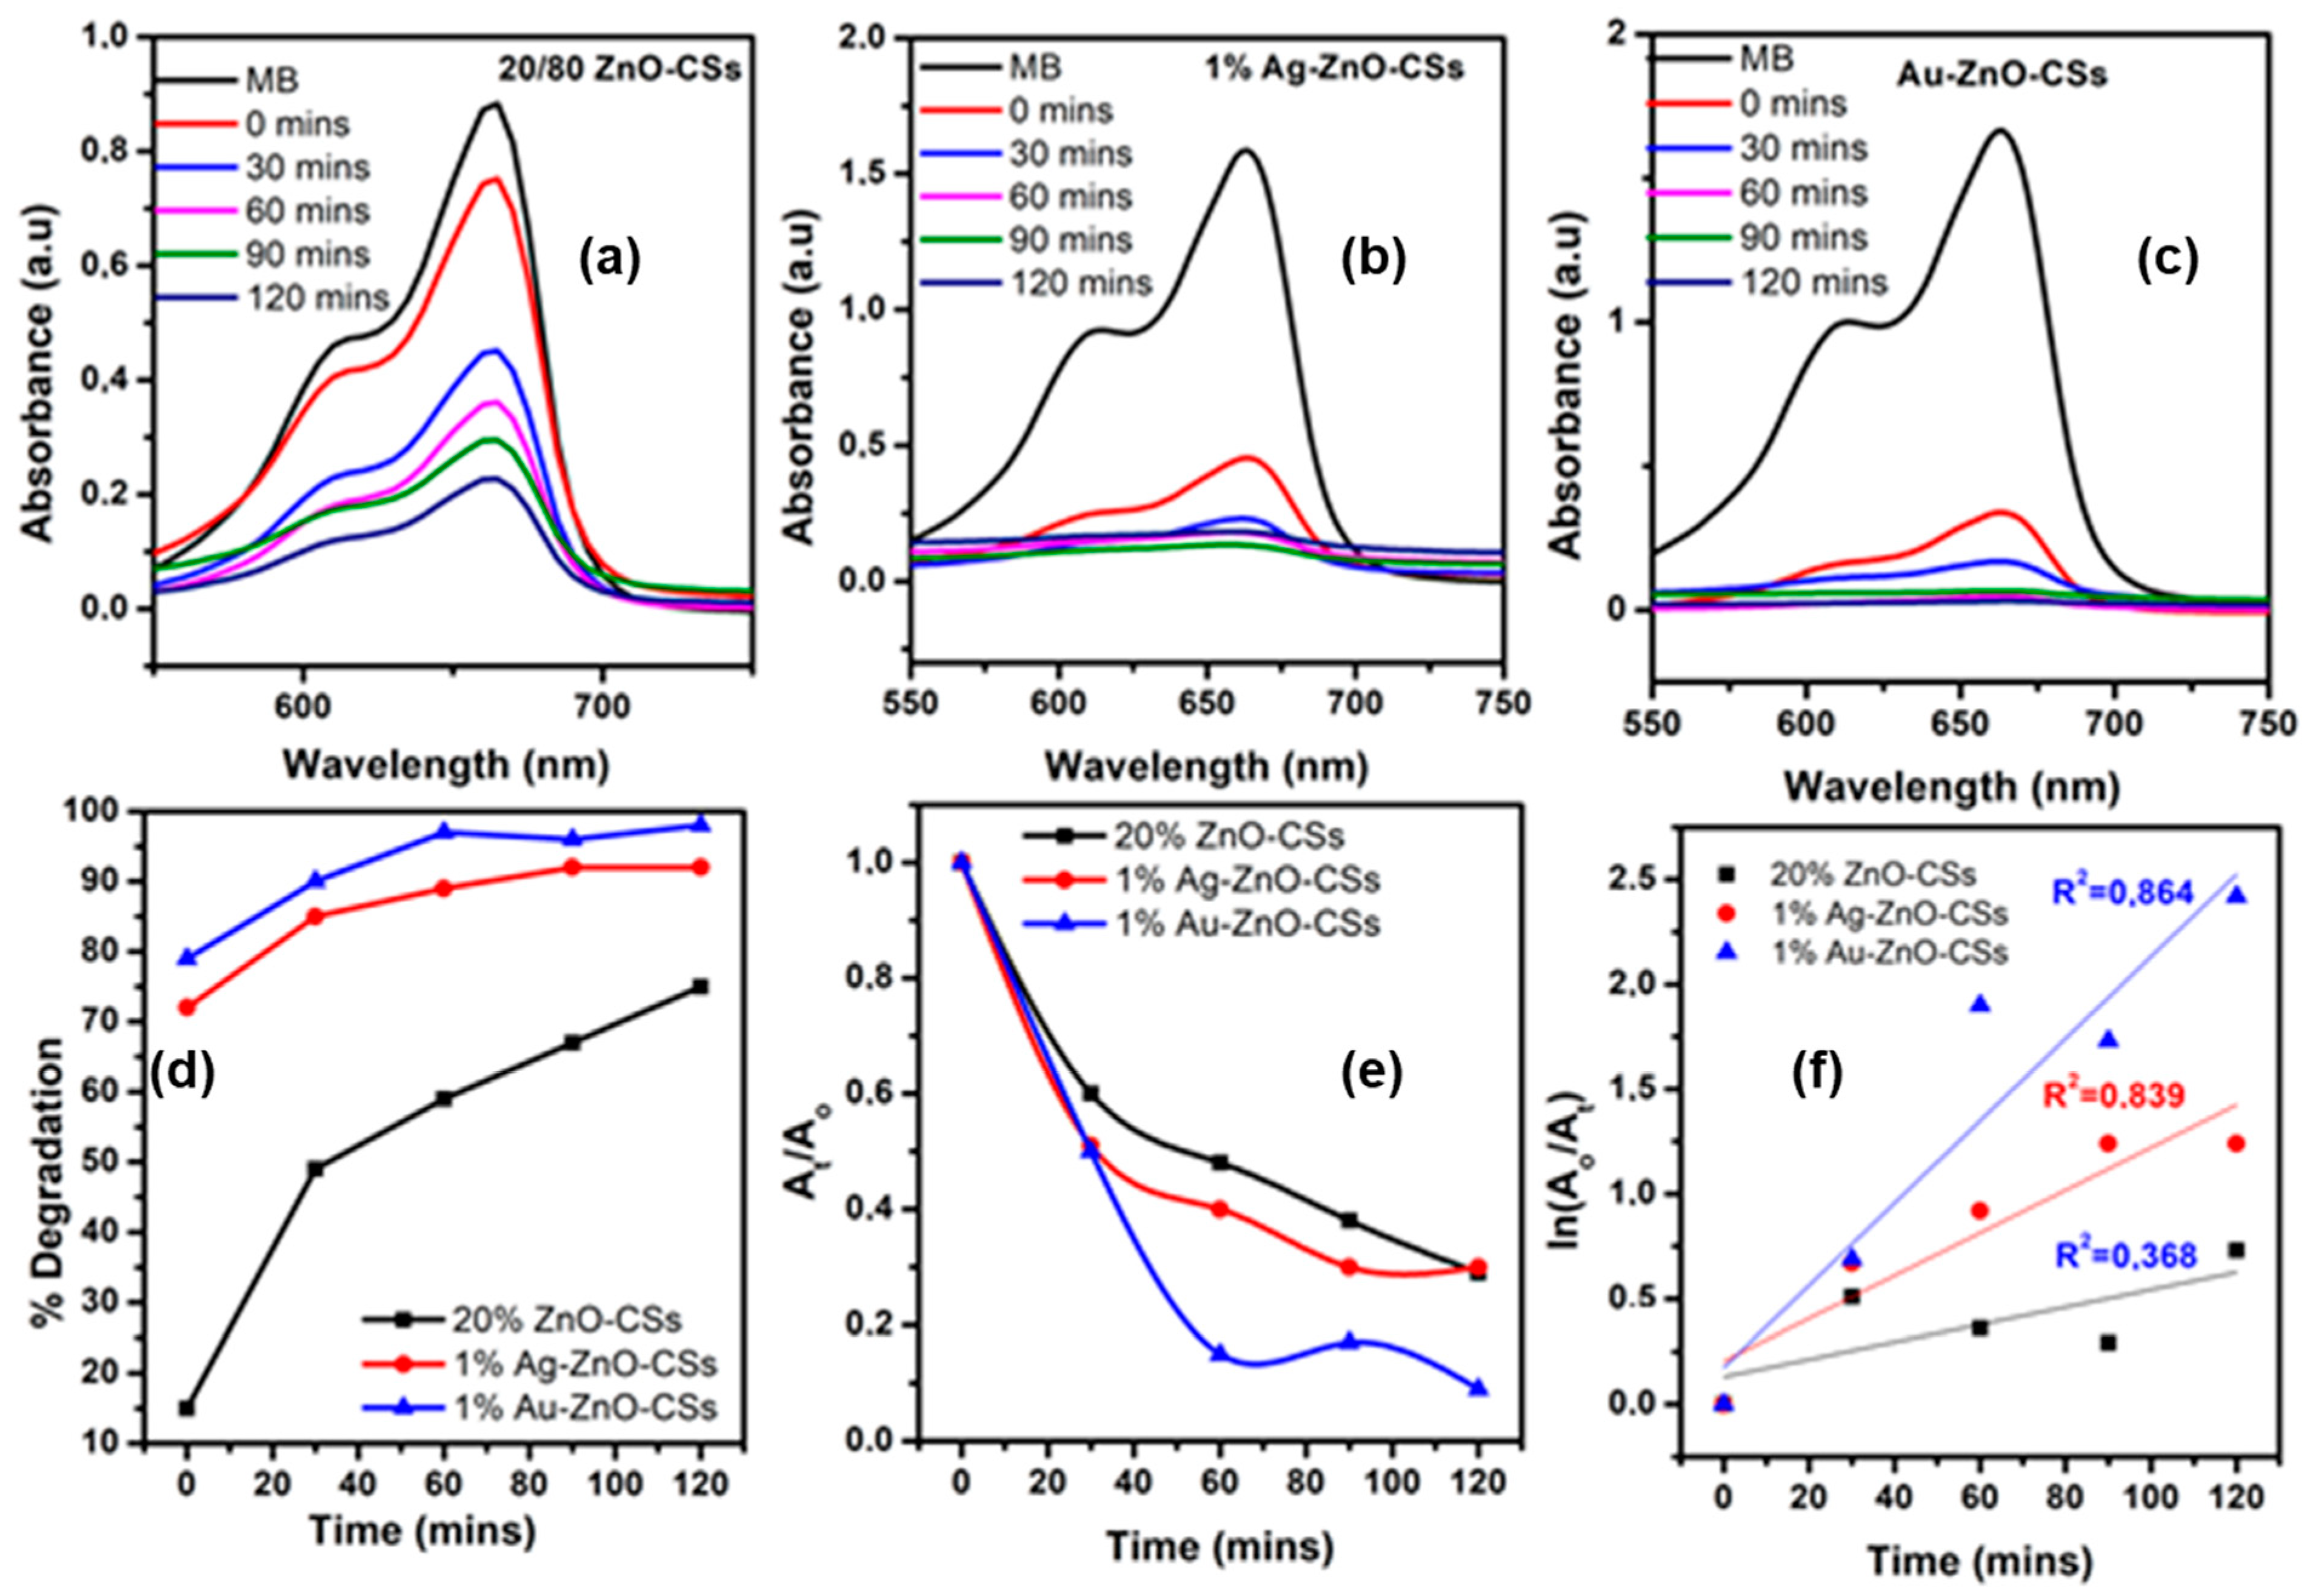
3.7. Photodegradation Studies
- Effects of various conditions on photocatalytic activity of MB
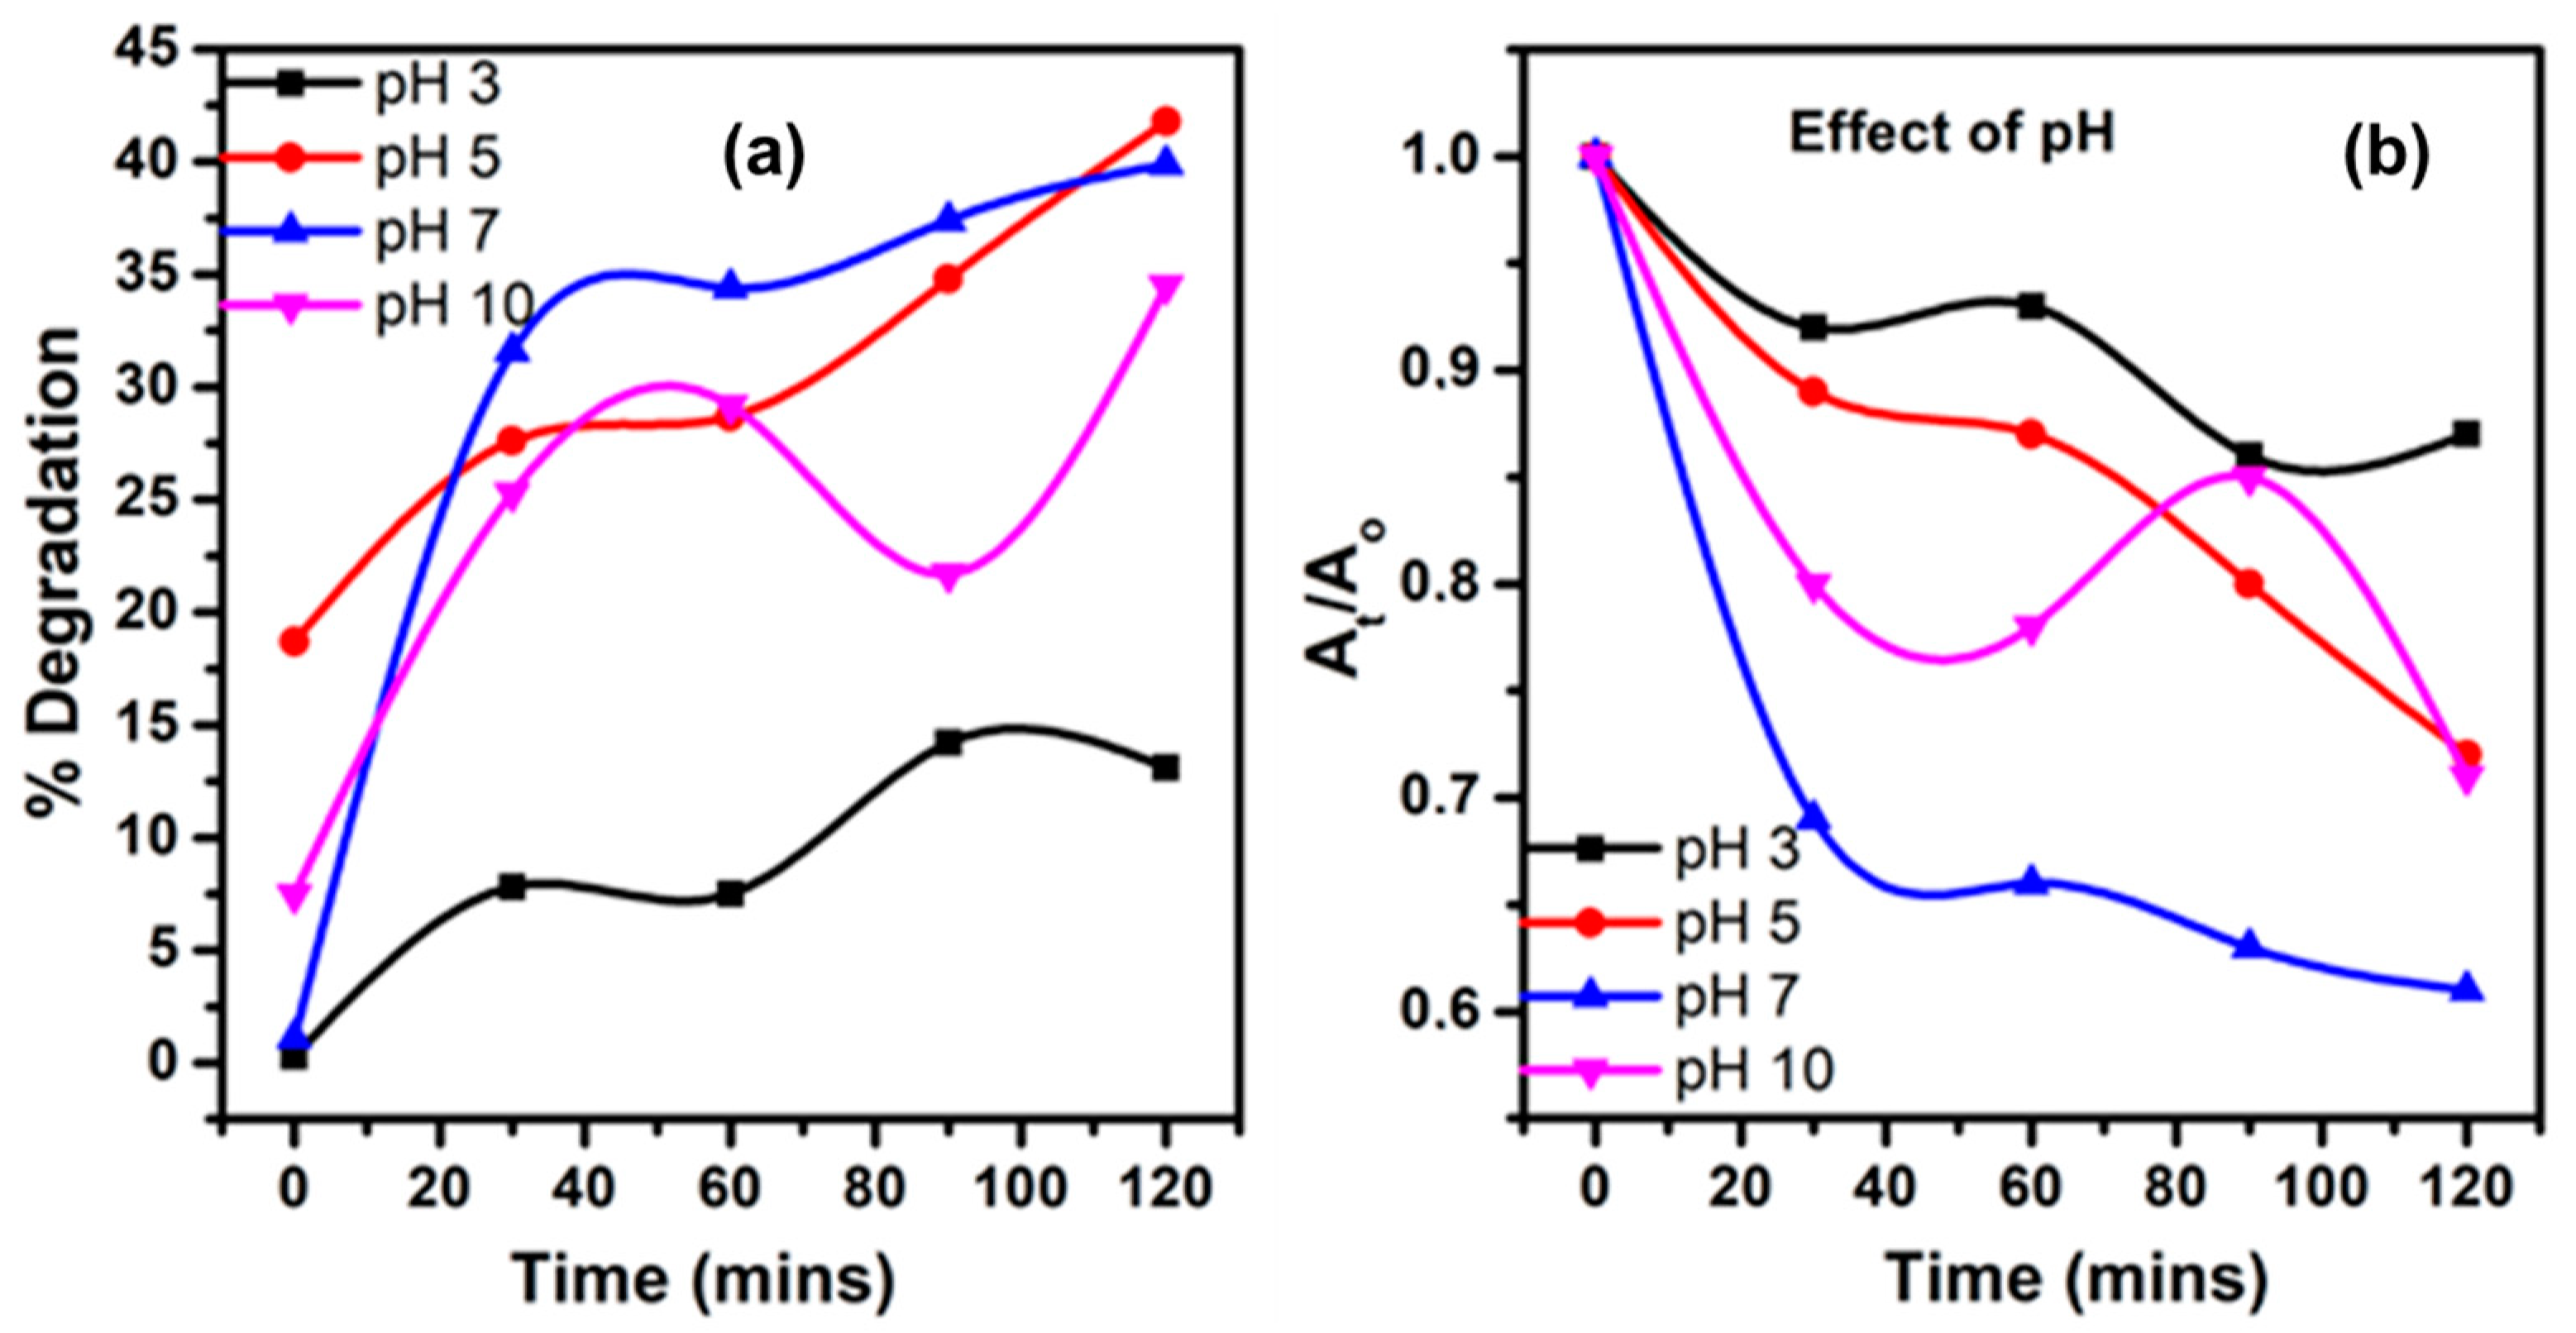
- pH Influence
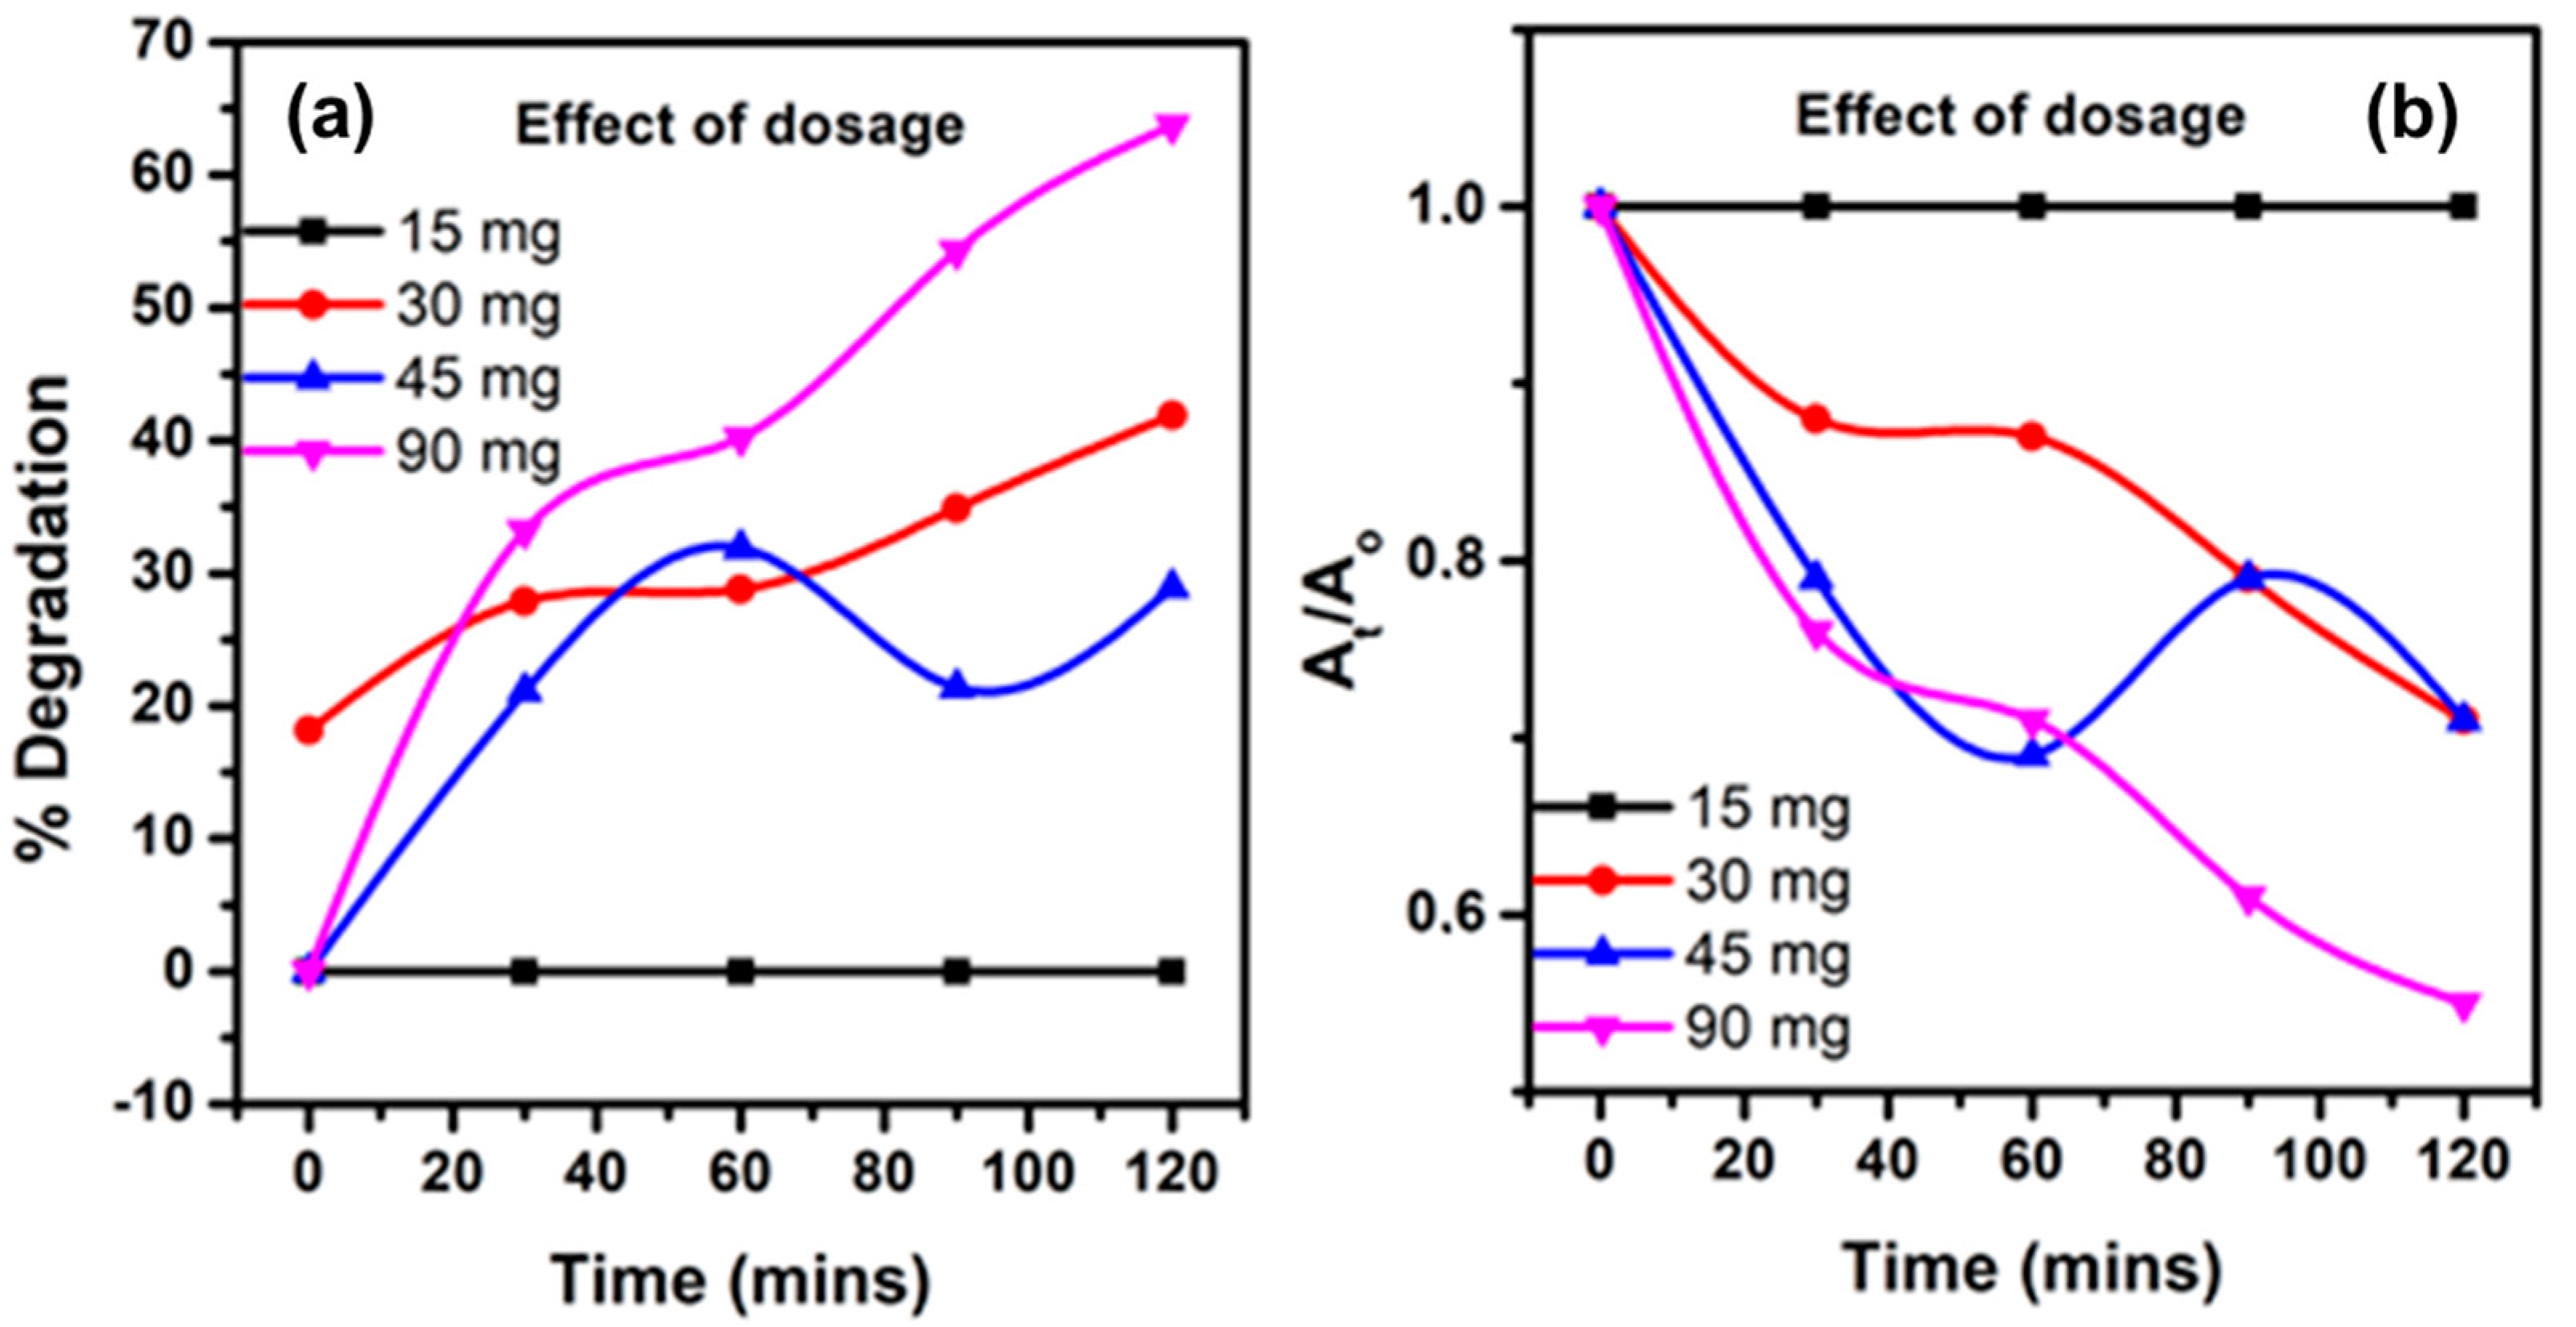
- Influence of ZnO–CSs dose
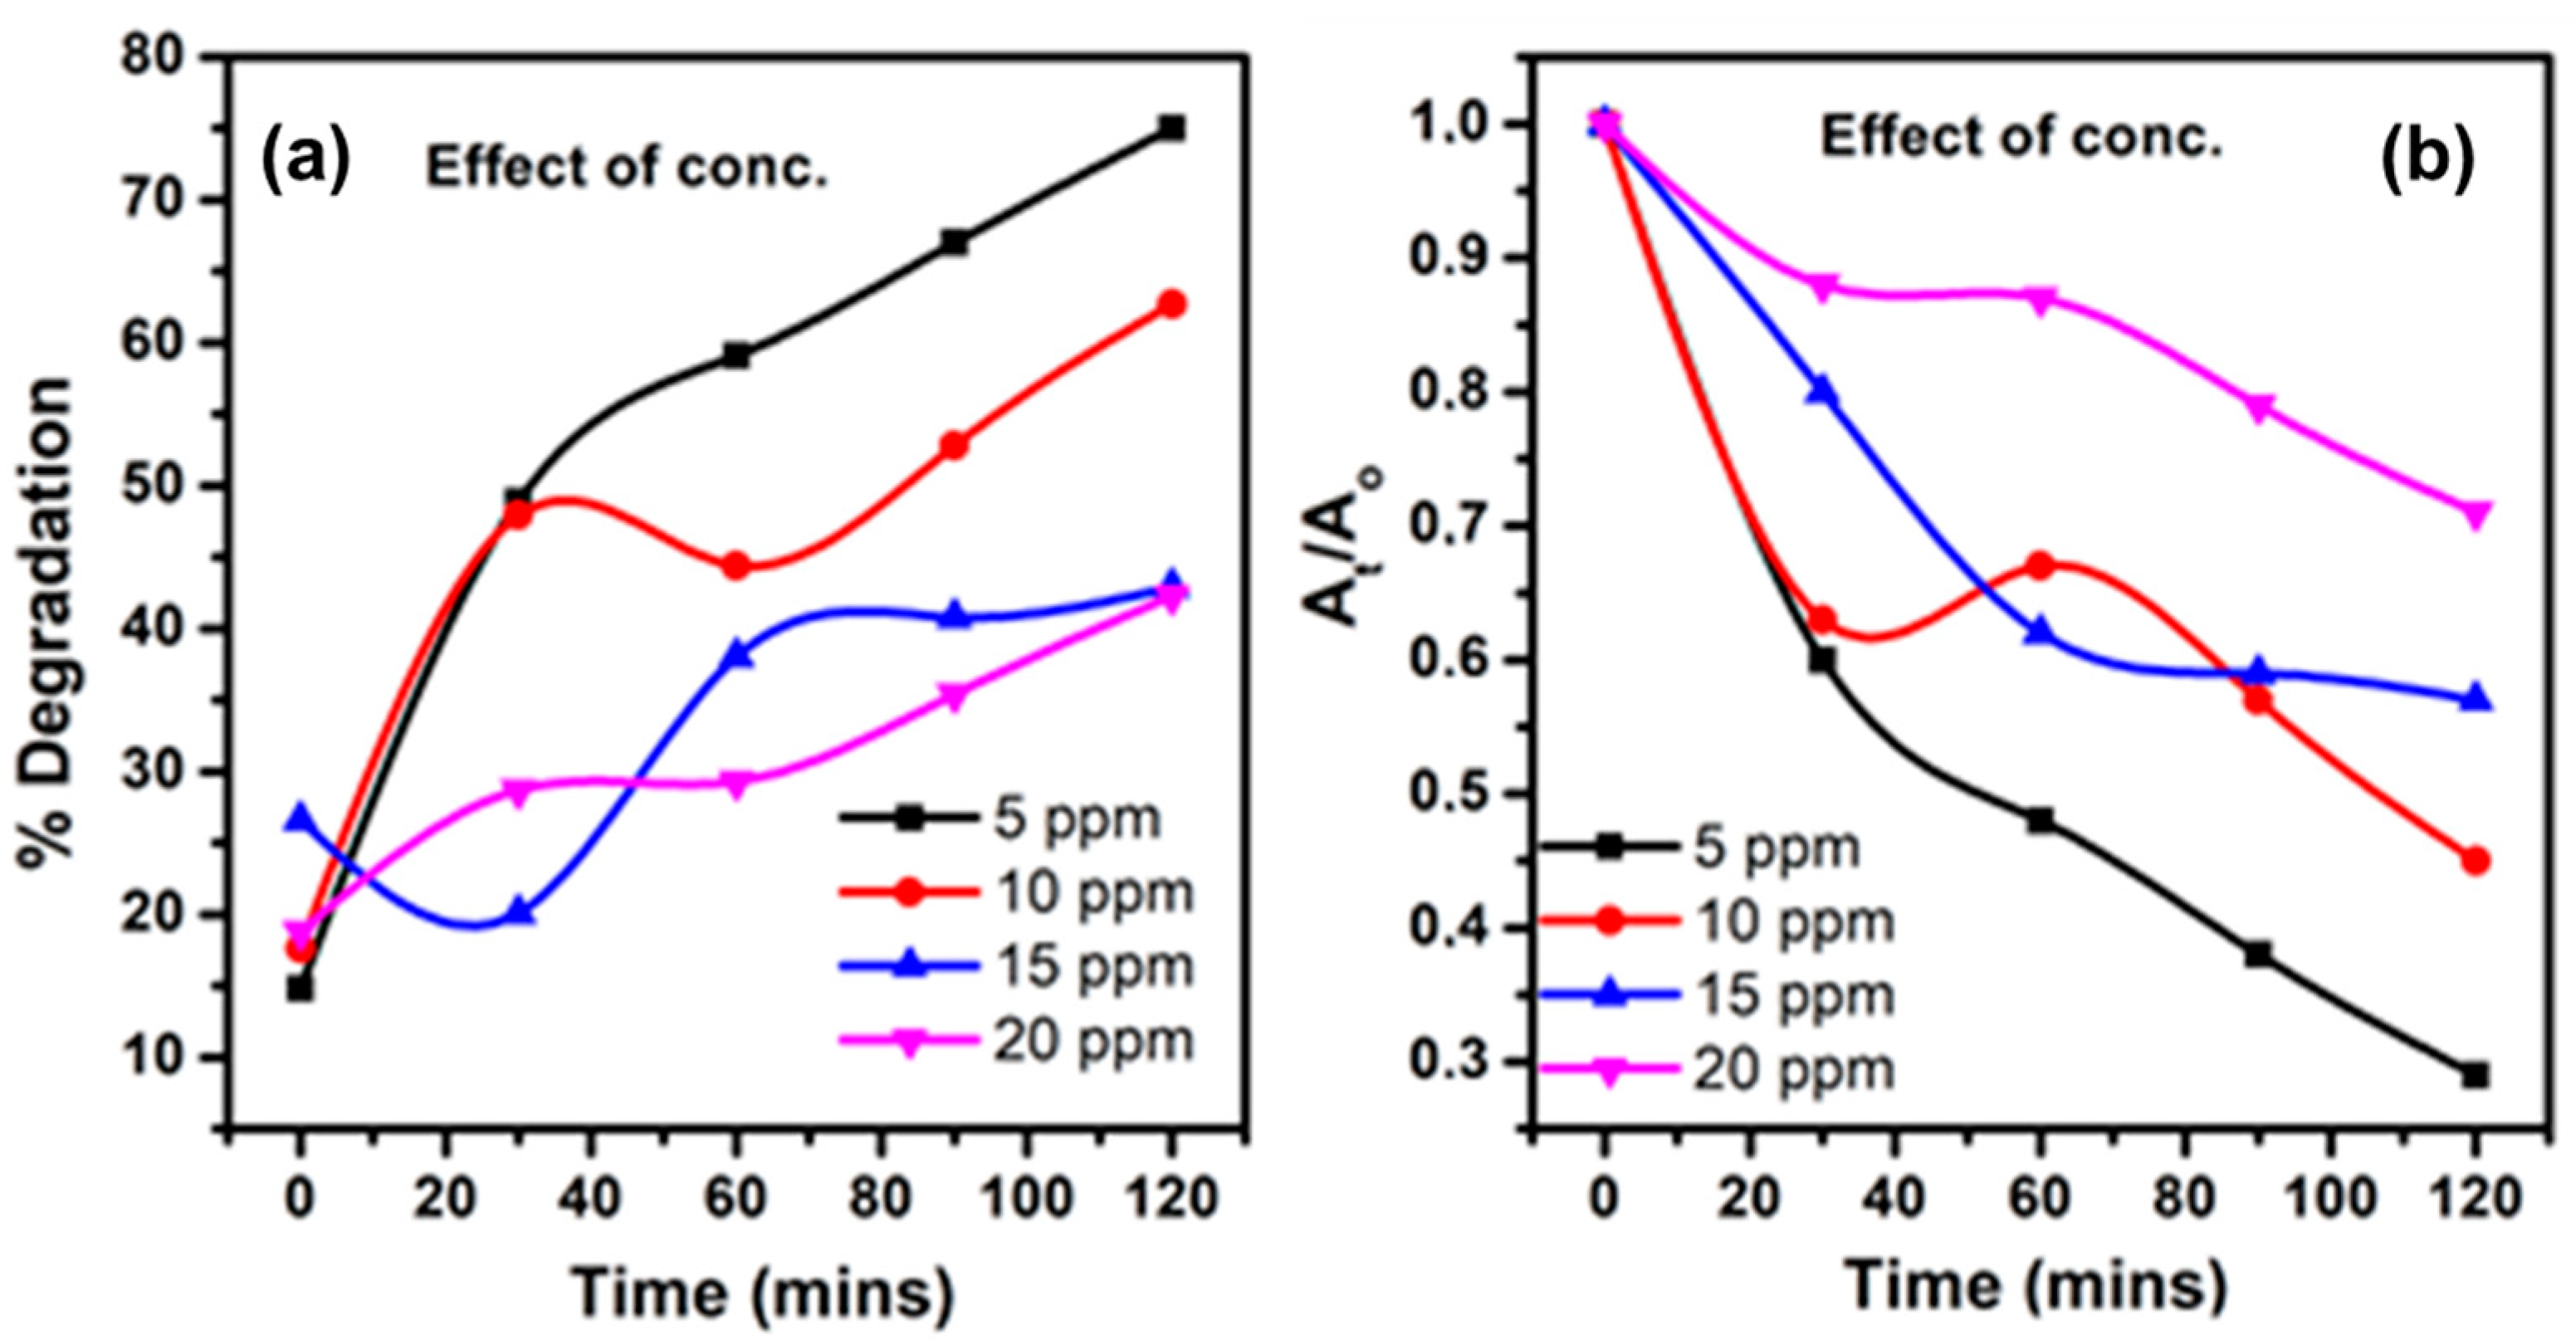
- Influence of MB Concentration
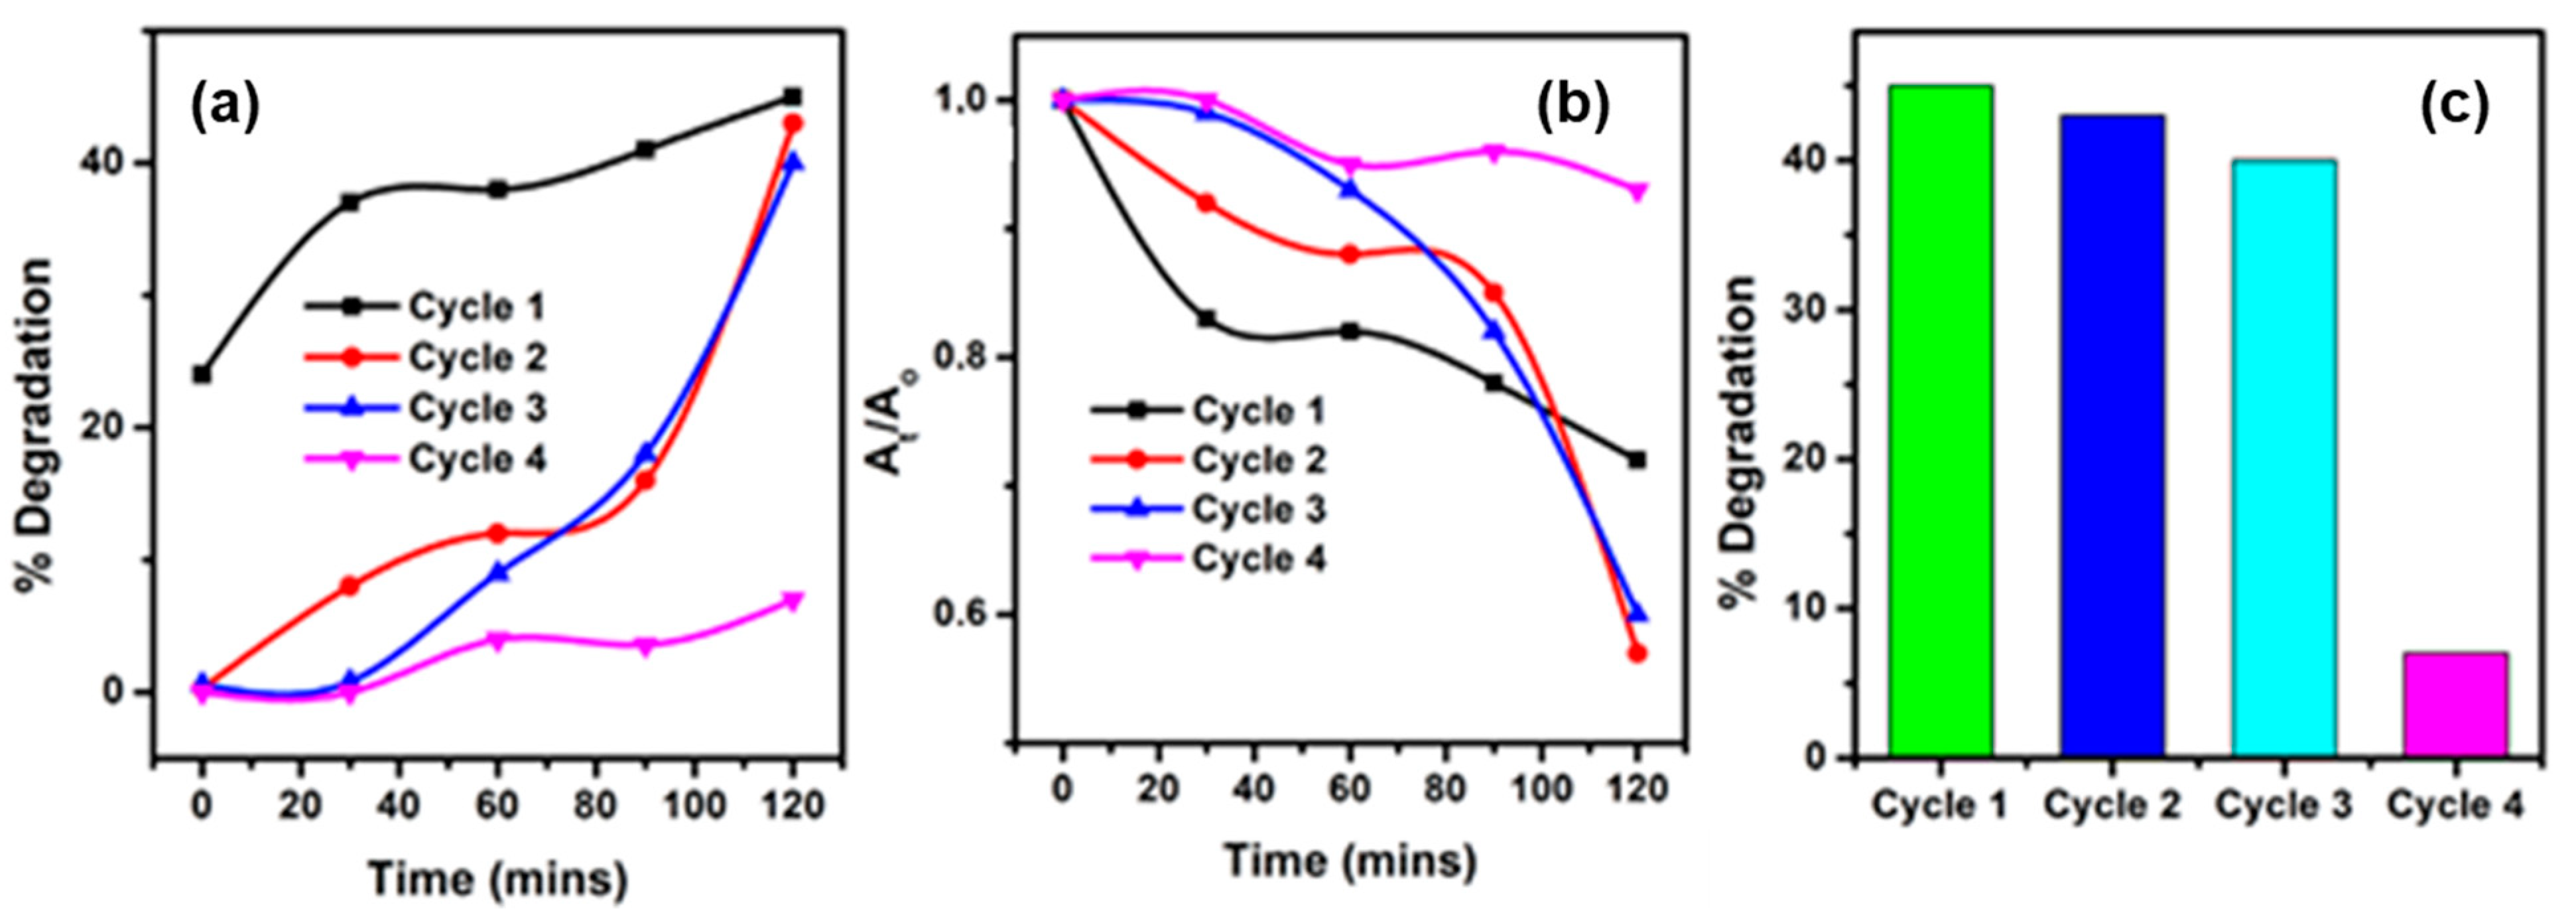
3.7.1. Reusability Studies
3.7.2. MB Trapping Studies
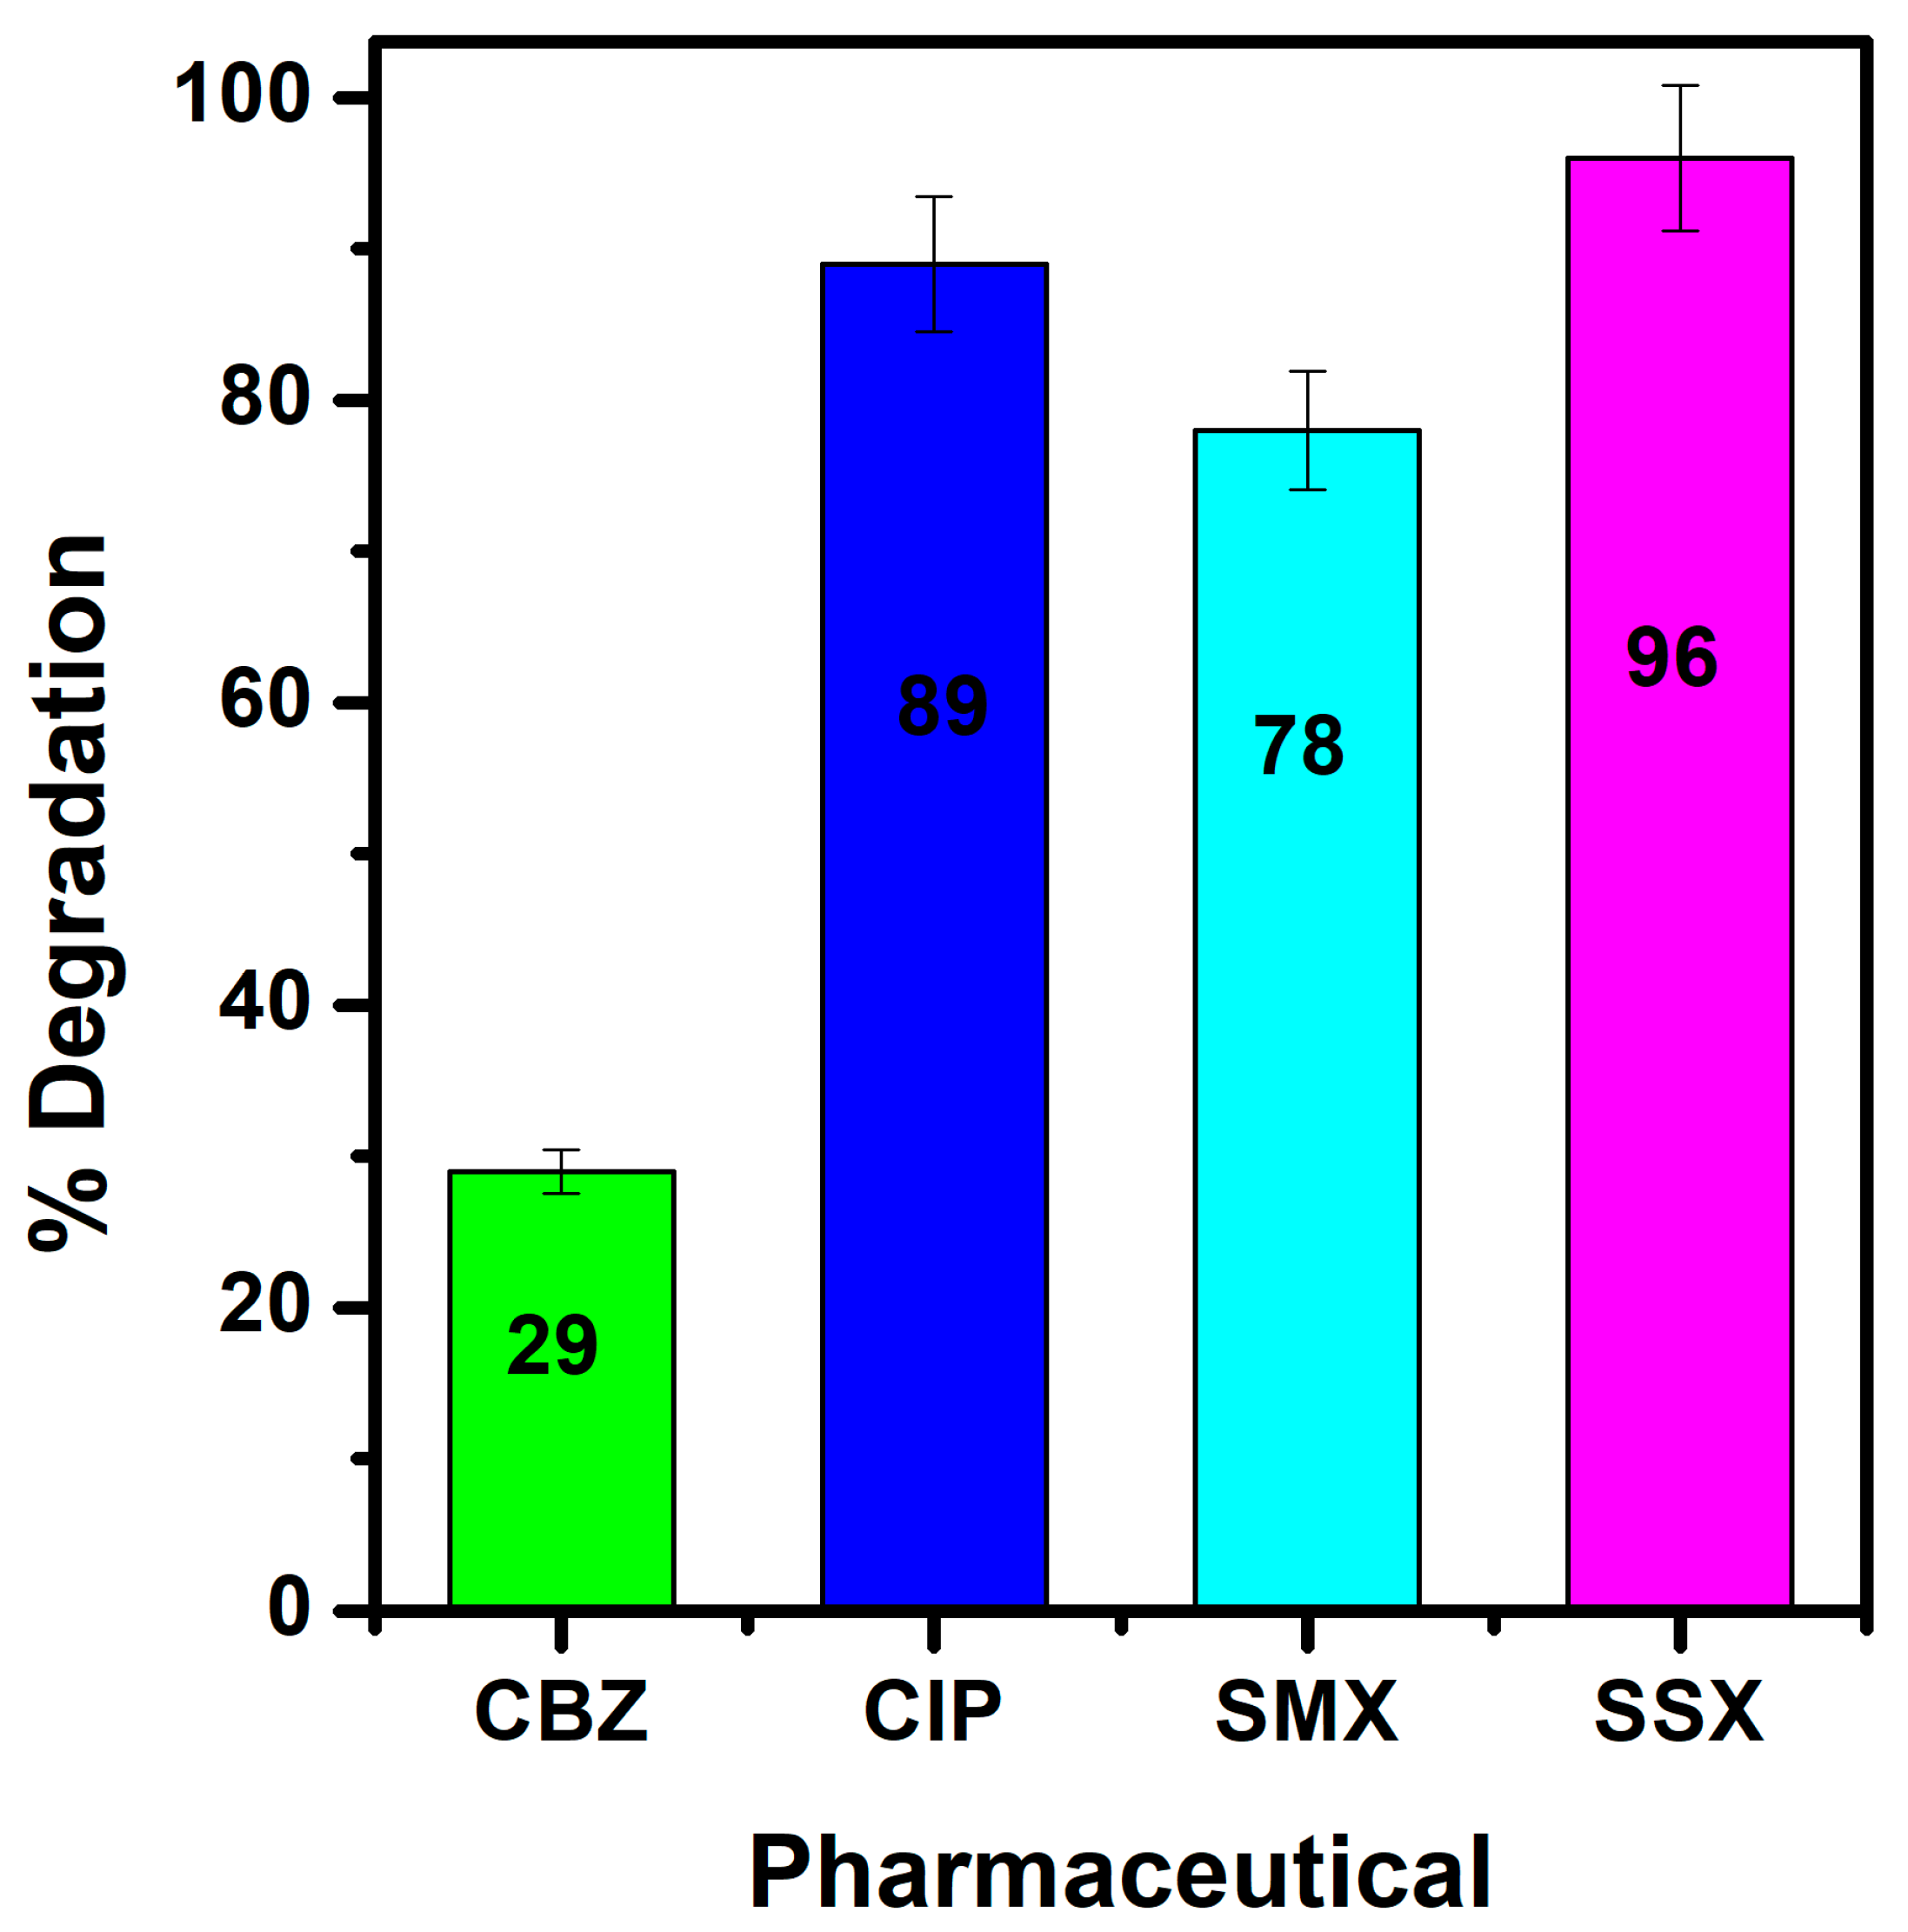
3.7.3. Photodegradation of Various Pharmaceuticals
4. Conclusions
Supplementary Materials
Author Contributions
Funding
Data Availability Statement
Acknowledgments
Conflicts of Interest
References
- Mallikarjunaswamy, C.; Lakshmi Ranganatha, V.; Ramu, R.; Udayabhanu; Nagaraju, G. Facile microwave-assisted green synthesis of ZnO nanoparticles: Application to photodegradation, antibacterial and antioxidant. J. Mater. Sci. Mater. Electron. 2020, 31, 1004–1021. [Google Scholar] [CrossRef]
- Otieno, F.A.; Ochieng, G.M. Water management tools as a means of averting a possible water scarcity in South Africa by the year 2025. Water SA 2004, 30, 120–124. [Google Scholar] [CrossRef]
- Arismendi, D.; Becerra-Herrera, M.; Cerrato, I.; Richter, P. Simultaneous determination of multiresidue and multiclass emerging contaminants in waters by rotating-disk sorptive extraction–derivatization-gas chromatography/mass spectrometry. Talanta 2019, 201, 480–489. [Google Scholar] [CrossRef]
- Basha, C.A.; Chithra, E.; Sripriyalakshmi, N.K. Electro-degradation and biological oxidation of non-biodegradable organic contaminants. Chem. Eng. J. 2009, 149, 25–34. [Google Scholar] [CrossRef]
- Suresh, D.; Nethravathi, P.C.; Rajanaika, H.; Nagabhushana, H.; Sharma, S.C. Green synthesis of multifunctional zinc oxide (ZnO) nanoparticles using Cassia fistula plant extract and their photodegradative, antioxidant and antibacterial activities. Mater. Sci. Semicond. Process. 2015, 31, 446–454. [Google Scholar] [CrossRef]
- Sharma, A.; Nagraik, R.; Sharma, S.; Sharma, G.; Pandey, S.; Azizov, S.; Chauhan, P.K.; Kumar, D. Green synthesis of ZnO nanoparticles using Ficus palmata: Antioxidant, antibacterial and antidiabetic studies. Results Chem. 2022, 4, 100509. [Google Scholar] [CrossRef]
- Arami, M.; Limaee, N.Y.; Mahmoodi, N.M.; Tabrizi, N.S. Removal of dyes from colored textile wastewater by orange peel adsorbent: Equilibrium and kinetic studies. J. Colloid Interface Sci. 2005, 288, 371–376. [Google Scholar] [CrossRef]
- Ratnamala, G.M.; Shetty, K.V.; Srinikethan, G. Removal of remazol brilliant blue dye from dye-contaminated water by adsorption using red mud: Equilibrium, kinetic, and thermodynamic studies. Water Air Soil Pollut. 2012, 223, 6187–6199. [Google Scholar] [CrossRef]
- Nasrollahzadeh, M.S.; Hadavifar, M.; Ghasemi, S.S.; Arab Chamjangali, M. Synthesis of ZnO nanostructure using activated carbon for photocatalytic degradation of methyl orange from aqueous solutions. Appl. Water Sci. 2018, 8, 104. [Google Scholar] [CrossRef]
- Kang, S.; Zhao, Y.; Wang, W.; Zhang, T.; Chen, T.; Yi, H.; Rao, F.; Song, S. Removal of methylene blue from water with montmorillonite nanosheets/chitosan hydrogels as adsorbent. Appl. Surf. Sci. 2018, 448, 203–211. [Google Scholar] [CrossRef]
- Uddin, M.T.; Islam, M.A.; Mahmud, S.; Rukanuzzaman, M. Adsorptive removal of methylene blue by tea waste. J. Hazard. Mater. 2009, 164, 53–60. [Google Scholar] [CrossRef] [PubMed]
- Bayomie, O.S.; Kandeel, H.; Shoeib, T.; Yang, H.; Youssef, N.; El-Sayed, M.M. Novel approach for effective removal of methylene blue dye from water using fava bean peel waste. Sci. Rep. 2020, 10, 7824. [Google Scholar] [CrossRef]
- Wainwright, M.; Crossley, K.B. Methylene blue-a therapeutic dye for all seasons? J. Chemother. 2002, 14, 431–443. [Google Scholar] [CrossRef] [PubMed]
- Mashkoor, F.; Nasar, A. Magsorbents: Potential candidates in wastewater treatment technology—A review on the removal of methylene blue dye. J. Magn. Magn. Mater. 2020, 500, 166408. [Google Scholar] [CrossRef]
- Noorimotlagh, Z.; Darvishi Cheshmeh Soltani, R.; Shams Khorramabadi, G.; Godini, H.; Almasian, M. Performance of wastewater sludge modified with zinc oxide nanoparticles in the removal of methylene blue from aqueous solutions. Desalination Water Treat. 2016, 57, 1684–1692. [Google Scholar] [CrossRef]
- Semeraro, P.; Comparelli, R. Application of photocatalysts in Environmental Chemistry. Catalysts 2024, 14, 174. [Google Scholar] [CrossRef]
- Mazeo, N.; Marzi, D.; Bavasso, I.; Piemonte, V. Removal of Methylene Blue from Wastewater by Waste Roots from the Arsenic-Hyperaccumulator Pteris vittata: Fixed Bed Adsorption Kinetics. Materials 2023, 16, 1450. [Google Scholar] [CrossRef]
- Calisto, V.; Domingues, M.R.M.; Erny, G.L.; Esteves, V.I. Direct photodegradation of carbamazepine followed by micellar electrokinetic chromatography and mass spectrometry. Water Res. 2011, 45, 1095–1104. [Google Scholar] [CrossRef]
- Lam, M.W.; Mabury, S.A. Photodegradation of the pharmaceuticals atorvastatin, carbamazepine, levofloxacin, and sulfamethoxazole in natural waters. Aquat. Sci. 2005, 67, 177–188. [Google Scholar] [CrossRef]
- Fu, H.; Gray, K.A. TiO2 (Core)/Crumpled Graphene Oxide (Shell) Nanocomposites Show Enhanced Photodegradation of Carbamazepine. Nanomaterials 2021, 11, 2087. [Google Scholar] [CrossRef]
- Daneshvar, N.; Aber, S.; Dorraji, M.S.; Khataee, A.R.; Rasoulifard, M.H. Photocatalytic degradation of the insecticide diazinon in the presence of prepared nanocrystalline ZnO powders under irradiation of UV-C light. Sep. Purif. Technol. 2007, 58, 91–98. [Google Scholar] [CrossRef]
- Sousa, H.R.; Silva, L.S.; Sousa, P.A.A.; Sousa, R.R.M.; Fonseca, M.G.; Osajima, J.A.; Silva-Filho, E.C. Evaluation of methylene blue removal by plasma activated palygorskites. J. Mater. Res. Technol. 2019, 8, 5432–5442. [Google Scholar] [CrossRef]
- Dutta, S.; Gupta, B.; Srivastava, S.K.; Gupta, A.K. Recent Advances on the removal of dyes from wastewater using various adsorbents: A critical review. Mater. Adv. 2021, 2, 4497–4531. [Google Scholar] [CrossRef]
- Lucas, M.S.; Peres, J.A. Decolorization of the azo dye Reactive Black 5 by Fenton and photo-Fenton oxidation. Dye. Pigment. 2006, 71, 236–244. [Google Scholar] [CrossRef]
- Saini, J.; Garg, V.K.; Gupta, R.K.; Kataria, N. Removal of Orange G and Rhodamine B dyes from aqueous system using hydrothermally synthesized zinc oxide loaded activated carbon (ZnO-AC). J. Environ. Chem. Eng. 2017, 5, 884–892. [Google Scholar] [CrossRef]
- Mills, A.; Davies, R.H.; Worsley, D. Water purification by semiconductor photocatalysis. Chem. Soc. Rev. 1993, 22, 417–425. [Google Scholar] [CrossRef]
- Rao, A.N.; Sivasankar, B.; Sadasivam, V. Kinetic study on the photocatalytic degradation of salicylic acid using ZnO catalyst. J. Hazard. Mater. 2009, 166, 1357–1361. [Google Scholar]
- Abellán, M.N.; Bayarri, B.; Giménez, J.; Costa, J.J.A.C.B.E. Photocatalytic degradation of sulfamethoxazole in aqueous suspension of TiO2. Appl. Catal. B Environ. 2007, 74, 233–241. [Google Scholar] [CrossRef]
- Mahlaule-Glory, L.M.; Hintsho-Mbita, N.C. Green Derived Zinc Oxide (ZnO) for the Degradation of Dyes from Wastewater and Their Antimicrobial Activity: A Review. Catalysts 2022, 12, 833. [Google Scholar] [CrossRef]
- Quek, J.A.; Sin, J.C.; Lam, S.M.; Mohamed, A.R.; Zeng, H. Bioinspired green synthesis of ZnO structures with enhanced visible light photocatalytic activity. J. Mater. Sci. Mater. Electron. 2020, 31, 1144–1158. [Google Scholar] [CrossRef]
- Kumar, V.; Gohain, M.; Som, S.; Kumar, V.; Bezuindenhoudt, B.C.B.; Swart, H.C. Microwave assisted synthesis of ZnO nanoparticles for lighting and dye removal application. Phys. B Condens. Matter 2016, 480, 36–41. [Google Scholar] [CrossRef]
- Li, Y.; Xie, W.; Hu, X.; Shen, G.; Zhou, X.; Xiang, Y.; Zhao, X.; Fang, P. Comparison of dye photodegradation and its coupling with light-to-electricity conversion over TiO2 and ZnO. Langmuir 2010, 26, 591–597. [Google Scholar] [CrossRef]
- Ibrahim, J.; Ajaegbu, V.C.; Egharevba, H.O. Pharmacognostic and phytochemical analysis of Commelina benghalensis L. Ethnobot. Leafl. 2010, 2010, 7. [Google Scholar]
- Grover, I.S.; Prajapat, R.C.; Singh, S.; Pal, B. Highly photoactive Au-TiO2 nanowires for improved photo-degradation of propiconazole fungicide under UV/sunlight irradiation. Sol. Energy 2017, 144, 612–618. [Google Scholar] [CrossRef]
- Deshmukh, A.A.; Mhlanga, S.D.; Coville, N.J. Carbon spheres. Mater. Sci. Eng. R Rep. 2010, 70, 1–28. [Google Scholar] [CrossRef]
- Iijima, S. Helical microtubules of graphitic carbon. Nature 1991, 354, 56–58. [Google Scholar] [CrossRef]
- Arumugam, M.; Manikandan, D.B.; Dhandapani, E.; Sridhar, A.; Balakrishnan, K.; Markandan, M.; Ramasamy, T. Green synthesis of zinc oxide nanoparticles (ZnO NPs) using Syzygium cumini: Potential multifaceted applications on antioxidants, cytotoxic and as nanonutrient for the growth of Sesamum indicum. Environ. Technol. Innov. 2021, 23, 101653. [Google Scholar] [CrossRef]
- Anitha, J.; Selvakumar, R.; Hema, S.; Murugan, K.; Premkumar, T. Facile green synthesis of nano-sized ZnO using leaf extract of Morinda tinctoria: MCF-7 cell cycle arrest, antiproliferation, and apoptosis studies. J. Ind. Eng. Chem. 2022, 105, 520–529. [Google Scholar] [CrossRef]
- Alshabanat, M.N.; AL-Anazy, M.M. An experimental study of photocatalytic degradation of congo red using polymer nanocomposite films. J. Chem. 2018, 2018, 9651850. [Google Scholar] [CrossRef]
- Niu, B.; Wu, D.; Wang, J.; Wang, L.; Zhang, W. Salt-sealing-pyrolysis derived Ag/ZnO@ C hollow structures towards efficient photo-oxidation of organic dye and water-born bacteria. Appl. Surf. Sci. 2020, 528, 146965. [Google Scholar] [CrossRef]
- Chen, P.K.; Lee, G.J.; Davies, S.H.; Masten, S.J.; Amutha, R.; Wu, J.J. Hydrothermal synthesis of coral-like Au/ZnO catalyst and photocatalytic degradation of Orange II dye. Mater. Res. Bull. 2013, 48, 2375–2382. [Google Scholar] [CrossRef]
- Ngoepe, N.M.; Mathipa, M.M.; Hintsho-Mbita, N.C. Biosynthesis of titanium dioxide nanoparticles for the photodegradation of dyes and removal of bacteria. Optik 2020, 224, 165728. [Google Scholar] [CrossRef]
- Munyai, S.; Mahlaule-Glory, L.M.; Hintsho-Mbita, N.C. Green Synthesis of Zinc Sulphide (ZnS) nanostructures using S.frutescence plant extract for photocatalytic degradation of dyes and antibiotics. Mater. Res. Express 2022, 9, 015001. [Google Scholar] [CrossRef]
- Zwane, B.N.; Mabuba, N.; Orimolade, B.O.; Koiki, B.A.; Arotiba, O.A. Photocatalytic degradation of ciprofloxacin and sulfamethoxazole on a carbon nanodot doped tungsten trioxide: Degradation product study. React. Kinet. Mech. Catal. 2020, 131, 453–470. [Google Scholar] [CrossRef]
- Bashir, B.; Shaheen, W.; Asghar, M.; Warsi, M.F.; Khan, M.A.; Haider, S.; Shakir, I.; Shahid, M. Copper doped manganese ferrites nanoparticles anchored on graphene nano-sheets for high performance energy storage applications. J. Alloys Compd. 2017, 695, 881–887. [Google Scholar] [CrossRef]
- Atarod, M.; Nasrollahzadeh, M.; Sajadi, S.M. Euphorbia heterophylla leaf extract mediated green synthesis of Ag/TiO2 nanocomposite and investigation of its excellent catalytic activity for reduction of variety of dyes in water. J. Colloid Interface Sci. 2016, 462, 272–279. [Google Scholar] [CrossRef]
- Bopape, D.A.; Motaung, D.E.; Hintsho-Mbita, N.C. Green synthesis of ZnO: Effect of plant concentration on the morphology, optical properties and and photodegradation of ‘dyes and antibiotics in wastewater. Optik 2022, 251, 168459. [Google Scholar] [CrossRef]
- Nagaraju, G.; Prashanth, S.A.; Shastri, M.; Yathish, K.V.; Anupama, C.; Rangappa, D. Electrochemical heavy metal detection, photocatalytic, photoluminescence, biodiesel production and antibacterial activities of Ag-ZnO nanomaterial. Mater. Res. Bull. 2017, 94, 54–63. [Google Scholar] [CrossRef]
- Dou, P.; Tan, F.; Wang, W.; Sarreshteh, A.; Qiao, X.; Qiu, X.; Chen, J. One-step microwave-assisted synthesis of Ag/ZnO/graphene nanocomposites with enhanced photocatalytic activity. J. Photochem. Photobiol. A Chem. 2015, 302, 17–22. [Google Scholar] [CrossRef]
- Rajbongshi, B.M.; Ramchiary, A.; Jha, B.M.; Samdarshi, S.K. Synthesis and characterization of plasmonic visible active Ag/ZnO photocatalyst. J. Mater. Sci. Mater. Electron. 2014, 25, 2969–2973. [Google Scholar] [CrossRef]
- Sapkota, K.P.; Lee, I.; Hanif, M.A.; Islam, M.A.; Hahn, J.R. Solar-light-driven efficient ZnO–single-walled carbon nanotube photocatalyst for the degradation of a persistent water pollutant organic dye. Catalysts 2019, 9, 498. [Google Scholar] [CrossRef]
- Yu, Z.; Zhang, L.; Wang, X.; He, D.; Suo, H.; Zhao, C. Fabrication of ZnO/Carbon quantum dots composite sensor for detecting NO gas. Sensors 2020, 20, 4961. [Google Scholar] [CrossRef] [PubMed]
- Du, Y.; Zhao, F.; Liu, L.; Gao, Y.; Xing, L.; Li, Q.; Fu, C.; Zhong, Z.; Zhang, X. Improvement of bond strength between ZnO nanorods and carbon fibers using magnetron sputtered ZnO films as the interphase. CrystEngComm 2017, 19, 868–875. [Google Scholar] [CrossRef]
- Saoud, K.; Alsoubaihi, R.; Bensalah, N.; Bora, T.; Bertino, M.; Dutta, J. Synthesis of supported silver nano-spheres on zinc oxide nanorods for visible light photocatalytic applications. Mater. Res. Bull. 2015, 63, 134–140. [Google Scholar] [CrossRef]
- Xu, S.; Zhang, H.; Qi, L.; Xiao, L. Conductometric acetone vapor sensor based on the use of gold-doped three-dimensional hierarchical porous zinc oxide microspheres. Microchim. Acta 2019, 186, 342. [Google Scholar] [CrossRef]
- Yang, S.; Wang, L.; Yan, Y.; Yang, L.; Li, X.; Lu, Z.; Zhai, H.; Han, D.; Huo, P. Two hybrid Au-ZnO heterostructures with different hierarchical structures: Towards highly efficient photocatalysts. Sci. Rep. 2019, 9, 16863. [Google Scholar] [CrossRef]
- Majhi, S.M.; Rai, P.; Yu, Y.T. Facile approach to synthesize Au@ ZnO core–shell nanoparticles and their application for highly sensitive and selective gas sensors. ACS Appl. Mater. Interfaces 2015, 7, 9462–9468. [Google Scholar] [CrossRef]
- Kadam, A.N.; Bhopate, D.P.; Kondalkar, V.V.; Majhi, S.M.; Bathula, C.D.; Tran, A.V.; Lee, S.W. Facile synthesis of Ag-ZnO core–shell nanostructures with enhanced photocatalytic activity. J. Ind. Eng. Chem. 2018, 61, 78–86. [Google Scholar] [CrossRef]
- Kotlhao, K.; Mtunzi, F.M.; Pakade, V.; Laloo, N.; Ejidike, I.P.; Modise, S.J.; Moutloali, R.M.; Klink, M.J. Enhancing the photocatalytic degradation of selected chlorophenols using Ag/zno nanocomposites. MRS Adv. 2018, 3, 2129–2136. [Google Scholar] [CrossRef]
- Patil, S.S.; Patil, R.H.; Kale, S.B.; Tamboli, M.S.; Ambekar, J.D.; Gade, W.N.; Kolekar, S.S.; Kale, B.B. Nanostructured microspheres of silver@ zinc oxide: An excellent impeder of bacterial growth and biofilm. J. Nanoparticle Res. 2014, 16, 1–11. [Google Scholar] [CrossRef]
- Tran Thi, V.H.; Pham, T.N.; Pham, T.T.; Le, M.C. Synergistic adsorption and photocatalytic activity under visible irradiation using Ag-ZnO/GO nanoparticles derived at low temperature. J. Chem. 2019, 2019, 2979517. [Google Scholar] [CrossRef]
- Bopape, D.A.; Mathobela, S.; Matinise, N.; Motaung, D.E.; Hintsho-Mbita, N.C. Green synthesis of CuO-TiO2 for the degradation of organic pollutants: Physical, Optical and Electrochemical Properties. Catalyst 2023, 13, 163. [Google Scholar] [CrossRef]
- Fageria, P.; Gangopadhyay, S.; Pande, S. Synthesis of ZnO/Au and ZnO/Ag nanoparticles and their photocatalytic application using UV and visible light. Rsc Adv. 2014, 4, 24962–24972. [Google Scholar] [CrossRef]
- Gogurla, N.; Sinha, A.K.; Santra, S.; Manna, S.; Ray, S.K. Multifunctional Au-ZnO plasmonic nanostructures for enhanced UV photodetector and room temperature NO sensing devices. Sci. Rep. 2014, 4, 6483. [Google Scholar] [CrossRef]
- Liu, L.; Yang, H.; Ren, X.; Tang, J.; Li, Y.; Zhang, X.; Cheng, Z. Au–ZnO hybrid nanoparticles exhibiting strong charge-transfer-induced SERS for recyclable SERS-active substrates. Nanoscale 2015, 7, 5147–5151. [Google Scholar] [CrossRef] [PubMed]
- Chang, Q.Q.; Cui, Y.W.; Zhang, H.H.; Chang, F.; Zhu, B.H.; Yu, S.Y. C-doped ZnO decorated with Au nanoparticles constructed from the metal–organic framework ZIF-8 for photodegradation of organic dyes. RSC Adv. 2019, 9, 12689–12695. [Google Scholar] [CrossRef]
- Poinern, G.E.J.; Brundavanam, S.; Shah, M.; Laava, I.; Fawcett, D. Photothermal response of CVD synthesized carbon (nano) spheres/aqueous nanofluids for potential application in direct solar absorption collectors: A preliminary investigation. Nanotechnol. Sci. Appl. 2012, 5, 49. [Google Scholar] [CrossRef] [PubMed]
- Kayani, Z.N.; Manzoor, F.; Zafar, A.; Mahmood, M.; Rasheed, M.; Anwar, M. Impact of Ag doping on structural, optical, morphological, optical and photoluminescent properties of ZnO nanoparticles. Opt. Quantum Electron. 2020, 52, 1–18. [Google Scholar] [CrossRef]
- Langa, C.; Hintsho-Mbita, N.C. Plant and bacteria mediated synthesis of TiO2 NPs for dye degradation in water. A review. Chem. Phys. Imp. 2023, 7, 100293. [Google Scholar] [CrossRef]
- Ramesan, M.T.; Siji, C.; Kalaprasad, G.; Bahuleyan, B.K.; Al-Maghrabi, M.A. Effect of silver doped zinc oxide as nanofiller for the development of biopolymer nanocomposites from chitin and cashew gum. J. Polym. Environ. 2018, 26, 2983–2991. [Google Scholar] [CrossRef]
- Kaur, A.; Ibhadon, A.O.; Kansal, S.K. Photocatalytic degradation of ketorolac tromethamine (KTC) using Ag-doped ZnO microplates. J. Mater. Sci. 2017, 52, 5256–5267. [Google Scholar] [CrossRef]
- Bonyani, M.; Zebarjad, S.M.; Janghorban, K.; Kim, J.Y.; Kim, H.W.; Kim, S.S. Au-Decorated Polyaniline-ZnO Electrospun Composite Nanofiber Gas Sensors with Enhanced Response to NO2 Gas. Chemosensors 2022, 10, 388. [Google Scholar] [CrossRef]
- Patil, S.S.; Mali, M.G.; Tamboli, M.S.; Patil, D.R.; Kulkarni, M.V.; Yoon, H.; Kim, H.; Al-Deyab, S.S.; Yoon, S.S.; Kolekar, S.S.; et al. Green approach for hierarchical nanostructured Ag-ZnO and their photocatalytic performance under sunlight. Catal. Today 2016, 260, 126–134. [Google Scholar] [CrossRef]
- Kot, M.; Wojcieszak, R.; Janiszewska, E.; Pietrowski, M.; Zieliński, M. Effect of modification of amorphous silica with ammonium agents on the physicochemical properties and hydrogenation activity of Ir/SiO2 catalysts. Materials 2021, 14, 968. [Google Scholar] [CrossRef] [PubMed]
- Cychosz, K.A.; Thommes, M. Progress in the physisorption characterization of nanoporous gas storage materials. Engineering 2018, 4, 559–566. [Google Scholar] [CrossRef]
- Tijani, J.O.; Fatoba, O.O.; Totito, T.C.; Roos, W.D.; Petrik, L. Synthesis and characterization of carbon doped TiO2 photocatalysts supported on stainless steel mesh by sol-gel method. Carbon Lett. 2017, 22, 48–59. [Google Scholar]
- Pandey, M.; Singh, M.; Wasnik, K.; Gupta, S.; Patra, S.; Gupta, P.S.; Pareek, D.; Chaitanya, N.S.N.; Maity, S.; Reddy, A.B.; et al. Targeted and enhanced antimicrobial inhibition of mesoporous ZnO–Ag2O/Ag, ZnO–CuO, and ZnO–SnO2 composite nanoparticles. ACS Omega 2021, 6, 31615–31631. [Google Scholar] [CrossRef]
- Wang, Z.; Jiang, X.; Pan, M.; Shi, Y. Nano-scale pore structure and its multi-fractal characteristics of tight sandstone by n2 adsorption/desorption analyses: A case study of shihezi formation from the sulige gas filed, ordos basin, china. Minerals 2020, 10, 377. [Google Scholar] [CrossRef]
- Sillanpää, M.; Matilainen, A. NOM removal by advanced oxidation processes. In Natural Organic Matter in Water: Characterization and Treatment Methods; Butterworth-Heinemann: Oxford, UK, 2015; pp. 159–211. [Google Scholar]
- Jiang, C.; Zhang, W.; Zou, G.; Yu, W.; Qian, Y. Precursor-induced hydrothermal synthesis of flowerlike cupped-end microrod bundles of ZnO. J. Phys. Chem. B 2005, 109, 1361–1363. [Google Scholar] [CrossRef]
- Ahmad, M.; Ahmad, I.; Ahmed, E.; Akhtar, M.S.; Khalid, N.R. Facile and inexpensive synthesis of Ag doped ZnO/CNTs composite: Study on the efficient photocatalytic activity and photocatalytic mechanism. J. Mol. Liq. 2020, 311, 113326. [Google Scholar] [CrossRef]
- Pawinrat, P.; Mekasuwandumrong, O.; Panpranot, J. Synthesis of Au–ZnO and Pt–ZnO nanocomposites by one-step flame spray pyrolysis and its application for photocatalytic degradation of dyes. Catal. Commun. 2009, 10, 1380–1385. [Google Scholar] [CrossRef]
- Zhao, X.; Su, S.; Wu, G.; Li, C.; Qin, Z.; Lou, X.; Zhou, J. Facile synthesis of the flower-like ternary heterostructure of Ag/ZnO encapsulating carbon spheres with enhanced photocatalytic performance. Appl. Surf. Sci. 2017, 406, 254–264. [Google Scholar] [CrossRef]
- Sobana, N.; Muruganandam, M.; Swaminathan, M. Characterization of AC–ZnO catalyst and its photocatalytic activity on 4-acetylphenol degradation. Catal. Commun. 2008, 9, 262–268. [Google Scholar] [CrossRef]
- Sharma, J.; Sharma, S.; Soni, V. Classification and impact of synthetic textile dyes on Aquatic Flora: A review. Reg. Stud. Mar. Sci. 2021, 45, 101802. [Google Scholar] [CrossRef]
- Singh, S. Natural sunlight driven photocatalytic performance of Ag/ZnO nanocrystals. Mater. Today Commun. 2022, 33, 104438. [Google Scholar] [CrossRef]


| Molecular Mass | Name of Molecule | Biomolecule Group | Structure | Molecular Formula |
|---|---|---|---|---|
| 164.093 | 1-Deoxynojirimycin | Alkaloids |  | C7H9N5 |
| 144.102 | Stachydrine | Amino acids | 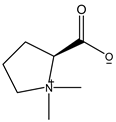 | C7H13NO2 |
| 226.097 | 2-(2-Hydroxy-5-methylphenyl)benzotriazole | Phenols | 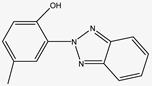 | C2H11N9O4 |
| 405.175 | Uridine 5-diphosphate | Sugars | 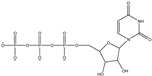 | C18H28O10 |
| 256.264 | Palmitamide | Fatty acids | 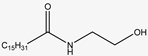 | C16H33NO |
| 419.317 | Di(5-nonyl) phthalate | Carboxylic acids | 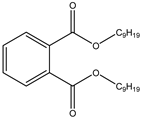 | C27H38N4 |
| Photocatalyst | Light Source | Dye | Time (min) | Conc. (mg/L) | Volume of Solution (mL) | Dosage | Efficiency (%) | Refs |
|---|---|---|---|---|---|---|---|---|
| ZnO@C | Visible | RBG | 120 | 10 | NR | 30 mg | ~95.8 | [73] |
| Ag/ZnO@C | Sunlight | RhB | 40 | 10 | NR | 100 | ~97.9 | [40] |
| 1% Ag/ZnO | UV | MB | 80 | 10 | NR | 24 mg | 57 | [85] |
| Au-ZnO | UV | MB | 60 | 10 | NR | 20 mg | 50 | [82] |
| Au/ZnO | UV | ORII | 180 | 10 | 400 | 1.5 g/L | 87.4 | [41] |
| 1% Ag–ZnO–CSs | UV | MB | 120 | 5 | 300 | 90 mg | 92 | [current study] |
| 1% Au–ZnO–CSs | UV | MB | 120 | 5 | 300 | 90 mg | 98 | [current study] |
Disclaimer/Publisher’s Note: The statements, opinions and data contained in all publications are solely those of the individual author(s) and contributor(s) and not of MDPI and/or the editor(s). MDPI and/or the editor(s) disclaim responsibility for any injury to people or property resulting from any ideas, methods, instructions or products referred to in the content. |
© 2024 by the authors. Licensee MDPI, Basel, Switzerland. This article is an open access article distributed under the terms and conditions of the Creative Commons Attribution (CC BY) license (https://creativecommons.org/licenses/by/4.0/).
Share and Cite
Bopape, D.A.; Motaung, D.E.; Hintsho-Mbita, N.C. Biosynthesis of Gold- and Silver-Incorporated Carbon-Based Zinc Oxide Nanocomposites for the Photodegradation of Textile Dyes and Various Pharmaceuticals. Textiles 2024, 4, 104-125. https://doi.org/10.3390/textiles4010008
Bopape DA, Motaung DE, Hintsho-Mbita NC. Biosynthesis of Gold- and Silver-Incorporated Carbon-Based Zinc Oxide Nanocomposites for the Photodegradation of Textile Dyes and Various Pharmaceuticals. Textiles. 2024; 4(1):104-125. https://doi.org/10.3390/textiles4010008
Chicago/Turabian StyleBopape, Dineo A., David E. Motaung, and Nomso C. Hintsho-Mbita. 2024. "Biosynthesis of Gold- and Silver-Incorporated Carbon-Based Zinc Oxide Nanocomposites for the Photodegradation of Textile Dyes and Various Pharmaceuticals" Textiles 4, no. 1: 104-125. https://doi.org/10.3390/textiles4010008
APA StyleBopape, D. A., Motaung, D. E., & Hintsho-Mbita, N. C. (2024). Biosynthesis of Gold- and Silver-Incorporated Carbon-Based Zinc Oxide Nanocomposites for the Photodegradation of Textile Dyes and Various Pharmaceuticals. Textiles, 4(1), 104-125. https://doi.org/10.3390/textiles4010008