
Influence of Molecular Weight of Anthraquinone Acid Dyes on Color Strength, Migration, and UV Protection of Polyamide 6 Fabrics


 ,
,  , ,
, ,
Abstract
1. Introduction
2. Materials and Methods
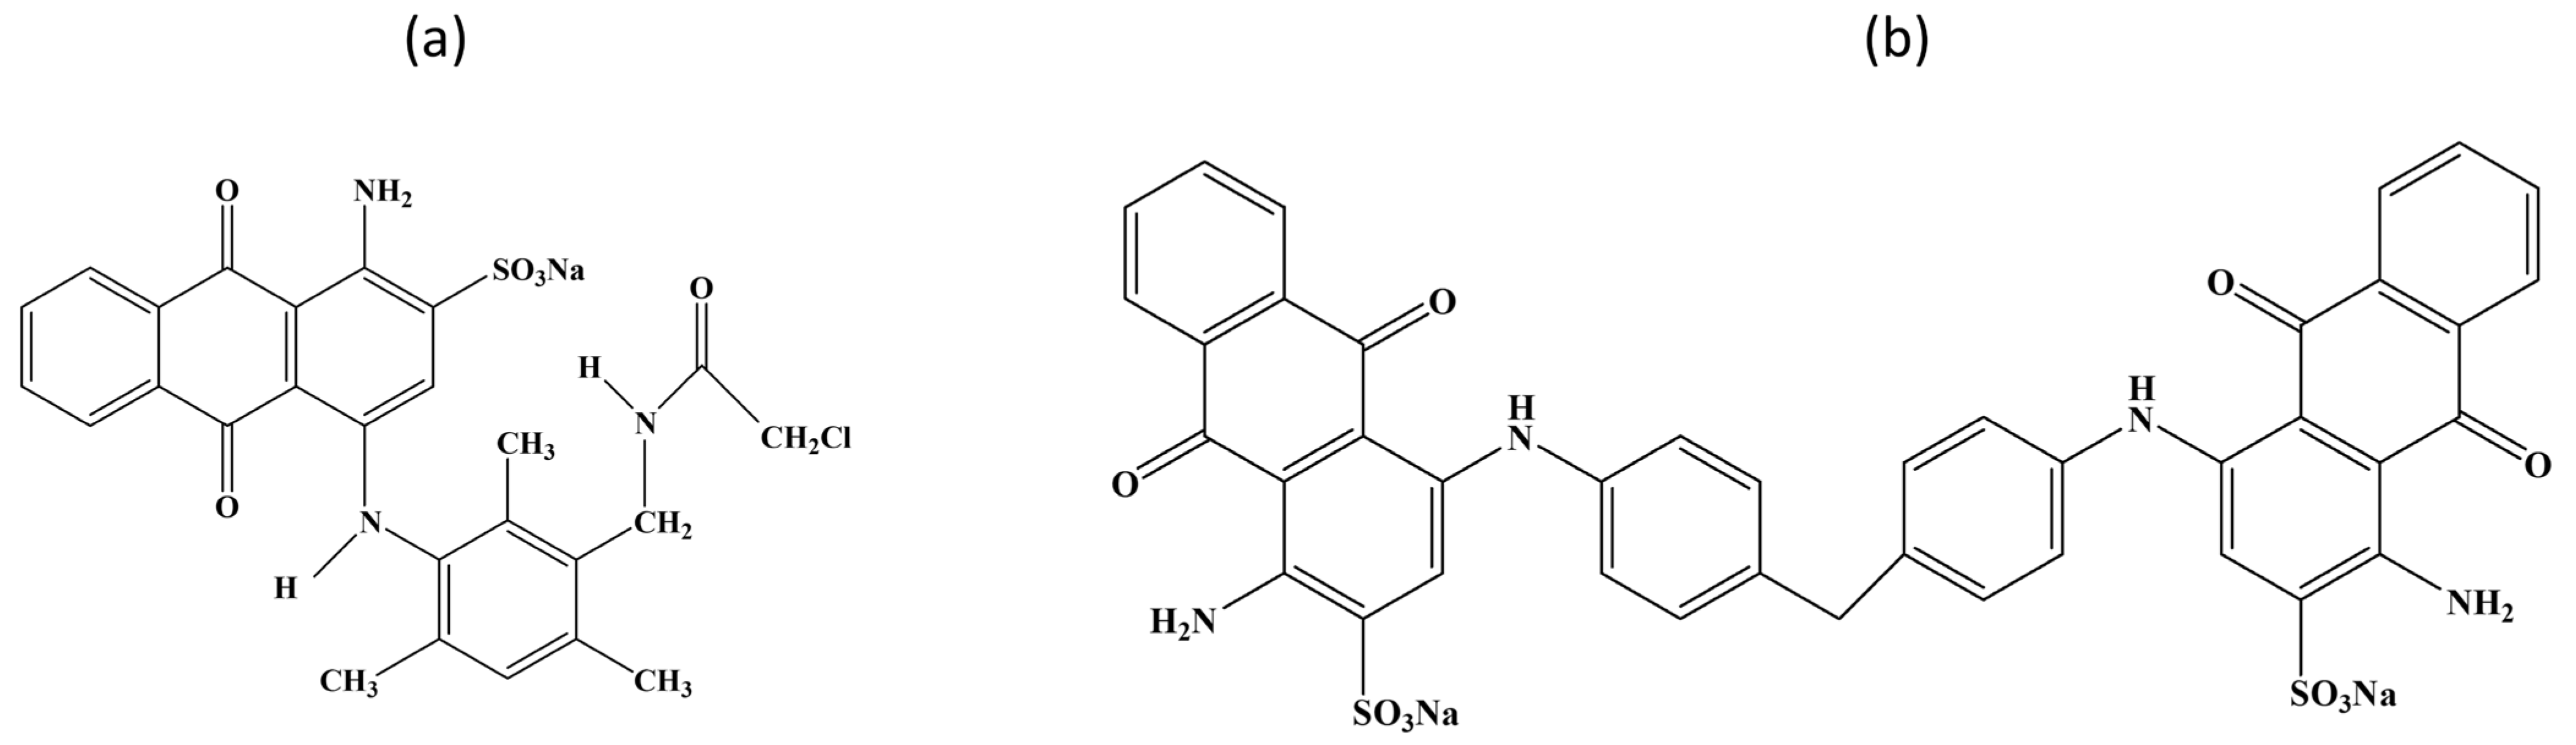
2.1. Materials
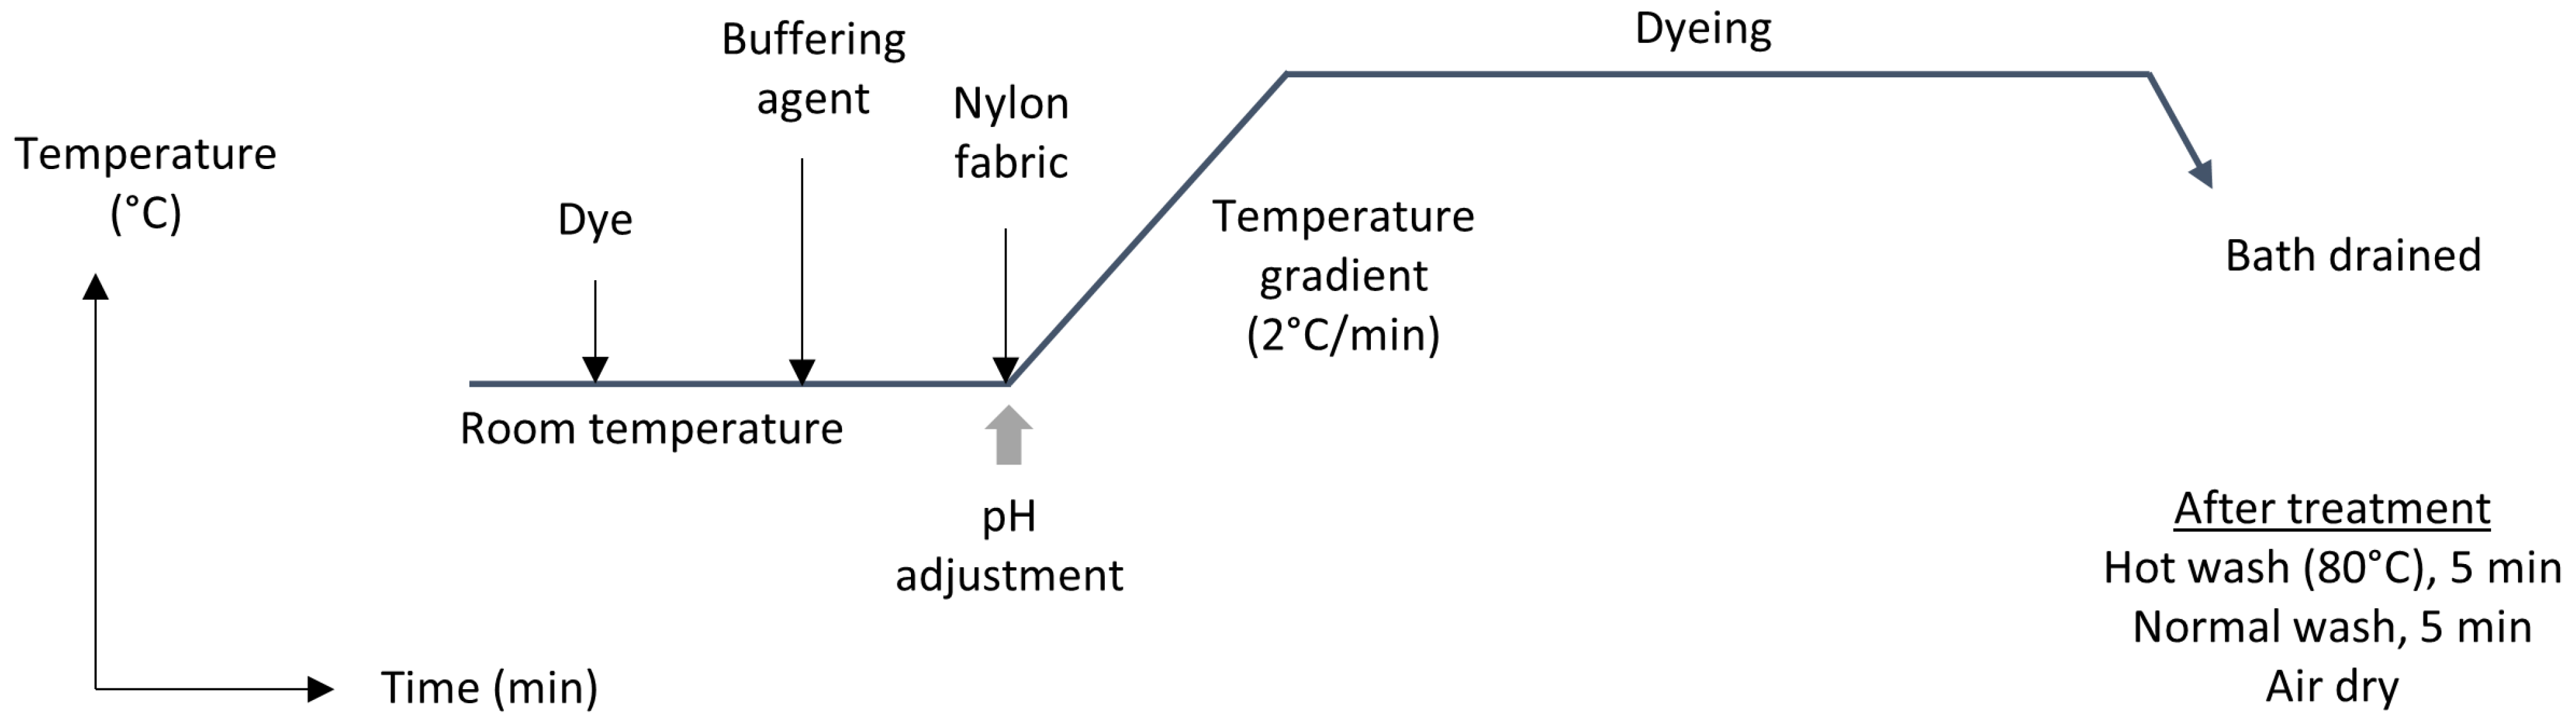
2.2. Dyeing
2.3. Spectral Measurement and Saturation Limit Analysis
2.4. Dynamic Behavior of Color Strength (K/S) at Different Dye-Bath Variants
2.5. Measurement of Dye Migration Index
2.6. Evaluation of UV Protection Factor and Fourier Transform Infrared Spectra
2.7. Color Fastness Evaluation
3. Results
3.1. Saturation Limit Analysis from Color Strength
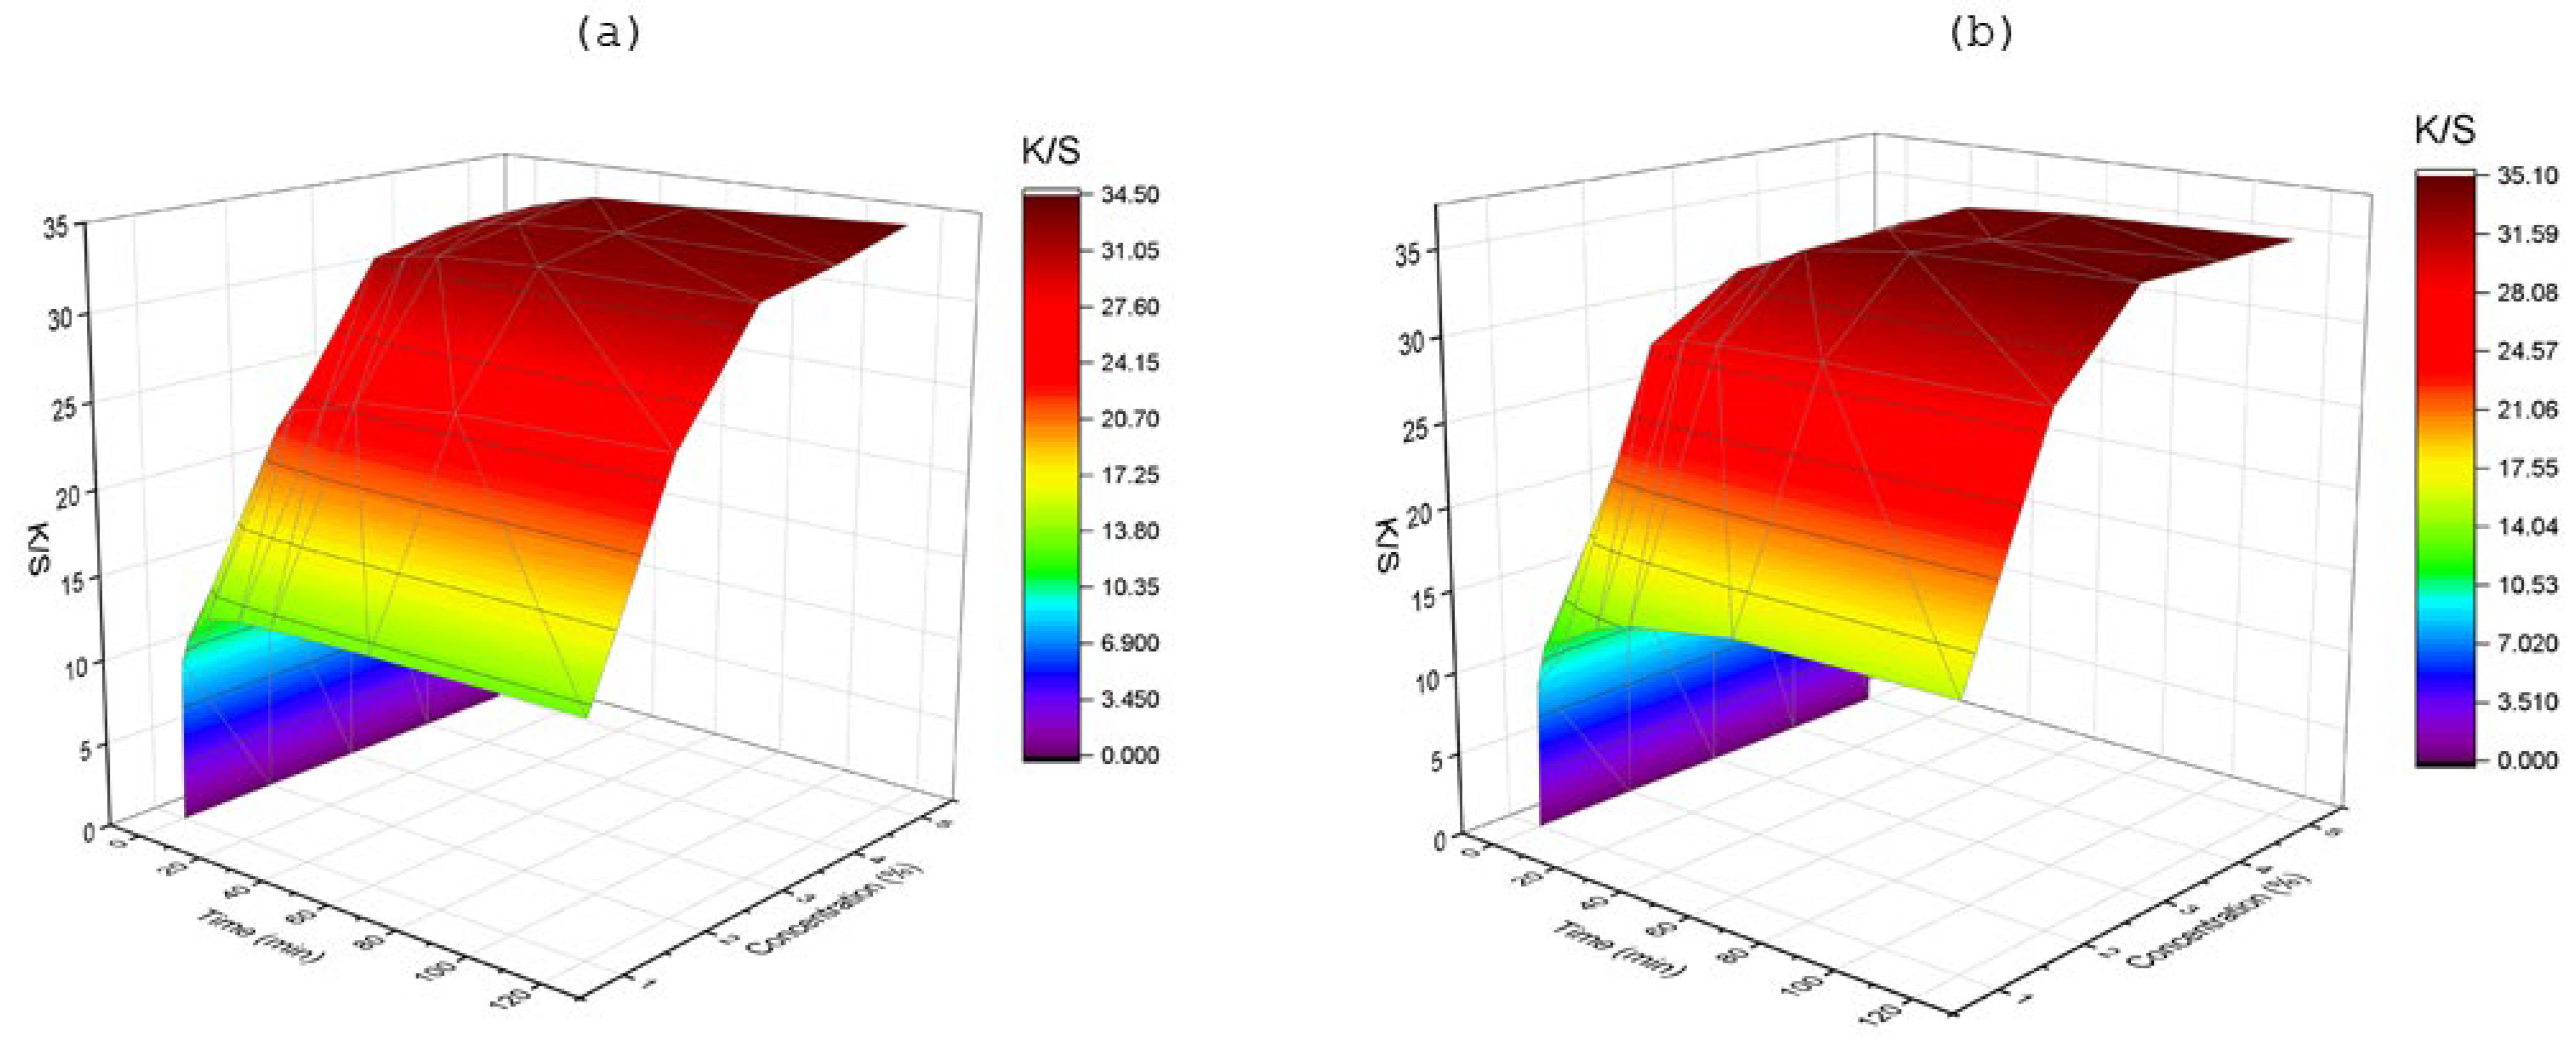
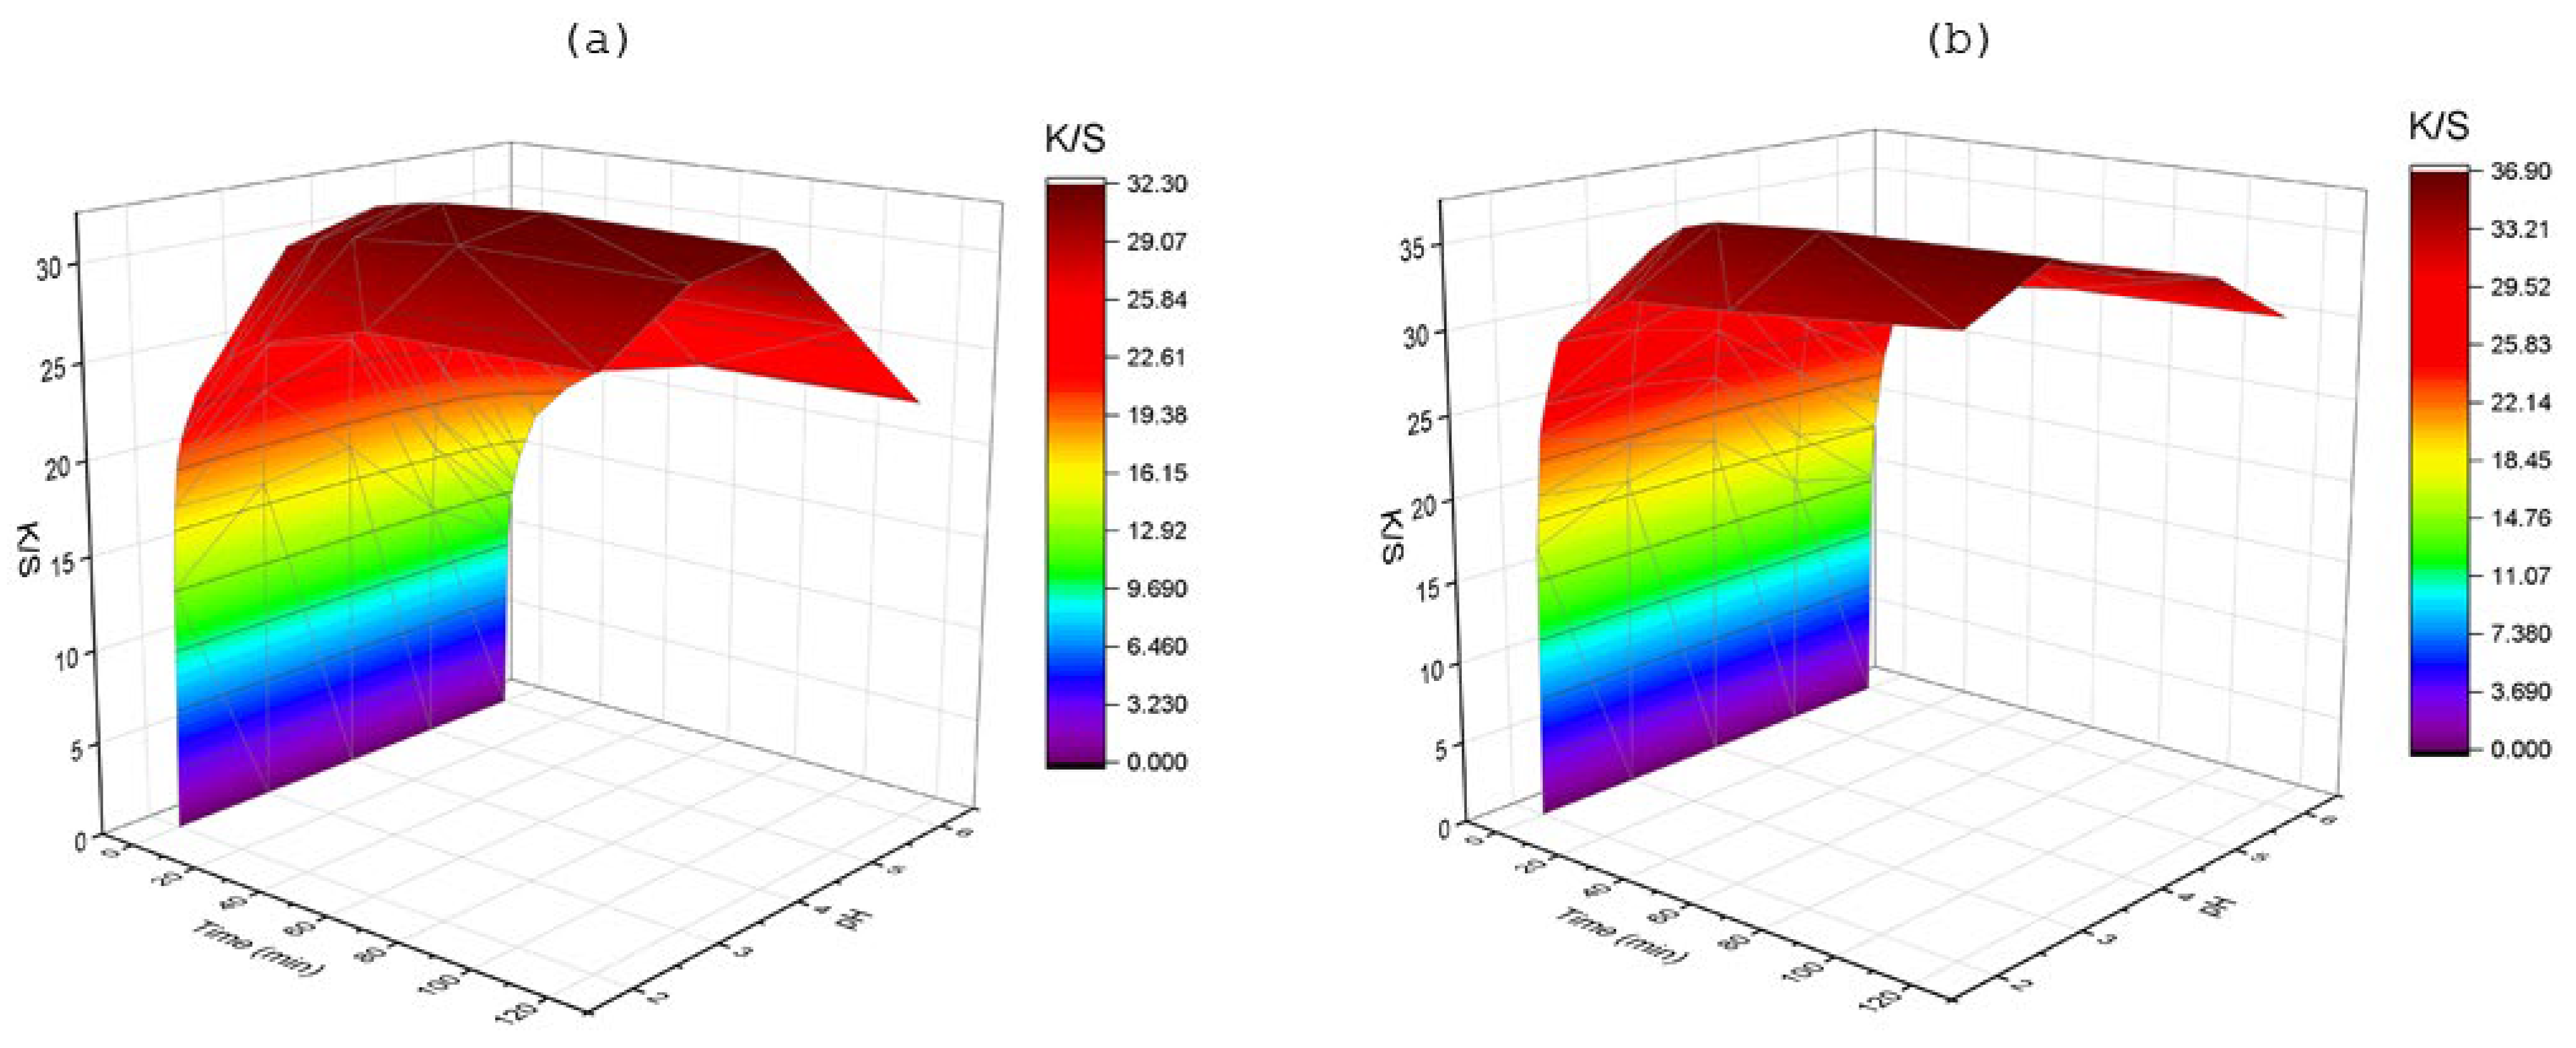
3.2. Dynamic Behavior of Color Strength (K/S)
3.2.1. Effect of Dye Concentration
3.2.2. Effect of Temperature
3.2.3. Effect of pH
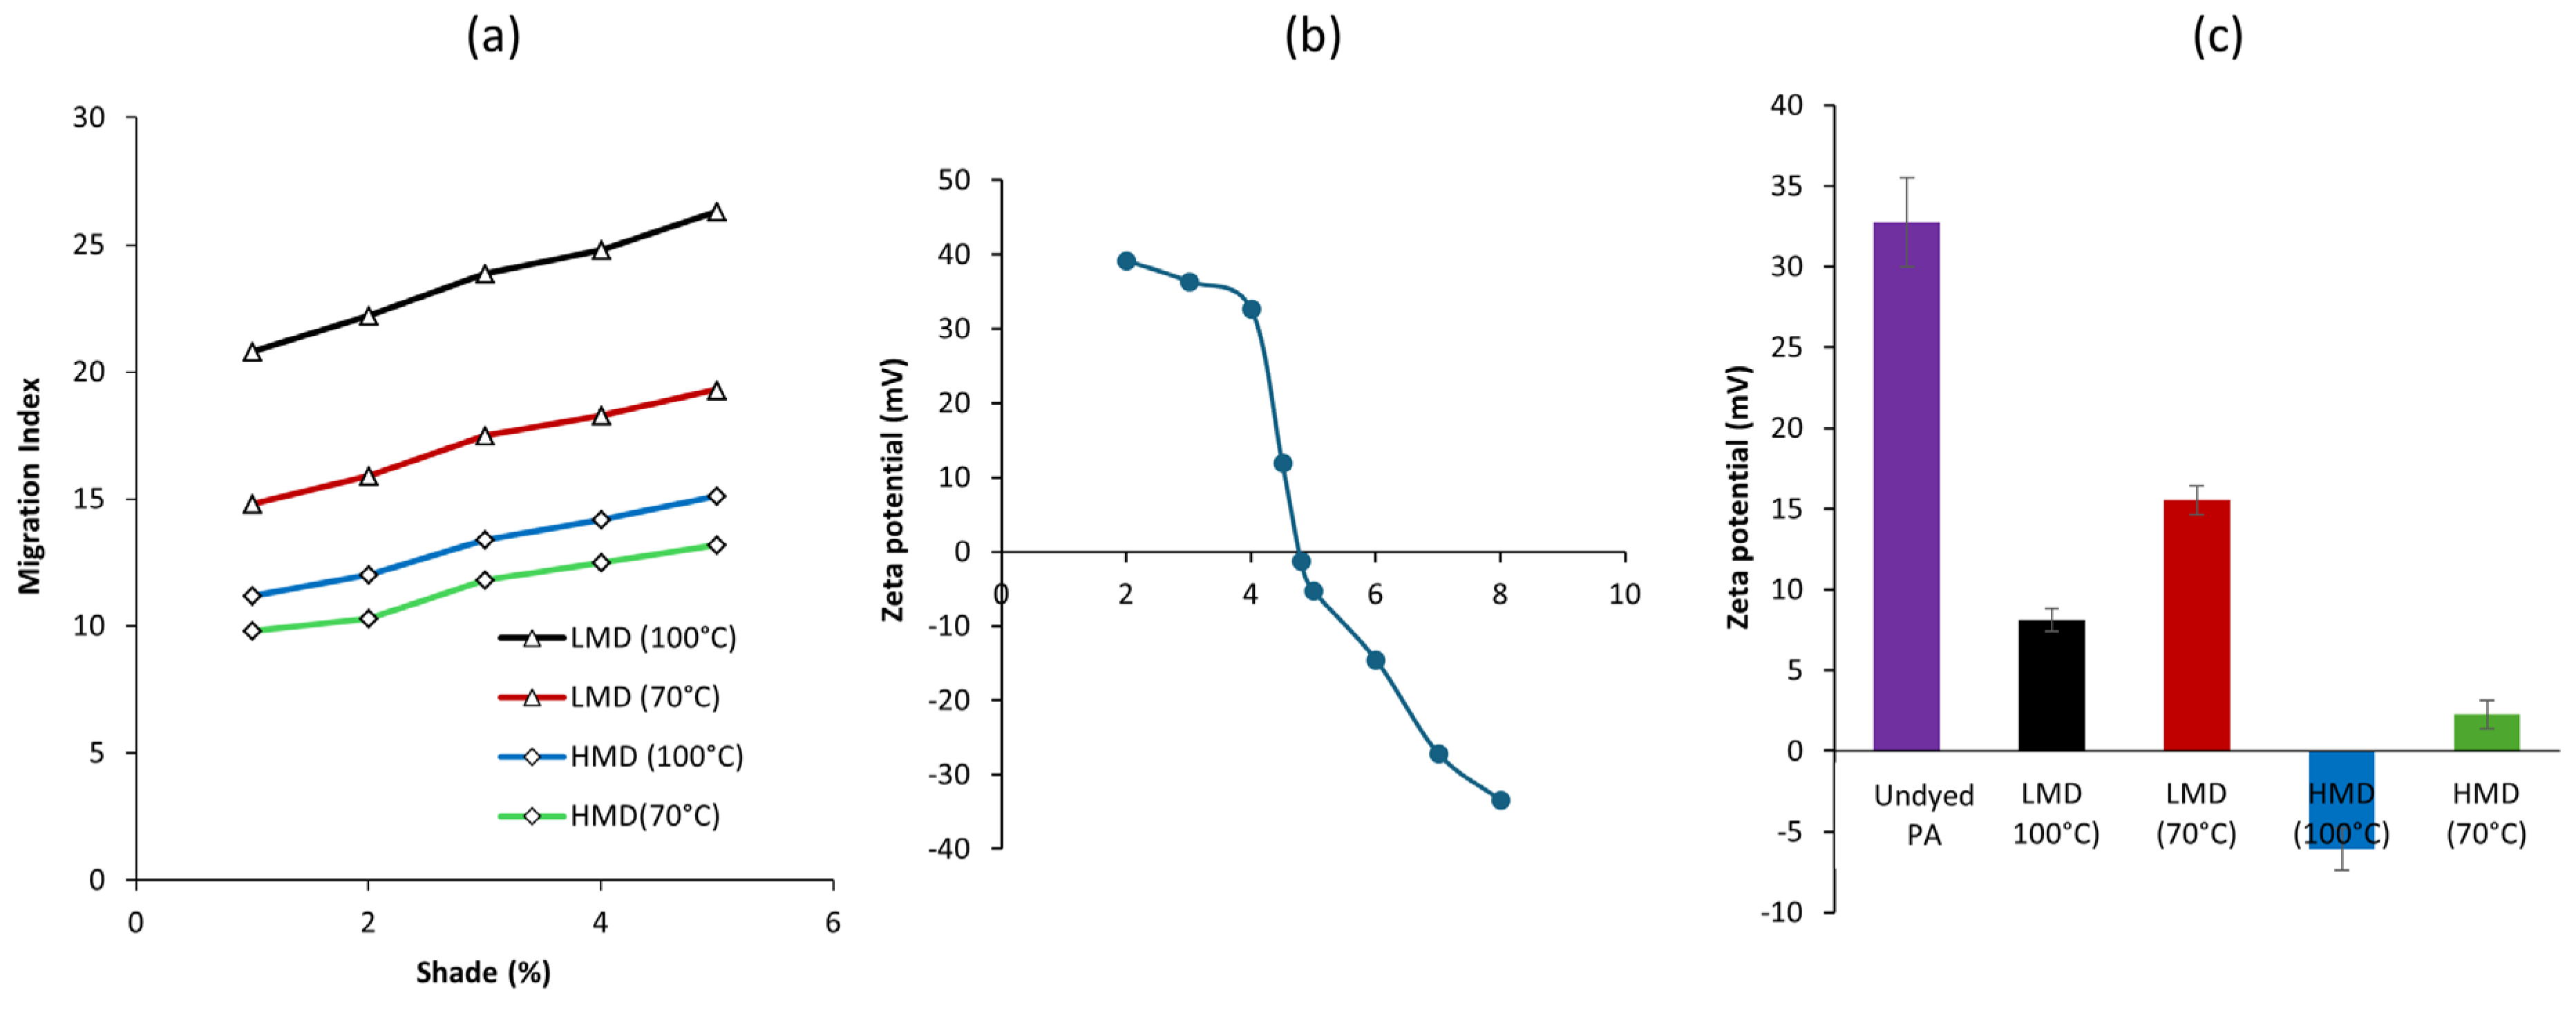
3.3. Dye Migration Index (MI) and Zeta Potential
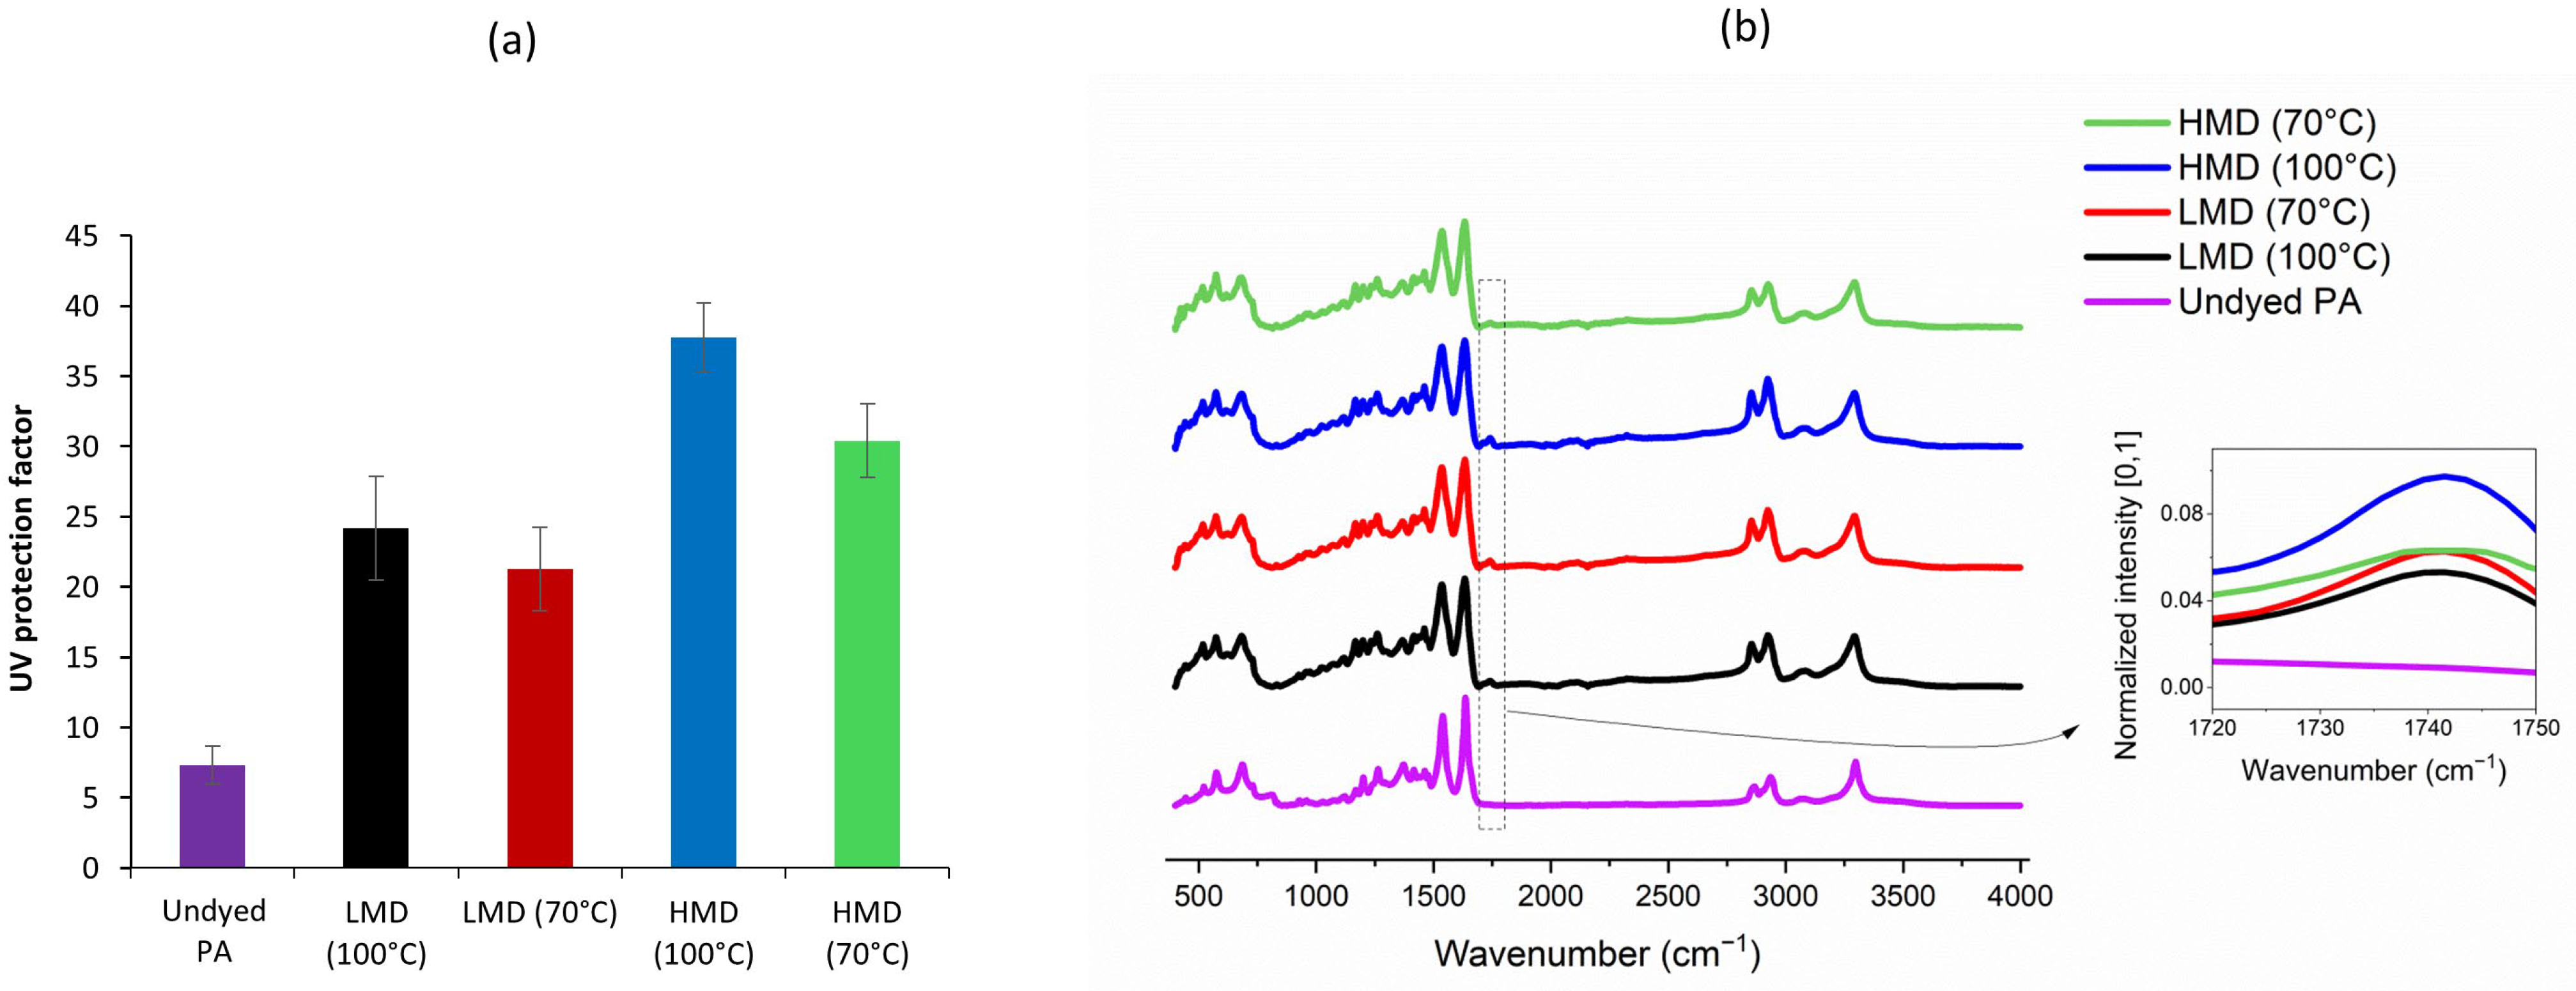
3.4. UV Protection and FTIR
3.5. Color Fastness
4. Conclusions
Author Contributions
Funding
Data Availability Statement
Conflicts of Interest
References
- Jóźwiak, T.; Filipkowska, U. The use of rapeseed husks to remove acidic and basic dyes from aquatic solutions. Appl. Sci. 2024, 14, 1174. [Google Scholar] [CrossRef]
- Haque, A.N.M.A.; Remadevi, R.; Wang, X.; Naebe, M. Sorption properties of fabricated film from cotton gin trash. Mater. Today Proc. 2020, 31, S221–S226. [Google Scholar] [CrossRef]
- Farzana, N.; Uddin, M.Z.; Haque, M.M.; Haque, A.N.M.A. Dyeability, kinetics and physico-chemical aspects of Bombyx mori muslin silk fabric with bi-functional reactive dyes. J. Nat. Fibers 2020, 17, 986–1000. [Google Scholar] [CrossRef]
- Waring, D.R.; Hallas, G. The Chemistry and Application of Dyes; Springer Science & Business Media: New York, NY, USA, 2013. [Google Scholar]
- Khatri, M.; Hussain, N.; El-Ghazali, S.; Yamamoto, T.; Kobayashi, S.; Khatri, Z.; Ahmed, F.; Kim, I.S. Ultrasonic-assisted dyeing of silk fibroin nanofibers: An energy-efficient coloration at room temperature. Appl. Nanosci. 2020, 10, 917–930. [Google Scholar] [CrossRef]
- Andrade-Guel, M.; Cabello-Alvarado, C.J.; Ávila Orta, C.A.; Cadenas-Pliego, G.; Cruz-Ortiz, B. Functional Technical Textile-Based Polymer Nanocomposites with Adsorbent Properties of Toxins and Dyes also Have Antibacterial Behavior. Materials 2024, 17, 3007. [Google Scholar] [CrossRef]
- Haque, A.N.M.A.; Naebe, M. Future Textiles; Deakin University: Waurn Ponds, VIC, Australia, 2024; Available online: https://hdl.handle.net/10779/DRO/DU:27221277.v1 (accessed on 19 June 2025).
- Bird, C.L.; Boston, W.S. Theory of Colouration of Textiles; White Rose Press Ltd.: London, UK, 1975. [Google Scholar]
- Carpignano, R.; Savarino, P.; Barni, E.; Viscardi, G.; Baracco, A.; Clementi, S. Dyeing of nylon 66 with disperse dyes. An optimization study. Dye. Pigment. 1989, 10, 23–31. [Google Scholar] [CrossRef]
- Benkhaya, S.; M’rabet, S.; El Harfi, A. Classifications, properties, recent synthesis and applications of azo dyes. Heliyon 2020, 6, e03271. [Google Scholar] [CrossRef]
- Benkhaya, S.; M’rabet, S.; El Harfi, A. A review on classifications, recent synthesis and applications of textile dyes. Inorg. Chem. Commun. 2020, 115, 107891. [Google Scholar] [CrossRef]
- Gürses, A.; Açıkyıldız, M.; Güneş, K.; Gürses, M.S. Classification of Dye and Pigments. In Dyes and Pigments; Springer International Publishing: Cham, Switzerland, 2016; pp. 31–45. [Google Scholar]
- Bae, J.-S.; Park, J.H.; Koh, J.; Kim, S.D. Dyeing and fastness properties of a reactive disperse dye on PET, nylon, silk and N/P fabrics. Fibers Polym. 2006, 7, 174–179. [Google Scholar] [CrossRef]
- Trotman, E.R. Dyeing and Chemical Technology of Textile Fibres; Griffin: London, UK, 1975. [Google Scholar]
- Huang, X.; Ye, W.; Zhuang, J.; Hu, C.; Dong, H.; Lei, B.; Liu, Y. π-Conjugated structure enhances the UV absorption performance of carbon dots and application in the design of light-colored sunglasses. ACS Sustain. Chem. Eng. 2024, 12, 10399–10410. [Google Scholar] [CrossRef]
- Klinkhammer, K.; Weskott, P.; Ratovo, K.; Krieg, M.; Bendt, E.; Mahltig, B. Transmission reduction for UV and IR radiation with dyed lyocell knitted textiles. Appl. Sci. 2023, 13, 5432. [Google Scholar] [CrossRef]
- Tayebi, H.-A.; Yazdanshenas, M.E.; Rashidi, A.; Khajavi, R.; Montazer, M. The Isotherms, Kinetics, and Thermodynamics of Acid Dye on Nylon6 with Different Amounts of Titania and Fiber Cross Sectional Shape. J. Eng. Fibers Fabr. 2015, 10, 155892501501000110. [Google Scholar] [CrossRef]
- Sada, E.; Kumazawa, H.; Ando, T. The Concentration Dependence of the Diffusion Coefficient of Acid Dyes in Nylon. J. Soc. Dye. Colour. 1983, 99, 92–97. [Google Scholar] [CrossRef]
- Atherton, E.; Downey, D.; Peters, R. Studies of the dyeing of nylon with acid dyes: Part I: Measurement of affinity and the mechanism of dyeing. Text. Res. J. 1955, 25, 977–993. [Google Scholar] [CrossRef]
- Gupta, V.; Chavan, R.; Kulkarni, M.; Natarajan, K. Dye-uptake behaviour of nylon-6 filaments and its structural dependence. Color. Technol. 2000, 116, 385–392. [Google Scholar] [CrossRef]
- Bell, J.P. Relation between nylon fiber mechanical properties and dye diffusion behavior. J. Appl. Polym. Sci. 1968, 12, 627–638. [Google Scholar] [CrossRef]
- Wang, H.H.; Wang, C.C.; Kuo, H.J. The kinetics and thermodynamics of nylon 6 fiber dyeing with hydrogen peroxide-glyoxal redox system. J. Appl. Polym. Sci. 2000, 76, 2105–2114. [Google Scholar] [CrossRef]
- Burkinshaw, S.; Son, Y.-A. A comparison of the colour strength and fastness to repeated washing of acid dyes on standard and deep dyeable nylon 6,6. Dye. Pigment. 2006, 70, 156–163. [Google Scholar] [CrossRef]
- ISO 105 E01; Textiles—Tests for Colour Fastness: Colour Fastness to Water. International Organisation for Standardisation: Geneva, Switzerland, 2013.
- ISO 105 E04; Textiles—Tests for Colour Fastness: Colour Fastness to Perspiration. International Organisation for Standardisation: Geneva, Switzerland, 2013.
- Fick, A. On liquid diffusion. J. Membr. Sci. 1995, 100, 33–38. [Google Scholar] [CrossRef]
- Mason, E.; Evans, R.I. Graham’s laws: Simple demonstrations of gases in motion: Part I, Theory. J. Chem. Educ. 1969, 46, 358. [Google Scholar] [CrossRef]
- Remington, W.; Gladding, E. Equilibria in the dyeing of nylon with acid dyes. J. Am. Chem. Soc. 1950, 72, 2553–2559. [Google Scholar] [CrossRef]
- Lewis, G.N. Valence and the Structure of Atoms and Molecules; Chemical Catalog Company, Incorporated: New York, NY, USA, 1923. [Google Scholar]
- Bouloton, J.; Morton, T. The dyeing of cellulosic materials: A review of the physics and chemistry of the dyeing process. J. Soc. Dye. Colour. 1940, 56, 145–159. [Google Scholar] [CrossRef]
- Islam, M.T.; Islam, T.; Islam, T.; Repon, M.R. Synthetic dyes for textile colouration: Process, factors and environmental impact. Text. Leather Rev. 2022, 5, 327–373. [Google Scholar] [CrossRef]
- Yan, N.; Zhang, M.; Ni, P. Size distribution and zeta-potential of polyamide microcapsules. J. Membr. Sci. 1992, 72, 163–169. [Google Scholar] [CrossRef]
- Oliveira, F.R.; Zille, A.; Souto, A.P. Dyeing mechanism and optimization of polyamide 6,6 functionalized with double barrier discharge (DBD) plasma in air. Appl. Surf. Sci. 2014, 293, 177–186. [Google Scholar] [CrossRef]
- Stiegelmaier, E.; Costa, T.C.; Pakuszewski, G.; de Souza, S.A.G.U.; de Souza, A.A.U.; Immich, A.P.S. Enhancing polyamide 6: Acid hydrolysis for functionalization and amino group quantification. Polymer 2024, 298, 126905. [Google Scholar] [CrossRef]
- Bhatt, N.; Daruwalla, E. Studies in the mechanism of dyeing of polyamide fibers with acid dyes. Text. Res. J. 1964, 34, 435–444. [Google Scholar] [CrossRef]
- Reinert, G.; Fuso, F.; Hilfiker, R.; Schmidt, E. UV-protecting properties of textile fabrics and their improvement. Text. Chem. Color. 1997, 29, 36–43. [Google Scholar]
- Tarbuk, A.; Grancarić, A.M.; Šitum, M. Skin cancer and UV protection. AUTEX Res. J. 2016, 16, 19–28. [Google Scholar] [CrossRef]
- Louris, E.; Sfiroera, E.; Priniotakis, G.; Makris, R.; Siemos, H.; Efthymiou, C.; Assimakopoulos, M. Evaluating the ultraviolet protection factor (UPF) of various knit fabric structures. In Proceedings of the IOP Conference Series: Materials Science and Engineering, Lesvos, Greece, 5–7 September 2018; p. 012051. [Google Scholar]
- Saha, B.; Saha, A.; Das, P.; Kakati, A.; Banerjee, A.; Chattopadhyay, P. A comprehensive review of ultraviolet radiation and functionally modified textile fabric with special emphasis on UV protection. Heliyon 2024, 10, e40027. [Google Scholar] [CrossRef]
- Gao, A.; Zhang, C.; Song, K.; Hou, A. Preparation of multi-functional cellulose containing huge conjugated system and its UV-protective and antibacterial property. Carbohydr. Polym. 2014, 114, 392–398. [Google Scholar] [CrossRef]
- Zhang, Y.; Haque, A.N.M.A.; Naebe, M. UV-functional flexible nanocomposite film with high lignin-cellulose nanocrystals content. J. Mater. Res. Technol. 2023, 26, 5990–6000. [Google Scholar] [CrossRef]
- Fayyaz, A.; Asghar, H.; Waqas, M.; Kamal, A.; Al-Onazi, W.A.; Al-Mohaimeed, A.M. Multi-Spectroscopic Characterization of MgO/Nylon (6/6) Polymer: Evaluating the Potential of LIBS and Statistical Methods. Polymers 2023, 15, 3156. [Google Scholar] [CrossRef]
- Zheng, C.; Chen, J.; Chen, X.; Gao, Y.; Zhu, B.; He, Y. Effects of polyetheramine on the properties of polyamide 6. J. Polym. Sci. Appl. 2017, 6, 2–10. [Google Scholar]
- Saito, K.; Xu, T.; Ishikita, H. Correlation between C=O stretching vibrational frequency and p K a shift of carboxylic acids. J. Phys. Chem. B 2022, 126, 4999–5006. [Google Scholar] [CrossRef]
- Cegarra, J. Determination of the migratory properties of direct dyes. J. Soc. Dye. Colour. 1957, 73, 375–381. [Google Scholar] [CrossRef]


| Specifications | C I Acid Blue 260 | C I Acid Blue 127:1 |
|---|---|---|
| Dye class | Anthraquinone | Anthraquinone |
| Molecular weight | 563.99 | 844.78 |
| Molecular formula | C26H23ClN3NaO6S | C41H26N4Na2O10S2 |
| Shade % | Color Strength (K/S) | |
|---|---|---|
| Low Molecular Weight | High Molecular Weight | |
| 0.5 | 6.4 | 7.6 |
| 1 | 13.2 | 15.2 |
| 1.5 | 18.5 | 22.5 |
| 2 | 25.2 | 29.4 |
| 2.5 | 28.9 | 34.3 |
| 3 | 32.3 | 34.5 |
| 3.5 | 32.8 | 34.4 |
| 4 | 33.3 | 34.2 |
| 4.5 | 33.4 | 34.4 |
| 5 | 33.9 | 34.8 |
| Dyes | Wash Temperature | Color Change | Color Staining | |||||
|---|---|---|---|---|---|---|---|---|
| Acetate | Cotton | PA | Polyester | Acrylic | Wool | |||
| Color fastness to wash | ||||||||
| LMD | 60 °C | 4 | 3–4 | 4 | 3 | 3 | 3 | 3 |
| HMD | 4–5 | 4 | 4 | 3–4 | 3–4 | 3–4 | 3–4 | |
| LMD | 38 °C | 4 | 4 | 4–5 | 3–4 | 3 | 3–4 | 3–4 |
| HMD | 4–5 | 4–5 | 4–5 | 4 | 3–4 | 4 | 4 | |
| Color fastness to water | ||||||||
| LMD | 4–5 | 4 | 4–5 | 4 | 4 | 4 | 4 | |
| HMD | 4–5 | 4–5 | 5 | 4–5 | 4–5 | 4–5 | 4–5 | |
| Color fastness to perspiration | ||||||||
| LMD | 4 | 4 | 4 | 4 | 4 | 4 | 4 | |
| HMD | 4–5 | 4 | 4–5 | 4–5 | 4–5 | 4–5 | 4 | |
| Color fastness to sublimation | ||||||||
| LMD | 4 | 4 | 4 | 4 | 4 | 4 | 4 | |
| HMD | 4–5 | 4 | 4–5 | 4–5 | 4–5 | 4–5 | 4 | |
Disclaimer/Publisher’s Note: The statements, opinions and data contained in all publications are solely those of the individual author(s) and contributor(s) and not of MDPI and/or the editor(s). MDPI and/or the editor(s) disclaim responsibility for any injury to people or property resulting from any ideas, methods, instructions or products referred to in the content. |
© 2025 by the authors. Licensee MDPI, Basel, Switzerland. This article is an open access article distributed under the terms and conditions of the Creative Commons Attribution (CC BY) license (https://creativecommons.org/licenses/by/4.0/).
Share and Cite
Farzana, N.; Haque, A.N.M.A.; Smriti, S.A.; Sayem, A.S.M.; Siddiqa, F.; Islam, M.A.; Nasim, M.; Hasan, S.M.K. Influence of Molecular Weight of Anthraquinone Acid Dyes on Color Strength, Migration, and UV Protection of Polyamide 6 Fabrics. Physchem 2025, 5, 31. https://doi.org/10.3390/physchem5030031
Farzana N, Haque ANMA, Smriti SA, Sayem ASM, Siddiqa F, Islam MA, Nasim M, Hasan SMK. Influence of Molecular Weight of Anthraquinone Acid Dyes on Color Strength, Migration, and UV Protection of Polyamide 6 Fabrics. Physchem. 2025; 5(3):31. https://doi.org/10.3390/physchem5030031
Chicago/Turabian StyleFarzana, Nawshin, Abu Naser Md Ahsanul Haque, Shamima Akter Smriti, Abu Sadat Muhammad Sayem, Fahmida Siddiqa, Md Azharul Islam, Md Nasim, and S M Kamrul Hasan. 2025. "Influence of Molecular Weight of Anthraquinone Acid Dyes on Color Strength, Migration, and UV Protection of Polyamide 6 Fabrics" Physchem 5, no. 3: 31. https://doi.org/10.3390/physchem5030031
APA StyleFarzana, N., Haque, A. N. M. A., Smriti, S. A., Sayem, A. S. M., Siddiqa, F., Islam, M. A., Nasim, M., & Hasan, S. M. K. (2025). Influence of Molecular Weight of Anthraquinone Acid Dyes on Color Strength, Migration, and UV Protection of Polyamide 6 Fabrics. Physchem, 5(3), 31. https://doi.org/10.3390/physchem5030031