Article

Anomalous Diffusion and Surface Effects on the Electric Response of Electrolytic Cells

by
Antonio M. Scarfone
1,2,
Giovanni Barbero
1,2,3,
Luiz R. Evangelista
1,2,4,* and
Ervin K. Lenzi
5
1
Istituto dei Sistemi Complessi del Consiglio Nazionale delle Ricerche (ISC-CNR) c/o Dipartimento di Scienza Applicata del Politecnico di Torino, Corso Duca degli Abruzzi 24, 10129 Torino, Italy
2
Dipartimento di Scienza Applicata del Politecnico di Torino, Corso Duca degli Abruzzi 24, 10129 Torino, Italy
3
Moscow Engineering Physics Institute, National Research Nuclear University MEPhI, Kashirskoye Shosse 31, 115409 Moscow, Russia
4
Departamento de Física, Universidade Estadual de Maringá, Avenida Colombo, 5790, Maringá 87020-900, Paraná, Brazil
5
Departamento de Física, Universidade Estadual de Ponta Grossa, Avenida Carlos Cavalcanti, 4748, Ponta Grossa 87030-900, Paraná, Brazil
*
Author to whom correspondence should be addressed.
Physchem 2022, 2(2), 163-178; https://doi.org/10.3390/physchem2020012
Submission received: 18 March 2022 / Revised: 4 April 2022 / Accepted: 12 May 2022 / Published: 17 May 2022
(This article belongs to the Section Mathematical Physics and Chemistry)

Abstract

:
We propose an anomalous diffusion approach to analyze the electrical impedance response of electrolytic cells using time-fractional derivatives. We establish, in general terms, the conservation laws connected to a modified displacement current entering the fractional approach formulation of the Poisson–Nernst–Planck (PNP) model. In this new formalism, we obtain analytical expressions for the electrical impedance for the case of blocking electrodes and in the presence of general integrodifferential boundary conditions including time-fractional derivatives of distributed order. A conceptual scenario thus emerges aimed at exploring anomalous diffusion and surface effects on the impedance response of the cell to an external stimulus.

Graphical Abstract

1. Introduction

The impedance spectroscopy technique is widely applied to the dielectric characterization of insulating material. According to this technique, the electrical impedance is obtained by the application of a small signal alternating potential of frequency f to the sample in order to obtain its response, which is represented by a solenoidal total current flowing through the system. In this way, the electrical impedance is analytically obtained as the ratio of the applied potential and the total current. Once this expression is built, the real and imaginary parts of the electrical impedance allow us to derive information on the dissipative and reactive mechanisms underlying the electric response of the medium to an external electric excitation [1,2,3]. In the high-frequency region (f larger than a few GHz), the response of the medium is related to atomic and molecular mechanisms responsible for atomic or molecular polarization. From the analysis of the impedance spectra in this region, it is possible to derive information on the dispersion of the real and imaginary parts of the complex dielectric constant.
On the other hand, in the low-frequency region (f smaller than of a few MHz), the response of the medium strongly depends on the ions present in the medium. This ionic contribution to the electric response of the electrolytic cell is known as electrode polarization. From the analysis of the spectra in this frequency region, it is possible to derive information about the physical characteristics of the ions in the considered medium, as the ionic concentration, or the ionic mobility. In the dc limit, the response depends on the nature of the electrodes. A continuum description of the medium containing the ions, characterized by a real dielectric constant, was proposed long ago by Macdonald [4] and a few years later by Trukham [5], and it is known as the Poisson–Nernst–Planck (PNP) model. This model employs the continuity equation for both positive and negative ions combined with the Poisson equation. One of the most striking features of the electrical impedance response in typical electrolytic cells is its behavior in the low-frequency limit, i.e., Z 1 / ( i ω ) , when perfect-blocking boundary conditions are considered. However, in many experimental scenarios [6,7,8,9], it has been shown that the electrical impedance in the low-frequency limit exhibits a different behavior, i.e., Z 1 / ( i ω ) γ , in which γ < 1 . This kind of challenging response has motivated the extensions of the PNP model in order to render it more suitable to analyze complex experimental data.
One of these extensions considers the modification of the continuity equations by incorporating to it time-derivatives of arbirary order, i.e., by formulating the drift-diffusion problem in terms of the fractional calculus [6,7,8,9]. Another way of extending the PNP model is to consider nonstandard boundary conditions involving more complex adsorption–desorption processes at the interface of the bulk electrode. The first kind of extension can be particularly relevant, because the diffusion of particles in structured media is well described by anomalous diffusion, and the electrodes, in general, are structured, porous media. The other strategy of extending the boundary conditions can be used to model complex processes between surface and bulk. Both approaches are not only non-exclusive but can complement each other. Thus, a suitable analysis of this aspect of the conceptual framework is necessary to evidence the predictions of each approach as well as their possible relevance and applicability to the experimental scenarios.
In this paper, we propose and analyze extensions of the PNP model in terms of time-fractional derivative incorporated to the continuity equations in the situation of blocking electrodes as boundary conditions. We also consider a general type of non-blocking integrodifferential boundary conditions to implement the tools needed to face a variety of experimental data. To establish the general equations, we show why and how the displacement current needs to be modified to satisfy the conservation laws when we modify the continuity equation, as pointed out in Refs. [10,11] for fractional derivatives of distributed order. In addition, we discuss the effects of each strategy described above to face impedance problems and how these strategies may be connected. These developments are performed in Section 2 and Section 3. Finally, our discussing and concluding remarks are presented in Section 4.

2. The Geometry of the Cell and Conservation Laws

Let us start by defining an electrolytic cell, i.e., the region where the charges are diffusing and subjected to an external time-dependent difference of potential. It contains an insulating fluid in which ions are dispersed and tend to accumulate close to the limiting surfaces (actually, electrodes of area A), placed at the positions z = ± d / 2 , where z is the normal coordinate of a Cartesian frame. The sample is thus a slab of thickness d filled with an isotropic fluid inside which ions, positive, with volume density N + ( z , t ) , and negative, with density N ( z , t ) , forming a homogeneous medium of dielectric constant ε (for simplicity, hereafter measured in units of ε 0 = 8.85 × 10 12 F/m). We will assume later that the system of ions is diluted in such a way that their presence does not alter significantly the value of ε and that generation–recombination effects can be neglected. In the approach we propose here, in which the concentration of the ions is small in the equilibrium, the geometrical dimensions of these ions do not play any role. The description of the system can be done by means of a continuous function representing the ionic density. In the case of concentrated solution, where the ionic density is comparable with the molecular density of the liquid in which the ions are dispersed, the analysis has to be performed along the lines discussed, for instance, in Refs. [12,13]. These ions are also assumed as monovalent, having a charge | q | = 1.6 × 10 19 C. Before the application of an external difference of potential, the liquid is locally and globally neutral. However, when the external field is turned on, the charges move and currents of positive, j + ( z , t ) , and negative, j ( z , t ) , charges appear in the sample, and the liquid becomes locally charged but remains globally neutral. From this assumption, it follows that in the limit of an infinite sample, in the absence of any external voltage,
N + ( z , t ) = N ( z , t ) = N ,
where N represents the equilibrium density of ions of either positive and negative signs. If the ions have different valences ζ + and ζ , the ionic bulk density of positive and negative ionic charge are ζ + N + ( z , t ) | q | and ζ N ( z , t ) | q | , respectively. In this framework, the condition of electro-neutrality in the state of thermodynamic equilibrium, where the bulk density of ions are N + , eq and N , eq , is ζ + N + , eq = ζ N , eq . The quantity N in this case has to be changed in ζ + N + , eq . However, all the analysis remains the same, since in the linear version of the PNP-model, just small deviations from the equilibrium state are considered. Working with N is a consequence of another assumption implicit to the whole approach: the neutral species are fully dissociated into positive and negative charges of arbitrary mobilities and equal concentrations. When the external difference of potential is applied, and if its amplitude, V 0 , is small enough (typically V 0 V T = k B T / q , where k B T is the thermal energy at room temperature: V T 25 mV), then the variations of the bulk densities of ions due to the external field, n ± ( z , t ) is such that | n ± ( z , t ) | N . In this approximation,
N + ( z , t ) = N + n + ( z , t ) and N ( z , t ) = N + n ( z , t ) ,
i.e., the actual densities of ions only slightly differ from N.
The problem of obtaining the total current flowing through the electrolytic cell may be stated in the framework of the Poisson–Nernst–Planck (PNP) model, which is represented by three fundamental equations. The first two are the continuity equations:
t N ± ( z , t ) + z j ± ( z , t ) = 0 ,
with the current densities given by
j ± ( z , t ) = D ± z N ± ( z , t ) D ± q k B T N ± ( z , t ) z V ( z , t ) ,
where D ± are the diffusion coefficients for the positive and negative ions. In Equation (4), V ( z , t ) is the actual electric potential which can be determined by invoking the third of the fundamental equation—the equation of Poisson—namely:
2 z 2 V ( z , t ) = q ε N + ( z , t ) N ( z , t ) ,
which connects the profile of the electric potential across the sample with the actual bulk density of ions of both signs.
From Equations (3) and (5), we have a condition related to the charge conservation with relevant implications, which should be evidenced. By combining Equation (3) for positive and negative ions in subtraction, we may write:
t N + ( z , t ) N ( z , t ) + z j + ( z , t ) j ( z , t ) = 0 .
Now, by remembering that the profile of the electric field is given by E ( z , t ) = V ( z , t ) / z , we use Poisson’s equation in Equation (6) to obtain
z q j + ( z , t ) j ( z , t ) + ε t E ( z , t ) = 0 .
This equation implies that
J ( t ) = q j + ( z , t ) j ( z , t ) + ε t E ( z , t ) .
The first term in Equation (8) is related to the conduction current and the second term is the displacement current. Equation (7) is in agreement with the Maxwell equations, which determines the dynamics of the electromagnetic field, and it requires (for the three-dimensional case) that · J = 0 , i.e., that the total current across the sample has to be solenoidal. This implies that the current
I ( t ) = q S j + ( z , t ) j ( z , t ) + ε S t E ( z , t )
does not depend on z, where S is the area of the electrode.
Let us repeat the analysis but now incorporating the time-fractional derivative of distributed order to the previous equations. We modify the continuity equations by expressing them in terms of the fractional time-derivative and analyze the changes produced in Equation (9). The modification of the continuity equation implies modifying the description of the diffusion in order to account for anomalous diffusion. In this case, the anomalous diffusion is expected to be related to the bulk properties of the system [14,15,16,17,18].
For simplicity, consider first generalizing the time-derivative operator in Equation (3) to a time-fractional derivative of order 0 < γ < 1 , i.e., / t γ / t γ . The continuity equations become
τ γ 1 γ N ± ( z , t ) t γ + j ± ( z , t ) z = 0 ,
in which τ is a characteristic time. Before proceeding, we notice that this extension of the PNP model to the field of fractional calculus requires modifying the continuity equations, which now involves a time-fractional derivative of arbitrary order γ . As we shall show below, this implies modifying the displacement current with the introduction of a time-fractional derivate of order γ of the electric field. Another way to extend the PNP model to the field of fractional calculus is to keep the continuity equations unchanged. In this case, the appropriate time-fractional derivative of the Riemann–Liouville type will be found acting only on the conduction current part of the total current. In this case, the displacement current remains unchanged, and the time derivative of the electric field is of first-order in time [10]. Subsequently, the time-fractional operator may be generalized further by considering time-fractional derivatives of distributed orders in general [19,20]:
τ γ 1 γ N ± ( z , t ) t γ 0 1 d γ τ γ 1 p ( γ ) γ t γ N ± ( z , t ) ,
where p ( γ ) is a distribution function of γ defined such that
0 1 d γ p ( γ ) = 1 ,
and the operator considered is Caputo’s one, which is here implemented as follows:
γ t γ N ± ( z , t ) = 1 Γ m γ t d t N ± ( m ) ( z , t ) t t γ + 1 m ,
where m 1 < γ < m , N ± ( m ) ( z , t ) is the time derivative of the m t h order, i.e., of the integer order m. Note that the case γ integer corresponds to the standard differential operator. Thus, the new operator constitutes a superposition of time derivatives of arbitrary order, and its action is expected to produce a more powerful description of the diffusive process occurring in the cell. As a matter of fact, the fractional time derivatives incorporated to the continuity equation lead us to obtain fractional diffusion equations, which, in turn, can be associated with a random walk problem characterized by long-tailed distributions. These distributions are connected with the complexity of the media [18], which directly influences the motion of the particles and may be responsible for anomalous diffusion behavior [21,22,23].
Using this operator, Equation (3) is modified to the following equation:
0 1 d γ p ( γ ) τ γ 1 γ t γ N ± ( z , t ) + z j ± ( z , t ) = 0 .
Thus, the first term of Equation (14) contains the so-called operator of time-fractional derivative of distributed order; indeed, p ( γ ) is a distribution of the fractional coefficient γ . The current densities of particles are still the ones given by Equation (4). The fundamental equations of the PNP model extended to the time-fractional approach of distributed order—which reduces to the standard one when γ = 1 —are Equation (14) and the equation of Poisson, Equation (5).
By operating with Equation (14), in a way similar to the one we have done for the standard case, it is possible to show that
0 1 d γ p ( γ ) τ γ 1 γ t γ n + ( z , t ) n ( z , t ) + z j + ( z , t ) j ( z , t ) = 0 ,
and, consequently,
z q j + ( z , t ) j ( z , t ) + ε 0 1 d γ p ( γ ) τ γ 1 γ t γ E ( z , t ) = 0 .
This result for the fractional case of distributed order implies that J ( z , t ) / z = 0 as before, where, now
J ( z , t ) = q j + ( z , t ) j ( z , t ) + ε 0 1 d γ p ( γ ) τ γ 1 γ t γ E ( z , t ) ,
with the total current given by
I ( t ) = q S j + ( z , t ) j + ( z , t ) + ε S 0 1 d γ p ( γ ) τ γ 1 γ t γ E ( z , t ) ,
and being again independent of the position, as required in order for the concept of electrical impedance to be meaningful, as we discuss below. We underline that the change with respect to Equation (9) is present in the term related to the displacement current, which now contains a time-fractional derivative of distributed order. In this generalized perspective, Equation (18) is the suitable result to be stated as the extension of the continuity equations previously presented in the framework of the PNP model. In addition, it can be related to the displacement current obtained from the extensions of the Maxwell equations to the fractional approach [24,25]. We notice also that in the case of the Cattaneo equation (hyperbolic diffusion equation) [26], a similar analysis should be carried out to explore the implications of the term related to the displacement current.
Another useful extension of the continuity equations could be obtained by introducing the operator
t d t k ( t t ) 0 1 d γ p ( γ ) τ γ 1 γ t γ n ± ( z , t ) = z j ± ( z , t ) ,
where k ( t ) is some kernel related to memory effects. Equation (19) extends the previous results and makes it possible to consider different kernels, which can be connected to non-singular integral-differential operators [27]. Again, by operating as before, from Equation (19), we obtain the total current defined as
I ( t ) = q S j + ( z , t ) j + ( z , t ) + ε S t d t k ( t t ) 0 1 d γ p ( γ ) τ γ 1 γ t γ E ( z , t )
which has to be position independent. The summarized analysis carried out above shows that extending the dynamic equations governing the motion of the ions in an electrolytic sample has a direct influence on the terms present in the definition of the total current flowing through the system. In particular, the displacement current has to be extended accordingly.

3. Electrical Impedance

To capture the experimental behavior of the ions in contact with the surface of the electrodes in order to investigate the electric response of the sample to the external applied voltage, we have to solve the set of fundamental equations discussed in the preceding section for different boundary conditions. In what follows, we shall consider two representative cases: (1) the conditions relevant to perfect blocking electrodes and (2) more general conditions stated in terms of an integro-differential operator to account for several different mechanisms occurring at the electrodes. The electrochemical impedance technique operates by submitting the sample to an ac voltage of small amplitude to assure that its response to the external field is linear. Thus, the impedance, Z ( ω ) , is measured as a function of the frequency f = ω / 2 π of the applied voltage, where ω is the circular frequency. Once the total current is obtained, the impedance may be obtained as Z ( t ) = V ( t ) / I ( t ) = Z ( ω ) , because the total current is solenoidal. For the applied potential on the surface of the electrode, we consider V ± d / 2 , t = ± V 0 / 2 e i ω t . Then, the electrical impedance is obtained from the previous equation by considering a linear approximation for the steady state (ac small-signal limit).

3.1. Boundary Condition: Perfect Blocking Electrodes

Let us consider first the case of perfect blocking electrodes as the boundary conditions, i.e.,
j + ( ± d / 2 , t ) = j ( ± d / 2 , t ) = 0 .
In the ac small-signal limit, N ± ( z , t ) = N + η ± ( z ) e i ω t , with N > > | η ± ( z ) | , and V ( z , t ) = ϕ ( z ) e i ω t is the actual profile of the electric potential to be obtained by solving the coupled equations of the PNP model introduced before. In this approximation, the densities of current may be rewritten as
j ± ( z , t ) D ± z η ± ( z , t ) D ± q k B T N z V ( z , t ) .
The coupled equations of the problem are now Equations (5), (14) and (22). Using these equations and the linear approximation for N ± ( z , t ) and V ( z , t ) in the ac small–signal limit, the continuity equation, Equation (14), becomes
D d 2 d z 2 η + ( z ) D q 2 N ε k B T η + ( z ) η ( z ) = Φ ( i ω ) η + ( z ) ,
D d 2 d z 2 η ( z ) + D q 2 N ε k B T η + ( z ) η ( z ) = Φ ( i ω ) η ( z ) ,
where
Φ ( i ω ) = 1 τ 0 1 d γ p ( γ ) ( i ω τ ) γ ,
assuming D + = D = D . By performing the changes ψ ( z ) = η + ( z ) η ( z ) and ψ + ( z ) = η + ( z ) + η ( z ) , it is possible to rewrite the previous equations as follows:
D d 2 d z 2 ψ ( z ) D 2 q 2 N ε k B T ψ ( z ) = Φ ( i ω ) ψ ( z )
and
D d 2 d z 2 ψ + ( z ) = Φ ( i ω ) ψ + ( z ) .
Along the same lines, Equation (5) becomes
d 2 d z 2 ϕ ( z ) = q ε ψ ( z ) ,
and the condition imposed by the potential on the electrode surface yields ϕ ( z ) = ϕ ( z ) . The solution for ψ ( z ) can be found by using the standard procedures to solve ordinary differential equations. In addition, it is also useful to observe that by means of Equation (28), the symmetry present in the potential is also present in ψ ( z ) . Consequently, we have
ψ ( z ) = A sinh β z with β = 1 / λ 1 + Φ ( i ω ) λ 2 / D ,
where λ = ε k B T / 2 q 2 N is the Debye screening length. By using Equation (29) and after the integration of Equation (28), the solution for the potential across the electrolytic cell is
ϕ ( z ) = q ε β 2 ψ ( z ) + C z .
In Equation (30), there are two constants of integration A and C, which can be determined by the boundary conditions. In the case of perfect blocking electrodes, and using the condition imposed to the system on the surface of the electrode for the applied potential, i.e., ϕ ± d / 2 = ± V 0 / 2 , it is possible to show that
A = ε V 0 / ( 2 q ) 1 / β 2 sinh β d / 2 + Φ ( i ω ) d λ 2 / 2 β cosh β d / 2
and
C = λ 2 2 V 0 Φ ( i ω ) / β D cosh β d / 2 1 / β 2 sinh β d / 2 + Φ ( i ω ) d λ 2 / 2 β cosh β d / 2 .
Once A and C are determined, the exact profiles for ϕ ( z ) and ψ ( z ) are known and, likewise, the densities of current and the total current flowing across the sample. These calculations allow us to obtain the following analytical expression for the impedance:
Z = 2 Φ ( i ω ) S ε β 2 1 λ 2 β tanh β d / 2 + d 2 D Φ ( i ω ) .
Equation (33) has a different behavior from the one obtained in Ref. [28] due to the displacement current considered here. It is more suitable and accomplishes the conservation laws required by the set of equations used in the formulation of the PNP model with fractional time derivatives of distributed order.
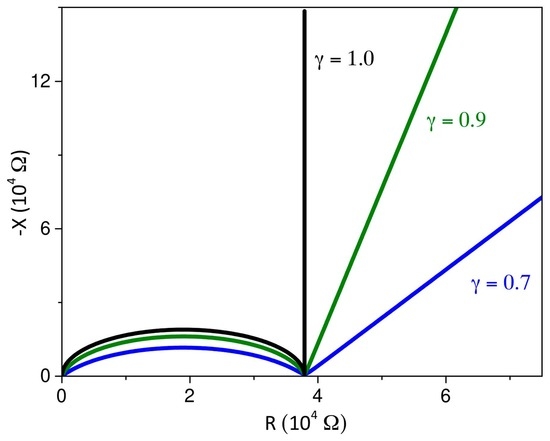
In Figure 1, the behavior of R = Re ( Z ) and X = Im ( Z ) is exhibited for some representative values of the physical parameters entering the model. The case γ = 1 (normal diffusion) is shown in black solid lines as a reference for the anomalous behavior exhibited when γ < 1 —corresponding to an underlying sub-diffusive process for the ions. The Nyquist diagram, Figure 1a, exhibits the strong influence of the value of γ on the slope of the curve, i.e., the crucial role played by the anomalous diffusion on the whole response of the sample to the external stimulus. The behavior of the imaginary part of the impedance, Figure 1b, is marked in the low-frequency region of the spectra by the anomalous diffusion behavior and, in the high-frequency region, by the dominant role played by the displacement current, which is now also governed by the fractional derivative of the electric field. Figure 1c shows the influence of the fractional approach on the real part of the impedance in the low and high-frequency limits. In general, the behavior exhibited in Figure 1 for the impedance evidences a connection with the constant phase elements (CPE) if we interpret the data in terms of equivalent circuits.
Expanding the expression of the electric impedance, Equation (33), around to ω = 0 , and taking into account that i γ = cos ( γ π / 2 ) + i sin ( γ π / 2 ) , we get
R ( ω 0 ) = d λ 2 D ε S + 2 λ τ ε S ( ω τ ) γ cos γ π 2 , X ( ω 0 ) = 2 λ τ ε S ( ω τ ) γ + d λ 4 D 2 ε S τ ( ω τ ) γ sin γ π 2 .
The first contribution to R ( ω 0 ) , R b = λ 2 d / ( D ε S ) , coincides with the value of the plateau of the spectrum of R = R ( ω ) , and it is a bulk property of the cell, since it is proportional to d. In the dc limit, the second addendum diverges. It follows that
lim ω 0 X R = tan γ π 2 ,
which is typical of the constant phase element [1]. The modulus of the reactance has a minimum for
ω m = 1 τ τ D λ 2 2 λ d 1 / γ .
For this circular frequency, the real and imaginary parts of the impedance of the cell are
R ( ω m ) = d λ 2 D ε S 1 + 2 λ d cos γ π 2 , X ( ω m ) = 2 d λ 2 ε S D 2 λ d sin γ π 2
from which it follows that ω m depends on τ , whereas R ( ω m ) and X ( ω m ) are independent of it. For usual electrolytic samples, the length of Debye is very small with respect to the thickness of the sample, and hence, R ( ω m ) R b , and X ( ω m ) is very small. In the Nyquist diagram, the linear dependence of the reactance on the resistance begins for ω = ω m from the point of coordinates ( R ( ω m ) , X ( ω m ) ) ( R b , 0 ) . It is visible on the parametric representation of R versus X decreasing the frequency, as a cusp. In the case of normal diffusion
ω m = D λ 2 2 λ d , R ( ω m ) = λ 2 d D ε S , and X ( ω m ) = 2 d λ 2 ε S D 2 λ d .
In the high-frequency region, the reactance is well approximated by the expression
X ( ω ) = d τ ε S ( ω τ ) γ sin γ π 2 .
A numerical calculation shows that the expressions X ( ω 0 ) and X ( ω ) coincide for ω = ω M given by
ω M = 1 τ 1 2 λ d D λ 2 τ 1 / γ 1 τ D λ 2 τ 1 / γ
since usually λ d , and
Z ( ω M ) = λ 2 d 2 ε D S [ 1 + cos γ π 2 ] i sin γ π 2 1 + cos γ π 2 .
Note that ω M depends on τ . Z ( ω M ) is independent of τ . In the case of normal diffusion ( γ = 1 ), these relations take the form
ω M = D λ 2
that coincides with the circular frequency of Debye, and
Z ( ω M ) = λ 2 d 2 ε D S ( 1 i ) ,
indicating that at this circular frequency, the resistance and reactance are equal, and half of the resistance of the plateau [1].
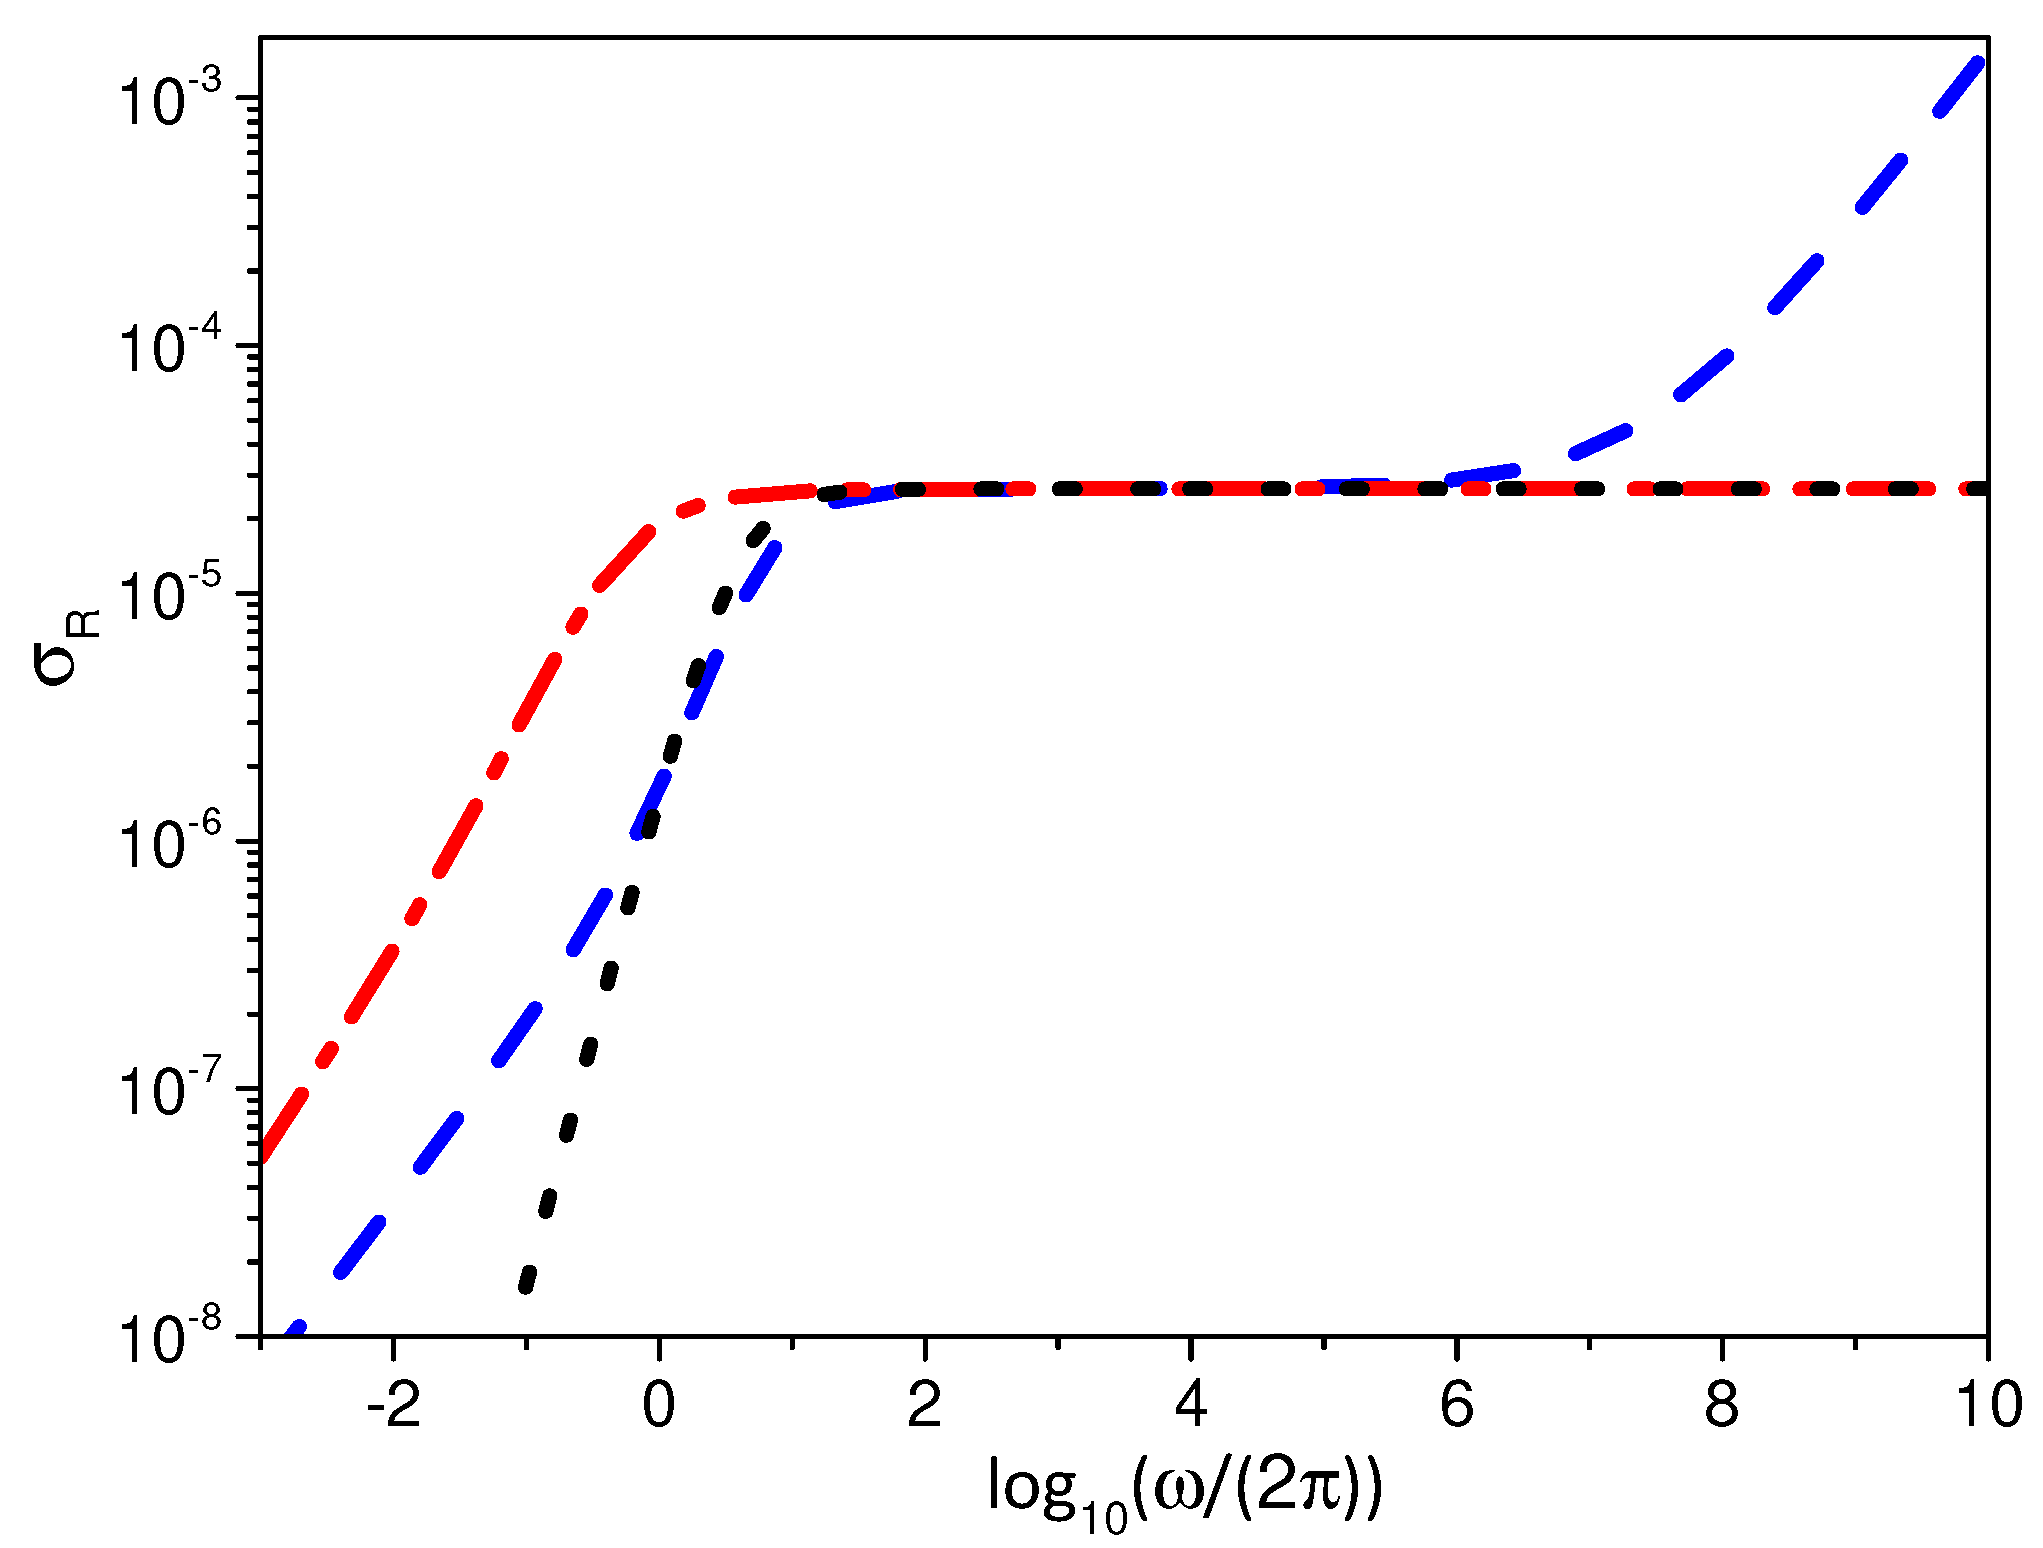
In Figure 2a, we show the frequency behavior of the electrical conductivity, i.e., σ = R d / ( S | Z | 2 ) , for different values of γ . It shows that the presence of the fractional time derivatives modifies the behavior in both the low and high-frequency limits. An anomalous behavior is exhibited for very low frequencies with respect to the normal case, again indicating the crucial presence of a sub-diffusion process for the ions in their response to the applied voltage. In the high-frequency region, the conductivity shows a behavior not typical of liquid samples but, perhaps, more akin to solid or semiconductor systems.
It is worth mentioning that this connection with the anomalous diffusion is provided by the relation between the electrical conductivity and the mean square displacement, as discussed in Refs. [29,30]. Consequently, the influence of the fractional time derivative is also observed in the low and high-frequency limits, as already shown in Figure 1c.

3.2. Boundary Condition: Integrodifferential Conditions

To proceed, we consider now the boundary conditions given by the following equation:
j ± ± d 2 , t = ± 0 1 d α p ¯ ( α ) t d t κ ± ( t t ) α t α N ± ± d 2 , t ,
where p ¯ ( α ) is a probability distribution and κ ± ( t ) is a kernel related to the kinetic processes occurring on the surface. Equation (34) is aimed at tackling general problems, and particular expressions for the kernel have been considered to investigate different specific problems, as discussed in Refs. [31,32,33,34]. One of the main features concerning Equation (34) is that the low-frequency behavior changes according to the form of κ ± ( t ) . On the other hand, the behavior in the high-frequency limit is governed by the bulk equation, in contrast to the case of the previous section. A particular situation concerning Equation (34) is obtained by considering κ ± ( t ) = κ ± e t / τ with p ( α ) = δ ( α 1 ) , which implies that
j ± ± d 2 , t = ± κ ± t d t e ( t t ) / τ t N ± ± d 2 , t .
In the ac small-signal limit, Equation (35) can be written as follows:
j ± ± d 2 , t = ± κ ± i ω τ 1 + i ω τ η ± ± d 2 e i ω t ,
which yields
j + j z = ± d / 2 = ± κ ± i ω τ 1 + i ω τ ψ ± d / 2 e i ω t .
Equation (37) is the same result obtained for the boundary condition discussed in Ref. [35]. It relates the kinetic processes occurring on the surface with the bulk dynamics through the equation:
j ± ± d 2 , t = ± d d t σ ± ( t ) ,
with
d d t σ ± t = κ ± N ± d 2 , t 1 τ σ ± ( t ) .
In fact, in the ac small-signal limit, if we follow the developments presented in Ref. [35], then Equations (38) and (39) allow us to obtain the relation:
j + j z = ± d / 2 = ± i ω s + s e i ω t ,
where σ ± ( t ) = σ 0 + s ± e i ω t and
s + s z = ± d / 2 = κ ± τ 1 + i ω τ ψ ( ± d / 2 ) ,
which is obtained from Equation (39). In the definition of σ ± , σ 0 is the density of adsorbed particles in the absence of an external electric field. The substitution of Equation (41) into Equation (40) yields Equation (37). The Chang–Jaffé electrode-reaction boundary conditions [36] can also be obtained from Equation (34) by choosing p ( α ) = δ ( α ) and κ ± ( t ) = κ ± δ ( t ) . It is also possible to consider the mixing between these two boundary conditions by a suitable choice of p ( α ) and κ ± ( t ) and other features connected to the CPE elements.
Before obtaining the electrical impedance for this case, let us explicate how the boundary conditions and the bulk are connected. In fact, the boundary condition given by Equation (34) implies that the bulk and the surfaces are coupled, i.e., the kinetics occurring on the surface and bulk dynamics change each other. This fact may be evidenced after the integration of Equation (14) as follows:
d / 2 d / 2 d z 0 1 d γ p ( γ ) τ γ 1 γ t γ N ± ( z , t ) + d / 2 d / 2 d z z j ± ( z , t ) = 0 ,
yielding
0 1 d γ p ( γ ) τ γ 1 γ t γ d / 2 d / 2 d z N ± ( z , t ) + j ± d 2 , t + j ± d 2 , t = 0 .
The last part of Equation (43) shows the influence of the boundary conditions on the bulk dynamic. The substitution of Equation (34) into Equation (43) yields
0 1 d γ p ( γ ) τ γ 1 γ t γ d / 2 d / 2 d z N ± ( z , t ) + 0 1 d α p ¯ ( α ) t d t κ ± ( t t ) × α t α N ± d 2 , t + N ± d 2 , t = 0 .
Equation (44) shows that the dynamics associated to the presence of the ions in the bulk and the processes occurring on the surface are coupled. It shows, in addition, in what manner the changes occurring in one (bulk) promotes changes in the other (surface). We underline that Equation (42) can also be analyzed by taking into account other boundary conditions.
In a way similar to the case analyzed in the preceding section, it is possible to show that the integration constants A and C present in Equation (29) and (30) are given by
A = ε V 0 / ( 2 q ) 1 / β 2 + k ( i ω ) / D sinh β d / 2 + Φ ( i ω ) d λ 2 / 2 β cosh β d / 2
and
C = λ 2 2 V 0 Φ ( i ω ) / β D cosh β d / 2 + k ( i ω ) / D sinh β d / 2 1 / β 2 + k ( i ω ) / D sinh β d / 2 + Φ ( i ω ) d λ 2 / 2 β cosh β d / 2 ,
where
k ( i ω ) = 0 1 d η p ( η ) ( i ω ) α 0 d t κ ( t ) e i ω t ,
with κ + ( t ) = κ ( t ) = κ ( t ) . These calculations yield the following analytical expression for the impedance:
Z = 2 S ε β 2 tanh β d / 2 / λ 2 β + d / 2 D E ( i ω ) Φ ( i ω ) + k ( i ω ) 1 + Φ ( i ω ) λ 2 / D tanh β d / 2 / ( λ 2 β ) ,
where E ( i ω ) = Φ ( i ω ) + k ( i ω ) β tanh d β / 2 . The asymptotic behavior of Equation (48) in the low-frequency limit is given by
Z 2 λ 2 S ε d 2 D + 1 / λ Φ ( i ω ) + k ( i ω ) / λ ,
where the first term is related to the bulk resistivity (a resistive element) and the second term is related to the surface and bulk effects. The surfaces effects are connected to the kinetic processes between the electrode and electrolyte. The bulk effects may be connected to the structure of the media. In both cases, the dispersion on the frequency due to the surface or bulk effects can be related to constant phase elements [32,37]. Equation (48) combines the previous case, i.e., the presence of the fractional time derivative, with the non-blocking boundary conditions stated by Equation (34). For this reason, we may assume that it can be used to model anomalous behavior promoted by the surface or bulk effects that are not suitably described in the normal approach.
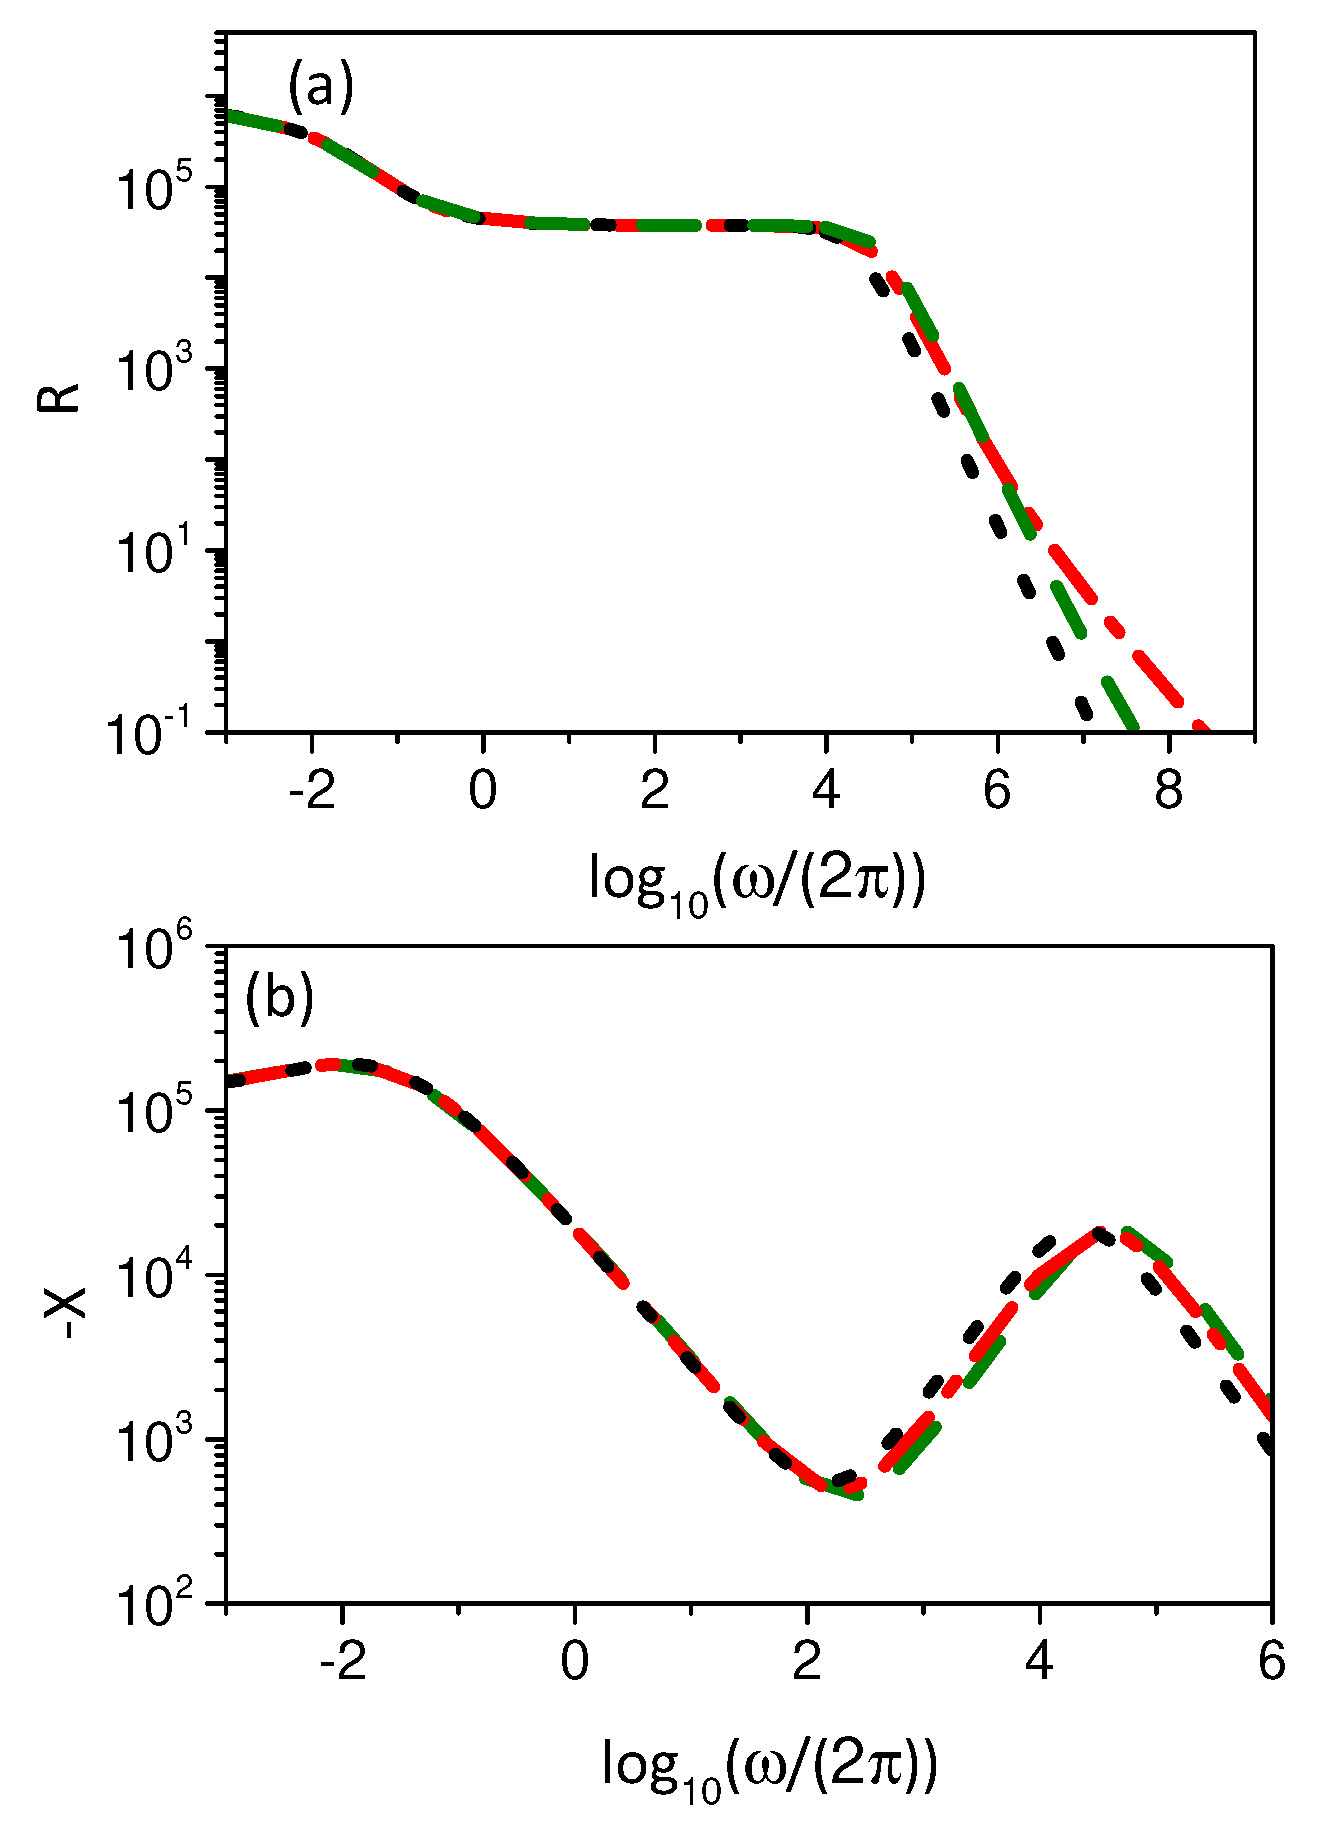
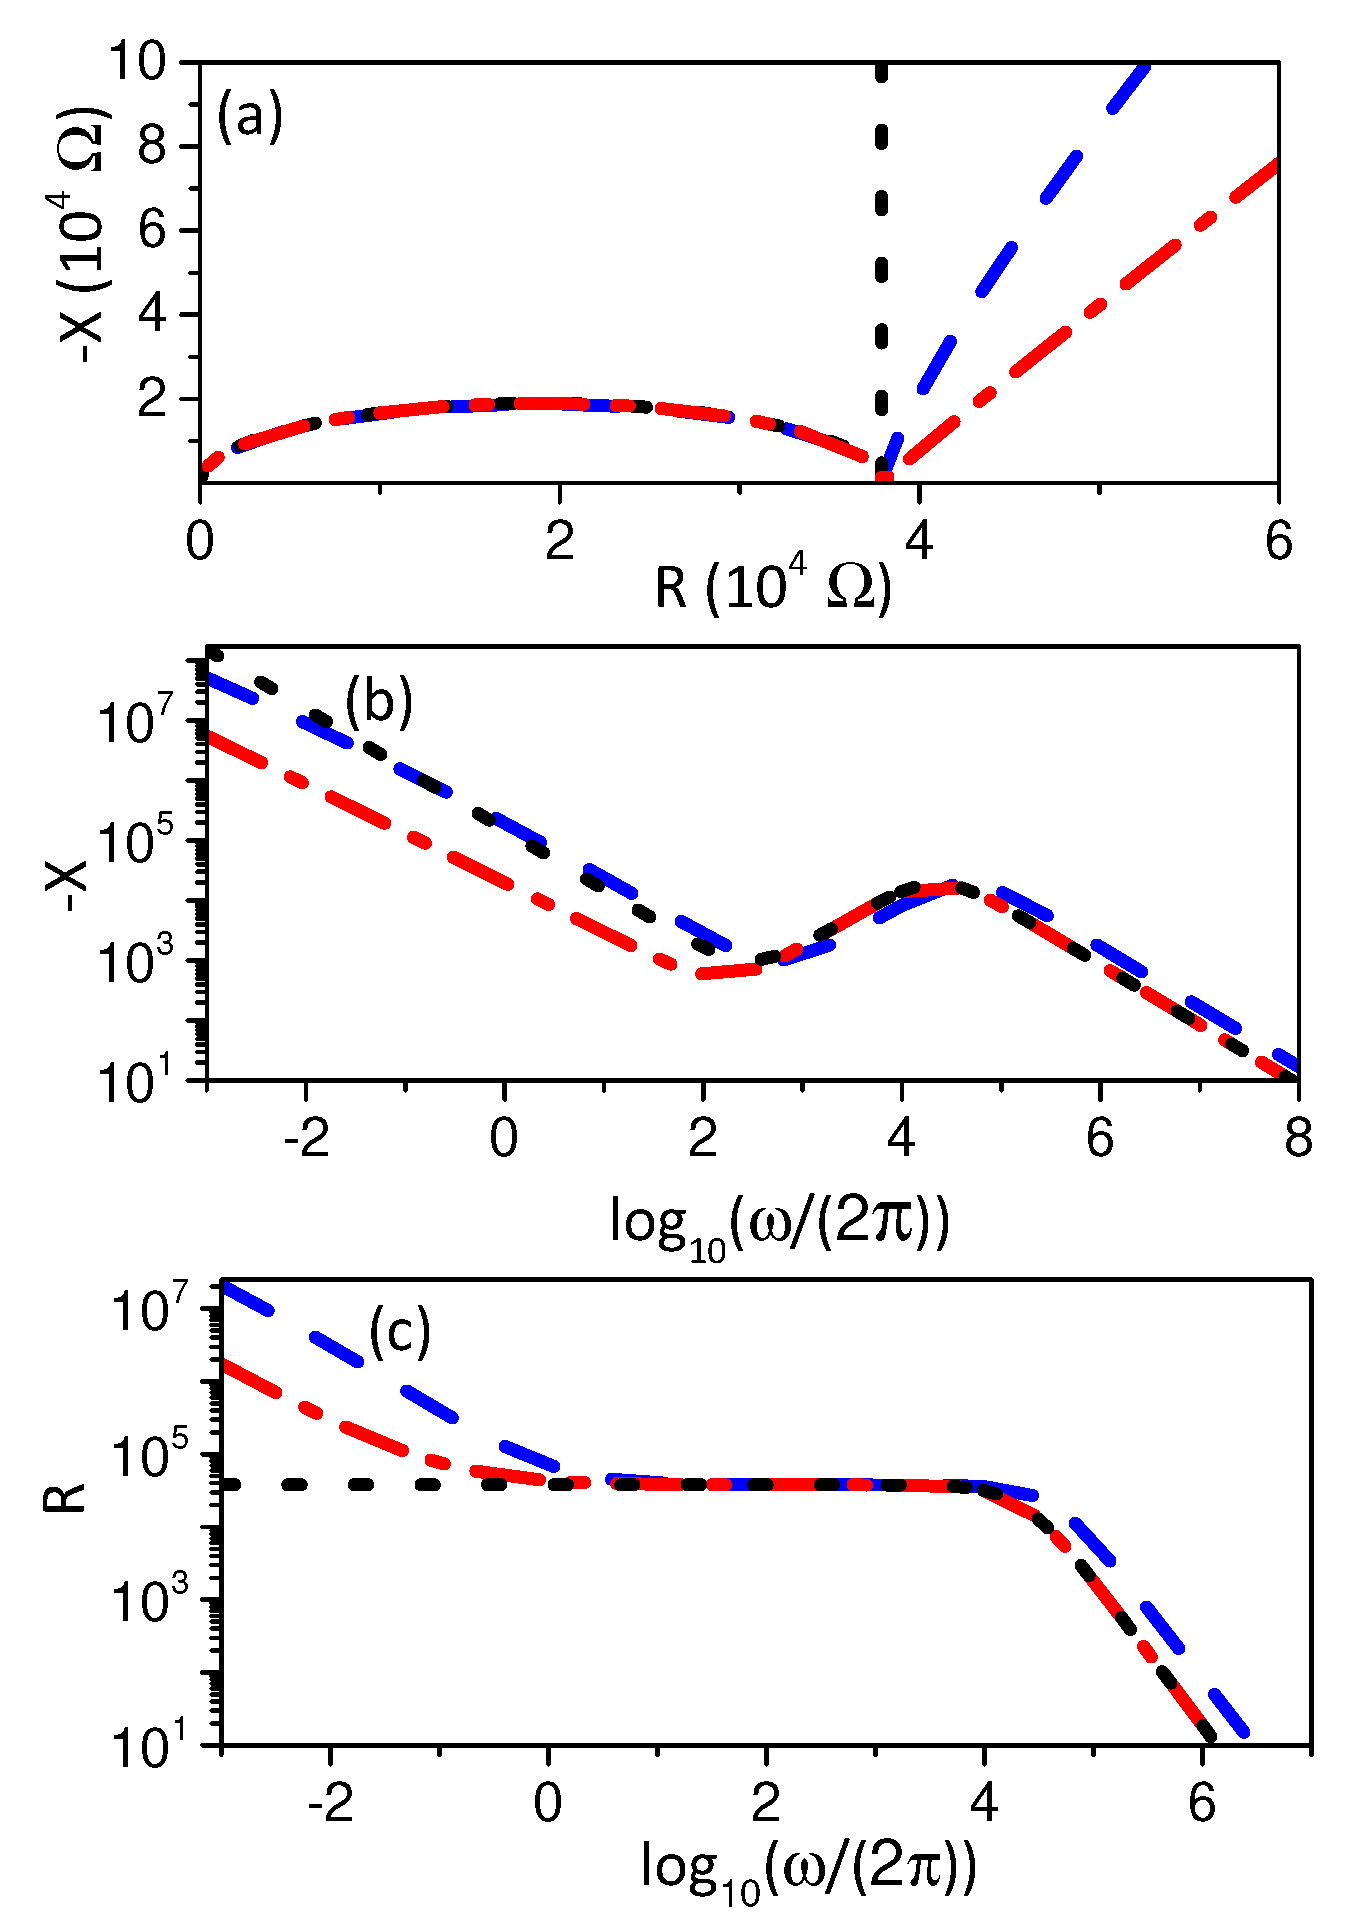
Figure 3 shows the behavior for the real and imaginary parts of Equation (48) by considering different possible scenarios. One of them focuses the surface effects (black dotted line) accounted for by means of the boundary conditions given by Equation (48) and the standard continuity equation. In this case, the behavior in the low-frequency limit is entirely governed by the surface effects whereas the behavior in the other limit (high-frequency) is essentially usual. The other curves (red dashed-dotted and green dashed lines) show the effect of the fractional derivative of distributed order in the continuity equation for two different values of γ . The behavior in the low-frequency limit for the set of parameters considered here is essentially governed by the choice of the boundary conditions. The bulk dynamics govern the high-frequency limit and modify the relaxation times present in this limit. Figure 4 and Figure 5 show the behavior of the impedance by considering the Nyquist diagram, imaginary and real parts of the impedance, and the electrical conductivity for different scenarios. In the low-frequency limit, they show that the behavior is not usual and may be related to a constant phase element, i.e., CPE, since Z 1 / ( i ω ) γ with γ < 1 instead of the usual capacitive behavior Z 1 / ( i ω ) . The behavior of the electrical conductivity shows that non-blocking boundary conditions (red dashed-dotted line) only promote an anomalous behavior in the low-frequency limit, which can be directly related to the processes present on the surface, as pointed out in Ref. [38]. On the other hand, changes in the continuity equation by incorporating fractional time derivatives of distributed order promote an anomalous behavior in the low and high-frequency limit.

4. Discussion and Conclusions

We have analyzed the role of the displacement current in the PNP model for electrical impedance when the bulk and surface dynamics incorporate the time-fractional approach. We have started our discussion by presenting how the total electric current arises in this extended model. The result shows that the displacement current has to be modified according to the extension carried out on the PNP model. In particular, for the case of the fractional time-derivative of distributed order in the continuity equation, the displacement current coincides with the one used recently in some generalizations of the Maxwell equations for material media involving fractional-order operators [24,25]. Other extensions, such as the one represented by Equation (20), yield different forms of the displacement current, which have a direct effect on the electrical response. One of the consequences of the extensions analyzed in this work is the presence of a CPE-like behavior of the electrical impedance in the low-frequency region of the spectra. This feature has shown to be a powerful tool to face a wide variety of complex behavior found in electrolytic cells, as discussed in Refs. [31,38]. This behavior has also been related to anomalous diffusion processes by means of the electrical conductivity, with subdiffusive characteristics in several scenarios [3,38]. On the other hand, it is also possible to obtain an anomalous behavior in the high-frequency limit, which is not typical of liquid samples but, perhaps, more closely related to solid or semiconductors systems [3]. To sum up, we remark that the results obtained here may be useful in the discussion of modifications of the PNP model in order to account for the role of the anomalous behavior in the electrical impedance measurements.

Author Contributions

Conceptualization, A.M.S., G.B., L.R.E. and E.K.L.; methodology, A.M.S., G.B., L.R.E. and E.K.L.; formal analysis, A.M.S., G.B., L.R.E. and E.K.L.; investigation, A.M.S., G.B., L.R.E. and E.K.L.; writing—original draft preparation, A.M.S., G.B., L.R.E. and E.K.L.; writing—review and editing, A.M.S., G.B., L.R.E. and E.K.L. All authors have read and agreed to the published version of the manuscript.

Funding

This work was partially supported by the MEPhI Program Priority 2030 (G.B.) and by the Program of Visiting Professor of Politecnico di Torino (L.R.E.). E.K.L. thanks partial financial support of the CNPq under Grant No. 302983/2018-0.

Institutional Review Board Statement

Not applicable.

Informed Consent Statement

Not applicable.

Conflicts of Interest

The authors declare no conflict of interest.

References

  1. Macdonald, J.R.; Johnson, W.B. Fundamental of impedance spectroscopy. In Impedance Spectroscopy, Theory, Experiment, and Applications; Barsoukov, E., Macdonald, J.R., Eds.; Wiley: New York, NY, USA, 2005; pp. 1–26. [Google Scholar]
  2. Orazem, M.E.; Tribollet, B. Electrochemical Impedance Spectroscopy; Wiley: New York, NY, USA, 2008. [Google Scholar]
  3. Sidebottom, D.L. Colloquium: Understanding ion motion in disordered solids from impedance spectroscopy scaling. Rev. Mod. Phys. 2009, 81, 999. [Google Scholar] [CrossRef]
  4. Macdonald, J.R. Theory of ac space–charge polarization effects in photoconductors, Semiconductors, and Electrolytes. Phys. Rev. 1953, 92, 4–17. [Google Scholar] [CrossRef]
  5. Trukhan, E.M. Dispersion of the dielectric constant of heterogeneous systems. Sov. Phys. Solid State (Engl. Transl.) 1963, 4, 2560. [Google Scholar]
  6. Basu, T.; Goswami, M.M.; Middya, T.R.; Tarafdar, S. Morphology and Ion-Conductivity of Gelatin-LiClO4 Films: Fractional Diffusion Analysis. J. Phys. Chem. B 2012, 116, 11362–11369. [Google Scholar] [CrossRef]
  7. Basu, T.; Giri, A.; Tarafdar, S.; Das, S. Electrical impedance response of gamma irradiated gelatin based solid polymer electrolytes analyzed using a generalized calculus formalism. J. Electroanal. Chem. 2015, 755, 52–62. [Google Scholar] [CrossRef] [Green Version]
  8. Majumdar, S.; Ray, R.; Sen, P. Anomalous intra diffusive behavior of chitosan/PVDF solid polymer electrolytes and the enhancement of effective specific capacitance with nanostructured spinel MnCoFeO4 electrode in solid-state supercapacitors. Electrochim. Acta 2021, 385, 138295. [Google Scholar] [CrossRef]
  9. L’vov, P.E.; Sibatov, R.T.; Yavtushenko, I.O.; Kitsuk, E.P. Time-Fractional Phase Field Model of Electrochemical Impedance. Fractal Fract. 2021, 5, 191. [Google Scholar] [CrossRef]
  10. Barbero, G.; Evangelista, L.R.; Lenzi, E.K. Time-Fractional Approach to the Electrochemical Impedance: The Displacement Current. arXiv 2022, arXiv:2201.00731. [Google Scholar]
  11. Lelidis, I.; Barbero, G. Role of the displacement current on Warburg-type behavior. Phys. Rev. E 2017, 95, 052604. [Google Scholar] [CrossRef]
  12. Borukhov, I.; Andelman, D.; Orlandi, H. Steric Effects in Electrolytes: A Modified Poisson-Boltzmann Equation. Phys. Rev. Lett. 1997, 79, 435–438. [Google Scholar] [CrossRef] [Green Version]
  13. Kornyshev, A.A. Double-Layer in Ionic Liquids: Paradigm Change? J. Phys. Chem. B 2007, 111, 5545–5557. [Google Scholar] [CrossRef] [PubMed]
  14. Ochoa-Tapia, J.A.; Valdes-Parada, F.J.; Alvarez-Ramirez, J. A fractional-order Darcy’s law. Physica A 2007, 374, 1–14. [Google Scholar] [CrossRef]
  15. Carcione, J.M.; Sanchez-Sesma, F.J.; Luzón, F.; Gavilán, J.J.P. Theory and simulation of time-fractional fluid diffusion in porous media. J. Phys. A 2013, 46, 345501. [Google Scholar] [CrossRef]
  16. Zhou, H.W.; Yang, S. Fractional derivative approach to non-Darcian flow in porous media. J. Hydrol. 2018, 566, 910–918. [Google Scholar] [CrossRef]
  17. Prakasha, D.G.; Veeresha, P.; Singh, J. Fractional approach for equation describing the water transport in unsaturated porous media with Mittag-Leffler kernel. Front. Phys. 2019, 7, 193. [Google Scholar] [CrossRef] [Green Version]
  18. Metzler, R.; Klafter, J. The random walk’s guide to anomalous diffusion: A fractional dynamics approach. Phys. Rep. 2000, 339, 1–77. [Google Scholar] [CrossRef]
  19. Chechkin, A.V.; Gorenflo, R.; Sokolov, I.M. Retarding subdiffusion and accelerating superdiffusion governed by distributed-order fractional diffusion equations. Phys. Rev. E 2002, 66, 046129. [Google Scholar] [CrossRef] [Green Version]
  20. Mainardi, F.; Pagnini, G.; Gorenflo, R. Some aspects of fractional diffusion equations of single and distributed order. App. Math. Comp. 2007, 187, 295–305. [Google Scholar] [CrossRef] [Green Version]
  21. Li, H.; Zheng, K.; Yang, J.; Zhao, J. Anomalous Diffusion Inside Soft Colloidal Suspensions Investigated by Variable Length Scale Fluorescence Correlation Spectroscopy. ACS Omega 2020, 5, 11123–11130. [Google Scholar] [CrossRef]
  22. Chepizhko, O.; Peruani, F. Diffusion, subdiffusion, and trapping of active particles in heterogeneous media. Phys. Rev. Lett. 2013, 111, 160604. [Google Scholar] [CrossRef] [Green Version]
  23. O’Shaughnessy, B.; Procaccia, I. Analytical solutions for diffusion on fractal objects. Phys. Rev. Lett. 1985, 54, 455. [Google Scholar] [CrossRef] [PubMed]
  24. Bogolyubov, A.N.; Potapov, A.A.; Rehviashvili, S.S. An approach to introducing fractional integro-differentiation in classical electrodynamics. Mosc. Univ. Phys. Bull. 2009, 64, 365–368. [Google Scholar] [CrossRef]
  25. Stefański, T.P.; Gulgowski, J. Formulation of time-fractional electrodynamics based on Riemann-Silberstein vector. Entropy 2021, 23, 987. [Google Scholar] [CrossRef] [PubMed]
  26. Barbero, G.; Macdonald, J.R. Transport process of ions in insulating media in the hyperbolic diffusion regime. Phys. Rev. E 2010, 81, 051503. [Google Scholar] [CrossRef] [Green Version]
  27. Tateishi, A.A.; Ribeiro, H.V.; Lenzi, E.K. The role of fractional time-derivative operators on anomalous diffusion. Front. Phys. 2017, 5, 52. [Google Scholar] [CrossRef] [Green Version]
  28. Lenzi, E.K.; Evangelista, L.R.; Barbero, G. Fractional diffusion equation and impedance spectroscopy of electrolytic cells. J. Phys. Chem. B 2009, 113, 11371–11374. [Google Scholar] [CrossRef]
  29. Scher, H.; Lax, M. Stochastic transport in a disordered solid. I. Theory. Phys. Rev. B 1973, 7, 4491–4502. [Google Scholar] [CrossRef]
  30. Scher, H.; Lax, M. Stochastic transport in a disordered solid. II. Impurity conduction. Phys. Rev. B 1973, 7, 4502–4519. [Google Scholar] [CrossRef]
  31. Evangelista, L.R.; Lenzi, E.K. Fractional Diffusion Dquations and Anomalous Diffusion; Cambridge University Press: Cambridge, UK, 2018. [Google Scholar]
  32. Lenzi, E.K.; de Paula, J.L.; Silva, F.R.G.B.; Evangelista, L.R. A connection between anomalous Poisson-Nernst-Planck model and equivalent circuits with constant phase elements. J. Phys. Chem. C 2013, 117, 23685–23690. [Google Scholar] [CrossRef]
  33. Lenzi, E.K.; Evangelista, L.R.; Taghizadeh, L.; Pasterk, D.; Zola, R.S.; Sandev, T.; Heitzinger, C.; Petreska, I. Reliability of Poisson–Nernst–Planck anomalous models for impedance spectroscopy. J. Phys. Chem. B 2019, 123, 7885–7892. [Google Scholar] [CrossRef]
  34. Ciuchi, F.; Mazzulla, A.; Scaramuzza, N.; Lenzi, E.K.; Evangelista, L.R. Fractional diffusion equation and the electrical impedance: Experimental evidence in liquid-crystalline cells. J. Phys. Chem. C 2012, 116, 8773–8777. [Google Scholar] [CrossRef]
  35. Evangelista, L.R.; Lenzi, E.K.; Barbero, G.; Macdonald, J.R. On the equivalence between specific adsorption and kinetic equation descriptions of the admittance response in electrolytic cells. J. Chem. Phys. 2013, 138, 114702. [Google Scholar] [CrossRef] [PubMed] [Green Version]
  36. Friauf, R.J. Polarization effects in the ionic conductivity of silver bromide. J. Chem. Phys. 1954, 22, 1329–1338. [Google Scholar] [CrossRef]
  37. Jorcin, J.; Orazem, M.E.; Pébére, N.; Tribollet, B. CPE analysis by local electrochemical impedance spectroscopy. Electrochim. Acta 2006, 51, 1473–1479. [Google Scholar] [CrossRef]
  38. Lenzi, E.K.; Zola, R.S.; Ribeiro, H.V.; Vieira, D.S.; Ciuchi, F.; Mazzulla, A.; Scaramuzza, N.; Evangelista, L.R. Ion motion in electrolytic cells: Anomalous diffusion evidences. J. Phys. Chem. B 2017, 121, 2882–2886. [Google Scholar] [CrossRef]
Figure 1. (a) Nyquist diagram for different values of γ , with Φ ( i ω ) = ( i ω ) γ , which implies p ( γ ) = δ ( γ γ ) . (b) Imaginary part of the impedance for different values of γ . (c) R vs. ω in the same range of frequency. The black (solid), green (dotted), and blue (dashed) lines correspond to the cases γ = 1.0 , γ = 0.9 , and γ = 0.7 , respectively. We consider, for illustrative purposes, D = 2.0 × 10 9 m 2 /s, S = 3.1415 × 10 4 m 2 , ε = 90 ε 0 ( ε 0 = 8.85 × 10 12 F/m), d = 1.33 × 10 3 m, τ = 1 s, and λ = 1.19 × 10 7 m.
Physchem 02 00012 g001
Figure 2. Electrical conductivity, σ R vs. ω for different values of γ as in Figure 1, where σ R = S / d σ .
Physchem 02 00012 g002
Figure 3. (a) Real and (b) imaginary parts of the impedance obtained from Equation (48) for different values of γ , with Φ ( i ω ) = p ( i ω ) + ( 1 p ) ( i ω ) γ (with p = c o n s t ) and k ( i ω ) = κ α ( i ω ) α + κ α ( i ω ) α (with κ = c o n s t , α = 0.8 , and α = 0.1 ). The black (dotted), green (dashed), and red (dashed-dotted) lines correspond to the cases γ = 1.0 , γ = 0.9 (with p = 1 / 2 ), and γ = 0.7 (with p = 1 / 2 ), respectively. We consider, for illustrative purposes, D = 2.0 × 10 9 m 2 /s, S = 3.14 × 10 4 m 2 , ε = 90 ε 0 ( ε 0 = 8.85 × 10 12 F/m), d = 1.33 × 10 3 m, τ = 1 s, κ α = 1.11 × 10 6 m/s 1 α , κ α = 3.00 × 10 7 m/s 1 α , and λ = 1.19 × 10 7 m.
Physchem 02 00012 g003
Figure 4. (a) Nyquist diagram, (b) the imaginary, and (c) real parts of the impedance obtained from Equation (48) for different values of γ and α , with Φ ( i ω ) = p ( i ω ) + ( 1 p ) ( i ω ) γ (with p = c o n s t ) and k ( i ω ) = κ ( i ω ) α (with κ = c o n s t ). The black (dotted), red (dashed-dotted), and blue (dashed) lines correspond to the cases γ = 1.0 with k ( i ω ) = 0 , γ = 1.0 with k ( i ω ) 0 (with α = 0.8 ), and γ = 0.7 (with p = 1 / 2 ) and k ( i ω ) = 0 , respectively. We consider, for illustrative purposes, D = 2.0 × 10 9 m 2 /s, S = 3.14 × 10 4 m 2 , ε = 90 ε 0 ( ε 0 = 8.85 × 10 12 F/m), d = 1.33 × 10 3 m, τ = 1 s, κ = 1.11 × 10 6 m/s 1 α , and λ = 1.19 × 10 7 m.
Physchem 02 00012 g004
Figure 5. Electrical conductivity obtained from the impedance given by Equation (48), for different values of γ and η , with Φ ( i ω ) = p ( i ω ) + ( 1 p ) ( i ω ) γ (with p = c o n s t ) and k ( i ω ) = κ ( i ω ) α (with κ = c o n s t ). The black (dotted), red (dashed-dotted), and blue (dashed) lines correspond to the cases γ = 1.0 with k ( i ω ) = 0 , γ = 1.0 with k ( i ω ) 0 (with α = 0.8 ), and γ = 0.7 (with p = 1 / 2 ) and k ( i ω ) = 0 , respectively. We consider, for illustrative purposes, D = 2.0 × 10 9 m 2 /s, S = 3.14 × 10 4 m 2 , ε = 90 ε 0 ( ε 0 = 8.85 × 10 12 F/m), d = 1.33 × 10 3 m, κ = 1.11 × 10 6 m/s 1 α , τ = 1 s, and λ = 1.19 × 10 7 m.
Physchem 02 00012 g005
Publisher’s Note: MDPI stays neutral with regard to jurisdictional claims in published maps and institutional affiliations.