
Phase Change Materials with Enhanced Thermal Conductivity and Heat Propagation in Them

Abstract
:1. Introduction
2. Physical, Chemical, and Thermophysical Characteristics of PCMs
- Thermophysical Requirements:
- Melting point suitable for a specific application of PCMs (between 20 and 80 °C);
- High value of:
- (i)
- Melting heat.
- (ii)
- Specific heat capacity.
- (iii)
- Thermal conductivity of solid and liquid phases.
- (iv)
- Density.
- (v)
- Phase change rate.
- Cyclic stability.
- Low pressure of PCM vapor.
- Small volume change during melting.
- Homogenous structure.
- Chemical requirements
- Stability.
- No degradation during crystallization/melting.
- Reversibility of crystallization/melting.
- Incombustibility.
- Nontoxicity.
- Explosion safety.
- Economic and ecological requirements:
- Low cost.
- High economic efficiency.
- Availability.
- Ecological safety.
3. Parameters of Heat Storage Systems
4. Thermal Conductivity of Carbon Nanoparticles
5. Thermal Conduction of Polymer Composites Doped with Carbon Nanoparticles
6. Conclusions
Funding
Institutional Review Board Statement
Informed Consent Statement
Acknowledgments
Conflicts of Interest
References
- Sharifi, N.P.; Shaikh, A.A.N.; Sakulich, A.R. Application of phase change materials in gypsum boards to meet building energy conservation goals. Energy Build. 2017, 138, 455–467. [Google Scholar] [CrossRef]
- Medina, M.A.; King, J.B.; Zhang, M. On the heat transfer rate reduction of structural insulated panels (SIPs) outfitted with phase change materials (PCMs). Energy 2008, 33, 667–678. [Google Scholar] [CrossRef]
- Vicente, R.; Silva, T. Brick masonry walls with PCM macrocapsules: An experimental approach. Appl. Therm. Eng. 2014, 67, 24–34. [Google Scholar] [CrossRef]
- Peippo, K.; Kauranen, P.; Lund, P. A multicomponent PCM wall optimized for passive solar heating. Energy Build. 1991, 17, 259–270. [Google Scholar] [CrossRef]
- Kenisarin, M.; Mahkamov, K. Passive thermal control in residential buildings using phase change materials. Renew. Sustain. Energy Rev. 2016, 55, 371–398. [Google Scholar] [CrossRef]
- Fang, Y.; Niu, J.; Deng, S.S. Numerical analysis for maximizing effective energy storage capacity of thermal energy storage systems by enhancing heat transfer in PCM. Energy Build. 2018, 160, 10–18. [Google Scholar] [CrossRef]
- Abdulrahman, R.S.; Ibrahim, F.A.; Dakhil, S.F. Development of paraffin wax as phase change material based latent heat storage in heat exchanger. Appl. Therm. Eng. 2019, 150, 193–199. [Google Scholar] [CrossRef]
- Li, W.; Qu, Z.; He, Y.; Tao, Y. Experimental study of a passive thermal management system for high-powered lithium ion batteries using porous metal foam saturated with phase change materials. J. Power Sources 2014, 255, 9–15. [Google Scholar] [CrossRef]
- Zhu, L.; Yang, Y.; Chen, S.; Sun, Y. Numerical study on the thermal performance of lightweight temporary building integrated with phase change materials. Appl. Therm. Eng. 2018, 138, 35–47. [Google Scholar] [CrossRef]
- Zhu, N.; Ma, Z.; Wang, S. Dynamic characteristics and energy performance of buildings using phase change materials: A review. Energy Convers. Manag. 2009, 50, 3169–3181. [Google Scholar] [CrossRef]
- Kusama, Y.; Ishidoya, Y. Thermal effects of a novel phase change material (PCM) plaster under different insulation and heating scenarios. Energy Build. 2017, 141, 226–237. [Google Scholar] [CrossRef]
- Wang, S.-M.; Matiašovský, P.; Mihálka, P.; Lai, C.-M. Experimental investigation of the daily thermal performance of a mPCM honeycomb wallboard. Energy Build. 2018, 159, 419–425. [Google Scholar] [CrossRef]
- Borodulin, V.Y.; Nizovtsev, M.I. Heat-inertial properties of walls of lightweight thermal insulation with phase change materials. J. Phys. Conf. Ser. 2018, 1105, 012108. [Google Scholar] [CrossRef]
- Zalba, B.; Marín, J.M.; Cabeza, L.F.; Mehling, H. Free-cooling of buildings with phase change materials. Int. J. Refrig. 2004, 27, 839–849. [Google Scholar] [CrossRef]
- Kandasamy, R.; Wang, X.-Q.; Mujumdar, A.S. Application of phase change materials in thermal management of electronics. Appl. Therm. Eng. 2007, 27, 2822–2832. [Google Scholar] [CrossRef]
- Gharbi, S.; Harmand, S.; Ben Jabrallah, S. Experimental comparison between different configurations of PCM based heat sinks for cooling electronic components. Appl. Therm. Eng. 2015, 87, 454–462. [Google Scholar] [CrossRef]
- Temirel, M.; Hu, H.; Shabgard, H.; Boettcher, P.; McCarthy, M.; Sun, Y. Solidification of additive-enhanced phase change materials in spherical enclosures with convective cooling. Appl. Therm. Eng. 2017, 111, 134–142. [Google Scholar] [CrossRef] [Green Version]
- Kenisarin, M.M. Short-term storage of solar energy. 1: Low temperature phase-change materials. Appl. Sol. Energy 1993, 29, 48–65. [Google Scholar]
- Royon, L.; Karim, L.; Bontemps, A. Optimization of PCM embedded in a floor panel developed for thermal management of the lightweight envelope of buildings. Energy Build. 2014, 82, 385–390. [Google Scholar] [CrossRef]
- Chiu, Y.-J.; Yan, W.-M.; Chiu, H.-C.; Jang, J.-H.; Ling, G.-Y. Investigation on the thermophysical properties and transient heat transfer characteristics of composite phase change materials. Int. Commun. Heat Mass Transf. 2018, 98, 223–231. [Google Scholar] [CrossRef]
- Tokuç, A.; Başaran, T.; Yesügey, S.C. An experimental and numerical investigation on the use of phase change materials in building elements: The case of a flat roof in Istanbul. Energy Build. 2015, 102, 91–104. [Google Scholar] [CrossRef] [Green Version]
- Ho, C.J.; Chen, C.P.; Lai, C.-M. The effects of geometric parameters on the thermal performance of a rectangular natural circulation loop containing PCM suspensions. Numer. Heat Transf. Part A Appl. 2016, 70, 1313–1329. [Google Scholar] [CrossRef]
- Vasil’ev, E.N.; Derevyanko, V.A. The dynamics of phase changes in a heat storage of thermal control system for onboard radio-electronic equipment. Thermophys. Aeromech. 2018, 25, 461–467. [Google Scholar] [CrossRef]
- Nizovtsev, M.I.; Borodulin, V.Y.; Letushko, V.N.; Terekhov, V.I.; Poluboyarov, V.A.; Berdnikova, L.K. Heat transfer in a phase change material under constant heat flux. Thermophys. Aeromech. 2019, 26, 313–324. [Google Scholar] [CrossRef]
- Kozak, Y.; Ziskind, G. Novel enthalpy method for modeling of PCM melting accompanied by sinking of the solid phase. Int. J. Heat Mass Transf. 2017, 112, 568–586. [Google Scholar] [CrossRef]
- Usachev, S.M.; Pertsev, V.T.; Khav’yarimana, S. Heat storage materials for building materials and structures. Nauchn. Zh. Stroit. Arkhit. 2018, 2, 68–75. (In Russian) [Google Scholar]
- Aymbetova, I.; Suleymenov, U.; Kambarov, M.; Kalshabekova, E.; Ristavletov, R. Thermophysical properties of phase transparent heat-storing materials used in construction. Adv. Curr. Nat. Sci. 2018, 1, 9–13. [Google Scholar] [CrossRef] [Green Version]
- Abhat, A. Low temperature latent heat thermal energy storage: Heat storage materials. Sol. Energy 1983, 30, 313–332. [Google Scholar] [CrossRef]
- Bendic, V.; Dobrotă, D. Theoretical and Experimental Contributions on the Use of Smart Composite Materials in the Construction of Civil Buildings with Low Energy Consumption. Energies 2018, 11, 2310. [Google Scholar] [CrossRef] [Green Version]
- Bendic, V.; Dobrotă, D.; Dobrescu, T.; Enciu, G.; Pascu, N. Rheological Issues of Phase Change Materials Obtained by the Complex Coacervation of Butyl Stearate in Poly Methyl Methacrylate Membranes. Energies 2019, 12, 917. [Google Scholar] [CrossRef] [Green Version]
- Bendic, V.; Dobrotă, D.; Simion, I.; Bălan, E.; Pascu, N.-E.; Tilina, D.I. Methods for Determining the Thermal Transfer in Phase-Changing Materials (PCMs). Polymers 2020, 12, 467. [Google Scholar] [CrossRef] [PubMed] [Green Version]
- Gariboldi, E.; Colombo, L.P.M.; Fagiani, D.; Li, Z. Methods to Characterize Effective Thermal Conductivity, Diffusivity and Thermal Response in Different Classes of Composite Phase Change Materials. Materials 2019, 12, 2552. [Google Scholar] [CrossRef] [PubMed] [Green Version]
- Lane, G.A.; Shamsundar, N. Solar Heat Storage: Latent Heat Materials, Vol. I: Background and Scientific Principles. J. Sol. Energy Eng. 1983, 105, 467. [Google Scholar] [CrossRef]
- Khudhair, A.M.; Farid, M.M. A review on energy conservation in building applications with thermal storage by latent heat using phase change materials. Energy Convers. Manag. 2004, 45, 263–275. [Google Scholar] [CrossRef]
- Raj, V.A.A.; Velraj, R. Review on free cooling of buildings using phase change materials. Renew. Sustain. Energy Rev. 2010, 14, 2819–2829. [Google Scholar] [CrossRef]
- Cabeza, L.F.; Castell, A.; Barreneche, C.; De Gracia, A.; Fernández, A.I. Materials used as PCM in thermal energy storage in buildings: A review. Renew. Sustain. Energy Rev. 2011, 15, 1675–1695. [Google Scholar] [CrossRef]
- Dincer, I.; Rosen, M.A. Thermal Energy Storage. Systems and Applications; Wiley: Chichester, UK, 2011. [Google Scholar]
- Souayfane, F.; Fardoun, F.; Biwole, P.-H. Phase change materials (PCM) for cooling applications in buildings: A review. Energy Build. 2016, 129, 396–431. [Google Scholar] [CrossRef]
- Zeinelabdein, R.; Omer, S.; Gan, G. Critical review of latent heat storage systems for free cooling in buildings. Renew. Sustain. Energy Rev. 2018, 82, 2843–2868. [Google Scholar] [CrossRef]
- Jaguemont, J.; Omar, N.; Van den Bossche, P.; Mierlo, J. Phase-change materials (PCM) for automotive applications: A review. Appl. Therm. Eng. 2018, 132, 308–320. [Google Scholar] [CrossRef]
- Grigor’Ev, I.S.; Dedov, A.V.; Eletskii, A.V. Phase Change Materials and Power Engineering. Therm. Eng. 2021, 68, 257–269. [Google Scholar] [CrossRef]
- Elias, C.; Stathopoulos, V. A comprehensive review of recent advances in materials aspects of phase change materials in thermal energy storage. Energy Procedia 2019, 161, 385–394. [Google Scholar] [CrossRef]
- Eletskii, A.V. Transport properties of carbon nanotubes. Phys. Uspekhi 2009, 52, 209–224. [Google Scholar] [CrossRef]
- Eletskii, A.V.; Iskandarova, I.M.; Knizhnik, A.A.; Krasikov, D. Graphene: Fabrication methods and thermophysical properties. Phys. Uspekhi 2011, 54, 227–258. [Google Scholar] [CrossRef]
- Erlbeck, L.; Schreiner, P.; Schlachter, K.; Dörnhofer, P.; Fasel, F.; Methner, F.-J.; Rädle, M. Adjustment of thermal behavior by changing the shape of PCM inclusions in concrete blocks. Energy Convers. Manag. 2018, 158, 256–265. [Google Scholar] [CrossRef]
- Silva, T.; Vicente, R.; Amaral, C.; Figueiredo, A. Thermal performance of a window shutter containing PCM: Numerical validation and experimental analysis. Appl. Energy 2016, 179, 64–84. [Google Scholar] [CrossRef]
- Yamamoto, T.; Watanabe, S.; Watanabe, K. Universal Features of Quantized Thermal Conductance of Carbon Nanotubes. Phys. Rev. Lett. 2004, 92, 075502. [Google Scholar] [CrossRef] [Green Version]
- Brown, E.; Hao, L.; Gallop, J.C.; Macfarlane, J.C. Ballistic thermal and electrical conductance measurements on individual multiwall carbon nanotubes. Appl. Phys. Lett. 2005, 87, 023107. [Google Scholar] [CrossRef]
- Dresselhaus, M.S.; Dresselhaus, G.; Eklund, P.C. Science of Fullerenes and Carbon Nanotubes; Academic Press: San Diego, CA, USA, 1996. [Google Scholar]
- Saito, R.; Dresselhaus, M.S.; Dresselhaus, G. Physical Properties of Carbon Nanotubes; Imperial Colledge Press: London, UK, 1998. [Google Scholar]
- Dresselhaus, M.S.; Dresselhaus, G.; Avouris, P. (Eds.) Carbon Nanotubes: Synthesis, Structure, Properties, and Applications; Springer: Berlin/Heidelberg, Germany, 2001. [Google Scholar]
- Ghosh, S.; Calizo, I.; Teweldebrhan, D.; Pokatilov, E.P.; Nika, D.L.; Balandin, A.A.; Bao, W.; Miao, F.; Lau, C.N. Extremely high thermal conductivity of graphene: Prospects for thermal management applications in nanoelectronic circuits. Appl. Phys. Lett. 2008, 92, 151911. [Google Scholar] [CrossRef]
- Balandin, A.A.; Ghosh, S.; Bao, W.; Calizo, I.; Teweldebrhan, D.; Miao, F.; Lau, C.N. Superior Thermal Conductivity of Single-Layer Graphene. Nano Lett. 2008, 8, 902–907. [Google Scholar] [CrossRef]
- Ghosh, S.; Bao, W.; Nika, D.L.; Subrina, S.; Pokatilov, E.P.; Lau, C.N.; Balandin, A.A. Dimensional crossover of thermal transport in few-layer graphene. Nat. Mater. 2010, 9, 555–558. [Google Scholar] [CrossRef]
- Abedpour, N.; Neek-Amal, M.; Asgari, R.; Shahbazi, F.; Nafari, N.; Tabar, M.R.R. Roughness of undoped graphene and its short-range induced gauge field. Phys. Rev. B 2007, 76, 195407. [Google Scholar] [CrossRef] [Green Version]
- Klemens, P.; Pedraza, D. Thermal conductivity of graphite in the basal plane. Carbon 1994, 32, 735–741. [Google Scholar] [CrossRef]
- Klemens, P.G. The Scattering of Low-Frequency Lattice Waves by Static Imperfections. Proc. Phys. Soc. Sect. A 1955, 68, 1113–1128. [Google Scholar] [CrossRef]
- Klemens, P.G. Theory of the A-plane thermal conductivity of graphene. J. Wide Bandgap Mater. 2000, 7, 332. [Google Scholar] [CrossRef]
- Nika, D.; Pokatilov, E.P.; Askerov, A.S.; Balandin, A. Phonon thermal conduction in graphene: Role of Umklapp and edge roughness scattering. Phys. Rev. B 2009, 79, 155413. [Google Scholar] [CrossRef] [Green Version]
- Schwamb, T.; Burg, B.R.; Schirmer, N.C.; Poulikakos, D. An electrical method for the measurement of the thermal and electrical conductivity of reduced graphene oxide nanostructures. Nanotechnology 2009, 20, 405704. [Google Scholar] [CrossRef]
- Hummers, W.S., Jr.; Offeman, R.E. Preparation of Graphitic Oxide. J. Am. Chem. Soc. 1958, 80, 1339. [Google Scholar] [CrossRef]
- Bocharov, G.; Eletskii, A. Percolation Conduction of Carbon Nanocomposites. Int. J. Mol. Sci. 2020, 21, 7634. [Google Scholar] [CrossRef]
- Bocharov, G.; Eletskii, A.; Mel’Nikov, V. Electrical properties of thermally reduced graphene oxide. Nanosyst. Phys. Chem. Math. 2018, 9, 98–101. [Google Scholar] [CrossRef]
- Bocharov, G.S.; Eletskii, A.V. Percolation Transition under Thermal Reduction of Graphene Oxide. J. Struct. Chem. 2018, 59, 806–814. [Google Scholar] [CrossRef]
- Nika, D.; Ghosh, S.; Pokatilov, E.P.; Balandin, A. Lattice thermal conductivity of graphene flakes: Comparison with bulk graphite. Appl. Phys. Lett. 2009, 94, 203103. [Google Scholar] [CrossRef] [Green Version]
- Knizhnik, A.; Eletskii, A.; Iskandarova, I.; Krasikov, D.; Potapkin, B.; Tilak, V.; Raghavan, K. Molecular dynamics calculation of the thermal conductivity of graphene. In Proceedings of the MRS Conference, Boston, MA, USA, 13–17 April 2009. [Google Scholar]
- Hu, J.; Ruan, X.; Chen, Y.P. Thermal Conductivity and Thermal Rectification in Graphene Nanoribbons: A Molecular Dynamics Study. Nano Lett. 2009, 9, 2730–2735. [Google Scholar] [CrossRef] [PubMed] [Green Version]
- Kondo, N.; Yamamoto, T.; Watanabe, K. Molecular-dynamics simulations of thermal transport in carbon nanotubes with structural defects. e-J. Surf. Sci. Nanotechnol. 2006, 4, 239–243. [Google Scholar] [CrossRef] [Green Version]
- Bauhofer, W.; Kovacs, J.Z. A review and analysis of electrical percolation in carbon nanotube polymer composites. Compos. Sci. Technol. 2009, 69, 1486–1498. [Google Scholar] [CrossRef]
- Aryanfar, A.; Medlej, S.; Tarhini, A.; Damadi, S.R.; Tehrani, A.R.B.; Goddard, W.A., III. 3D percolation modeling for predicting the thermal conductivity of graphene-polymer composites. Comput. Mater. Sci. 2021, 197, 110650. [Google Scholar] [CrossRef]
- Burger, N.; Laachachi, A.; Ferriol, M.; Lutz, M.; Toniazzo, V.; Ruch, D. Review of thermal conductivity in composites: Mechanisms, parameters and theory. Prog. Polym. Sci. 2016, 61, 1–28. [Google Scholar] [CrossRef]
- Li, A.; Zhang, C.; Zhang, Y.-F. Thermal Conductivity of Graphene-Polymer Composites: Mechanisms, Properties, and Applications. Polymers 2017, 9, 437. [Google Scholar] [CrossRef] [Green Version]
- Chen, H.; Ginzburg, V.V.; Yang, J.; Yang, Y.; Liu, W.; Huang, Y.; Du, L.; Chen, B. Thermal conductivity of polymer-based composites: Fundamentals and applications. Prog. Polym. Sci. 2016, 59, 41–85. [Google Scholar] [CrossRef]
- Yu, A.; Ramesh, P.; Itkis, M.E.; Bekyarova, E.; Haddon, R.C. Graphite Nanoplatelet−Epoxy Composite Thermal Interface Materials. J. Phys. Chem. C 2007, 111, 7565–7569. [Google Scholar] [CrossRef]
- Irwin, P.C.; Cao, P.; Bansal, A.; Schadler, L.S. Thermal and mechanical properties of polyimide nanocomposites. In Proceedings of the 2003 Annual Report Conference on Electrical Insulation and Dielectric Phenomena, Albuquerque, NM, USA, 19–22 October 2003; pp. 120–123. [Google Scholar]
- Min, C.; Yu, D.; Cao, J.; Wang, G.; Feng, L. A graphite nanoplatelet/epoxy composite with high dielectric constant and high thermal conductivity. Carbon 2013, 55, 116–125. [Google Scholar] [CrossRef]
- Al-Saygh, A.; Ponnamma, D.; Almaadeed, M.A.; Vijayan, P.P.; Karim, A.; Hassan, M.K. Flexible Pressure Sensor Based on PVDF Nanocomposites Containing Reduced Graphene Oxide-Titania Hybrid Nanolayers. Polymers 2017, 9, 33. [Google Scholar] [CrossRef] [PubMed]
- Li, Y.; Lian, H.; Hu, Y.; Chang, W.; Cui, X.; Liu, Y. Enhancement in Mechanical and Shape Memory Properties for Liquid Crystalline Polyurethane Strengthened by Graphene Oxide. Polymers 2016, 8, 236. [Google Scholar] [CrossRef] [PubMed] [Green Version]
- Kim, D.S.; Dhand, V.; Rhee, K.Y.; Park, S.-J. Study on the Effect of Silanization and Improvement in the Tensile Behavior of Graphene-Chitosan-Composite. Polymers 2015, 7, 527–551. [Google Scholar] [CrossRef] [Green Version]
- Kim, H.; Macosko, C.W. Processing-property relationships of polycarbonate/graphene composites. Polymers 2009, 50, 3797–3809. [Google Scholar] [CrossRef]
- Battegazzore, D.; Fadda, E.; Fina, A. Flexible and High Thermal Conductivity Composites Based on Graphite Nanoplates Paper Impregnated with Polydimethylsiloxane. J. Compos. Sci. 2021, 5, 309. [Google Scholar] [CrossRef]
- Teng, C.C.; Ma, C.C.M.; Lu, C.H.; Yang, S.Y.; Lee, S.H.; Hsiao, M.C.; Yen, M.Y.; Chiou, K.C.; Lee, T.M. Thermal conductivity and structure of non-covalent functionalized graphene/epoxy composites. Carbon 2011, 49, 5107–5116. [Google Scholar] [CrossRef]
- Song, S.H.; Park, K.H.; Kim, B.H.; Choi, Y.W.; Jun, G.H.; Lee, D.J.; Kong, B.S.; Paik, K.W.; Jeon, S. Enhanced thermal conductivity of epoxy-graphene composites by using non-oxidized graphene flakes with non-covalent functionalization. Adv. Mater. 2013, 25, 732–737. [Google Scholar] [CrossRef]
- Wang, F.; Drzal, L.T.; Yan, Q.; Huang, Z. Mechanical properties and thermal conductivity of graphene nanoplatelet/epoxy composites. J. Mater. Sci. 2015, 50, 1082–1093. [Google Scholar] [CrossRef]
- Wan, Y.-J.; Tang, L.-C.; Gong, L.-X.; Yan, D.; Li, Y.-B.; Wu, L.-B.; Jiang, J.-X.; Lai, G.-Q. Grafting of epoxy chains onto graphene oxide for epoxy composites with improved mechanical and thermal properties. Carbon 2014, 69, 467–480. [Google Scholar] [CrossRef]
- Qian, R.; Yu, J.; Wu, C.; Zhai, X.; Jiang, P. Alumina-coated graphene sheet hybrids for electrically insulating polymer composites with high thermal conductivity. RSC Adv. 2013, 3, 17373–17379. [Google Scholar] [CrossRef]
- Sun, R.; Yao, H.; Zhang, H.-B.; Li, Y.; Mai, Y.-W.; Yu, Z.-Z. Decoration of defect-free graphene nanoplatelets with alumina for thermally conductive and electrically insulating epoxy composites. Compos. Sci. Technol. 2016, 137, 16–23. [Google Scholar] [CrossRef]
- Kim, S.Y.; Noh, Y.J.; Yu, J. Thermal conductivity of graphene nanoplatelets filled composites fabricated by solvent-free processing for the excellent filler dispersion and a theoretical approach for the composites containing the geometrized fillers. Compos. Part A Appl. Sci. Manuf. 2015, 69, 219–225. [Google Scholar] [CrossRef]
- Gu, J.; Xie, C.; Li, H.; Dang, J.; Geng, W.; Zhang, Q. Thermal percolation behavior of graphene nanoplatelets/polyphenylene sulfide thermal conductivity composites. Polym. Compos. 2014, 35, 1087–1092. [Google Scholar] [CrossRef]
- Dai, W.; Yu, J.; Liu, Z.; Wang, Y.; Song, Y.; Lyu, J.; Bai, H.; Nishimura, K.; Jiang, N. Enhanced thermal conductivity and retained electrical insulation for polyimide composites with SiC nanowires grown on graphene hybrid fillers. Compos. Part A Appl. Sci. Manuf. 2015, 76, 73–81. [Google Scholar] [CrossRef]
- Tian, L.; Wang, Y.; Li, Z.; Mei, H.; Shang, Y. The thermal conductivity-dependant drag reduction mechanism of water droplets controlled by graphene/silicone rubber composites. Exp. Therm. Fluid Sci. 2017, 85, 363–369. [Google Scholar] [CrossRef]
- Chen, J.; Chen, X.; Meng, F.; Li, D.; Tian, X.; Wang, Z.; Zhou, Z. Super-high thermal conductivity of polyamide-6/graphene-graphene oxide composites through in situ polymerization. High Perform. Polym. 2017, 29, 585–594. [Google Scholar] [CrossRef]
- Guo, W.; Chen, G. Fabrication of graphene/epoxy resin composites with much enhanced thermal conductivity via ball milling technique. J. Appl. Polym. Sci. 2014, 131, 338–347. [Google Scholar] [CrossRef]
- Yu, J.; Qian, R.; Jiang, P. Enhanced thermal conductivity for PVDF composites with a hybrid functionalized graphene sheet-nanodiamond filler. Fibers Polym. 2013, 14, 1317–1323. [Google Scholar] [CrossRef]
- Zong, P.; Fu, J.; Chen, L.; Yin, J.; Dong, X.; Yuan, S.; Shi, L.; Deng, W. Effect of aminopropylisobutyl polyhedral oligomeric silsesquioxane functionalized graphene on the thermal conductivity and electrical insulation properties of epoxy composites. RSC Adv. 2016, 6, 10498–10506. [Google Scholar] [CrossRef]
- Ma, W.-S.; Wu, L.; Yang, F.; Wang, S.-F. Non-covalently modified reduced graphene oxide/polyurethane nanocomposites with good mechanical and thermal properties. J. Mater. Sci. 2014, 49, 562–571. [Google Scholar] [CrossRef]
- Cho, E.-C.; Huang, J.-H.; Li, C.-P.; Chang-Jian, C.-W.; Lee, K.-C.; Hsiao, Y.-S.; Huang, J.-H. Graphene-based thermoplastic composites and their application for LED thermal management. Carbon 2016, 102, 66–73. [Google Scholar] [CrossRef]
- Wang, Z.; Tong, J.; Li, W.; Zhang, H.; Hu, M.; Chen, H.; He, H. Highly Enhancing Electrical, Thermal, and Mechanical Properties of Polypropylene/Graphite Intercalation Compound Composites by In Situ Expansion during Melt Mixing. Polymers 2021, 13, 3095. [Google Scholar] [CrossRef] [PubMed]
- Varenik, M.; Nadiv, R.; Levy, I.; Vasilyev, G.; Regev, O. Breaking through the Solid/Liquid Processability Barrier: Thermal Conductivity and Rheology in Hybrid Graphene–Graphite Polymer Composites. ACS Appl. Mater. Interfaces 2017, 9, 7556–7564. [Google Scholar] [CrossRef] [PubMed]
- Chakraborty, A.K.; Plyhm, T.; Barbezat, M.; Necola, A.; Terrasi, G. Carbon nanotube (CNT)–epoxy nanocomposites: A systematic investigation of CNT dispersion. J. Nanopart. Res. 2011, 13, 6493–6506. [Google Scholar] [CrossRef]
- Tarhini, A.A.; Tehrani-Bagha, A.R. Graphene-based polymer composite films with enhanced mechanical properties and ultra-high in-plane thermal conductivity. Compos. Sci. Technol. 2019, 184, 107797. [Google Scholar] [CrossRef]
- Wang, J.; Li, C.; Li, J.; Weng, G.J.; Su, Y. A multiscale study of the filler-size and temperature dependence of the thermal conductivity of graphene-polymer nanocomposites. Carbon 2021, 175, 259–270. [Google Scholar] [CrossRef]
- Kumar, P.; Yu, S.; Shahzad, F.; Hong, S.M.; Kim, Y.-H.; Koo, C.M. Ultrahigh electrically and thermally conductive self-aligned graphene/polymer composites using large-area reduced graphene oxides. Carbon 2016, 101, 120–128. [Google Scholar] [CrossRef]
- Shahil, K.M.F.; Balandin, A.A. Graphene–Multilayer Graphene Nanocomposites as Highly Efficient Thermal Interface Materials. Nano Lett. 2012, 12, 861–867. [Google Scholar] [CrossRef] [PubMed] [Green Version]
- Ji, C.; Yan, C.; Wang, Y.; Xiong, S.; Zhou, F.; Li, Y.; Sun, R.; Wong, C.-P. Thermal conductivity enhancement of CNT/MoS2/graphene−epoxy nanocomposites based on structural synergistic effects and interpenetrating network. Compos. Part B Eng. 2019, 163, 363–370. [Google Scholar] [CrossRef]
- Yan, H.; Tang, Y.; Long, W.; Li, Y. Enhanced thermal conductivity in polymer composites with aligned graphene nanosheets. J. Mater. Sci. 2014, 49, 5256–5264. [Google Scholar] [CrossRef]
- Liu, Z.-P.; Yang, R. Synergistically-Enhanced Thermal Conductivity of Shape-Stabilized Phase Change Materials by Expanded Graphite and Carbon Nanotube. Appl. Sci. 2017, 7, 574. [Google Scholar] [CrossRef] [Green Version]


| Number of Carbon Atoms in Molecule | Phase Transition Temperature, °C | Melting Heat, J/g | Liquid State Density, kg/m3 | Thermal Conductivity, W/m K |
|---|---|---|---|---|
| 9–12 | −9 to −53 | 184 | 686 | 0.15 |
| 13–16 | −6 to 18 | 196 | 716 | 0.19 |
| 16–18 | 18 to 28 | 212 | 734 | 0.21 |
| 16–28 | 42 to 44 | 214 | 765 | 0.21 |
| 20–33 | 48 to 50 | 218 | 769 | 0.21 |
| 22–45 | 58 to 60 | 221 | 795 | 0.21 |
| 24–50 | 66 to 68 | 221 | 830 | 0.21 |
| Acid | Chemical Formula | Phase Transition Temperature, °C | Melting Heat, J/g | Liquid State Density, g/cm3 | Specific Heat Capacity, J/g K | Thermal Conductivity, W/m K |
|---|---|---|---|---|---|---|
| Caprylic | CH3(CH2)6COOH | 16 | 128 | 0.862 (80 °C) | - | 0.148 |
| Capric | CH3(CH2)8COOH | 32 | 136 | 0.866 (40 °C) | - | 0.149 |
| Lauric | CH3(CH2)10COOH | 42–44 | 155 | 0.870 (50 °C) | 1.6 | 0.147 |
| Myristic | CH3(CH2)12COOH | 54 | 158 | 0.840 (80 °C) | 1.6 | - |
| Palmitic | CH3(CH2)14COOH | 63 | 159 | 0.847 (80 °C) | - | 0.165 |
| Stearic | C17H35COOH | 70 | 191 | - | - | 0.172 |
| Substance | Chemical Formula | Phase Transition Temperature, °C | Melting Heat, J/g | Liquid State Density, g/cm3 | Specific Heat Capacity, J/g K | Thermal Conductivity, W/m K |
|---|---|---|---|---|---|---|
| Potassium phosphide hydrate | KP∙4H2O | 18.5 | 231 | 1.455 | 1.83 | - |
| Calcium chloride hydrate | CaCl∙6H2O | 29.7 | 171 | 1.710 | - | 0.60 |
| Sodium sulphate hydrate | Na2SO4∙10H2O | 32.4 | 254 | 1.485 | 1.93 | 0.54 |
| Sodium hydrogen phosphate hydrate | Na2PO4∙12H2O | 35.2 | 280 | 1.420 | 1.55 | 0.59 |
| Zinc nitrate hydrate | Zn(NO3)2∙6H2O | 48.0 | 147 | 2.065 | 1.34 | - |
| Sodium dithionite hydrate | Na2S2O4∙5H2O | 78.0 | 201 | 1.600 | 1.46 | - |
| Barium hydroxide hydrate | Ba(OH)2∙8H2O | 116.0 | 267 | 2.180 | 1.17 | - |
| Magnesium chloride hydrate | MgCl2∙6H2O | 165 | 1.570 | 1.72 | - |
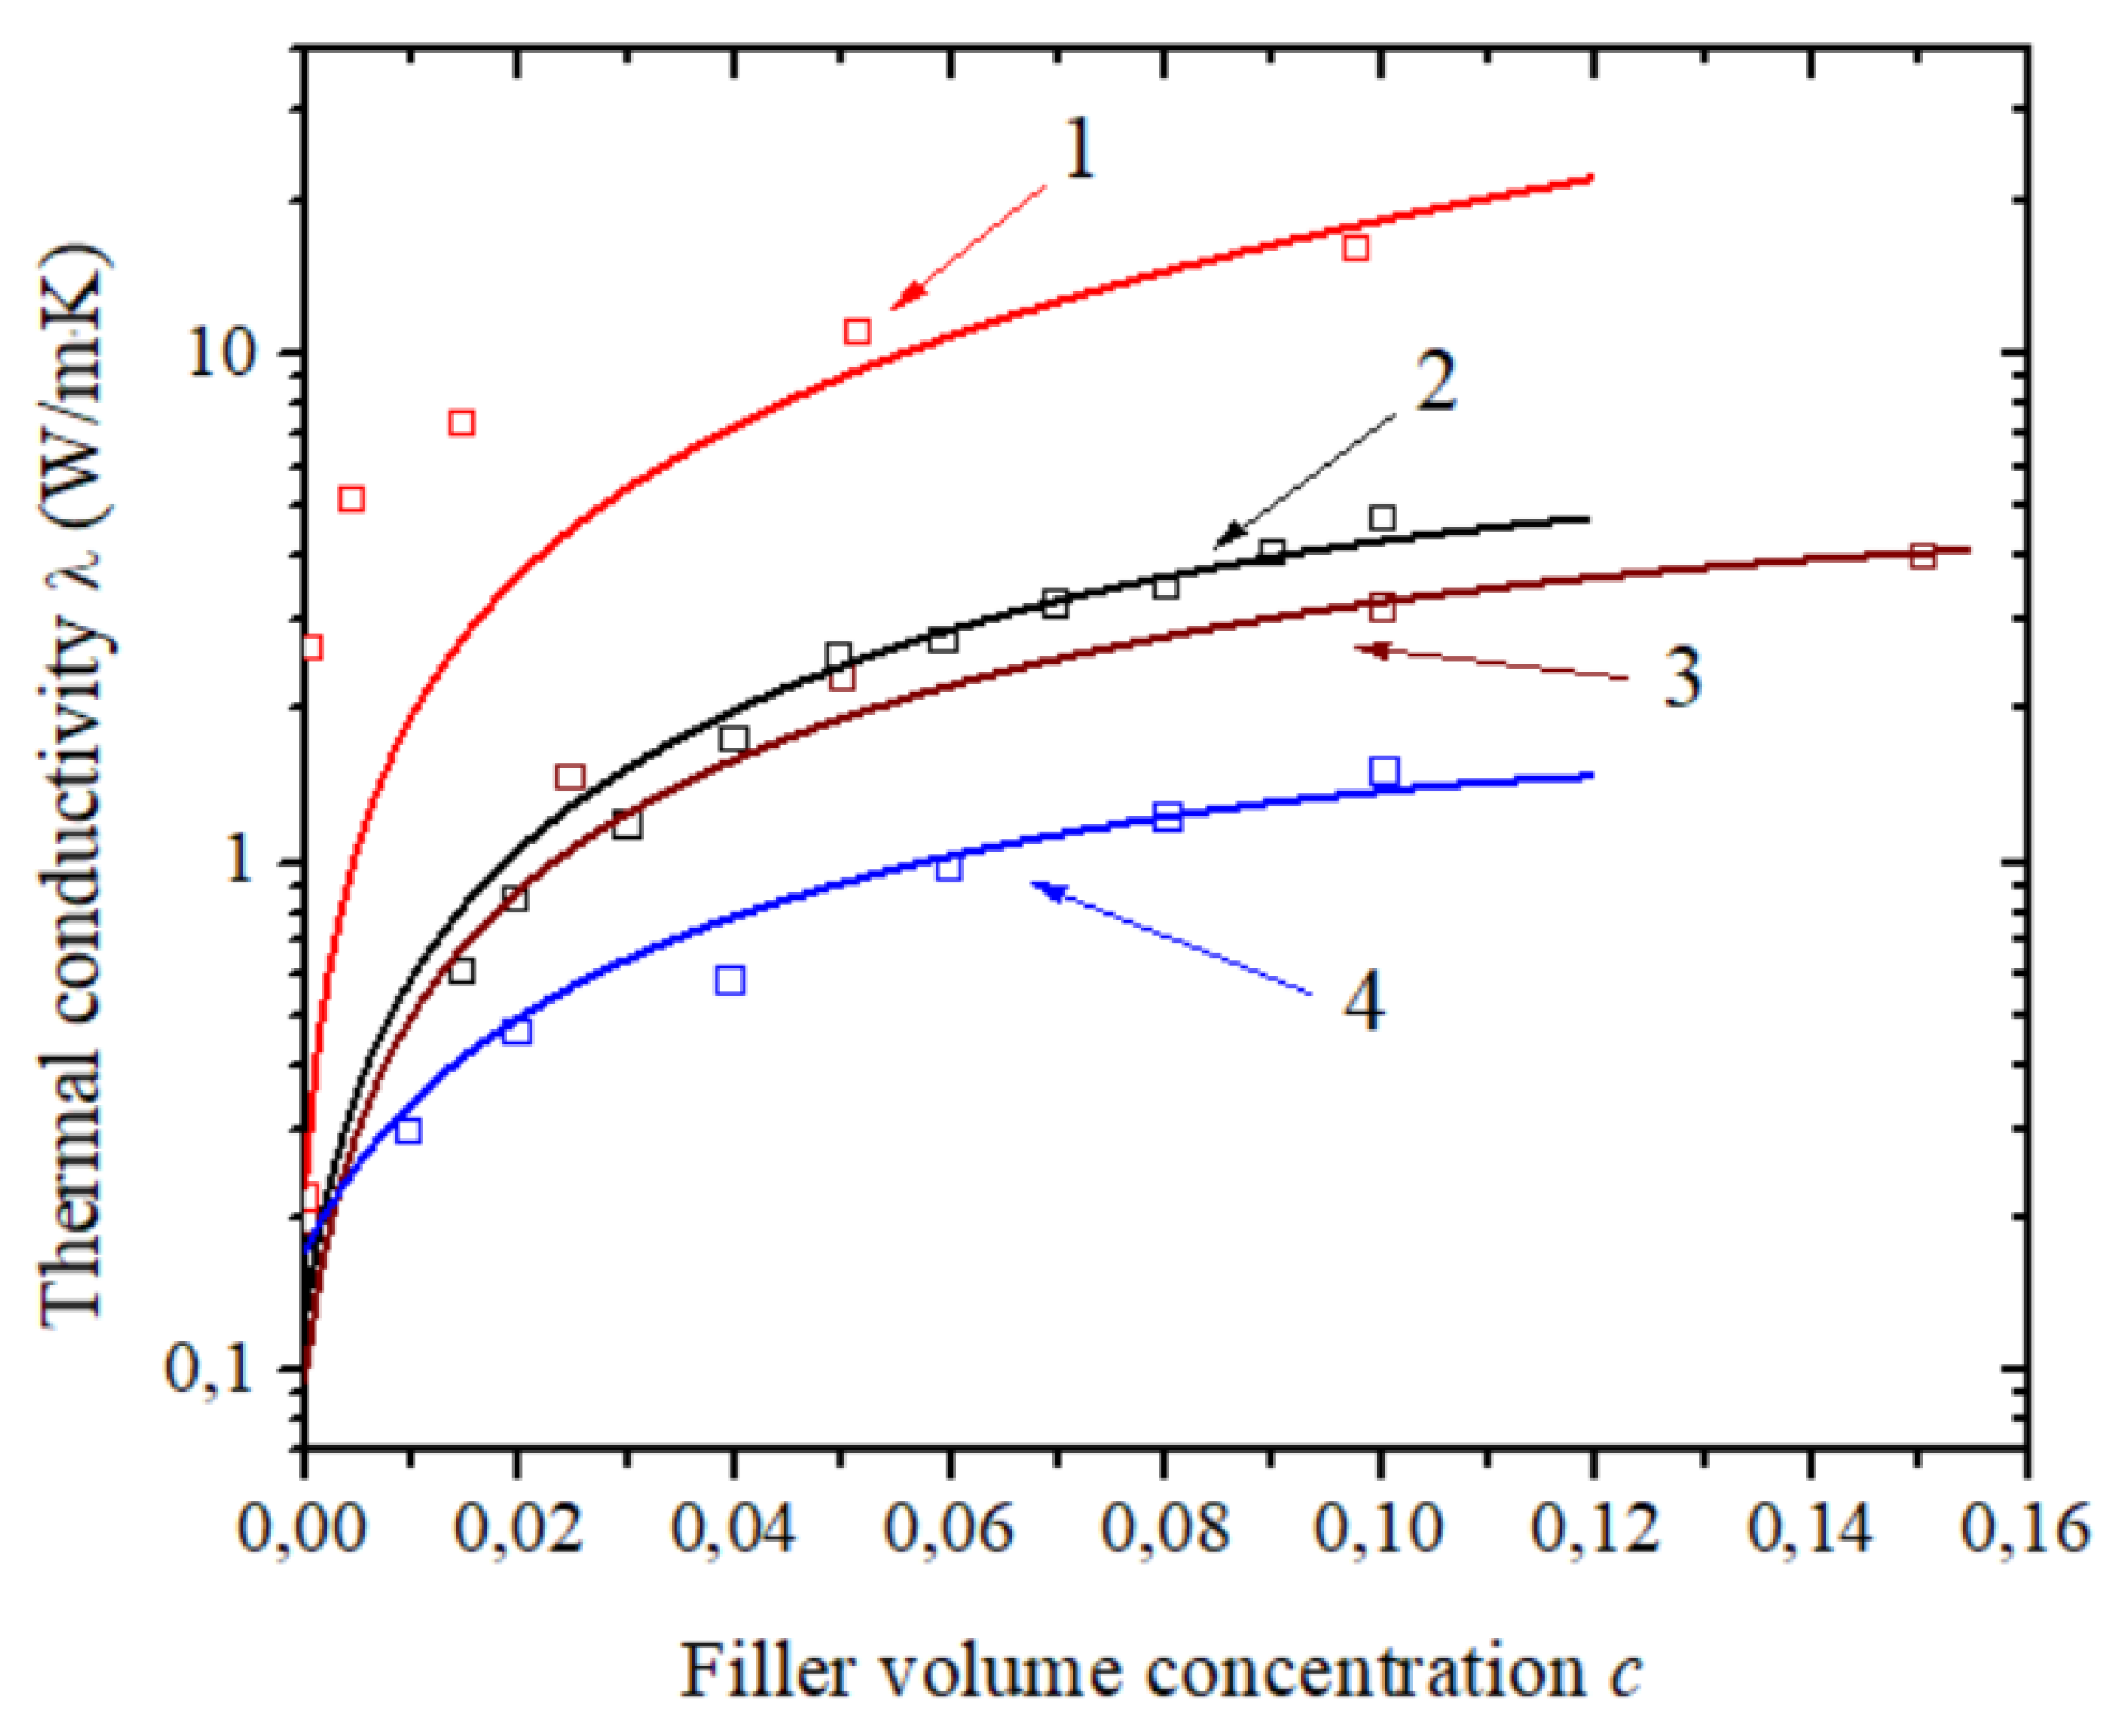
| Sample | Thermal Conductivity κ, W/m K | Electrical Conductivity σ, S/m | Duration of Annealing, min | Contact Resistance, kΩ |
|---|---|---|---|---|
| 1 | 2.87 | 62.2 | 60 | 120 |
| 2 | 0.87 | 6.21 | 5 | 2 |
| 3 | 0.14 | 6.57 | 5 | 130 |
| 4 | 19.5 | 20 | 300 |
| Polymer | Graphene Content, wt% | Thermal Conductivity, W/m K | TCE, % per wt% of Graphene | Preparation Method | Surface Preparation Method | Ref. |
|---|---|---|---|---|---|---|
| Py-PGMA-GNS/epoxy | 3.8 | 1.91 | 225 | In-situ polymerization | Non-covalent modification | [81] |
| f-GFs/epoxy | 10 | 1.53 | 66.5 | In-situ polymerization | Non-covalent modification | [82] |
| GnP-C750/epoxy | 5 | 0.45 | 23.8 | In-situ polymerization | no | [83] |
| DGEBA-f-GO/epoxy | 4.64 | 0.72 | 52.3 | In-situ polymerization | no | [84] |
| GS@Al2O3/PVDF | 40 | 0.586 | 4.8 | Solution mixing | Coated by alumina nanoparticles | [85] |
| Al2O3@ GNP/epoxy | 12 | 1.49 | 56.4 | Solution mixing | Coated by alumina | [86] |
| ApPOSS-graphene/ epoxy | 0.5 | 0.348 | 115.8 | Solution mixing | Covalent modification | [87] |
| GNP/PBT | 20 | 1.98 | 61 | In-situ polymerization | no | [88] |
| GNPs/PPS | 37.8 | 4.414 | 49 | Melt mixing | Covalent modification | [89] |
| PI/SiCNWs-GSs | 7 | 0.577 | 21 | Solution mixing | no | [90] |
| GP/SR | 0.72 | 0.3 | 69.4 | Mechanical blending | Covalent modification | [91] |
| PA6/graphene-GO | 10 | 2.14 | 56.9 | In-situ polymerization | Non-covalent modification | [92] |
| GNP/epoxy | 25 | 2.67 | 49.4 | Solution mixing | No | [93] |
| PVDF/FGS/ND | 45 | 0.66 | 3.9 | Solution mixing | no | [94] |
| ApPOSS-graphene/epoxy | 0.5 | 0.348 | 115.8 | Solution mixing | Covalent modification | [95] |
| IL-G/PU | 0.608 | 0.3012 | 55.9 | In-situ polymerization | Non-covalent modification | [96] |
| PA/TCA-rGO | 5 | 5.1 | 357.8 | Melt mixing | Covalent modification | [97] |
| BE/graphene | 2.5 | 0.542 | 73.7 | Solution mixing | Covalent modification | [98] |
| GNPs/silicone | 16 | 2.6 | 49.7 | In-situ polymerization | no | [99] |
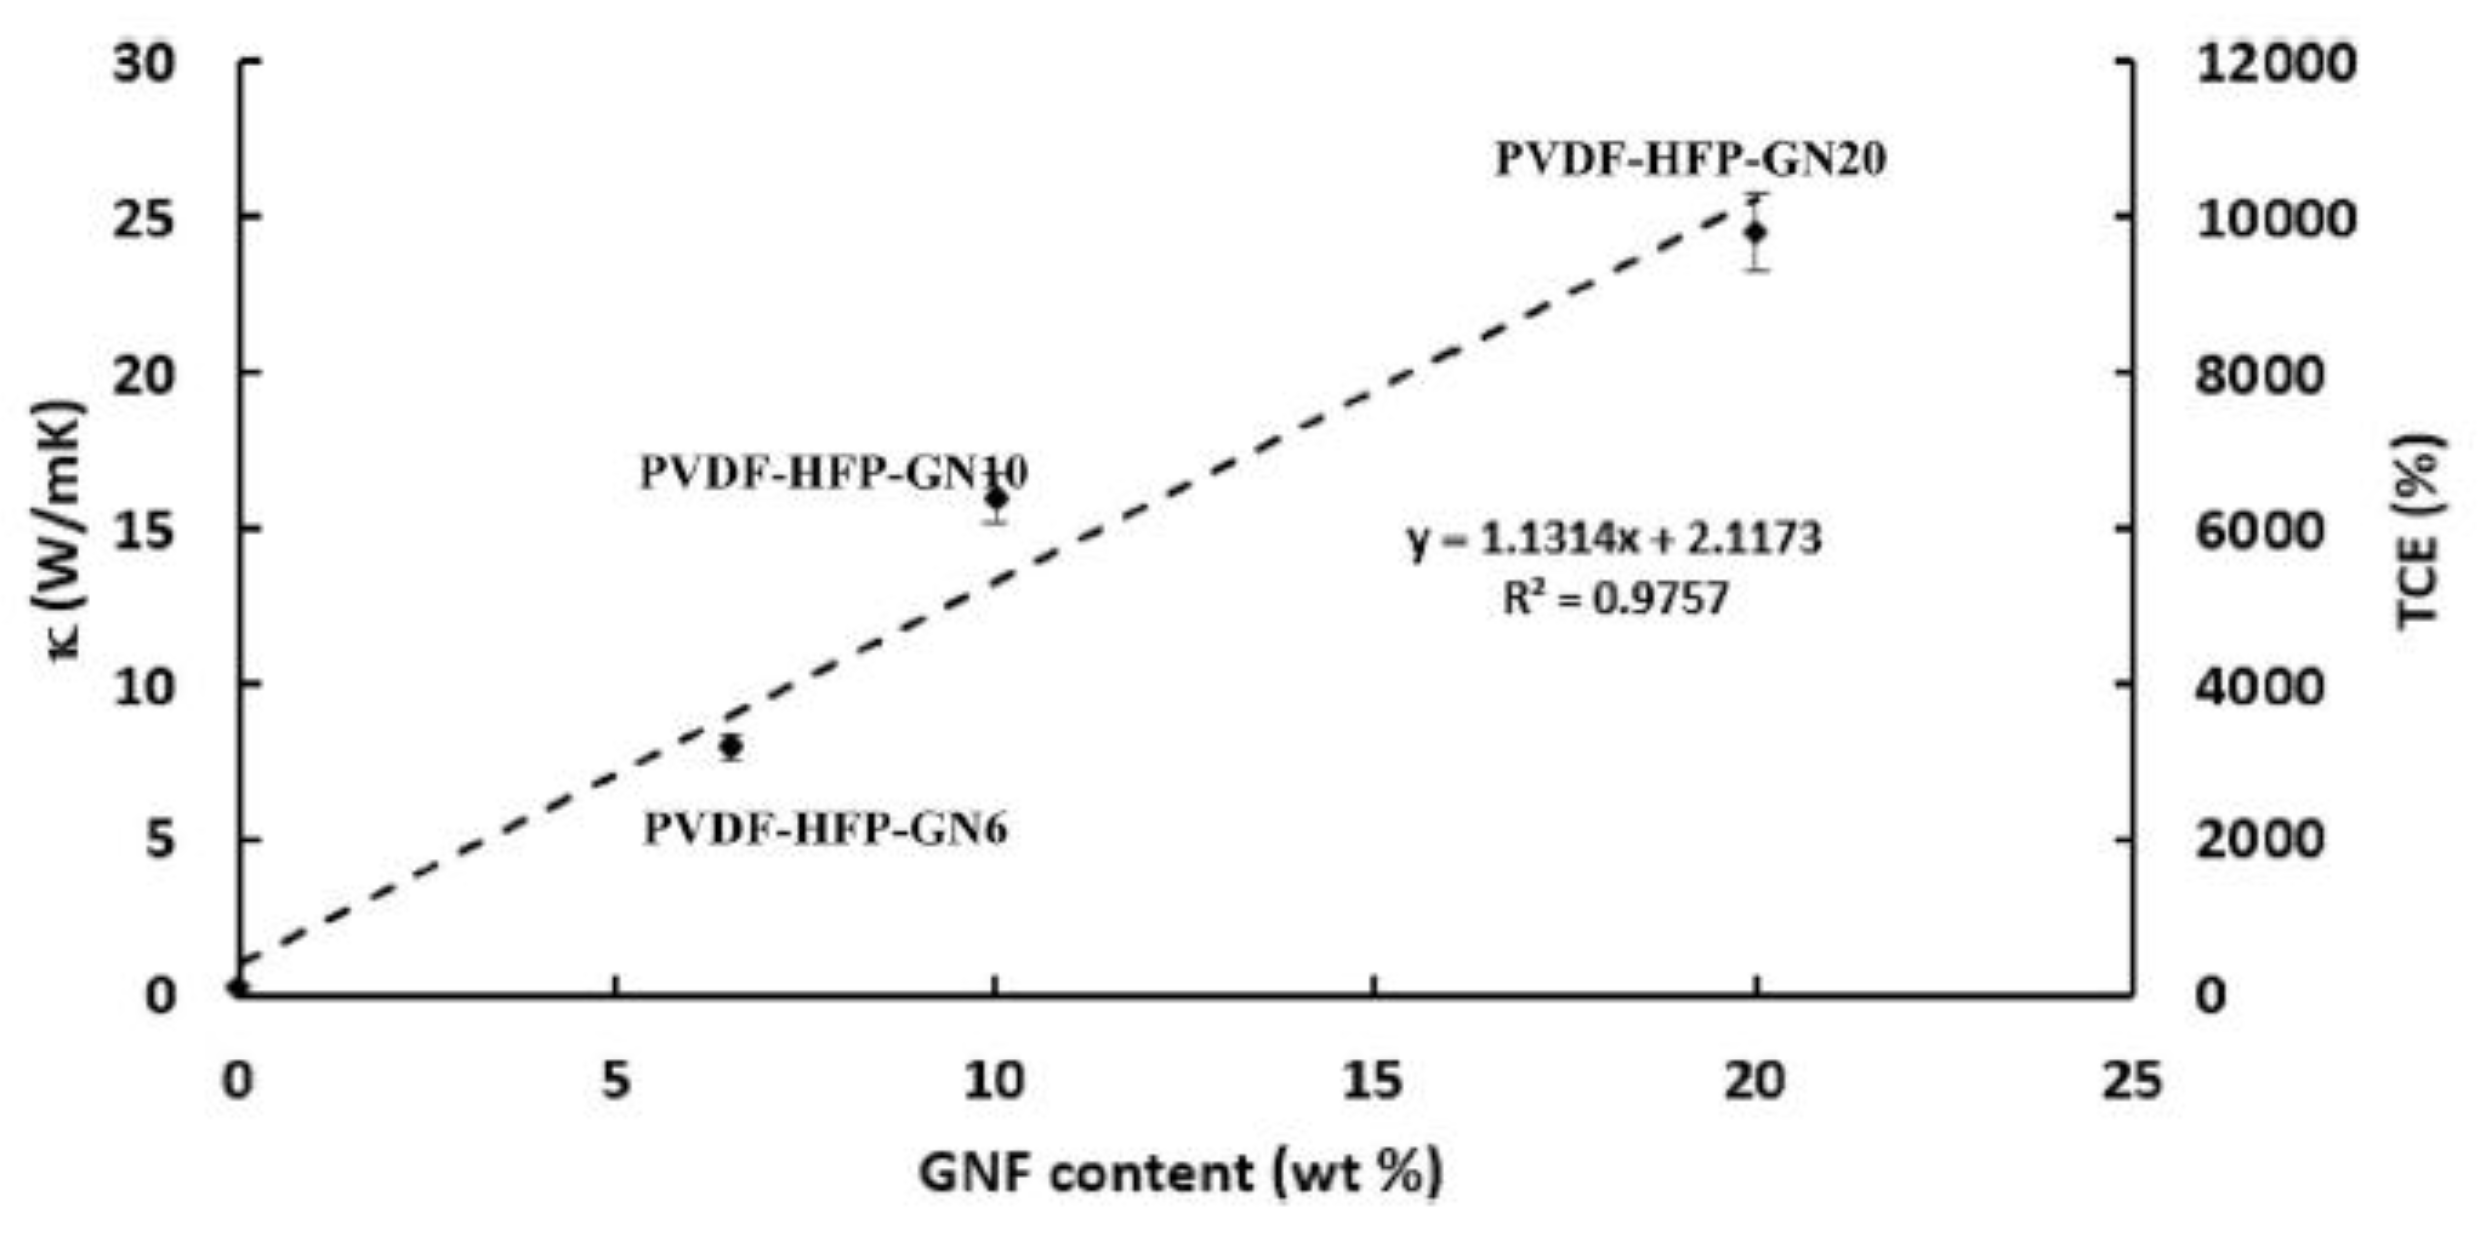
| wg, % | 0 | 1 | 6 | 10 | 20 | 25 | 33 | 50 |
|---|---|---|---|---|---|---|---|---|
| Κ, W/m K | 0.22 | 3.24 | 7.95 | 16.0 | 24.5 | 36.3 | 38.1 | 57.51 |
Publisher’s Note: MDPI stays neutral with regard to jurisdictional claims in published maps and institutional affiliations. |
© 2022 by the author. Licensee MDPI, Basel, Switzerland. This article is an open access article distributed under the terms and conditions of the Creative Commons Attribution (CC BY) license (https://creativecommons.org/licenses/by/4.0/).
Share and Cite
Eletskii, A.V. Phase Change Materials with Enhanced Thermal Conductivity and Heat Propagation in Them. Physchem 2022, 2, 18-42. https://doi.org/10.3390/physchem2010003
Eletskii AV. Phase Change Materials with Enhanced Thermal Conductivity and Heat Propagation in Them. Physchem. 2022; 2(1):18-42. https://doi.org/10.3390/physchem2010003
Chicago/Turabian StyleEletskii, Alexander V. 2022. "Phase Change Materials with Enhanced Thermal Conductivity and Heat Propagation in Them" Physchem 2, no. 1: 18-42. https://doi.org/10.3390/physchem2010003
APA StyleEletskii, A. V. (2022). Phase Change Materials with Enhanced Thermal Conductivity and Heat Propagation in Them. Physchem, 2(1), 18-42. https://doi.org/10.3390/physchem2010003