Article

Urbanization Impacts on Wetland Ecosystems in Northern Municipalities of Lomé (Togo): A Study of Flora, Urban Landscape Dynamics and Environmental Risks

1
Laboratory of Botany and Plant Ecology, Faculty of Sciences, University of Lomé, Lomé 01BP 1515, Togo
2
Regional Centre of Excellence on Sustainable Cities in Africa, CERViDA_DOUNEDON, University of Lomé, Lomé 01BP1515, Togo
3
Geomatics/Remote Sensing Group, Institute of Geography, Ruhr-University Bochum, Universitaetsstrasse 150, Building IA, Room 6/59, D-44780 Bochum, Germany
4
Center for Landscape Conservation Planning, School of Landscape Architecture & Planning, University of Florida, P.O. Box 115704, Gainesville, FL 32611-5704, USA
*
Author to whom correspondence should be addressed.
Conservation 2025, 5(3), 28; https://doi.org/10.3390/conservation5030028
Submission received: 3 May 2025 / Revised: 5 June 2025 / Accepted: 9 June 2025 / Published: 20 June 2025

Abstract

:
Climate change and anthropogenic activities, which are central to landscape-related concerns, affect both the well-being of populations and the structure of semi-urban and urban landscapes worldwide. This article aims to assess the environmental impact of landscape modifications across Togo as perceived through the lens of urban ecology. In conjunction with Landsat 8 satellite imagery, data were gathered via questionnaires distributed to stakeholders in urban space development. Four land use classifications are discernible from analyzing the Agoè-Nyivé northern municipalities’ cartography: vegetation, development areas/artificial surfaces, crops and fallows, meadows, and wetlands. Between 2014 and 2022, meadows and wetlands decreased by 57.14%, vegetation cover decreased by 27.77%, and fields and fallows decreased by 15.38%. Development areas/artificial surfaces increased by 40.47% due to perpetual expansion, displacing natural habitats, including wetlands and meadows, where rapid growth results in the construction of flood-prone areas. In wetland ecosystems, 91 plant species were identified and classified into 84 genera and 37 families using a floristic inventory. Typical species included Mitragyna inermis (Willd.) Kuntze; Nymphaea lotus L.; Typha australis Schumach; Ludwigia erecta (L.); Ipomoea aquatica Forssk; Hygrophila auriculata (Schumach.) Heine. This concerning observation could serve as an incentive for policymakers to advocate for incorporating urban ecology into municipal development strategies, with the aim of mitigating the environmental risks associated with rapid urbanization.

1. Introduction

Wetlands, essential to hydrological regimes, function as natural water purifiers and groundwater recharge zones, contributing to water quality and providing economic benefits [1]. They also constitute habitats for characteristic flora and fauna, in particular by providing refuges for feeding and resting for many species of waterbirds [2,3,4,5,6]. They are heritage sites with a characteristic landscape [7,8].
However, these particularly fragile wetland ecosystems are increasingly threatened, especially in urban areas. Rapid urbanization, combined with climate change, is exerting increasing pressure on wetlands polarized by various economic and infrastructure activities [9]. The demographic boom, which began in the 19th century with an increase of more than 80% of the world population [10] but was marked by a global urban population that did not exceed 6% [11], was accompanied by accelerated urbanization. Today, urban areas are expanding at a rate twice that of global population growth [12]. In Togo, for instance, the current urbanization rate stands at 42.9%, while the population growth rate is 2.3%, reflecting national trends consistent with global urban dynamics [13].
Since 2007, more than half of the world’s population lives in urban areas [14], and this proportion could reach 60% by 2030 [12] and 70% by 2050 [14]. In Africa, where urbanization remains relatively low at 40% [15], it is expected to grow rapidly and reach 62% according to the United Nations (2007), particularly in Togo, where the Greater Lomé region concentrates 42.9% of the urban population [16].
This rapid urbanization, associated with unsustainable agricultural practices, leads to the degradation or even disappearance of wetlands, disrupting the ecosystems and hydrological regimes that depend on them [7,17,18,19]. These transformations without logical planning [20] also compromise the integration of urban ecology into urban planning processes.
In Togo, research has primarily focused on the characterization and mapping of wetlands [5,21], with limited attention to the direct relationships between urbanization and wetland ecosystems. Therefore, this paper aims to assess the impact of urban expansion on these habitats. Particularly, it conducts a diachronic analysis of land use dynamics from 2014 to 2022, highlighting environmental risks in the northern municipalities of Agoè-Nyivé.

2. Materials and Methods
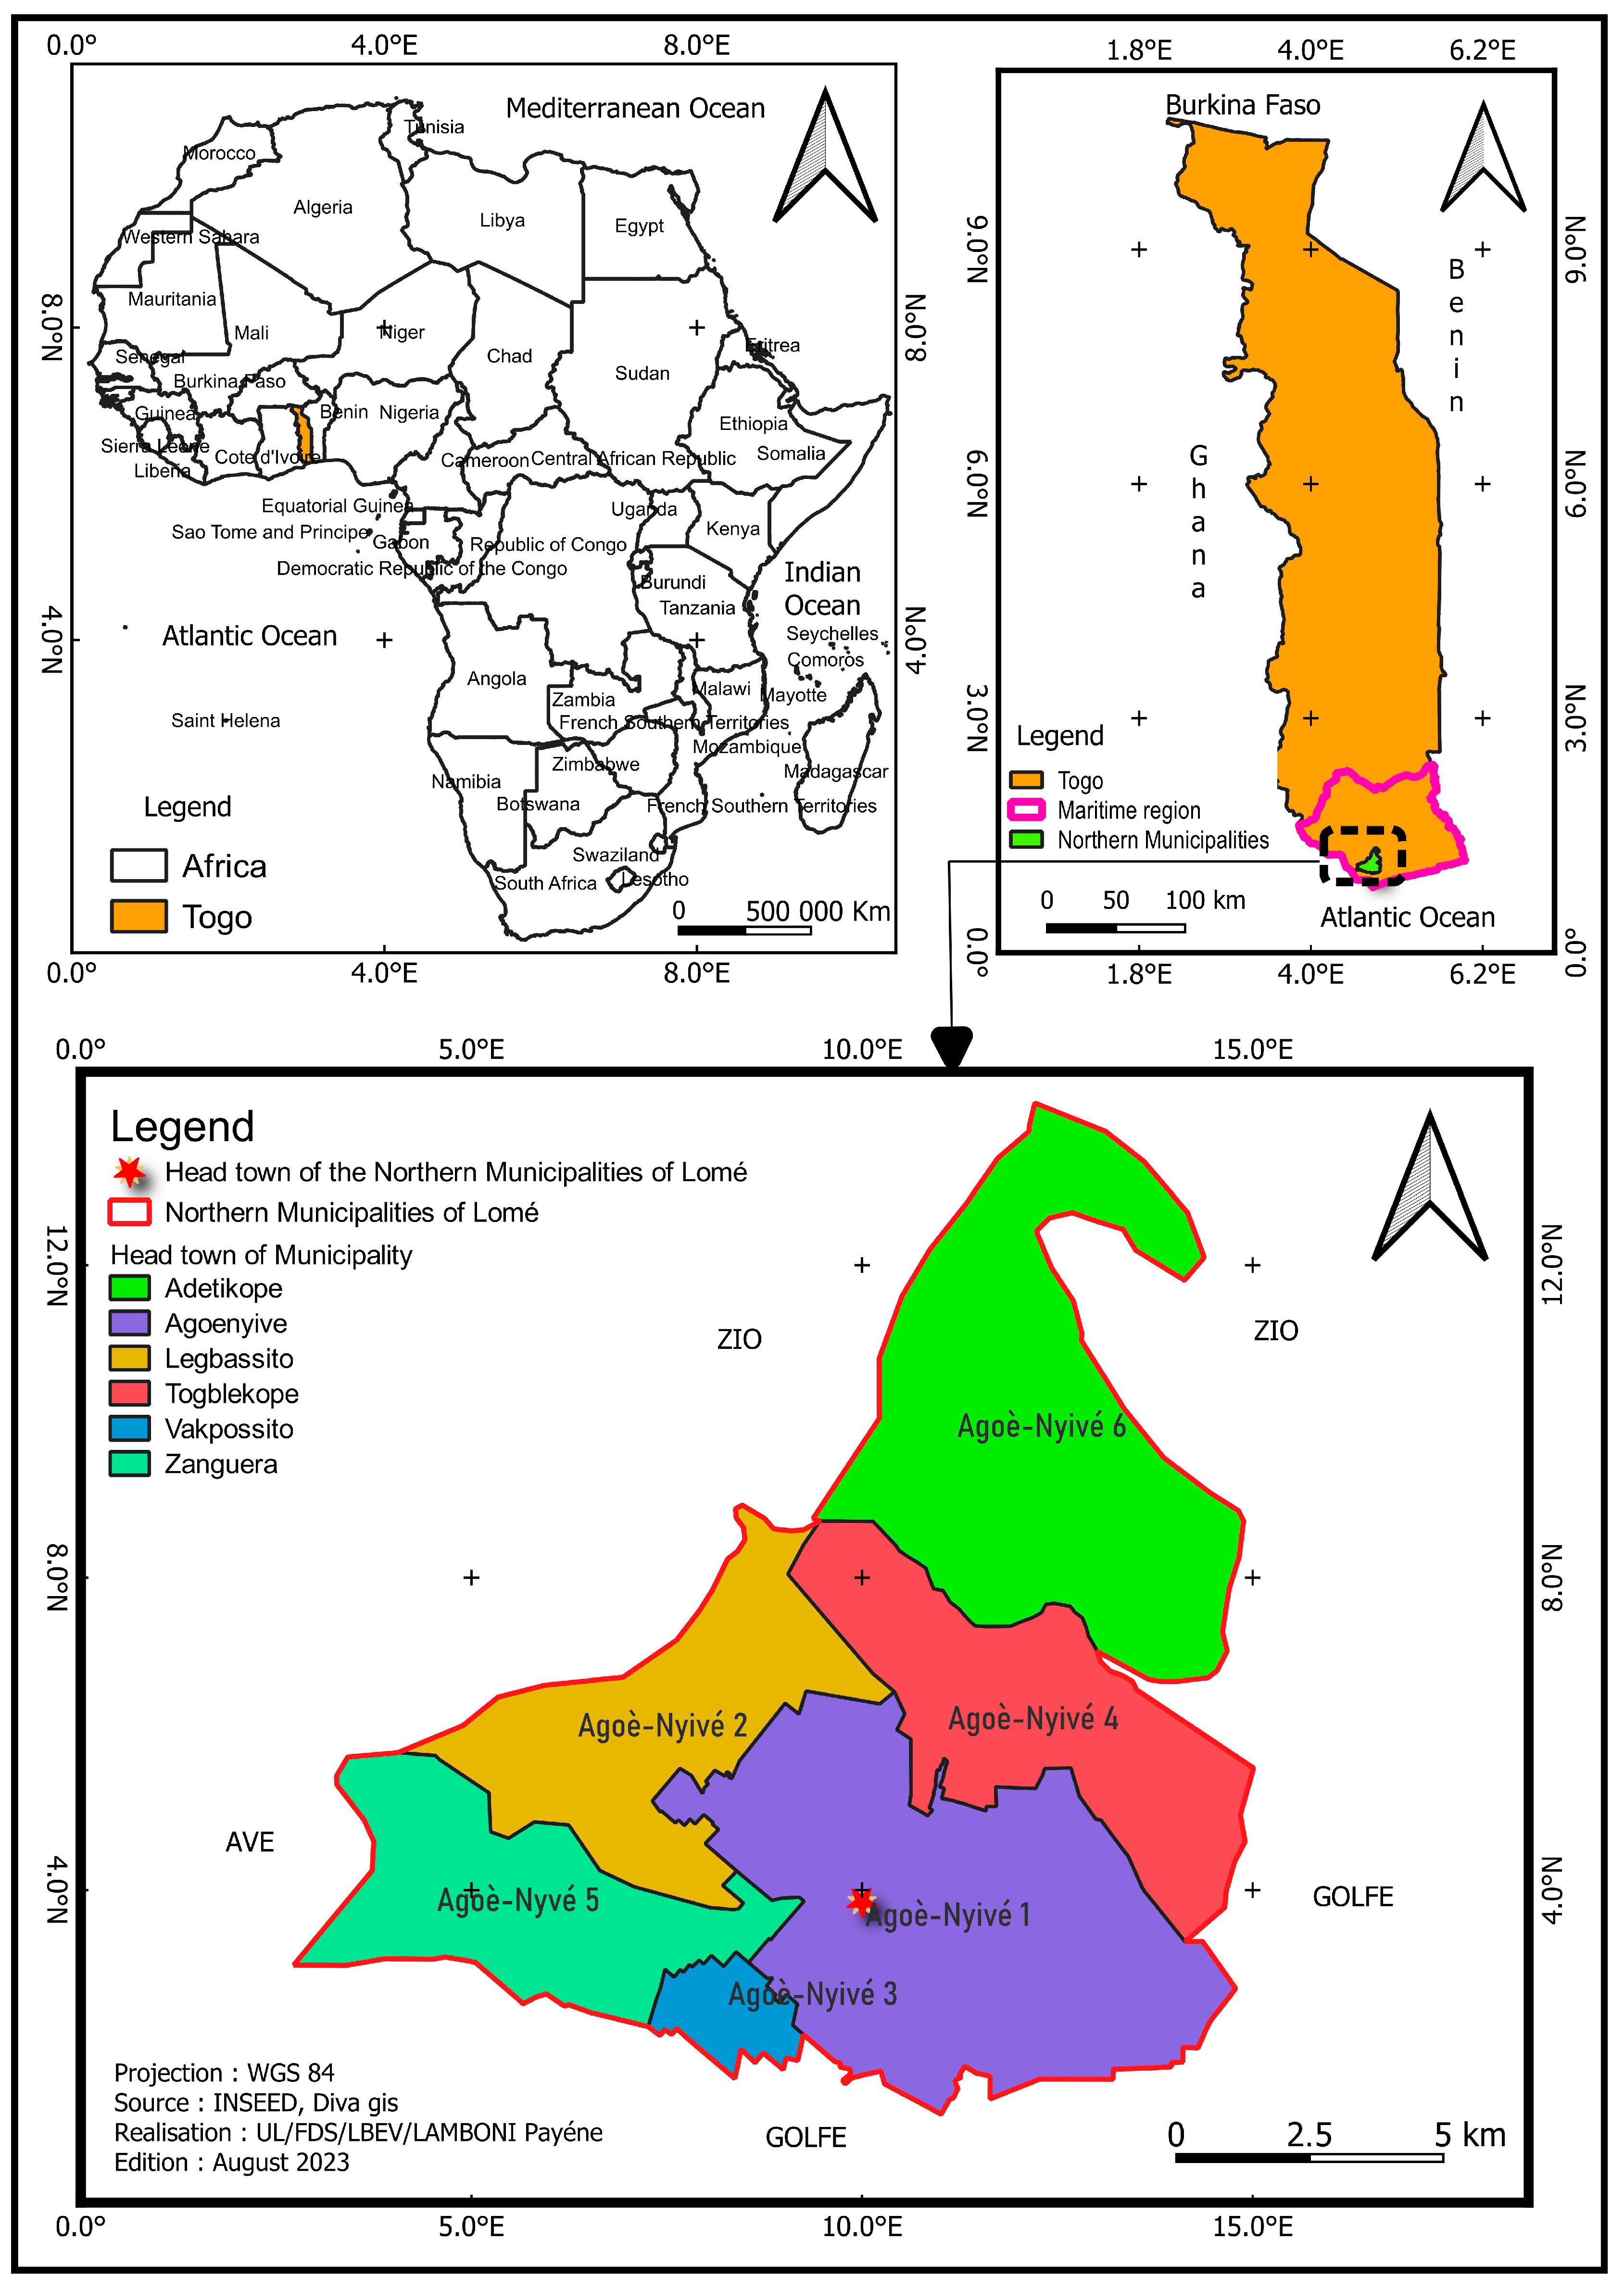
2.1. Study Area

In Togo, this study was conducted in the municipalities of Lomé, encompassing 167.06 sq km with 40.97% of the Autonomous District of Greater Lomé and 2.62% of the marine administrative zone. It is located between longitudes 1°09′ and 1°24′ E and between latitudes 6°20′ and 6°37′ N (Figure 1). It is part of Togo’s fourth ecological zone [22] and has the two-mode climate typical of the Guinean subequatorial climate. Annual precipitation ranges from 424 to 1417 mm, with an average of 826 mm; air humidity levels are 50% [23]. Soils consisting of fluviosoil, nitisoil, and regosoil are the most prevalent [24]. The vegetation cover in the study area consists of woody trees scattered along roads, in gaps, in reserves, and in wetlands.
The area under consideration has a population density of 5283 people/km2, with an estimated total population of 882,695 residents. Among this population, approximately 51.4% are female [16]. The population comprises various socio-linguistic and cultural communities, primarily Ewé, Kabyè, Lamba, Nawda, Moba, and Tem.

2.2. Data Collection

Mapping of urban frames
Landsat 8/OLI-2 and TIRS satellite data with full spatial and spectral resolution (30 × 30 m) and low cloud cover (less than 10%) were acquired from the U.S. Geological Survey (USGS) platform (https://earthexplorer.usgs.gov/ on 15 August 2023). Landsat TM-type images from the years 2014 and 2022, acquired in August 2023, were used, following a common approach in wetland studies [25,26,27].
Floristic and ecological data
The identification of wetlands was based on the analysis of the ecological descriptors in the diagram below (Figure 2). To avoid selection bias and ensure statistical representativeness, stratified random sampling was used after prior identification of wetlands [28]. In total, data were collected from 57 plots. Given the diversity of wetlands, a 50 m × 10 m plot size was chosen for inventorying natural [29,30]. The study of the vegetation was based on the sigmatist method of [31]. All herbaceous and woody plant species encountered in the plots were inventoried [32,33].
Environmental risk perception data
Data were collected through interviews with local populations and relevant authorities, supplemented by field observations [35] in August 2023. Following an exploratory study, 23 flood-prone sites were identified, where a sample of 125 respondents was surveyed (one per concession). The interviews focused on vulnerability factors related to environmental hazards. Data collection was carried out using KoBoToolbox (version 2.022.16) on Android devices [36,37].
Climate data
To assess drought trends in the study area, climatic data were analyzed. Precipitation and temperature records from 1979 to 2021 were obtained from the National Meteorological Agency of Togo.

2.3. Data Analysis and Processing

Each species was assigned to a family according to the APG III classification system, its corresponding biological type following [38], and its phytogeographic affinity [39]. Ecological parameters collected at each sampling point were processed using IBM SPSS Statistics 21 software.
To analyze land cover changes, Landsat 8 images from the years 2014 and 2022 were processed using ArcMap 10.4.1 and QGIS 3.8 software based on the availability of quality satellite imagery for those years. Two vegetation indices were computed: the Normalized Difference Vegetation Index (NDVI) (EQ 1) [40] and the Normalized Difference Water Index (NDWI) (EQ 2) [41]. These indices were used to create a spectral composite, which was then converted into a composite raster for land use classification. The geographical arrangement of a sequence of units, namely Unit 1 (U1), Unit 2 (U2), Unit 3 (U3), and Unit 4 (U4), extending from the northernmost point to the southernmost point, was used to help analyze the landscape.
E Q 1 : N D V I = X   N e a r   i n f r a   r e d X   r e d X   N e a r   i n f r a   r e d + X   r e d
E Q 2 : N D W I = X P I R X   M I R X P I R + X   M I R
An unsupervised classification method was applied to distinguish land use categories in the northern municipalities, using a composite band of NDVI and NDWI raster indices. Classification accuracy was enhanced by comparing remote sensing data with ground-truth observations. Furthermore, the mmqgis plugin in QGIS was used to overlay the moisture map with flood-sensitive points identified in the field, thereby generating a sensitivity of flood-prone areas.
An adapted reclassification of NDWI values into three classes enables the differentiation of surface types based on their water content. Values greater than 0.3 (NDWI > 0.3) correspond to open water bodies, indicating high moisture content. Values between 0 and 0.3 (0 < NDWI ≤ 0.3) represent wetlands or hydrophilic vegetation, reflecting medium moisture levels. Finally, values less than or equal to zero (NDWI ≤ 0) are grouped under very low moisture, encompassing dry soils, built-up areas, and typical vegetation [42].
Flood risk analysis incorporated both geographic information systems (GIS) and remote sensing, along with participatory data collection involving communities impacted by these hazards [43]. Survey data were analyzed with SPSS using dynamic cross-tabulations to highlight environmental vulnerabilities. Key determinants of vulnerability were identified through an analytical framework that assessed exposure and potential harm using citation frequencies [44].
In the context of climate change, drought risk was characterized using the Standardized Precipitation-Evapotranspiration Index (SPEI) [45] and computed over a three-month timescale using precipitation and temperature data [46]. Data were processed using Rstudio 8.5, command-line algorithms, and the SPEI 1.7 software. The Standardized Precipitation Index (SPI), based solely on precipitation, was also calculated. The indices allow for the assessment of both drought and flood hazard severity classification [47,48]: negative values indicate drought conditions, while positive values reflect excess rainfall and potential flood risk.

3. Results

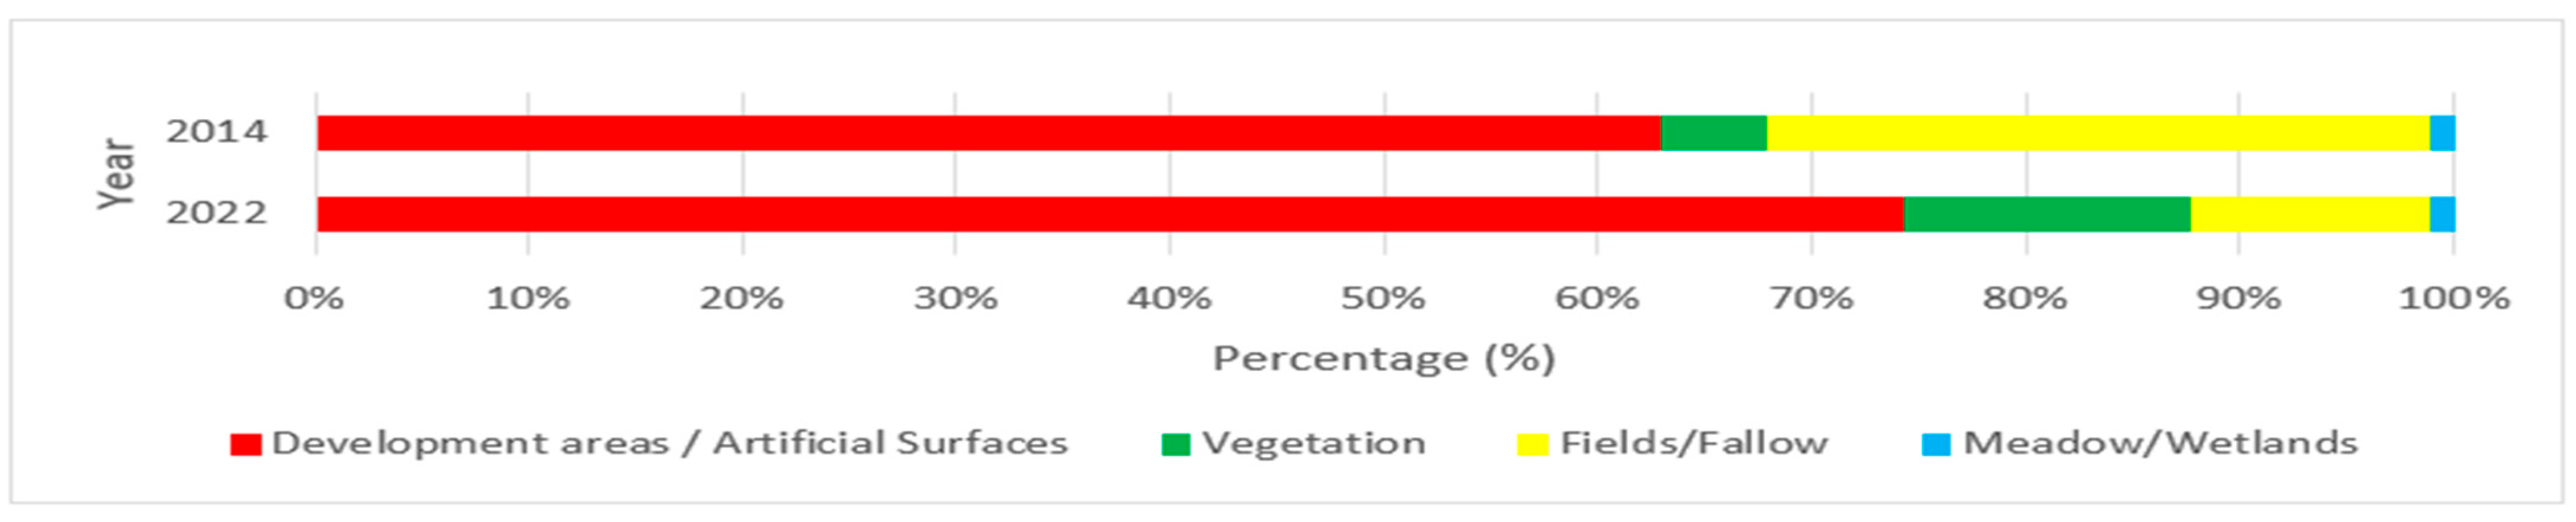
3.1. Structure and Dynamics of Urban Landscape Under Sprawling

A landscape analysis of the northern municipalities identifies four distinct categories of land use: development areas/artificial surfaces (59%), vegetation (13%), grasslands and wetlands (6%), and fields and fallows (22%) (Figure 3).
A transformation occurred in this landscape between the years 2014 and 2022. Regarding proportional change, development areas/artificial surfaces increased from 42% to 59% at 40.47%. Notably, meadows and wetlands declined with a rate of 57.14%, going from 14% to 6%, vegetation cover with a rate of 27.77% went from 18% to 13%, and fields and fallows with a rate of 15.38% went from 26% to 22% (Figure 4).
Concerning the fragmentation, the decrease in the number of human settlement patches from 332 to 230 suggests a concentration of this land-use type into fewer, possibly more densely populated and spatially connected areas. Similarly, the reduction in the number of patches of fields and fallow lands from 1093 to 686 reflects a spatial compression of these land covers, likely due to agricultural intensification or land abandonment leading to consolidation.
In grasslands and wetlands, the slight decrease in patch number, from 267 to 243, indicates a trend toward the coalescence of smaller patches into larger, more continuous units, suggesting a homogenization of the landscape structure within these ecosystems.
In contrast, the increase in the number of vegetative patches from 696 to 809 highlights a fragmentation process, where previously contiguous vegetation areas have been broken into smaller, more isolated patches, possibly due to anthropogenic pressure or land-use change.

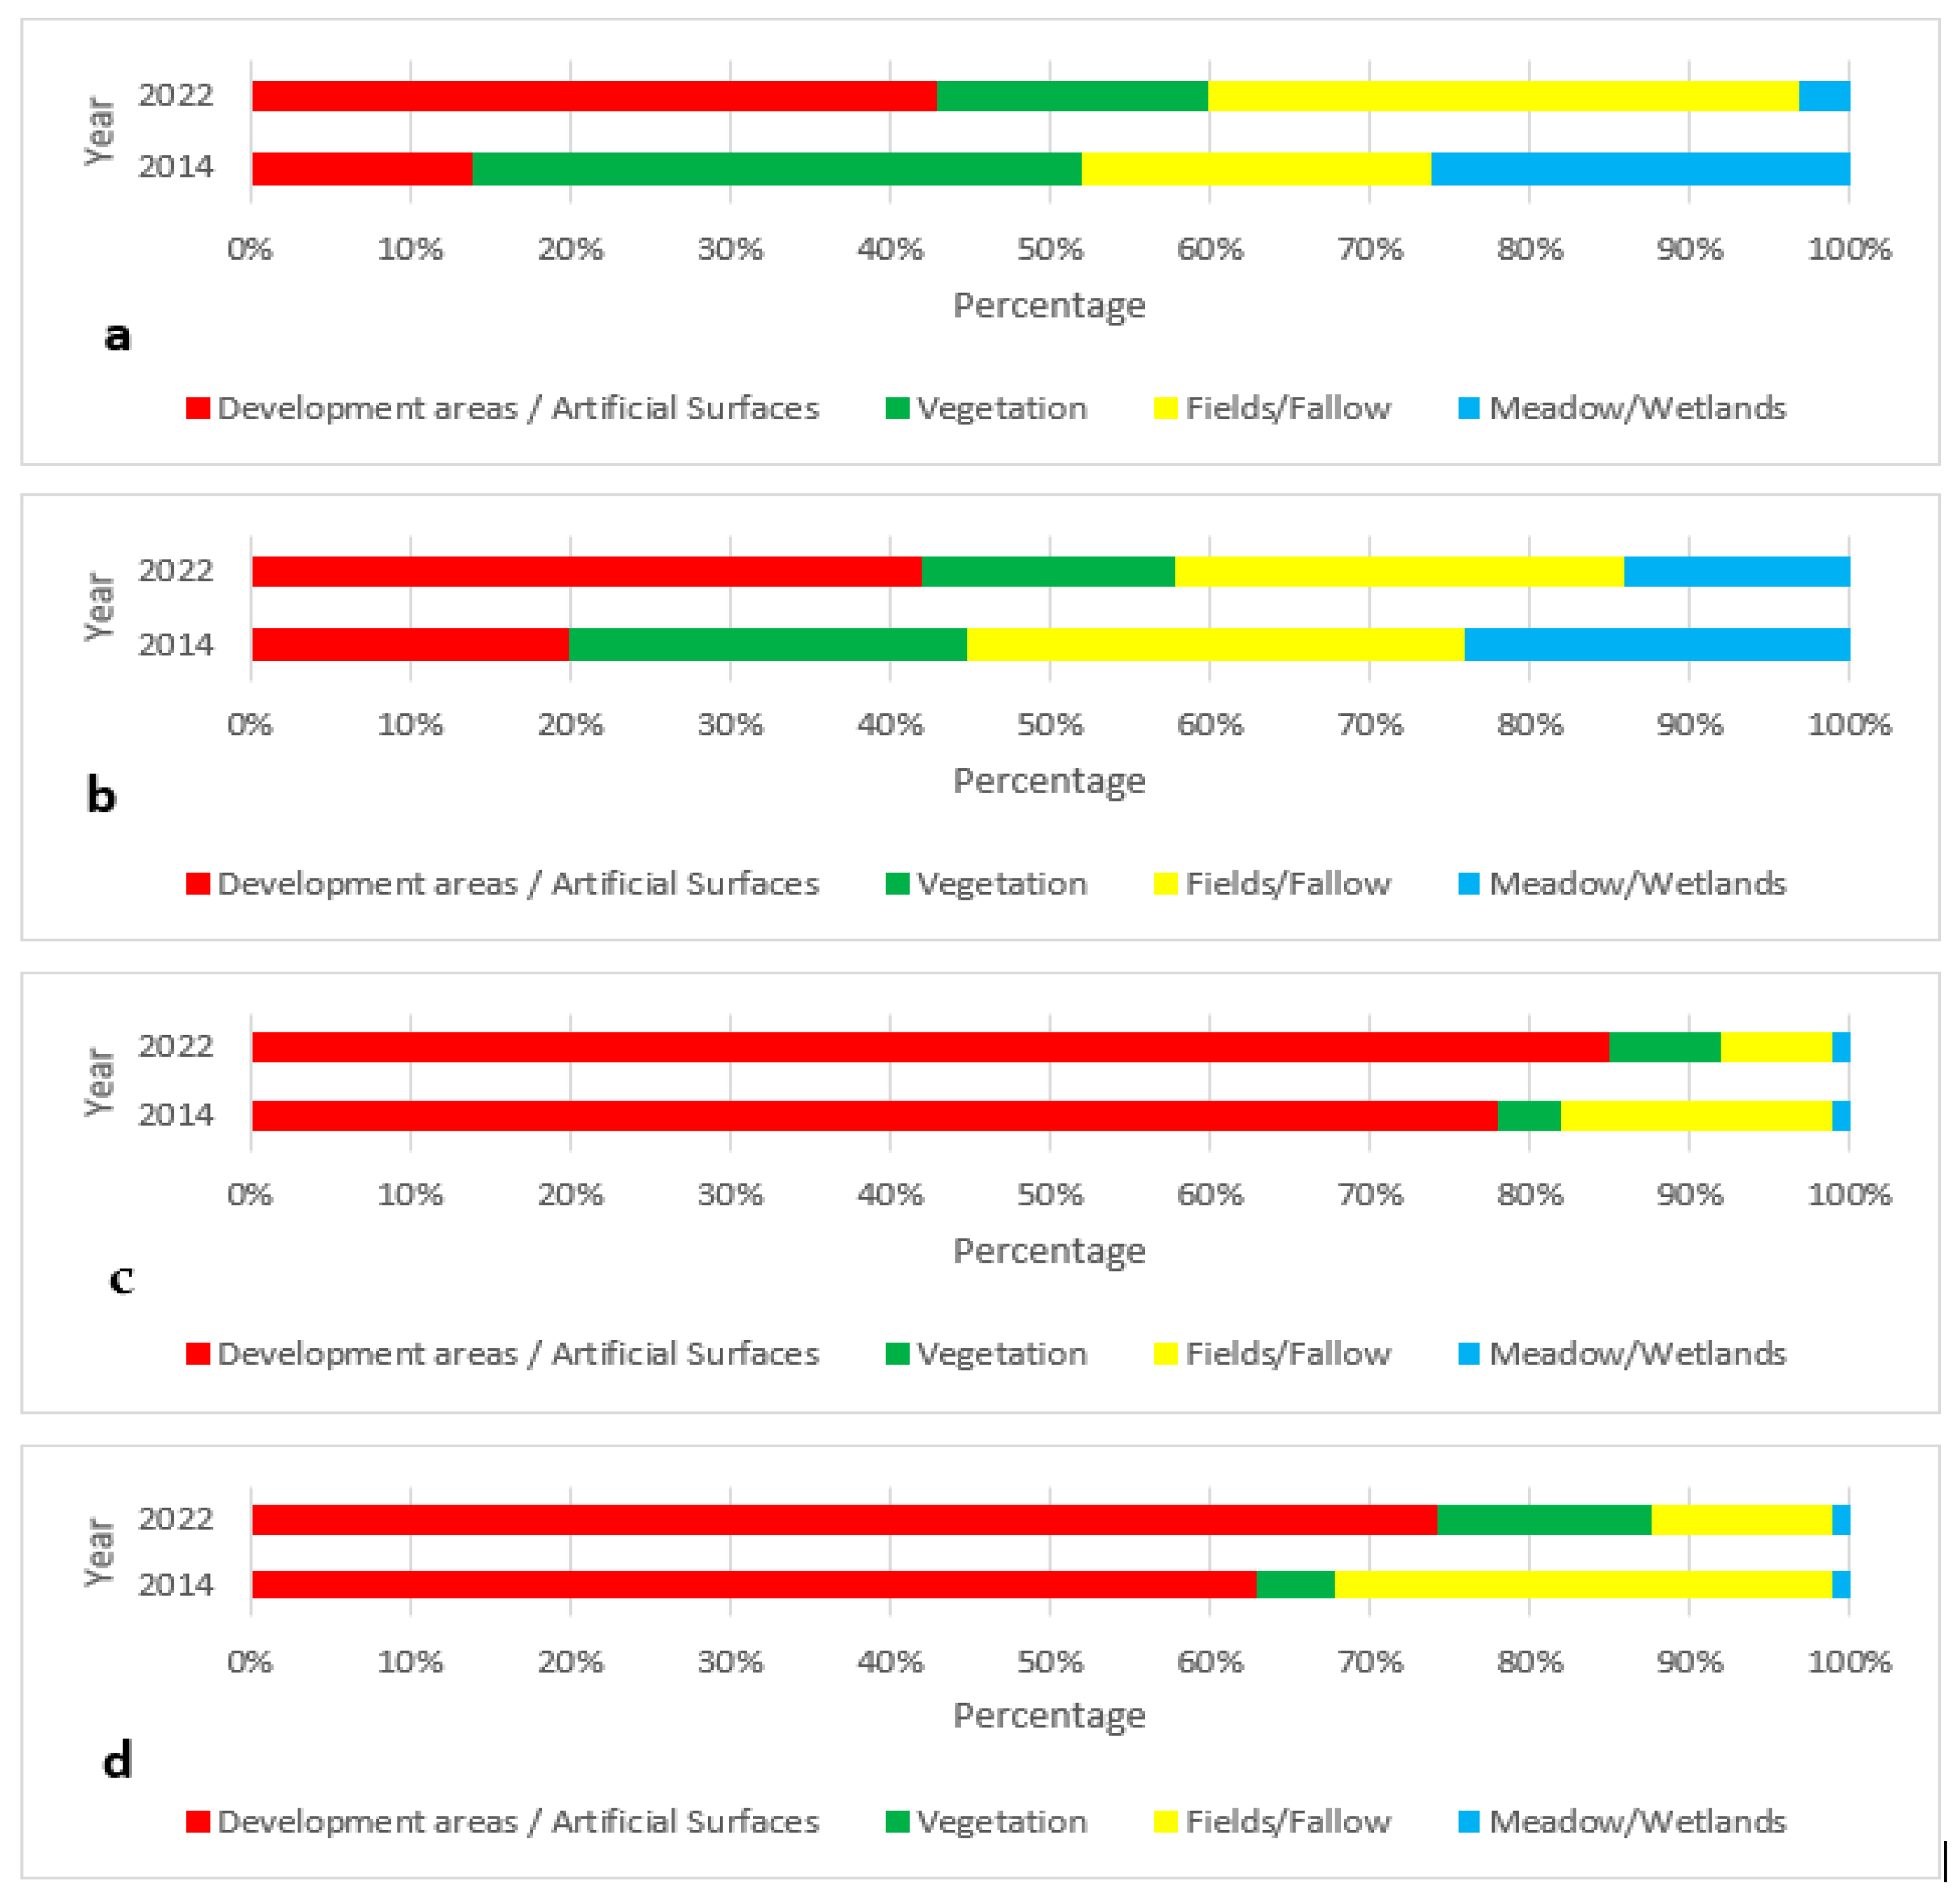
3.2. Characteristics of Spatial Land Cover Units

According to the study, four distinct spatial units can be identified, characterized by their geographical and structural heterogeneity.
Unit 1 data analysis reveals land cover shifts. Between 2014 and 2022, there was a 207% rise in development areas/artificial surfaces and a 68.2% increase in fields and fallows, while natural vegetation decreased by 23.7% and meadows and wetlands decreased by 84.6% (Figure 5a).
The single-class evolution in Unit 2 transpired within development areas/artificial surfaces, which has more than doubled, from 20% to 42%, over the study period duration between 2014 and 2022. Natural vegetation, fields, fallow land, meadows, and flood-prone areas have decreased by 36.7%, 9.7%, and 41.7%, respectively (Figure 5b).
In Unit 3, we see that between 2014 and 2022, the percentage of development areas/artificial surfaces increased from 78% to 85%, and the percentage of vegetation increased from 4% to 7%. Conversely, fields and fallow lands experience a reduction of 17% to 7% (Figure 5c).
In Unit 4, the prevailing category comprises development areas/artificial surfaces. Already prominent in 2014, this class has undergone a 17.4% increase by 2022. The proportion of vegetation cover increased at a rate of 160% between 2014 and 2022. The area occupied by fields and fallows decreased by 64.5% relative to its original surface area (Figure 5d).

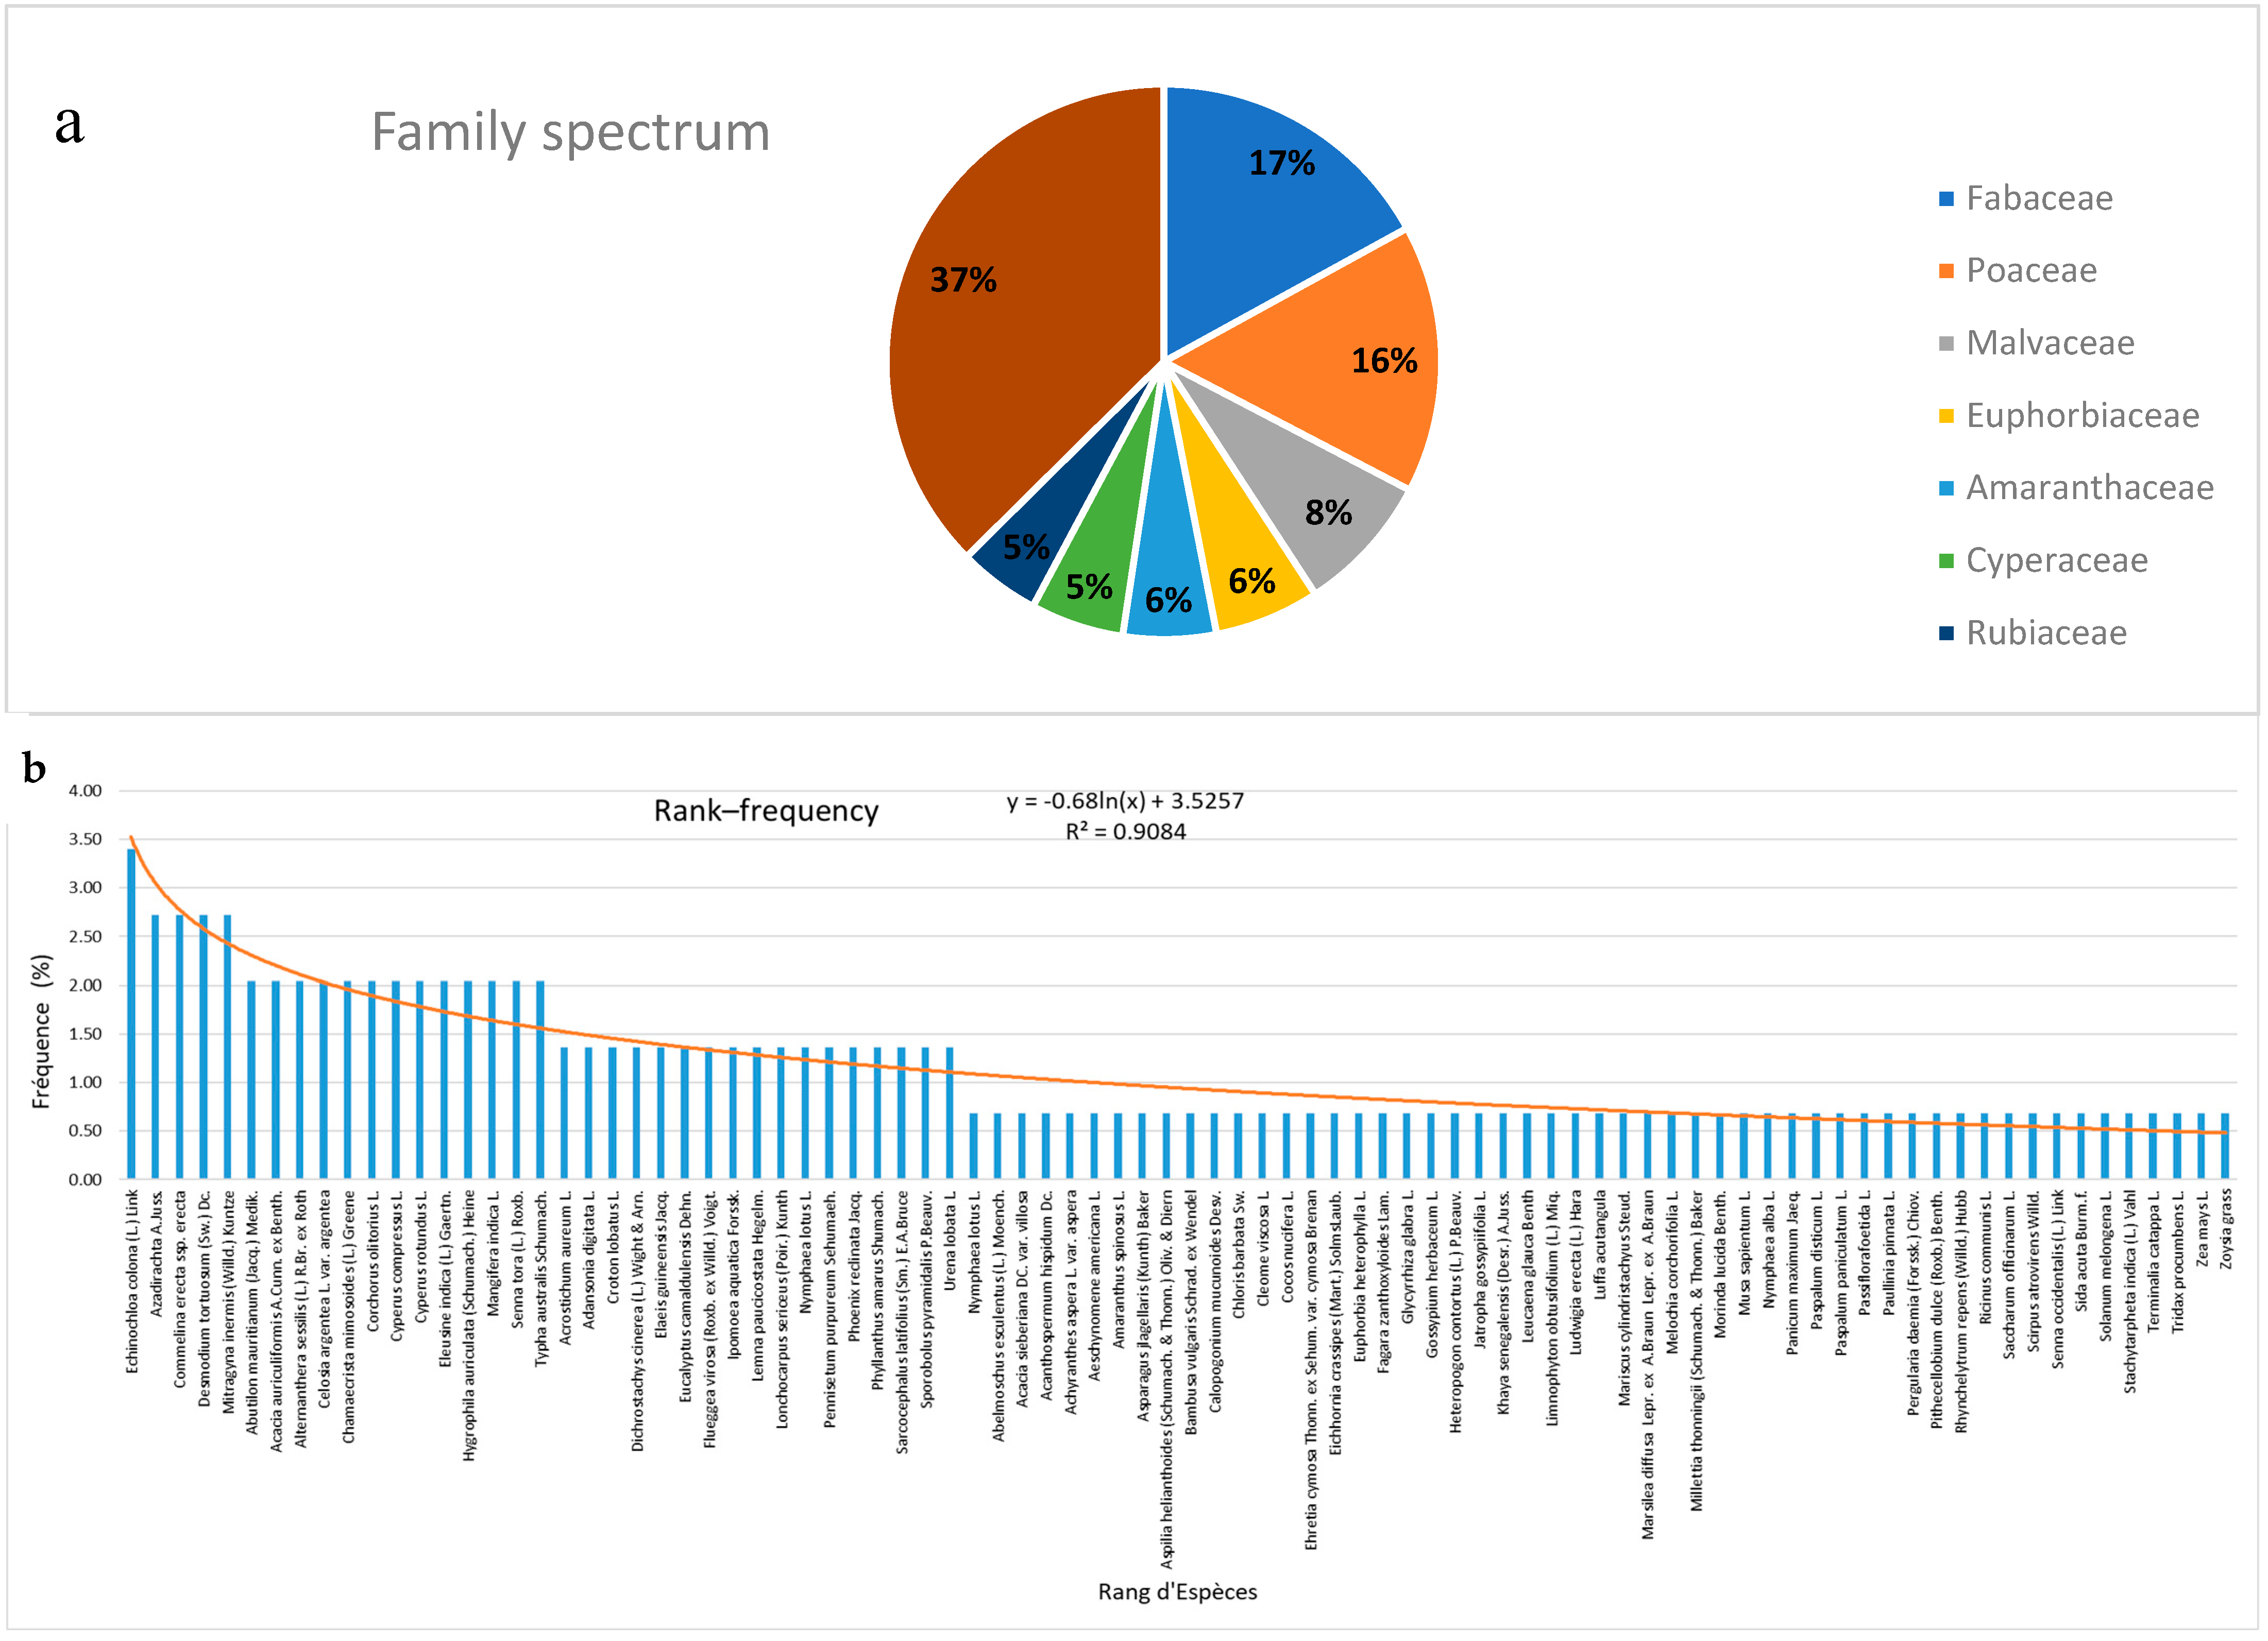
3.3. Flora and Typology of Critical Flooding Zones and Urban Wetlands

In the wetlands of the Northern Municipalities of Lomé, 91 plant species were identified across three Wetland Types and classified into 84 genera and 37 families (Figure 6). The most represented families are Fabaceae (17.0%), Poaceae (16%), and Malvaceae (8%). Families represented at less than 1% are Passifloraceae, Combretaceae, Sapindaceae, Onagraceae, Cucurbitaceae, Musaceae, Alismataceae, Rutaceae, Apocynaceae, Solanaceae, Verbenaceae, Boraginaceae, Asparagaceae, Capparaceae, Pontederiaceae, Burseraceae, and Polygonaceae. The floristic inventory carried out highlights a great diversity of plant species with variable relative frequencies. Echinochloa colona (L.) Link is the most frequent species, reaching 3.40% of the total representation. A group of species, notably Azadirachta indica A. Juss., Commelina erecta ssp. erecta, Desmodium tortuosum (Sw.) DC., and Mitragyna inermis (Willd.) Kuntze, present frequencies close to 2.72%, marking their importance in the floristic composition.
The formations found in the alluvial plain are flooded savannahs, croplands, permanent ponds, hygrophilous vegetation, and floating aquatic plant species (Table 1).

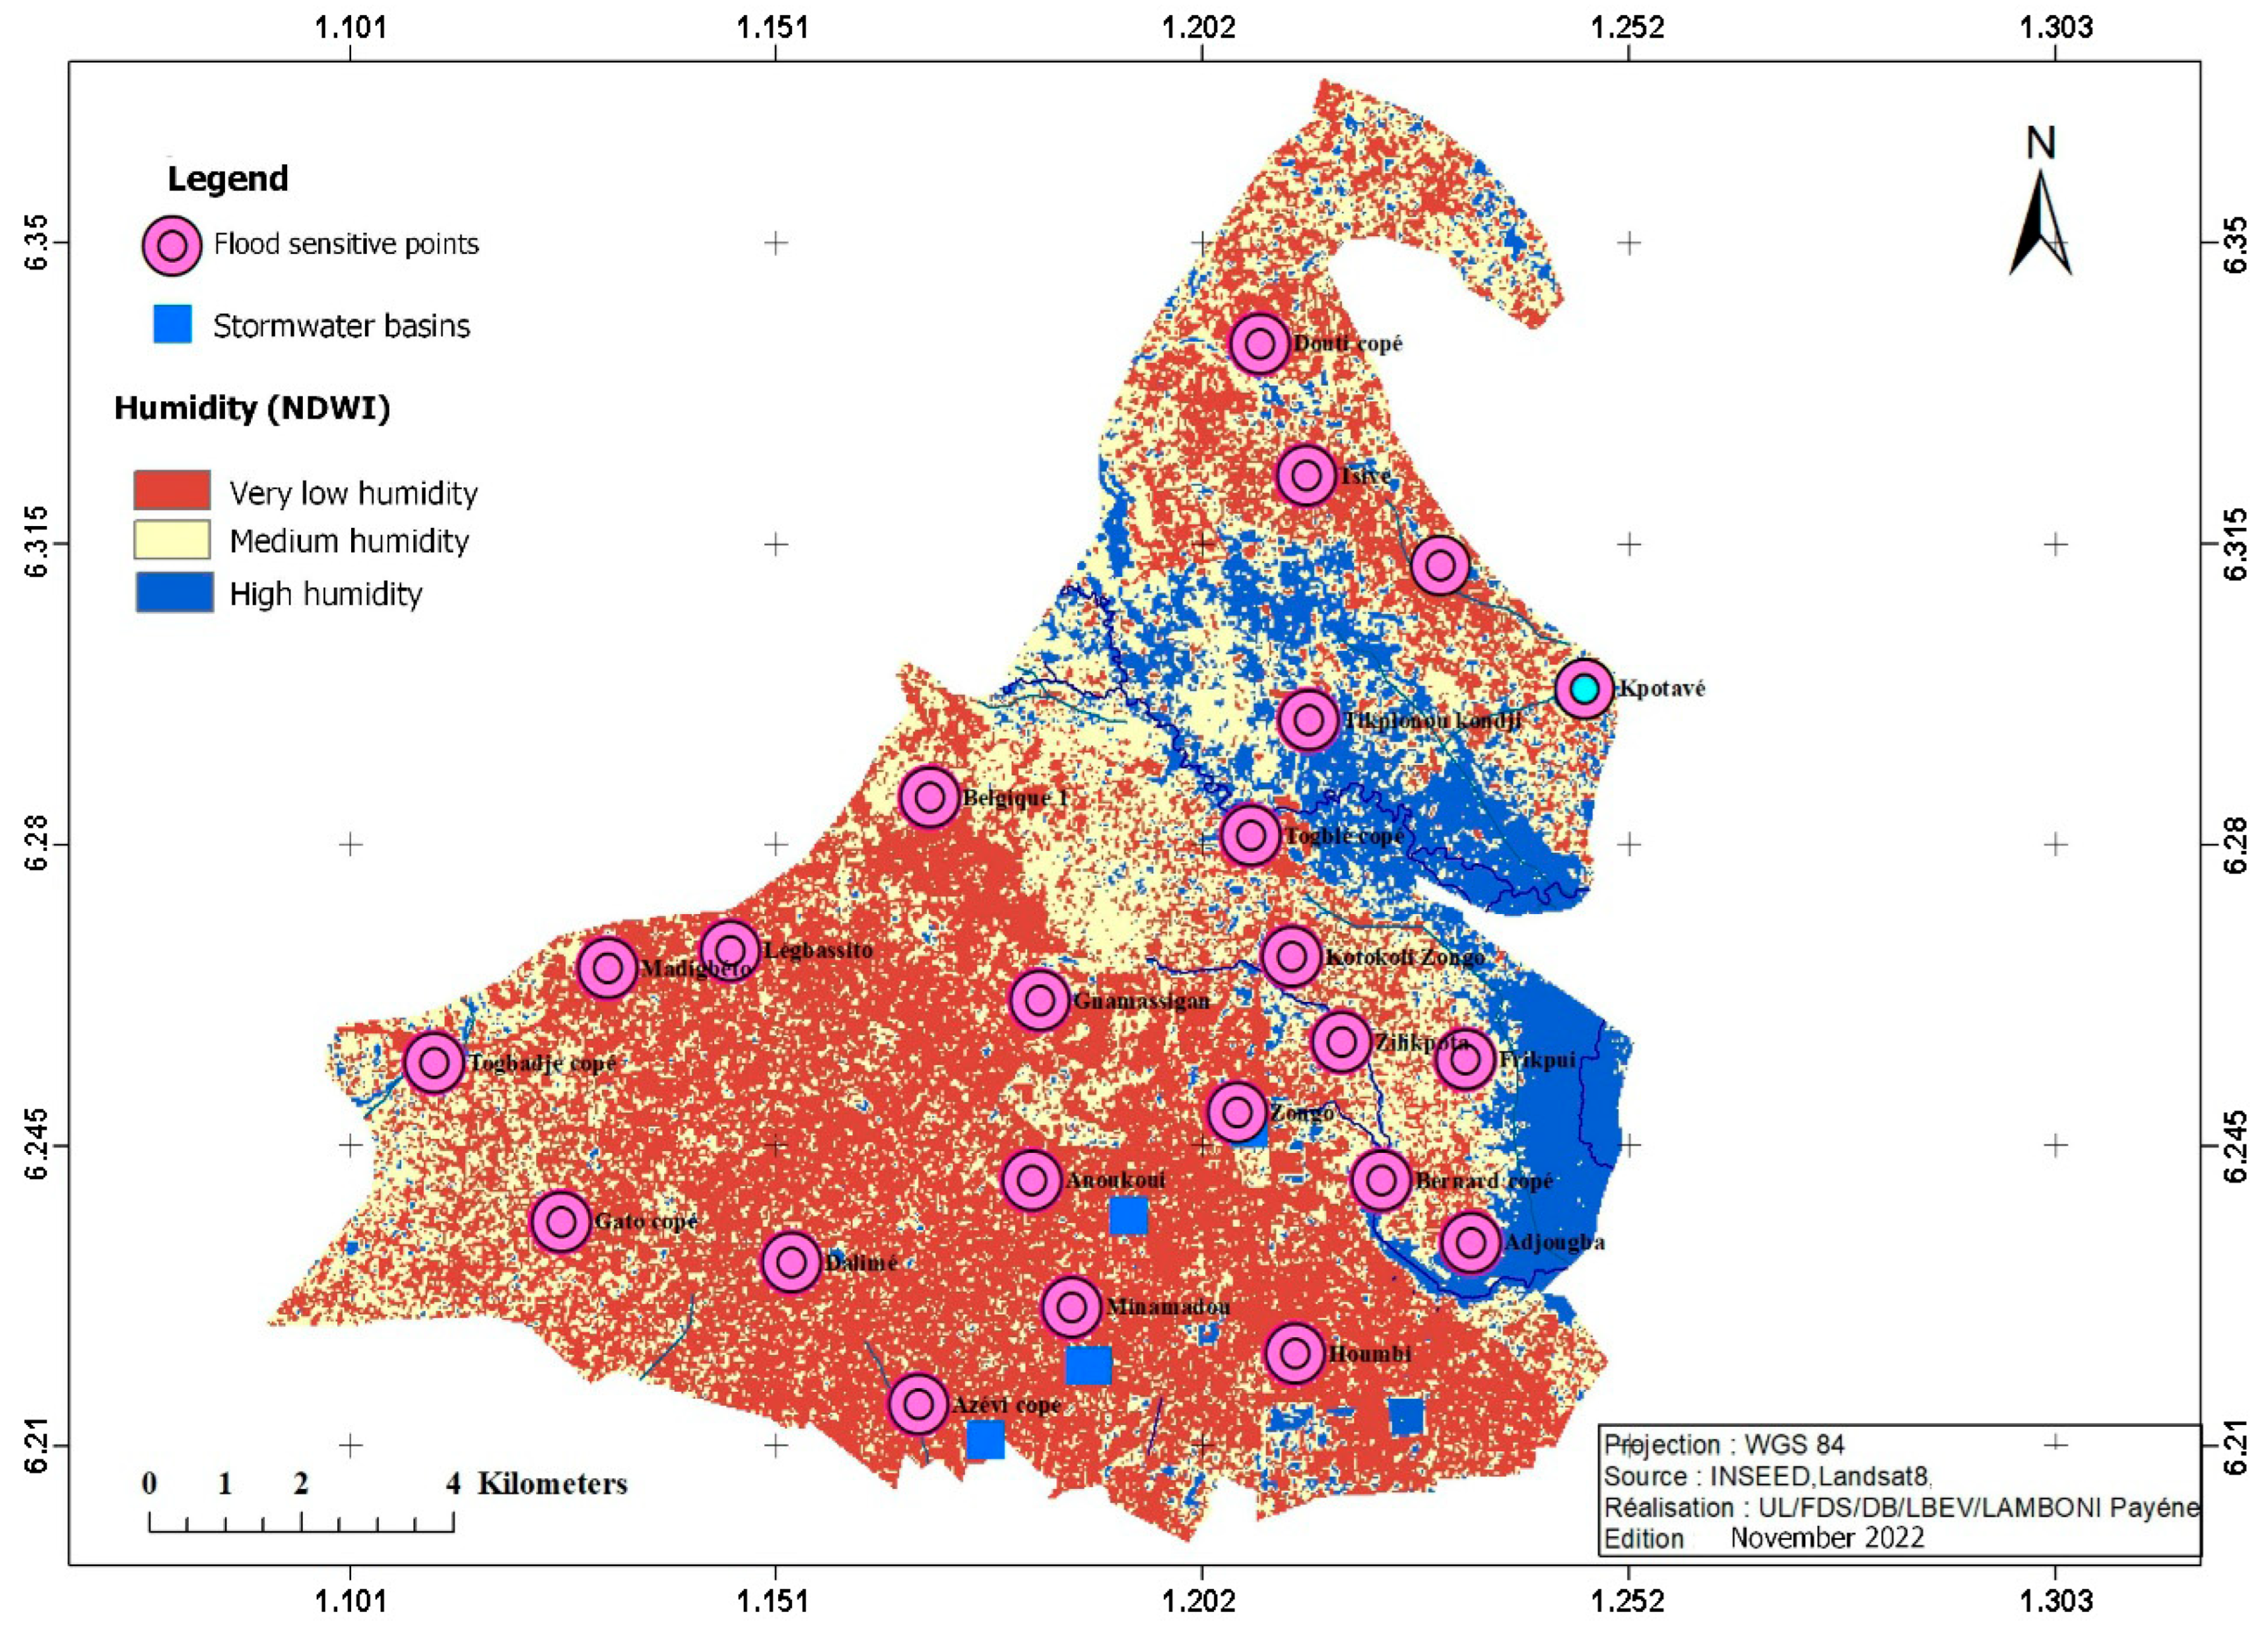
3.4. Distribution of Storm Basins and Sensitive Points to Flooding

The field survey findings about hydrological events facilitated the identification of 22 locations across the entire northern municipalities susceptible to floods. By comparing the risk spots reported by the people with the NDWI map, it was feasible to ascertain the locations that are more susceptible to risks based on their height. Points located in areas of high humidity are the most sensitive to flooding, followed by points located in areas of medium humidity (Figure 7). These areas are waterlogged, and in rainy weather, the vertical runoff is not really significant, which leaves the water on the surface, creating flooding. These areas are located in the alluvial basin of the Zio and near rivers or large streams in the prefecture.

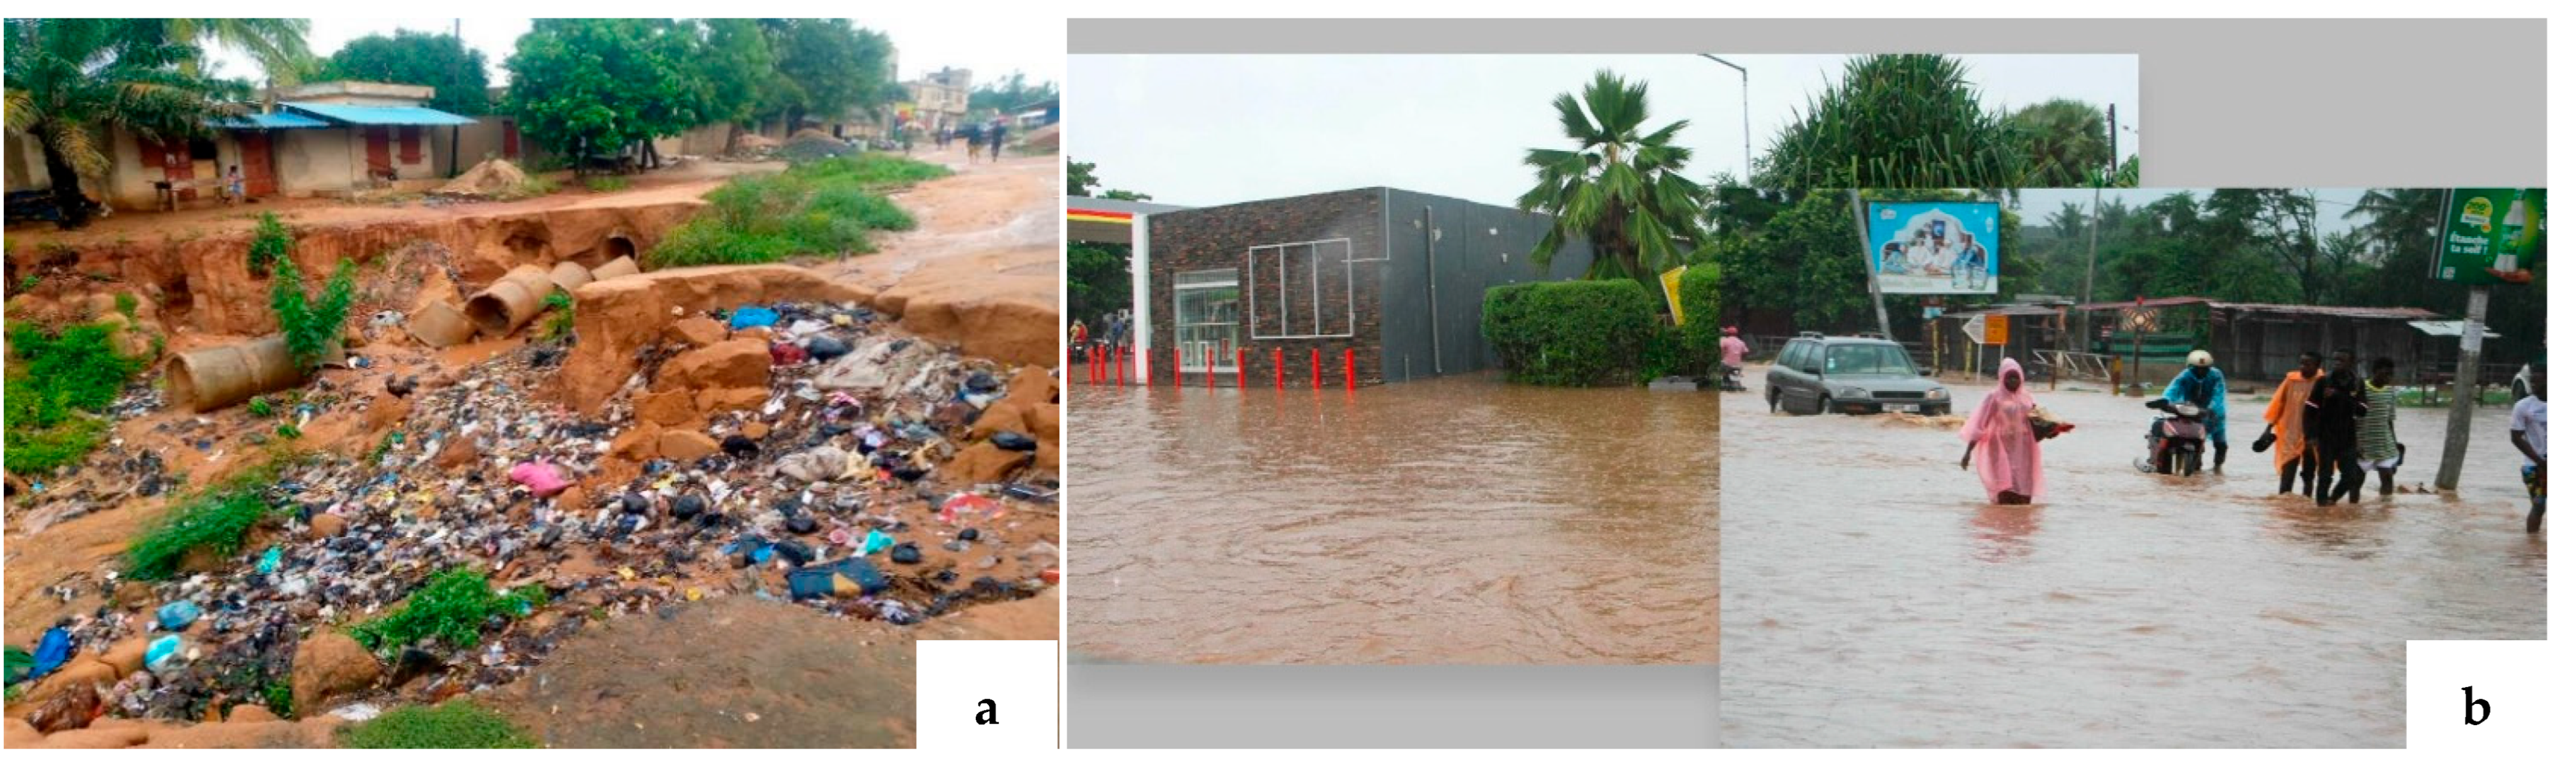
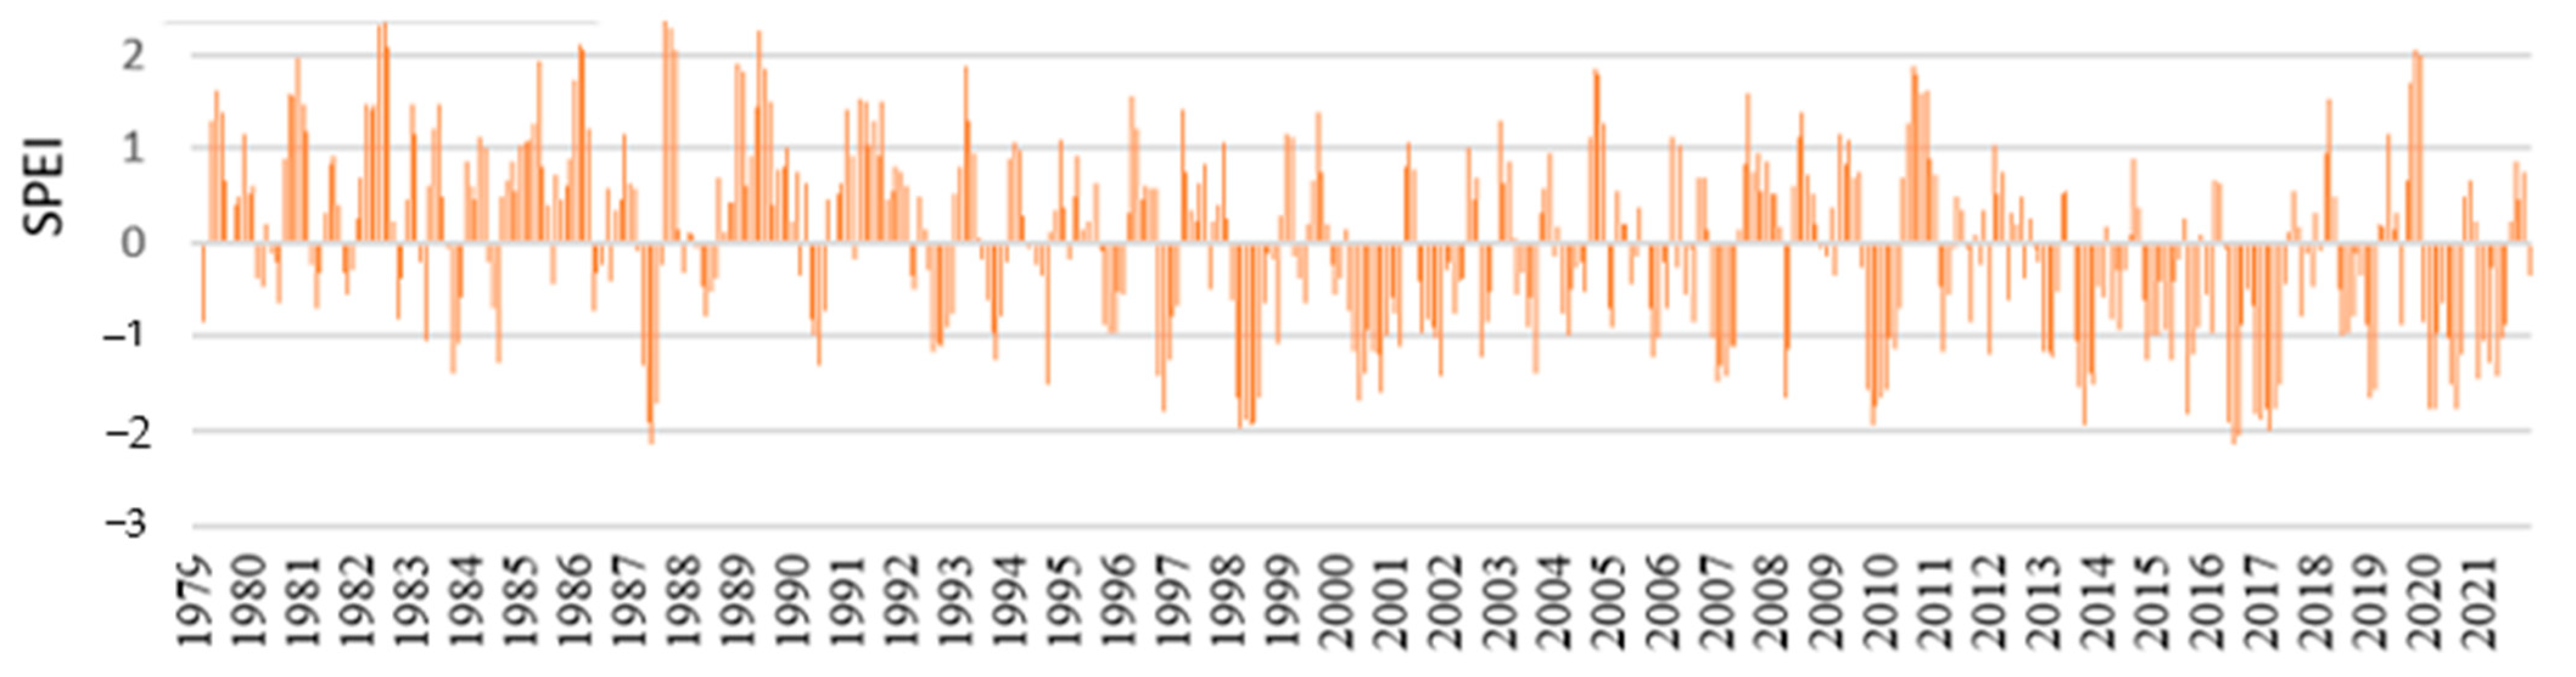
3.5. Landscape Dynamics and the Emergence of Environmental Risks

The landscape of the Northern Municipalities of Lomé, classified into four distinct units, has undergone significant spatial and temporal changes from 2014 to 2022. These changes represent transitions between different land cover classes. The expansion of development areas/artificial surfaces has reduced the areas of natural ecosystems, such as meadows and wetlands, with the proliferation of structures in flood-prone zones being particularly alarming, especially in Units 1 and 2.
In Units 3 and 4, in addition to the degradation of natural habitats, the intensification of urban development has diminished the capacity for heavy rainfall absorption and disrupted both fluvial and overland drainage networks, thereby increasing the susceptibility to flooding. Moreover, agricultural fields, which cover approximately 22% of the landscape, pose an elevated risk of groundwater pollution, a critical source of potable water. The expansion of croplands in Unit 1 has further heightened this vulnerability.
The environmental vulnerability assessment conducted in the northern municipalities of Agoè-Nyivé, based on susceptibility, exposure, and adaptive capacity, identifies inundation as the most dominant hazard (83%), followed by pollution (7%) and drought (7%). These hazards are often interconnected, forming compound risks in which one event can trigger or amplify others. Inundation not only threatens public health and safety but also contributes to soil erosion (3%) and increased pollution levels (5%). The observed soil erosion within the municipalities constitutes a cascading risk, exacerbated by ground subsidence and deficiencies in the local hydrological system (Figure 8). Furthermore, survey results reveal that 44% of respondents dispose of solid waste in illegal dumping sites, and up to 14% of waste is stored inside residential dwellings. Notably, green carpet-like moss was observed in approximately 50% of households, indicating persistent moisture conditions and potential public health concerns.
The urban wetlands in the northern municipalities of the Agoè-Nyivé prefecture are also influenced by climatic parameters. Analysis of precipitation data recorded at the Lomé station from 1979 to 2021 using the SPEI and SPI indices reveals a succession of wet and dry periods (Figure 9 and Figure 10). Indeed, the period from 1979 to 1998 is recognized as predominantly wet, while the period from 1998 to 2010 exhibited a balance between wet and dry conditions. However, since 2010, a relative trend toward agricultural drought has emerged. This trend is attributable to climate change, which increases vulnerability to drought risk.

4. Discussion

4.1. Characteristics of Plant Formations

The diversity of plant formations in the urban northern municipalities is illustrated by their typology. This diversity is also observed nationally in anthropogenic landscapes [19,50]. Among these plant formations, wetlands are of particular interest. The identification of wetlands in the northern municipalities is based on the analysis of soil types, the presence of water, and indicator species [51]. A total of 91 species, distributed among 84 genera and 37 families, have been recorded in the wetland areas of these municipalities. Compared to regional studies conducted on wetlands, the species diversity observed in this study appears significantly lower. For instance, a survey carried out in the urban and peri-urban wetlands of the Grand Lomé Autonomous District (DAGL) reported 163 plant species [52]. This number increases to 371 species when the entire Zio River watershed in Togo is considered [53]. At a broader regional scale, another study identified 398 plant species in the wetlands of southeastern Côte d’Ivoire [54]. The low species richness observed in this study could be explained by strong anthropogenic pressure on the site, notably through habitat degradation and changes in land use. Furthermore, the size of the study areas may also contribute to the differences in observed species richness.
The occurrence of certain species, such as Acacia sieberiana, Adansonia digitata, and Commiphora africana, within floodable savannah ecosystems, is substantiated by the findings of spontaneous savannah flora in the urban area of Lomé [55]. Most genera and species that are distinctive to wetlands are acknowledged as bioindicators of wetlands. The species Scirpus atrovirens, Typha australis, Nymphaea lotus, and Sagitaria spp. are found in the alluvial plain. Also, in semi-floodable meadows, species of the genus Scirpus (S. validus, S. jluvialilis, S. aculus, S. helerochaetus, S. maritimus), Typha spp., then Lemna spp. are found. In the peat bogs, Typha (Typha domingensis) and Sagitaria (Sagitaria longiloba) are found [51]. The semi-temporal pools of the wetland of the Oti-Mandouri watershed are dominated by floating hydrophytes such as Nymphaea spp. [56]. In floating plant communities in the wetlands of the southeast of the Ivory Coast [54], Eichhornia crassipes and Ipomoea aquatica occur; in temporary pools, Ludwigia stolonifera; and in brackish marshes, Nymphaea lotus, Cyperus articulates, and Mariscus ligularis. The existence of these species serves as evidence for the enduring or intermittent existence of water in these regions. Nevertheless, vegetation degradation is mainly attributed to the pressures exerted by urbanization, climatic dangers, and flooding. The phenomenon of urban pressure promotes the depletion of vegetation in order to accommodate development areas/artificial surfaces.

4.2. Landscape Dynamics and Risks

The rate of land use dynamics within the northern municipalities has experienced a notable acceleration over eight years, resulting in significant implications for all classes. Development areas/artificial surfaces have exhibited the most significant increase in surface area, just like the study carried out by some authors in Kinshasa in the Democratic Republic of Congo [57]. The swift urbanization of the northern municipalities can be attributed to political and geographical factors. This is evident in the northern municipalities’ transition to an independent administrative entity and their integration into the autonomous district of Greater Lomé, which has consistently propelled its growth and expansion. Over six years, the population has experienced a twofold increase, rising from 419,649 individuals in 2010 [58] to 882,695 inhabitants in 2022 [59]. Urban sprawl results from this increase in human activities and requirements caused by population growth. Unit 4’s altered plant cover is attributable to implementing individual reforestation initiatives across all concessions, developing green spaces, reforestation efforts in the region, and converting fallow lands in higher strata.
Meadows and wetlands were not consolidated but rather dispersed due to urbanization; development areas/artificial surfaces were established in the dispersed areas, thereby increasing the northern municipalities’ vulnerability to inundation. The degradation of natural habitats is a consequence of anthropogenic activities, specifically the expansion of urban areas. The issue of groundwater pollution is not new and has been documented in other municipalities across the nation, as evidenced by the detection of physicochemical pollutants and microorganisms indicative of fecal contamination in the city of Aného [60].

4.3. Vulnerabilities Linked to Risks

Environmental conditions in the northern municipalities of Lomé have significant repercussions on the health of populations living in flood-prone areas. In response to this situation, the Togolese authorities, through the National Development Plan (PND 2018–2022) and the government’s 2020–2025 roadmap, are paying particular attention to cross-cutting issues related to land use planning. This includes the development of municipal development plans to clearly define authorized residential areas and those to be excluded. Notably, a considerable portion of this waste, potentially up to 14%, is found to be stored within residential dwellings. Moss with a green carpet-like appearance is detected in around 50% of residential dwellings. The phenomenon is commonly observed in numerous African cities, including Cameroon, where the urban populace disposes of solid trash haphazardly inside urban areas. It has been reported that approximately 34% of this debris is indiscriminately deposited into water bodies [61]. According to some authors [62], the lack of effective management of surface rainfall has significant implications for the functionality of urban areas and poses a considerable constraint on the overall well-being of cities in Togo. According to studies, waterborne diseases are caused by various pollutants in water, primarily fecal matter [63]. These pollutants are spread by a mechanism known as spatial infra-diffusion, which involves the interpenetration and interdependence of different water bodies, leading to contamination. The factors above unequivocally contribute to the growth of pathogenic agents within the human body. In a study, it was shown that the presence of widespread saprophytic micromycetes characterizes the soils in the autonomous district of Greater Lomé. These micromycetes are known to be opportunistic parasites that can contribute to human pathology. Flooding plays a significant role in disseminating pathogenic microorganisms and the deterioration of some crops that have limited tolerance to prolonged submersion [63].
In the county of Agoè-Nyivé, the lack or insufficiency of a firmly established hydrological system is suggestive of soil erosion resulting from removing topsoil from the streets. Degraded soil is known to be transported by turbulent water discharge, leading to the development of ravines along roadways or near structures. The fragility of the hydromorphic substrate is the cause of collapse and subsidence [63].
The vulnerability factors of the Agoè-Nyivé northern municipalities are associated with the risk of floods, exposing populations, products, and materials. A cumulative count of nine vulnerabilities has been detected. The presence of buildings occupying the river beds, as observed, results in a complete lack of consistency in the occupation of the alluvial plain and the formation of counter-slopes that disregard the functional attributes of a hydrosystem [35,64]. Some work showed that wetlands contribute to reducing flood risks when, in our case, they are a high-risk area [65]. This contradiction arises from the fact that, in our case, in the northern municipalities of Agoè-Nyivé, the wetlands are invaded by human installations, which disrupt the function of the area.

4.4. Alignment of This Study with the Sustainable Development Goals (SDGs)

This study on the impacts of urbanization on wetland ecosystems in the northern communes of Lomé (Togo) is closely aligned with several Sustainable Development Goals (SDGs). It contributes to MDG 11 by helping to plan more sustainable cities by taking into account the environmental effects of urbanization. In connection with MDG 13, it explores how wetland ecosystems can mitigate the effects of climate change. It also supports MDG 14 by highlighting the importance of protecting the aquatic biodiversity of coastal wetlands. This study also supports MDG 15 by highlighting the need to conserve terrestrial ecosystems threatened by urbanization. Finally, it responds to MDG 6 by highlighting the crucial role of wetlands in water and sanitation management and the risks associated with their degradation.

5. Conclusions

To assess the environmental impact of landscape changes, the land use study conducted in the Northern Municipalities of Lomé between 2014 and 2022 reveals a significant expansion of artificial surfaces (+40.47%) at the expense of natural habitats, notably grasslands and wetlands, which declined by 57.14%. Evaluating the impact of urban expansion on wetland habitats shows increased fragmentation and degradation of these ecosystems, driven by the progressive encroachment of human constructions, severely disrupting their essential ecological functions. This landscape transformation exacerbates ecosystem degradation and heightens vulnerability to environmental hazards, particularly flooding. These effects are further compounded by inadequate land management practices and the absence of sustainable waste management systems. To address these challenges and promote sustainable urbanization within the Grand Lomé Autonomous District, municipalities must adopt and implement the Plan for the Integration of Ecological Planning into Urban Development (PIPEDU) as a key ecological planning tool. Protection and restoration of wetlands and natural habitats are also recommended, notably through the establishment of an urban green belt around Lomé. Moreover, urban expansion in high-risk areas must be strictly controlled by strengthening land management processes and rigorously enforcing legislation that prohibits residential development in flood-prone zones during the issuance of the cadastral plan. Finally, improved stormwater and hydrological system management is strongly advised to reduce flood risks and ensure better ecological balance in urbanized areas.

Author Contributions

Conceptualization, L.P., K.G., F.F. and W.K. methodology, L.P., K.G., F.F. and W.K.; software, L.P., K.G. and F.F.; validation, L.P., K.G., F.F. and W.K.; formal analysis, L.P. and K.G.; investigation, L.P., K.G. and Y.G.P.; resources, W.K. and B.K.; data curation, L.P., K.G. and Y.G.P.; writing—original draft preparation, L.P. and K.G.; writing—review and editing, L.P., K.G., F.F., Y.G.P., V.G., E.B., K.M., M.D. and W.K.; visualization, L.P., F.F., W.K. and B.K.; supervision, W.K. and B.K.; project administration, F.F.; funding acquisition, W.K. and F.F. All authors have read and agreed to the published version of the manuscript.

Funding

This study was financed by the World Bank initiative via the Regional Excellence Center for Sustainable Cities in Africa (CERViDA-DOUNEDON) hosted by the University of Lomé (Togo) Under the project « Planification écologique en milieu urbain, cas des communes de Kozah 1, Ogou 1 et Agoè-Nyivé 1/ CONVENTION N°004/2022/CERViDA-DOUNEDON ».

Institutional Review Board Statement

The study was conducted in accordance with the Declaration of Helsinki, and approved by the Ethics Committee of University of Lomé, Faculty of Health Sciences (project code 002/2024/CE-FSS and date of 27 March 2024).

Informed Consent Statement

Informed consent was obtained from all subjects involved in the study.

Data Availability Statement

Data are available upon request.

Acknowledgments

This study was carried out in collaboration with West African Universities Laboratories and the three municipalities’ staff under the lead of the Laboratory of Botany and Plant Ecology (LBEV) of the University of Lomé (Togo).

Conflicts of Interest

The authors declare no conflicts of interest.

References

  1. Mitsch, W.J.; Gosselink, J.G. Wetlands; John Wiley & Sons: Hoboken, NJ, USA, 2015. [Google Scholar]
  2. Afdhal, B.; Hamdi, N.; Charfi-Cheikhrouha, F.; Moali, A. Importance ecologique et role des zones humides artificielles du Nord de la Tunisie dans la conservation des oiseaux d’eau en hivernage. Bulletin de la Société Zoologique de France 2008, 133, 253. [Google Scholar]
  3. Bergkamp, G.; Orlando, B. Les zones humides et les changements climatiques. In Explorer les Avenues de la Collaboration Entre la Convention sur les Zones Humides (Ramsar, Iran 1971) et la Convention-Cadre des Nations Unies sur les Changements Climatiques; Ramsar Convention: Gland, Switzerland, 1999; 31p. [Google Scholar]
  4. Bidois, J. Amenagement de Zones Humides Ripariennes pour la Reconquete de la Qualite de l’eau Experimentation et Modélisation. Ph.D. Thesis, Université Rennes 1, Rennes, France, 1999. [Google Scholar]
  5. Folega, F.; Kanda, M.; Fandjinou, K.; Bohnett, E.; Wala, K.; Batawila, K.; Akpagana, K. Flora and Typology of Wetlands of Haho River Watershed, Togo. Sustainability 2023, 15, 2814. [Google Scholar] [CrossRef]
  6. Yaokokoré-Béibro, K.H.; Gueye, M.F.; Koné, Y.S.; Odoukpé, K.S.G. Biodiversité urbaine des oiseaux dans la Zone humide d’importance internationale de Grand-Bassam (Sud-Est de la Côte d’Ivoire). Int. J. Innov. Appl. Stud. 2015, 11, 339–349. [Google Scholar]
  7. Clauzel, C. Dynamiques de L’occupation du sol et Mutations des Usages dans les Zones Humides Urbaines. Étude Comparée des Hortillonnages d’Amiens (France) et des Chinampas de Xochimilco (Mexique). Ph.D. Thesis, Université Paris-Sorbonne-Paris IV, Paris, France, 2008. [Google Scholar]
  8. Lézy, E.; Lézy-Bruno, L. BiodiverCités: Les Aires Protégées Urbaines, des Laboratoires Grandeur Nature; Iggybook: Paris, France, 2013. [Google Scholar]
  9. Badiane, S.D.; Mbaye, E. Zones humides urbaines à double visage à Dakar: Opportunité ou menace? Sci. Eaux Territ. 2018, 2018, 1–5. [Google Scholar]
  10. Veyret-Verner, G. L’accroissement de la population mondiale (1920–1960). Types d’accroissement naturel et essai d’interprétation. Revue de Géographie Alpine 1965, 53, 525–559. [Google Scholar] [CrossRef]
  11. World Bank. World Development Report; Oxford University Press: Oxford, UK, 1984. [Google Scholar]
  12. Malouono, M. Problématique des eaux pluviales dans les quartiers périphériques des villes de l’Afrique subsaharienne (Recherche bibliographique, 2014). Environ. Water Sci. Public Health Territ. Intell. J. 2018, 2, 77–85. [Google Scholar]
  13. INSEED. INSEED—Institut National de la Statistique et des Etudes Économiques et Démographiques; INSEED: Lomé, Togo, 2024. [Google Scholar]
  14. United Nations. World Urbanization Prospects 2007; Department of Economic and Social Affairs, Population Division: New York, NY, USA, 2007; 32p. [Google Scholar]
  15. Bocquier, P.; Mukandila, A.K. African urbanization trends and prospects. Afr. Popul. Stud. 2011, 25, 337–361. [Google Scholar] [CrossRef]
  16. INSEED. Distribution Spatiale de la Population; INSEED: Lomé, Togo, 2022. [Google Scholar]
  17. Degla, M.H.; Geoffroy, K.; Houessou, L.; Lougbégnon, T. Progrès relatifs à l’influence des facteurs écologiques et sociaux sur l’évaluation de la dynamique des écosystèmes humides. Revue Marocaine des Sciences Agronomiques et Vétérinaires 2024, 12, 233–239. [Google Scholar]
  18. Roudart, L.; Mazoyer, M. Histoire des Agricultures du Monde; Du Néolithique à la Crise Contemporaine Le Seuil: Paris, France, 1997. [Google Scholar]
  19. Salavati, B. Impact de L’urbanisation sur la Réponse Hydrologique des Bassins Versants Urbains. Ph.D. Thesis, Université Pierre et Marie Curie-Paris VI, Paris, France, 2015. [Google Scholar]
  20. Aschan-Leygonie, C.; Bonnaud, A.; Girault, C. Quand la situation urbaine favorise la protection des espaces naturels: Le cas de Göteborg (Suède). Cybergeo Eur. J. Geogr. 2015. document 744. [Google Scholar] [CrossRef]
  21. Abalo, M.; Badabate, D.; Fousseni, F.; Kpérkouma, W.; Koffi, A. Landscape-based analysis of wetlands patterns in the Ogou River basin in Togo (West Africa). Environ. Chall. 2021, 2, 100013. [Google Scholar] [CrossRef]
  22. Ern, H. Die vegetation togos. gliederung, gefährdung, erhaltung. Willdenowia 1979, 9, 295–312. [Google Scholar]
  23. Leroux. La Variabilité des Précipitations en Afrique Occidentale: Les Composantes Aérologiques du Problème; Université Jean Moulin: Lyon, France, 1983. [Google Scholar]
  24. FAO-UNESCO. Digital Soil Map of the World. 2007. Available online: https://www.fao.org/soils-portal/data-hub/soil-maps-and-databases/faounesco-soil-map-of-the-world/en/ (accessed on 2 May 2025).
  25. Ozesmi, S.L.; Bauer, M.E. Satellite remote sensing of wetlands. Wetl. Ecol. Manag. 2002, 10, 381–402. [Google Scholar] [CrossRef]
  26. Malki, F.; Al Karkouri, J.; Sabir, M.; El Mderssa, M.; Dallahi, Y. Contribution of geomatics tools to the study of the spatio-temporal evolution of forest stands of the Maamora forest in the face of global changes. In E3S Web of Conferences; EDP Sciences: Les Ulis, France, 2022; p. 01001. [Google Scholar]
  27. Peng, K.; Jiang, W.; Hou, P.; Wu, Z.; Cui, T. Detailed wetland-type classification using Landsat-8 time-series images: A pixel- and object-based algorithm with knowledge (POK). GIScience Remote Sens. 2024, 61, 2293525. [Google Scholar] [CrossRef]
  28. Johnston, C.A.; Zedler, J.B.; Tulbure, M.G.; Frieswyk, C.B.; Bedford, B.L.; Vaccaro, L. A unifying approach for evaluating the condition of wetland plant communities and identifying related stressors. Ecol. Appl. 2009, 19, 1739–1757. [Google Scholar] [CrossRef]
  29. Mabafei, A.; Diwediga, B.; Fousseni, F.; Wala, K.; Koffi, A. Caractérisation phyto-sociologique des zones humides de la plaine de l’Ogou. Rev. Écosystèmes et Paysages (Togo) 2021, 1, 43–57. [Google Scholar]
  30. Thiombiano, A.; Glele Kakaï, R.; Bayen, P.; Boussim, J.I.; Mahamane, A. Méthodes et dispositifs d’inventaires forestiers en Afrique de l’Ouest: État des lieux et propositions pour une harmonisation. Ann. Sci. Agron. 2016, 20, 15–31. [Google Scholar]
  31. Braun-Blanquet, J. Plant Sociology: The Study of Plant Communities; McGraw-Hill Book Company: New York, NY, USA; London, UK, 1932; 439p. [Google Scholar]
  32. Akoègninou, A.; Van der Burg, W.J.; Van der Maesen, L.J.G. Flore Analytique du Bénin; Backhuys Publishers: Leiden, The Netherlands, 2006. [Google Scholar]
  33. Brunel, J.F.; Hiepko, P.; Scholz, H. Flore analytique du Togo: Phanérogames. Englera 1984, 4, 3–751. [Google Scholar] [CrossRef]
  34. Agence de l’eau Seine Normandie. Agence de l’eau Seine-Normandie. 2017. Available online: https://www.eau-seine-normandie.fr/agence-de-leau/presentation-et-competences (accessed on 1 June 2022).
  35. Klassou, K.S. L’influence humaine dans l’origine et la gravite des inondations au Togo: Cas de l’amenagement de l’espace dans la grande banlieue nord de Lome (Togble-Adetikope). Revue de Géographie Tropicale de L’environnement 2014, 2, 3–15. [Google Scholar]
  36. KoBoCollect. KoBoCollect—Data Collection for Humanitarian and Development Settings; Harvard Humanitarian Initiative: Cambridge, MA, USA, 2022. [Google Scholar]
  37. Harvard Humanitarian Initiative. KoBoToolbox; Harvard Humanitarian Initiative: Cambridge, MA, USA, 2022. [Google Scholar]
  38. Raunkiaer, C. The life forms of plants and statistical plant geography; being the collected papers of C. Raunkiaer. Geogr. J. 1934, 84, 455. [Google Scholar]
  39. White, F. La Végétation de l’Afrique: Mémoire Accompagnant la Carte de Végétation de l’Afrique Unesco/AETFAT/UNSO; IRD Editions: Marseille, France, 1986; Volume 20. [Google Scholar]
  40. Tucker, C.J. Red and photographic infrared linear combinations for monitoring vegetation. Remote Sens. Environ. 1979, 8, 127–150. [Google Scholar] [CrossRef]
  41. Gao, B.C. NDWI—A normalized difference water index for remote sensing of vegetation liquid water from space. Remote Sens. Environ. 1996, 58, 257–266. [Google Scholar] [CrossRef]
  42. McFeeters, S.K. Using the normalized difference water index (NDWI) within a geographic information system to detect swimming pools for mosquito abatement: A practical approach. Remote Sens. 2013, 5, 3544–3561. [Google Scholar] [CrossRef]
  43. Luong, A.T. Évaluation des Risques D’inondations Dans le Bassin du Fleuve Huong, Province de Thua Thien Hue, Centre du Vietnam. Ph.D. Thesis, Université du Québec à Montréal, Montréal, QC, Canada, 2012. [Google Scholar]
  44. Dauphiné, A.; Provitolo, D. Risques et Catastrophes: Observer, Spatialiser, Comprendre, Gérer; Armand Colin: Malakoff, France, 2013. [Google Scholar]
  45. Vicente-Serrano, S.M.; Beguería, S.; Angulo-Martínez, M. A multiscalar global drought dataset: The SPEIbase: A new gridded product for the analysis of drought variability and impacts. Bull. Am. Meteorol. Soc. 2010, 91, 1351–1354. [Google Scholar]
  46. Svoboda, M.; Hayes, M.; Wood, D. Standardized Precipitation Index: User Guide. 2012. Available online: https://digitalcommons.unl.edu/droughtfacpub/209/ (accessed on 1 June 2022).
  47. Koungbanane, D.; Zahiri, P.E.; Sourou, H.; Totin Vodounon, H.S.; Amoussou, E.; Lare, L.Y.; Koubodana, H.D. Analyse fréquentielle et détermination des seuils pluvio-hydrologiques de risques d’inondation dans le bassin-versant de l’Oti au Togo. Afrique Sci. 2020, 17, 73–88. [Google Scholar]
  48. McKee, T.B. Drought monitoring with multiple time scales. In Proceedings of the 9th Conference on Applied Climatology, Boston, MA, USA, 15–20 January 1995. [Google Scholar]
  49. République Togolaise. République Togolaise. Très Importantes Inondations à Lomé. 2023. Available online: https://www.republicoftogo.com/toutes-les-rubriques/environnement/tres-importantes-inondations-a-lome (accessed on 1 May 2025).
  50. Fousseni, F.; Lamboni, P.; Kombate, B.; Atakpama, W.; Madjouma, K.; Marra, D.; Kpérkouma, W.; Komlan, B. Un système pilote de suivi régional de la biodiversité au Togo dénommé BioReMa-Togo (Système de suivi de la biodiversité region Maritime). Revue Ecosystèmes et Paysages 2024, 4, 1–13. [Google Scholar] [CrossRef]
  51. Tiner, R.W. The primary indicators method—A practical approach to wetland recognition and delineation in the United States. Wetlands 1993, 13, 50–64. [Google Scholar] [CrossRef]
  52. Amadou, S.A. Enjeux et Défis de la Conservation des Zones Humides Naturelles Péri-Urbaine et Urbaine du Grand Lome (Togo). Mémoire de Master, Institut de Formation et de Recherche Pour le Développement Durable (IFORDD), Lomé, Togo, 2025. [Google Scholar]
  53. Seou, E.; Akame, L.; Boukpessi, T. Diversité floristique et caractéristiques structurales des groupements végétaux du bassin du Zio (Sud-Togo). Physio-Géo Géographie Phys. Environ. 2022, 17, 83–98. [Google Scholar] [CrossRef]
  54. Kouame, M.L.O. Ordination et classificcation de la vegetation des zones humides du Sud-Est de la côte D’Ivoire. Agron. Afr. 2009, 21, 1–13. [Google Scholar]
  55. Kouglo, Y.E. Les Refuges Urbains de la Biodiversité: Cas des Ligneux dans la Ville de Lomé; Université de Lomé: Lomé, Togo, 2004. [Google Scholar]
  56. Okoumassou, K.; Samah, K.; Houkpè, K.; Abamy, K.O. Fiche Descriptive sur les Zones Humides Ramsar (FDR)-Version 2006–2008. 2007. Available online: https://rsis.ramsar.org/RISapp/files/RISrep/BF1877RISformer_161203.pdf (accessed on 1 November 2024).
  57. Mavunda, C.A.; Kanda, M.; Folega, F.; Egbelou, V.; Bosela, B.; Drazo, N.A.; Yoka, J.; Dourma, M.; AKPAGANA, K. Dynamique spatio-temporelle des changements d’occupation du sol sous incidence anthropique dans la ville de Kinshasa (RDC) de 2001 à 2021. Geo-Eco-Trop 2022, 46, 137–148. [Google Scholar]
  58. DGSCN. Recensement Général de la Population et de L’habitat (06 au 21 Novembre 2010); Résultats Définitifs: Lomé, Togo, 2011; 44p. [Google Scholar]
  59. INSEED. Distribution Spatiale de la Population; Institut national de la statistique et des études économiques et démographiques: Lomé, Togo, 2022. [Google Scholar]
  60. Poromna, H.; Gado, A.R.; Kangni-Dossou, M.; Gnandi, K.; Ameyapoh, Y. Evaluation de la Vulnérabilité des Nappes Phréatiques à la Pollution engendrée par la Mauvaise Gestion des boues de Vidange dans la Ville d’Aného au Togo. Eur. Sci. J. 2022, 18, 208. [Google Scholar] [CrossRef]
  61. Fogwe, Z.N.; Asue, E.N. Cameroonian urban floodwater retaliations on human activity and infrastructural developments in channel flood ways of Kumba. Curr. Urban Stud. 2016, 4, 85–96. [Google Scholar] [CrossRef]
  62. Klassou, K.S. L’urbanisation et l’assainissement pluvial au Togo. Revue de Géographie Tropicale de L’environnement 2011, 2, 45–60. [Google Scholar]
  63. Abomo, D.M.; Fouda, M.; Chofor, Z.B.; Kamwo, M. Analyse spatiale du risque d’inondation dans le bassin versant du Mbanya à Douala, capitale économique du Cameroun. In Novatech 2010-7ème Conférence Internationale sur les Techniques et Stratégies Durables pour la Gestion des eaux Urbaines par Temps de Pluie/7th International Conference on Sustainable Techniques and Strategies for Urban Water Management; Graie: Lyon, France, 2010; pp. 1–10. [Google Scholar]
  64. Fogwe, Z.N.; Lambi, C.M. Combating Inundation in Some Major Cameroonian Cities: An Appraisal of Indigenous Strategies; Environmental Issues: Problems and Prospects; University of Buea, Unique Printers: Bamenda, Cameroon, 2001. [Google Scholar]
  65. Wu, Y.; Zhang, G.; Rousseau, A.N.; Xu, Y.J.; Foulon, É. On how wetlands can provide flood resilience in a large river basin: A case study in Nenjiang river Basin, China. J. Hydrol. 2020, 587, 125012. [Google Scholar] [CrossRef]
Figure 1. The map of the municipalities of Lomé.
Conservation 05 00028 g001
Figure 2. Wetland identification diagram based on French Water Agency assessment tools [34].
Conservation 05 00028 g002
Figure 3. Structure and dynamics of the urban landscape.
Conservation 05 00028 g003
Figure 4. Landscape proportion metrics.
Conservation 05 00028 g004
Figure 5. Class Proportion Metrics: Unit 1 (a), Unit 2 (b), Unit 3 (c), Unit 4 (d).
Conservation 05 00028 g005
Figure 6. Family spectrum (a) and species rank–frequency curve (b).
Conservation 05 00028 g006
Figure 7. Map of soil moisture-related flood hotspots (NDWI).
Conservation 05 00028 g007
Figure 8. (a) Bad adaptation induced by the impact of runoff and flooding with dump; (b) flooding in Lomé, photo from the National Agency for Civil Protection [49].
Conservation 05 00028 g008
Figure 9. SPEI time series curve.
Conservation 05 00028 g009
Figure 10. SPI time series curve (the intervals of 10 represent ten-year periods; thus, 0 corresponds to the year 1979, 10 to 1989, 20 to 1999, 30 to 2009, and 40 to 2019; the red color illustrates the dry trend in rainfall and the blue illustrates the wet trend).
Conservation 05 00028 g010
Table 1. Typology of Wetlands and Characteristic Plant Species.
Wetland TypeDominant Vegetation FormationsCharacteristic Species
Alluvial plainFlooded savannah, croplands, and permanent pondsMitragyna inermis (Willd.) Kuntze, Sarcocephalus latifolius (Sm.) E.A.Bruce, Dichrostachys cinerea (L.) Wight & Arn, Lonchocarpus sericeus (Poir.) Kunth, Echinochloa colona (L.) Lin
Lowland meadowsHygrophilous and hydrophilous vegetation, and permanent pondsTypha australis Schumach., Mariscus cylindristachyus Steud., Scirpus atrovirens Willd., Persicaria senegalensis (Meisn.) Sojak, Mitragyna inermis (Willd.) Kuntze, Marsilea diffusa Lepr. ex A.Braun, Ipomoea aquatica Forssk., Hygrophila auriculata (Schumach.) Heine, Cyperus compressus L., Cyperus articulatus L., Cyperus rotundus L., Nymphaea lotus L., Nymphaea alba L., Ludwigia erecta (L.) Hara
Stormwater retention pondsFloating aquatic plant species (often invasive)Eichhornia crassipes (Mart.) Solms, Lemna paucicostata Hegelm.
Disclaimer/Publisher’s Note: The statements, opinions and data contained in all publications are solely those of the individual author(s) and contributor(s) and not of MDPI and/or the editor(s). MDPI and/or the editor(s) disclaim responsibility for any injury to people or property resulting from any ideas, methods, instructions or products referred to in the content.

