Article

Land Use Change and the Structural Diversity of Affem Boussou Community Forest in the Tchamba 1 Commune (Tchamba Prefecture, Togo)

1
Laboratoire de Botanique et Ecologie Végétale (LBEV), Faculté des Sciences (FDS), Université de Lomé (UL), Lomé 01 BP 1515, Togo
2
Institut National de Formation Agricole (INFA) de Tové, Département de Foresterie, Kpalimé BP 401, Togo
3
Earthworm Foundation (Ex The Forest Trust), Chemin de Chantavril 2, 1260 Nyon, Switzerland
4
The Food and Agriculture Organization (FAO), 1307, Av. Duisburg, Kodjoviakopé, Lomé 01 BP 911, Togo
*
Author to whom correspondence should be addressed.
Conservation 2023, 3(3), 346-362; https://doi.org/10.3390/conservation3030024
Submission received: 16 May 2023 / Revised: 11 June 2023 / Accepted: 20 June 2023 / Published: 27 June 2023

Abstract

:
Affem Boussou community forest (AFC) abounds in important biological resources. This study, which contributes to its better management, examines the spatiotemporal dynamics of the vegetation and its ecological and structural characteristics to propose a zoning plan for said forest. The analysis of the spatiotemporal dynamics of land use in the AFC from Google Earth images of 2015, 2018, and 2021 revealed a regressive trend of formations: crops and fallows (−33.98%), dense dry forests (−7.92%), gallery forests (−3.46%), plantations (−100%), grassy savannahs, and meadows (−18.84%), except for tree/shrub savannahs (484.23%). The floristic inventory identified 163 species divided into 129 genera and 55 families. Fabaceae (14.02%), and Combretaceae (10.55%) are the most represented families. Anogeissus leiocarpa (5.19%) and Vitellaria paradoxa (4.72%) are the most frequent species. We note the dominance of individuals of small diameters. The regeneration potential of the AFC is 64 feet/ha due to 21 feet/ha of suckers, 29 feet/ha of seedlings, and 14 feet/ha of shoots. As a zoning plan, the AFC was subdivided into four zones: the agroforestry zone (18.80%), the sustainable production forest zone (42.22%), the buffer zone (11%), and the biological conservation zone (28%). These results constitute a scientific basis for testing ecological indicators of the sustainable management of community forests in Togo.

1. Introduction

Ecosystem degradation evolves with bioclimatic conditions and anthropogenic action [1,2]. A direct consequence of this degradation is the fragmentation of plant formations [3]. This is compounded by a certain lack of institutional willingness and the absence of adequate management tools. As a result, forest density may decrease significantly, and some species may be extinguished [4]. From 1990 to 2015, the world’s total forest area decreased from 31.6% to 30.6% [5]. This forest cover has continued to decline since the beginning of the century in the intertropical zone. Concomitantly with this reduction in forest cover, cultivated areas have increased considerably [6,7], leading to a degradation characterized by an increasing loss of their floristic diversity.
In West Africa, numerous studies [8,9,10,11] have shown that human activities (slash-and-burn agriculture, ranches and other rangelands, mining, urbanization) negatively impact the structure, the floristic composition, and the dynamics of natural forests. The most dominant forms of disturbance that contribute to shaping the structure and physiognomy of the vegetation [12,13,14] include wildfires, anarchic exploitation of woody resources, shortening of the duration of fallows, and land clearing, coupled with hydrological stress related to irregular rainfall.
For decades, village communities in Togo have preserved portions of their land for hunting, biodiversity conservation, land reserve, cultural, and spiritual purposes. Some of these areas, which today constitute community forests, are managed according to traditional rules. The capacity of these areas to conserve fauna and flora, the effectiveness of their management, and interactions with riparian communities are also hotly debated [12,15]. The main products derived from these forest ecosystems contribute to food security and are sources of income for their populations [16]. Therefore, knowledge of all ecological and physiognomic aspects of the vegetation is essential to assess the resources of these areas.
In recent years, the central region of Togo has faced significant degradation of forest ecosystems, with negative repercussions for the population. This situation has caused a substantial loss of vegetation cover, leading to rapid land degradation and a significant loss of biodiversity. Between 1986 and 2003, open and dry forests and forest–savannah mosaics saw a 26.52% regression, alongside an increase in anthropogenic formations of around 26.48% [17]. This degradation not only adds to ecosystem depletion but also jeopardizes the quality of life and potentially the survival of vulnerable populations that rely heavily on ecological services. Being one of the leading wood energy suppliers in Togo, with more than 100 localities with high wood energy productivity [18], the resources of this region are highly coveted. The Affem Boussou community forest in the Tchamba prefecture is not spared from this situation. The community forest of Affem is under massive anthropogenic disturbances characterized by wildfires, hunting, wood harvesting, and non-timber product harvesting. The boundaries of the Affem community forest are currently affected by ecosystem fragmentation caused by extensive slash-burn agriculture from its periphery to its center. Due to the willingness of the Affem local community to set up the community forest and carry out a sustainable management plan, research to provide essential evidence on the potentiality of this crucial ecosystem has not yet been completed. Thus, for the best management of these ecosystems, it is necessary to question the spatial nature of this ecosystem’s degradation. What is its extent to date? It is well known that the community forest plays a crucial role in the conservation and management of biodiversity, hence the interest in analyzing the spatiotemporal dynamics of the vegetation. The overall goal of this research is to contribute to advancing information on forest dynamics in Togo in order to better direct the country’s forest management strategies and policies. More specifically, we aim to analyze land use changes between 2015, 2018, and 2021, thereby characterizing the structural diversity of the ecosystem and providing a zoning plan for the aforementioned community forest.

2. Materials and Methods

2.1. Study Area

Affem community forest is located in the prefecture of Tchamba, more specifically in the canton of Affem (Figure 1). It is situated between 9°11′ and 9°13′ North latitude and 1°55′ and 1°56′ East latitude. It covers an area of 82.19 ha. It belongs to ecological zone III [19], in the Benin-Togolese Peneplain, whose altitude varies between 200 and 400 m. and rests on the granite–gneissic crystalline base of the Benin-Togolese Plain structural unit [20]. The plant forms of Affem can be found on a wide range of soils, the most common of which are leached tropical ferruginous soils, soils with limited erosion, ferralitic soils, and vertisols. It has a Sudanian-type climate, with a wet season from April to October and a dry season from November to March [21,22]. The annual rainfall ranges between 1200 and 1300 mm. The relative humidity ranges from 60 to 80%, while the evaporation rate is approximately 1600 mm/year. Monthly temperatures range from 25 to 38 °C (with a monthly average of 26.5 °C). The vegetation in the study site is essentially characterized by Guinean wooded savannahs [20]. Vitellaria paradoxa, Tectona grandis, Terminalia spp., Lonchocarpus sericeus, Piliostigma thonningii, and Pterocarpus erinaceus are the most common woody species encountered. The fauna is dominated by rodents (rats, squirrels, agoutis, wild mice, hares), reptiles (green mambas, lizards), and birds (coliforms, gruiforms, columbines, cuculiforms, partridges, parrots).
Tchamba prefecture is home to a diverse range of ethnic groups. Among them, Tchamba, Kamboli, Koussountou, Bago, Kotokoli, Kabyè, etc. Tchamba had 34,626 residents at the time of the first census of 1970 [23]. The population rose to 46,000 people in the second census in 1981, to 74,000 people in 2004, and to 13,1674 people in 2010. It has a young population, with around 20% living in the city core, and is distinguished by rapid growth. The population of the villages Adjeidè (Kri-Kri), Larini, and Affem, considered the AFC riparian population, is estimated to be 25,000 people. Agriculture and commerce are the primary activities in Affem. The township provides cereals, tubers, cashew nuts, and charcoal to the nearby towns, mainly Tchamba [24].

2.2. Data Collection

2.2.1. Image Acquisition

High-resolution images covering three different years (2015, 2018, and 2021) were downloaded from several online geospatial data sources. Thus, using the add-on “open layer plugging” and shapefile of the study area, an ESRI image from 2021, followed by a digital globe image of 2018 and an aerial image of 2015 were, respectively, downloaded with an ESRI map, Google satellite and Bing aerial plugging. The choice of these images and their temporality is justified by their availability and their free access [25,26]. The relatively small size of the studied zone has also guided the use of high-resolution images, with the need to map the significant spatial entities’ features [27,28].
The land classification system was derived from the national system adapted to FAO LCS [29]. Riparian forest, dense dry forest, plantations, open forest, shrub/tree savannah, and fallow/cropland are the important land cover types identified after visual interpretation of the images and exploitation of auxiliaries’ earth observation data [30,31]. Digitization from the screen was then carried out. After digitalization, post-classification processing was performed, for example, via geoprocessing thematic vector analysis, including some reclassification, land cover type area computation [32,33], and layout of the time series map.
Finally, the land cover type dynamic was analyzed to assess changes in land use type between the three different periods [34,35]. Differences in a given land cover type between two periods were determined using the relationship below
Δ U = U 2 U 1 / n
where ΔU represents the annual rate of change, U2 the land cover type for the upper year, U1 the land cover type for the lower year, and n the number of years between the two dates.

2.2.2. Sampling

From the Affem Boussou community forest (AFC) vector file and QGIS 3.83 software [36], 34 regular grid points (of 100 m space from each other) were generated as forest inventory plot’s location (Figure 1). This choice is explained by the willingness to systematically sample plant species in all the different forms of land use in the AFC.
In-field sampling points were tracked from the MapsMe application installed on a mobile phone. At each point, a rectangular plot of 50 m × 20 m was installed for complete plant resource inventories [37,38].

2.2.3. Affem Boussou Community Forest (AFC) Plant Resource Inventories

The floristic inventory consisted of recording all woody species in plots, and herbaceous species in 10 m × 10 m subplots. The forest inventory consisted of measuring the height of the bole, the total tree height of woody species, and the diameter at breast height (DBH) ≥ 10 cm [39]. All tree diameters were measured using a measuring tape at 1.30 m from the ground. Bole and total tree height were estimated using visual notation. The choice of this technique was motivated by its successful use in Togo by previous authors with the same research topic [40,41].
The regeneration of the species was inventoried in three sub-plots of 2 m × 2 m installed diagonally in the middle of each plot. It was performed on individuals with a diameter between 5 and 10 cm, considered as potential regeneration subjects [4]. The regeneration mode (natural seedlings, stump sprouts, suckers) was also considered [42].
The ecological inventory was carried out in 50 m × 20 m plots. Ecological variables such as topography, overall vegetation cover, and evidence of human activities were recorded within each plot. Formation types were also identified. Coordinates of all inventory plots were recorded with a GPS (global positioning system) receiver.

2.2.4. Analysis of Floristic Diversity

The analysis of the floristic diversity allowed us to draw up a list of the species recorded and to group them by family. A matrix “surveys × species” was elaborated based on the presence and absence of species (in rows, the species, and in columns, the surveys). The elaborated matrix was submitted to multivariate analysis techniques to highlight the major ecological gradients, as well as the identification and the typology of major plant communities that emerge from them [43]. Thus, the matrix was subjected to the DECORANA® (DEtrended CORrespondence ANAlysis) method for plant community identification purposes [44,45] with CANOCO (CANOnial Community Ordination) software [46,47]. For each identified plant grouping, the list of flora affected, followed by their corresponding family, life forms [48] and chorology [49] was assigned. The alpha diversity (Table 1) measures, such as specific richness, specific frequencies, and abundances, were determined [50]. This was followed by the Shannon index (Ish) and Pielou equitability index (Eq) [51] for both plant communities. The formula for each of these indices is shown in the table below.
The density of the feet, average total height, average diameter, basal area, and regeneration rate were estimated as dendrometric parameters (Table 2).

2.2.5. Zoning Plan

We know how the AFC’s land use has changed over the time series, including its flora and ecosystem potentialities [55]. It is thus easier to suggest a management plan map, based on zoning, through buffer geoprocessing analysis. To design the zoning management map of AFC, the land use map of 2021 output associated with the ecosystems’ assessment results was processed to define major management zones, taking into consideration both the ecosystems residing in the AFC. Using QGIS software (version 2021), a buffer design followed by an asymmetric difference geoprocessing analysis was performed [56,57]. Finally, the key role or management vocation was defined for each designed zone [58,59].

3. Results

3.1. Spatial Characterization of Land Use

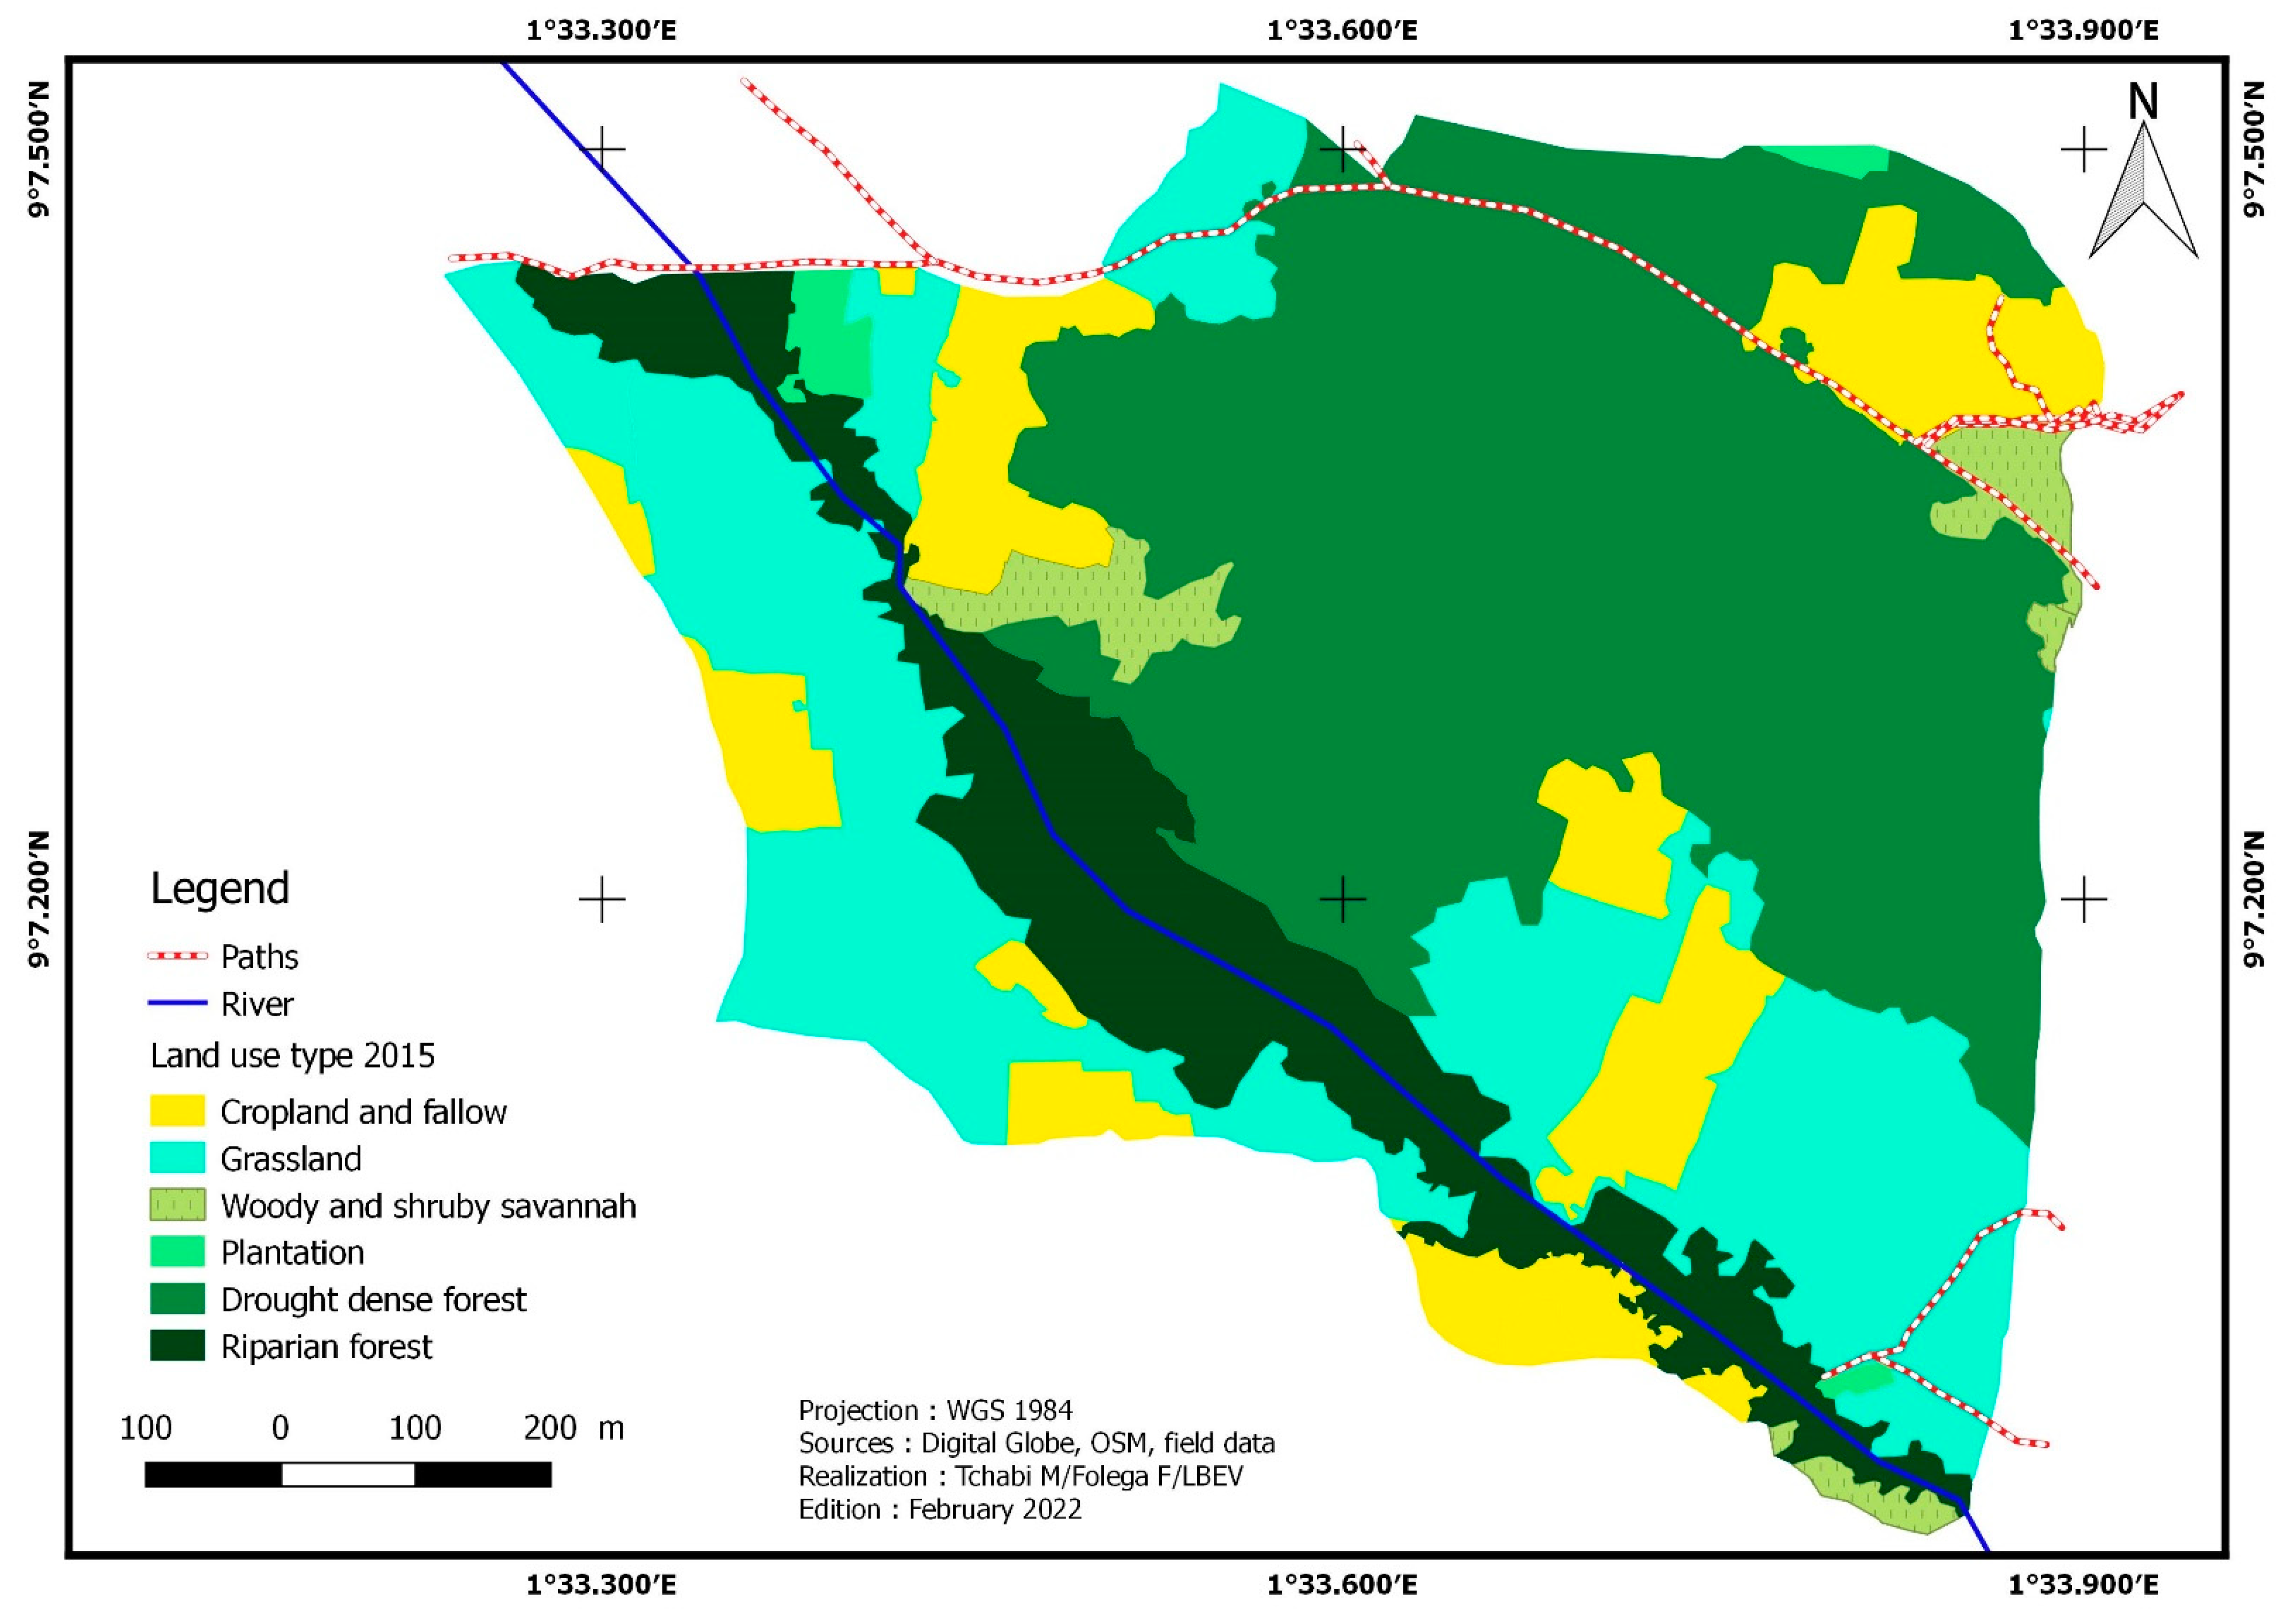
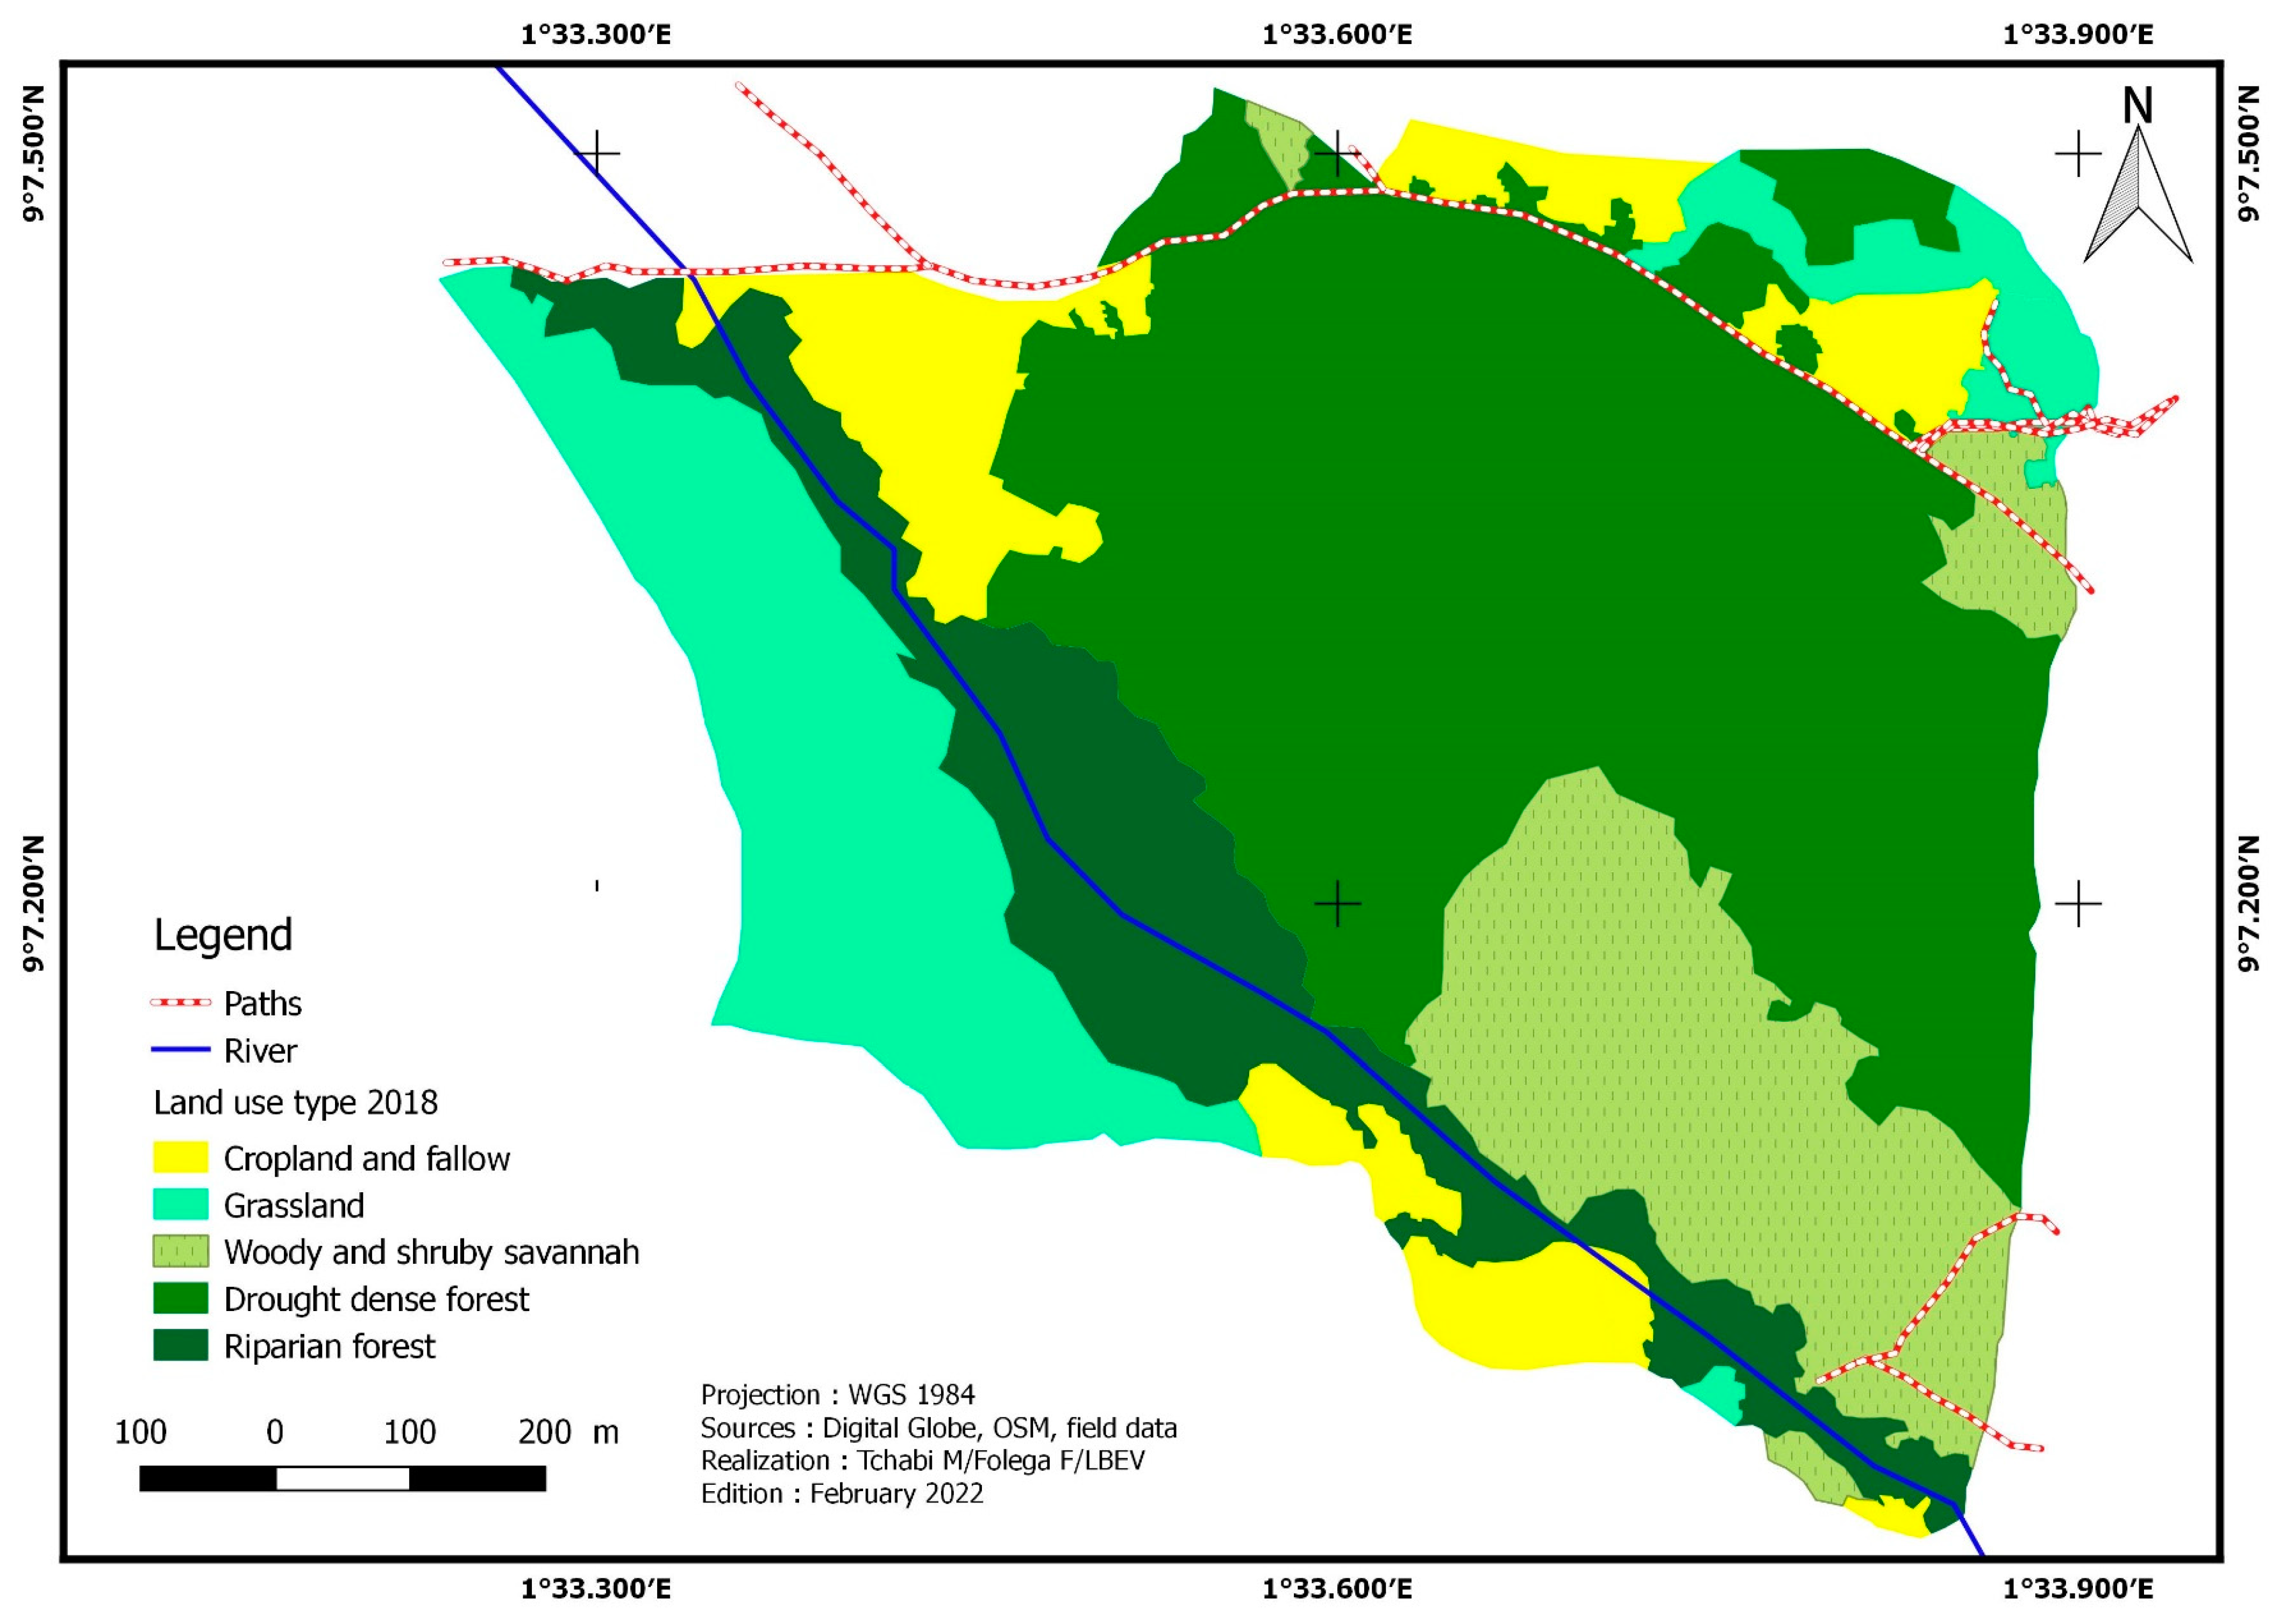
The Affem Boussou community forest (ACF) is 82.19 ha in size. In 2015, six land cover categories (Figure 2) were found within this area: dense dry forest, gallery forest, plantations, tree savannah/shrub savannah, grassland savannah/meadow, and crop/fallow. These different vegetation formations have undergone significant changes between 2015 and 2018. The extent of dense dry forests has grown. This area, which was 35.89 ha or 43.66% of the total area, rose by 1.78% i.e., 36.53 ha. The same is true for tree savannahs/shrub savannahs, which expanded from 2.41 ha (2.93% of total area) in 2015 to 12.84 ha (15.62% of total forest area). This land use unit recorded an increase of 10.42 ha or 432.40% (Table 3). The area of gallery forests decreased by −0.76%, from 10.95 ha in 2015 to 10.86 ha in 2018, i.e., a loss of 0.08 ha. Crops/fallow land has dropped from 10.82 ha (13.17% of total) to 8.37 ha (−22.63% regression rate). The grassy savannahs/meadows decreased from 2.4 hectares in 2015 to 13.59 ha in 2018, representing a 36.41% decrease. In addition, 0.75 hectares of plantation acreage was converted to crops/fallow in 2015 (Figure 3).
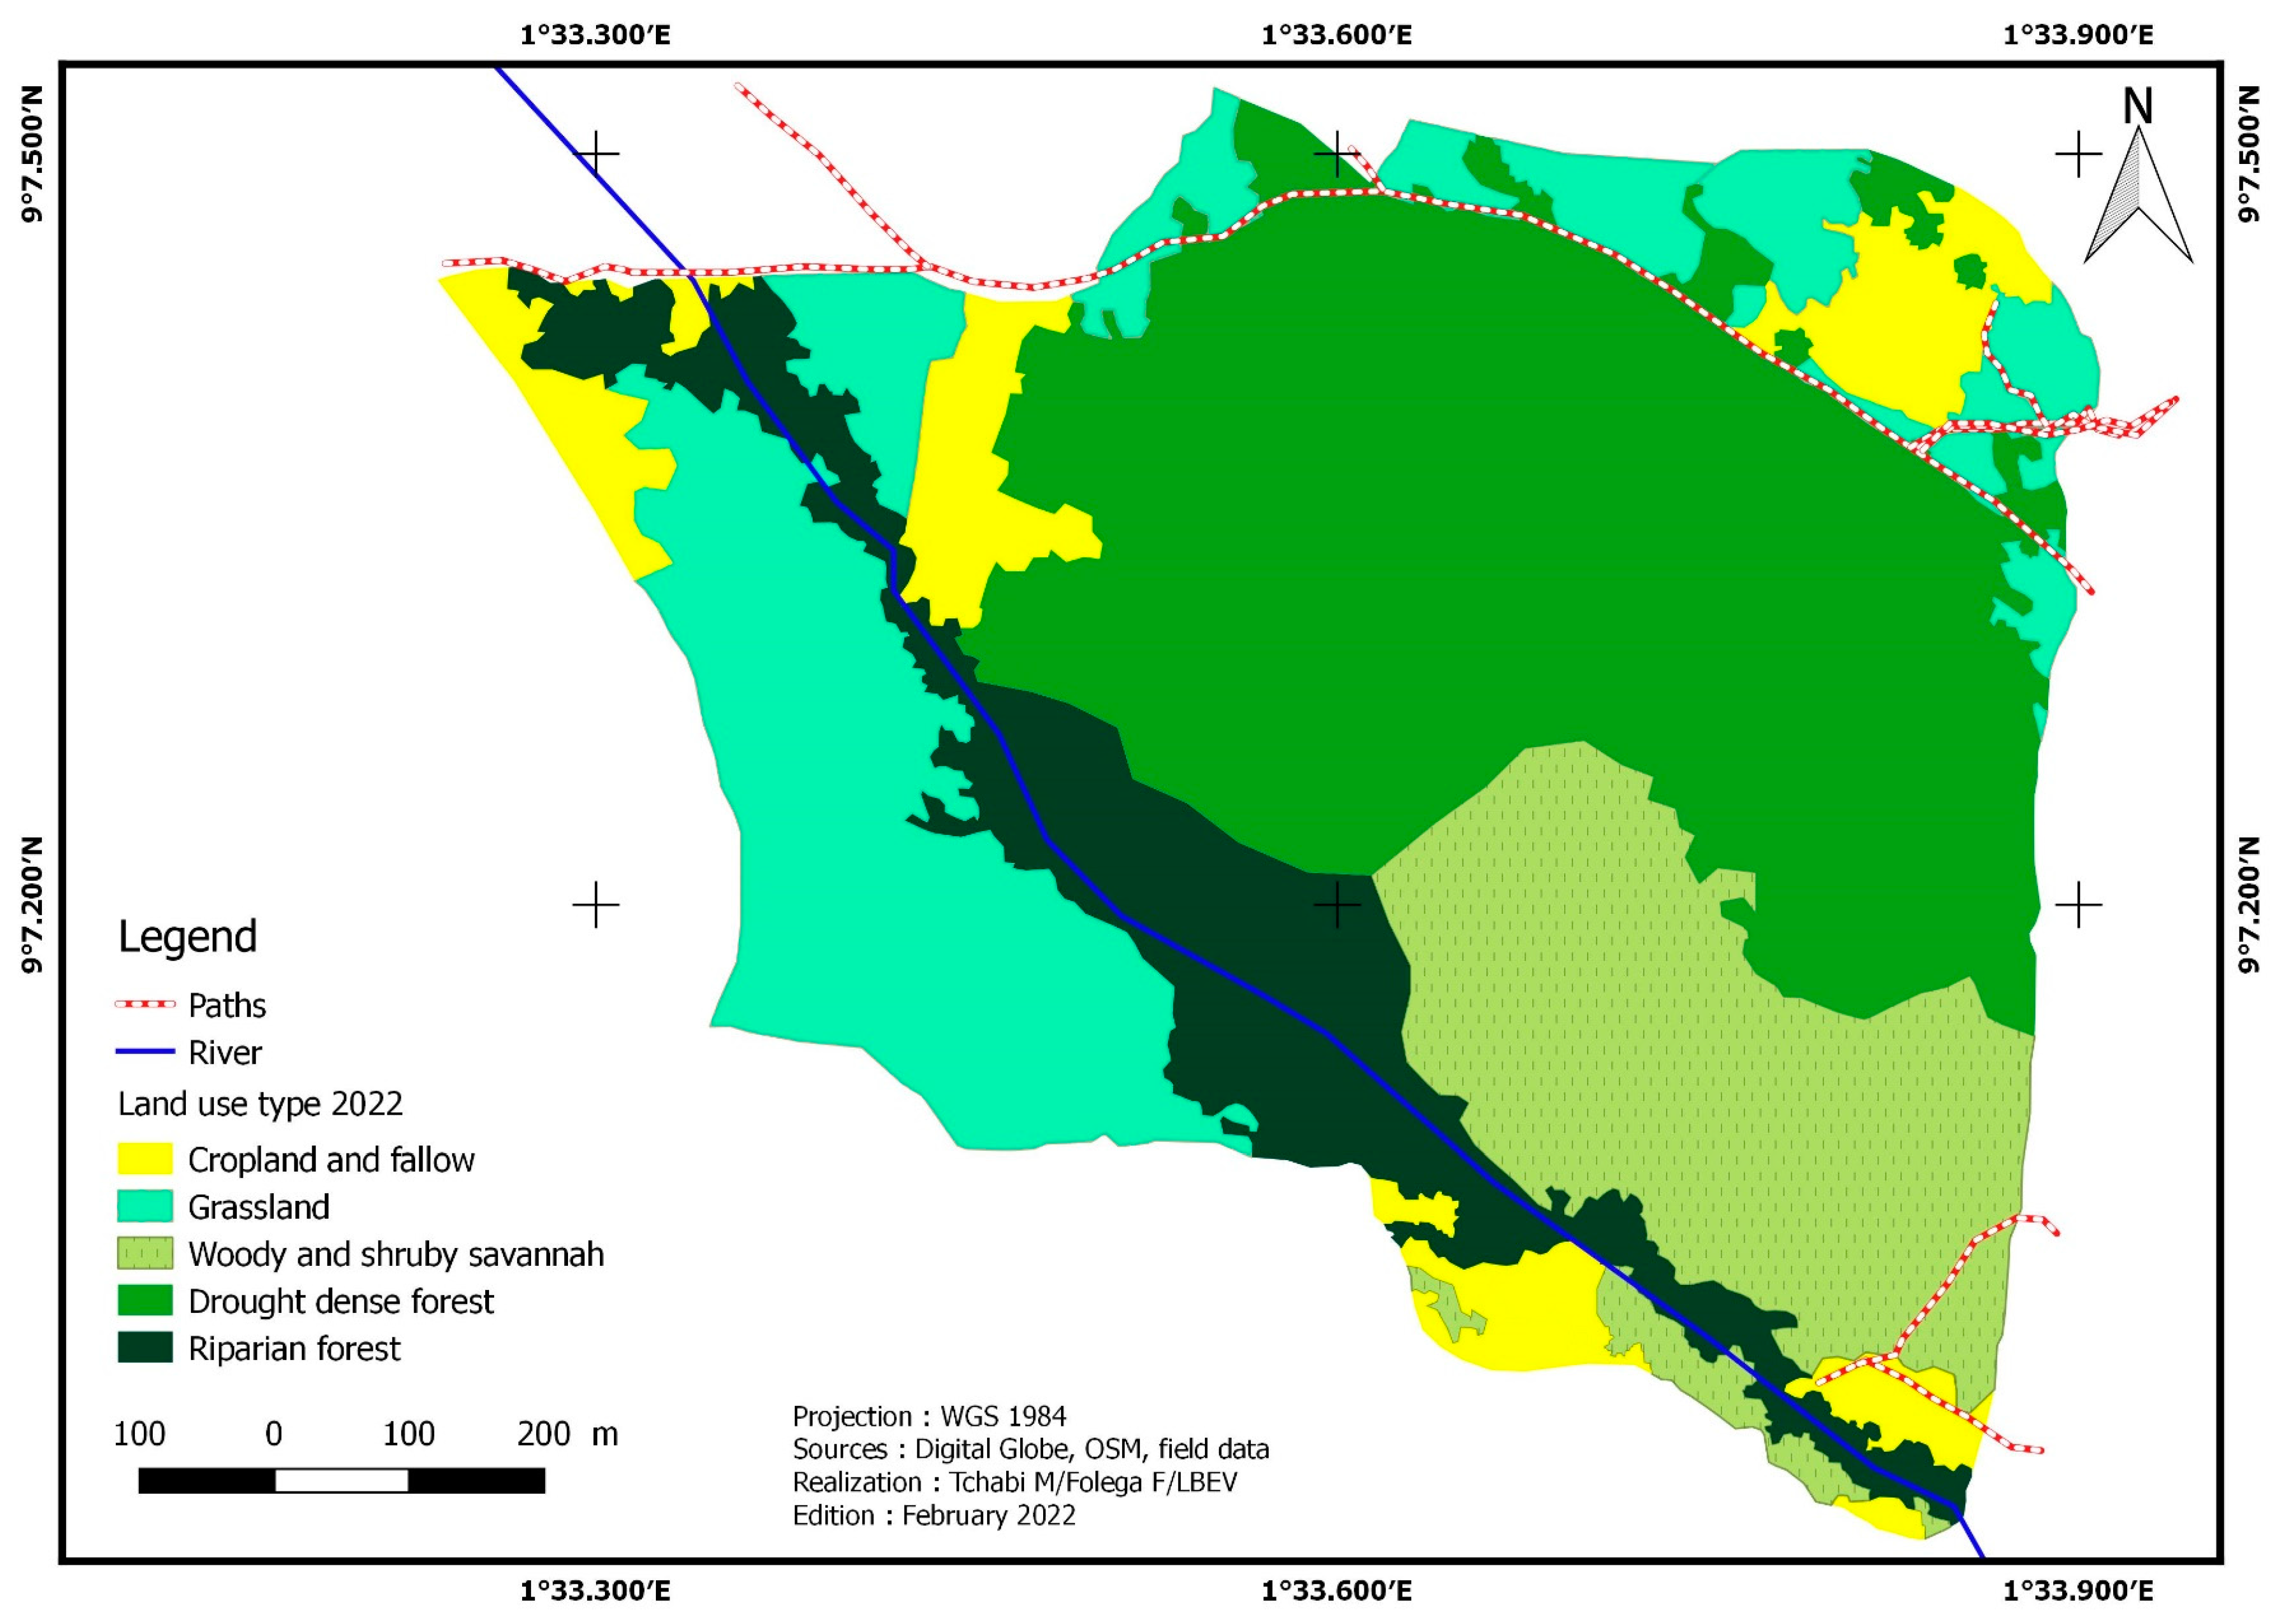
Five land cover types were identified in 2021 (Figure 4): dense dry forests, gallery forests, tree savannahs/shrub savannahs, grassy savannahs/meadows, and crops/fallow. Dry dense forest, gallery forest, and camp/fallow areas decreased in the area. The area of crops/fallow land decreased from 8.37 ha to 7.15 ha, representing a regression rate of −14.66%, while that of gallery forests decreased from 10.86 ha to 10.57 ha, a regression rate of −2.72%. The area of dry forests reduced from 36.57 ha in 2018 (44.44% of the total area) to 33.05 ha in 2020, a regression rate of −9.53%. On the other hand, tree savannahs/shrubs and grassy savannahs/meadows have experienced a significant increase in their extent. Tree/shrub savannahs increased from 12.84 ha to 14.08 ha, an increase of 9.73%. The emergence of grassy savannas/grasslands is the most significant. They grew from 13.59 ha to 17.34 ha, i.e., a growth rate of 27.63% (Table 3).
In the last 6 years, the areas of crops/fallow, plantations, gallery forests, dense dry forests, and grassy savannahs/meadows have decreased. Crops/fallow lands have lost 3.68 ha of their area, a regression rate of −33.98%. Gallery forests regressed by −3.46%, with a loss of 0.38 ha. Dry forests have declined by 2.84 ha, i.e., −7.92%. The plantations present in 2015 have been completely transformed into other land use units. Grassland savannahs/grasslands lost 4.03 ha of their area, representing a regression rate of −18.84%. The wooded savannahs/shrub savannahs have evolved, with a progression rate of 4884.23% and a gain of 11.67 ha.

3.2. Forest Flora Assessment

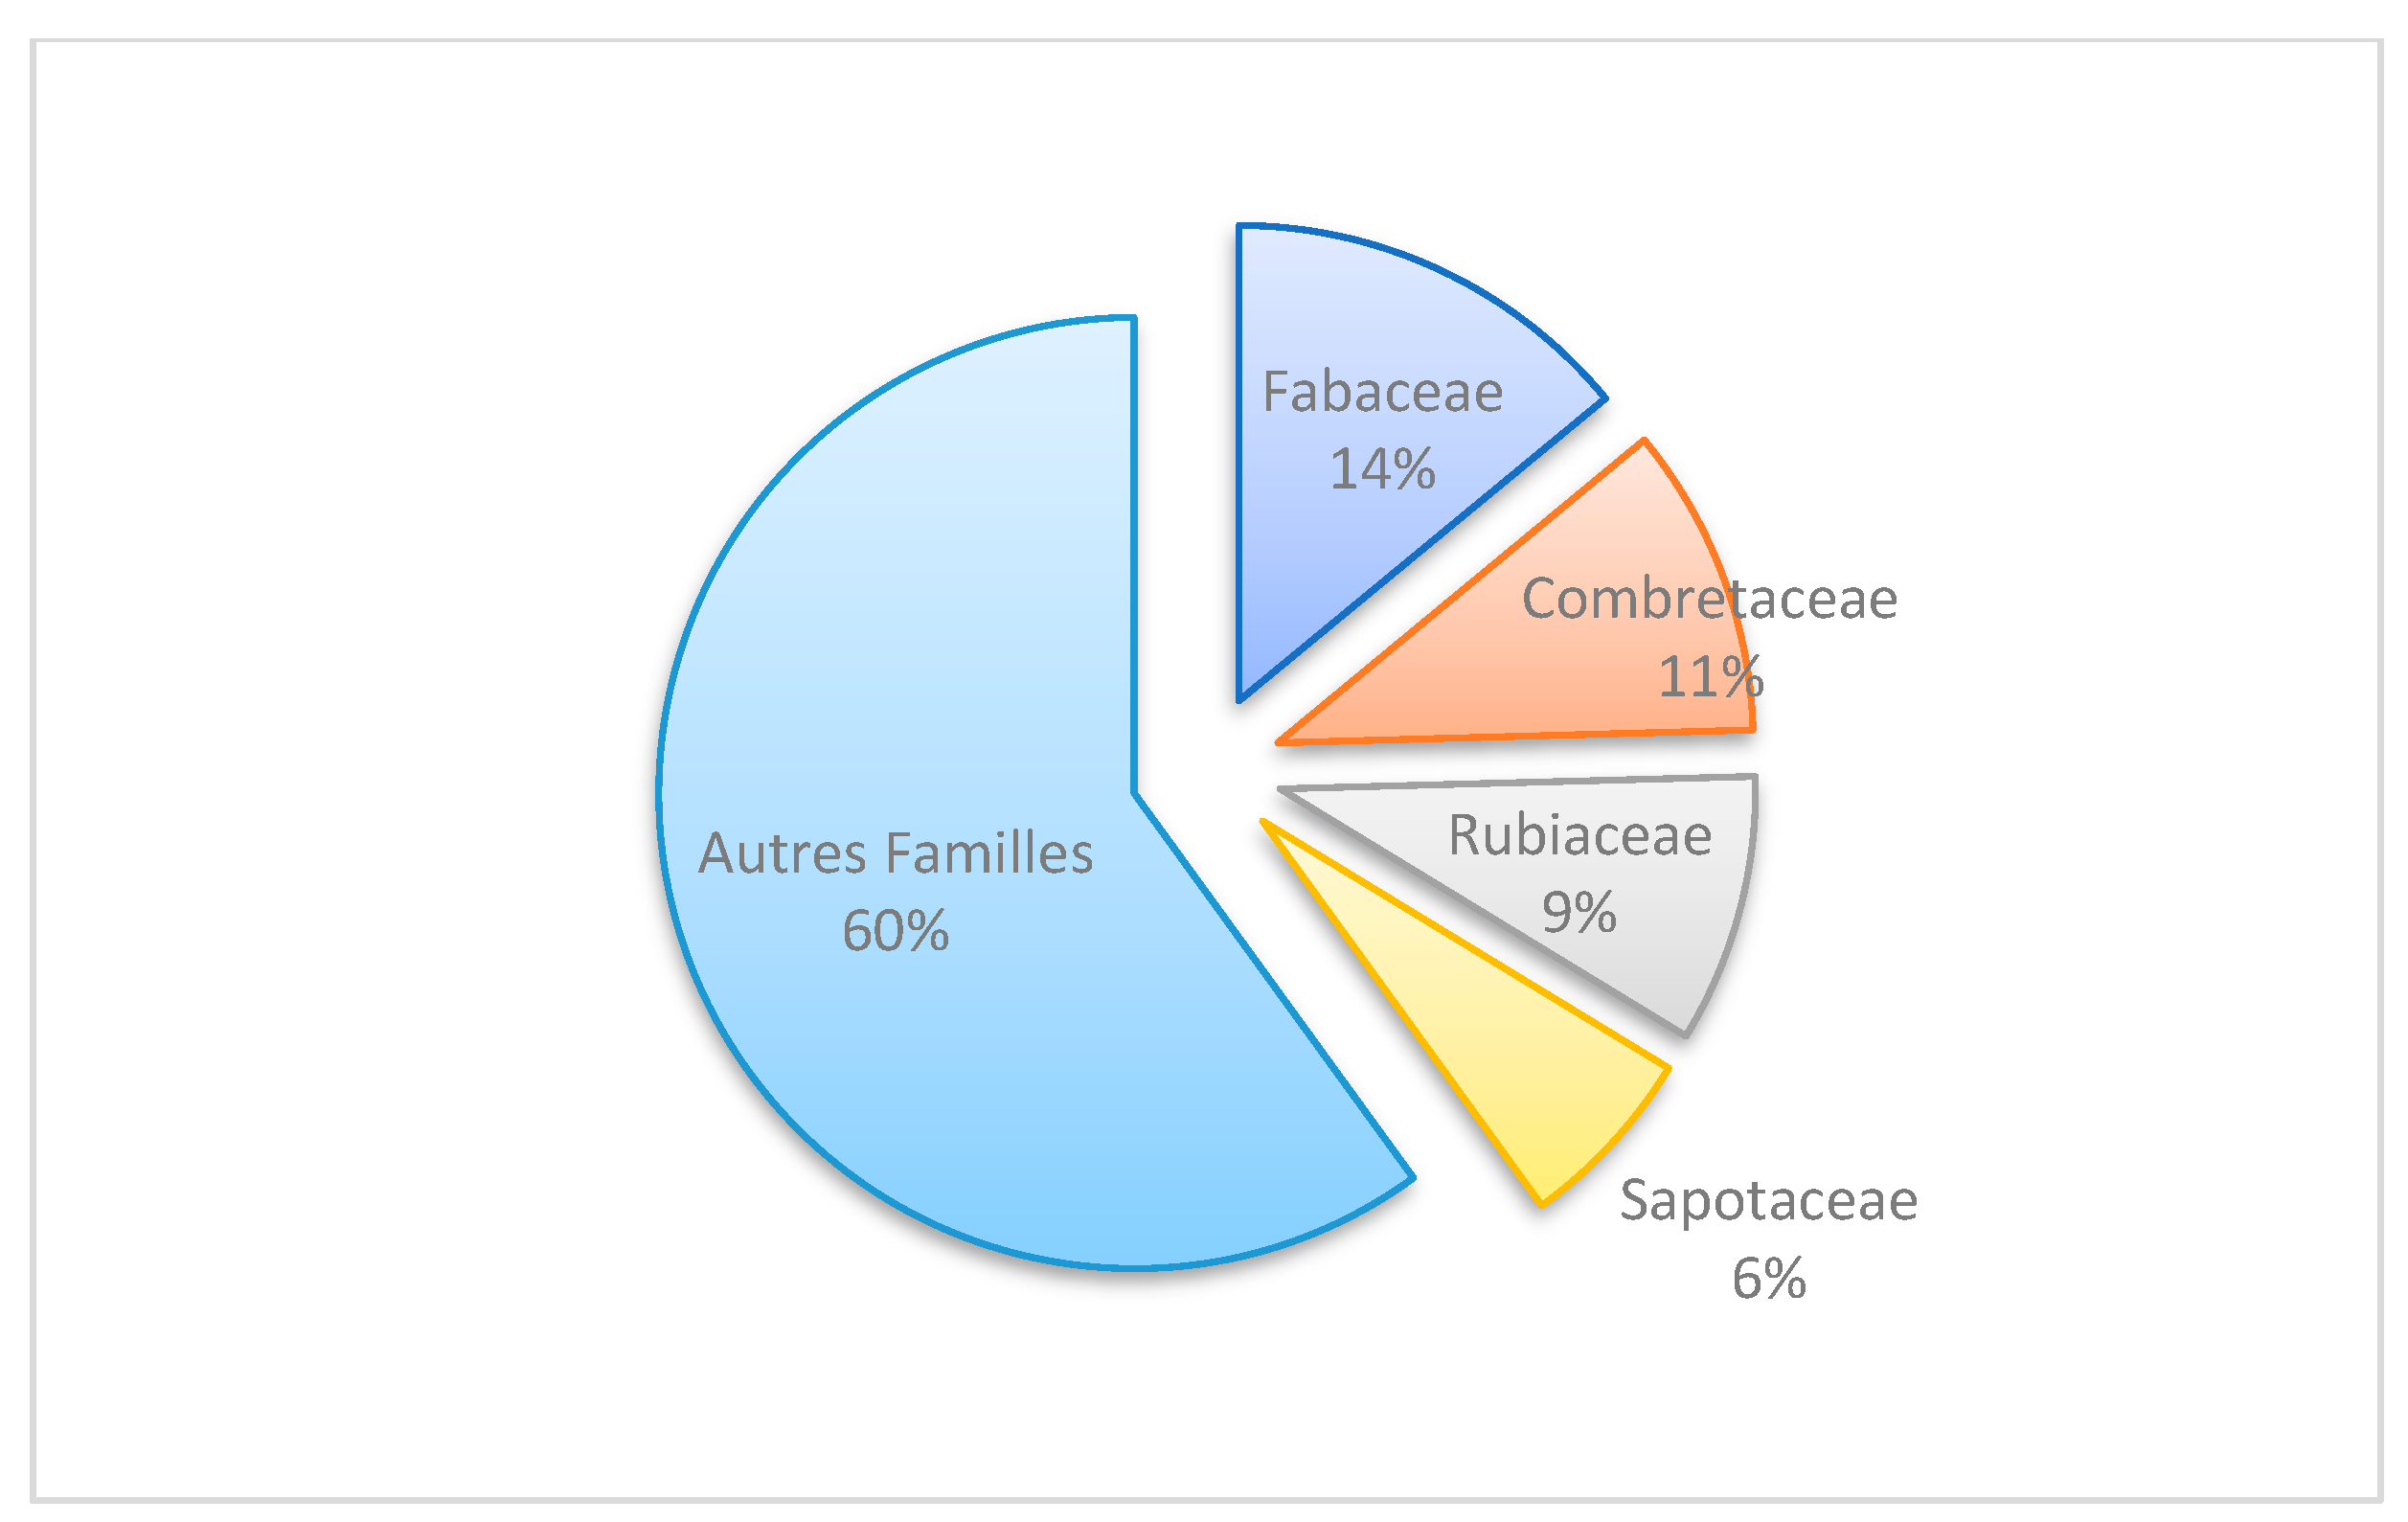
The flora consist of 163 species divided into 129 genera and 55 families. Fabaceae (14.02%), Combretaceae (10.55%), Rubiaceae (9.13%), Sapotaceae (6.30%), and other families (60%) all feature. (See Figure 5). Anogeissus leiocarpa (5.19%), Vitellaria paradoxa (4.72%), Daniella oliveri (3.15%), and Khaya senegalensis (3.15%) dominate the vegetation.

3.3. Plant Formation of ACF

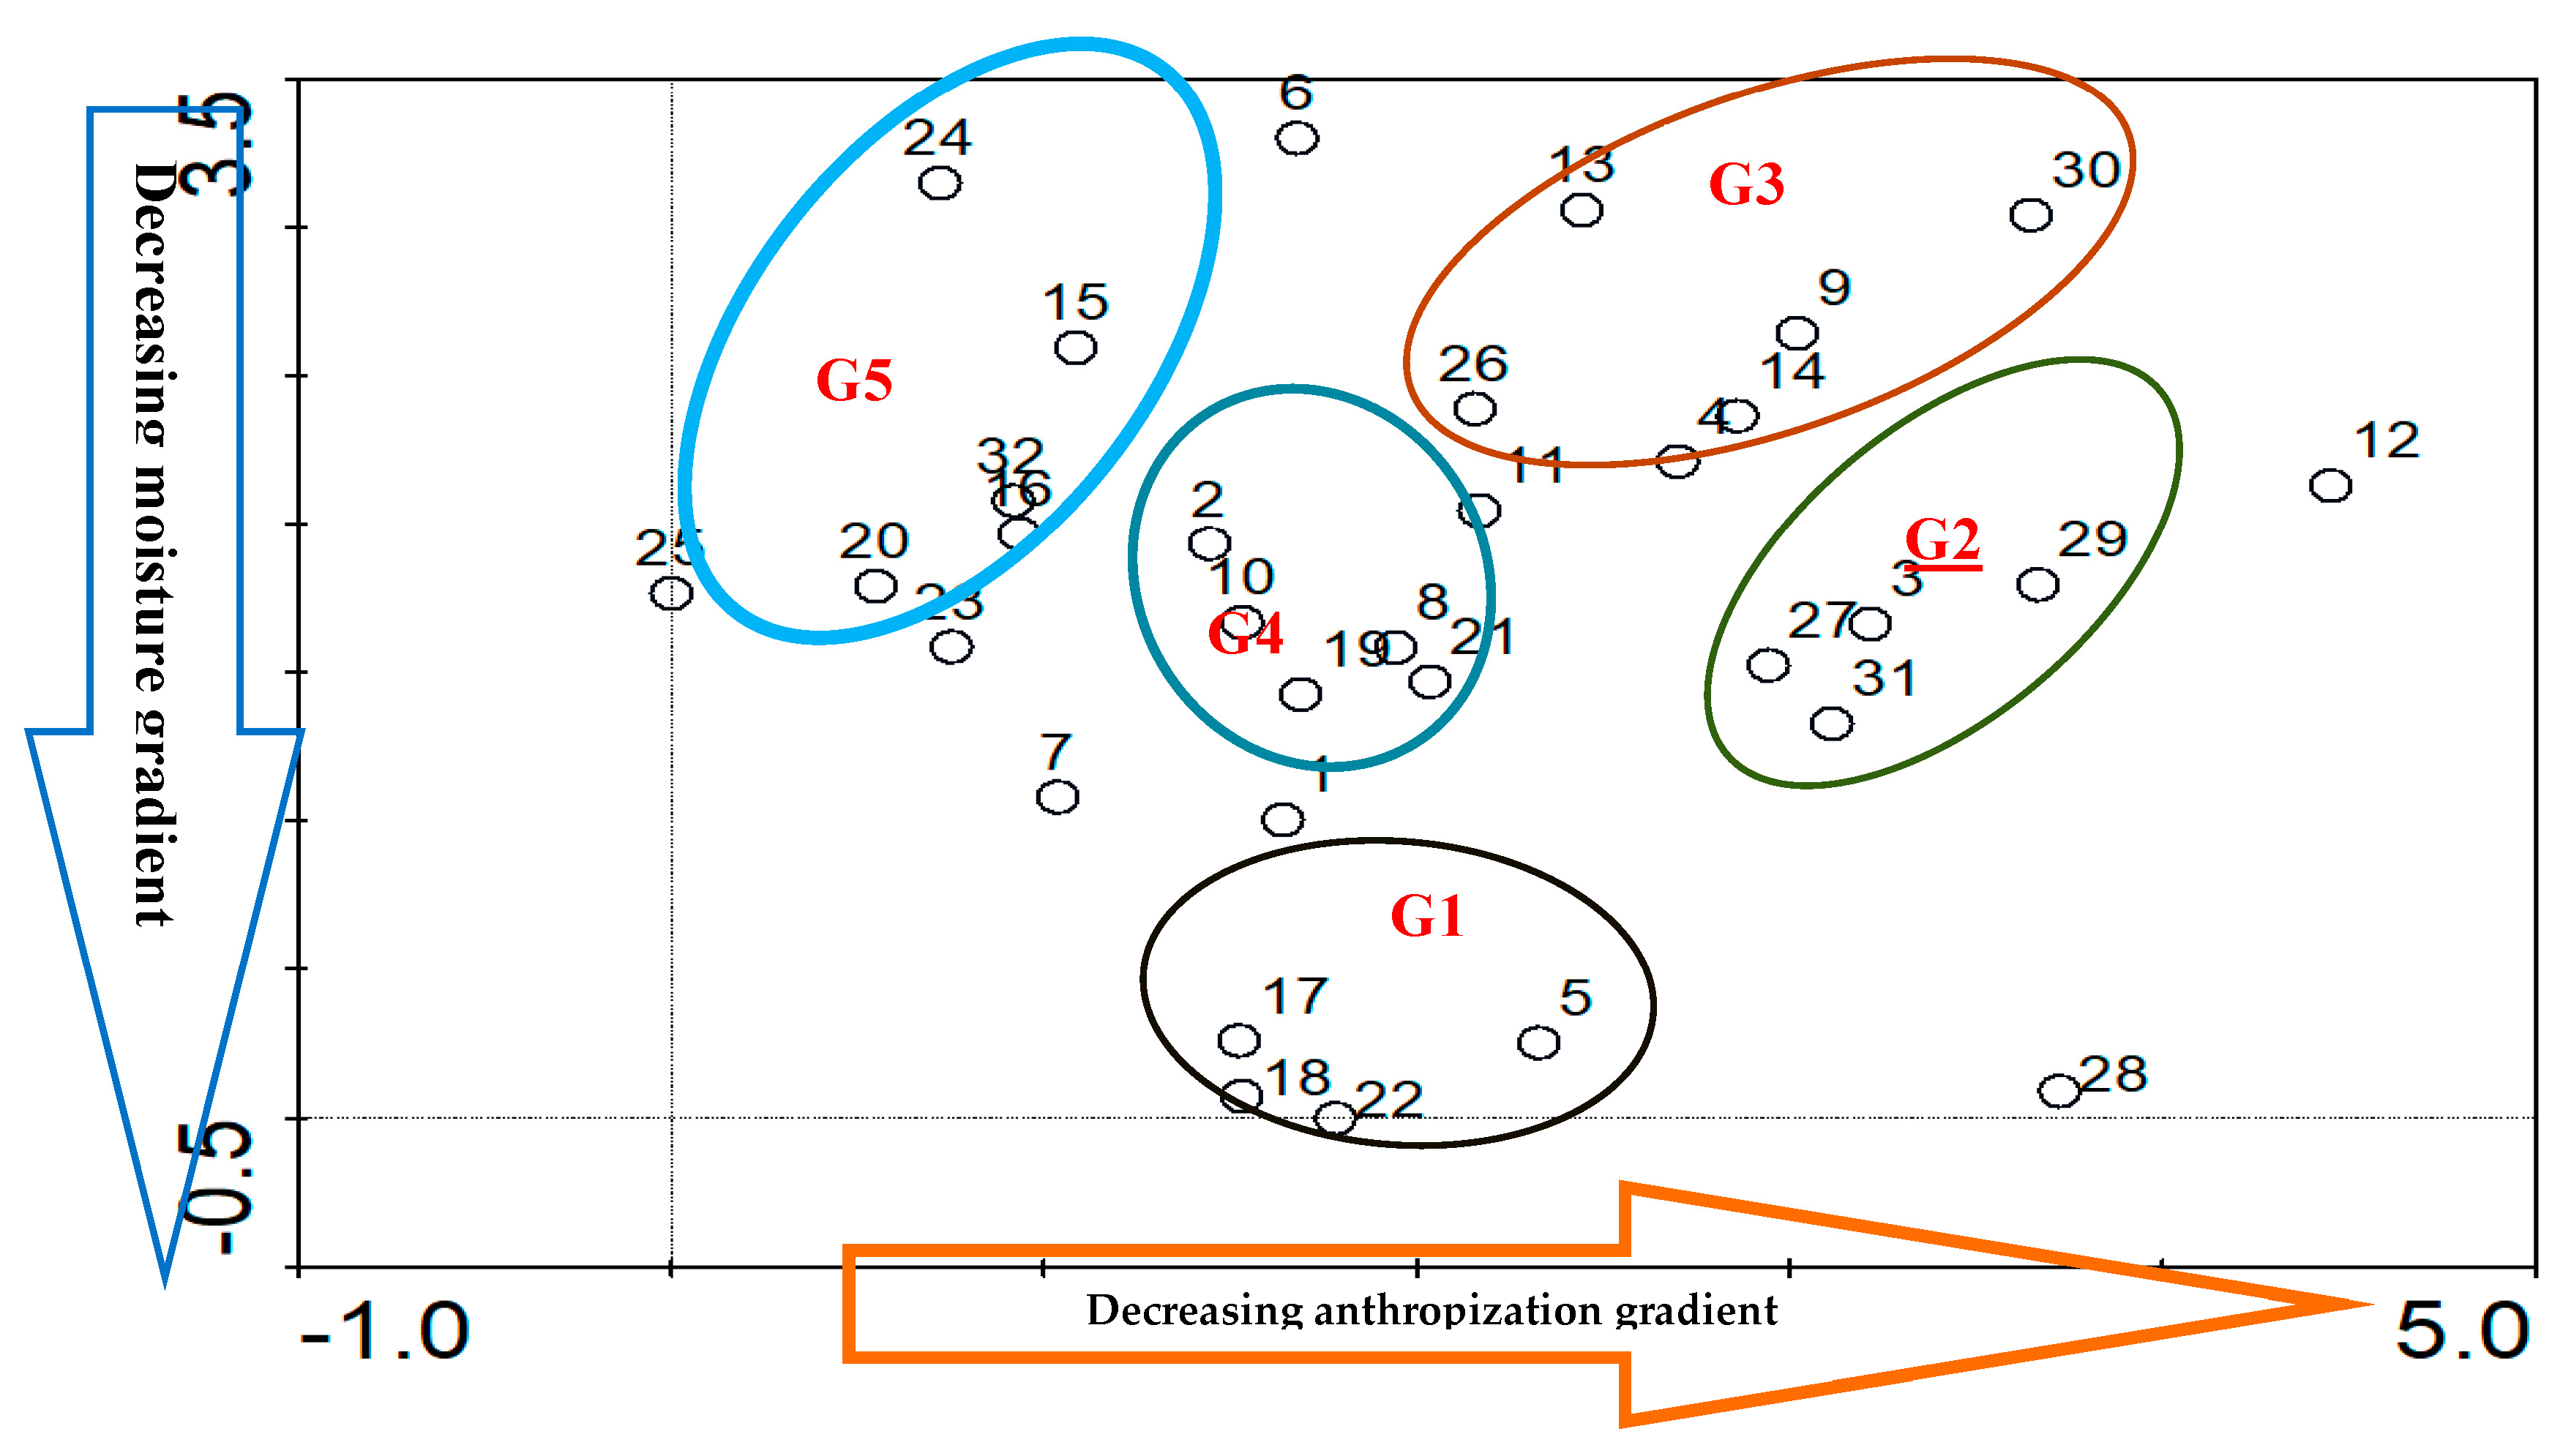
Hierarchical ascending classification was performed using CANOCO (Canonical Community Ordination) software, which allowed us to divide the 32 plots into five groups: tree/shrub savannahs (G1), dense dry forests (G2), agrosystems (crops/fallow) (G3), grassy savannahs/meadows (G4), and gallery forests (G5) (Figure 6).

3.3.1. Tree/Shrub Savannahs (G1)

Group G1 is composed of five plots with 56 species classified in 51 genera and 33 families. Anogeissus leiocarpa (6.76%), Albizia zygia (4.05%), Cola gigantea (4.05%), Diospyros mombouttensis (4.05%), and Khaya senegalensis (4.05%) are the most common species. Fabaceae (16.22%), Combretaceae (9.46%), Malvaceae (8.11%), and Meliaceae (5.41%) are the most represented families. This group has a plant density of 74 plants/ha. The average diameter is 22.5 ± 11.14 cm, the average height is 16.13 ± 4.28 m, and the bole height is 8.39 ± 3.32 m, while the basal area is 2.98 m2/ha (Table 4). The Shannon diversity index is 3.90, and the Piélou Equitability is 0.97, with a sandy clay soil type. Regarding regeneration, group G1 had a density of 78 plants/ha (Table 4), with 20 plants/ha of shoots, 54 plants/ha of seedlings, and 24 plants/ha of suckers.
The distribution of woody individuals by diameter class shows an “L” shape, with individuals in the 10–18 cm diameter class dominating (Figure 7A), implying that small-diameter individuals are dominant, which translates into the dominance of small-diameter individuals. On the other hand, the distribution of height classes indicates a “bell” structure. This structure is adjusted by the value of the Weibull shape coefficient, which is c = 2.135, reflecting a predominance of medium-height individuals (Figure 7B). Thus, the dominant individuals are between 7 and 17 m in height.

3.3.2. Dense Dry Forests (G2)

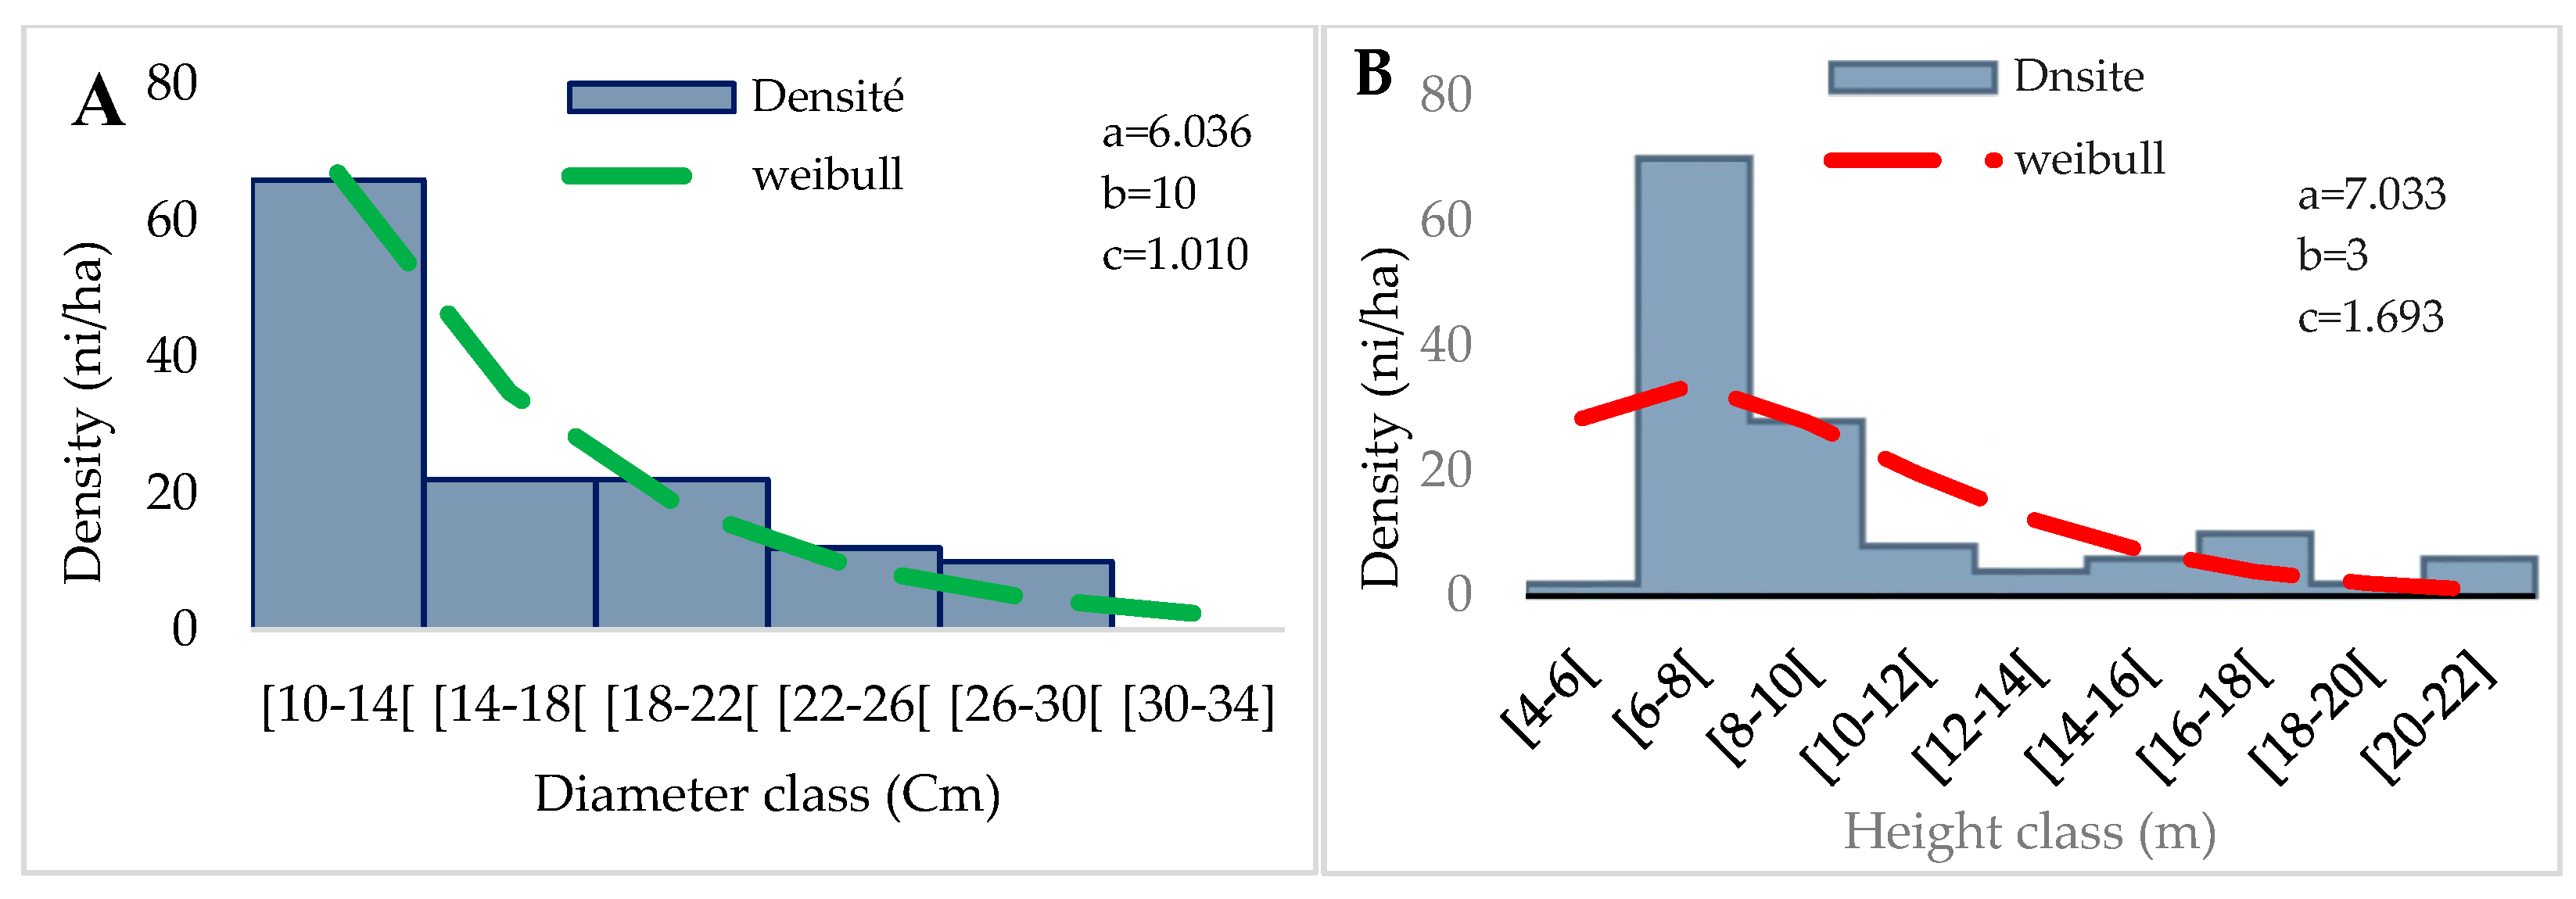
This group consists of five plots, with 64 species divided into 52 genera and 29 families. Vitellaria paradoxa (7.95%), Anogeissus leiocarpa (6.82%), Cola gigantea (2.27%), and Khaya senegalensis (2.27%) are the most common species. However, Combretaceae (14.77%), Fabaceae (14.77%), Sapotaceae (10.23%), Rubiaceae (9.09%), and Malvaceae (4.55%) are the most common families. This group has a density of 136 plants/ha. The average diameter is 17.2 ± 5.42 cm, the average height is 16.37 ± 4.11 m, and the bole height is 3.73 ± 2.35 m. The basal area is 1865 m2/ha. The Shannon diversity index is 3.63 bits, and the Piélou Equitability is 0.87, with a sandy clay soil type. Group G2 has a regeneration density of 64 feet/ha (Table 4) due to 26 feet/ha of seedlings, 20 feet/ha of suckers, and 18 feet/ha of shoots.
The distribution of woody individuals by diameter class shows an “L” structure centered on a 10–14 cm diameter class (Figure 8A), indicating the dominance of individuals with small diameters. A bell-shaped design represents the height classes. A predominance of low and medium-height individuals characterizes this distribution. The Weibull coefficient “c” ranges from 1 to 3.6. Thus, the dominant individuals are between 6–10 m. (Figure 8B).

3.3.3. Crops and Fallow Areas (Agrosystem) (G3)

The G3 group consists of seven plots, with 94 species listed in 79 genera and 36 families. The most represented species are Anogeissus leiocarpa (5,89%), Vitellaria paradoxa (4.89%), Daniella oliveri (4.35%), Crossopteryx febrifuga (2.18%) and Borassus aethiopum (1.63%). The most represented families are Fabaceae (14.13%), Combretaceae (13.04%), Rubiaceae (9.78%), and Moraceae (5.98%). This group has a density of 36 plants/ha. The average diameter is 13 ± 3.78 cm, the average total height is 12.35 ± 4.48 m, and the bole height is 3.51 ± 2.01 m. The basal area is 4.38 m2/ha. Shannon’s diversity index is 4.34, and Piélou’s Equitability is 0.96, with a clay–silt soil type. Regeneration is dominated by seedlings with a density of 23 feet/ha (Table 4), followed by suckers with 18 feet/ha, and shoots with 6 feet/ha.
The distribution of woody individuals by diameter class shows an “L” structure marked by a dominance of individuals in the 10–12 cm diameter class (Figure 9A), thus reflecting a dominance of small-diameter individuals. The representation of the height classes shows a bell-shaped structure. A predominance of low and medium-height individuals characterizes this distribution. The Weibull coefficient “c” ranges from 1 to 3.6. As a result, the dominating individuals range in height from 6 to 8 m (Figure 9B).

3.3.4. Grassy Savannahs and Meadows (G4)

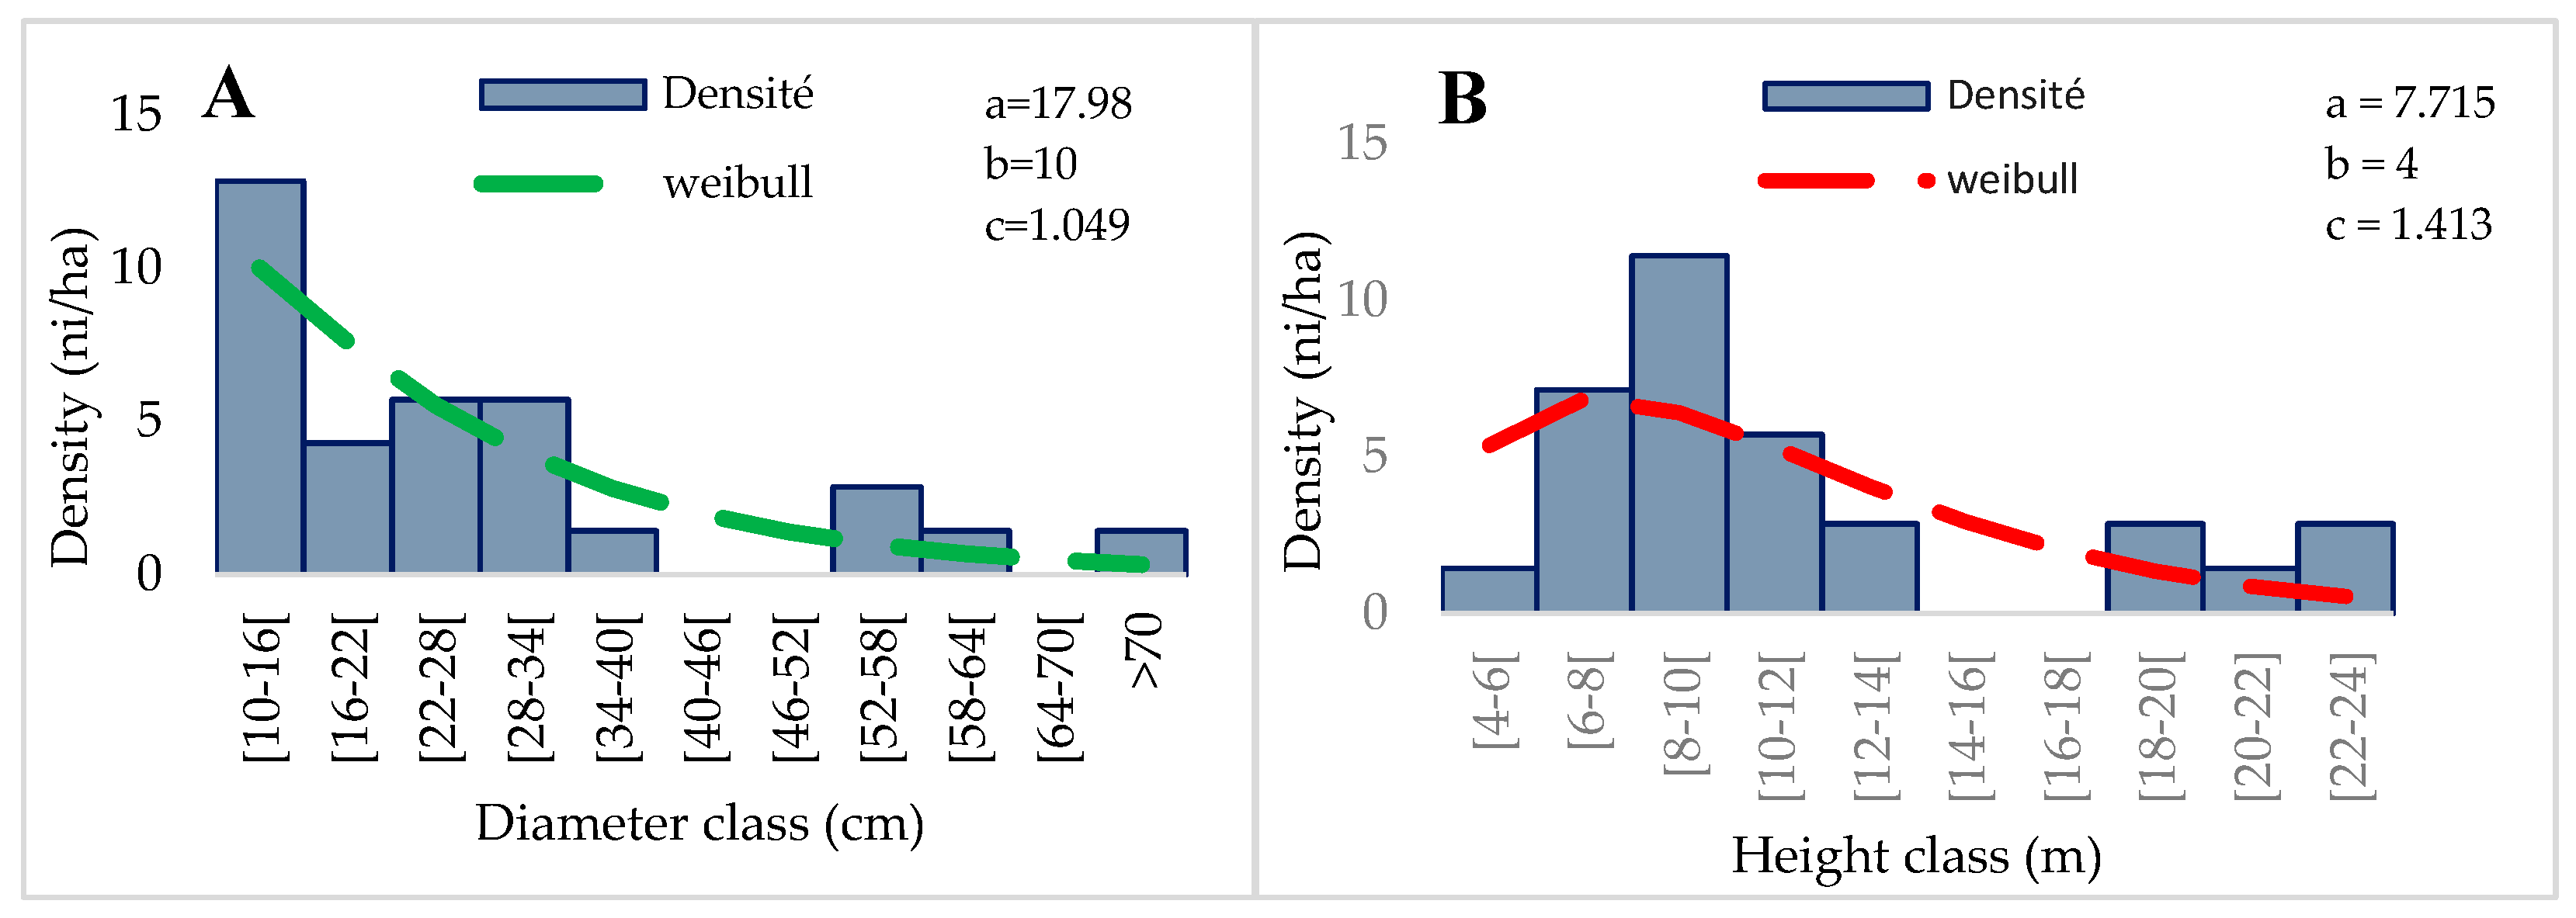
Group G4 is composed of seven records, in which 83 species are listed in 75 genera and 35 families. The most represented species are Anogeissus leiocarpa (4.11%), Vitellaria paradoxa (4.11%), Ficuse sur forssk (3.42%), Parkia biglobosa (3.42%), and Phoenix reclinata (2.74%). The most presented families are Fabaceae (12.33%), Combretaceae (10.96%), Rubiaceae (10.96%), and Asteraceae (6.85%). This group has a density of 36 plants/ha. The average diameter is 22.5 ± 17.18 cm, the average height is 9.62 ± 5.47 m, and the bole height is 5.16 ± 2.73 m. The basal area is 16.43 m2/ha (Table 4). Shannon’s diversity index is 4.04 bits, and Piélou’s Equitability is 0.92 with a sandy clay soil type. In terms of regeneration, group G4 has a density of 32 feet/ha due to 10 feet/ha of seedlings, 16 feet/ha of suckers, and 6 feet/ha of shoots.
The distribution of woody individuals by diameter class shows an “L” structure centered on a 10–16 cm diameter class (Figure 10A), thus representing the dominance of small-diameter individuals. The representation of height classes shows a bell-shaped structure. A predominance of low and medium-height individuals characterizes this distribution. The Weibull coefficient “c” ranges from 1 to 3.6. Thus, the dominant individuals are between 6–10 m. (Figure 10B).

3.3.5. Gallery Forests (G5)

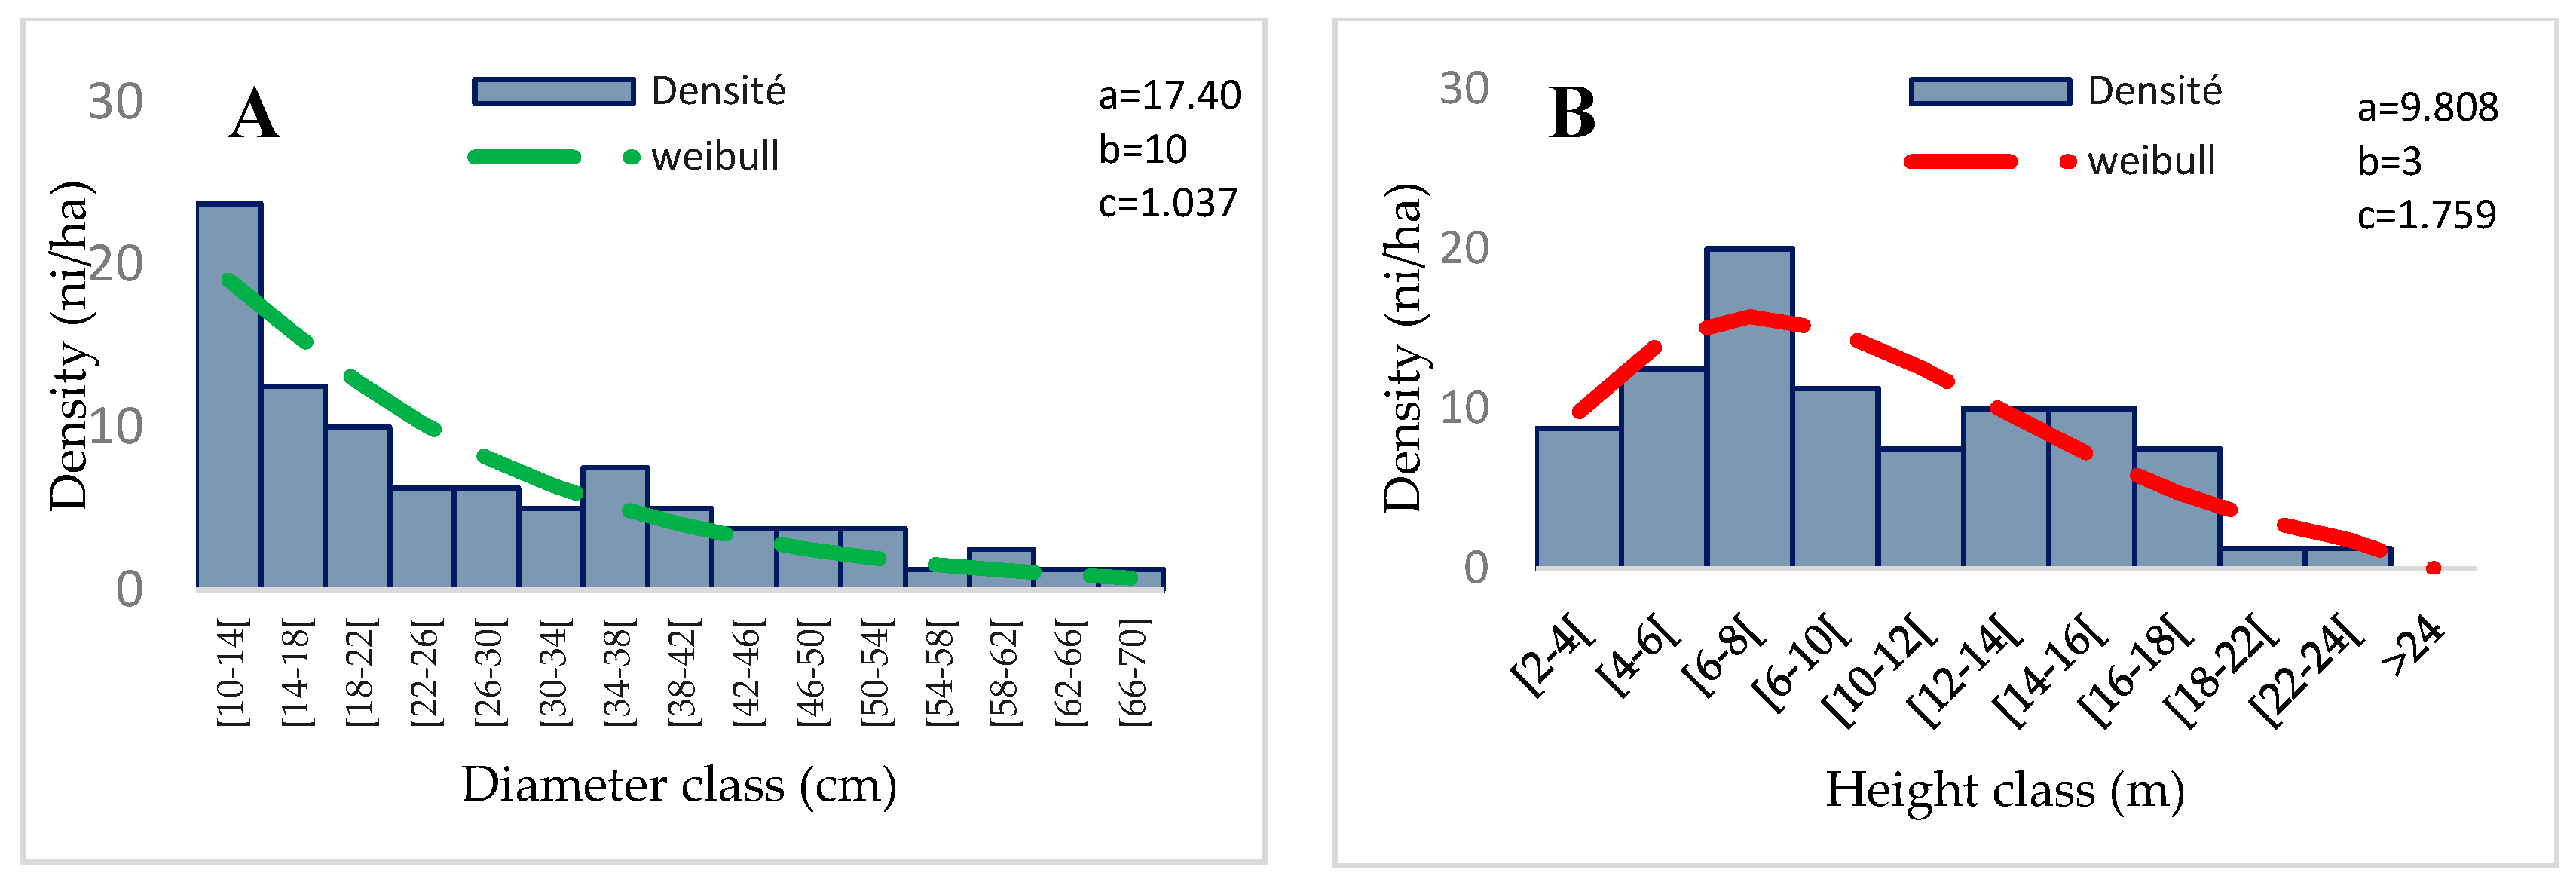
The G5 group is composed of eight plots, in which 81 species are listed in 67 genera and 36 families. The most represented species are Daniella oliverie (4.90%), Vitellaria paradoxa (4.90%), Anogeissus leiocarpa (3.50%), Chassalia kolly (2.80%), and Piliostigma thonningii (1.40). The families most presented are Fabaceae (14.69%), Combretaceae (9.10%), Rubiaceae (9.10%), and Sapotaceae (5.60%). This group has a density of 94 plants/ha (Table 4). The average diameter is 30 ± 15.30 cm, the average height is 14.84 ± 5.16 m, and the bole height is 6.01 ± 3.63 m. The basal area is 71.23 m2/ha. Shannon’s diversity index is 3.97 bits, and Piélou’s Equitability is 0.90 with a sandy and silty soil type. In terms of regeneration, group G5 has a density of 78 feet/ha due to 35 feet/ha of seedlings, 25 feet/ha of suckers, and 18 feet/ha of shoots.
The distribution of woody individuals by diameter class shows an “L” structure centered on a 10–14 cm diameter class (Figure 11A), thus representing the dominance of small-diameter individuals. The representation of height classes shows a bell-shaped structure. A predominance of low and medium-height individuals characterizes this distribution. Weibuul’s coefficient “c” is between 1 ≤ c ≤ 3.6. Thus, the dominant individuals are between 4–8 m (Figure 11).

3.4. Regeneration

The AFC has a regeneration potential of is 64 ft/ha due to 21 ft/ha of suckers, 29 ft/ha of seedlings, and 14 ft/ha of sprouts. Pavetta capensis (13.85%), Anogeissus leiocarpa (12.31%), Khaya senegalensis (10.76%), Vitellaria paradoxa (9.23%), and Daneilla oliveri (7.69%) have the highest regeneration density for suckers. For seedlings, there are Anogeissus leiocarpa s (19.57%), Lonchocarpus seruceus (6.52%), Acacia polyacantha (5.43%), Daniella oliveri (5.43%), Piliostigma thoningii (4.43%), and the rejects are Anogeissus leiocarpa (20.93) Lonchocarpus seruceus (13.95%), Khaya senegalensis (11.62%), Daneilla oliveri (4.65%) and Vitellaria paradoxa (4.65%).

3.5. Proposition of the Zoning Plan

The AFC is an area in which many actors carry out several activities. This can be a source of mismanagement due to the open access status of the resources. Participatory management is necessary to preserve the interests of the various actors and to allow the forest to play its role. It is therefore necessary to fragment the space, i.e., to subdivide it into zones according to the nature of the activities and/or interventions to be carried out therein. AFC management must meet three objectives: (1) to conserve ecological functions and biological diversity; (2) to contribute to the sustainable supply of agro-sylvo-pastoral products for the AFC’s residents; and (3) to ensure the protection and conservation of natural resources. The overall objective is to contribute to the development of community forestry by providing products and services to meet the needs and expectations of the population and the authorities in terms of social, economic, and environmental wellbeing.
Division into series and the management plan of ACF
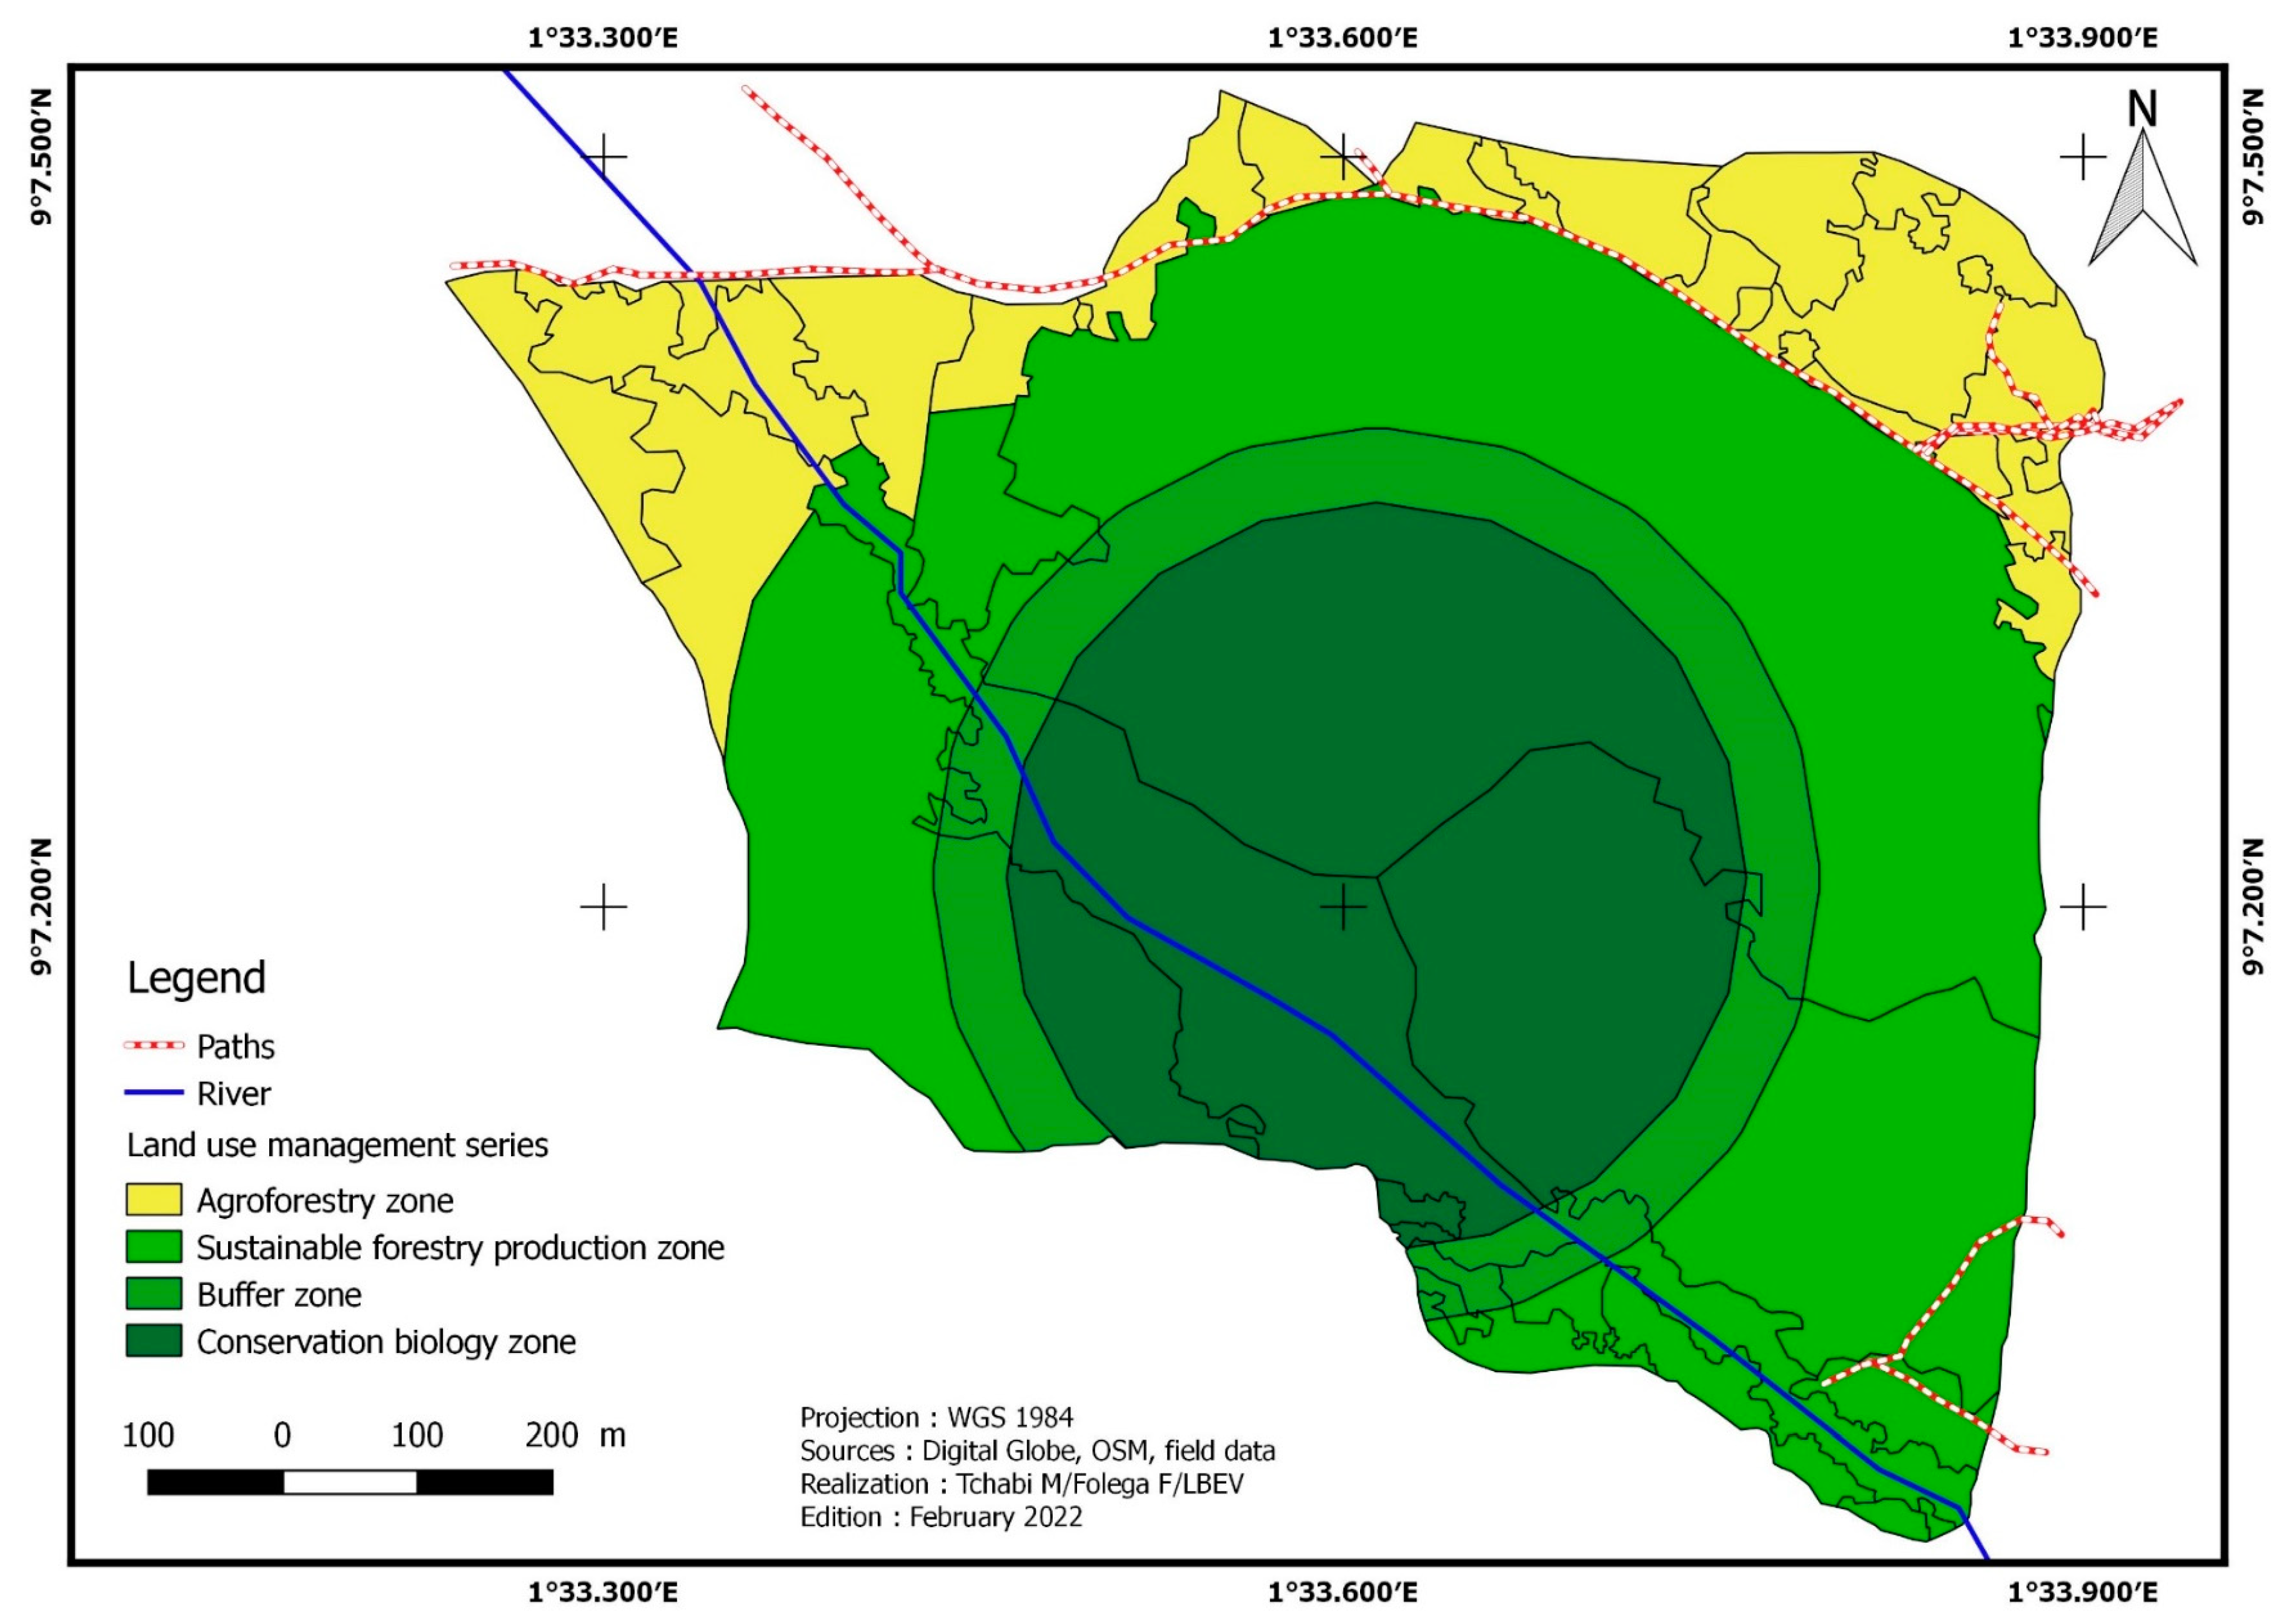
A series, by definition, is a unit of objective and treatment (Table 5). As a result, it clusters together areas and portions that will receive the same treatment. The AFC is divided into four series (Figure 12) to meet the management plan’s objectives.
  • The agroforestry series (series 1)
The agroforestry series consists of crops, fallow land, and pasture. The series covers 15.45 ha or 18.80% of the total area of the AFC (Table 5). It is primarily made up of initially forested regions that have been destroyed and cultivated in the past. Agro-sylvo-pastoral activities will be carried out, that is, an association of perennial crops with forest plants and animals (pastures). Reforestation activities will be carried out with agroforestry species such as Samanea samane, Senna siamea, and Albizia lebbeck.
  • The forest series of sustainable production (series 2)
The forest zone accounts for 42.22% of the total area of the forest, or 34.70 ha. The riparian communities will be authorized to collect non-wood products and some stems in a customary and non-destructive manner. This should allow for controlled harvesting, the preservation of the area, and the conservation of biological diversity. The absence of penetration road building and industrial exploitation are assets in achieving these objectives. The tagging of the trees will be compulsory for felling, thus allowing more precise and more reasonable forest utilization. The production of timber and the reconstitution of floristic diversity justify the implementation of this series. Full plantations are reserved for young and very degraded fallows. The main species used are Anogeissus leiocarpa, Khaya spp, Daneilla, and Terminalia spp. Other methods adapted to the state of the stands can be used, such as enrichment in layers (with Terminalia spp, Afzelia spp, Pterocarpus, and Khaya spp), and planting in densely spaced plots, as they allow the conservation of significant biodiversity by maintaining the inter-band floristic composition. To ensure the success of these enhancements, maintenance must be carried out over time, which entails significant recurrent costs. Planting under cover might also contribute to the diversification of this composition.
  • The buffer series (series 3)
The buffer zone is an area that separates the sustainable production zone from the biological conservation zone. It covers an area of 9.03 ha or 11% of the total area of the AFC. Some human activities are allowed in this area, and we try to limit their impacts.
  • The biological conservation series (series 4)
This series represents 23.01 ha or 28% of the total area of the AFC. The value of this series in terms of biological diversity justifies its conservation in its current state, and it covers areas sensitive to significant erosion processes. Industrial operators are excluded from any logging activity in this area. They serve as a vital part of the ecological reservoir’s protection zone; hence, entry is restricted.

4. Discussion

The spatiotemporal dynamics of the AFC’s vegetation were assessed, and five major land-use units were identified: dense dry forest, crops and fallow, gallery forest, shrub/shrub savannah, and grassland savannah/meadows. Plantations were only observed in 2015 due to protection measures initiated by the village community. The study of [60] identified the same number of land use units using national and international classification systems. An anthropization of vegetation formations has been observed over the years. These phenomena are mainly due to human action, as reported by [61,62] in a study on village green belts in the prefecture of Avé in Togo. Several studies have confirmed the socio-economic dependence of riparian populations on forest massifs [63,64,65,66]. The steady diminution of farmed lands is beginning to bear fruit as a result of riparian people’s awareness of the need for plant resource protection and sustainable management. Crops/fallow areas have regressed considerably, losing 14.66% of their surface area between 2018 and 2021. However, savannah formations have increased, with increases of 27.63% and 9.73% for grassland savannahs/meadows and tree/shrub savannahs, respectively. These findings contradict those of [67] in a study on changes in vegetation cover in the watershed of Zio in southwestern Togo, using remote sensing, wherein regression of grassy savannahs was recorded due to the profiles of crops/fallow areas and built-up areas/bare ground. This is mainly due to the extension of the habitat in the Zio watershed, which is primarily linked to population growth and peri-urbanization [67]. In the context of the declining and unevenly distributed rainfall recorded in recent years, [68,69], the watershed is also suitable for agricultural activities. On the other hand, the increase in ruminant livestock in the central region, which has resulted in an increasing need for grazing lands, could explain the observed regression of cultivated areas in favor of savanna formations in the AFC, [70] notes the same decrease in cultivated areas in northern Senegal.
The AFC’s floristic analysis reveals significant potential for woody and non-woody species. There are 163 species, which are classified 129 genera and 55 families. This diversity is more significant than that found by [71] in the Abdoulaye reserve and by [72] in the Kaodji community forest in Benin, with 69 and 83 woody species, respectively. The variance is attributed not only to differences in the sample methodology and sampling region, but also to anthropogenic forces that cause the degradation of various formations. The species richness varies from one group to another. It is more important in the crops and fallow lands (94 species), and low in the tree/shrub savannahs (56 species). These results are consistent with those of [72], where the lowest diversity is observed in the savannas. The five identified groups all have an L-shaped distribution of diameter classes. From an ecological point of view, the AFC would have all the assets for its reconstitution of the high density of juvenile individuals, according to the conclusions of [7,12], in a study within the community forest of Edouwossi-Copé in southern Togo. It is within this dynamic that this forest benefits from a program of restoration of forest landscapes and good governance, initiated by the GIZ, itself within the framework of the “Forest For Future” mechanism for forests and farmers (F4F), which aims to contribute to the fight against climate change through the restoration and management of forests. The non-negligible regeneration rate (64 feet/ha) is much lower than the 1713 feet/ha regeneration rate of the Agbandi community forest in central Togo [73]. This large discrepancy could be explained by the dominance of open forests in the Agbandi community forest.
The need to reconcile sustainable production, enhanced community revenues, and excellent ecosystem services lends validity to the AFC zoning plan [74]. The zoning of forest domains has often been considered a way of capitalizing on the results of diagnoses of the state of resources encountered in forests. In addition to being forward-thinking, these plans would be part of programmatic processes for formalizing community forests. Optimal use of this study’s findings may lead to preliminary steps toward orienting future AFC actions toward a sustainable management mechanism consistent with similar activities undertaken in the region.

5. Conclusions

The study of the spatiotemporal dynamics of land use in the AFC revealed a regressive trend in formations. The floristic inventory allowed a list of 163 species divided into 129 genera and 55 families. Fabaceae, Combretaceae, Rubiaceae, and Sapotaceae are the most represented families. Anogeissus leiocarpa, Vitellaria paradoxa, Daniella oliveri, and Khaya senegalensis are the most represented species. The predominance of young individuals is noted in all formations of the community forest. The regeneration density of the AFC is 64 feet/ha due to 21 feet/ha of suckers, 29 feet/ha of seedlings, and 14 feet/ha of shoots. Considering these results, it is important to strengthen management measures to conserve the biodiversity of the ACF. The zoning of forest domains has often been considered the result of a process of capitalizing on the results of the diagnoses of the state of forest conservation.

Author Contributions

F.F. has conceptualized, analyzed data and wrote the first draft, B.B., T.M., M.K., A.W., I.A., D.O., W.K., B.K. and A.K. contributed to the manuscript editing. All authors have read and agreed to the published version of the manuscript.

Funding

This study was financed by the Forest Farms Facility (FFF) of FAO (Togo).

Data Availability Statement

Data are available upon request.

Acknowledgments

The Authors thank the Forest Farms Facility (FFF) of FAO and the Laboratory of Botany and Plant Ecology (LBEV) of the University of Lomé (Togo) for their unconditional support.

Conflicts of Interest

The authors declare no conflict of interest.

References

  1. Akognongbe, A.; Abdoulaye, D.; Vissin, E.W.; Boko, M. Dynamique de l’occupation du sol dans le bassin versant de l’Oueme à l’exutoire de Bétérou (Bénin). Afr. Sci. 2014, 10, 228–242. [Google Scholar]
  2. Hlovor, A.K.D.; Adjonou, K.; Dangbo, F.A.; Abotsi, K.E.; Afelu, B.; Kokou, K. Dynamique du couvert forestier dans la partie méridionale des monts Togo, Afrique de l’ouest. Rev. Ivoir. Sci. Technol. 2021, 37, 300–313. [Google Scholar]
  3. Sama, A.; Ramdé, Z.; Ouédraogo, P.C.; Sikuzani, Y.U.; Salomon, W.; Dipama, J.-M.; Bogaert, J. Pression anthropique et dynamique de l’occupation du sol Autour du Corridor n 1 du Complexe éCologique Pô-Nazinga-Sissili au Burkina Faso. Tropicultura 2023. Available online: https://popups.uliege.be/2295-8010/index.php?id=2200 (accessed on 30 May 2023).
  4. Dourma, M.; Batawila, K.; Wala, K.; Kokou, K.; Guelly, K.A.; Bellefontaine, R.; de Foucault, B. Régénération naturelle des peu-plements à Isoberlinia spp. en zone soudanienne au Togo. Acta Bot. Gall. 2009, 156, 415–425. [Google Scholar] [CrossRef] [Green Version]
  5. FAO. La Situation des Forêts du Monde. Les forêts au Service du Développement Durable. Licence: CC BY-NC-SA 3.0 IGO. Rome/Italie 2018, 158p. Available online: https://www.fao.org/documents/card/fr/c/I9535FR/ (accessed on 30 May 2023).
  6. Bergonzini, J.-C. Changements Climatiques, Désertification, Diversité Biologique, et Forêts; SILVA: Nogent-sur-Marne, France, 2004. [Google Scholar]
  7. Folega, F.; Atakpama, W.; Pereki, H.; Djiwa, O.; Dourma, M.; Kombate, B.; Abreni, K.; Wala, K.; Akpagana, K. Potentialites ecologiques et socio-economiques de la foret communautaire d’agbedougbe (region des Plateaux-Togo). J. Rech. Sci. L’université Lomé 2017, 19, 31–49. [Google Scholar]
  8. Badjare, B.; Woegan, Y.A.; Folega, F.; Atakpama, W.; Wala, K.; Akpagana, K. Vulnérabilité des ressources ligneuses en lien avec les différentes formes d’usages au Togo: Cas du paysage des aires protégées Doungh-fosse aux lions (Région des Savanes). Rev. Agrobiol. 2021, 11, 2552–2565. [Google Scholar]
  9. Lykke, A.M. Local perceptions of vegetation change and priorities for conservation of woody-savanna vegetation in Senegal. J. Environ. Manag. 2000, 59, 107–120. [Google Scholar] [CrossRef]
  10. Tente, B.; Sinsin, B. Diversité et structure des formations arborescentes du secteur Perma-Toucountouna dans la chaîne de l’Atacora (Bénin). Études Flore Végétation Burkina Faso 2002, 6, 31–42. [Google Scholar]
  11. UICN/PACO. Evaluation de L’efficacité de la Gestion des Aires Protégées: Aires Protégées du Togo. 2008. Available online: https://papaco.org/fr/wp-content/uploads/2015/07/RAPPAM-TOGO.pdf (accessed on 15 January 2021).
  12. Folega, F.; Pereki, H.; Woegan, A.Y.; Dourma, M.; Atakpama, W.; Maza, M.S.; Akpagana, K. Caractérisation écologique de la Forêt Communautaire d’Edouwossi-Cope (Région des Plateaux-Togo). J. Rech. Sci. Univ. Lomé 2017, 19, 47–61. [Google Scholar]
  13. Grégoire, J.-M.; Simonetti, D. Interannual changes of fire activity in the protected areas of the SUN network and other parks and reserves of the West and Central Africa region derived from MODIS observations. Remote Sens. 2010, 2, 446–463. [Google Scholar] [CrossRef] [Green Version]
  14. Hien, P.; Bac, V.; Tham, H.; Nhan, D.; Vinh, L. Influence of meteorological conditions on PM2.5 and PM2.5−10 concentrations during the monsoon season in Hanoi, Vietnam. Atmos. Environ. 2002, 36, 3473–3484. [Google Scholar] [CrossRef]
  15. Nguinguiri, J.-C. Les Approches Participatives Dans la Gestion des Ecosystemes Forestiers D’afrique Centrale; Revue des Initiatives Existantes; CIFOR: Bogor, Indonesia, 1999; Volume 23. [Google Scholar]
  16. Morou, B.; Lawali, S.; Oumani, A.A.; Ounani, H.; Guero, C.; Mahamane, A. Ressources forestières ligneuses: Diversité et usages dans le terroir villageois de Dan Saga. Afr. Sci. 2016, 12, 228–239. [Google Scholar]
  17. Koumoi, Z.; Alassane, A.; Djangbedja, M.; Boukpessi, T.; Kouya, A.-E. Dynamique spatio-temporelle de l’occupation du sol dans le Centre-Togo. AHOHO-Rev. Géographie Du Lardymes 2013, 7, 163–172. [Google Scholar]
  18. Kaina, A.; Dourma, M.; Folega, F.; Diwediga, B.; Kpérkouma, W.; Akpagana, K. Localisation des bassins de production de bois énergie et typologie des acteurs de la filière dans la région centrale du Togo. Rev. Ivoir. Sci. Technol. 2021, 37, 196–211. [Google Scholar]
  19. Ern, H. Die Vegetation Togos. In Gliederung, Gefährdung, Erhaltung Willdenowia; Botanischer Garten und Botanisches Museum: Berlin, Germany, 1979; pp. 295–312. [Google Scholar]
  20. Koumoi, Z.; Boukpessi, T.; Kpedenou, K.D. Principaux facteurs explicatifs de la dynamique de l’occupation du sol dans le Centre-Togo: Apport des SIG et des statistiques spatiales. Rev. Ivoir. Géographie Des Savanes 2017, 3, 252–273. [Google Scholar]
  21. Banito, A.; Kpemoua, E.K.; Dayiwo, R.K.; Tedihou, E.; Sikirou, R. Inventaire des maladies de l’anacardier (Anacardium occi-dentale L.) dans la préfecture de Tchamba au Togo International. J. Biol. Chem. Sci. 2021, 15, 2514–2525. [Google Scholar]
  22. METEO-TOGO. Données de la Météo, Région Centrale. 2020. Available online: https://wwwmeteocitycom (accessed on 20 February 2020).
  23. Adougnon, K. Togo: Le recensement général de la population du Togo. In Les Recensements Africains: 1ère Partie: Monographies Méthodologiques; GDA: Paris, France, 1970. [Google Scholar]
  24. Roudié, P. Aspects du développement récent de l’économie togolaise. Les Cah. D’outre-Mer 1978, 31, 359–374. [Google Scholar] [CrossRef]
  25. Kolarić, S.; Shelden, D. Toward an open IoT implementation for urban environments: The architecture of the DBL SmartCity platform. In Smart Cities and Smart Governance: Towards the 22nd Century Sustainable City; Springer: Cham, Switzerland, 2021; pp. 345–372. [Google Scholar] [CrossRef]
  26. Rand, J.T.; Kramer, L.A.; Garrity, C.P.; Hoen, B.D.; Diffendorfer, J.E.; Hunt, H.E.; Spears, M.A. continuously updated, geospatially rectified database of utility-scale wind turbines in the United States. Sci. Data 2020, 7, 15. [Google Scholar] [CrossRef] [Green Version]
  27. Blaschke, T.; Burnett, C.; Pekkarinen, A. Image segmentation methods for object-based analysis and classification. In Remote Sensing Image Analysis: Including the Spatial Domain; Springer: Dordrecht, The Netherlands, 2004; pp. 211–236. [Google Scholar] [CrossRef]
  28. Parivallal, R.; Nagarajan, B. Supervised Classification Methods For Object Identification Using Google Map Image. Int. J. Eng. Sci. Manag. Res. 2014, 1, 71. [Google Scholar]
  29. Di Gregorio, A. Land Cover Classification System: Classification Concepts and User Manual: LCCS; Food and Agriculture Organization: Rome, Italy, 2005; Volume 2. [Google Scholar]
  30. Li, X.; Shen, H.; Li, H.; Zhang, L. Patch matching-based multitemporal group sparse representation for the missing information reconstruction of remote-sensing images. IEEE J. Sel. Top. Appl. Earth Obs. Remote Sens. 2016, 9, 3629–3641. [Google Scholar] [CrossRef]
  31. Schmitt, M.; Zhu, X.X. Data fusion and remote sensing: An ever-growing relationship. IEEE Geosci. Remote Sens. Mag. 2016, 4, 6–23. [Google Scholar] [CrossRef]
  32. Stefanov, W.L.; Ramsey, M.S.; Christensen, P.R. Monitoring urban land cover change: An expert system approach to land cover classification of semiarid to arid urban centers. Remote Sens. Environ. 2001, 77, 173–185. [Google Scholar] [CrossRef]
  33. Yang, L.; Xian, G.; Klaver, J.M.; Deal, B. Urban land-cover change detection through sub-pixel imperviousness mapping using remotely sensed data. Photogramm. Eng. Remote Sens. 2003, 69, 1003–1010. [Google Scholar] [CrossRef]
  34. Ahlqvist, O. Extending post-classification change detection using semantic similarity metrics to overcome class heterogeneity: A study of 1992 and 2001 US National Land Cover Database changes. Remote Sens. Environ. 2008, 112, 1226–1241. [Google Scholar] [CrossRef]
  35. Arouna, O.; Etene, C.G.; Issiako, D. Dynamique de l’occupation des terres et état de la flore et de la végétation dans le bassin supérieur de l’Alibori au Benin. J. Appl. Biosci. 2016, 108, 10543–10552. [Google Scholar] [CrossRef] [Green Version]
  36. Akim, F.A.; Yao, W.A.; Kperkouma, W.; Koffi, A. Dynamique des émissions de gaz à effet de serre liées au secteur foresterie et autres affectations des terres (FAT) dans le paysage du socle Eburnéen au Togo Dynamics of greenhouse gas emissions linked to the forestry sector and other land uses. AFOL. Rev. Ecosystèmes Paysages 2021, 1, 58–72. [Google Scholar]
  37. Aboubacar, K.; Douma, S.; Mamoudou, B.M.; Seyni, R.S.D. Structure des populations naturelles de Neocarya macrophylla (Sabine) Prance, ligneux d’intérêt alimentaire, dans le Dallol Bosso, Niger. Bois For. Trop. 2018, 337, 67–78. [Google Scholar] [CrossRef] [Green Version]
  38. Ouedraogo, O.; Thiombiano, A.; Hahn-Hadjali, K.; Guinko. Diversité et structure des groupements ligneux du parc national d’Arly (Est du Burkina Faso). Flora Veg. Sudano-Sambesica 2008, 11, 5–16. [Google Scholar] [CrossRef]
  39. Pereki, H.; Wala, K.; Thiel-Clemen, T.; Bessike, M.P.B.; Zida, M.; Dourma, M.; Batawila, K.; Akpagana, K. Woody species diversity and important value indices in dense dry forests in Abdoulaye Wildlife Reserve (Togo, West Africa). Int. J. Biodivers. Conserv 2013, 5, 358–366. [Google Scholar]
  40. Folega, F.; Bimare, K.; Konate, D.; Kperkouma, W.; Koffi, A. Inventaire et séquestration de carbone de la végétation de l’emprise urbaine de la ville de Dapaong, Togo. Espace Géographique Société Maroc. 2020. [Google Scholar] [CrossRef]
  41. Folega, F.; Zhang, C.Y.; Woegan, Y.A.; Wala, K.; Dourma, M.; Batawila, K.; Seburanga, J.L.; Zhao, X.H.; Akpagana, K. Structure and ecology of forest plant community in Togo. J. Trop. For. Sci. 2014, 26, 225–239. [Google Scholar]
  42. Sokpon, N.; Biaou, S.H.; Ouinsavi, C.; Hunhyet, O. Bases techniques pour une gestion durable des forêts claires du Nord-Bénin: Rotation, diamètre minimal d’exploitabilité et régénération. Bois. For. Trop. 2006, 287, 45–57. [Google Scholar]
  43. Legendre, P.; Legendre, L. Numerical Ecology; Elsevier: Amsterdam, The Netherlands, 2012. [Google Scholar]
  44. Hill, M. Decorana A FORTRAN Program for Detrended Correspondence Analysis and Reciprocal Averaging; Cornell University: Ithaca, NY, USA, 1979. [Google Scholar] [CrossRef]
  45. Kim, J.-H.; Park, J.-M.; Jung, K.-S.; Ri, C.-U. DECORANA and TWINSPAN Aided Analysis of Koelreuteria paniculata Community Formation. Korean J. Environ. Ecol. 2005, 19, 9–18. [Google Scholar]
  46. Braak, T. CANOCO Reference Manual and CanoDraw for Windows User’s Guide: Software for Canonical Community Ordination (Version 4.5); Microcomputer Power: Ithaca NY, USA, 2002. [Google Scholar]
  47. Ter Braak, C.T.; Smilauer, P. CANOCO Reference Manual and User’s Guide to Canoco for Windows: Software for Canonical Community Ordination (Version 4); Microcomputer Power: Ithaca NY, USA, 1998. [Google Scholar]
  48. Raunkiaer, C. The Life Forms of Plants and Statistical Plant Geography; Being the Collected Papers of C. Raunkiaer; Clarendon Press: Oxford, UK, 1934. [Google Scholar]
  49. White, F. La Végétation de L’afrique: Memoire Accompagnant la Carte de Végétation de L’afrique; Unesco/AETFAT/UNSO; IRD Editions: Paris, France, 1986; Volume 20. [Google Scholar]
  50. Magurran, A.E. Diversity indices and species abundance models. In Ecological Diversity and Its Measurement; Springer: Berlin/Heidelberg, Germany, 1988; pp. 7–45. [Google Scholar]
  51. Chao, A.; Shen, T.-J. Nonparametric estimation of Shannon’s index of diversity when there are unseen species in sample. Environ. Ecol. Stat 2003, 10, 429–443. [Google Scholar] [CrossRef]
  52. Sickle, J.V.; Gregory, S.V. Modeling inputs of large woody debris to streams from falling trees. Can. J. For. Res. 1990, 20, 1593–1601. [Google Scholar] [CrossRef]
  53. Bégin, J.; Raulier, F. Comparaison de différentes approches, modèles et tailles d’échantillons pour l’établissement de relations hauteur-diamètre locales Canadian. J. For. Res. 1995, 25, 1303–1312. [Google Scholar] [CrossRef]
  54. Décourt, N. Utilisation de la photographie pour mesurer les surfaces terrières. Rev. For. Française 1956, 7, 505–507. [Google Scholar] [CrossRef] [Green Version]
  55. Folega, F.; Atakpama, W.; Wala, K.; Mukete, B.; Shozo, S.; Akira, O.; Zhao, X.-H. Land use patterns and tree species diversity in the Volta Geological Unit, Togo. J. Mt. Sci. 2019, 16, 1869–1882. [Google Scholar] [CrossRef]
  56. Eiselt, H.; Marianov, V.; Bhadury, J. Mathematical and Geospatial Tools. In Multicriteria Location Analysis; Springer: Berlin/Heidelberg, Germany, 2023; pp. 107–142. [Google Scholar]
  57. Rial-Berriel, C.; Acosta-Dacal, A.; Pérez, M.Á.C.; Suárez-Pérez, A.; Melián, A.M.; Zumbado, M.; Hernández, L.A.H.; Ruiz-Suárez, N. Intensive livestock farming as a major determinant of the exposure to anticoagulant rodenticides in raptors of the Canary Islands (Spain). Sci. Total Environ. 2021, 768, 144386. [Google Scholar] [CrossRef] [PubMed]
  58. Hajjar, R.; Oldekop, J.A.; Cronkleton, P.; Newton, P.; Russell, A.J.; Zhou, W.A. global analysis of the social and environmental outcomes of community forests. Nat. Sustain. 2021, 4, 216–224. [Google Scholar] [CrossRef]
  59. Nurrochmat, D.R.; Pribadi, R.; Siregar, H.; Justianto, A.; Park, M.S. Transformation of agro-forest management policy under the dynamic circumstances of a two-decade regional autonomy in Indonesia. Forests 2021, 12, 419. [Google Scholar] [CrossRef]
  60. Mensah, K.; Folega, F.; Woegan, Y.A.; Atakpama, W.; Pereki, H.; Wala, K.; Akpagana, K. État et dynamique spatio-temporelle de la forêt communautaire d’EdouwossiCopé, Région des Plateaux-Togo. Rev. Écosystèmes Paysages 2022, 2, 12–26. [Google Scholar]
  61. Bigma, B.; Woegan, Y.A.; Bawa, A.; Diwediga, B.; Koumantiga, D.; Wala, K.; Akpagana, K. Ceintures vertes villageoises de la préfecture de l’Avé au Togo (Afrique de l’ouest): Diversité floristique, menaces et modes de gestion. Rev. Écosystèmes Paysages 2022, 2, 1. [Google Scholar]
  62. Fousseni, F.; Marra, D.; Wala, K.; Batawila, K.; Zhang, C.-Y.; Zhao, X.-H.; Akpagana, K. Assessment and impact of anthropogenic disturbances in protected areas of northern Togo. For. Stud. China 2012, 14, 216–223. [Google Scholar] [CrossRef]
  63. Boulogne, M. Vulnérabilité des Paysages Forestiers Dans le Parc de Ranomafana (Madagascar): Dynamiques Environnementales et Trajectoires Agroforestières. Ph.D. Thesis, Université Grenoble Alpes, Nogent-sur-Marne, France, 2016. [Google Scholar]
  64. Issifou, A.; Folega, F.; Kombate, B.; Atakpama, W.; Batawila, k.; Ketoh, G.K.; Akpagana, K. Cartographie participative des terroirs riverains de la réserve de faune d’Abdoulaye au Togo. Rev. Écosystèmes Paysages 2022, 2, 83–97. [Google Scholar]
  65. Ouattara, B.; Sanou, L.; Koala, J.; Hien, M. Utilisations locales et vulnérabilité des espèces ligneuses dans les forêts classées de Oualou et de Tissé au Burkina Faso, Afrique de l’Ouest. Afr. Sci. 2021, 19, 63–77. [Google Scholar]
  66. Zanh, G.G.; Barima, Y.S.S.; Kouakou, K.A.; Sangne, Y.C.I. Usages des produits forestiers non-ligneux selon les communautés riveraines de la forêt classée du Haut-Sassandra (Centre-Ouest de la Côte d’Ivoire). Int. J. Pure App. Biosci. 2016, 4, 212–225. [Google Scholar]
  67. Seou, E.; Takou, P.W.; Boukpessi, T. Analyse des changements par télédétection de la couverture végétale du bassin de Zio (Sud-Ouest Togo). Rev. Écosystèmes Paysages 2022, 2, 126–139. [Google Scholar]
  68. Abalo, M.; Badabate, D.; Fousseni, F.; Kpérkouma, W.; Koffi, A. Landscape-based analysis of wetlands patterns in the Ogou River basin in Togo (West Africa). Environ. Chall. 2021, 2, 100013. [Google Scholar] [CrossRef]
  69. Folega, F.; Kanda, M.; Fandjinou, K.; Bohnett, E.; Wala, K.; Batawila, K.; Akpagana, K. Flora and Typology of Wetlands of Haho River Watershed, Togo. Sustainability 2023, 15, 2814. [Google Scholar] [CrossRef]
  70. Sarr, M.A. Cartographie des changements de l’occupation du sol entre 1990 et 2002 dans le nord du Sénégal (Ferlo) à partir des images Landsat. Cybergeo Eur. J. Geogr. 2009. [Google Scholar] [CrossRef]
  71. Adjonou, K.; Djiwa, O.; Kombate, Y.; Kokutse, A.D.; Kokou, K. Etude de la dynamique spatiale et structure des forêts denses sèches reliques du Togo: Implications pour une gestion durable des aires protégées. Int. J. Biol. Chem. Sci. 2010, 4. [Google Scholar] [CrossRef]
  72. Djego, J.; Gibigaye, M.; Tente, B.; Sinsin, B. Analyses écologique et structurale de la forêt communautaire de Kaodji au Bénin. Int. J. Biol. Chem. Sci. 2012, 6, 705–713. [Google Scholar] [CrossRef] [Green Version]
  73. Bawa, D.M.; Folega, F.; Atato, A.; Diwediga, B.; Wala, K.; Akpagana, K. Caractéristiques floristiques et structurales de la forêt communautaire d’Agbandi au centre du Togo (Afrique de l’ouest). Rev. Écosystèmes Paysages 2022, 2, 55–74. [Google Scholar]
  74. Folega, F.; Datche-Danha, K.E.; Folega, A.; Woegan, A.Y.; Kperkouma, W.; Akpagana, K. Diversité des services écosystémiques et utilisation des terres dans le paysage du socle Eburnéen au Togo: Diversity of ecosystem services and land use in the Eburnean basement landscape of Togo. Rev. Nat. Technol. 2022, 14, 61–75. [Google Scholar]
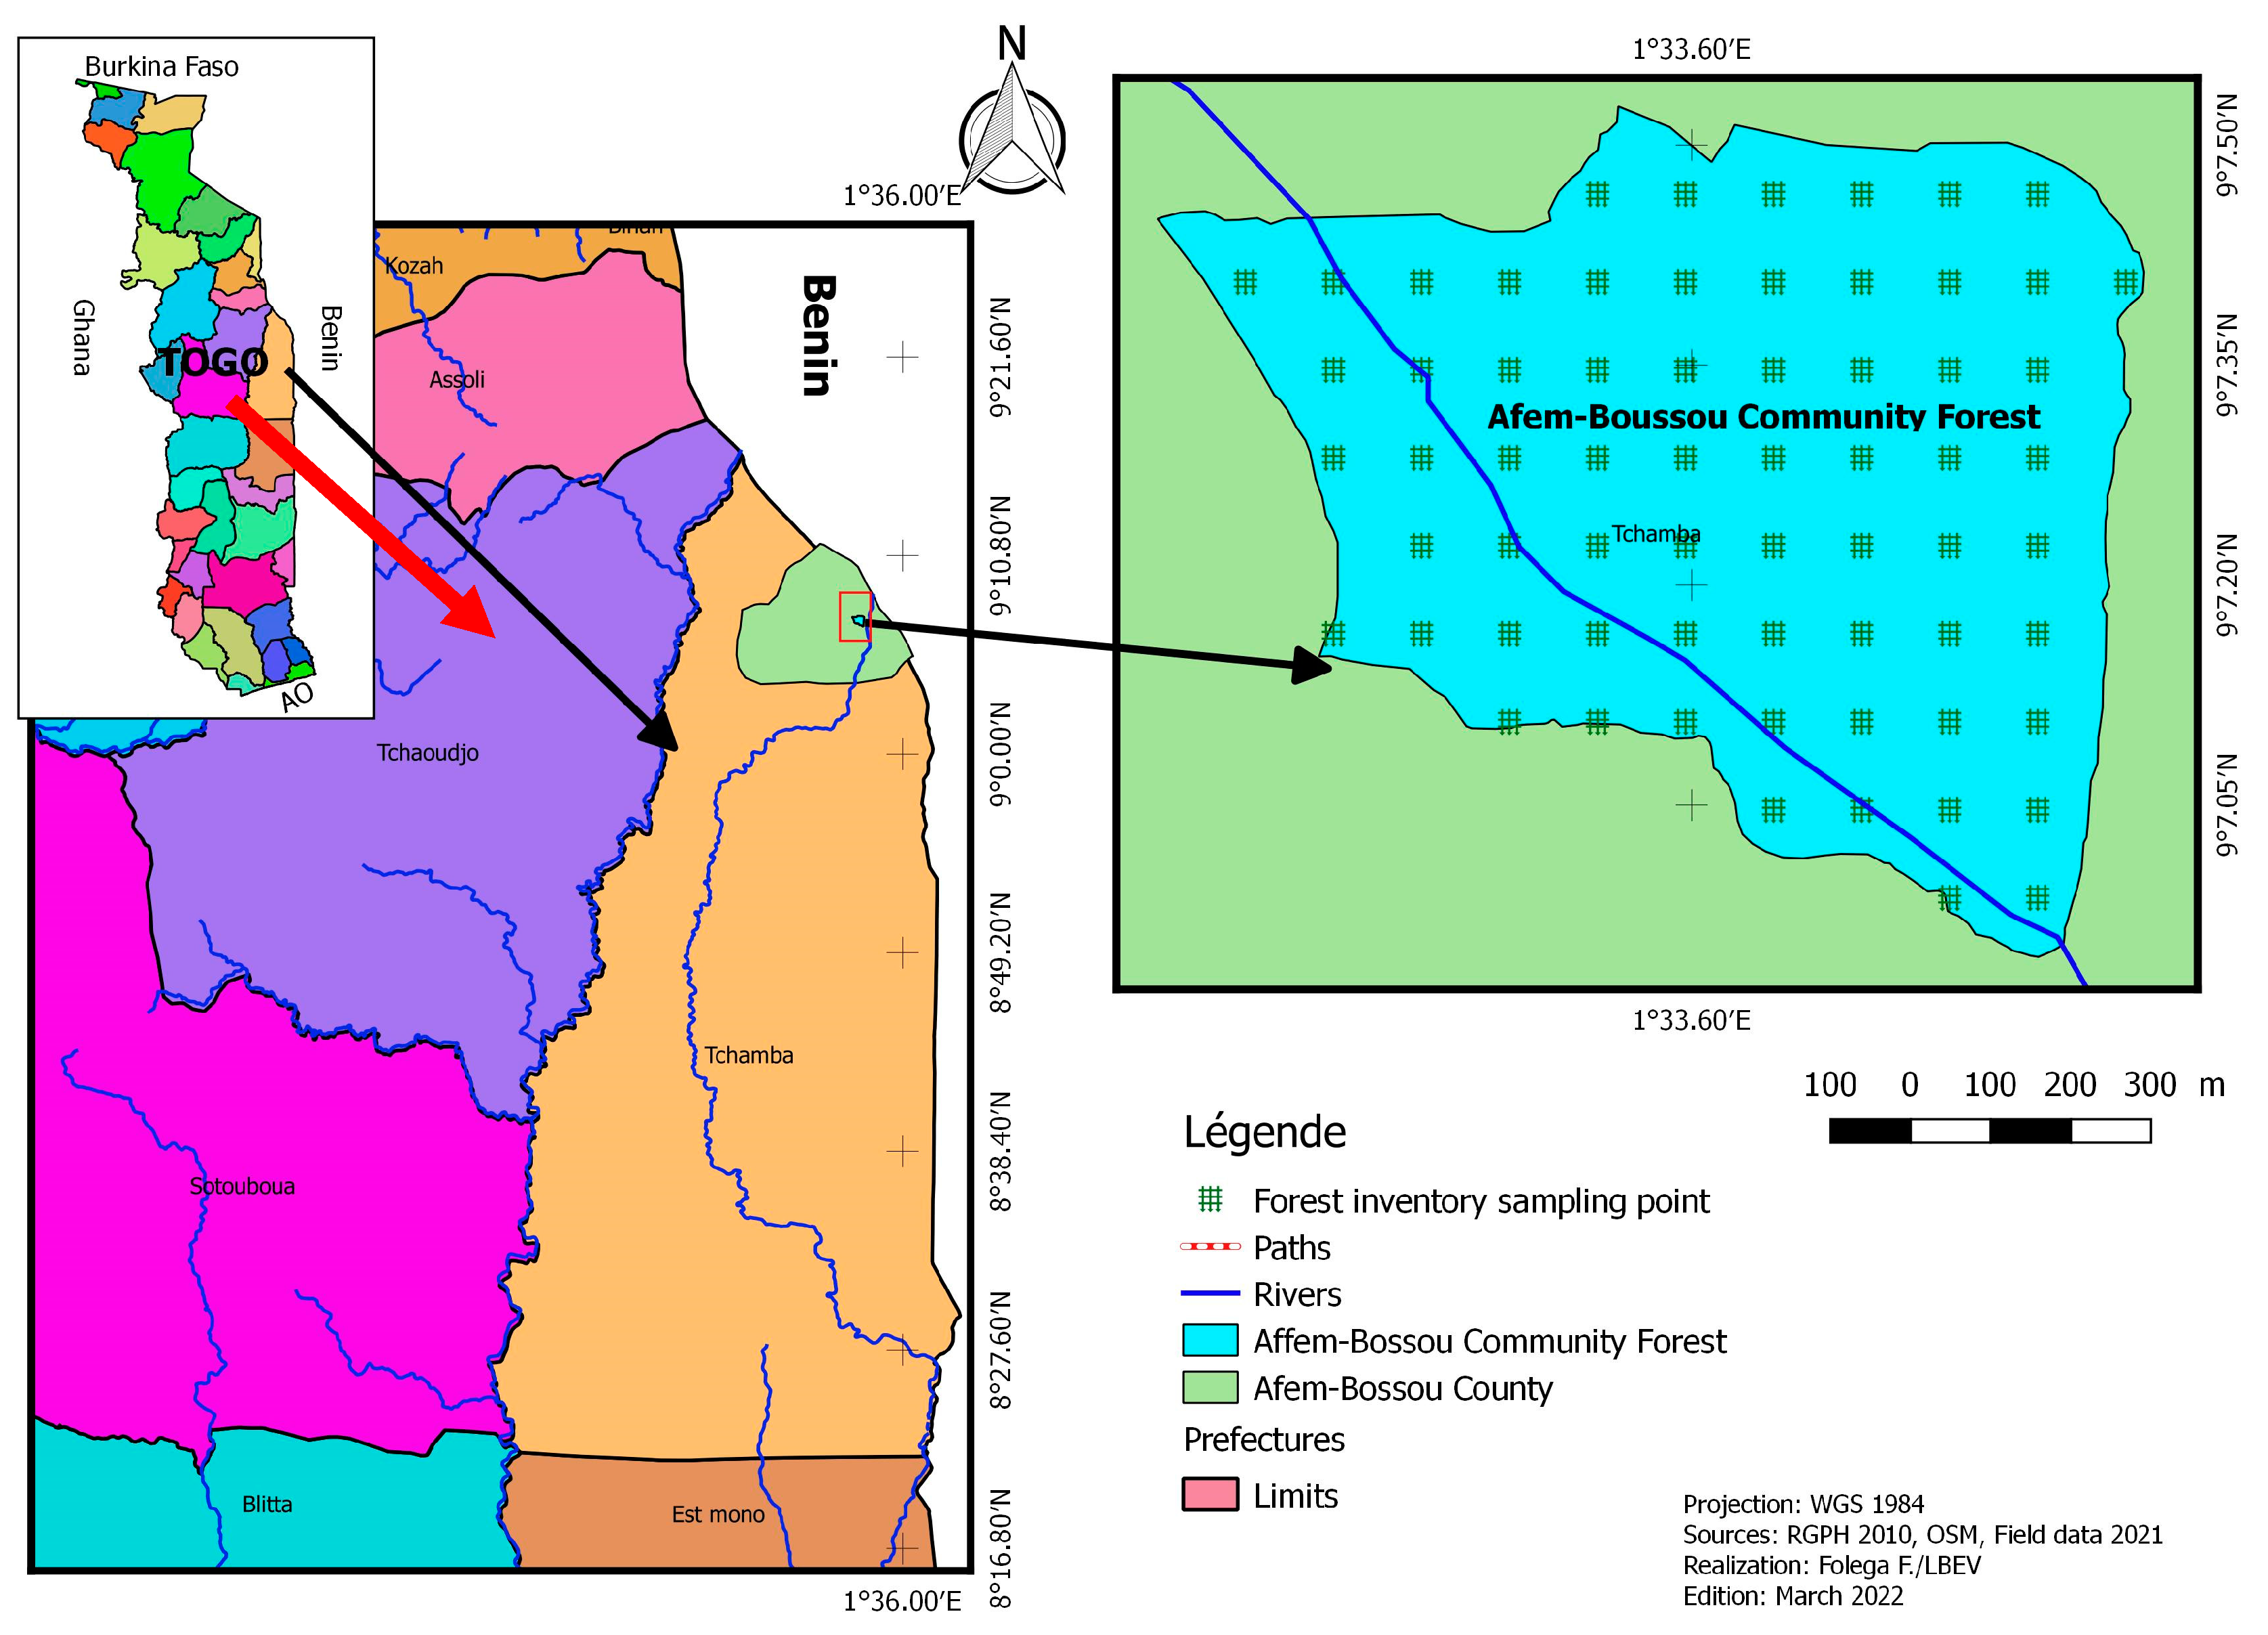
Figure 1. Location of Affem community forest.
Conservation 03 00024 g001
Figure 2. Land use in 2015.
Conservation 03 00024 g002
Figure 3. Land use in 2018.
Conservation 03 00024 g003
Figure 4. Land use in 2021.
Conservation 03 00024 g004
Figure 5. Raw spectrum of Affem forest families.
Conservation 03 00024 g005
Figure 6. Hierarchical ascending classification of AFC records.
Conservation 03 00024 g006
Figure 7. Distribution of diameter (A) and height (B) classes of group G1.
Conservation 03 00024 g007
Figure 8. Distribution of diameter (A) and height (B) classes of group G2.
Conservation 03 00024 g008
Figure 9. Distribution of diameter (A) and height (B) classes of group G3.
Conservation 03 00024 g009
Figure 10. Distribution of diameter (A) and height (B) classes of group G4.
Conservation 03 00024 g010
Figure 11. Distribution of diameter (A) and height (B) classes of group G5.
Conservation 03 00024 g011
Figure 12. Map of the zoning plan.
Conservation 03 00024 g012
Table 1. Components of alpha diversity.
ParametersFormulaReferences
Shannon Index (Ish)Ish = −∑(ni/n) log2 (ni/n)[51]
Pielou Equitability Index (E)Eq = ish/log2S[43,50]
S = total number of species in a biotope; ni = number of individuals of species i, n = total number of individuals
Table 2. Different statistical parameters.
ParametersFormulaSource
Total density (D) of wooded areaD = n/s[41,52]
Average diameter (Dm)Dm = 1/n ∑di[53]
Basal area (GG = π/4s ∑0.0001d2[54]
Average height
Rate of regeneration
Hm = 1/n ∑hi
Tr = n/(n + N) × 100
[53]
(Bowers, 1986)
n = number of plants per survey; S = survey area in hectares; di = diameter at 1.30 m of tree; hi = height of tree; n = number of species at dbh < 10 cm; and N = number of plants at dbh ≥ 10 cm.
Table 3. Land use unit assessment rate.
Surface AreaAssessment Rate %
2015 2018 2021
Land Use UnitsHa%Ha %Ha %2015–20182018–20212015–2021
Crop and fallow10.8213.178.3710.197.158.69−22.63−14.66−33.98
Dense dry forest35.8943.6636.5344.4433.0540.211.78−9.53−7.92
Gallery forest10.9513.3210.8613.2210.5712.86−0.76−2.72−3.46
Plantation0.750.91----−100-−100
Tree/shrub savannahs2.412.9312.8415.6214.0817.14432.409.73484.23
Grassy savannah and meadow21.3726.0013.5916.5317.3421.10−36.4127.63−18.84
Table 4. Structural characteristics and diversity index of groups.
Group Density (ft/ha)Average Diameter (cm)Average Height (m)Bole Height (m)Basal Area G (m2/ha)Shannon IndexPielou Equitability Index
G17422.5 ± 11.1416.1 ± 4.288.39 ± 3.322.983.90.97
G213617.2 ± 5.42 9.62 ± 4.113.73 ± 2.3518.653.630.87
G33813 ± 3.7812.35 ± 4.483.51 ± 2.014.384.340.96
G43622.5 ± 17.18 16.37 ± 5.475.16 ± 2.7316.434.040.92
G59430 ± 15.30 14.84 ± 5.166.01 ± 3.63 7.123.970.9
Table 5. Management series and vocation use.
Series (Zone)Area (ha)Primary UseSecondary Use
Agroforestry vocation 15.45Agricultural and foraged products Soil fertilization
Sustainable forestry production34.70Energy wood, timber, non-timber forest productsEnvironment protection
Buffer9.03Separation of the protection and production areas
Biological conservation 23.01Conservation of biodiversity and genetic resourcesTourism, carbon sequestration, and recreation
Disclaimer/Publisher’s Note: The statements, opinions and data contained in all publications are solely those of the individual author(s) and contributor(s) and not of MDPI and/or the editor(s). MDPI and/or the editor(s) disclaim responsibility for any injury to people or property resulting from any ideas, methods, instructions or products referred to in the content.