Article

Characterization of Sugarcane Germplasm for Physiological and Agronomic Traits Associated with Drought Tolerance Across Various Soil Types

by
Phunsuk Laotongkam
1,2,
Nakorn Jongrungklang
1,3,
Poramate Banterng
1,
Peeraya Klomsa-ard
2,
Warodom Wirojsirasak
2 and
Patcharin Songsri
1,3,*
1
Department of Agronomy, Faculty of Agriculture, Khon Kaen University, Khon Kaen 40002, Thailand
2
Mitr Phol Innovation and Research Center, Phu Khiao, Chaiyaphum 36110, Thailand
3
Northeast Thailand Cane and Sugar Research Center (NECS), Khon Kaen University, Khon Kaen 40002, Thailand
*
Author to whom correspondence should be addressed.
Stresses 2025, 5(3), 57; https://doi.org/10.3390/stresses5030057 (registering DOI)
Submission received: 13 July 2025 / Revised: 20 August 2025 / Accepted: 26 August 2025 / Published: 1 September 2025
(This article belongs to the Section Plant and Photoautotrophic Stresses)

Abstract

In this study, we aimed to evaluate physiological and agronomic traits in 120 sugarcane genotypes under early drought stress conditions in a field trial across various soil types. The experiment used a split-plot arrangement, with a randomized complete block design and two replications. Two different water regimes were assigned to the main plot: (1) non-water stress (CT) and (2) drought (DT) at the early growth stage, during which sugarcane was subjected to drought stress by withholding water for 4 months. The subplot consisted of 120 sugarcane genotypes. The stalk height, stalk diameter, number of stalks, photosynthetic traits including SPAD chlorophyll meter reading (SCMR) and maximum quantum efficiency of photosystem II photochemistry (Fv/Fm), and normalized difference vegetation index (NDVI) were measured at 3, 6, and 9 months after planting (MAP). Yield and yield component parameters were measured at 12 MAP. Drought treatments lead to significant changes in various physiological traits in the sugarcane. Clustering analysis classified 36 sugarcane varieties grown in sandy loam soil and 15 genotypes in loam soil into two main clusters. In sandy loam soils, Biotec4 and CO1287 exhibited outstanding performance in drought conditions, delivering high cane yields. Meanwhile, in loam soil, MPT13-118, MPT07-1, Q47, F174, MPT14-1-902, and UT1 exhibited the best drought tolerance. Under drought conditions, cluster 1 showed higher values for SCMR, NDVI, height growth rate (HGR), cane yield, and drought tolerance index compared to cluster 2. These findings suggest that breeders can utilize these genotypes to enhance drought resistance, and the identified physiological traits can assist in selecting stronger candidates for drought tolerance.

1. Introduction

Sugarcane is a significant economic crop, serving as a raw material for sugar production and other related industries [1,2]. However, suboptimal growth conditions significantly impact various biological systems, influencing growth rates, physiological responses, and resistance mechanisms [3]. These conditions can arise from water scarcity in tropical regions [4], leading to substantial yield reductions by inhibiting development and growth. Drought can decrease sugarcane yield by up to 80% [5]. Developing drought-tolerant sugarcane genotypes requires a multifaceted approach focusing on both high yield potential and a high drought tolerance index [6,7]. This strategy enhances productivity and sustainability in rainfed sugarcane agriculture, supporting the livelihoods of farmers and the sugarcane industry in regions prone to drought. Sugarcane in Thailand primarily grows during the late rainy season, accounting for 90% of the total production [8]. Sugarcane is frequently impacted by early-season and mid-season drought conditions [9]. This stress can reduce the plant growth stages and mechanisms of sugarcane drought tolerance, which are linked to physiological and growth traits [10]. These traits influence sugarcane adaptation and yield [11]. The use of physiological characteristics for evaluation and selection is essential in drought tolerance breeding programs for sugarcane.
Developing drought-tolerant sugarcane genotypes is crucial in maintaining yields in rainfed areas during insufficient rainfall distribution. The sugarcane genotype responds to dry conditions through various adaptive mechanisms that affect morphological, biochemical, and physiological traits [12,13]. These include changes in photosynthesis rate, stomatal conductance, SPAD chlorophyll meter reading (SCMR), and photochemical efficiency of photosystem II, as indicated by chlorophyll fluorescence [13], as well as in the normalized difference vegetation index (NDVI) [14]. Sugarcane genotypes with drought tolerance exhibit higher photosynthesis efficiency and chlorophyll fluorescence than drought-susceptible genotypes [15]. SCMR in sugarcane has a significant positive correlation with the chlorophyll content in the leaves under drought conditions [3,10]. The NDVI has shown promise, demonstrating utility in assessing growth capability, particularly in drought-affected areas [16]. According to Gunnula et al. [17], the NDVI could decline as drought stress increases, complicating yield predictions, as it reflects plant biomass rather than maturity under these conditions. SCMR and chlorophyll fluorescence values are measured to evaluate the genetic traits of sugarcane for the organization and classification of genetic groups for breeding enhancement [18]; in the initial stage of variety selection, the focus is on cane yield, while in the later stage, the emphasis is on the sucrose content and physiological traits related to sucrose accumulation [19]. This approach enhances the accuracy of evaluating and selecting genotypes. A study on using physiological traits to select suitable sugarcane clones under limited water conditions at 100% and 50% irrigation revealed that chlorophyll fluorescence, SCMR, leaf rolling, and sugarcane yield tended to decrease under 50% irrigation, showing a positive correlation with sugarcane yield [20].
Conducting experiments in different soil types is crucial for assessing sugarcane genotype stability under drought. Soil properties influence water availability and plant stress responses. For instance, sandy soil dries out easier than organic soils, intensifying drought effects [21]. Studies by Mubeen et al. [22] showed that soil type alters physiological and agronomic responses. Thus, including multiple soil types improves genotype evaluation and broadens applicability across environments.
In this study, we aimed to identify traits associated with drought tolerance in sugarcane germplasm from various types of soil during the early growth stage. We focused on five key traits: the maximum quantum efficiency of photosystem II photochemistry (Fv/Fm) ratio, SCMR, NDVI, leaf rolling (LR), and height growth rate (HGR). These findings could significantly impact sugarcane breeding programs by aiding in selecting parent plants and developing drought-tolerant genotypes.

2. Results

2.1. Soil Moisture Content and Meteorological Conditions

In sandy loam soil, the minimum daily air temperature ranged from 9.4 to 29.4 °C, and the maximum temperature ranged from 19.3 to 40.8 °C (Figure 1a). The total rainfall during the drought stress period was 185.5 mm, while the cumulative rainfall after the drought stress period was 1302.91 mm during the growing season in sandy loam soil (Figure 1a). In loam soil, the minimum daily air temperature ranged from 10.0 to 29.4 °C, and the maximum temperature ranged from 18.9 to 40.0 °C. The total rainfall during the drought stress period was 276 mm in loam soil. In contrast, the cumulative rainfall during the growing season in loam soil after the drought stress period was 950.5 mm (Figure 1b).
The soil moisture content (SMC) under the two water regimes for all sugarcane genotypes differed significantly (Figure 2). The differences in SMC between the two water regimes increased over time after the withholding of water and remained stable after the re-watering period. The SMC measurements confirmed that irrigation applications of the treatments were adequately controlled. Under non-water stress (CT), SMC ranged from 10.3% to 12.1% in sandy loam soil and 11.5% to 14.2% in loam soil throughout the experiment. In contrast, under drought conditions, DS, SMC dropped to 6.6% in sandy loam and 6.7% in loam soil at 3 months after water withholding.

2.2. Physiological Variations in Progressive Drought Stress and Recovery

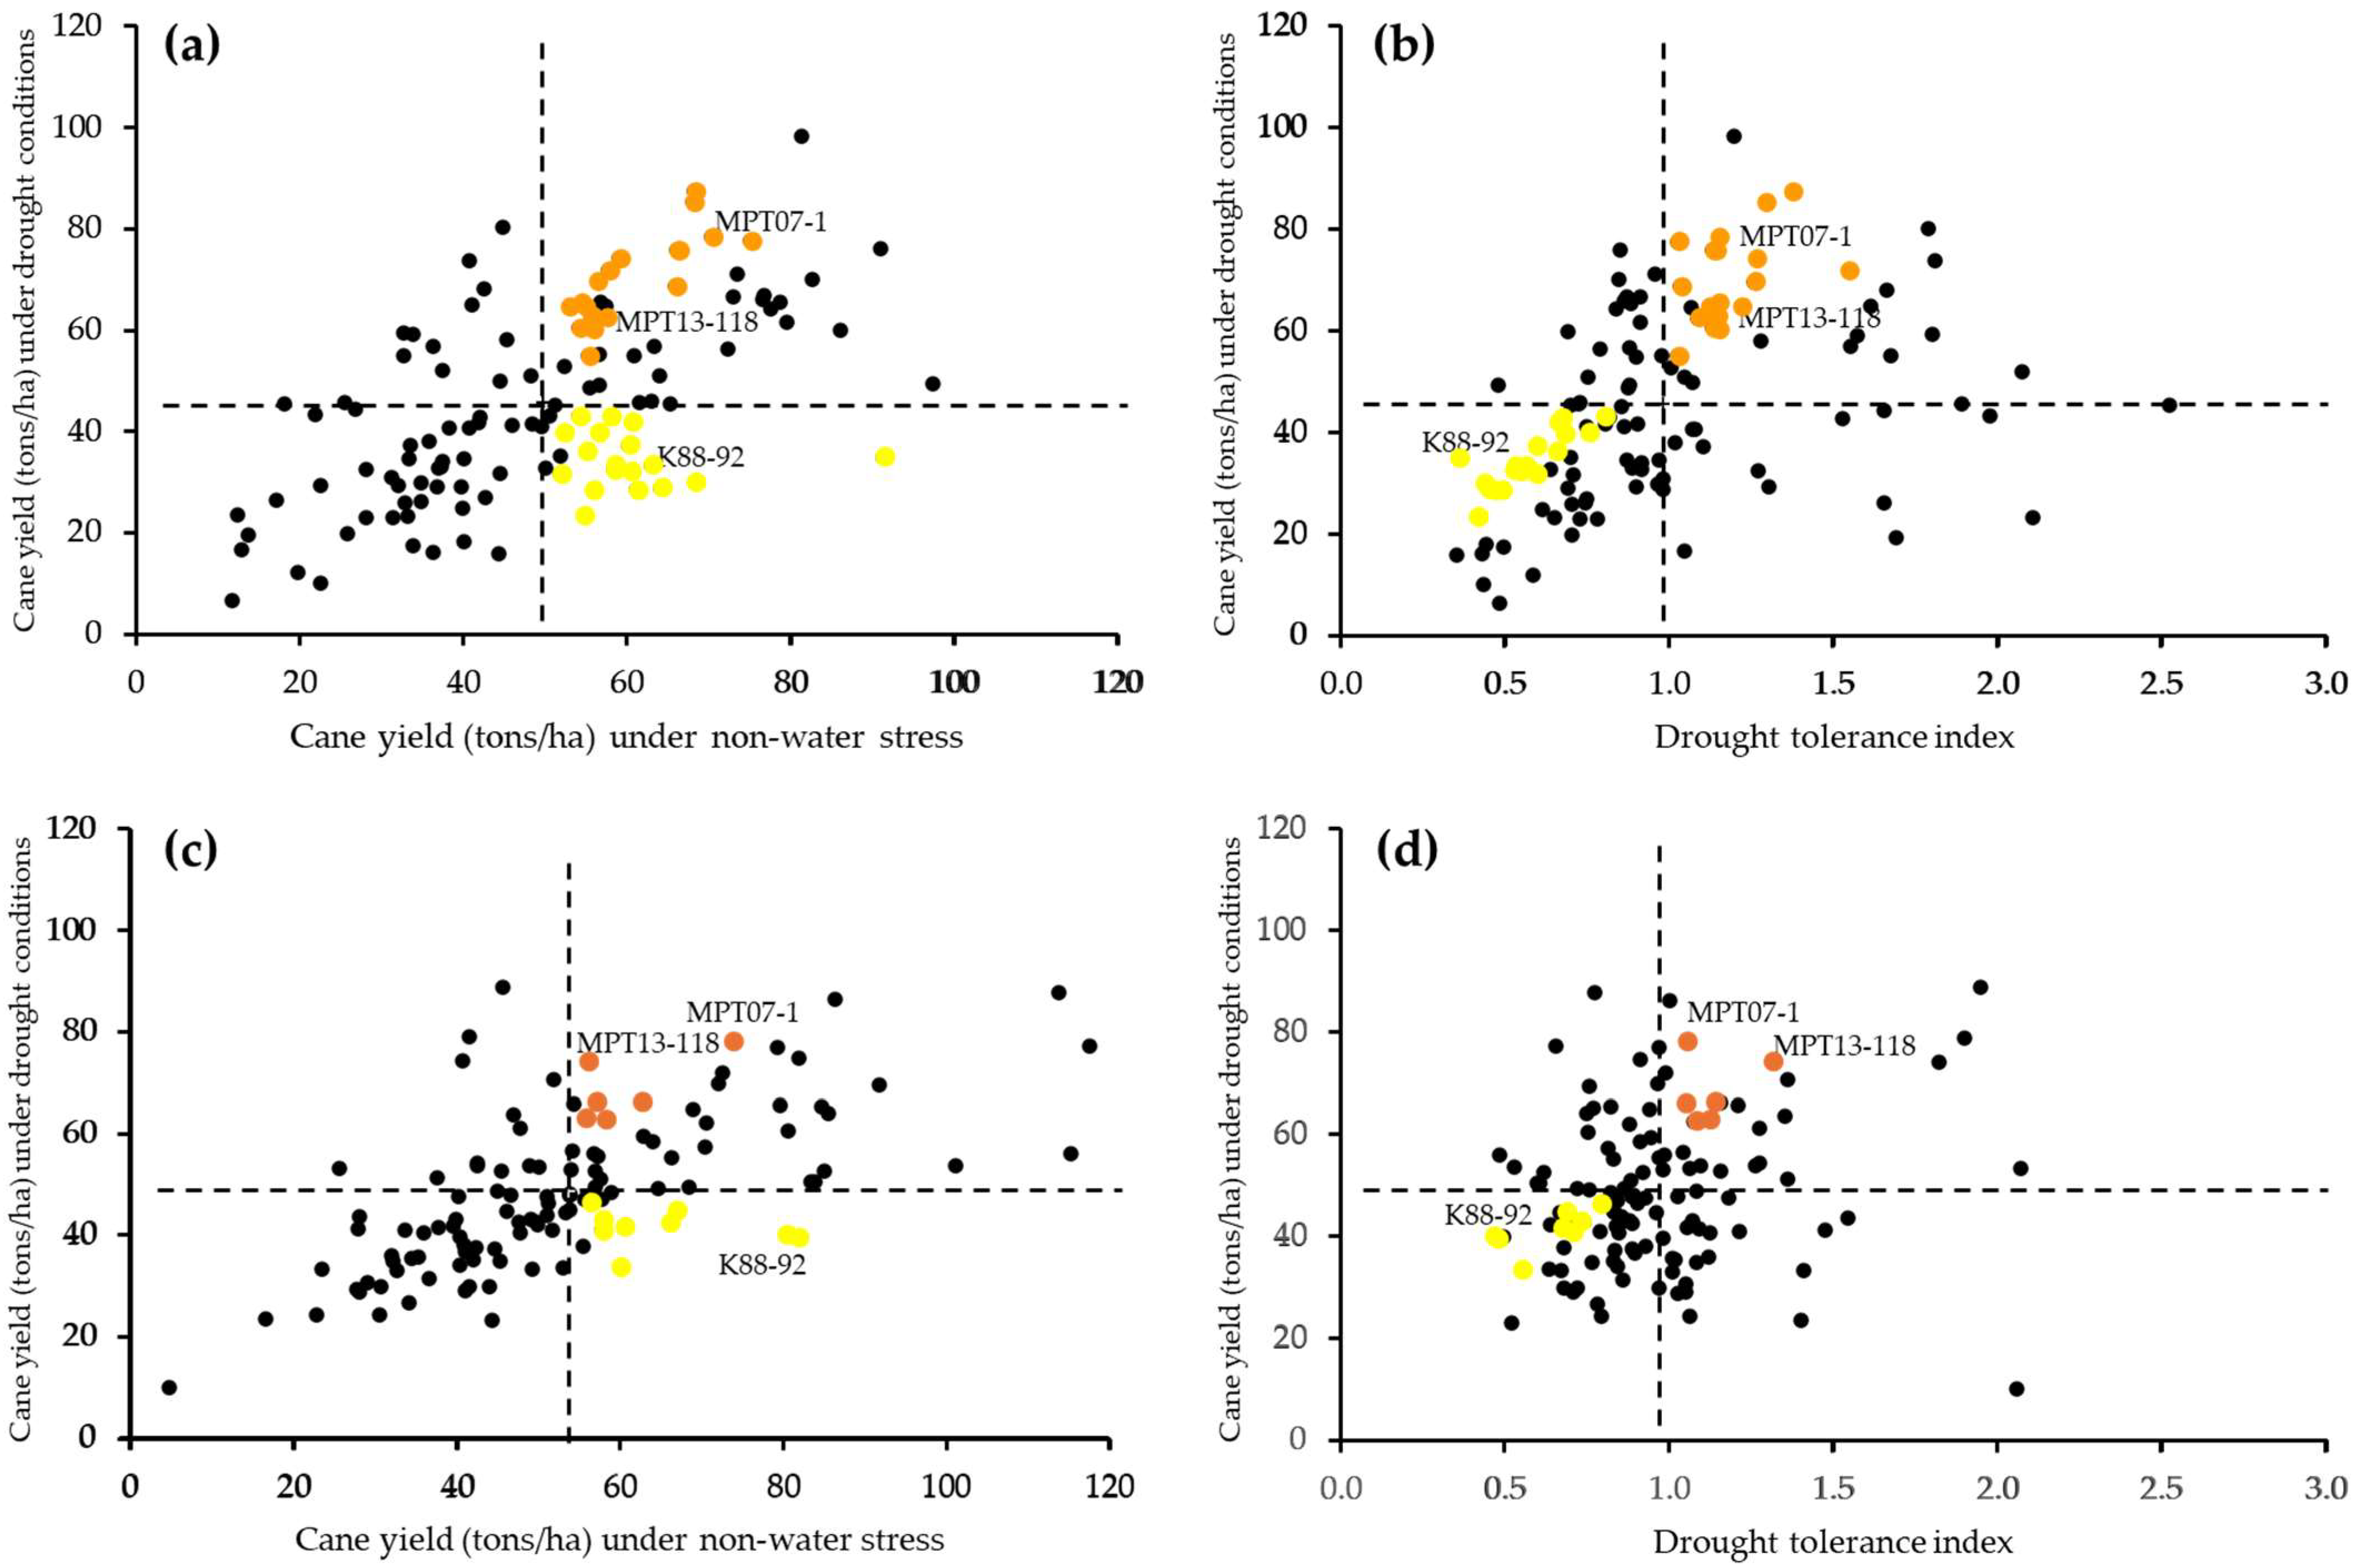
The effect of rain on sugarcane crops was beneficial during tillering, vegetative growth, and cane elongation. The MPT07-1 and MPT13-118 genotypes exhibited strong drought tolerance, as indicated by their high drought tolerance index, and yield under non-water-stress and drought conditions. K88-92 exhibited a high cane yield under non-water-stress conditions but showed a low cane yield and a low drought tolerance index under drought conditions (Figure 3).
In this study, 120 sugarcane genotypes were selected to represent the following groups: high cane yield in irrigated conditions, high cane yield in rainfed conditions, and high drought tolerance index (HHH); and high cane yield in irrigated conditions, low cane yield in rainfed conditions, and low drought tolerance index (HLL). These groups were categorized based on significant differences in cane yield under non-water-stress and drought conditions, with the DTI of cane yield under drought-stressed conditions. The HHH group consisted of 18 genotypes in sandy loam soil and 6 genotypes in loam soil. The HLL group comprised 18 genotypes in sandy loam soil and 9 genotypes in loam soil (Figure 3a,b).
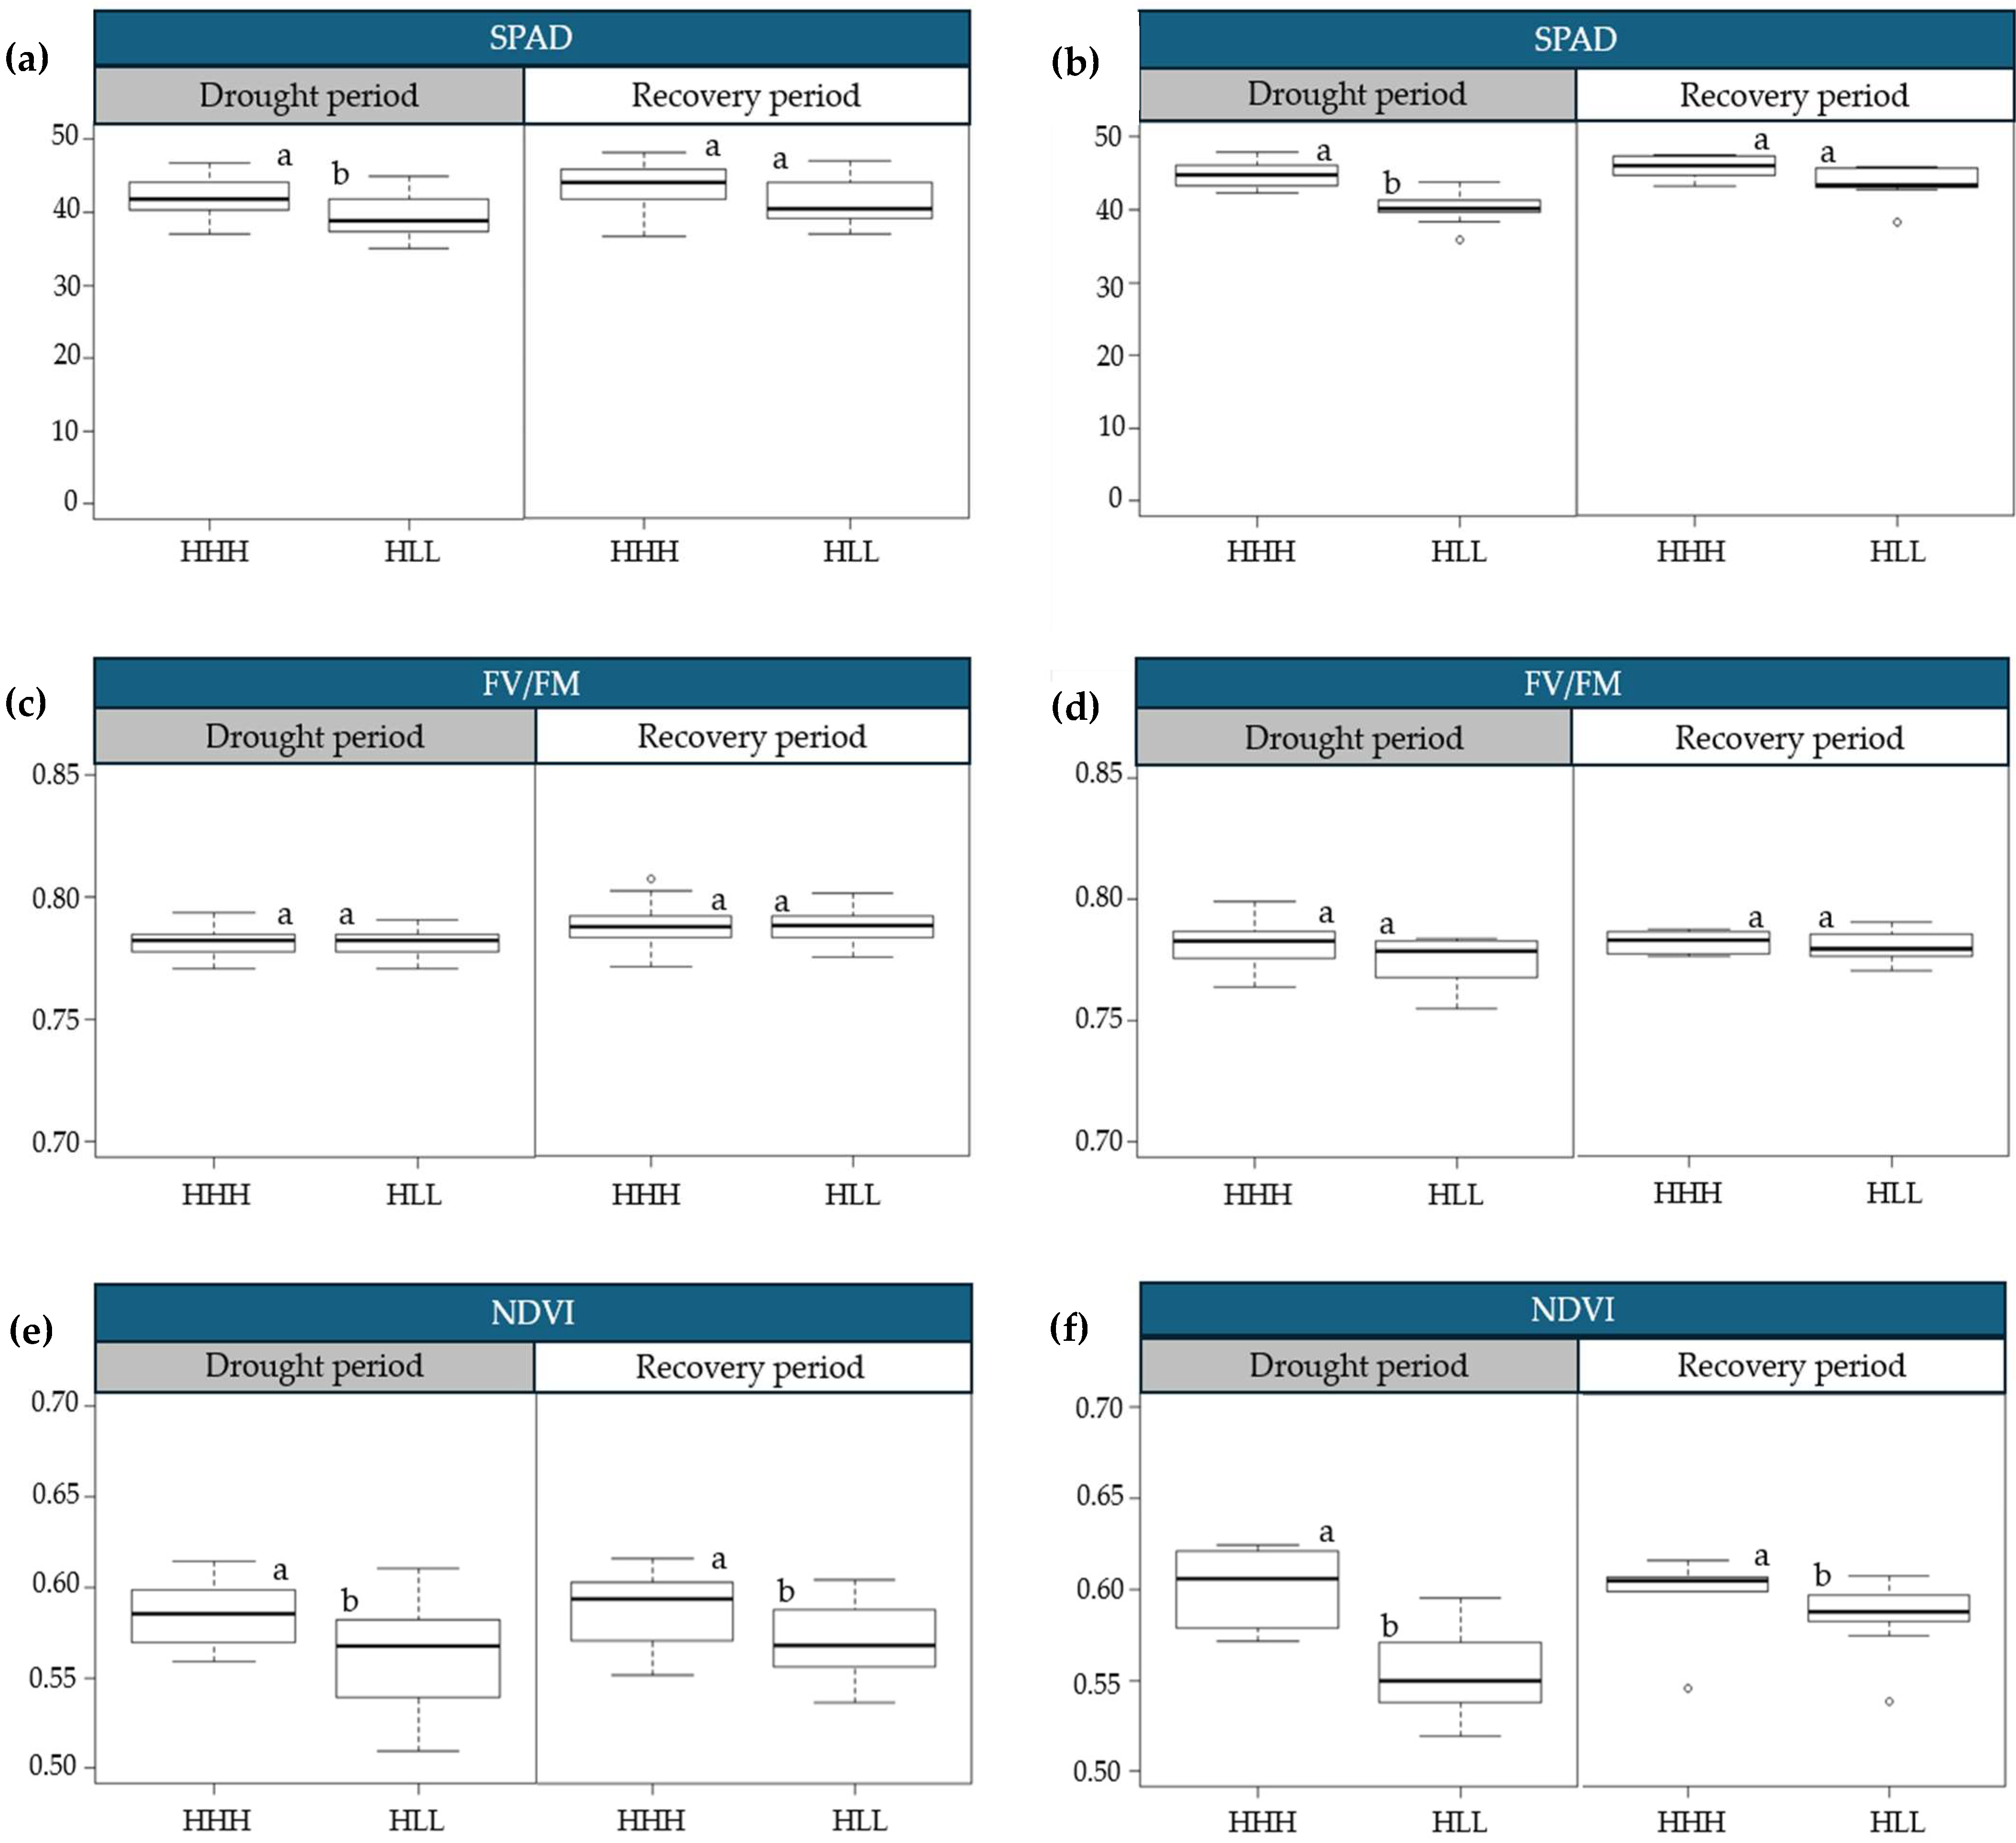
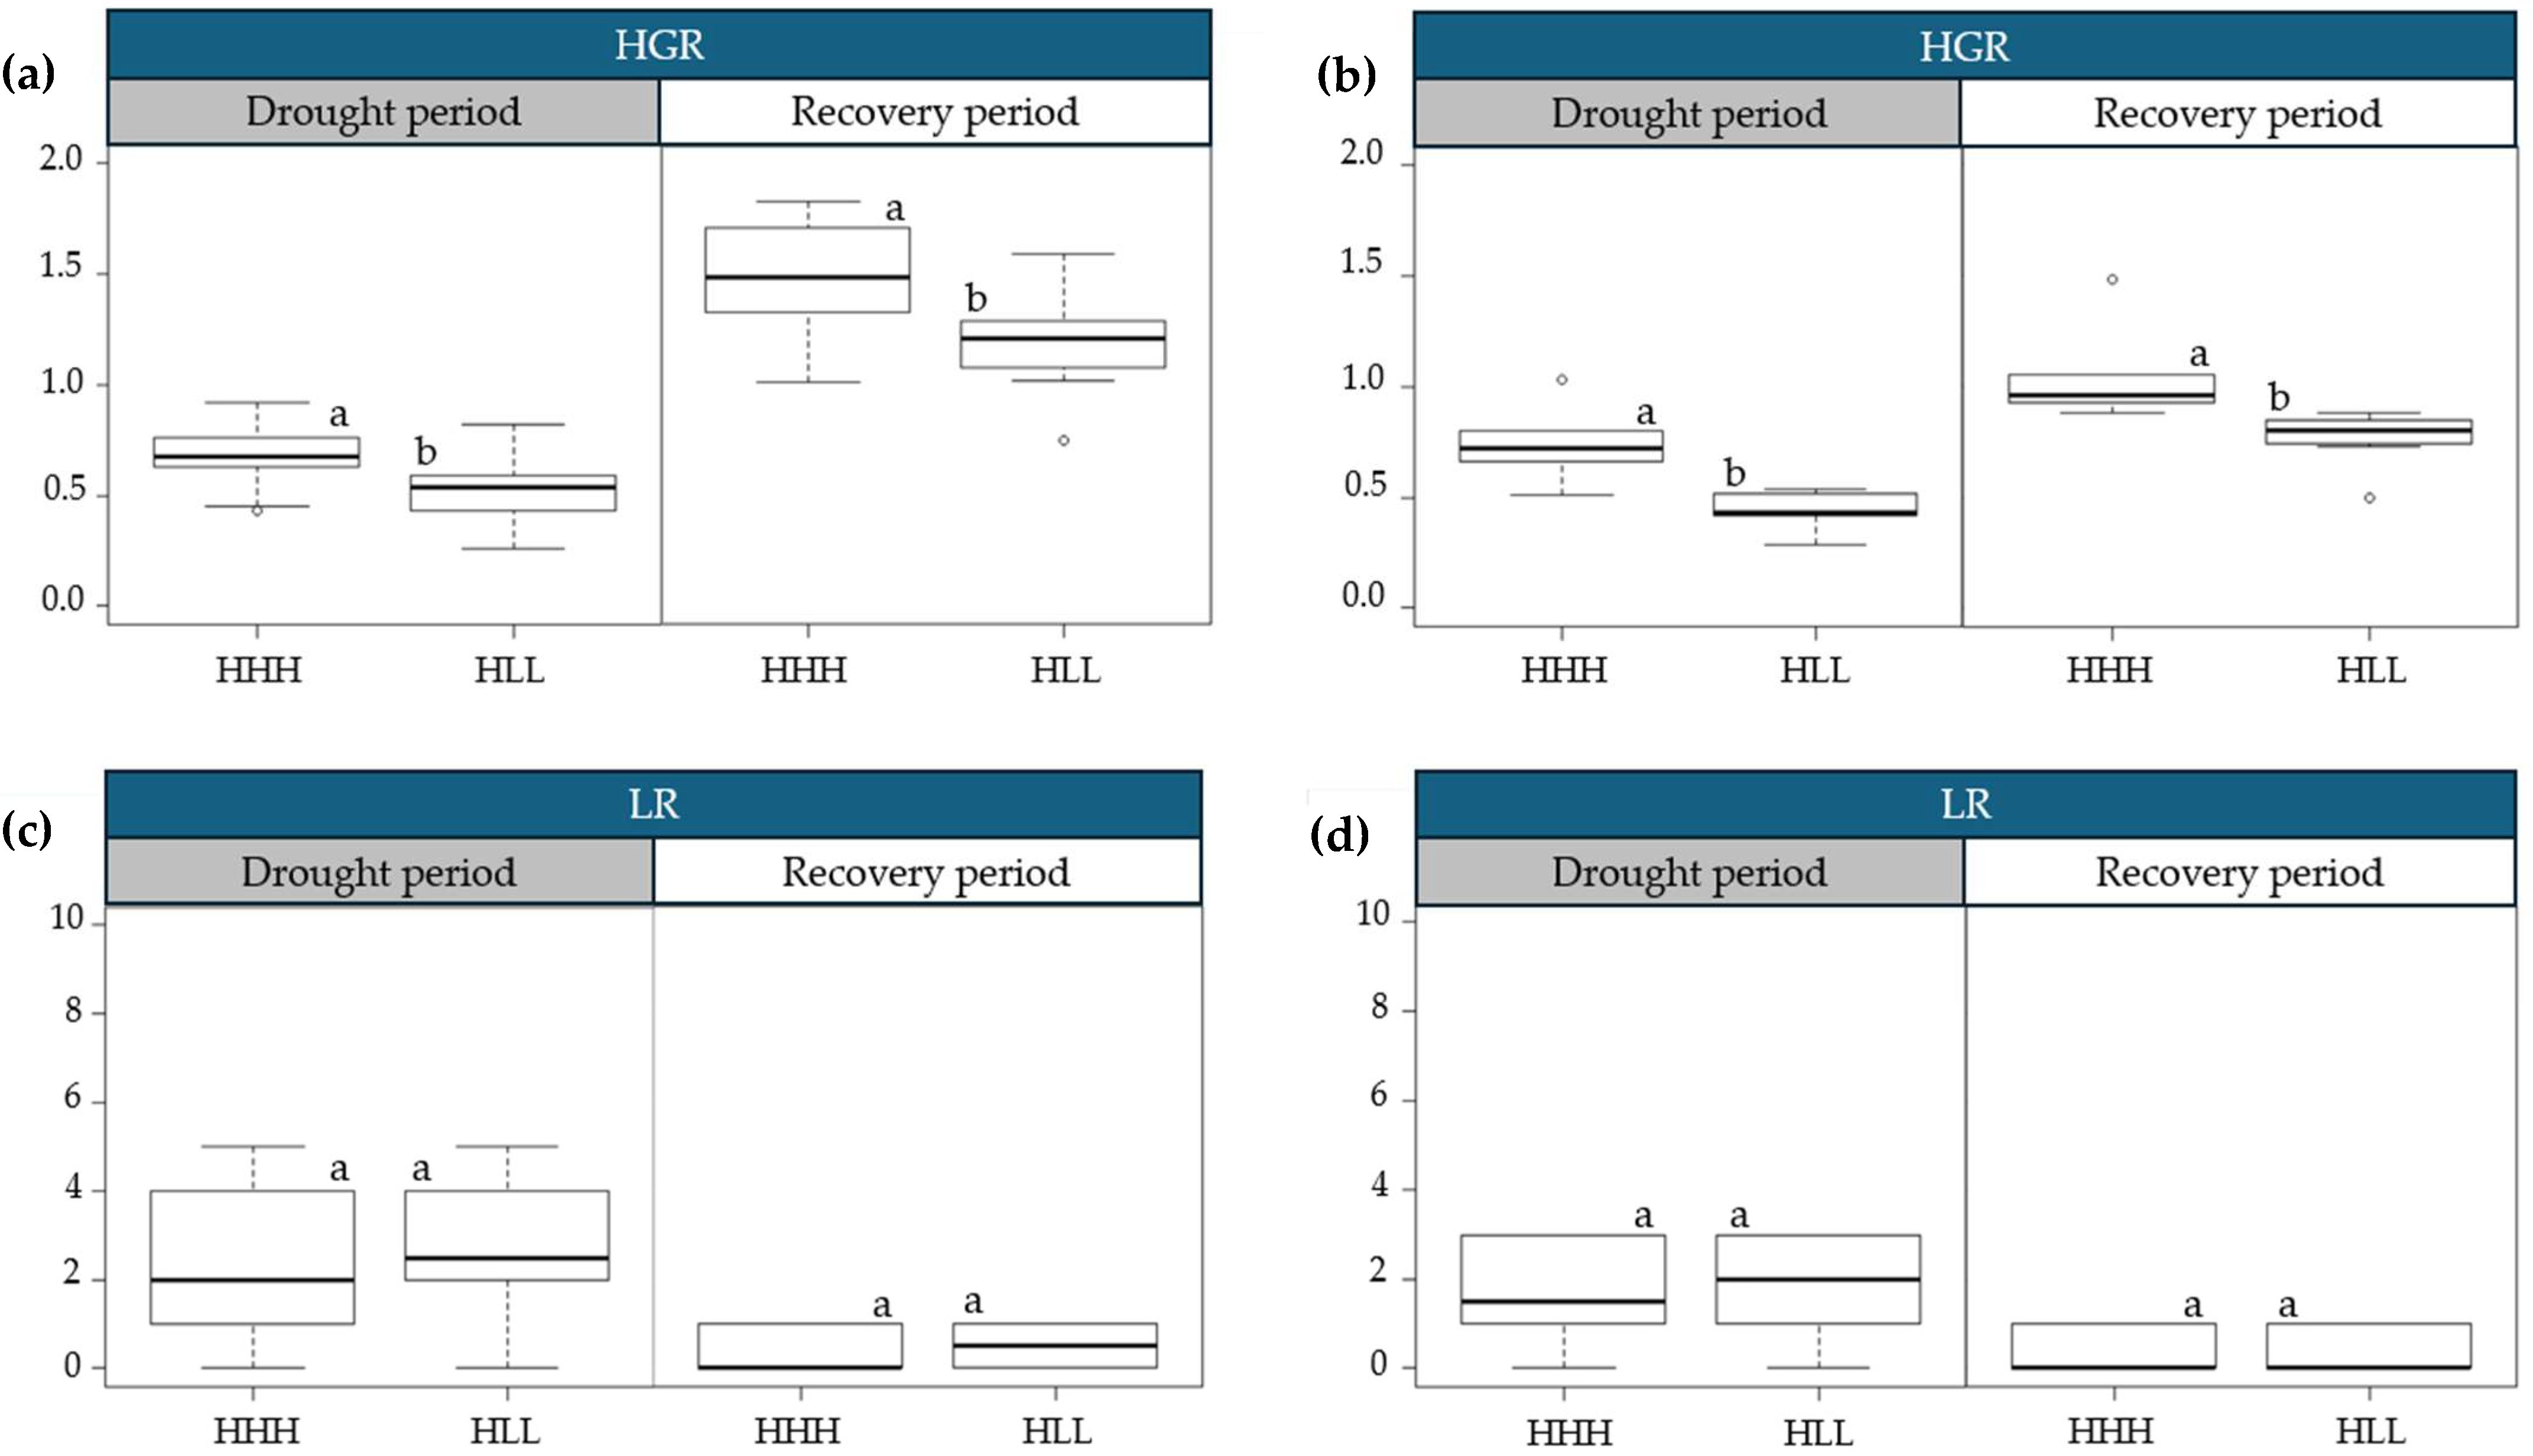
Variations in morpho-physiological traits were observed among the sugarcane groups during both the drought and recovery periods (Figure 4 and Figure 5). During the drought period, HGR, SCMR, and NDVI traits exhibited significant differences among the groups. The HHH group showed the highest HGR, with values of 0.68 cm day−1 in sandy loam soil and 1.03 cm day−1 in loam soil, whereas the HLL group recorded the lowest values, at 0.26 cm day−1 in sandy loam soil and 0.29 cm day−1 in loam soil.
Similarly, the HHH group exhibited the highest SCMR values, 42.09, and NDVI values, 0.5849, in sandy loam soil, as well as the highest SCMR values, 47.90, and NDVI values, 0.6245, in loam soil. In contrast, the HLL group displayed the lowest SCMR values, 35.00, and NDVI values, 0.5094, in sandy loam soil, as well as the lowest SCMR values, 35.9, and NDVI values at 0.5197 in loam soil.

2.3. Hierarchical Clustering of Sugarcane Genotypes Based on Physiological Traits

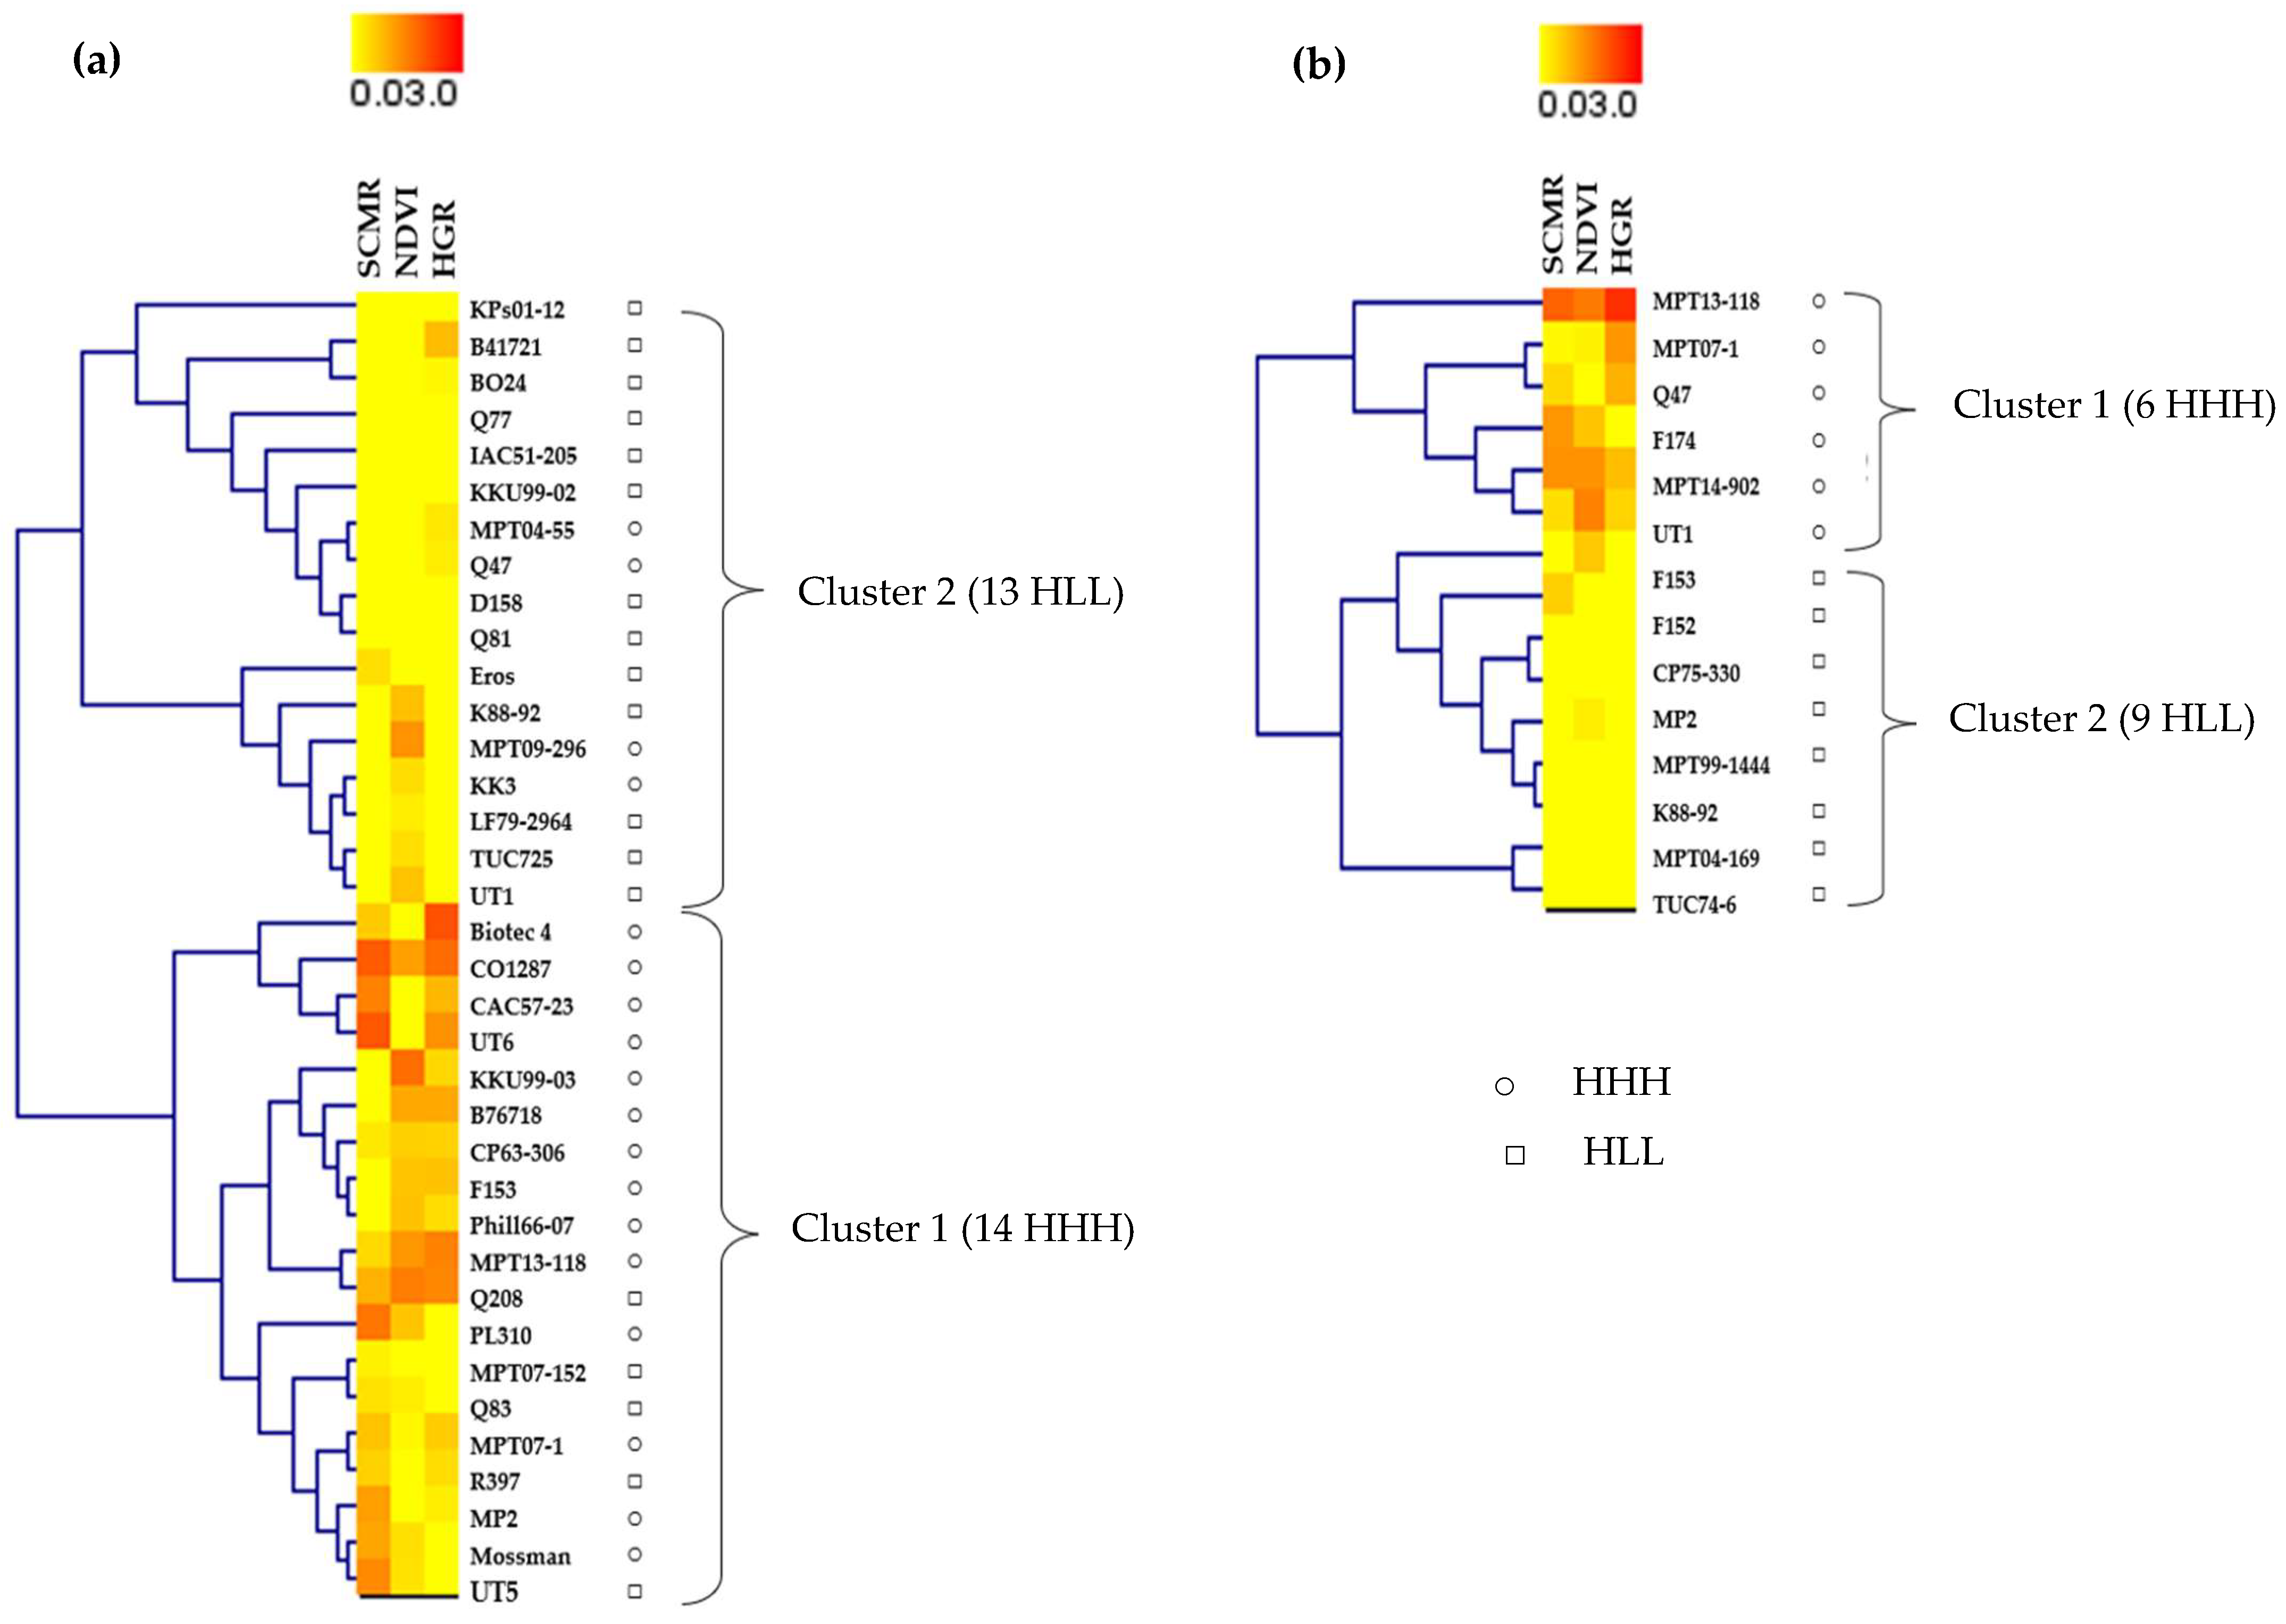
Hierarchical clustering analysis was conducted using the UPGMA algorithm and a heatmap to cluster sugarcane genotypes based on their responses to drought treatments. This analysis utilized three traits (SCMR, NDVI, and HGR) measured at 3-month intervals. As a result, 36 sugarcane genotypes in sandy loam (Figure 6a) and 15 sugarcane genotypes in loam soil (Figure 6b) were reclassified into two clusters, each reflecting distinct responses to drought conditions. Genotypes with similar physiological responses to drought stress were grouped within the same cluster, with SCMR, NDVI, and HGR predominantly characterizing cluster 1. The first phenotype was represented by sugarcane genotypes in cluster 1, which exhibited a stay-green phenotype by sustaining their green leaf area throughout the experiment. However, genotypes also maintained SCMR, NDVI, and HGR in cluster 1 during drought. Furthermore, the results revealed that one genotype in clusters 14 and 6 (in sandy loam and loam soils, respectively) belonged to the HHH group. Conversely, 1 genotype in cluster 2, which formed 13 genotypes in sandy loam soil and 9 genotypes in loam soil, was associated with the HLL group.
Regarding the potential yield in the drought-stressed field experiment performed to evaluate the potential for productivity in drought conditions, the highest cane yield was observed in cluster 1, with 70.11 tons ha−1 in sandy loam soil, followed by 68.34 tons ha−1 in loam soil. Cluster 1 also exhibited higher NDVI, HGR, and cane yield than cluster 2 during drought and recovery across both soil types. The percentage difference in cane yield was higher in location 1 than in location 2 (Table 1).

2.4. Relationships Among Cane Yield and Physiological Traits

The Pearson correlation coefficient was calculated to determine the degree of relationships among cane yield and physiological traits (drought tolerance index (DTI), SCMR, NDVI, and HGR) (Figure 4). Cane yield exhibited a significant correlation with the DTI (r = 0.94 **), SCMR (r = 0.36 *), NDVI (r = 0.46 **), and HGR (r = 0.47 **) in sandy loam soil. DTI exhibited a significant correlation with cane yield (CY) (r = 0.87 **), SCMR (r = 0.67 **), NDVI (r = 0.68 **), and HGR (r = 0.82 **) in loam soil. However, NDVI had a non-significant correlation with HGR in both soil types (Figure 7).

3. Discussion

3.1. Physiological Variations in Progressive Drought Stress and Recovery

The large agricultural regions, particularly in tropical and subtropical zones, are expected to experience increased variability in rainfall patterns and prolonged dry periods [23,24,25], which pose significant challenges to limit sugarcane growth and productivity [11,26,27]. Drought-tolerant sugarcane genotypes possess mechanisms that enable them to survive and thrive in water-limited environments while maintaining high cane yields [11]. The maintenance of growth enhances the plant’s capacity to adapt to water deficit stress by modulating nutrient allocation and photosynthetic activity. Moreover, continued growth facilitates the sustained productivity of the crop under drought conditions [11,28]. Drought stress adversely affects key physiological indices in plants, including Fv/Fm, SCMR, and pigment content, all of which tend to decrease under such conditions. These indicators provide valuable insights into plant health and stress responses, supporting the effective development of drought-tolerant cultivars [29]. The HHH group employs three acclimation strategies to sustain high cane yields. This group maintained SCMR and NDVI during the water-stress period (Figure 4a,b,e,f and Table 1). Additionally, all sugarcane cultivars exhibited no significant variation in Fv/Fm (Figure 5c,d). The morpho-physiological traits of sugarcane genotypes determine phenotypic variability in their responses to recovery and drought treatments throughout the growth phase [30,31,32]. Drought stress during the early growth stage significantly affected almost all growth parameters [28]. The results indicated that growth-related traits (HGR) and photosynthesis-related traits (SCMR and NDVI) were affected under early drought stress conditions. This is consistent with the findings of Dinh et al. [33], who reported that drought stress significantly reduced plant height and SPAD chlorophyll meter reading (SCMR) in sugarcane under drought stress at the early growth stage. However, SCMR could fully recover after the drought period, in contrast to HGR and NDVI [10,14]. The drought-tolerant sugarcane genotype exhibits high NDVI under water-stress conditions [34]. Drought-tolerant sugarcane clones have been found to sustain elevated SCMR values, which correlate with improved cane yield and higher stress tolerance indices under water-limited conditions [35]. Therefore, drought-tolerant sugarcane cultivars exhibited high SCMR values, indicating their capacity to preserve chlorophyll levels during drought stress [36]. In addition, the previous report by Masoabi et al. [37] indicates that the drought-tolerant sugarcane cultivar maintains a high Fv/Fm value during both moderate and severe water deficit stress. Although physiological traits such as SCMR and Fv/Fm decline during drought periods [20], their effective recovery supports photosynthetic capacity and contributes to sugarcane productivity during recovery [38]. Furthermore, a high NDVI value under drought conditions demonstrates enhanced water use efficiency, consistent carboxylation efficiency, and a robust antioxidant system that reduces reactive oxygen species, thereby supporting photosynthesis and promoting plant recovery after drought [34].

3.2. Hierarchical Clustering of Sugarcane Genotypes Based on Physiological Traits

Under drought-stressed conditions, Cluster 1 showed the highest cane yield, with 70.11 tons/ha in sandy loam and 68.34 tons/ha in loam soil. Cluster 1 also outperformed Cluster 2 in NDVI, HGR, and cane yield during both drought and recovery phases across both soil types. Additionally, the yield difference between clusters was greater in location 1 than in location 2 (Table 1). The research is consistent with Wirojsirasak et al. [14], who presented that under drought conditions, the traits in group I (Fv/Fm and SCMR) displayed strong positive correlations among themselves, while showing negative correlations with traits in group II. An increase in photosynthetic attributes has been observed in drought-sensitive sugarcane genotypes [39,40]. Tolerance mechanisms are particularly effective under mild and moderate drought conditions because they enable plants to survive stress, maintain vital activities, and develop and preserve essential functions [40]. A study on HGR in a drought-tolerant sugarcane genotype by Khonghintaisong et al. [41] revealed an increase in the HGR pattern during the recovery period, identifying it as a key trait in enhancing sugarcane yield. HGR is a reliable trait that promotes sugarcane yield, as indicated by the positive correlation [41]. Jangpromma et al. [10] found that drought reduced height growth during water stress; however, the relative height growth rate (RHG) indicated the potential for increased height after recovery. Drought-tolerant genotypes exhibited better height and physiological traits recovery after drought conditions compared to sensitive cultivars [36,38].
The physiological process related to photosynthesis is crucial in crop yield, plant growth, and development. Drought during the early stages of plant development inhibits various physiological traits in plants [9,38,42]. In this study, drought significantly altered sugarcane photosynthesis by reducing SCMR and NDVI. Silva et al. [42] and Verma et al. [43] found that under drought stress, reductions in photosynthetic pigments (SCMR) occurred, while drought severity was mainly indicated by a decreasing NDVI trend [44].

3.3. Relationships Among Cane Yield and Physiological Traits

Cane yield showed a strong positive correlation with DTI (r = 0.94 **), SCMR (r = 0.36 *), NDVI (r = 0.46 **), and HGR (r = 0.47 **) in sandy loam soil. In loam soil, DTI was significantly correlated with CY (r = 0.87 **), SCMR (r = 0.67 **), NDVI (r = 0.68 **), and HGR (r = 0.82 **). However, NDVI and HGR did not show a significant correlation in both soil types (Figure 7). Drought simultaneously affects various morphological and physiological traits in plants. A single trait cannot fully reflect the complexity of drought tolerance mechanisms; therefore, it is necessary to consider multiple traits when selecting a drought-tolerant genotype. Based on the proposed morpho-physiological traits, hierarchical clustering analysis can provide insights into the interrelationships between genotypes and measured traits under various treatments [45]. SCMR, NDVI, and HGR were the most effective in selecting drought-tolerant genotypes. Drought-tolerant sugarcane genotypes showed enhanced HGR during recovery periods, which were positively correlated with cane yield under the early drought period [41]. In addition, CY in tolerant sugarcane genotypes is highly correlated with DTI and HGR under short-term and long-term drought periods [7], and there is a positive correlation between DTI and cane yield under strong drought tolerance [46]. Higher DTI values correlated with greater photosynthetic pigment content maintenance, as SCMR indicated [28]. Drought-tolerant sugarcane genotypes maintain higher SCMR and DTI values by employing mechanisms that help mitigate drought stress [28].
Drought stress is a major limiting factor for sugarcane productivity. The identification of reliable physiological traits is therefore crucial for breeding programs aimed at enhancing drought tolerance. This study found that height growth rate (HGR), Normalized Difference Vegetation Index (NDVI), and SPAD chlorophyll meter reading (SCMR) are effective non-destructive indicators for evaluating sugarcane genotypes under water-deficient conditions [47]. These traits allow for rapid assessment and are particularly suitable for large-scale germplasm screening. Their application enables the precise selection of drought-tolerant genotypes and supports the development and advancement of breeding populations with improved adaptability to drought-prone environments.

4. Materials and Methods

4.1. Plant Materials and Stress Treatment

The experiment was conducted under a field trial in a tropical climate zone. In the sandy loam soil (16.311328, 102.191785), sugarcane was planted and grown from November 2020 to November 2021, and planting in the loam soil (16.465202, 102.111236) was conducted from January 2021 to January 2022 at the Mitr Phol Innovation and Research Center, Chaiyaphum 36110, Thailand. The experiment was set up as a split-plot arrangement, with a randomized complete block design and two replications. The main plot consisted of two water applications: non-water-stress (CT) and drought conditions (DS) at the early growth stage. Water was supplied under the control condition (CT) through 3 irrigation events, with a total cumulative amount of 266.67 mm, which was sufficient to meet the water requirements of sugarcane. For drought conditions (DS), water was withheld from 0 to 4 months after planting and then re-watered during two irrigation events after 4 to 12 months. In sandy loam soil, the cumulative water amount under CT was 1932.86 mm, while under DS it was 1666.19 mm. In loam soil, the cumulative water amount under CT was 1670.95 mm, and under DS it was 1404.28 mm. The subplot included 120 sugarcane genotypes (Table S1) evaluated during the formative stage at two field locations. These genotypes exhibited varying degrees of drought tolerance, as evidenced by differences in cane yield and drought tolerance index under drought conditions. The soil samples were systematically collected from two experimental plots at depths of 15 cm and 30 cm to assess soil texture composition. The sandy loam with a composition of 70.86% sand, 23.47% silt, and 5.67% clay. In contrast, the loam soil contained 42.14% sand, 33.54% silt, and 24.32% clay.

4.2. Meteorological Condition Soil Moisture Measurements

Meteorological data were collected from November 2020 to January 2022. Rainfall, maximum and minimum temperatures were recorded daily throughout the experiment at the weather station at Mitr Phol Innovation and Research Center and Bua Phak Kwian field, Chaiyaphum 36110, Thailand. The distance between the weather station and the experiment was about 1.3 km and 1.0 km.
The soil moisture content (SMC) was measured 3, 6, and 9 months after planting using the auger gravimetric method at 0–45 cm depths in the soil. Soil samples were weighed and oven-dried at 105 °C for 48 h. The soil moisture content was calculated through the following equation:
Soil   moisture   content   ( % )   =   wet   weight dry   weight dry   weight   ×   100

4.3. Morpho-Physiological Measurements

Morpho-physiological data were collected at 3-month intervals under non-stress (CT) and drought conditions (DT): initially 3 months after water withholding, and subsequently after re-watering conducted between 6 and 9 months. Growth and physiological traits in this study were measured on three individual plants per plot. These three measurements were then averaged to represent the value for each plot. Growth-related traits were examined using the growth rates of plant height, specifically, the height growth rate (HGR). Photosynthesis-related traits were measured using the chlorophyll fluorescence ratio (Fv/Fm), and chlorophyll content was estimated using the SCMR and the normalized difference vegetation index (NDVI). Health-related leaf traits included the leaf rolling score (LR). Plant height was measured from the ground to the top visible dewlap (TVD); the HGR was calculated as follows [14,41]:
High   growth   rate   =   Δ H Δ T
ΔH represents the difference in plant height between the two measurements (plant height at 3 MAP minus height at 0 MAP), and ΔT represents the time interval between the two measurements (plant height at 3 MAP minus height at 0 MAP).
The Fv/Fm ratio was measured between 09:00 a.m. and 2:00 p.m. on cloudless days using a chlorophyll fluorescence meter [48] (Handy PEA, Hansatech Instrument Ltd., Norfolk, UK). The center of the leaf blade, as observed in the first and second fully expanded leaves from random sampling per plot using a leaf clip, was dark-adapted for 30 min before fluorescence measurements [14,49]. The leaf chlorophyll content (SCMR) was estimated without harm using a SPAD chlorophyll meter (SPAD-501, Minolta, Tokyo, Japan). Measurements were taken for the same leaf with the Fv/Fm ratio between 09:00 a.m. and 2:00 p.m. The average measurements were taken at each leaf’s bottom, middle, and tip [14]. The normalized difference vegetation index (NDVI) is a valuable tool for monitoring sugarcane health; however, its predictive accuracy for yield under drought is limited, necessitating further research to enhance its reliability in such scenarios. The measured center of the same leaf with FV/FM and SCMR.
Leaf rolling (LR) in drought-stressed plants was characterized by using a score scale ranging from 1 (healthy or unrolled leaf) to 5 (onion leaf or tight rolling) [14,50,51].

4.4. Statistical Analysis

Data were compiled using Microsoft Excel 365. The experimental data were subjected to an analysis of variance (ANOVA). Significant differences between means were assessed using the least significant difference (LSD) test at the 0.05 probability level in Statistix 10 software. The Pearson correlation coefficient between attributes was calculated using the R statistical program, version 4.3.2. Cluster sugarcane by calculating the standard deviation of traits, grouping genotypes with cane yield under both water conditions with DTI (use means and standard deviation), and using statistical methods like k-means clustering for analysis [14,52,53], employing the UPGMA algorithm in GENESIS software version 1.8.1.

5. Conclusions

The analysis of 120 sugarcane varieties identified two distinct groups based on yield potential and drought tolerance in loam and clay soils. The results highlight the critical differences in their responses to early drought conditions, underscoring the need for strategic variety selection.
The first group features varieties that achieve high yields in both irrigated and rainfed conditions, demonstrating a high drought tolerance index (HHH). Notable examples include Biotec4, CO1287, CAC57-23, UT6, KKU99-03, CP63-306, MPT07-1, and MPT13-118. In contrast, the second group shows high yields under irrigation but low performance in rainfed situations, leading to a low drought tolerance index (HLL) with varieties such as Kps01-12, BO24, and IAC51-205.
A strong positive correlation exists between cane yield, SCMR, NDVI, HGR, and DTI, reinforcing the importance of these traits in enhancing sugarcane production. Cluster 1 outperformed cluster 2 during early growth stages in drought, proving its adaptability.
By targeting HGR, SCMR, and NDVI, breeders can identify sugarcane varieties that perform well under early drought, enhancing industry productivity and sustainability.

Supplementary Materials

The following supporting information can be downloaded at https://www.mdpi.com/article/10.3390/stresses5030057/s1, Table S1: List of the 120 sugarcane genotypes accessions used in the study to characterize sugarcane germplasm for physiological and agronomic traits associated with drought tolerance across various soil types.

Author Contributions

Conceptualization, P.L., N.J., P.B., P.K.-a., W.W. and P.S.; methodology, P.L., N.J., P.B., W.W. and P.S.; validation, P.L., N.J. and P.S.; formal analysis, P.L.; investigation, P.L., P.B., P.K.-a., W.W. and P.S.; resources, P.K.-a., W.W. and P.S.; data curation, P.L.; writing—original draft preparation, P.K.-a. and P.S.; writing—review and editing, P.L. and P.S.; visualization, P.L. and P.S.; supervision, N.J., P.B. and P.S.; project administration, P.S. All authors have read and agreed to the published version of the manuscript.

Funding

This research was funded by the Mitr Phol Sugarcane Research Center Co., Ltd., Chaiyaphum, Thailand, and the Northeast Thailand Cane and Sugar Research Center (NECS), Khon Kaen University, Thailand.

Data Availability Statement

The data presented in this study are available within the article.

Acknowledgments

This study was supported by Mitr Phol Sugarcane Research Center Co., Ltd., Chaiyaphum, Thailand. Support for this research was also provided by the Northeast Thailand Cane and Sugar Research Center (NECS) and by funding from the Research and Innovation Department, Khon Kaen University.

Conflicts of Interest

Authors Phunsuk Laotongkam, Peeraya Klomsa-ard, and Warodom Wirojirasak were employed by the Mitr Phol Innovation and Research Center. The remaining authors declare that the research was conducted in the absence of any commercial or financial relationships that could be construed as potential conflicts of interest.

Abbreviations

The following abbreviations are used in this manuscript:
%Percentage
ΔHDifference in plant height between the two measurements
ΔTTime interval between the two measurements
a.m.Ante meridiem
°CDegree celsius
cmCentimeter
CTControl condition
CYCane yield
DSDrought condition
DTIDrought tolerance index
Fv/FmMaximum quantum efficiency of photosystem II photochemistry or chlorophyll fluorescence
HGRHeight growth rate
HHHHigh cane yield under irrigated conditions, high cane yield under rainfed conditions, and a high drought tolerance index
HLLHigh cane yield under irrigated conditions, low cane yield under rainfed conditions, and a low drought tolerance index
kmKilo metters
L1Sandy loam soil
L2Loam soil
LRLeaf rolling
LSDLeast significant difference test
MAPMonths after planting
NDVINormalized difference vegetation index
mmMillimeters
p.m.Post-meridiem
RHGRelative height growth rate
SCMRSPAD chlorophyll meter reading
SMCSoil moisture contents
ton/haTons per hectare
TVDTop visible dewlap

References

  1. Khonghintaisong, J.; Onkaeo, A.; Songsri, P.; Jongrungklang, N. Water use efficiency characteristics and their contributions to yield in diverse sugarcane genotypes with varying drought resistance levels under different field irrigation conditions. Agriculture 2024, 14, 1952. [Google Scholar] [CrossRef]
  2. Singh, S.K.; Katiyar, A. The economic importance of sugarcane: An imperative grass of Indian sub-continent. J. Exp. Zool. India 2016, 19, 401–406. [Google Scholar]
  3. Kapoor, D.; Bhardwaj, S.; Landi, M.; Sharma, A.; Ramakrishnan, M.; Sharma, A. The impact of drought in plant metabolism: How to exploit tolerance mechanisms to increase crop production. Appl. Sci. 2020, 10, 5692. [Google Scholar] [CrossRef]
  4. Khonghintaisong, J.; Songsri, P.; Jongrungklang, N. Growth and physiological patterns of sugarcane cultivars to mimic drought conditions in late rainy season system. Naresuan Univ. J. Sci. Technol. 2017, 2, 102–112. [Google Scholar]
  5. Kyei-Mensah, C.; Kyerematen, R.; Adu-Acheampong, S. Impact of rainfall variability on crop production within the Worobong ecological area of Fanteakwa district, Ghana. Adv. Agric. 2019, 7930127. [Google Scholar] [CrossRef]
  6. Wu, Q.; Li, A.; Zhao, P.; Xia, H.; Zhang, Y.; Que, Y. Theory to practice: A success in breeding sugarcane variety YZ08–1609 known as the King of Sugar. Front. Plant Sci. 2024, 15, 1413108. [Google Scholar] [CrossRef]
  7. Tippayawat, A.; Jogloy, S.; Vorasoot, N.; Jongrungklang, N.; Kimbeng, C.A.; Jifon, J.L.; Khonghintaisong, J.; Songsri, P. Timing and duration of drought differentially affect growth and yield components among sugarcane genotypes. Plants 2025, 14, 796. [Google Scholar] [CrossRef]
  8. Manivong, P.; Bourgois, E. White Paper: Thai Sugarcane Sector and Sustainability. Available online: https://bonsucro.com/white-paper-thai-sugarcane-industry-sustainability-released/ (accessed on 25 August 2025).
  9. Reyes, J.A.O.; Carpentero, A.S.; Santos, P.J.A.; Delfin, E.F. Effects of water regime, genotype, and formative stages on the agro-physiological response of sugarcane (Saccharum officinarum L.) to drought. Plants 2020, 9, 661. [Google Scholar] [CrossRef]
  10. Jangpromma, N.; Thammasirirak, S.; Jaisil, P.; Songsri, P. Effects of drought and recovery from drought stress on above ground and root, root growth, and water use efficiency in sugarcane (Saccharum officinarum L.). Aust. J. Crop Sci. 2012, 6, 1298–1304. [Google Scholar]
  11. Ferreira, T.H.S.; Tsunada, M.S.; Bassi, D.; Araujo, P.; Mattiello, L.; Guidelli, G.V.; Righetto, G.L.; Gonçalves, V.R.; Lakshmanan, P.; Menossi, M. Sugarcane water stress tolerance mechanisms and its implications on developing biotechnology solutions. Plant Sci. 2017, 8, 1077. [Google Scholar] [CrossRef] [PubMed]
  12. Queiroz, R.J.B.; dos Santos, D.M.M.; Ferraudo, A.S.; Carlin, S.D.; Silva, M.D.A. Biochemical and physiological responses of sugarcane cultivars to soil water deficiencies. Sci. Agric. 2011, 68, 469–476. [Google Scholar] [CrossRef]
  13. Bunce, J. Leaf gas exchange and photosystem II fluorescence responses to CO2 cycling. Plants 2023, 12, 1620. [Google Scholar] [CrossRef]
  14. Wirojsirasak, W.; Songsri, P.; Jongrungklang, N.; Tangphatsornruang, S.; Klomsa-ard, P.; Ukoskit, K. Determination of morpho-physiological traits for assessing drought tolerance in sugarcane. Plants 2024, 13, 1072. [Google Scholar] [CrossRef]
  15. da Graca, J.; Rodrigues, F.; Farias, J.; Oliveira, M.; Hoffmann-Campo, C.; Zingaretti, S. Physiological parameters in sugarcane cultivars submitted to water deficit. Braz. J. Plant Physiol. 2010, 22, 189–197. [Google Scholar] [CrossRef]
  16. Supavetch, S. In-season yield prediction and monitoring of sugarcane using cumulative growth of normalized difference vegetation index. In Proceedings of the 2022 IEEE Mediterranean and Middle-East Geoscience and Remote Sensing Symposium (M2GARSS), Istanbul, Turkey, 7–9 March 2022; pp. 173–176. [Google Scholar]
  17. Gunnula, W.; Kosittrakun, M.; Righetti, T.L.; Weerathaworn, P. Relationship between MODIS NDVI and rainfall patterns for sugarcane farmers’ fields in northeastern Thailand. Aust. J. Crop Sci. 2011, 5, 1845–1851. [Google Scholar]
  18. Janpuk, T.; Pinata, P.; Klomsa-Ard, P.; Jongrungklang, N.; Nanta, N.; Bootprom, N.; Songsri, P. Evaluation of Genetic Diversity in Sugarcane Germplasm Based on Physiological and Agronomic Traits. Kaen Kaset=Khon Kaen Agric. J. 2019, 47, 761–772. [Google Scholar]
  19. Zhou, L.; Wang, S.; Chi, Y.; Li, Q.; Huang, K.; Yu, Q. Responses of photosynthetic parameters to drought in subtropical forest ecosystem of China. Sci. Rep. 2015, 5, 18254. [Google Scholar] [CrossRef]
  20. Kumar, R.A.; Vasantha, S.; Tayade, A.S.; Anusha, S.; Geetha, P.; Hemaprabha, G. Physiological efficiency of sugarcane clones under water-limited conditions. Trans. ASABE 2020, 63, 133–140. [Google Scholar] [CrossRef]
  21. Zhao, D.; Irey, M.; LaBorde, C.; Hu, C.-J. Physiological and yield characteristics of 18 sugarcane genotypes grown on sand soil. Crop Sci. 2019, 59, 2741–2751. [Google Scholar] [CrossRef]
  22. Mubeen, M.; Ahmed, M.; Ijaz, M.; Mehmood, K.; Javed, H.U.; Ali, Q.; Batool, A. Comparative analysis of growth and physiological responses of sugarcane elite genotypes to water stress and sandy loam soils. Plants 2023, 12, 2759. [Google Scholar] [CrossRef]
  23. Vicente-Serrano, S.M.; Beguería, S.; López-Moreno, J.I. A review of environmental droughts: Increased risk under global warming. Earth Sci. Rev. 2020, 200, 102953. [Google Scholar] [CrossRef]
  24. Faranda, D.; Vrac, M.; Yiou, P. ClimaMeter: Contextualizing extreme weather in a changing climate. Weather Clim. Dyn. 2024, 5, 959–978. [Google Scholar] [CrossRef]
  25. Mahajan, S.; Tuteja, N. Cold, salinity and drought stresses: An overview. Arch. Biochem. Biophys. 2005, 444, 139–158. [Google Scholar] [CrossRef]
  26. Lobell, D.B.; Schlenker, W.; Costa-Roberts, J. Climate trends and global crop production since 1980. Science 2011, 333, 616–620. [Google Scholar] [CrossRef]
  27. Contiliani, D.F.; Nebo, J.F.C.d.O.; Ribeiro, R.V.; Landell, M.G.d.A.; Pereira, T.C.; Ming, R.; Figueira, A.; Creste, S. Drought-triggered leaf transcriptional responses disclose key molecular pathways underlying leaf water use efficiency in sugarcane (Saccharum spp.). Front. Plant Sci. 2023, 14, 1182461. [Google Scholar] [CrossRef]
  28. Khuynh, B.T.; Thang, V.N.; Chinh, V.D.; Thom, P.T. Growth and physiological responses of sugarcane to drought stress at an early growth stage. Vietnam J. Agric. Sci. 2019, 2, 451–460. [Google Scholar] [CrossRef]
  29. Shin, Y.K.; Bhandari, S.R.; Jo, J.S.; Song, J.W.; Lee, J.G. Effect of drought stress on chlorophyll fluorescence parameters, phytochemical contents, and antioxidant activities in lettuce seedlings. Horticulturae 2021, 7, 238. [Google Scholar] [CrossRef]
  30. Kaura, V.; Malhotra, P.K.; Mittal, A.; Sanghera, G.S.; Kaur, N.; Bhardwaj, R.D.; Cheema, R.S.; Kaur, G. Physiological, biochemical, and gene expression responses of sugarcane under cold, drought and salt stresses. J. Plant Growth Regul. 2023, 42, 6367–6376. [Google Scholar] [CrossRef]
  31. Silva, M.D.A.; Jifon, J.L.; Da Silva, J.A.; Sharma, V. Use of physiological parameters as fast tools to screen for drought tolerance in sugarcane. Braz. J. Plant Physiol. 2007, 19, 193–201. [Google Scholar] [CrossRef]
  32. Abbas, S.R.; Ahmad, S.D.; Sabir, S.M.; Shah, A.H. Detection of drought tolerant sugarcane genotypes (Saccharum officinarum) using lipid peroxidation, antioxidant activity, glycine-betaine and proline contents. J. Soil Sci. Plant Nutr. 2014, 14, 233–243. [Google Scholar] [CrossRef]
  33. Dinh, H.T.; Watanable, K.; Takaragawa, H.; Kawamitsu, Y. Effects of drought stress at early growth stage on response of sugarcane to different nitrogen application. Sugar Tech 2018, 20, 420–430. [Google Scholar] [CrossRef]
  34. Rao, M.; Rao, P.; Charumathi, C.; Adilakshmi, A.; Devi, C.; Bharathalakshmi, B. Sugarcane Clones for soil moisture stress/drought conditions of Andhra Pradesh. Theor. Biol. Forum 2023, 12, 400–407. [Google Scholar]
  35. Khuimphukhieo, I.; Bhandari, M.; Enciso, J.; Da Silva, J.A. Assessing drought stress of sugarcane cultivars using Unmanned Vehicle System (UAS)-Based vegetation indices and physiological parameters. Remote Sens. 2024, 16, 1433. [Google Scholar] [CrossRef]
  36. Masoabi, M.; Snyman, S.; Van Der Vyver, C. Characterisation of an ethyl methanesulfonate-derived drought-tolerant sugarcane mutant line. Ann. Appl. Biol. 2023, 182, 343–360. [Google Scholar] [CrossRef]
  37. Devi, K.; Gomathi, R.; Kumar, R.A.; Manimekalai, R.; Selvi, A. Field tolerance and recovery potential of sugarcane varieties subjected to drought. Indian J. Plant Physiol. 2018, 23, 271–282. [Google Scholar] [CrossRef]
  38. De Almeida Silva, M.; Jifon, J.L.; Sharma, V.; Da Silva, J.a.G.; Caputo, M.M.; Damaj, M.B.; Guimarães, E.R.; Ferro, M.I.T. Use of physiological parameters in screening drought tolerance in sugarcane genotypes. Sugar Tech 2011, 13, 191–197. [Google Scholar] [CrossRef]
  39. Zhang, Y.B.; Yang, S.L.; Dao, J.M.; Deng, J.; Shahzad, A.N.; Fan, X.; Li, R.D.; Quan, Y.J.; Bukhari, S.A.H.; Zeng, Z.H. Drought-induced alterations in photosynthetic, ultrastructural and biochemical traits of contrasting sugarcane genotypes. PLoS ONE 2020, 15, e0235845. [Google Scholar] [CrossRef]
  40. Tardieu, F. Any trait or trait-related allele can confer drought tolerance: Just design the right drought scenario. J. Exp. Bot. 2012, 63, 25–31. [Google Scholar] [CrossRef]
  41. Khonghintaisong, J.; Songsri, P.; Jongrungklang, N. Understanding growth rate patterns among different drought resistant sugarcane cultivars during plant and ratoon crops encountered water deficit at early growth stage under natural field conditions. Agronomy 2021, 11, 2083. [Google Scholar] [CrossRef]
  42. De Almeida Silva, M.; Jifon, J.L.; Santos, C.M.D.; Jadoski, C.J.; Da Silva, J.a.G. Photosynthetic capacity and water use efficiency in sugarcane genotypes subject to water deficit during early growth phase. Braz. Arch. Biol. Technol. 2013, 56, 735–748. [Google Scholar] [CrossRef]
  43. Verma, K.K.; Song, X.P.; Zeng, Y.; Li, D.M.; Guo, D.J.; Rajput, V.D.; Chen, G.L.; Barakhov, A.; Minkina, T.M.; Li, Y.R. Characteristics of leaf stomata and their relationship with photosynthesis in Saccharum officinarum under drought and silicon application. ACS Omega 2020, 5, 24145–24153. [Google Scholar] [CrossRef]
  44. Sultana, M.S.; Gazi, M.Y.; Mia, M.B. Multiple indices based agricultural drought assessment in the northwestern part of Bangladesh using geospatial techniques. Environ. Chall. 2021, 4, 100120. [Google Scholar] [CrossRef]
  45. Balbaa, M.G.; Osman, H.T.; Kandil, E.E.; Javed, T.; Lamlom, S.F.; Ali, H.M.; Kalaji, H.M.; Wróbel, J.; Telesinski, A.; Brysiewicz, A.; et al. Determination of morpho-physiological and yield traits of maize inbred lines (Zea mays L.) under optimal and drought stress conditions. Front. Plant Sci. 2022, 13, 959203. [Google Scholar] [CrossRef]
  46. Endres, L.; Santos, C.M.D.; Souza, G.V.D.; Menossi, M.; Santos, J.C.M.D. Morphological changes recorded in different phenophases of sugarcane plants subjected to water stress in tropical field conditions. Aust. J. Crop Sci. 2018, 12, 1041–1050. [Google Scholar] [CrossRef]
  47. Harakotr, P.; Sornpha, W.; Khonghintaisong, J.; Gonkhamdee, S.; Songsri, P.; Jongrungklang, N. Correlation Between Rapid Measurement and Leaf Chlorophyll Content of Various Sugarcane Genotypes at Different Growth Phases. Asian J. Plant Sci. 2024, 23, 367–376. [Google Scholar] [CrossRef]
  48. Maxwell, K.; Johnson, G.N. Chlorophyll fluorescence-a practical guide. J. Exp. Bot. 2000, 51, 659–668. [Google Scholar] [CrossRef] [PubMed]
  49. Murchie, E.H.; Lawson, T. Chlorophyll fluorescence analysis: A guide to good practice and understanding some new applications. J. Exp. Bot. 2013, 64, 3983–3998. [Google Scholar] [CrossRef]
  50. Lean, F.L.; Ismail, M.; Berahim, Z.; Rahman, M.; Islam, M. Physiological and molecular characterization of drought responses and screening of drought tolerant rice varieties. Biosci. J. 2015, 31, 709–718. [Google Scholar] [CrossRef]
  51. Cal, A.J.; Sanciangco, M.; Rebolledo, M.C.; Luquet, D.; Torres, R.O.; McNally, K.L.; Henry, A. Leaf morphology, rather than plant water status, underlies genetic variation of rice leaf rolling under drought. Plant Cell Environ. 2019, 42, 1532–1544. [Google Scholar] [CrossRef] [PubMed]
  52. Kang, S.A.; Muhammad, N.; Farooq Ahmad, K.; Farasat, S. Divergence analysis and association of some economical characters of sugarcane (Saccharum officinarum L.). J. Plant Breed. Genet. 2013, 1, 1–6. [Google Scholar]
  53. Carretillo Moctezuma, C.D.; Guzmán Martínez, M.; Godínez-Jaimes, F.; García-Preciado, J.C.; Reyes Carreto, R.; Terrones Salgado, J.; Pérez Arriaga, E. Growth Curve Models and Clustering Techniques for Studying New Sugarcane Hybrids. AgriEngineering 2025, 7, 114. [Google Scholar] [CrossRef]
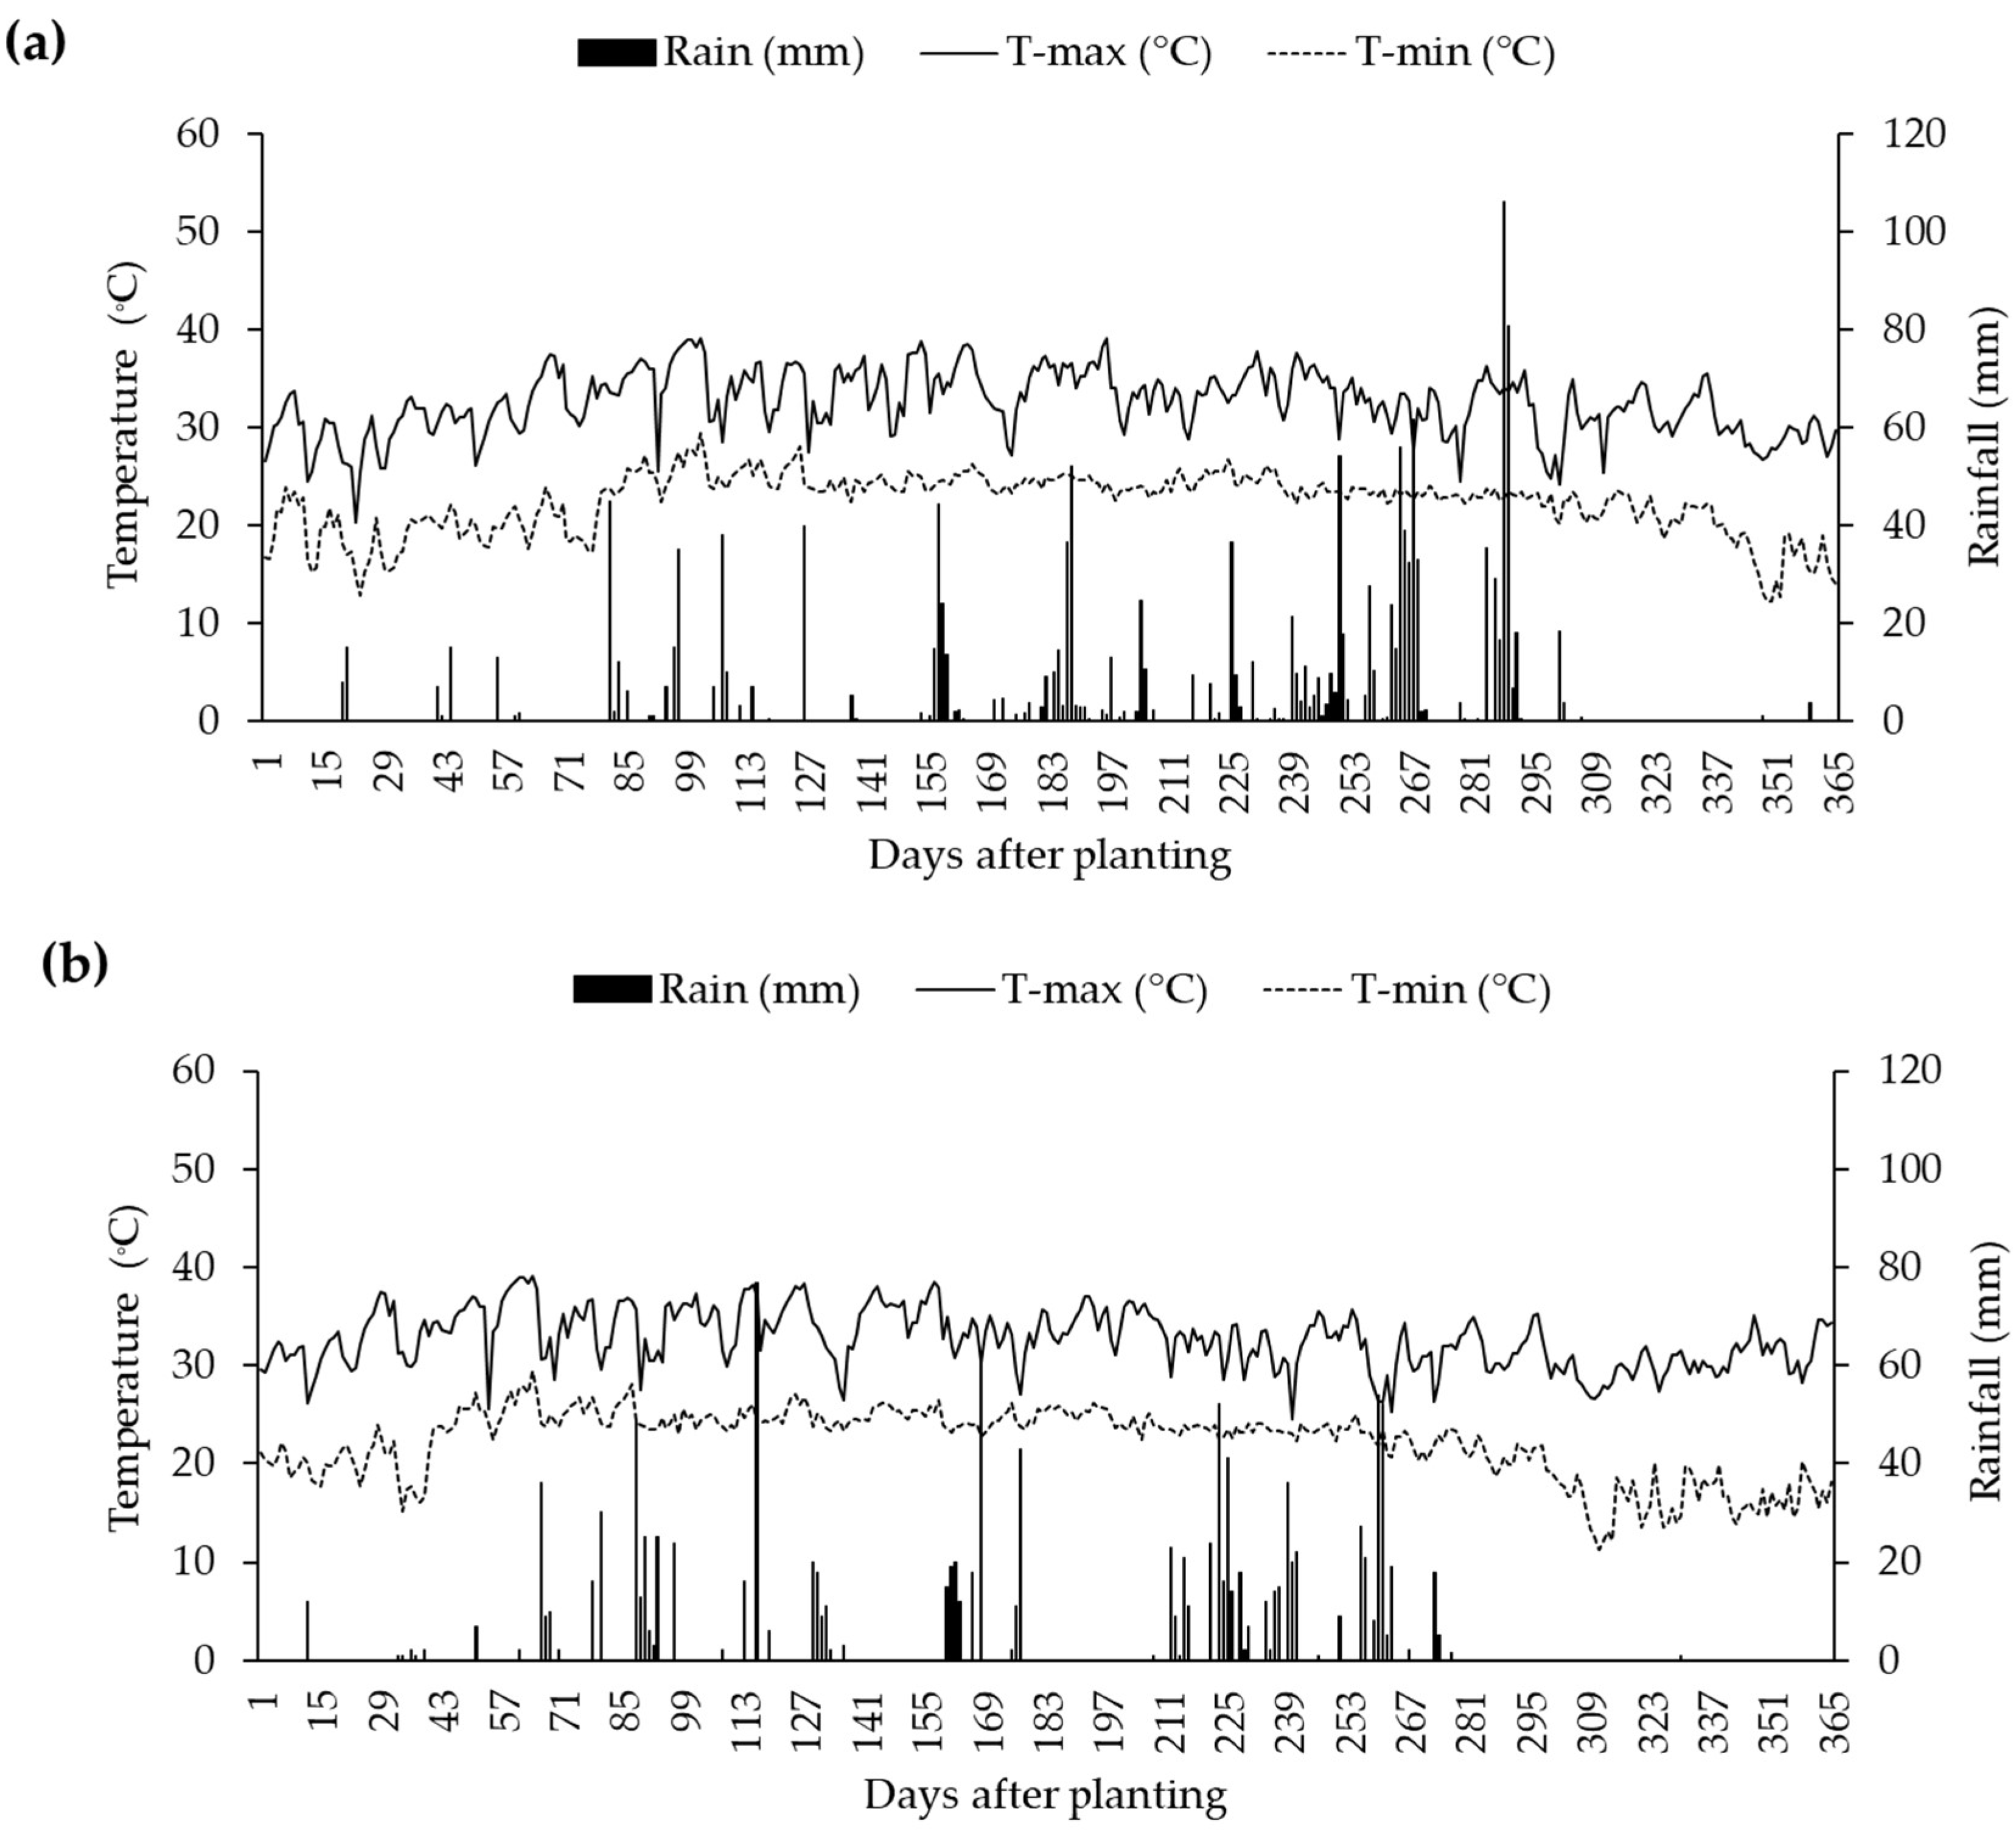
Figure 1. Rainfall (mm), maximum, and minimum temperature (°C) during the experimental period, spanning 1 to 365 days after planting under sandy loam soil (1 November 2020–1 November 2021) (a) and loam soil (1 January 2021–1 January 2022) (b).
Stresses 05 00057 g001
Figure 2. Soil moisture contents (%) under two soil water management regimes (non-water stress, CT, and drought conditions, DS) of 120 sugarcane genotypes with drought and recovery periods under sandy loam soil (a) and loam soil (b).
Stresses 05 00057 g002
Figure 3. Scatter plot of 120 sugarcane genotypes based on cane yield (ton/ha) under non-water-stress and drought conditions, and tolerance index determined over 3 months of water withholding. Relationship between cane yield in drought conditions and cane yield in non-water-stress conditions (ton/ha) in sandy loam soil (a) and relationship between cane yield in drought conditions (ton/ha) and drought tolerance index in sandy loam soil (b). Relationship between cane yield (ton/ha) in drought conditions and cane yield (ton/ha) in non-water-stress conditions in loam soil (c) and relationship between cane yield (ton/ha) in drought conditions and drought tolerance index in loam soil (d).
Stresses 05 00057 g003
Figure 4. SPAD chlorophyll meter reading (SCMR) in sandy loam soil (a) and loam soil (b), maximum quantum efficiency of photosystem II photochemistry the (Fv/Fm) in sandy loam soil (c) and loam soil (d), and normalized difference vegetation index (NDVI) in sandy loam soil (e) and loam soil (f) of cluster 1 (HHH) and cluster 2 (HLL) during drought and recovery periods. Different letters on the boxes indicate significant differences based on the least significant difference (LSD) test at p < 0.05. The box’s horizontal line represents the median.
Stresses 05 00057 g004
Figure 5. Height growth rate (HGR) in sandy loam soil (a) and loam soil (b), leaf rolling (LR) score in sandy loam soil (c) and loam soil (d) of cluster 1 (HHH) and cluster 2 (HLL) during drought and recovery periods. Different letters on the boxes indicate significant differences based on the least significant difference (LSD) test at p < 0.05. The box’s horizontal line represents the median.
Stresses 05 00057 g005
Figure 6. Heatmap and clustering based on three physiological traits under drought conditions determined over 3 months of water withholding in sandy loam (a) and loam soils (b).
Stresses 05 00057 g006
Figure 7. The correlation coefficients among agronomic and physiological traits, cane yield, and the percentage reduction in cane yield were measured in 120 sugarcane genotypes under drought conditions. **, * and ns indicate significance at p < 0.01, p < 0.05 and non-significant, respectively. A cane yield (CY), a drought tolerance index (DTI), an estimated chlorophyll content (SCMR) value, a normalized difference vegetation index (NDVI), and a height growth rate (HGR) are all used in this equation under sandy loam soil (a) and loam soil (b).
Stresses 05 00057 g007
Table 1. Physiological traits and percent change between sugarcane genotypes grown during drought and recovery periods.
ClusterDrought PeriodRecovery PeriodYield (ton/ha)
SCMRNDVIHGRSCMRNDVIHGR
L1L2L1L2L1L2L1L2L1L2L1L2L1L2
142.09 a44.83 a0.5849 a0.6013 a0.68 a0.75 a43.61 a45.71 a0.5904 a0.6115 a1.49 a1.01 a70.11 a68.34 a
239.46 b40.19 b0.5631 b0.5565 b0.52 b0.45 b41.57 a43.53 a0.5705 b0.5849 b1.21 b0.77 b34.35 b39.27 b
Difference (%)(−) 6.25(−) 10.35(−) 3.71(−) 7.45(−) 23.41(−) 40.36(−) 4.67(−) 4.77(−) 3.37(−) 4.34(−) 18.79(−) 23.51(−) 51.01(−) 42.54
Different letters indicate a significant difference according to the least significant difference (LSD) test at p < 0.05. SCMR, estimated chlorophyll content in SCMR units; NDVI, normalized difference vegetation index; HGR, height growth rate; L1, sandy loam soil; L2, loam soil.
Disclaimer/Publisher’s Note: The statements, opinions and data contained in all publications are solely those of the individual author(s) and contributor(s) and not of MDPI and/or the editor(s). MDPI and/or the editor(s) disclaim responsibility for any injury to people or property resulting from any ideas, methods, instructions or products referred to in the content.