Article

Interactive Effects of Ionophore Antibiotic Monensin and Polystyrene Microplastics on the Growth and Physiology of Microcystis aeruginosa

by
Behen Manawadu
,
Mudalige Don Hiranya Jayasanka Senavirathna
* and
Takeshi Fujino
Graduate School of Science and Engineering, Saitama University, 255 Shimo-okubo, Sakura-ku, Saitama 338-8570, Japan
*
Author to whom correspondence should be addressed.
Stresses 2025, 5(3), 43; https://doi.org/10.3390/stresses5030043
Submission received: 26 April 2025 / Revised: 17 June 2025 / Accepted: 22 June 2025 / Published: 1 July 2025
(This article belongs to the Section Plant and Photoautotrophic Stresses)

Abstract

This study was conducted to examine the combined effects of monensin (MS) and 3 µm polystyrene microplastics (PEMPs) on the growth and stress-associated physiological responses of Microcystis aeruginosa under controlled laboratory conditions [temperature: 20 ± 1 °C, lighting: (30 ± 4) µmol m−2 s−1 (12 h:12 h light–dark photoperiod), growth medium: BG-11]. The experiments included MS concentrations of 0, 50, 250, and 500 µg/L and PEMPs concentrations of 0.25, 1.25, and 6 mg/L. Measurements included optical density (OD730), chlorophyll ‘a’, cellular protein content, oxidative stress, and the activities of catalase (CAT) and guaiacol peroxidase (GPX). M. aeruginosa exhibited a significant increase in growth on day 7 at elevated MS concentrations across all PEMP levels. Similarly, MS and PEMP treatments had a significant interactive effect on cellular protein content on day 7. However, their combined effect on chlorophyll ‘a’ production was not significant. Oxidative stress measurements showed a dose-dependent decrease with increasing MS concentrations under PEMP administrations. Enzyme activity assays indicated that CAT activity increased while GPX activity decreased with higher MS concentrations. The results imply that co-contamination of PEMPs and MS has a significant impact on the growth and stress physiology of M. aeruginosa in aquatic ecosystems.

1. Introduction

Microcystis aeruginosa is recognized as one of the predominant bloom-forming cyanobacteria, widely distributed across aquatic ecosystems worldwide [1]. Harmful algal blooms (HABs) dominated by M. aeruginosa elevate the concentrations of toxins such as microcystins and odor-causing compounds like 2-methylisoborneol (2-MIB) and geosmin in freshwater bodies, posing significant risks to both human and animal health [2,3]. Oxidative stress is defined as a cellular condition arising from an imbalance between the generation and accumulation of reactive oxygen species (ROS) and the efficacy of the antioxidant defense mechanisms responsible for their detoxification [4]. Through evolutionary adaptation, M. aeruginosa has developed enhanced tolerance to environmental stresses by employing complex strategies such as colony formation to mitigate the effects of external stresses [5]. The accumulation of ROS in response to environmental stressors markedly disrupts the overall metabolic processes of cyanobacteria cells [6]. Previous studies have reported varied responses of M. aeruginosa to different abiotic stress factors. Experimental results on the effects of temperature variation on M. aeruginosa showed increased production of ROS at higher temperatures compared to lower temperatures. Furthermore, temperature fluctuations significantly affected intracellular chlorophyll ‘a’ concentration, ROS levels, and catalase (CAT) activity in M. aeruginosa [7]. Similarly, M. aeruginosa has exhibited varying stress responses to different water contaminants, including salts, antibiotics, and microplastics [8,9,10].
Agricultural runoff, particularly from livestock farming, introduces multiple stressors including veterinary antibiotics and microplastics that may synergistically affect cyanobacterial communities. Monensin (MS) is a polyether ionophore antibiotic that is widely used as livestock feed additive and extensively released into the environment via livestock manure [11]. MS has potential to increase the feed conversion efficiency of rumen digestion process of cattle and reduce the production of methane (CH4) by enteric fermentation, which supports regulation of greenhouse gas (GHG) emissions from the livestock sector [12,13]. MS contaminations near cattle farming operations are frequently reported and the estimated maximum theoretical concentration of MS near a lagoon was reported as 246 µg/L, assuming no degradation occurred [14]. Previous studies have reported MS concentration of 84 µg/L in wastewater from a beef cattle feedyard system and 40 µg/L of MS at a beef lagoon near cattle farming operations [15,16]. Presence of ionophores including MS in surface waters, ground water, bottom-sediments, and soil has been reported in all USA, Europe, and Asia regions [17]. However, the MS contamination levels in nearby aquatic environments could exceed the levels of ordinary veterinary antibiotics, since they are administered daily to cattle as feed additives with an administering dosage ranging 5–400 g/ton of feed [18]. Even with higher contamination levels around livestock farms, the secondary environmental impacts of prolonged MS use on surrounding ecosystems are not clearly defined.
Plastic contaminations have become a major ecological concern worldwide, leading to many adverse environmental and socioeconomic impacts. The impacts worsen with the long-term transformation of large plastics into microplastics (MPs, particle sizes ranging from 1 µm to 5 mm) and nano-plastics (NPs, particle size < 1 µm) as a result of the degradation process [19,20]. While many studies have focused on oceans, surface water bodies, landfill sites, and open dumpsites, the contribution of the livestock sector in releasing primary or secondary micro and nano-plastics (MNPs) has not been well highlighted. The main entry pathway of MPNs for livestock farms is contaminated surface water sources (rivers, lakes, ponds, and streams). In addition to these, plastic feed packages, synthetic bedding materials, feeders, and drinkers used on farms act as secondary contamination sources [21]. Agricultural field practices that use plastic mulches release MNPs during their degradation process [22]. These MNPs are predominantly detected as polypropylene, polyethylene, and polystyrene when considered on a global scale [23].
MS has interesting chemical properties incorporated with its molecular structure, if it is considered that the monensic acid (monohydrate) contains six oxygen atoms inside and five of them are able to form cation complexes with mono-valent metal ions. The cation forming capability varies as Na+ > K+ > Li+ > Rb+ > Cs+ respectively [24]. These metal-binding properties of monensin catalyze the exchange of Na+ and H+ ions across biological membranes [25]. These processes result in blocking the nutrition transport across the membrane and maintaining a pH difference across the membrane, especially in gram-positive bacteria. Also, the unbalanced Na+ and K+ distribution tends to activate the ATP, utilizing primary pumps to re-establish the ion balance in between the cell membrane. Prolonged ATP utilization under conditions of malnutrition depletes cellular energy reserves, creating additional stress to cells and ultimately leading to cell death [26]. However, cyanobacteria show a relatively lesser response to monensin due to gram-negative cell wall structure. Polystyrene (PE) is a kind of a polymer (C8H8)n derived from styrene. This is highly vulnerable to natural and artificial degradation [27]. The adsorption of antibiotics such as MS onto MPs is critical for assessing their combined toxicity. MPs have shown adsorption of antibiotics including amoxicillin, ciprofloxacin, and tetracycline that were in the freshwater systems, and polyethylene-based MPs showed the highest adsorption. The adsorption mechanisms have been identified as hydrophobic interactions, hydrogen bonds, electrostatic interactions, van der Waals bonds, and microporous filling mechanisms [28,29]. However, there is limited information available on the adsorption of ionophore antibiotics onto microplastics.
According to a previous experiment, M. aeruginosa showed significant increase in growth for 100, 200, and 500 µg/L of MS on the seventh day of the exposure period, revealing the positive impact of MS on the formation of M. aeruginosa-based HABs. Similarly, M. aeruginosa showed a significant decrease in chlorophyll ‘a’ production at 500 µg/L MS treatment and did not show any significant change in oxidative stress and antioxidant enzyme activities in between the 100–500 µg/L MS concentrations. However, 1000 and 2000 µg/L of MS showed a significant growth reduction and increased oxidative stress condition in M. aeruginosa followed by increased antioxidant activities, highlighting the typical antibacterial properties of monensin against M. aeruginosa [30]. However, the interactive effects of MS and polystyrene MPs in the nearby aquatic environments in livestock farming areas might alter the growth and physiological responses of M. aeruginosa compared to the individual MS treatment (Figure 1). Correspondingly, stress responses of M. aeruginosa under the interactive effects of ionophore antibiotic MS and 3 µm polystyrene MPs (PEMPs) remain unrevealed.
Therefore, the present study was conducted to evaluate the growth, oxidative stress levels, and antioxidant enzyme activities (CAT and GPX) of Microcystis aeruginosa under exposure to different concentrations of MS and PEMPs. The ultimate objective was to investigate the stress responses of M. aeruginosa to MS and PEMPs and to assess their potential impacts on aquatic ecosystems in areas near livestock farming.

2. Results

Microcystis aeruginosa treatment flasks were visually observed daily and after the 5th day of the treatment; among the treatment flasks, all three PEMP treatments (0.25, 1.25, and 6 mg/L) of 250 µg/L and 500 µg/L MS treatments showed a clear increase in green color compared to the 0 and 50 µg/L MS treatments. Microscopic observations (Keyence BZ–XB10, Itasca, IL, USA) were conducted on day 7, showing that PEMP particles remained attached to the cell clumps as well as freely dispersed in the growth medium (Figure 2).
Visual observation results were further confirmed by the OD730 values of day 5 and day 7 (Figure 3 and Figure 4). Even under the effect of PEMPs (0.25, 1.25, and 6 mg/L), MS has significantly promoted the growth of M. aeruginosa for 250 and 500 µg/L concentrations. When considering the OD730 distribution of day 3 (Figure 4a), under the effects of 6 mg/L PEMPs, OD730 has clearly reduced under the effect of 500 µg/L MS concentration, indicating the negative responses of M. aeruginosa cells under the increased level of two contaminants. However, this interaction was not statistically significant. Under these contamination levels at the 3rd day of the treatment, 250 µg/L MS and 0.25 mg/L PEMPs showed the highest mean OD730 value. According to the statistical analysis, none of the MS and PEMP combinations showed any statistically significant impact on the day 3 OD730 measurements. When it comes to the OD730 results of day 5 of the treatment (Figure 4b), all three treatment combinations of PEMPs showed elevated OD730 values for 250 and 500 µg/L MS treatments. Among those two treatment combinations, highest PEMP treatment (6 mg/L) showed the lowest OD730 value. Similarly, the lowest OD730 value for all treatment combinations was shown by the highest PEMP (6 mg/L) treatment of 0 µg/L MS treatment. According to the day 5 results, there is a statistically significant [F (3,12) = 14.06, p < 0.01] effect of MS treatment on the OD730 measurements. Even under the PEMP contaminations, M. aeruginosa demonstrated an increase in the OD730 distribution of day 7 (Figure 4c), representing a similar result to the day 7 outcomes of individual MS treatment [30]. Similarly, there is a statistically significant [F (3,12) = 27.50, p < 0.01] effect of MS treatment on the day 7 OD730 measurements. The considered levels of PEMPs did not show any statistically significant interactive effect on the OD730 measurements.
At day 3 of the treatment, cellular protein measurements (Figure 5) of 1.25 and 6 mg/L treatments showed a noticeable increase in cell protein for 50, 250, and 500 µg/L MS concentrations, demonstrating the positive impact of MS on the growth of M. aeruginosa. The MS and PEMP treatments showed a statistically significant [F (6,12) = 6.54, p < 0.01] interactive effect on the cellular protein contents of day 3 of the treatment. Day 5 cellular protein results (Figure 5b) showed a statistical significance [F (3,12) = 12.07, p < 0.01] for MS treatment, while day 7 results (Figure 5c) showed a statistically significant [F (6,12) = 3.38, p = 0.034] interactive effect. The day 7 results showed a significant increase in cellular protein contents compared to the control for increased MS under higher PEMP treatments, further demonstrating the positive effect of MS on the growth of M. aeruginosa. According to the grouped one-way ANOVA analysis, for the respective PEMP groups 1.25 and 6 mg/L, day 7 cellular protein measurements exhibited a significant (p < 0.05) increase for 250 and 500 µg/ L MS concentrations.
When considering the overall results for all three days (day 3, 5, and 7), increasing MS concentrations showed a dose-dependent decrease in chlorophyll ‘a’ production (Figure 6). On day 3, MS and PEMP treatments showed a statistically significant [F (6,12) = 8.63, p < 0.01] interactive effect on the chlorophyll ‘a’ production. However, the lowest chlorophyll ‘a’ production was observed from the highest MS and PEMP treatment combination. The day 5 and day 7 results did not show any statistically significant interactive effect, while the MS treatment has a statistically significant [F (3,12) = 6.762, p < 0.01] effect on the day 7 chlorophyll ‘a’ production.
H2O2 concentrations of the cells [H2O2 concentration (µM)/cell protein (µg)] were estimated as an indirect indicator of oxidative stress levels of M. aeruginosa. The MS and PEMP treatments exhibited an MS dose-dependent decrease in H2O2 concentration for higher (>50 µg/L) MS levels (Figure 7). All PEMP combinations resulted in lower H2O2 concentrations at 250 and 500 µg/L MS compared to their respective controls. Based on the statistical analysis, MS and PEMP treatments did not have any statistically significant interactive effect on H2O2 concentrations. However, MS treatment exhibited a statistically significant [F(3,12) = 52.91, p < 0.01] effect on H2O2 concentrations. According to the previous study, MS treatment did not show any statistically significant increased oxidative stress condition for 100, 200, and 500 µg/L MS concentrations [30]. However, this significant decrease in H2O2 concentration highlights the activation of antioxidant enzyme measures under the increased MS and PEMP contaminations. This finding was further supported by the increased CAT activities observed in the current experiment (Figure 8) at higher MS concentrations. The results showed a statistically significant interactive effect of MS and PEMP treatment, as confirmed by two-way ANOVA [F(6,12) = 14.70, p < 0.01], indicating that the changes in CAT activity were closely linked to both MS and PEMP treatments. GPX activity measurements (Figure 9) did not show any statistically significant interactive effect for MS and PEMP treatments. However, the individual treatment of MS showed a statistically significant [F(3,12) = 11.54, p < 0.01] effect on the GPX activity measurements.

3. Discussion

Microplastic (MP) contamination and HAB formation have emerged as significant global environmental concerns, posing potential risks to ecosystems, public health, and animal welfare [31,32]. MS is used as both a veterinary antibiotic and a livestock feed additive. Its administration as a feed additive aims to enhance feed conversion efficiency in cattle, ultimately reducing CH4 emissions from enteric fermentation [13]. However, inadequate livestock waste management practices and excessive use of MS have led to a significant increase in its environmental concentrations by converting it as an environmental stressor for other organisms [33].
Previous experimental results revealed that MS has a significant positive effect on the growth of M. aeruginosa. The highest growth was observed at 500 µg/L MS concentration according to the measurements of the 7th day of the experiment. MS concentrations of 1000 and 2000 µg/L significantly inhibited M. aeruginosa growth by the 7th day, exhibiting a significant increase in oxidative stress levels [30]. Therefore, the present study was conducted based on the MS concentration range that promoted M. aeruginosa growth to evaluate the impact of PEMPs under this enhanced growth. Previous experiment results on M. aeruginosa (FACHB905—Wuhan, China) exhibited significant growth inhibition at 10–200 mg/L concentrations of 3 µm PEMPs, as indicated by the chlorophyll ‘a’ measurement after a 72-h exposure period. In the current experiment, at 0 µg/L MS concentration, increasing PEMP levels resulted in decreased OD730 across all three days, and a reduction in cellular protein content on day 3 and day 5 at the highest PEMP concentration. This phenomenon may be attributed to the physical and chemical interference caused by the presence of PEMPs, including induced oxidative stress and cell membrane disruption resulting from their presence. However, the exact mechanism underlying the growth inhibition of M. aeruginosa under exposure to PEMPs remains insufficiently understood in previous studies. Similarly, H2O2 measurements showed an increasing trend with increasing PEMP levels, indicating heightened oxidative stress in M. aeruginosa in response to PEMPs. The elevated H2O2 levels may be attributed to a physiological stress response triggered by the presence of exogenous particulate matter in the surrounding medium. Such particles could interfere with cellular homeostasis by disrupting membrane integrity, enhancing light scattering, or altering nutrient and gas exchange dynamics. These disturbances may lead to an overproduction of ROS, thereby overwhelming the antioxidant defense mechanisms of M. aeruginosa and resulting in elevated oxidative stress [34,35].
However, the present experiment results revealed that the interactive effect of MS and PEMPs still positively influenced the growth of M. aeruginosa, highlighting the individual effects of MS. This finding is clearly demonstrated by the OD730 measurements (Figure 4) and protein assays (Figure 5), which displayed increased values for 250 and 500 µg/L MS concentrations across all three PEMP treatments. Cell protein measurements showed a statistically significant interactive effect of the MS and PEMPs on day 7 of the treatment; however, the direction of this effect was influenced by the MS concentration. Furthermore, an exposure of M. aeruginosa to 5 µm PEMPs at concentrations of 10–100 mg/L for 7 days resulted in growth promotion on day 7, and exposure of 10–200 mg/L concentrations of 3 µm PEMPs exhibited significant growth inhibition [34,36]. However, in the present experiment, the effect of monensin appears to be more pronounced than that of PEMPs, as the all PEMP concentrations exhibit a growth trend similar to that observed in the monensin-only experiment [30]. This outcome may have resulted from the relatively low concentration range of PEMPs (0.25–6 mg/L) used in the current experiment, which could change if higher concentrations are applied. Therefore, further studies are required, incorporating additional PEMP-related variables such as different concentration ranges, bead sizes, colors, and exposure periods, to enable a more precise interpretation.
Microplastics (MPs) can serve as vectors for contaminants in aquatic environments, facilitating the adsorption, transport, and transfer of various contaminants and chemical substances. Polystyrene MPs may serve as carriers of antibiotics, such as oxytetracycline [37]. The antibiotics sulfadiazine, amoxicillin, tetracycline, ciprofloxacin, and trimethoprim have been reported absorbing into polyethylene-, polystyrene-, polypropylene-, polyvinyl chloride (PVC)-, and polyamide-based microplastics [38]. However, the ionization capacity and hydrophobicity of antibiotics determine the electrostatic attraction between the antibiotic and the contaminant. The type and number of functional groups present in an antibiotic influence its ionization coefficient in aqueous media. Additionally, the pH of the media plays a critical role in the degree of ionization of antibiotics [10]. However, MS has a negative surface charge since many cations are able to form complexes with it [24]. Similarly, the antibiotic sorption behavior of microplastics may be influenced by the physiological and biochemical characteristics of aquatic biota present in the ecosystem, as well as their capacity for antibiotic bioaccumulation [39]. Therefore, further studies are required to explain the MS adsorption properties of polystyrene MPs when they are alone and under the presence of M. aeruginosa.
Oxidative stress in cyanobacteria arises from an imbalance between the production of ROS and the organism’s capacity for detoxification [40]. However, the H2O2 measurements of M. aeruginosa have significantly decreased in the current experiment (Figure 7) with the increasing MS concentration (250 and 500 µg/L), where the individual MS exposure (≤500 µg/L) did not show significant change in H2O2 measurements for increasing MS [30]. The H2O2 concentrations in the current experiment for the 250 and 500 µg/L MS treatments were significantly lower compared to the corresponding controls of each PEMP treatment. This could be attributed either to a reduction in oxidative stress in M. aeruginosa under the combined effect of MS and PEMP, or to increased antioxidant activity that helps detoxify H2O2 under the interactive effect of MS and PEMPs. However, the increased growth response of M. aeruginosa may have resulted from reduced oxidative stress conditions caused by enhanced antioxidant enzyme activities. According to the results of CAT activity measurements (Figure 8), the increased CAT activity might have degraded the produced H2O2 under the interactive effect of MS and PEMPs. This outcome is further demonstrated by the two-way ANOVA results of CAT activity measurements that displayed a statistically significant interactive effect between MS and PEMP treatments. However, in the individual MS experiment, MS concentrations ≤ 500 µg/L did not result in any statistically significant changes in oxidative stress or CAT activity compared to the control treatment [30]. Similarly, a previous experiment result showed a significant change in CAT activity in M. aeruginosa for different sizes of polystyrene MPs under low initial algal density [41]. Therefore, it can be determined that a higher MS and PEMPs combined effect has a significant impact on the oxidative stress or CAT activity measurements of M. aeruginosa. The reduction in H2O2 content may further contribute positively to the growth and proliferation of M. aeruginosa.
Chlorophyll ‘a’ production showed a statistically significant decrease only on day 3 (Figure 6). Measurements on days 5 and 7 did not show any statistically significant changes displaying MS, and PEMPs do not have an interactive effect on chlorophyll ‘a’ production of M aeruginosa. According to the results of this study, based on oxidative stress, OD730, and cellular protein measurements, under optimal environmental conditions, environmentally relevant concentrations of MS (≤500 µg/L) were still capable of enhancing M. aeruginosa growth, even in the presence of 3 µm polyethylene microplastic particles (PEMPs) at concentrations of 0.25, 1.25, and 6 mg/L. However, the experiment was conducted under conditions favorable for M. aeruginosa growth. Therefore, M. aeruginosa stress responses to MS and PEMPs may differ under the actual environmental conditions compared to the findings of this study. An experiment conducted to evaluate the impact of initial cell density on the growth of M. aeruginosa reported a significant relationship between the initial and final cell densities, independent of the growth medium [42]. In the current experiment, the concentrations of M. aeruginosa used were higher than those typically recommended for laboratory-based toxicity or physiological assays. However, the aim was to simulate conditions similar to natural cyanobacterial occurrences, where cell densities can become relatively high in nutrient-enriched livestock wastewater ponds compared to large natural water bodies. Various growth phases of cyanobacteria, including M. aeruginosa, show different growth rates and physiological responses under the influence of different abiotic and biotic stressors [43]. These growth phases might alter the response levels of cyanobacteria to environmental stressors. Thus, applying these findings to real-world scenarios requires careful consideration of the mentioned variables.
Nevertheless, with the enhanced growth of M. aeruginosa under altered stress conditions, the interactive effects of MS and PEMPs could potentially exacerbate the occurrence of M. aeruginosa-dominated HABs in surface water bodies located near cattle farming areas. Although MS is administered to improve feed conversion efficiency and enhance livestock productivity, its excessive and indiscriminate use may inadvertently pose significant ecological risks despite these intended benefits. Poor MS use, coupled with inadequate and unsafe manure disposal practices, may contribute to unforeseen environmental consequences. These stress responses of M. aeruginosa to MS and PEMPs may represent an underexplored environmental impact resulting from the unregulated release of these compounds into aquatic ecosystems.

4. Materials and Methods

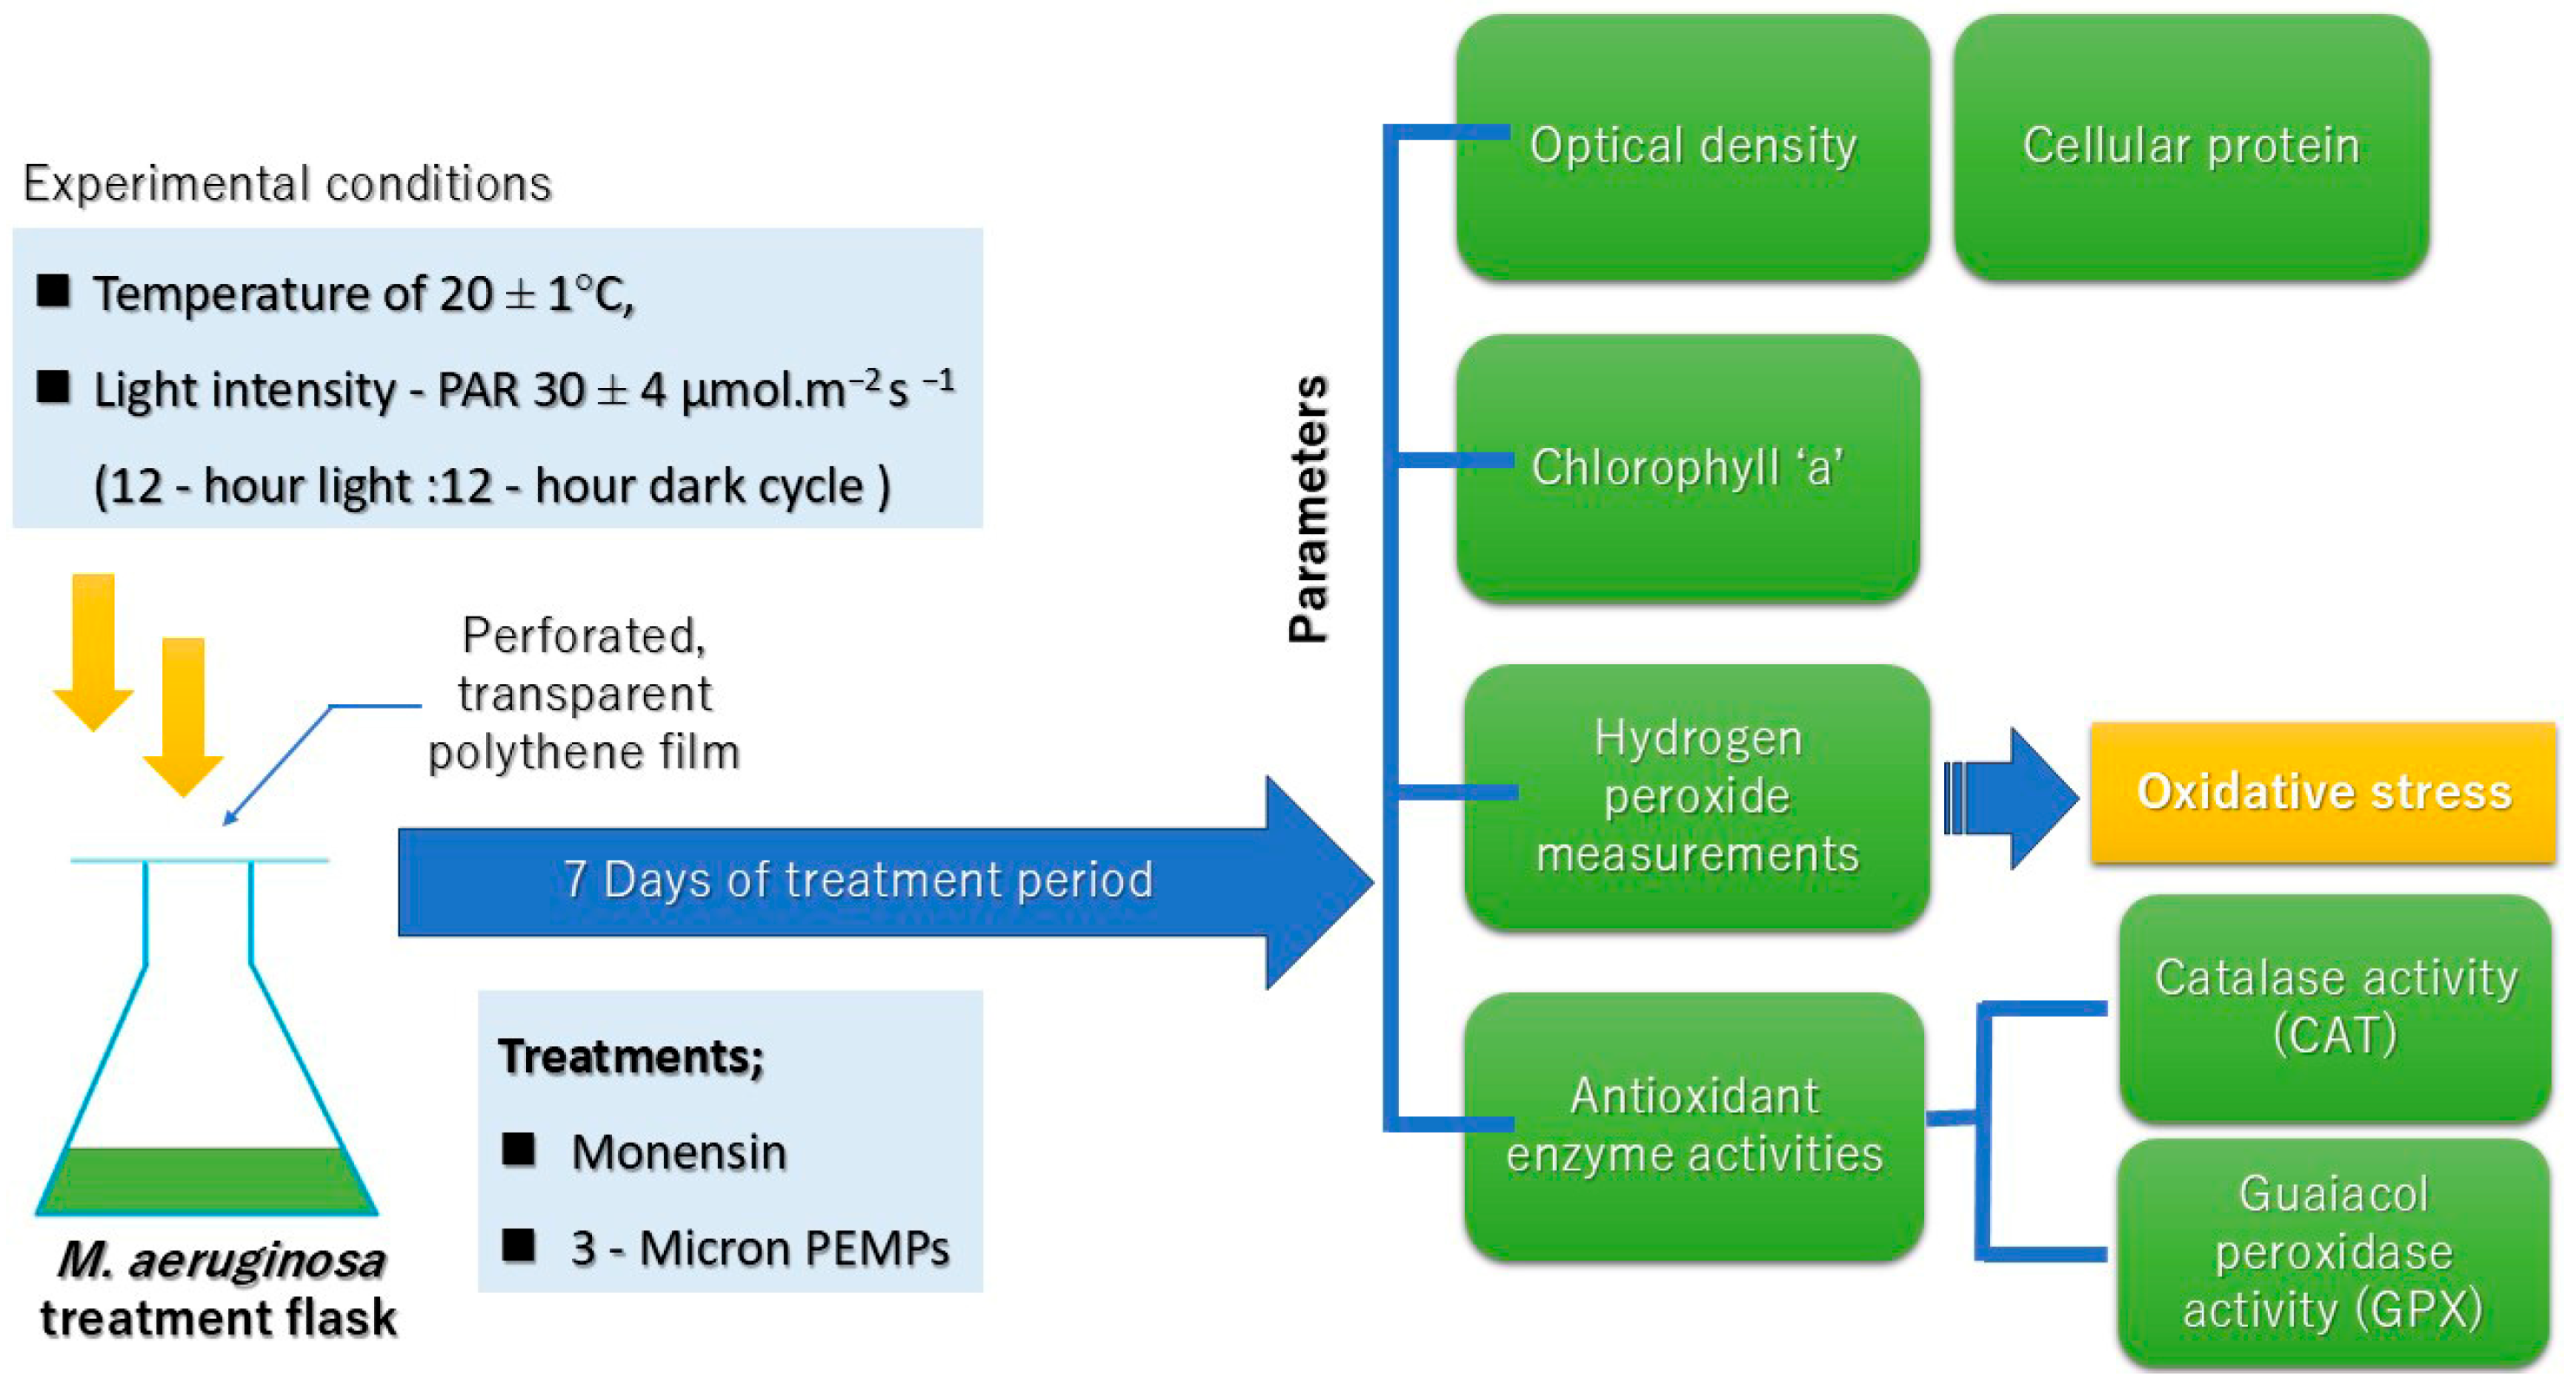
4.1. Cyanobacteria Culture Conditions

Microcystis aeruginosa (strain NIES-111) cultures were procured from the National Institute for Environmental Studies (NIES, Tsukuba, Japan) and cultivated in BG-11 media. The cultures were maintained in an incubator (MIR554PJ, Panasonic, Osaka, Japan) at 20 ± 1 °C under a 12 h light:12 h dark photoperiod, regulated by an electronic timer. The light intensity was set at 30 ± 4 µmol·m−2·s−1 photosynthetically active radiation (PAR), measured using a light meter (Apogee MQ-200, Logan, UT, USA). The cultures were manually agitated twice daily at predetermined intervals to ensure proper aeration.

4.2. Preparation of the Treatments

Monensin sodium salt (TLC 90–95%) was obtained from Sigma Aldrich (Tokyo, Japan). MS was dissolved in 70% ethanol (2 mg dissolved in 1000 µL of 70% ethanol). The mixtures were left undisturbed on a glass Petri dish for approximately 2–3 h to allow for the extensive evaporation of ethanol. Later, the antibiotic was diluted using BG-11 media to make a 40 mg/L stock solution. Relevant amounts of MS were added to each treatment to acquire the predetermined concentrations. Three µm-diameter polystyrene microplastics (PEMPs), colorless polystyrene microspheres (1.05 g mL−1 density, 2.6% in aqueous solution; catalog number 17134-15, Polyscience, Warrington, PA, USA), were added into the treatments in adequate amounts to make the relevant concentrations.

4.3. Experimental Setup

The initial OD730 (absorption at 730 nm in spectrophotometer) of cell cultures for each treatment was adjusted to 0.5061 (absorption units) by mixing the main cultures with BG-11 media. The 100 mL conical flasks were used to arrange the treatment flasks (Figure 10). MS and PEMP treatments were introduced on the same day for each treatment, modulating the ordinary set-up where the contaminants commonly enter into the water bodies along with the nutrition source. MS concentrations were arranged in 0, 50, 250, and 500 µg/L concentrations based on the previous experiment results [30]. PEMP concentrations were arranged in 0.25, 1.25, and 6 mg/L followed by a factorial, completely randomized design (CRD). Each treatment was arranged with two replicates and 1–3 measurements from each replicate was taken. After arranging the treatments, flasks were covered with a perforated transparent polyethene film. All experimental units were kept in the same incubator (MIR554PJ, Panasonic, Osaka, Japan) at 20 ± 1 °C temperature and lighting (12 h:12 h light dark cycle) 30 ± 4 µmol.m−2 s −1 for seven days and samples were shaken two times per day manually with constant intervals. OD730 of each replicate was measured on day 3, day 5, and day 7 and, simultaneously, cell samples were harvested into 1.5 mL centrifuge tubes and pelleted through centrifuging at 12,000× g at 4 °C for 15 min (Tomy MX-105, digital Biology, Tokyo, Japan) and kept preserved at (−80) °C.

4.4. Optical Density Measurements (OD730)

OD730 measurements of all replicates for each treatment combination were measured on days 3, 5, and 7 using a spectrophotometer (Shimadzu UV Mini-1280, Tokyo, Japan) at the 730 nm wavelength. Three readings were taken from each replicate and recorded. Before sampling, the flasks were thoroughly shaken to ensure uniform dispersion of cyanobacterial cells throughout the medium [44].

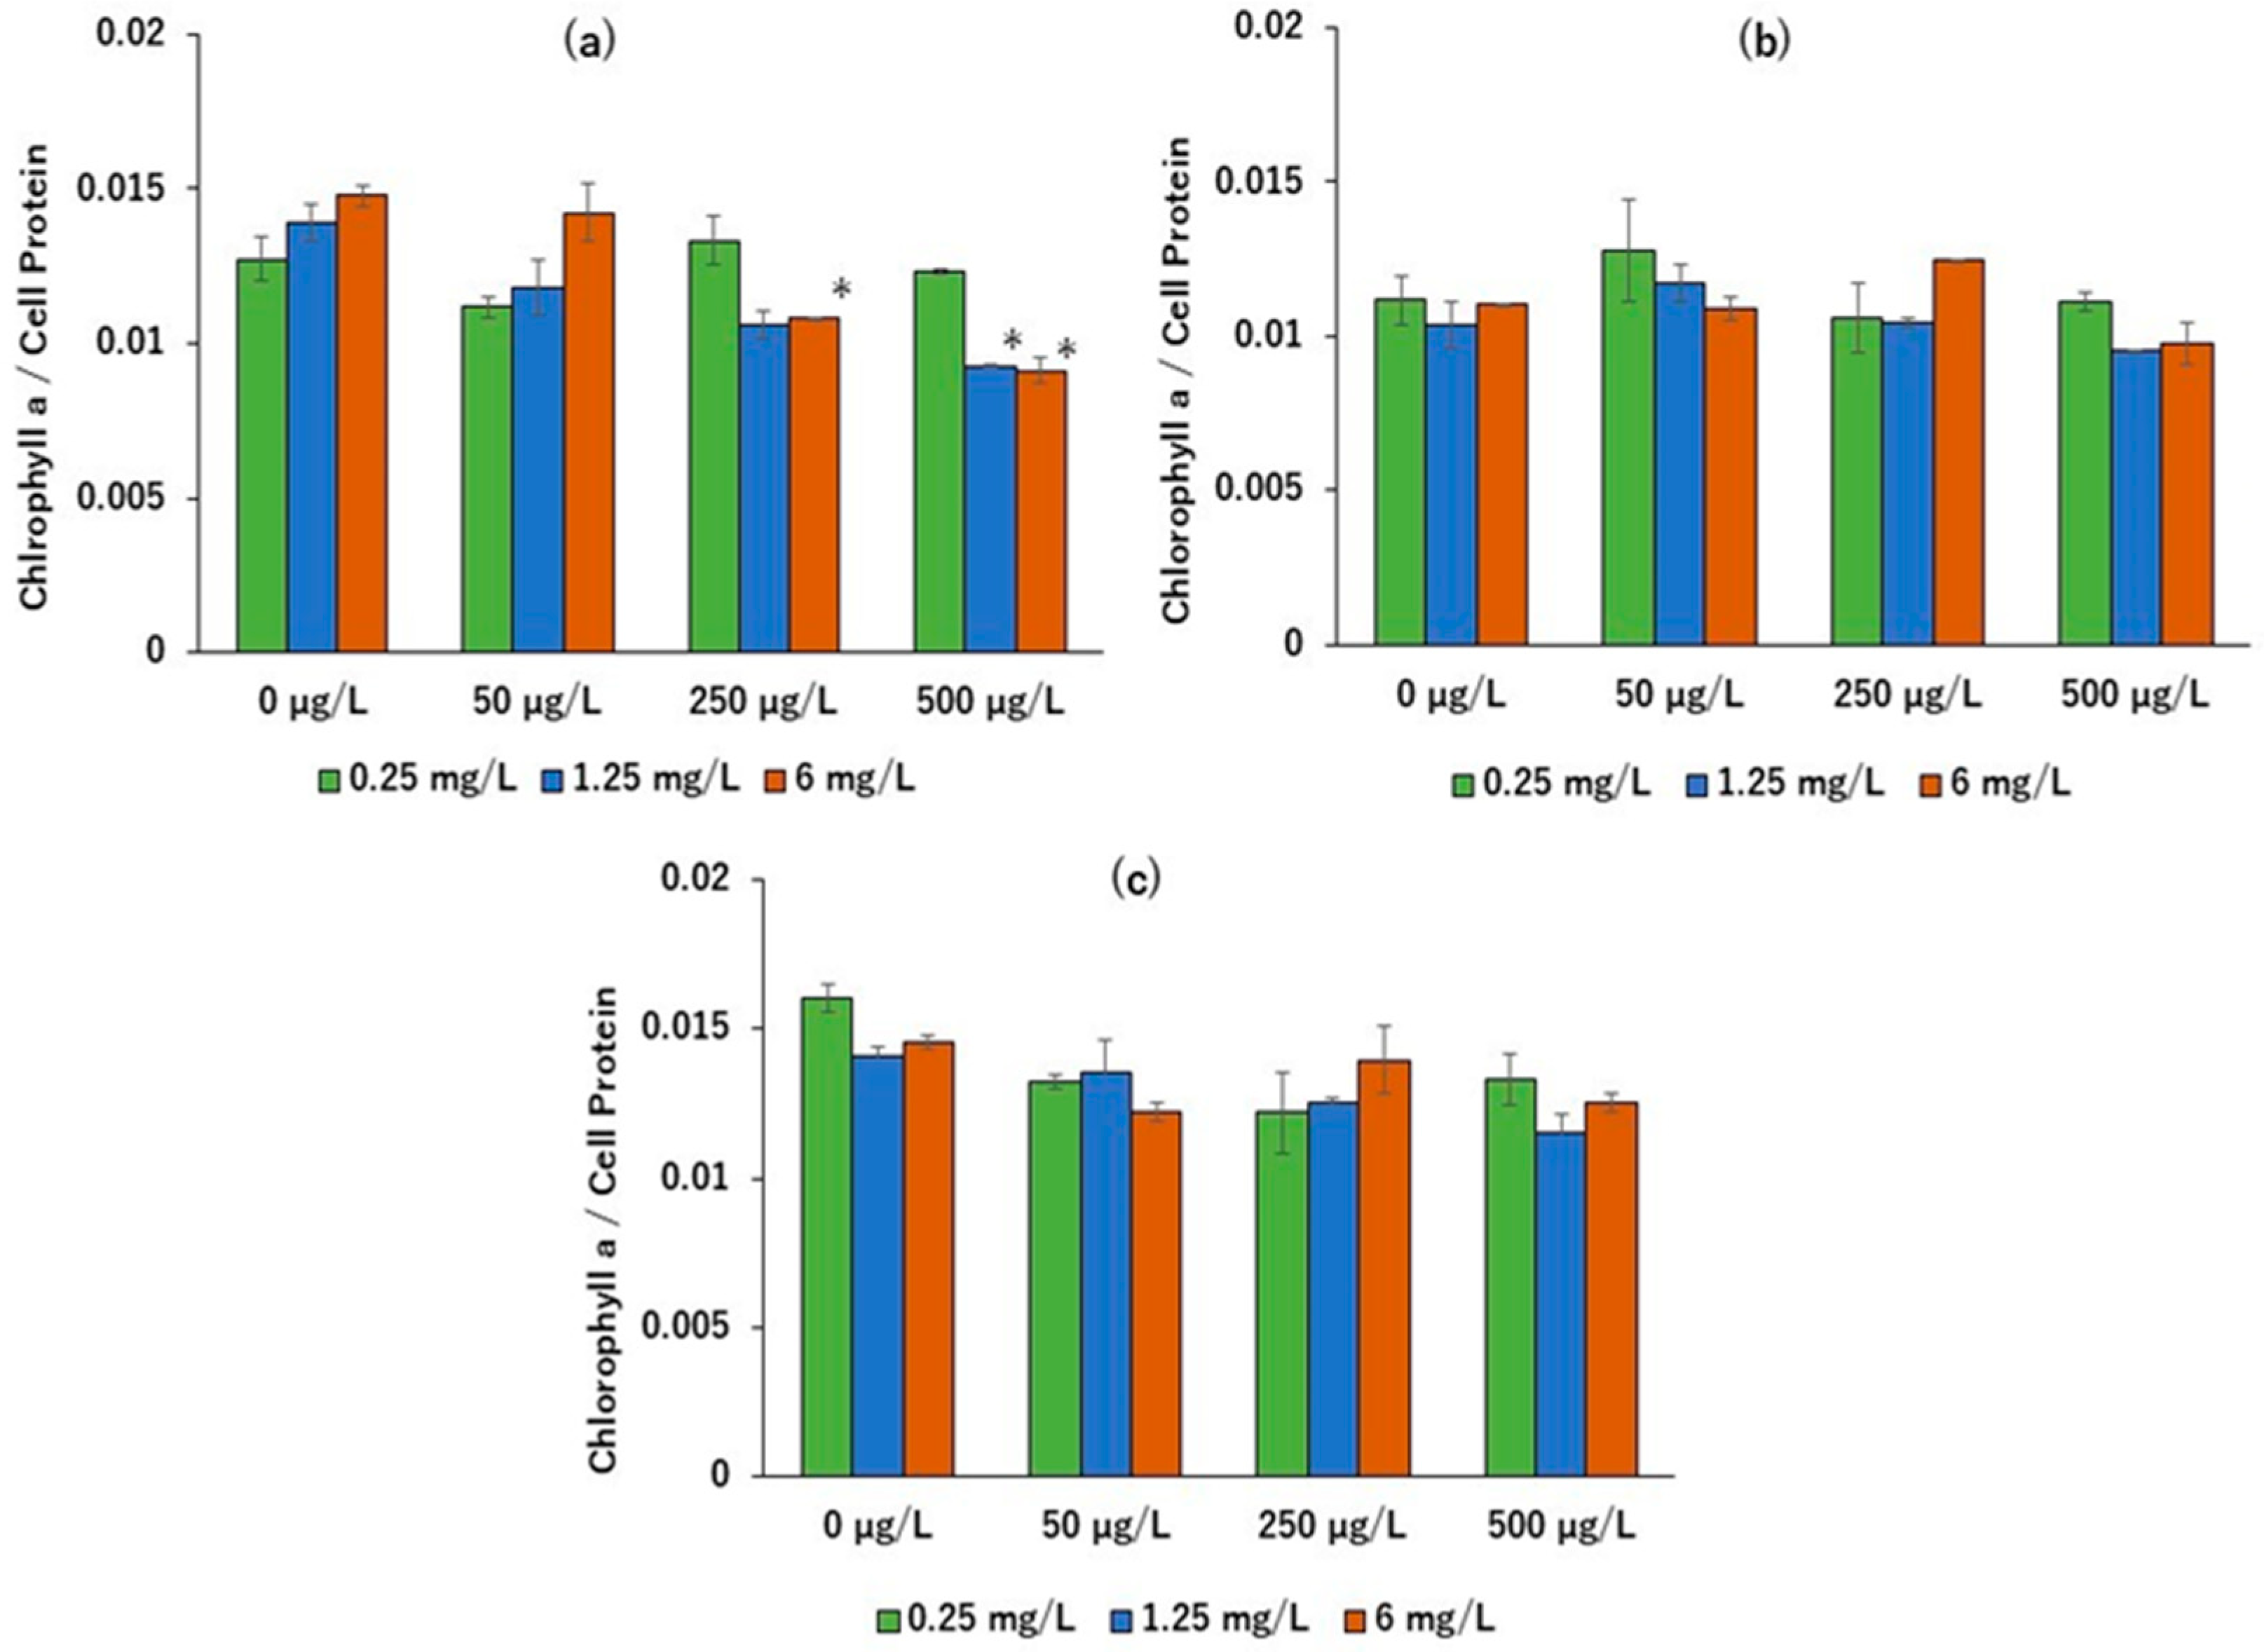
4.5. Chlorophyll ‘a’ Measurement

Chlorophyll ‘a’ content was measured on days 3, 5, and 7 of the treatment period. Samples, previously stored at −80 °C, were thawed for 15 min until reaching room temperature (20–25 °C). Pigments were then extracted into 1 mL of 95% (v/v) ethanol. The tubes were manually shaken and vortexed for 10 s to ensure complete mixing of the cells with the ethanol. The samples were incubated in a water bath at 60 °C for 10 min. After incubation, the samples were centrifuged at 4000× g for 10 min at 4 °C. The supernatant was carefully pipetted, and absorbance was measured at three wavelengths (750 nm, 665 nm, and 649 nm) using a Shimadzu UV Mini-1280 spectrophotometer. Absorbance values for ethanol at the shorter wavelengths were corrected by adding or subtracting values to account for auto-zero errors. All measurements were performed under low-light conditions to minimize photodegradation of the extracted chlorophyll. Chlorophyll ‘a’ concentrations were calculated using Equation (1). To minimize errors due to turbidity or light scattering, the absorbance at 750 nm was subtracted from each absorbance measurement [45,46].
Chlorophyll ‘a’ (μg/mL) = 13.95A665 − 6.88A649

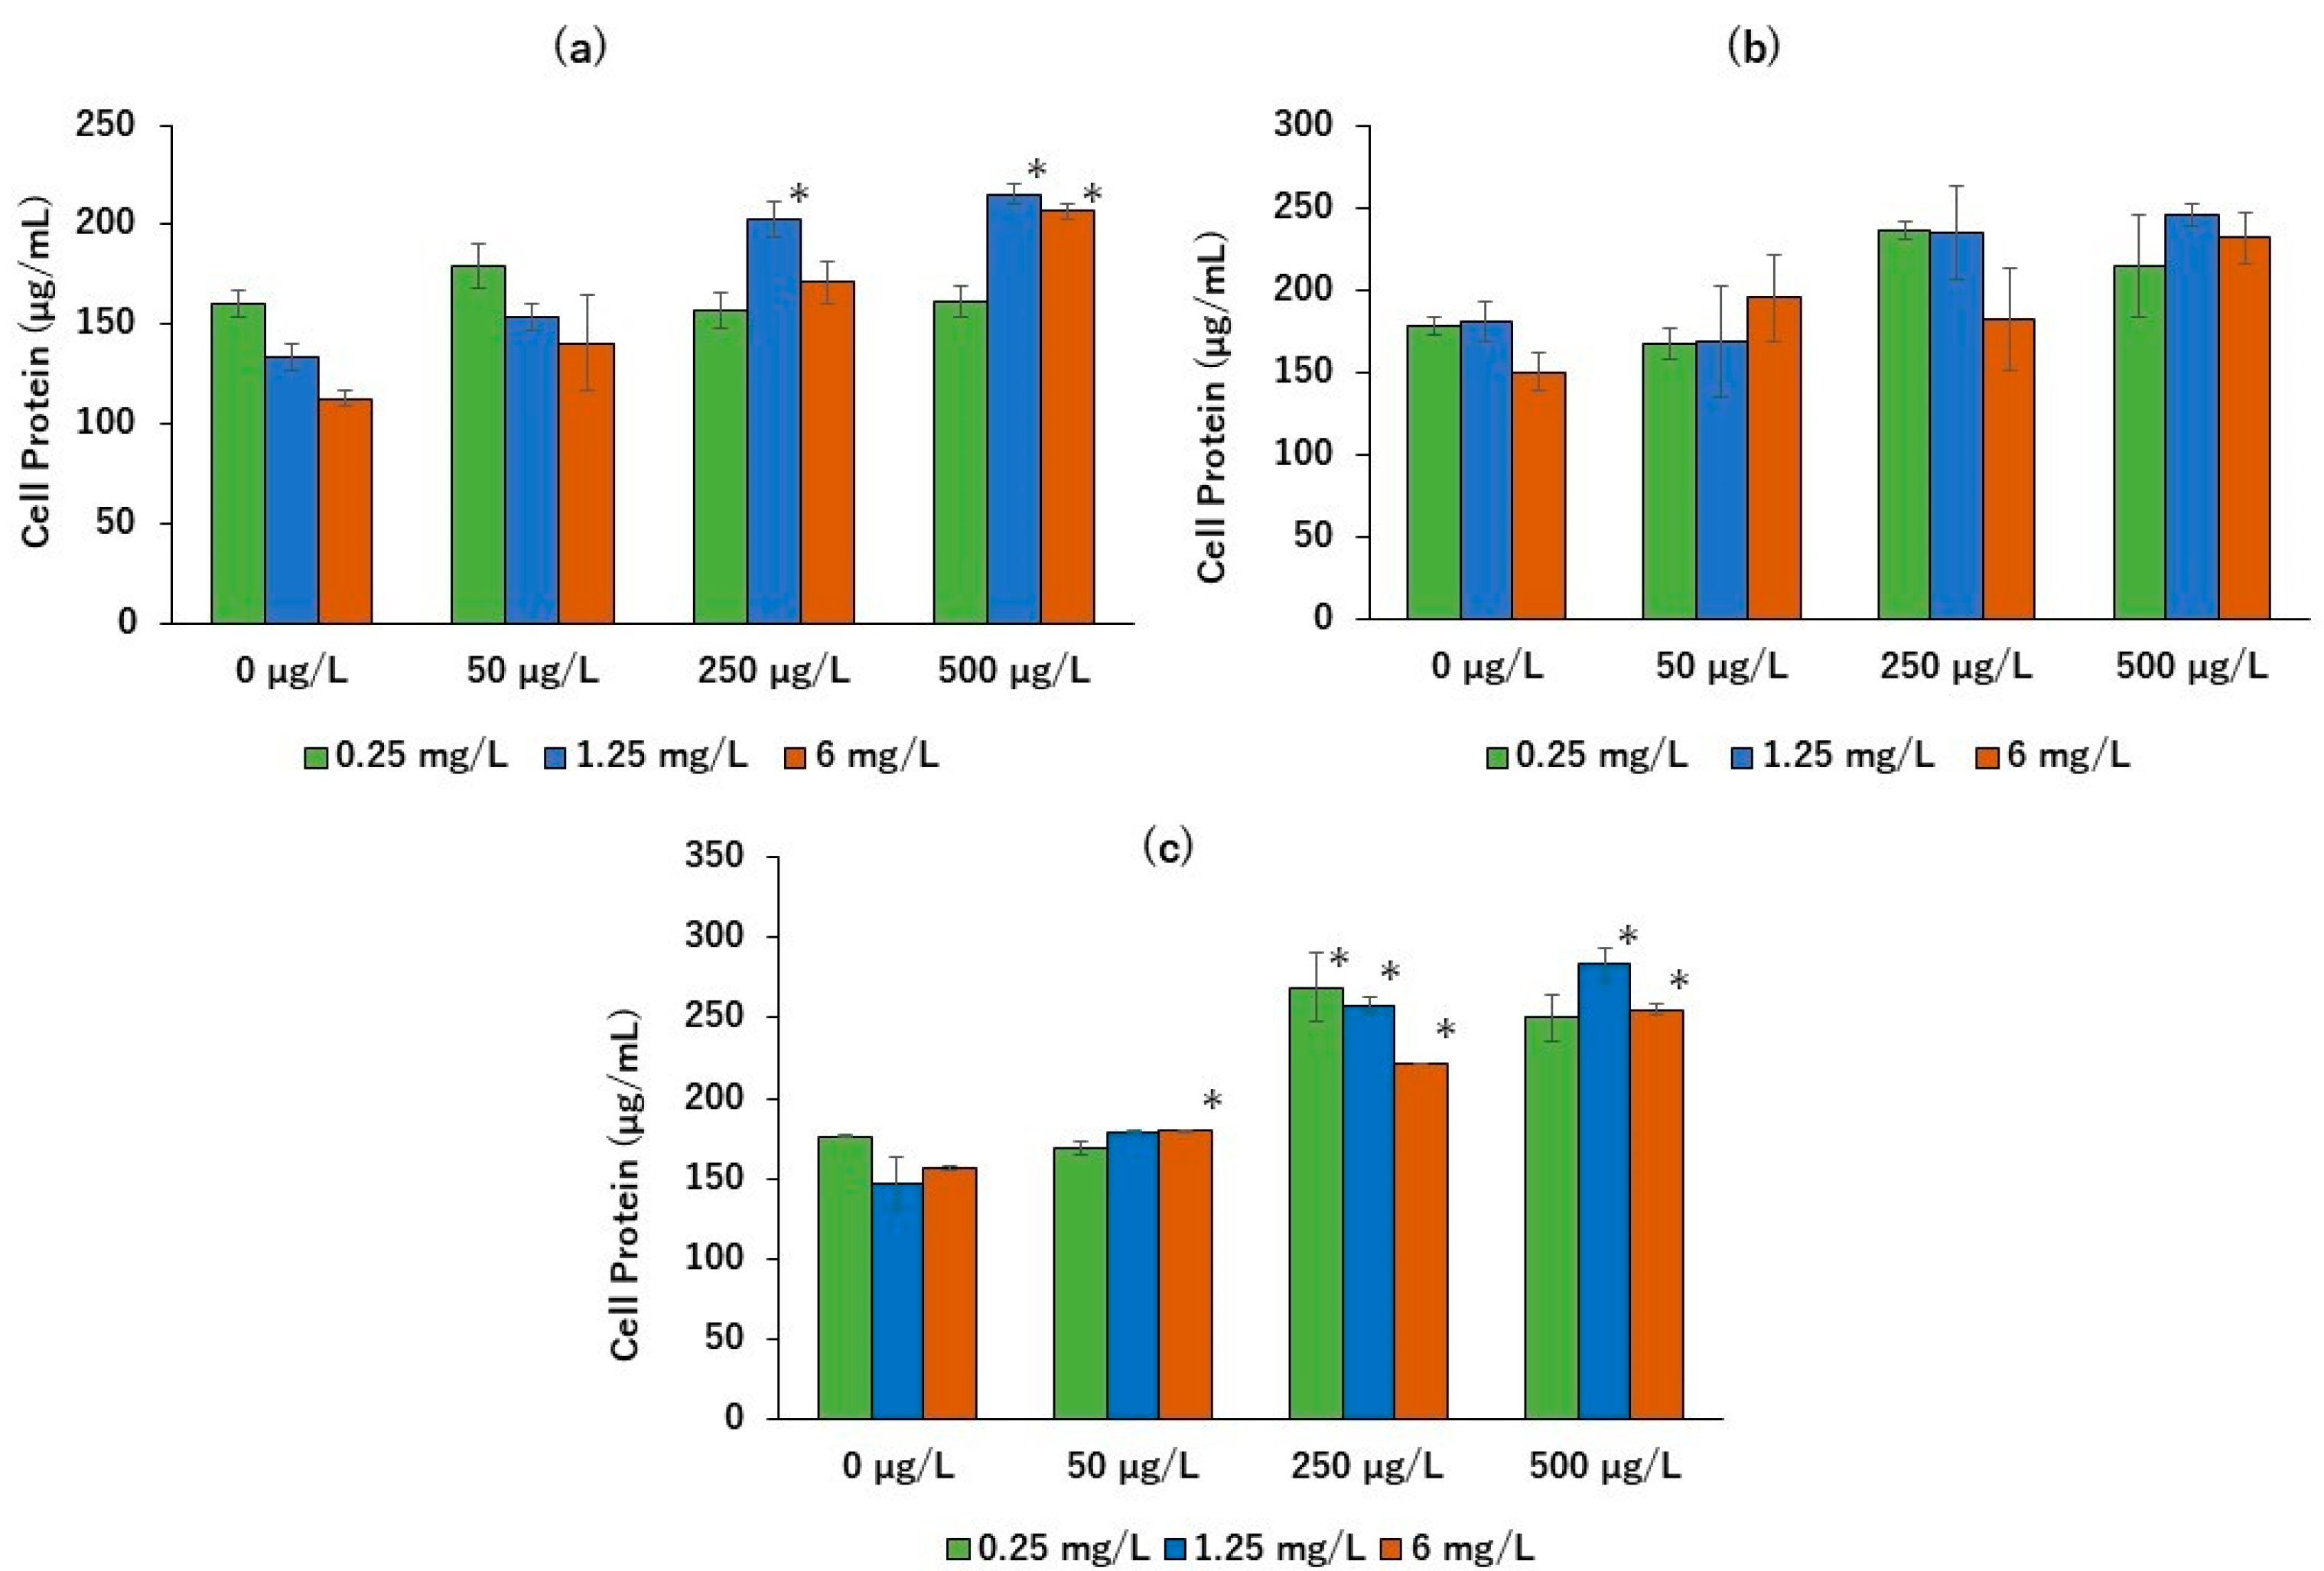
4.6. Cellular Protein Content

Protein content was assessed on days 3, 5, and 7 of the treatment period using a modified Bradford assay [47]. To remove chlorophyll, cell samples were washed with ethanol. The samples were mixed with 750 μL of 95% ethanol and vortexed for 10 s to ensure complete pigment extraction. After that, they were centrifuged at 4000× g for 10 min at 4 °C. After carefully discarding the supernatant, the samples were incubated at 25 °C for 24 h in an oven to allow ethanol evaporation. This step was essential to minimize chlorophyll interference and ensure accuracy in colorimetric measurements. To measure cellular protein, each sample was mixed with 0.5 mL of 0.5 M NaOH and incubated in a water bath at 70 °C for 10 min. The samples were then centrifuged at 7000× g for 10 min at 4 °C. Protein absorbance was measured spectrophotometrically at a wavelength of 595 nm (Shimadzu UV Mini-1280, Tokyo, Japan) after a precise 10 min incubation with the formulated Bradford protein assay reagent (Fujifilm Wako Chemicals, Osaka, Japan). Protein concentrations were quantified using a pre-estimated standard curve.

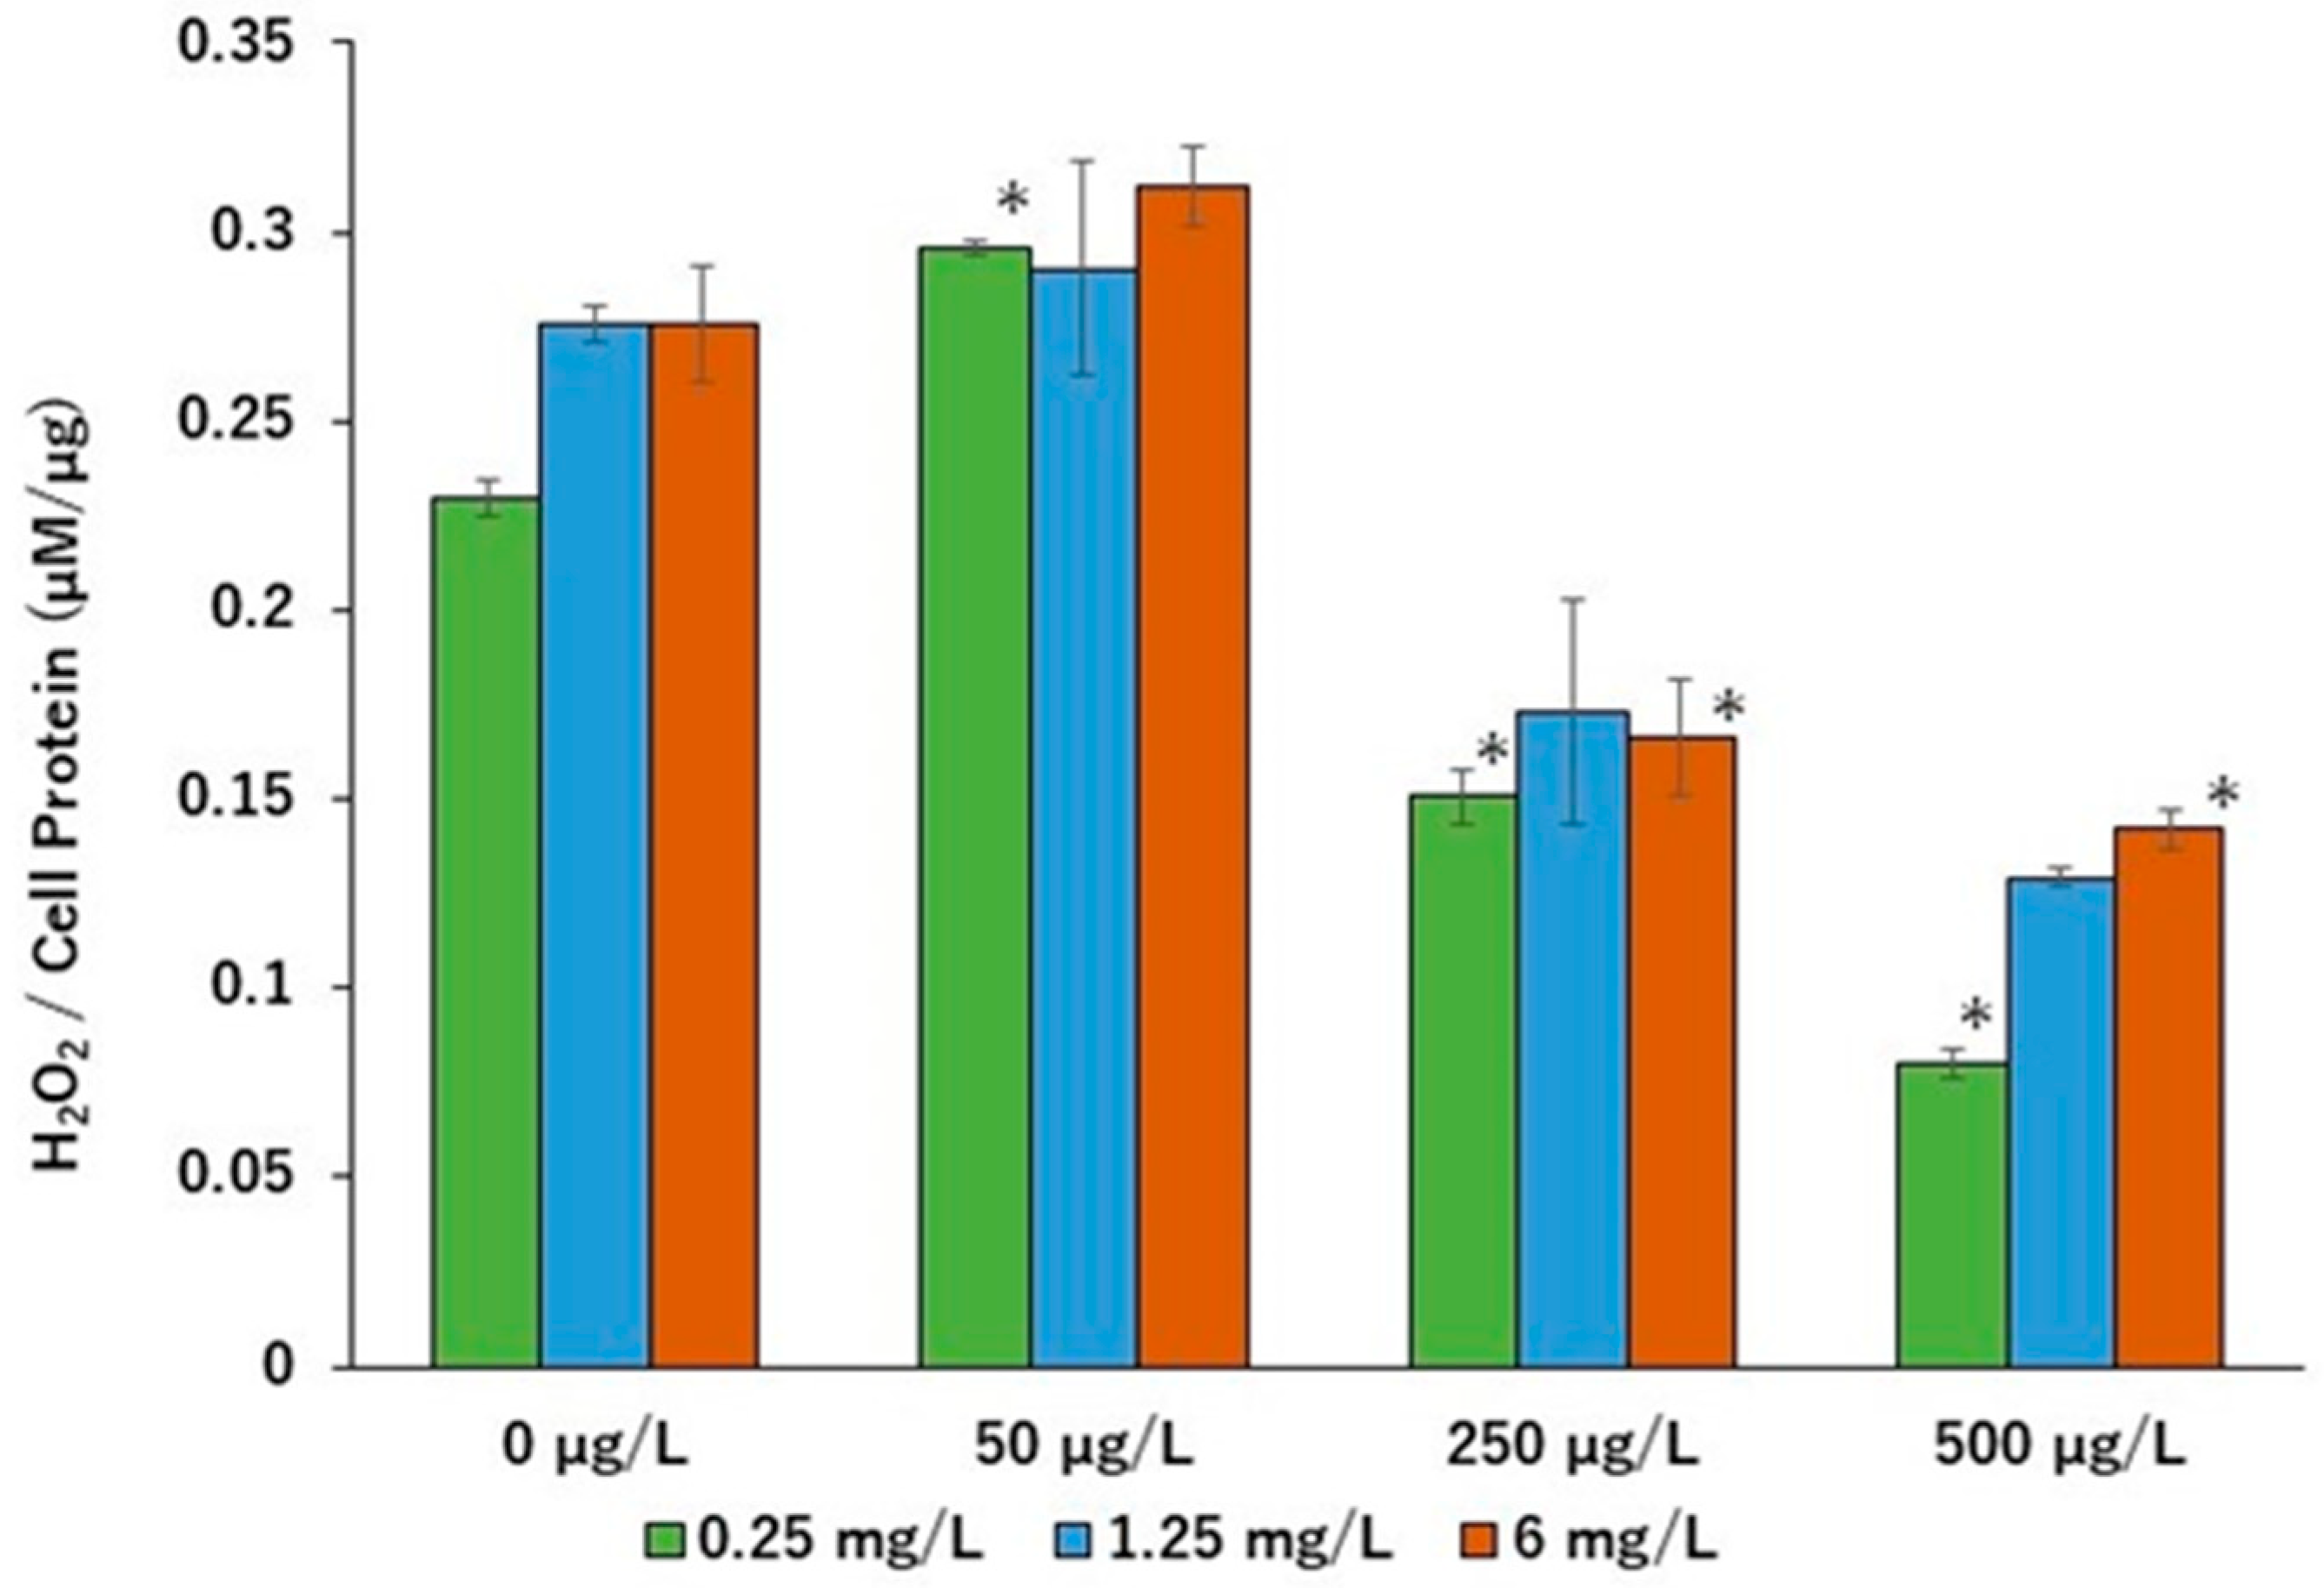
4.7. Hydrogen Peroxide Measurement

The objective of measuring H2O2 content was to assess oxidative stress levels in cyanobacteria. H2O2 estimation was conducted on cell samples treated for seven days. Preserved cell pellets were thawed at room temperature (20–25 °C) for 15 min before being homogenized in 1 mL of 0.1 M phosphate buffer. The homogenized samples were then centrifuged at 10,000× g for 10 min at 4 °C. To prepare the reaction mixture for each sample, the supernatant was mixed with 0.1 M Ti (SO4)2 in 20% (v/v) H2SO4 at a 1:3 ratio. The absorbance of each sample was measured at 410 nm using a spectrophotometer (Shimadzu UV Mini-1280, Tokyo, Japan), and H2O2 concentrations were determined based on a pre-prepared standard curve for known concentrations [48].

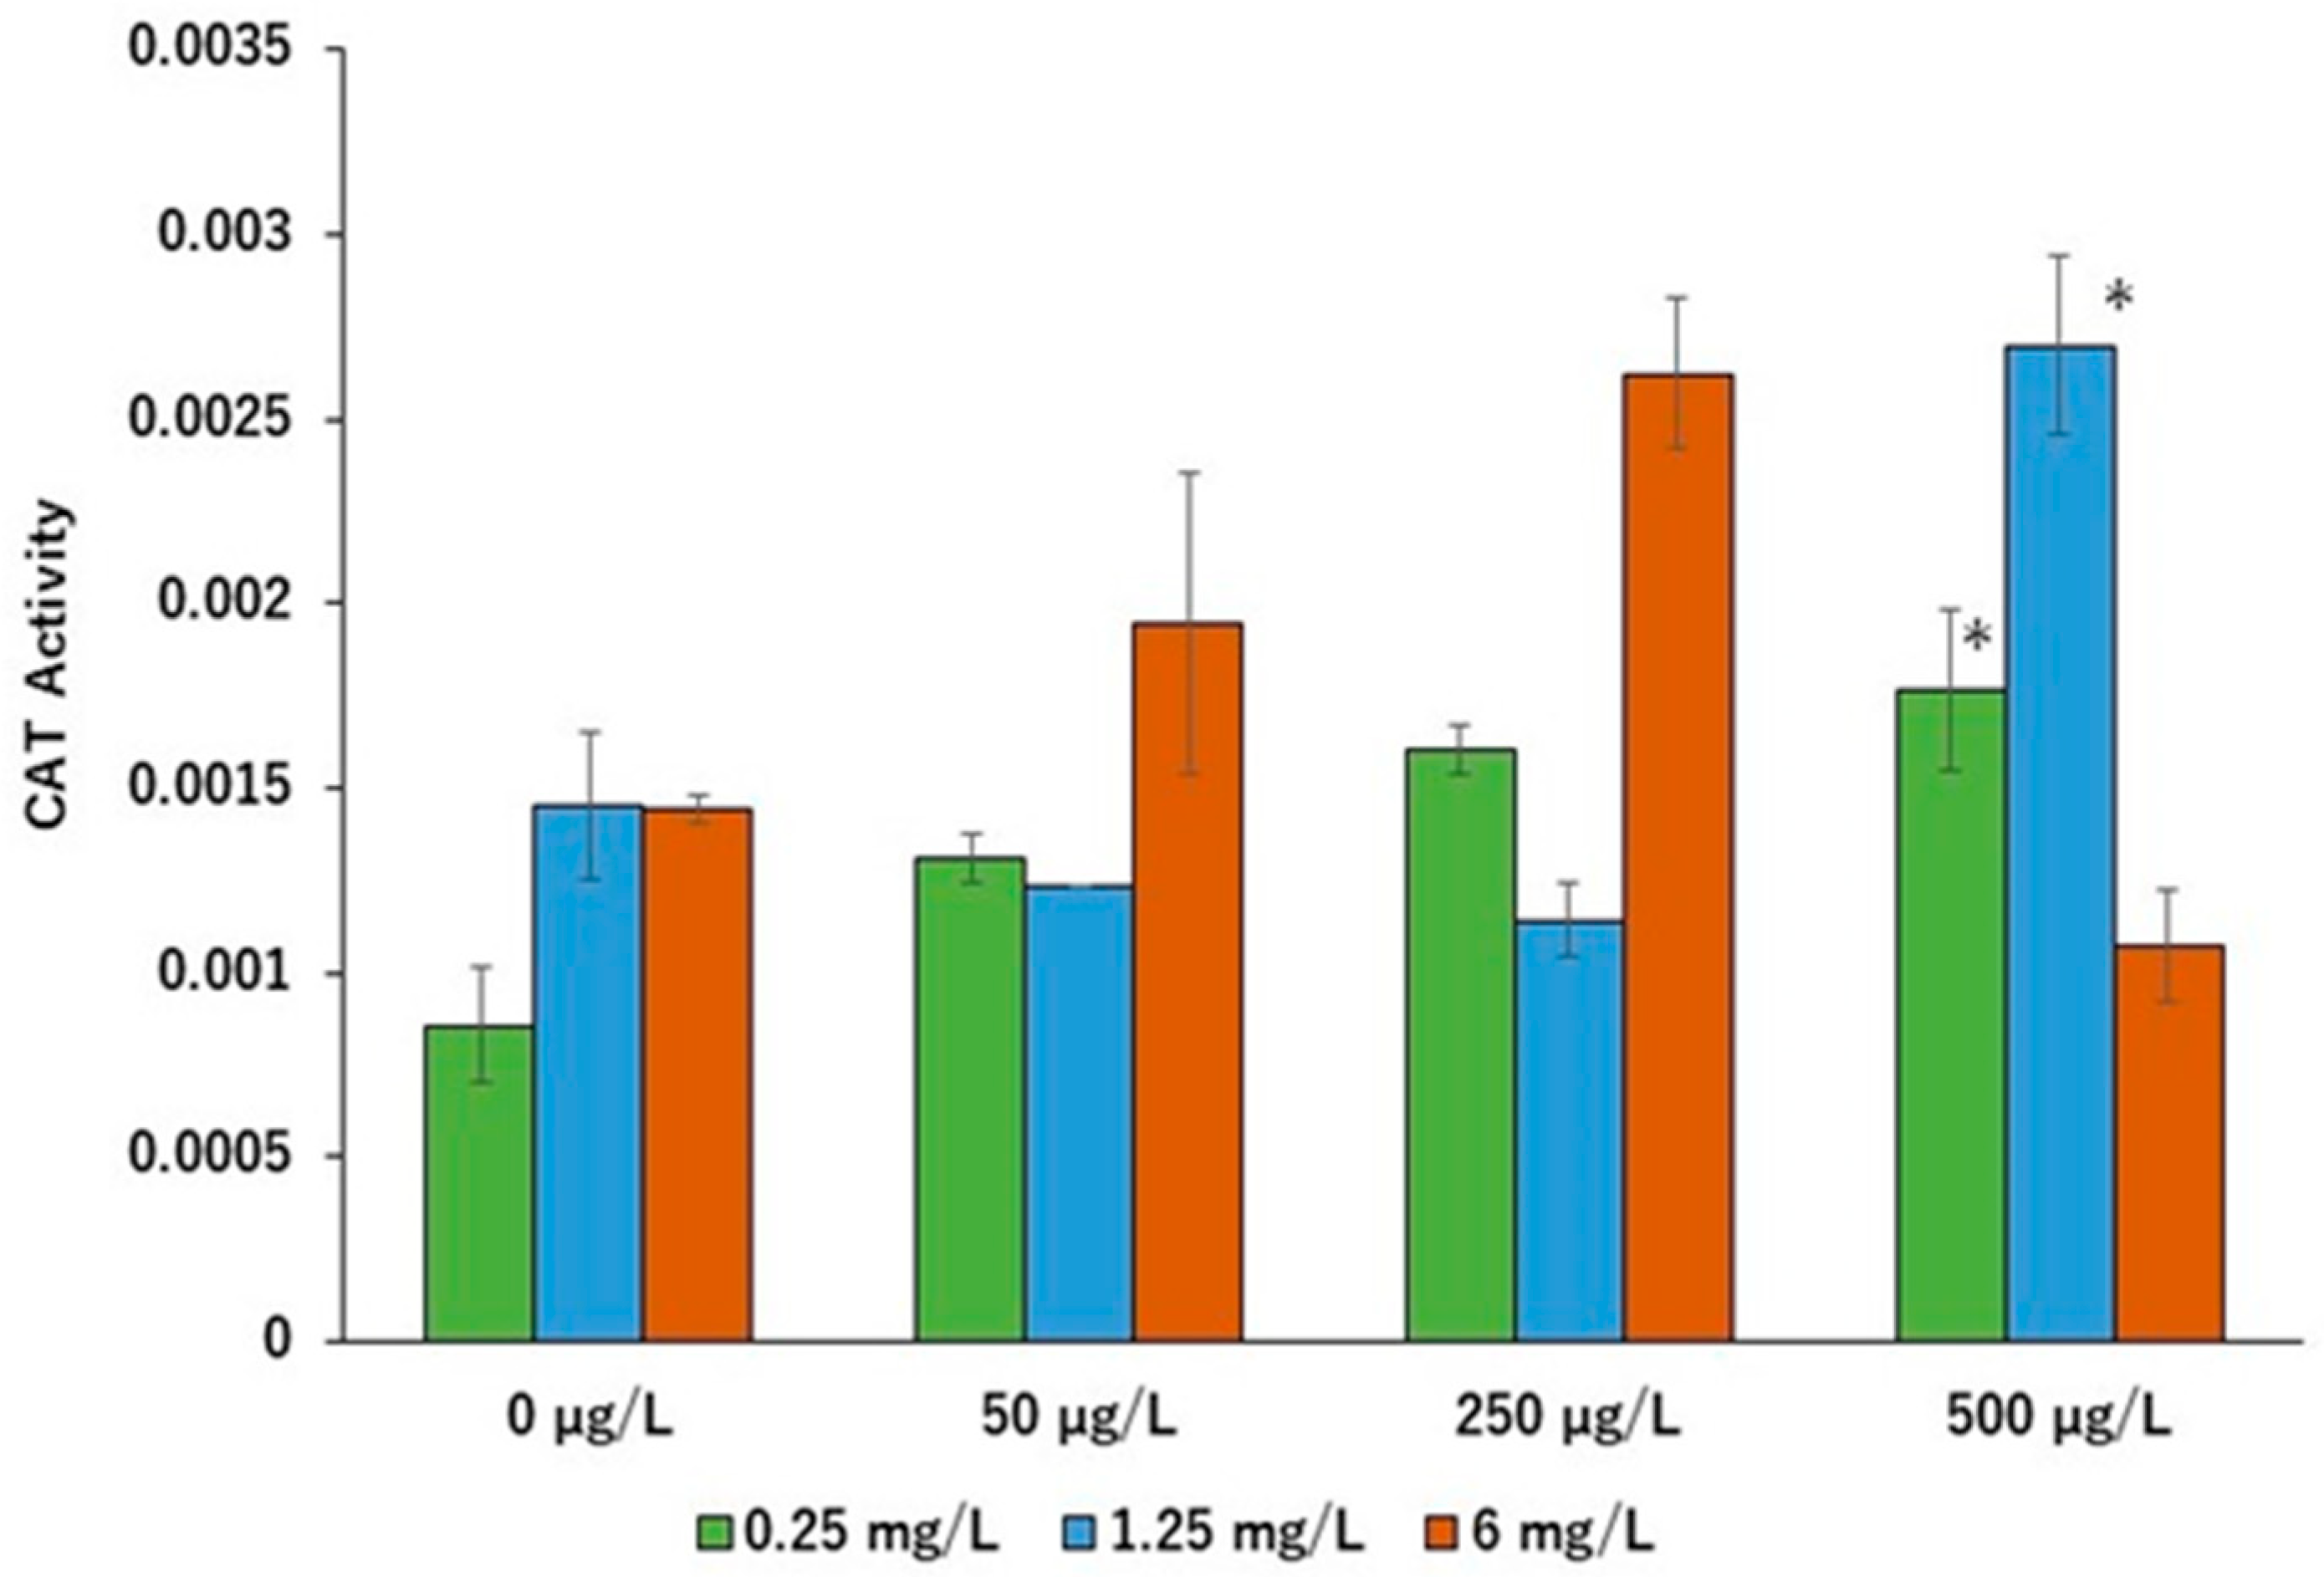
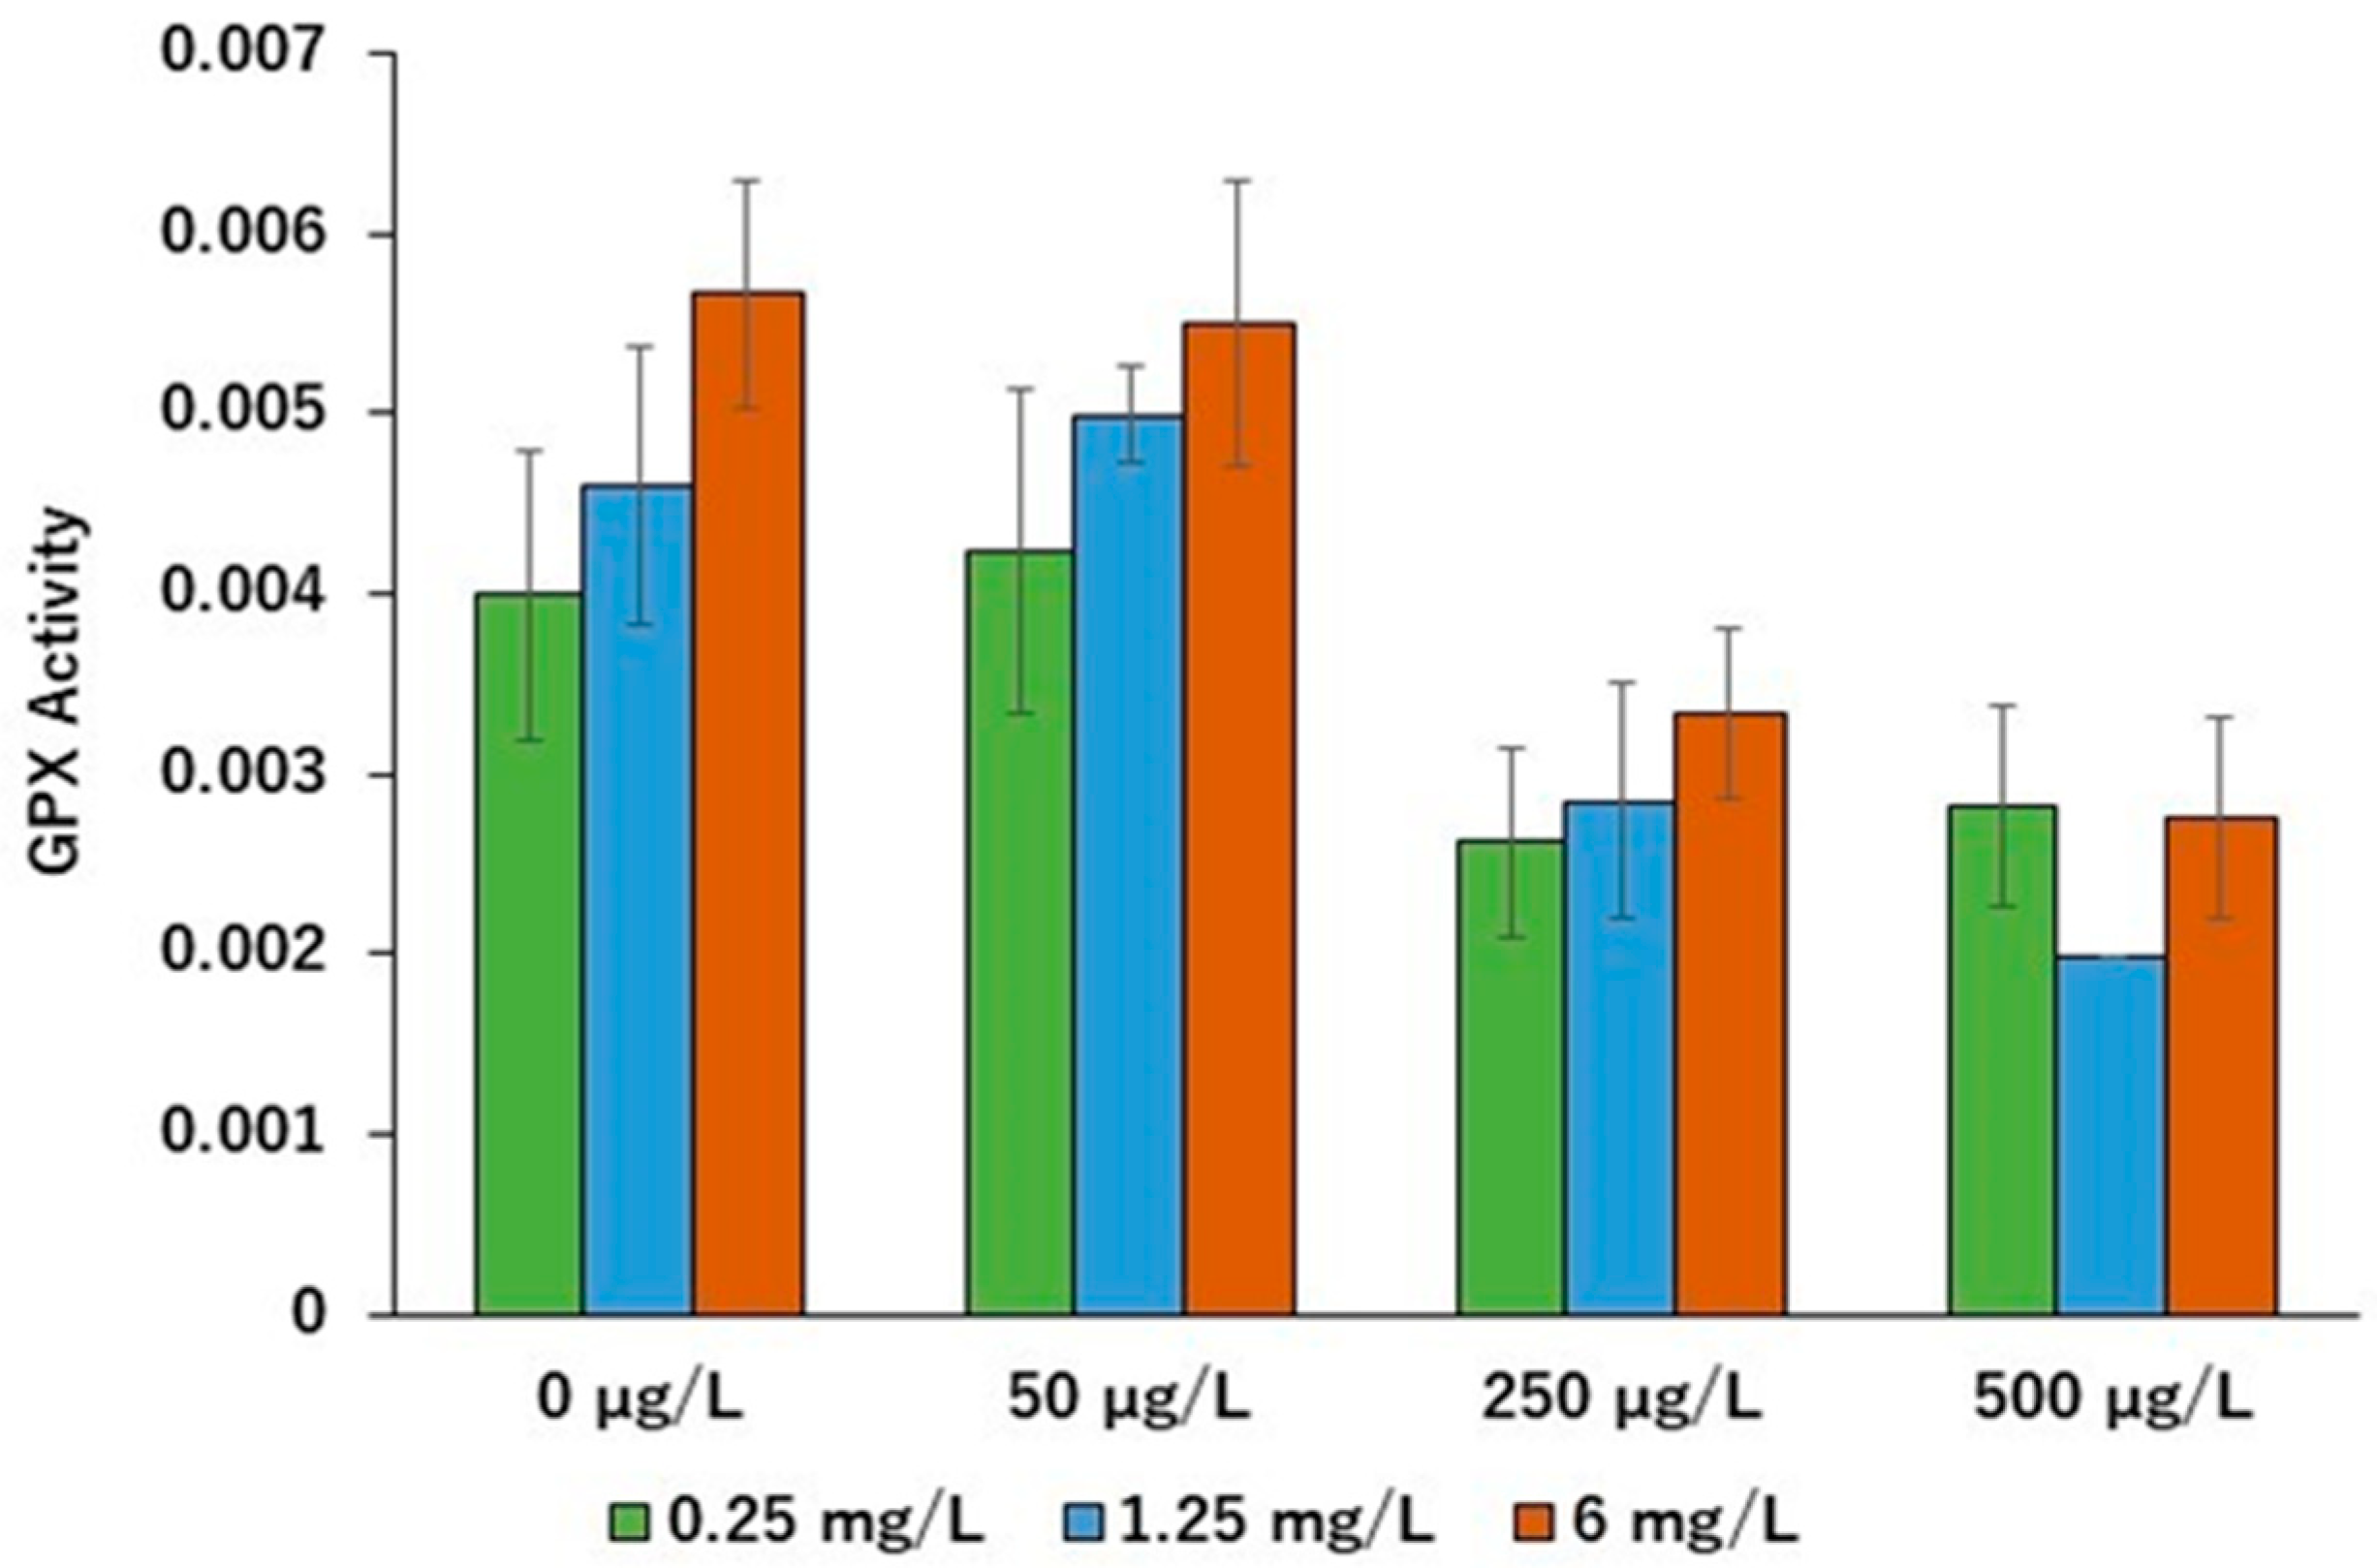
4.8. Antioxidant Activity Measurements

Antioxidant measurements for catalase activity (CAT) and guaiacol peroxidase activity (GPX) were carried out for cell samples harvested at day 7. The enzymes were extracted from preserved cell pellets into 1 mL of extraction solution prepared with 6.057 mg/mL, 0.37 mg/mL, 0.177 mg/mL 0.155 mg/mL, 0.308 mg/mL, 2.171 mg/mL of tris, 2Na(EDTA.2Na), Ascorbic acid, Dithiothreitol, Glutathione (reduced form), and MgCl2.6H2O, respectively, and 45 µL/mL of 1 M HCl. The mixture was centrifuged at 12,000× g for 20 min at 4 °C. The reaction solution was prepared using 5.606 mg/mL Tris, 0.37 mg/mL EDTA-2Na, and 45 µL/mL of 1 M HCl. The testing mixture was then prepared by combining the reaction solution, 750 mM H2O2 solution, and enzyme samples in a 23:1:1 ratio. Absorbance measurements were taken at 240 nm wavelength for 3 min, with continuous readings recorded at 10 s intervals using a spectrophotometer. All measurements were performed under controlled conditions at 25 °C. H2O2 decomposition rate was calculated from the decreasing rate of absorbance, considering the molar extinction coefficient of H2O2 as 43.6 M−1 cm−1. CAT activity was represented as micromoles of hydrogen peroxide consumed per minute per unit weight (μg) of cellular protein in the sample (μmol/min/μg) [49].
For GPX activity measurements, the enzymes were extracted from preserved cell pellets using the extraction solution (CAT method). The mixture was then centrifuged at 12,000× g rpm for 20 min at 4 °C. The reaction solution was prepared using Tris, EDTA-2Na, HCl, H2O2, and 2.22% guaiacol in ethanol. The testing mixture was formulated by combining the reaction solution and sample solution in a 24:1 ratio. Absorbance measurements were recorded at 470 nm using a spectrophotometer, with continuous readings taken at 10 s intervals for 3 min. GPX activity was represented as the rate of the formation of tetra-guaiacol per minute per unit weight of cell protein sample (μmol/min/μg), considering the molar extinction coefficient for tetra-guaiacol at 470 nm as 26.6 mM−1cm−1 [50].

4.9. Statistical Analysis

The experiment was designed using a factorial, completely randomized design (CRD) model, ensuring equal conditions across all treatments. The interactive effects of the two treatments were analyzed using a two-way ANOVA, with statistical significance set at (p < 0.05) and (p < 0.01). Additionally, a grouped one-way ANOVA with post-hoc Tukey HSD (Honestly Significant Difference) analysis was performed. All data were initially recorded manually and later transferred to Microsoft Excel (version 16.0, 2016). Descriptive statistical analyses were conducted using Microsoft Excel, while all other statistical analyses were performed using IBM SPSS (version 25, IBM Corp., Armonk, NY, USA).

5. Conclusions

The present study investigated the interactive effects of monensin (MS) and 3 µm polystyrene microplastics (PEMPs) on the growth and stress-related physiological responses of Microcystis aeruginosa. Oxidative stress measurements showed a statistically significant decrease with increasing MS concentrations (>50 µg/L) under PEMP treatment, while catalase (CAT) activity increased significantly. The findings highlighted that the interactive effects of MS and PEMPs at environmentally relevant concentrations have the potential to alter oxidative stress and antioxidant enzyme activities in M. aeruginosa, resulting in increased growth of the organism. The stress responses of M. aeruginosa under the co-existence of MS and PEMPs may lead to harmful outcomes in aquatic environments by promoting its growth. Therefore, it is important to expand this study by incorporating additional variables related to PEMPs.

Author Contributions

Conceptualization, T.F. and M.D.H.J.S.; Investigation, B.M.; Methodology, M.D.H.J.S.; Formal Analysis, B.M.; Resources, T.F. and M.D.H.J.S.; Supervision, T.F. and M.D.H.J.S.; Visualization, B.M.; Writing—original draft, B.M.; Writing—review and editing, M.D.H.J.S. All authors have read and agreed to the published version of the manuscript.

Funding

This research received no external funding.

Data Availability Statement

The original data presented in the study are included in the article further inquiries can be directed to the corresponding author.

Conflicts of Interest

The authors declare no conflicts of interest.

Abbreviations

The following abbreviations are used in this manuscript:
HABHarmful algal blooms
CATCatalase activity
GPXGuaiacol peroxidase activity
MSMonensin
GHGGreenhouse gas
MPMicroplastics
NPNano-plastics
PARPhotosynthetically active radiation
OD730Optical density
ROSReactive oxygen species

References

  1. Zurawell, R.W.; Chen, H.; Burke, E.E.; Prepas, E.E. Hepatotoxic cyanobacteria: A review of the biological importance of microcystins in freshwater environments. J. Toxicol. Environ. Health 2005, 8 Pt B, 1–37. [Google Scholar] [CrossRef]
  2. Park, N.Y.; Choi, H.S.; Kang, S.U.; Lim, A.S. The Harmful Cyanobacterium Microcystis aeruginosa Differently Affects the Growth Rate and Photosynthetic Efficiency of Several Species of Marine Phytoplankton. Environ. Microbiol. Rep. 2025, 17, e70091. [Google Scholar] [CrossRef] [PubMed]
  3. Juttner, F.; Watson, B. Biochemical and Ecological Control of Geosmin and 2-Methylisoborneol in Source Waters. Appl. Environ. Microbiol. 2007, 73, 4395–4406. [Google Scholar] [CrossRef]
  4. Pizzino, G.; Irrera, N.; Cucinotta, M.; Pallio, G.; Mannino, F.; Arcoraci, V.; Squadrito, F.; Altavilla, D.; Bitto, A. Oxidative Stress: Harms and Benefits for Human Health. Oxidative Med. Cell. Longev. 2017, 2017, 8416763. [Google Scholar] [CrossRef] [PubMed]
  5. Yang, Z.; Kong, F.; Shi, X. Effects of filtered lake water on colony formation and growth rate in Microcystis aeruginosa of different physiological phases. J. Freshw. Ecol. 2005, 20, 425–429. [Google Scholar] [CrossRef]
  6. Wu, D.; Yang, C.; Zhang, X.; Hou, X.; Zhang, S.; Dai, X.; Zhang, X.; Igarashi, Y.; Luo, F. Algicidal Effect of Tryptoline Against Microcystis aeruginosa: Excess Reactive Oxygen Species Production Mediated by Photosynthesis. Sci. Total Environ. 2022, 806 Pt 4, 150719. [Google Scholar] [CrossRef]
  7. Giannuzzi, L.; Krock, B.; Minaglia, M.C.C.; Rosso, L.; Houghton, C.; Sedan, D.; Malanga, G.; Espinosa, M.; Andrinolo, D.; Hernando, M. Growth, Toxin production, Active Oxygen Species and Catalase Activity of Microcystis aeruginosa (Cyanophyceae) Exposed to Temperature Stress. Comp. Biochem. Physiol. Part C Toxicol. Pharmacol. 2016, 189, 22–30. [Google Scholar] [CrossRef]
  8. Wang, W.; Sheng, Y.; Jiang, M. Physiological and Metabolic Responses of Microcystis aeruginosa to a Salinity Gradient. Environ. Sci. Pollut. Res. 2022, 29, 13226–13237. [Google Scholar] [CrossRef] [PubMed]
  9. Liu, Y.; Chen, S.; Chen, X.; Zhang, J.; Gao, B. Interactions Between Microcystis aeruginosa and Coexisting Amoxicillin Contaminant at Different Phosphorus Levels. J. Hazard. Mater. 2015, 297, 83–91. [Google Scholar] [CrossRef]
  10. Babić, S.; Horvat, A.J.M.; Mutavdžić Pavlović, D.; Kaštelan-Macan, M. Determination of pKa values of active pharmaceutical ingredients. TrAC Trends Anal. Chem. 2007, 26, 1043–1061. [Google Scholar] [CrossRef]
  11. Hillis, D.G.; Lissemore, L.; Sibley, P.K.; Solomon, K.R. Effects of monensin on zooplankton communities in aquatic microcosms. Environ. Sci. Technol. 2007, 41, 6620–6626. [Google Scholar] [CrossRef]
  12. Odongo, N.E.; Bagg, R.; Vessie, G.; Dick, P.; Or-Rashid, M.M.; Hook, S.E.; Gray, J.T.; Kebreab, E.; France, J.; McBride, B.W. Long-Term Effects of Feeding Monensin on Methane Production in Lactating Dairy Cows. J. Dairy Sci. 2007, 90, 1781–1788. [Google Scholar] [CrossRef] [PubMed]
  13. Appuhamy, J.A.D.R.N.; Strathe, A.B.; Jayasundara, S.; Wanger-Riddle, C.; Dijkstra, J.; France, J.; Kebreab, E. Anti-methanogenic effects of monensin in dairy and beef cattle: A meta-analysis. J. Dairy Sci. 2013, 96, 5161–5173. [Google Scholar] [CrossRef]
  14. Watanabe, N.; Harter, T.H.; Bergamaschi, B.A. Environmental occurrence and shallow ground water detection of the antibiotic monensin from dairy farms. J. Environ. Qual. 2008, 37 (Suppl. S5), S-78–S-85. [Google Scholar] [CrossRef]
  15. Sandoz, M.A.; Wooten, K.J.; Clendening, S.L.; Hensley, L.L.; Smith, L.R.; Smith, P.N. Transport mechanisms for veterinary pharmaceuticals from beef cattle feedyards to wetlands: Is aerial deposition a contributing source. Agric. Ecosyst. Environ. 2018, 252, 14–21. [Google Scholar] [CrossRef]
  16. Sassman, S.A.; Lee, L.S. Sorption and degradation in soils of veterinary ionophore antibiotics: Monensin and lasalocid. Environ. Toxicol. Chem. 2007, 26, 1614–1621. [Google Scholar] [CrossRef]
  17. Alonso, L.L.; Demetrio, P.M.; Capparelli, A.L.; Marino, D.J.G. Behavior of ionophore antibiotics in aquatic environments in Argentina: The distribution on different scales in water courses and the role of wetlands in depuration. Environ. Int. 2019, 133 Pt A, 105144. [Google Scholar] [CrossRef]
  18. Dolliver, H.; Kumar, K.; Gupta, S.; Singh, A. Application of Enzyme-Linked Immunosorbent Assay Analysis for Determination of Monensin in Environmental Samples. J. Environ. Qual. 2008, 37, 1220–1226. [Google Scholar] [CrossRef] [PubMed]
  19. Li, Y.; Chen, L.; Zhou, N.; Chen, Y.; Ling, Z.; Xiang, P. Microplastics in the human body: A comprehensive review of exposure, distribution, migration mechanisms, and toxicity. Sci. Total Environ. 2024, 946, 174215. [Google Scholar] [CrossRef]
  20. Cortés, C.; Domenech, J.; Salazar, M.; Pastor, S.; Marcos, R.; Hernández, A. Nano-plastics as a potential environmental health factor: Effects of polystyrene nanoparticles on human intestinal epithelial Caco-2 cells. Environ. Sci. 2020, 7, 272–285. [Google Scholar] [CrossRef]
  21. Ramachandraiah, K.; Ameer, K.; Jiang, G.; Hong, G. Micro- and nano-plastic contamination in livestock production: Entry pathways, potential effects and analytical challenges. Sci. Total Environ. 2022, 844, 157234. [Google Scholar] [CrossRef] [PubMed]
  22. Yang, Y.; Li, P.; Jiao, J.; Yang, Z.; Lv, M.; Li, Y.; Zhou, C.; Wang, C.; He, Z.; Liu, Y.; et al. Renewable sourced biodegradable mulches and their environment impact. Sci. Hortic. 2020, 268, 109375. [Google Scholar] [CrossRef]
  23. Vivekanand, A.C.; Mohapatra, S.; Tyagi, V.K. Microplastics in aquatic environment: Challenges and perspectives. Chemosphere 2021, 282, 131151. [Google Scholar] [CrossRef] [PubMed]
  24. Lutz, W.K.; Wipf, H.K.; Simon, W. Alkali cation specificity and carrier properties of the antibiotics nigericin and monensin. Helv. Chim. Acta 1970, 53, 1741–1746. [Google Scholar] [CrossRef]
  25. Sandeaux, R.; Sandeaux, J.; Gavach, C.; Brun, B. Transport of Na+ by monensin across bimolecular lipid membranes. Biochim. Biophys. Acta Biomembr. 1982, 684, 127–132. [Google Scholar] [CrossRef]
  26. Russell, J.B. A proposed mechanism of monensin action in inhibiting ruminal bacterial growth: Effects on ion flux and protonmotive force. J. Anim. Sci. 1987, 64, 1519–1525. [Google Scholar] [CrossRef]
  27. Siddiqui, A.S.; Singh, S.; Bahmid, N.A.; Shyu, D.J.H.; Dominguez, R.; Lorenzo, J.M.; Pereira, J.A.M.; Camera, J.S. Polystyrene microplastic particles in the food chain: Characteristics and toxicity—A review. Sci. Total Environ. 2023, 892, 164531. [Google Scholar] [CrossRef]
  28. Easton, T.; Budhiraja, V.; He, Y.; Zhang, Q.; Arora, A.; Koutsos, V.; Chatzisymeon, E. Antibiotic Adsorption by Microplastics: Effect of Weathering, Polymer Type, Size, and Shape. Environments 2025, 12, 120. [Google Scholar] [CrossRef]
  29. Wang, Y.; Yang, Y.; Liu, X.; Zhao, J.; Liu, R.; Xing, B. Interaction of Microplastics with Antibiotics in Aquatic Environment: Distribution, Adsorption, and Toxicity. Environ. Sci. Technol. 2021, 55, 15579–15595. [Google Scholar] [CrossRef]
  30. Manawadu, B.; Senavirathna, M.D.H.J.; Fujino, T. Individual and combined effects of ionophore antibiotics monensin and lasalocid on growth, oxidative stress and antioxidant responses of Microcystis aeruginosa. Water Sci. Technol. 2024, 90, 2585–2601. [Google Scholar] [CrossRef]
  31. Behara, S.; Das, S. Environmental impacts of microplastic and role of plastisphere microbes in the biodegradation and upcycling of microplastic. Chemosphere 2023, 334, 138928. [Google Scholar] [CrossRef] [PubMed]
  32. Brooks, B.W.; Lazorchak, J.M.; Meredith, D.A.; Johnson, M.V.; Morton, S.L.; Perkins, D.A.K.; Reavie, E.D.; Scott, G.I.; Smith, S.A.; Steevens, J.A. Are Harmful Algal Blooms Becoming the Greatest Inland Water Quality Threat to Public Health and Aquatic Ecosystems. Environ. Toxicol. Chem. 2015, 35, 6–13. [Google Scholar] [CrossRef] [PubMed]
  33. Pérez, D.J.; Okada, E.; Iturburu, F.G.; De Gerónimo, E.; Cantón, G.; Aparicio, V.C.; Costa, J.L.; Menone, M.L. Monensin occurrence in surface water and its impact on aquatic biota in a stream of the southeast Pampas, Argentina. Environ. Sci. Pollut. Res. 2021, 28, 8530–8538. [Google Scholar] [CrossRef]
  34. Zheng, X.; Zhang, W.; Yuan, Y.; Yanyao, L.; Liu, X.; Wang, X.; Fan, Z. Growth inhibition, toxin production and oxidative stress caused by three microplastics in Microcystis aeruginosa. Ecotoxicol. Environ. Saf. 2021, 208, 111575. [Google Scholar] [CrossRef]
  35. Hong, Y.; Boiti, A.; Vallone, D.; Foulkes, N.S. Reactive Oxygen Species Signaling and Oxidative Stress: Transcriptional Regulation and Evolution. Antioxidants 2024, 13, 312. [Google Scholar] [CrossRef] [PubMed] [PubMed Central]
  36. Li, N.; Zeng, Z.; Zhang, Y.; Zhang, H.; Tang, N.; Guo, Y.; Lu, L.; Li, X.; Zhu, Z.; Gao, X.; et al. Higher toxicity induced by co-exposure of polystyrene microplastics and chloramphenicol to Microcystis aeruginosa: Experimental study and molecular dynamics simulation. Sci. Total Environ. 2023, 866, 161375. [Google Scholar] [CrossRef]
  37. Zhang, T.; Jiang, B.; Xing, Y.; Ya, H.; Lv, M.; Wang, X. Current status of microplastics pollution in the aquatic environment, interaction with other pollutants, and effects on aquatic organisms. Environ. Sci. Pollut. Res. 2022, 29, 16830–16859. [Google Scholar] [CrossRef] [PubMed]
  38. Li, J.; Zhang, K.; Zhang, H. Adsorption of antibiotics on microplastics. Environ. Pollut. 2018, 237, 460–467. [Google Scholar] [CrossRef]
  39. R Nałęcz-Jawecki, G.; Giebułtowicz, J.; Chojnacka, J.; Pajchel, Ł.; Drobniewska, A. The Sorption of Antidepressant Pharmaceuticals on Virgin and Aged Microplastics Is Lower than Bioconcentration in Protozoa. Water 2024, 16, 2514. [Google Scholar] [CrossRef]
  40. Latifi, A.; Ruiz, M.; Zhang, C. Oxidative stress in cyanobacteria. FEMS Microbiol. Rev. 2008, 33, 258–278. [Google Scholar] [CrossRef]
  41. Zhou, X.; Zhou, S.; Duan, X.; Zhang, N.; Ren, Y.; Liang, L.; Ye, X. Effects of polystyrene microplastics on growth, physiological traits of Microcystis aeruginosa and microcystin production and release. Environ. Pollut. 2025, 373, 126178. [Google Scholar] [CrossRef] [PubMed]
  42. Dunn, R.M.; Manoylov, K.M. The Effects of initial cell density on the growth and proliferation of the potentially toxic cyanobacterium Microcystis aeruginosa. J. Environ. Prot. 2016, 7, 1210–1220. [Google Scholar] [CrossRef]
  43. Keung Wong, Y. Algae; IntechOpen: London, UK, 2019. [Google Scholar] [CrossRef]
  44. Oginni, G.F.; Dzakpasu, L.S.; Babu, W.A.; Ezekiel, A.O. Relative effects of varying light conditions on the growth of toxic and non-toxic strains of Microcystis aeruginosa. J. Environ. Prot. 2021, 12, 1161–1173. [Google Scholar] [CrossRef]
  45. Lichtenthaler, K.H. Chlorophyll and carotenoids; pigments of photosynthetic bio membranes. In Methods in Enzymology; Academic Press: Cambridge, MA, USA, 1987; Volume 148. [Google Scholar] [CrossRef]
  46. ISO 10260; Water Quality—Measurement of Biochemical Parameters—Spectrometric Determination of the Chlorophyll-a Concentration. ISO: Geneva, Switzerland, 1992.
  47. Bradford, M.M. A rapid and sensitive method for the quantitation of microgram quantities of protein utilizing the principle of protein-dye binding. Anal. Biochem. 1976, 72, 248–254. [Google Scholar] [CrossRef]
  48. Patterson, B.D.; Iviacrae, E.A.; Fergusont, A.B. Estimation of hydrogen peroxide in plant extracts using titanium(W). Anal. Biochem. 1984, 139, 487–492. [Google Scholar] [CrossRef]
  49. Aebi, H. Catalase in vitro. Methods Enzymol. 1984, 105, 121–126. [Google Scholar] [CrossRef]
  50. Ewing, J.F.; Janero, D.R. Microplate superoxide dismutase assay employing a nonenzymatic superoxide generator. Anal. Biochem. 1995, 232, 243–248. [Google Scholar] [CrossRef]
Figure 1. Flow of waste materials from livestock farming operations and microplastic-releasing industries towards nearby freshwater ponds. Under the presence of macro- and micronutrients, optimum lighting (PAR), and optimum temperature, cyanobacteria such as Microcystis aeruginosa tend to form bloom conditions. Contaminants such as monensin and polystyrene microplastics might alter the growth, oxidative stress levels, and antioxidants levels of M. aeruginosa.
Stresses 05 00043 g001
Figure 2. (a) Microcystis aeruginosa stock cultures used to arrange treatment. (b) Microscopic view of starting cultures of M. aeruginosa at day zero [Keyence BZ-XB10 fluorescence microscope at (44.4 × magnification)]. (c) Treatment flasks of M. aeruginosa treated with monensin and 3 µm polystyrene microplastics. (d) Microscopic view of M. aeruginosa culture under the treatment of monensin 500 µg/L and 3 µm polystyrene microplastics 6 mg/L at day 7.
Stresses 05 00043 g002
Figure 3. Optical density (OD730) distribution of Microcystis aeruginosa cultures at day 3, day 5, and day 7 under monensin (0, 50, 250, and 500 µg/L) treatment. (a) Under the exposure of 0.25 mg/L 3 µm polystyrene microplastics (PEMPs), (b) under the exposure of 1.25 mg/L PEMPs, and (c) under the exposure of 6 mg/L PEMPs. Error bars represent the standard error.
Stresses 05 00043 g003
Figure 4. Optical density (OD730) distribution of Microcystis aeruginosa cultures at (a) day 3, (b) day 5, and (c) day 7 under monensin (0, 50, 250, and 500 µg/L) and 3 µm polystyrene microplastics (PEMPs—0.25, 1.25, and 6 mg/L) exposure. Error bars represent the standard error. Significant (p < 0.05) treatments of each PEMP group compared to relevant control are indicated as ‘*’.
Stresses 05 00043 g004
Figure 5. Cellular protein contents (µg /mL) of Microcystis aeruginosa cultures at (a) day 3, (b) day 5, and (c) day 7 under monensin (0, 50, 250, and 500 µg/L) and 3 µm polystyrene microplastics (PEMPs—0.25, 1.25 and 6 mg/L) exposure. Error bars represent the standard error. Significant treatments (p < 0.05) of each PEMP group compared to relevant control are indicated as ‘*’.
Stresses 05 00043 g005
Figure 6. Chlorophyll ‘a’ content [chlorophyll ‘a’ (µg/mL)/cellular protein (µg/mL)] of Microcystis aeruginosa cultures at (a) day 3, (b) day 5, and (c) day 7 under monensin (0, 50, 250, and 500 µg/L) and 3 µm polystyrene microplastics (PEMPs—0.25, 1.25 and 6 mg/L) exposure. Error bars represent the standard error. Significant (p < 0.05) treatments of each PEMP group compared to relevant control are indicated as ‘*’.
Stresses 05 00043 g006
Figure 7. Oxidative stress levels [H2O2 (µM)/cell protein (µg/mL)] of Microcystis aeruginosa cultures at day 7 under monensin (0, 50, 250, and 500 µg/L) and 3 µm polystyrene microplastics (PEMPs—0.25, 1.25, and 6 mg/L) exposure. Error bars represent the standard error. Significant (p < 0.05) treatments of each PEMP group compared to relevant control are indicated as ‘*’.
Stresses 05 00043 g007
Figure 8. CAT activity [micromoles of hydrogen peroxide consumed per minute per unit weight (µg) of cellular protein in the sample (μmol/min/µg)] of Microcystis aeruginosa cultures at day 7 under monensin (0, 50, 250 and 500 µg/L) and 3 µm polystyrene microplastics (PEMPs—0.25, 1.25, and 6 mg/L) exposure. Error bars represent the standard error. Significant (p < 0.05) treatments of each PEMP group compared to relevant control are indicated as ‘*’.
Stresses 05 00043 g008
Figure 9. GPX activity [micromoles of tetra-guaiacol produced per minute per unit weight (µg) of cellular protein in the sample (μmol/min/µg)] of Microcystis aeruginosa cultures at day 7 under monensin (0, 50, 250 and 500 µg/L) and 3 µm polystyrene microplastics (PEMPs—0.25, 1.25, and 6 mg/L) exposure. Error bars represent the standard error. Significant (p < 0.05) treatments of each PEMP group compared to relevant control are indicated as ‘*’.
Stresses 05 00043 g009
Figure 10. Experimental conditions and parameters (PEMPs: polystyrene microplastics).
Stresses 05 00043 g010
Disclaimer/Publisher’s Note: The statements, opinions and data contained in all publications are solely those of the individual author(s) and contributor(s) and not of MDPI and/or the editor(s). MDPI and/or the editor(s) disclaim responsibility for any injury to people or property resulting from any ideas, methods, instructions or products referred to in the content.

