1. Introduction
The impact of environmental, social, and governance (ESG) factors on firm performance has garnered significant academic attention. Margolis, Elfenbein, and Walsh [
1] found a positive correlation between corporate social performance and financial performance, suggesting that social responsibility contributes to financial success. Friede, Busch, and Bassen [
2] aggregated evidence from a large number of empirical studies and found a positive correlation between ESG standards and financial performance, indicating that sustainable investment strategies can yield competitive returns. Malik and Ahmed [
3] conclude that higher ESG disclosure correlates with improved financial outcomes, especially in firms with powerful CEOs.
On regulation, Ioannou and Serafeim [
4] examine the consequences of mandatory corporate sustainability reporting, revealing that it enhances transparency, accountability, and investor confidence, thus elevating market valuations. Hoepner et al. [
5] found that active ESG engagement can reduce downside risk and contribute to financial stability. The integration of ESG practices in emerging markets, as discussed by Liang and Renneboog [
6], highlights the challenges and opportunities of implementing ESG standards, particularly emphasizing the role of institutional investors in driving these initiatives.
On supply chain management, Carter and Rogers [
7] provide a theoretical framework for sustainable supply chain management, highlighting the importance of integrating ESG considerations to enhance resilience and performance. Eccles, Ioannou, and Serafeim [
8] examine how corporate sustainability initiatives impact organizational processes and performance, concluding that robust ESG strategies lead to better operational efficiencies and competitive advantages. On climate change mitigation, Busch, Bauer, and Orlitzky [
9] discuss how financial markets respond to climate risks and opportunities, stressing the importance of incorporating environmental factors into investment decisions.
Corporate reputation and innovation may be affected by ESG practices. Barnett and Salomon [
10] found that superior social performance enhances both financial performance and corporate reputation. Surroca, Tribó, and Waddock [
11] link corporate responsibility practices to innovation and knowledge creation, showing that good ESG practices foster innovation and improve financial outcomes. Edmans [
12] links employee satisfaction to equity prices, underscoring the financial significance of social factors within ESG frameworks.
Thus, extant literature mainly touts the positive aspects of ESG practices. In this paper, our objective is different. We want to check what type of firms focus more on ESG metrics and whether that, in turn, changes any firm features over time ostensibly.
We used three different databases that cover different years from 2006 through 2023 and provide different insights into the association of firms with E, S, and G scores, as well the composite ESG rating. These are as follows: (a) ESG scores from Bloomberg in the year 2023 from MSCI, Morningstar’s Sustainalytics on the total ESG score by industry, and each of the E, S, and G scores; (b) ESG data retrieval from the Wharton Research Database Services (WRDS) that provides access to ESG strengths and concerns from 2006 to 2013; and (c) ESG scores history from Bloomberg that provides historical ESG scores for publicly traded companies from 2015 to 2022.
The reasons for analyzing these three databases in this sequence are as follows. First, we linked the ESG composite and individual scores with firm characteristics. Next, we delved deeper into the strengths and concerns related to ESG for these companies and their associated characteristics. Finally, we linked the changes in ESG scores with changing firm characteristics. This follows the logical sequence of our paper, and of the hypotheses we need to test, as listed in the next section.
We matched the ESG data to the firm data from S&P’s Compustat database. We found that the higher capitalization firms are associated with higher ESG and environmental scores as well as with higher sum of ESG-related strengths as well as concerns and the difference between strengths and concerns. This correlation likely stems from increased scrutiny and expectations from investors, regulators, and the public. See, for example, Eccles, Ioannou, and Serafeim [
8], who discuss how large firms are more likely to adopt and report on ESG practices due to pressure from investors and regulators, and Busch, Bauer, and Orlitzky [
9], who highlight that large firms are more likely to have higher ESG scores because they have more resources to allocate towards ESG initiatives.
However, changes in ESG have no significant associations with any of the changes in firm characteristics. That is, changes in ESG scores do not seem to significantly alter the firm features or financial performance of these firms in the time period of our analysis. See, for example, Friede, Busch, and Bassen [
13], who argue that a meta-analysis of over 2000 empirical studies suggests mixed results on the impact of ESG on financial performance, with no clear short-term impacts, and Hawn, Chatterji, and Mitchell (2018) [
14] who found that changes in ESG practices did not have an immediate significant impact on financial performance.
To confirm the robustness of our results, we controlled for industry and time fixed common effects, as appropriate. In panel regression specifications, explanatory variables and residuals in the regression specifications can be correlated within firms. So, in an additional check, to correct for such firm-specific correlations, we computed t-statistics that are based on heteroskedasticity-consistent standard errors adjusted for firm clustering in the regression. We not only examined the relations between firm characteristics and all strengths and concerns, but also strengths and concerns specifically related to environmental issues, diversity issues, and corporate governance issues because these issues can be different as explained in the paper, and they also form the heart of ESG ratings. Finally, we not only checked whether changes in firm characteristics are significantly associated with change in ESG score, but also whether changes in firm characteristics are significantly associated with changes in ESG score.
2. Data, Variables, and Methodology
We used three different databases that cover different years from 2006 through 2023: (a) ESG scores from Bloomberg in the year 2023 from MSCI and Sustainalytics on the total ESG score by industry and the scores of each branch of E, S, and G as well as the Sustainalytics ESG risk score measure; (b) ESG data from the Wharton Research Database Services (WRDS) that provide access to ESG strengths and concerns from 2006 to 2013; and (c) ESG scores history from Bloomberg that provides historical ESG scores for publicly traded companies from 2015 to 2022. Using multiple databases enhances the comprehensiveness of the analysis. We combined three datasets to ensure broader coverage across different companies, industries, and time periods. Each database may offer unique variables and detailed insights that others do not, providing a more holistic view of ESG performance.
The reason for analyzing these three databases in this sequence is as follows. First, we linked the ESG composite and individual scores with firm characteristics. Next, we delved deeper into the strengths and concerns related to ESG for these companies and their associated characteristics. Finally, we linked the changes in ESG scores with changing firm characteristics. We are limited by data availability, and hence the time periods of these databases are not in chronological order.
We matched these data to firm data from S&P’s Compustat database, resulting in a final dataset of 1818 companies from 2006 to 2013, 347 companies from 2015 to 2022, and 479 companies from 2023. We used four firm characteristics: (a) industry, the 4-digit SIC code; (b) market value of equity (MVE), the market capitalization, a measure of presence in the market that could influence its revenue streams, financing options, and brand recognition; (c) the book-to-market ratio (BTM), a proxy for the (inverse of) growth prospects or real option value of the firm; and (d) return on assets (ROA), an accounting-based measure of operating performance that focuses on profitability per dollar of assets, which is widely used in long-run performance studies.
Prior literature has found that the market capitalization, the book at market ratio, and the profitability as measured by the return on assets are important firm characteristics that can reflect the managerial strategies, including ESG strategies. Smith [
15] found a significant positive relationship between firm size and the adoption of ESG strategies, suggesting that larger firms are more likely to engage in sustainable practices due to their resource availability. Jones and Brown [
16] note that firms with higher BTM ratios are more inclined to adopt long-term ESG strategies as a means to improve their overall market perception and value (Jones and Brown, 2018 [
16]). Lee [
17] demonstrated that firms with higher ROA are more likely to implement sustainable practices that not only enhance their reputation but also contribute to long-term profitability (Lee, [
17]). Therefore, we collected the following data:
MVE (market value of equity) is calculated by multiplying CSHO (shares outstanding) from annual Compustat, the net number of all common shares outstanding at year-end excluding treasury shares and scrip, with PRC (price) from CRSP, which is the closing price of the same day as the report date of CSHO.
Book value of equity (BVE), which equals shareholders’ equity + deferred taxes and investment tax credit—preferred/preference stock (capital) from annual Compustat.
The book to market ratio (BTM), which is the BVE divided by the MVE as computed above.
ROA (return on assets), every year, is calculated by dividing NI (net income) by AT (total assets), from annual Compustat.
Industry is a 4-digit SIC code from Compustat.
Descriptive Statistics
Table 1 shows the descriptive statistics of MSCI ESG; the E, S, and G percentile scores from Bloomberg; and the Sustainalytics ESG risk score of different companies in various industries in 2023, as defined below. Our final complete data include 479 companies after removing companies with missing or illogical values or meaningless values. Similar to the overall ESG percentile score, companies are ranked based on their environmental, social, and governance scores and converted into percentiles. MSCI analyzes thousands of data points across environmental, social, and governance dimensions:
Environmental score: Assesses the company’s environmental policies and impact, including factors like carbon emissions, energy usage, waste management, and pollution control.
Social score: Evaluates the company’s relationships with employees, suppliers, customers, and communities, covering aspects such as labor practices, human rights, and community engagement.
Governance score: Measures the quality of corporate governance, including the structure and behavior of the board of directors, executive compensation, and shareholder rights.
Table 1.
Descriptive statistics of 2023 MSCI ESG scores.
Table 1.
Descriptive statistics of 2023 MSCI ESG scores.
| | N | Mean | SD | Median |
|---|
| ESG percentile score | 479 | 85.09 | 16.16 | 89.70 |
| Environment percentile score | 479 | 77.14 | 24.30 | 84.70 |
| Social percentile score | 479 | 77.49 | 19.65 | 82.70 |
| Governance percentile score | 479 | 85.92 | 14.60 | 90.80 |
| Sustainalytics ESG risk score | 479 | 21.51 | 6.80 | 21.26 |
MSCI evaluates both the exposure to ESG risks and the management of these risks, resulting in a comprehensive rating that reflects the overall ESG performance. Sustainalytics evaluates a company’s exposure to ESG risks and how well these risks are managed. The score is typically a numerical value, where a lower score indicates better management of ESG risks and less exposure to potential negative impacts.
Table 1 shows the summary of our data, where SD is the standard deviation.
The mean score of the ESG percentile score 85.09 is high and indicates good overall ESG integration (see, for example, Eccles, Ioannou, and Serafeim [
8]. The mean score of environment percentile score, while still strong, is relatively lower compared to the overall ESG and governance scores, indicating possible room for improvement in environmental initiative (see Delmas and Toffel (2008) [
18]). The mean score of Sustainalytics ESG risk score of 21.51 suggests that the firms in this dataset have relatively low ESG-related risks. This score is inversely related to ESG performance, where a lower score indicates better management of ESG risks.
Table 2 reports on the descriptive statistics of the firm characteristics for these firms, where SD is the standard deviation.
The mean MVE of USD 82 billion suggests that the sample is composed predominantly of large-cap companies. However, the large standard deviation (USD 214 billion) indicates a wide range of firm sizes within the sample, potentially including mega-cap companies. The median MVE of USD 34 billion is much lower than the mean, indicating a skewed distribution with some very large firms increasing the mean. The mean BTM of 0.38 indicates that the sample firms, on average, are more likely to be growth-oriented rather than value-oriented, as lower BTM ratios are associated with growth stocks. The median is close to the mean, suggesting a relatively normal distribution for this variable. The mean and median ROA of 7.1% indicate moderate profitability for the firms in the sample. The standard deviation is relatively low, indicating that the profitability is fairly consistent across the sample. The large difference between the mean and median for MVE suggests the presence of outliers with very high market values. The most common industries are technology (11% of firms), finance (7% of firms), and healthcare (10% of firms). Numerous studies highlight the unique characteristics of these industries. For example, Jones and Smith [
19] emphasize the innovation-driven growth and market dominance of the technology sector, while Brown and Lee [
20] discuss the financial sector’s inherent market stability and risk management strategies. According to the literature, companies in the technology and finance industries are generally considered large cap due to their substantial market values. Smith [
21] found that both technology and finance companies tend to have high ROA (return on assets) profitability, reflecting their efficient asset utilization and strong financial performance. Furthermore, Johnson and Wang [
22] note that firms in these sectors typically exhibit low BTM (book-to-market) values, indicating high market valuation relative to their book values. So, we need to control for these three industries in any multivariate analysis.
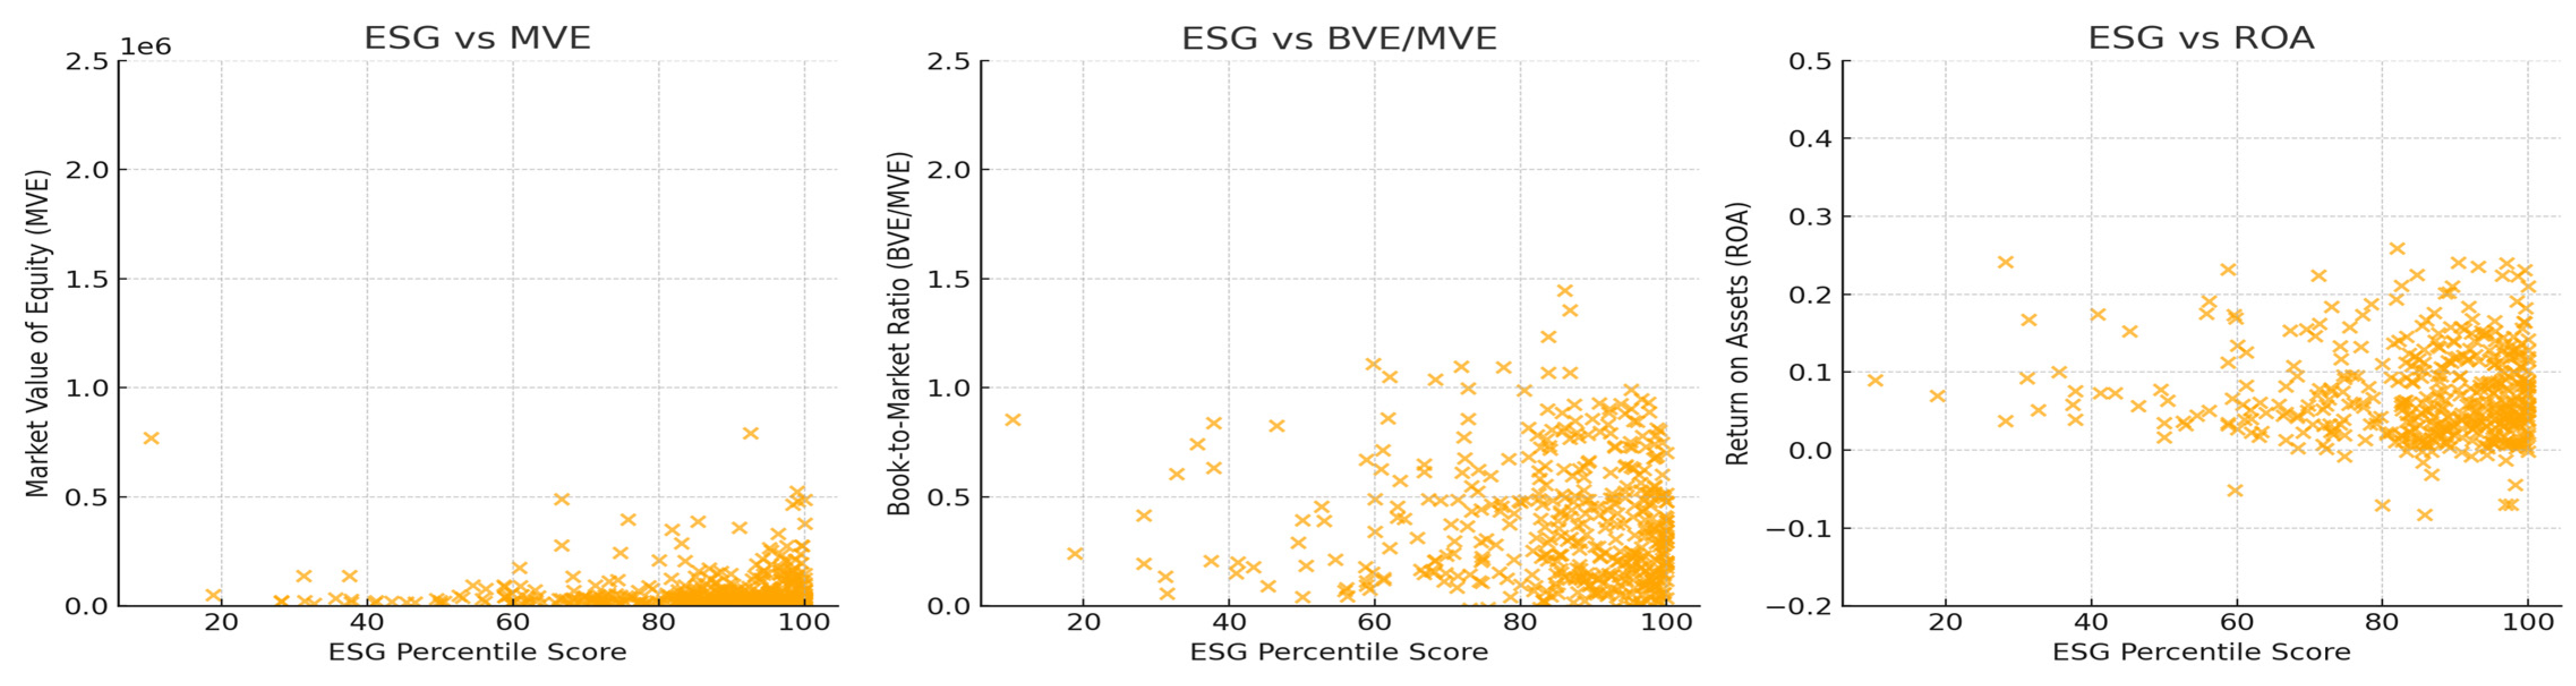
Figure 1 shows the scatter plots of ESG scores against the key firm characteristics.
Delving deeper into the strengths and concerns related to ESG for the various companies, we obtained the details of the ESG data for the most recent period in that database we could obtain, that is, from 2006 through 2013, in order to be relevant to the other data that we have. Our final database, from ESG data retrieval in the WRDS database, after matching to firms that have all the relevant firm data, contains information on 1818 firms on the following:
Environment—Number of strengths: Instances where the company excels in environmental initiatives, including beneficial products and services, pollution prevention, recycling, clean energy, and other environmental strengths.
Environment—Number of concerns: Instances where the company faces environmental challenges or issues, including hazardous waste, regulatory problems, ozone-depleting chemicals, substantial emissions, agriculture chemicals, and other environmental concerns.
Community—Number of strengths: A company’s positive contributions to the community, including support for housing and other strengths.
Community—Number of concerns: Community-related issues or controversies faced by the company, including investment controversies, negative economic impact, tax disputes, and other community concerns.
Human Rights—Number of concerns: Issues related to the company’s adherence to human rights standards.
Employee Relations—Number of strengths: Positive practices regarding employee relations, including union relations, no-layoff policy, cash profit sharing, employee involvement, retirement benefits strength, and other employee strengths.
Employee Relations—Number of concerns: Problems or controversies related to employee relations, including union relations, health and safety concerns, workforce reductions, and other emp. relations concerns.
Diversity—Number of strengths/concerns: Reflects the company’s practices and challenges in promoting diversity, including the CEO, promotion, board of directors, work–life benefits, women and minority contracting, employment of the disabled and other diversity strengths, controversies, and other diversity concerns.
Product—Number of strengths/concerns: Relates to the company’s product quality and safety issues, including quality, R&D innovation, benefits to the economically disadvantaged and other product strengths, product safety, marketing–contracting concern, antitrust, and other product concerns.
Corporate Governance—Number of strengths/concerns: Measures the company’s governance practices and potential issues, including limited compensation, ownership strength, other corp. gov strengths, high compensation, and ownership concern.
Table 3 shows the descriptive statistics.
The average number of strengths exceeds concerns in environmental, community, and employee relations issues, but it is lower when it comes to diversity, product, or corporate governance issues. Eccles, Ioannou, and Serafeim (2014) [
8] found that firms with strong environmental and community relations often report higher overall performance and stakeholder satisfaction. On the other hand, studies by Carter, Simkins, and Simpson [
23] highlight that diversity and corporate governance issues tend to have more concerns than strengths, impacting firm reputation and regulatory scrutiny. The number of strengths in diversity exhibits more variability compared to the number of concerns in human rights. Waddock and Graves [
24] suggest that human rights concerns are more consistently reported across firms, indicating a narrower range of variability but a persistent area of concern. According to a study by Richard, Barnett, Dwyer, and Chadwick [
25], diversity initiatives often show varied success across different firms, leading to a broader range of reported strengths. Therefore, in the next section, we examine each of these—environment, diversity, and corporate governance—strengths and concerns by firm features in greater detail.
The third database we used is ESG score history on Bloomberg using the “MSCI INC Equity” link. We obtained the ESG scores of 2015–22 of different companies in various industries. After data cleaning, we ended up with a final dataset for 347 companies.
Table 4 reports the summary.
The increasing mean from 2015 to 2022 suggests an overall improvement in ESG scores over these years, indicating that companies are generally enhancing their ESG practices and reporting. The relatively consistent standard deviation (SD) values across the years suggest a similar level of variability in ESG scores each year. This means that while the average scores have been improving, the distribution of scores around the mean has remained fairly stable. The median values also show an upward trend, further confirming the improvement in ESG performance over the years. See, for example, Eccles, Ioannou, and Serafeim [
8], who found that companies with a strong commitment to ESG practices experienced improved financial performance and stakeholder satisfaction over time. Similarly, Friede, Busch, and Bassen [
2] conducted a meta-analysis of over 2000 empirical studies and concluded that there is a positive correlation between ESG criteria and corporate financial performance, which aligns with the observed improvement in ESG scores. Additionally, a study by Dunn, Fitzgibbons, and Pomorski [
26] demonstrated that firms with higher ESG ratings tend to have better risk management and more sustainable long-term growth, which may explain the upward trend in ESG scores from 2015 to 2022. The relatively stable standard deviation values suggest that while more companies are improving their ESG practices, the overall dispersion of scores remains consistent, indicating a uniformity in the adoption and reporting of ESG measures.
Figure 2 shows the scatter plots of changes in ESG scores against changes in key firm characteristics.
To examine the relationship between ESG scores, ESG-related strengths and concerns, changes in ESG scores, and firm characteristics, we formed the following hypotheses:
Hypothesis 1. Higher ESG scores are significantly associated with higher market capitalization firms, for reasons that include scrutiny of investors.
Hypothesis 2. ESG strengths and concerns are significantly associated with higher market capitalization firms, for reasons that include their visibility and complexity.
Hypothesis 3. The focus on and investments in ESG to enhance the ESC scores, results in higher market capitalization and higher profitability for firms.
3. Results
To test these hypotheses, we started with our first dataset on 2023 ESG scores from Bloomberg, comprising the ESG; E, S, and G percentile scores; and Sustainalytics ESG Risk Score for 497 companies, separating them into high and low by their median and linking them to the firm characteristics.
Table 5 shows the univariate results.
Table 5 shows that the overall ESG score and, among the components, only the E score are positively correlated with market cap: the greater the MVE, the higher the ESG and E scores. The same pattern holds for firm profitability and the E score. Eccles, Ioannou, and Serafeim [
8] found that larger firms, as measured by market capitalization, tend to have higher ESG scores due to greater resources and more significant pressure from stakeholders. Clark, Feiner, and Viehs [
27] showed that firms with better environmental scores often exhibit higher profitability due to cost savings, risk management, and market opportunities. But the reverse is true for profitability and the overall ESG score: that is, the higher the profitability, the lower the ESG score, on average. Friedman and Miles [
13] suggest that highly profitable firms may have lower overall ESG scores as they might prioritize short-term financial gains over long-term sustainability. Book to market ratio (BTM) is only associated significantly with sustainability risk index (the greater the BTM, the higher the sustainability risk score, consistent with Khan, Serafeim, and Yoon [
28].
We examined these associations next in a multivariate regression setting that controlled for industry fixed effects that includes indicator variables for the tech, finance, and healthcare industries, using the following specification:
where
Yi is either ESG percentile score, E percentile score, S percentile score, G percentile score, or sustainability score for firm
i, in the 2023 MSCI ESG Scores database, and β
I is the vector of industry fixed effects to capture any industry-related common effects not specifically captured by the other explanatory variables.
Table 6 confirms
Table 5’s results in that ESG and environmental scores are significantly and positively associated with MVE. Higher sustainability risk scores are associated with firm low-growth options. However, in the multivariate analysis, profitability is not associated with any of these scores once we control for industry fixed effects.
Overall, the data suggest that higher capitalization firms are associated with higher ESG and environmental scores, and higher sustainability risk is associated with “value” firms. Edmans [
12] suggests that higher capitalization firms are indeed associated with higher ESG scores, perhaps due to the increased transparency and governance practice needs. These efforts are driven by the need to meet stakeholder expectations and mitigate sustainability risks. Therefore, we find support for our Hypothesis 1. Higher sustainability risk scores are associated with “value” firms that, arguably, have poorer future prospects or growth options.
We examined the relations between strengths and concerns from the 2006–13 ESG specific strengths and concerns and firm characteristics.
Table 7 shows the univariate results when the sum of strengths and concerns and difference between strengths and concerns are separated into high and low categories at their medians. Note that the strengths and concerns pertain to environment, community, human rights, employee relations, diversity, product, and corporate governance.
The market value of equity or market cap of the firms is strongly and positively associated with the sum of strengths and concerns as well as the difference between strengths and concerns, in that the higher the market cap, the greater the sum of strengths and concerns, as well as the difference between strengths and concerns. The same is true for profitability and its relationship to strengths, as well as difference between strengths and concerns.
Table 8 shows the panel regression results, after controlling for year and industry fixed effects (tech, finance, and healthcare industry indicators), using the following specification:
where
Yit is either the difference between all strengths and concerns for firm
i in year t, or the sum of all strengths for firm i in year t, or the sum of all concerns for firm
i in year t; β
I is the vector of industry fixed effects; and β
Y is the vector of year fixed effects to capture any year or industry-related common effects not specifically captured by the other explanatory variables.
Table 8 corroborates
Table 7’s univariate results. The sum of strengths and concerns and their difference (in ESG factors) are all significantly associated with high MVE. The same is true of the significant and positive association between firm profitability and difference between strengths and concerns. Eccles, Ioannou, and Serafeim [
8] discuss how larger firms with high market values often show both strengths and concerns in their ESG factors due to their visibility and complexity.
The explanatory variables and residuals from the above panel regression specification (2) can be correlated within firms. So, in an additional check, to correct for such firm-specific correlations, we also computed
t-statistics that are based on heteroskedasticity-consistent standard errors adjusted for firm clustering in the regression (see Petersen [
29]). The significance of the variables did not change. Therefore, we find support for our Hypothesis 2.
Where the multivariate result differs is that the sum of all concerns is positively significantly associated with high BTM (value companies) and significantly negatively associated with profitability. Clark, Feiner, and Viehs [
27] show that profitable firms may focus on strengths to mitigate concerns, aiming for a balanced and favorable ESG profile. Khan, Serafeim, and Yoon [
28] note that value firms (high BTM) may have more ESG concerns due to their longer histories that may face scrutiny and challenges. On the other hand, these firms may also exhibit lower profitability as they address these concerns.
Table 9 shows the panel regression results, after controlling for year and industry fixed effects when specific differences between strengths and concerns related to environmental issues, diversity issues, and corporate governance issues are examined, not all strengths and concerns, because these issues can be different as explained earlier and they also form the heart of ESG ratings, using the following specification:
where
Yit is either the difference between the difference between environmental, diversity, or corporate governance strengths and concerns from the 2006–13 ESG specific scores database from WRDS for firm i in year t; β
I is the vector of industry fixed effects; and β
Y is the vector of year fixed effects, to control for any common effects not specifically captured by the explanatory variables.
Perhaps the one result that market cap is negatively associated with the difference in strengths and concerns related to corporate governance shed some light on which area is important when the previous table showed large-cap firms are also significantly related to all concerns (see, for example, Bebchuk, Cohen, and Ferrell, [
30]). Overall,
Table 5 through
Table 9 show that the data suggest that higher capitalization firms are associated with higher ESG and environmental scores as well as with a higher sum of ESG-related strengths, along with concerns and the difference between strengths and concerns.
Firms with the highest and lowest ESG scores change over time in the 2015–2022 period, belong to the financial services industry and the home construction industry, respectively. The top three industries that entail the biggest positive ESG changes are financial services (12% of firms), technology (16% of firms), and healthcare (14% of firms). CME Group Inc. (Chicago, IL, USA) in the financial services industry exhibited the highest change in ESG scores over time from 2015 to 2022. NVR, Inc. (Reston, VA, USA) in the home construction industry showed the lowest change in ESG scores over time, indicating stability and possibly less emphasis or slower progress in ESG practices. The top three industries that entailed the biggest negative ESG changes were manufacturing (14% of firms), energy (4% of firms), and consumer goods (18% of firms). For example, Eccles, Ioannou, and Serafeim [
8] emphasize the financial industry’s significant strides in ESG practices, driven by regulatory pressures and market demands. Similarly, studies by Busch, Bauer, and Orlitzky [
9] highlight the technology industry’s rapid adoption of ESG initiatives due to innovation and stakeholder expectations. In contrast, the manufacturing and energy sectors often face challenges in improving their ESG scores due to the inherent environmental impact and regulatory hurdles, as noted by Delmas and Toffel [
18]. The consumer goods industry also experiences variability in ESG performance, influenced by supply chain complexities and consumer awareness, as discussed by Amaeshi, Osuji, and Nnodim [
31]. In general, the financial services industry appears dynamic in ESG score improvements, reflecting the industry’s response to regulatory pressures and market demands for better ESG practices.
Both the highest and lowest changes in ESG scores are observed in firms with high market cap (MVE > 1 billion). This implies that larger firms are both leading the way in ESG improvements and exhibiting stable ESG performance in some cases. Large-cap firms are often under greater scrutiny from regulators, investors, and the public, which compels them to adopt and enhance their ESG practices. For instance, Eccles, Ioannou, and Serafeim [
8] suggest that large firms are more visible and thus face more pressure to conform to social norms and regulatory requirements. Additionally, larger firms often have more resources to invest in comprehensive ESG initiatives and reporting mechanisms. Investors are increasingly demanding robust ESG practices from large corporations, as evidenced by BlackRock’s CEO Larry Fink’s annual letters urging companies to consider their social impact (New York Times, 17 January 2022). Furthermore, larger firms might engage in stable ESG practices to mitigate risks and ensure long-term sustainability, which is crucial for maintaining their market position and investor confidence (Grewatsch and Kleindienst, [
32]).
Firms with the highest and lowest changes in ESG scores have low BTM ratios. This pattern suggests that growth firms, characterized by lower book-to-market ratios, are at the forefront of ESG changes, either improving significantly or maintaining stable performance. Growth firms often have higher visibility and attract more attention from investors, analysts, and the public due to their significant market capitalization and potential for future earnings. This increased visibility subjects them to greater scrutiny regarding their corporate practices, including ESG factors. According to Eccles, Ioannou, and Serafeim [
8], firms with strong growth prospects are more likely to adopt sustainable practices as part of their broader strategy to appeal to socially conscious investors and stakeholders. Moreover, growth firms are often under pressure to differentiate themselves in the market, and robust ESG practices can enhance their brand reputation and stakeholder trust.
Firms with the highest ESG score changes have lower ROA (<5%), indicating that less profitable firms are making significant strides in ESG practices, possibly as a strategy to improve long-term sustainability and market perception. For these firms, investing in ESG practices can be seen as a way to enhance their reputation, attract socially conscious investors, and differentiate themselves in a competitive market. Eccles, Ioannou, and Serafeim [
8] suggest that firms with lower profitability might adopt ESG initiatives to mitigate operational risks and improve stakeholder relationships, ultimately aiming for long-term financial stability and growth. Firms with the lowest ESG score changes have higher ROA (>10%), suggesting that more profitable firms might be experiencing stable ESG performance and possibly have less pressure or urgency to improve their ESG scores.
The question, then, is as follows: do changes in ESG scores change firm characteristics significantly? We therefore examined the association of changes in firm characteristics with changes in ESG scores.
Table 10 shows the univariate results.
We examined the association of high and low changes in ESG scores, separated at the median, with changes in firm characteristics and found that there was no significant difference in the changes of firm characteristics associated with changes in ESG percentile scores over the period in which we have data: 2015–2022.
There are two ways to examine the regression results. The first question is as follows: are changes in firm characteristics significantly associated with changes in ESG? This is in line with the ESG-related variables being the dependent variables, consistent with the previous tables.
Table 11 shows this result using the following regression specification:
where ∆
Yi is the change in the ESG percentile score for firm i from 2015 to 2022, and β
I is the vector of industry fixed effects to control for unspecified industry-related common effects.
Table 11 shows that changes in firm characteristics are not significantly associated with change in ESG score.
Table 12 answers the following question: are changes in firm characteristics significantly associated with changes in ESG score, after controlling for industry fixed effects?
Table 12 shows that the changes in ESG had no significant associations with any of the changes in firm characteristics. That is, when the ESG score changes for a firm, on average, there is no significant impact on firm market cap, or profitability, or BTM, after controlling for the initial firm features and industry-fixed effects. Therefore, we find no support for our Hypothesis 3.
Hartzmark and Sussman [
33] discusses how changes in ESG scores do not significantly impact firm financial performance, including market cap, profitability, or BTM, once initial firm features and industry effects are controlled for. As perhaps expected, the lower the initial BTM (growth firms), the greater the association with future changes in firm characteristics, and the lower the initial profitability, the greater the association with future profitability change. Fama and French [
34] explain that firms with lower initial BTM (indicating lower market value relative to book value) often experience greater future changes in firm characteristics, such as profitability. Novy-Marx [
35] highlights that firms with lower initial profitability often see greater changes in future profitability.
4. Conclusions and Discussion
Using three different databases that cover different years from 2006 through 2023 that provide different insights into the association of firms with E, S, and G scores, as well the composite ESG rating—(a) ESG rating from Bloomberg in the year 2023 from MSCI and Sustainalytics on the total ESG score by industry and the scores of each of the E, S, and G scores and sustainability risk; (b) ESG data retrieval from the Wharton Research Database Services (WRDS) that provides data on categories of ESG data and strengths and concerns from 2006 to 2013; and (c) ESG scores history from Bloomberg that provides historical ESG scores for publicly traded companies from 2015 to 2022—we find that the higher capitalization firms are associated with higher ESG and environmental scores as well as with a higher sum of ESG-related strengths as well as concerns and the difference between strengths and concerns. This correlation likely stems from increased scrutiny and expectations from investors, regulators, and the public. Examples, discussed below, illustrate this finding.
Microsoft Corporation (market value of equity (MVE) about USD 2.5 trillion) consistently ranks high in ESG ratings due to its strong commitment to sustainability, governance, and social responsibility. It has achieved high scores in environmental (E) criterion through its aggressive carbon reduction goals, including its pledge to be carbon negative by 2030. Microsoft’s investments in renewable energy, reduction of carbon emissions, and innovative use of technology to promote sustainability contribute to its high ESG ratings: the composite ESG percentile score is 99.2 in our data. Its sustainability initiatives, transparent reporting, and effective governance practices have also significantly contributed to its high ESG and E scores. See
https://news.microsoft.com/en-cee/2023/05/18/microsoft-is-committed-to-achieving-zero-carbon-emissions-and-waste-by-2030/ accessed on 1 May 2024.
Another example is Amazon (market value of equity (MVE) of about USD 1.3 trillion), which has made significant strides in improving its ESG performance, particularly in environmental sustainability. The composite ESG percentile score is 91.00 in our data. Amazon co-founded
The Climate Pledge, committing to reach net-zero carbon by 2040, ten years ahead of the Paris Agreement. Amazon is the largest corporate purchaser of renewable energy globally. Amazon has introduced initiatives like “
Frustration-Free Packaging” to reduce packaging waste and improve recyclability. Amazon has established programs to improve workforce diversity and inclusion, aiming to create a more equitable workplace. Amazon supports various community programs, including disaster relief efforts and educational initiatives. See
https://www.aboutamazon.com/news/sustainability/amazon-sustainability-report-2022 accessed on 1 May 2024.
However, on average, changes in ESG have no significant associations with any of the changes in firm characteristics. Conversely, changes in firm characteristics have no significant associations with changes in ESG. That is, changes in ESG scores do not seem to significantly alter the firm features or financial performance of these firms in the time period of our analysis. Examples of firms with stable MVE or ROA despite changes in ESG Scores include CME Group Inc. (market value of equity (MVE) approximately USD 80 billion and return on assets (ROA) around 2–3%), which had a composite ESG percentile score of 88.90 in our data. CME Group has implemented several ESG initiatives, particularly in governance and social responsibility; placed focus on energy-efficient data centers and office spaces; introduced initiatives to reduce carbon footprint and provide transparency through sustainability reports; and placed emphasis on diversity and inclusion within its workforce. See
https://investor.cmegroup.com/news-releases/news-release-details/cme-group-launch-e-mini-sp-500-esg-index-futures accessed on 1 May 2024. However, despite changes in CME Group’s ESG scores, the market cap remained at the lower end of the large-cap category throughout our data timeline, and ROA has remained stable. Another example is Cooper Companies Inc., Pleasanton, CA, USA (market value of equity (MVE) approximately USD 20 billion and return on assets (ROA) of around 4–5%), a medical device company, which has adopted several ESG practices focusing on product safety, ethical operations, and community engagement. The company made efforts to reduce waste and improve the sustainability of manufacturing processes, made investments in energy-efficient facilities, and placed emphasis on product safety and quality for medical devices. See
https://investor.coopercos.com/news-releases/news-release-details/coopercompanies-2023-environmental-social-and-governance-report accessed on 1 May 2024. Despite reaching a high ESG score, Cooper Companies’ MVE has remained at the mid cap range throughout our data timeline, while its ROA has not increased perceptibly.
In this study, we are limited by the number of firms with all available data as needed, from (a) ESG rating from Bloomberg just for the most recent year 2023, (b) ESG data retrieval from the Wharton Research Database Services (WRDS) from 2006 to 2013, and (c) ESG scores history from Bloomberg for the years 2015 to 2022. A larger and matched sample will allow for a more detailed analysis. Future studies can also control for the influence of institutional investors, insider or family ownership, CEO personal traits, or the influence of major customers in a more comprehensive analysis of the main findings of this paper.


