Abstract
This paper investigates the presence of speculative bubbles in the Scandinavian countries namely Denmark, Finland, Norway, and Sweden over the period from 1980Q1 to 2018Q4 and searches for evidence of bubble migration among those countries. First, we apply the GSADF test developed by Phillips et al. (2015) on quarterly housing price-to-rent ratios to test for exuberance and episodic bubbles. Subsequently, we examine bubble migration between these markets using the non-parametric model with time-varying coefficients (NPM-TVC) developed by Greenaway-McGrevy and Phillips (2016). We find evidence of episodic bubbles in all the Scandinavian real estate markets for the period 1980 to 2018. Our results also indicate that housing bubbles are contagious between these markets during several periods, and the market connection is stronger for geographically neighboring countries.
1. Introduction
Real estate bubble detection is a topic of ongoing research among economists. The empirical literature has investigated the presence and migration of real estate bubbles in different countries, including the United States [,,], Japan [], Australia [], China [], New Zealand [,], Israel [], Canada [,] and the OECD countries [,,,,].
Recently, there have been recurrent warnings about potentially exuberant house prices in the Scandinavian housing markets. In fact, the 2019 Bloomberg report on the world’s housing bubbles ranked Sweden and Norway as the 3rd and 4th most overheated real estate markets in the world in the first quarter of 2019 [], while Iceland, Denmark, and Finland rank 9th, 10th, and 18th, respectively. In addition, economic reports from the International Monetary Fund [], the Council of the European Union [,] and Opie et al., [] also indicate that Scandinavian real estate markets are experiencing a macroeconomic imbalance. In particular, the reports consistently point out the rapid and persistent housing-price growth above economic fundamentals, occurring since the mid-1990s. For example, from 2000 to 2018, the nominal housing price index increased by 109.9% in Denmark, 75.3% in Finland, 193.8% in Norway, and 239.7% in Sweden. During the same period, rental prices registered a much weaker increase of 52.7% in Denmark, 52.9% in Finland, 64.3% in Norway, and 42.3% in Sweden []. While analysing the existence of bubbles, previous studies such as Dermani et al., [] and Maher [] found mixed evidence on real estate price exuberance in Sweden. Other studies [,,,] have also documented the presence of real estate bubbles in Scandinavian countries, including Denmark, Sweden, and Norway. However, none of these papers have investigated the contagion of bubbles between these markets.
The purpose of this paper is to fill this empirical gap, by addressing two main questions: Do Scandinavian real estate markets experience episodic bubbles? If so, to what extent are these bubbles contagious between these markets? Our empirical strategy consists of, first, investigating the presence of bubbles in the real estate markets of Denmark, Sweden, Norway, and Finland by using the GSADF test developed by Phillips et al., []. Subsequently, we examine bubble migration between these markets using the non-parametric model with time-varying coefficients (NPM-TVC) developed by Greenaway-McGrevy and Phillips []. Our data were retrieved from OECD Statistics on real estate prices []. Following the literature on bubble detection [,] we focused on the price-to-rent ratios (rather than real price) to control for economic fundamentals. Rent has been shown to be a major indicator of real estate market sustainability [,,]. Comparing six methods for measuring real estate bubbles, Bourassa et al., [] concluded that the price-to-rent ratio measure is the most reliable method, both ex-post and in real-time, for identifying real estate bubbles.
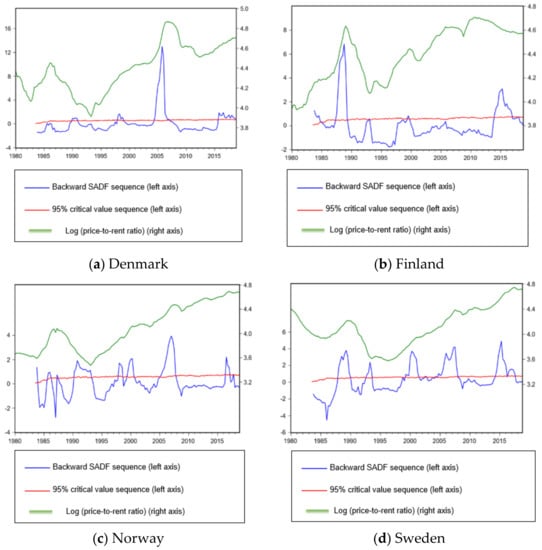
Our results suggest that the Scandinavian real estate markets experienced several bubble episodes during the 1980 to 2018 period. For instance, we found that the Danish real estate market experienced a bubble during the 2004Q2 to 2007Q2 period, with a peak in 2005Q4. Norway also experienced episodic bubbles from 2004Q4 to 2007Q1. In Sweden, bubble episodes occurred from 1987Q4 to 1989Q4, 1992Q4 to 1993Q4, 1999Q2 to 2001Q2, 2004Q3 to 2008Q1, and 2014Q3 to 2017Q4. In Finland, we found evidence of two major bubbles from 1987Q3 to 1989Q2 and 2013Q4 to 2017Q1, with a peak in 2015Q4. Our results also suggest that the Scandinavian real estate markets are interconnected, as the bubbles appear to be contagious between these countries. On average, the results also suggest that the housing market connection is stronger for geographically close countries.
The rest of the paper is organized as follows: Section 2 sets out the data used in this paper. Section 3 presents our empirical model for detecting bubble episodes and investigating bubble migration. Section 4 shows and discusses our empirical results. Section 5 concludes the paper and suggests future research avenues.
2. Data and Descriptive Statistics
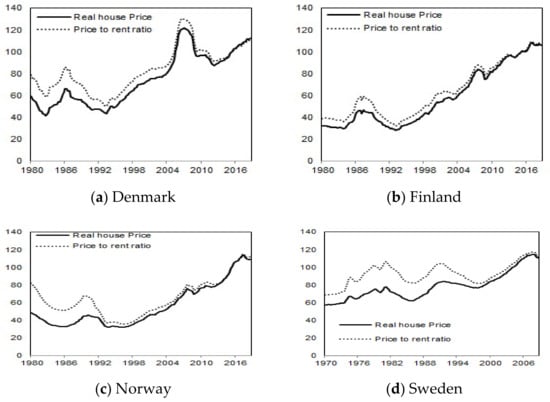
The data used in this paper were obtained from OECD.Stat [] Our database contains two housing price indicators: (i) The real house price, which is the ratio of nominal price to the consumers’ expenditure deflator, both seasonally adjusted, from the OECD national accounts database. According to the OECD database, the nominal house price covers the sale of newly-built and existing dwellings, following the recommendations from the Handbook of Residential Property Prices Indices; and (ii) The price-to-rent ratio, which is the nominal house price divided by the rent price. This measure is considered an indicator of the profitability of house ownership. This indicator is an index with 2015 as the base year. In order to test for real estate bubbles and bubbles contagion in Denmark, Finland, Norway, and Sweden, we used the quarterly real estate price-to-rent ratio from 1980Q1 to 2018Q4. The evolution of the price-to-rent ratios and the real prices, with a base of 2015Q1, for each country are presented in Figure 1. Real prices and price-to-rent ratios display an increasing trend for the Scandinavian countries during the period, with short-term fluctuations. There was a substantial increase in each of the price-to-rent ratio and real prices during the period.

Figure 1.
Real house price and price-to-rent ratios from 1980 to 2018.
Table 1 presents the statistical results. Interestingly, the results indicate that Denmark had the highest price-to-rent ratio. In fact, the Danish price-to-rent ratio ranged between 50.5 and 130.25, with an average of 81.35. Finland displayed the second-highest price-to-rent ratio, ranging between 48.97 and 110.84, with an average of 77.36. Finally, the average price-to-rent ratios were 64.9 and 63.01 in Sweden and Norway, respectively.

Table 1.
Descriptive statistics.
Unit root and stationary tests are presented in Table 2. We use three stationary tests (ADF, KPSS, and PP). The null hypothesis of ADF and PP is the presence of the unit root, and the null hypothesis of KPSS is the absence of the unit root. All the results consistently indicate that the price-to-ratio series contains the unit root for all the Scandinavian countries at a 5% threshold.

Table 2.
Unit root and stationary test.
3. Methodology
3.1. Identifying Bubble Episodes
Following Phillips et al., [], this paper uses the right tail unit root tests of Phillips et al., [], to analyze the explosive behavior of stock prices in South Africa. The procedure of Phillips et al., [], estimates the following auto-regressive specification:
where is the property price indicator at period , is the intercept, is the optimal lag order, and is the error term. The null hypothesis of the GSADF test (H0: β = 0) is the absence of a bubble. The alternative hypothesis is (H1: β > 0) which implies an explosive behavior for the time series. If the GSADF test rejects the null hypothesis, then there is evidence of at least one bubble in the market.
In the GSADF procedure, the estimation of Equation (1) is repeated on sub-samples of data in a recursive fashion and is based on global backward supremum ADF statistics of the form:
where is the minimum window size; is the starting point, which varies from 0 to , and is the ending point, which varies from to 1. The minimum window size is determined according to the formula proposed by Phillips et al., [].
3.2. Model of Bubble Contagion
We rely on the non-parametric model with time-varying coefficients (NPM-TVC) developed by Greenaway-McGrevy and Phillips []. This method is designed to capture the lead-lag relationship between the time series dynamics of the price-to-rent ratios. Let us consider two markets, A and B. The non-parametric regression specified by Greenaway McGrevy and Phillips [] is:
where
The time-varying coefficient δ is estimated by local kernel regression such that
where is a Gaussian kernel, h is the bandwidth, r is the fraction date, and d is the lag.
4. Empirical Results
4.1. Bubble Detection
We report the results of the GSADF test for bubble episodes in Table 3 and Figure 2. Table 3 indicates that, overall, Scandinavian real estate markets were overheated during the period investigated in the present study. We find evidence of exuberant behavior in all these markets, since the GSADF statistics are significant at 1%, for Denmark, Finland, Norway, and Sweden (See Table 3).

Table 3.
GSADF test for exuberance detection.

Figure 2.
Real estate bubble detection using GSADF.
Bubble episodes, identified from the recursive calculation of the BSADF statistics, are presented in Figure 2a for Denmark, Figure 2b for Finland, Figure 2c for Norway, and Figure 2d for Sweden. Recall that Phillips et al.’s [] test indicates an explosive price behavior when the BSADF statistic is superior to the critical value. Figure 2a shows that Denmark experienced a bubble for the period of 2004Q2 to 2007Q2 with a peak in 2005Q4. However, the Danish real estate market has remained cool since 2007Q3. In Finland (Figure 2b), the real estate market experienced two major bubbles during the periods from 1987Q3 to 1989Q2, with a peak in 1988Q4, and 2013Q4 to 2017Q1, with a peak in 2015Q4. The Norwegian real estate market (See Figure 2c) also experienced episodic bubbles. The most important bubble in Norway occurred from 2004Q4 to 2007Q1. In Figure 2d, we observed that Sweden experienced several bubble episodes during the periods from 1987Q4 to 1989Q4, 1992Q4 to 1993Q4, 1999Q2 to 2001Q2, 2004Q3 to 2008Q1, and 2014Q3 to 2017Q4. Overall, we found evidence of several bubble episodes in Scandinavian real estate markets from 1980Q1 to 2018Q4. However, since 2018Q1, our findings suggest that all of the studied markets are in a no-bubble period.
4.2. Bubble Contagion
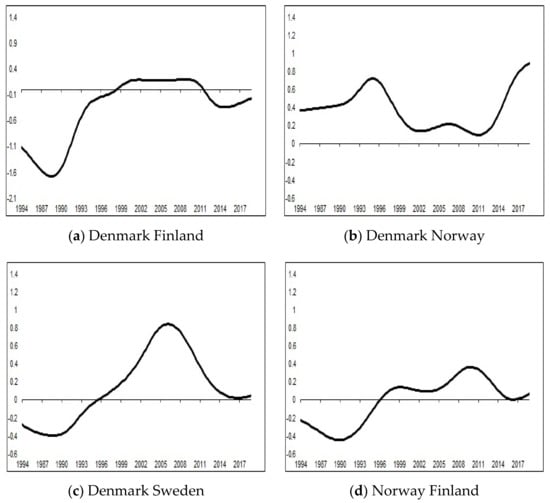
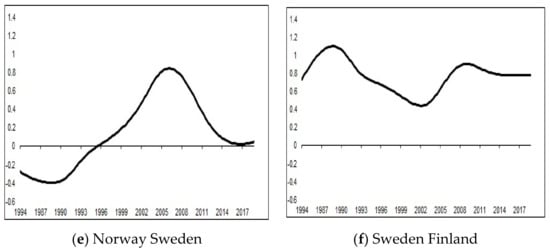
Figure 3 presents the time-varying coefficients, estimated from the model of Greenaway-McGrevy and Phillips []. Figure 3b,d indicate that the markets of Denmark-Norway and Sweden-Finland have been connected throughout the 1980–2018 period since the estimated coefficients are positive. This result indicates that real estate prices have migrated between these markets. Moreover, the pairing of Denmark and Sweden (Figure 3b), Norway and Finland (Figure 3c), and Norway and Sweden (Figure 3e) have been in place since 1995Q3, 1996Q2, and 1999Q1, respectively. The weakest connection is observed for Denmark and Finland (Figure 3a), where price migration is observed only between 1998Q3 and 2011Q1 with a low intensity. Overall, these results confirm the existence of bubbles contagion between the Scandinavian real estate markets.


Figure 3.
Housing prices contagion between pairs of countries.
5. Conclusions
In this paper, we tested for the explosive behavior of real estate prices in Denmark, Norway, Sweden, and Finland using Phillips et al.’s [] GSADF test. We provide further evidence that the Scandinavian real estate markets are exuberant and contained several episodic bubbles from 1980 to 2018.
This result is consistent with Maher [] who found that the Swedish real estate market is overheated. More importantly, based on the non-parametric model with time-varying coefficients estimated by Greenaway-McGrevy and Phillips [], we provide evidence that bubbles migrate between the Scandinavian real estate markets. This result is consistent with Vitek [] and Mircheva and Muir [], who indicated that Denmark, Finland, Norway, and Sweden form a tightly integrated region and such a connection between these real estate markets increases the risk of a regional house bubble since a bubble can migrate from one market to another.
Taken together, our results suggest that Scandinavian policymakers should pay attention to the contagion effect of housing prices run-up between countries and should undertake coordinated housing policies to cool their respective real estate markets. Finally, future research may focus on: (i) the effect of mortgage regulation on the occurrence and the migration of bubbles in the Scandinavian real estate markets; (ii) the impact of foreign buyers on housing price exuberance.
Author Contributions
Conceptualization, J.-L.B. and I.R.; methodology, J.-L.B. and I.R.; software, K.A.; formal analysis, K.A. and E.O.; data curation, J.-L.B. and K.A.; writing—original draft preparation, J.-L.B., K.A., E.O. and I.R.; writing—review and editing, J.-L.B., K.A., E.O. and I.R. All authors have read and agreed to the published version of the manuscript.
Funding
This research received no external funding.
Institutional Review Board Statement
Not applicable.
Informed Consent Statement
Not applicable.
Data Availability Statement
OECD Housing data are publicly available online.
Conflicts of Interest
The authors declare no conflict of interest.
References
- Case, E.K.; Shiller, R.J. Is There a Bubble in the Housing Market? Brook. Pap. Econ. Act. 2003, 299–342. Available online: https://www.brookings.edu/bpea-articles/is-there-a-bubble-in-the-housing-market/ (accessed on 5 August 2021). [CrossRef]
- Schwartz, H.M. Subprime Nation: American Power, Global Capital, and the Housing Bubble; Cornell University Press: New York, NY, USA, 2009. [Google Scholar]
- Gelain, P.; Lansing, K.J. House prices, expectations, and time-varying fundamentals. J. Empir. Financ. 2014, 29, 3–25. [Google Scholar] [CrossRef]
- Hu, Y.; Oxley, L. Bubble contagion: Evidence from Japan’s asset price bubble of the 1980-90s. J. Jpn. Int. Econ. 2018, 50, 89–95. [Google Scholar] [CrossRef]
- Dreger, C.; Zhang, Y. Is there a bubble in the chinese housing market? Urban Policy Res. 2013, 31, 27–39. [Google Scholar] [CrossRef]
- Fraser, P.; Hoesli, M.; McAlevey, L. House prices and bubbles in new zealand. J. Real Estate Financ. Econ. 2008, 37, 71–91. [Google Scholar] [CrossRef][Green Version]
- Greenaway-McGrevy, R.; Phillips, P.C. Hot property in New Zealand: Empirical evidence of housing bubbles in the metropolitan centres. N. Z. Econ. Pap. 2016, 50, 88–113. [Google Scholar] [CrossRef]
- Caspi, I. Rtadf: Testing for Bubbles with EViews. J. Stat. Softw. 2017, 81, 1–16. [Google Scholar] [CrossRef]
- Rherrad, I.; Mokengoy, M.; Fotue, L.K. Is the canadian housing market ‘really’exuberant? Evidence from Vancouver, Toronto and Montreal. Appl. Econ. Lett. 2019, 26, 1597–1602. [Google Scholar] [CrossRef]
- Rherrad, I.; Bago, J.L.; Mokengoy, M. Real estate bubbles and contagion: New empirical evidence from Canada. N. Z. Econ. Pap. 2021, 55, 38–51. [Google Scholar] [CrossRef]
- Engsted, T.; Hviid, S.J.; Pedersen, T.Q. Explosive bubbles in house prices? Evidence from the OECD countries. J. Int. Financ. Mark. Inst. Money 2016, 40, 14–25. [Google Scholar] [CrossRef]
- Engsted, T.; Pedersen, T.Q. Predicting returns and rent growth in the housing market using the rent-price ratio: Evidence from the OECD countries. J. Int. Money Financ. 2015, 53, 257–275. [Google Scholar] [CrossRef]
- Gomez-Gonzalez, J.E.; Gamboa-Arbeláez, J.; Hirs-Garzon, J.; Pinchao-Rosero, A. When Bubble Meets Bubble: Contagion in OECD Countries. J. Real Estate Financ. Econ. 2018, 56, 546–566. [Google Scholar] [CrossRef]
- Bago, J.L.; Rherrad, I.; Akakpo, K.; Ouédraogo, E. Real Estate Bubbles and Contagion: Evidence from Selected European Countries. Rev. Econ. Anal. 2021, 13, 386–405. [Google Scholar] [CrossRef]
- Bago, J.L.; Akakpo, K.; Rherrad, I.; Ouédraogo, E. Volatility spillover and international contagion of housing bubbles. J. Risk Financ. Manag. 2021, 14, 287. [Google Scholar] [CrossRef]
- Bloomberg. Global Insight: Where Is the Next Housing Bubble Brewing? Bloomberg Economics Report; Bloomberg: New York, NY, USA, 2019. [Google Scholar]
- International Monetary Fund. Nordic Regional Report: Selected Issues; International Monetary Fund, European Department: Paris, France, 2013; Volume 13. [Google Scholar] [CrossRef]
- Council of the European Union. Council Recommendation of 13 July 2018 on the 2018 National Reform Programme of Sweden and Delivering a Council Opinion on the 2018 Convergence Programme of Sweden; Technical Report; Council of the European Union: Brussels, Belgium, 2018. [Google Scholar]
- Councilof the European Union. Council Recommendation of 13 July 2018 on the 2018 National Reform Programme of Denmark and Delivering a Council Opinion on the 2018 Convergence Programme of Denmark; Technical Report; Council of the European Union: Brussels, Belgium, 2018. [Google Scholar]
- Opie, J.; Binsfeld, M.; Shen, D.; Barisone, G. Special Comment: Risks Abound for Overheated Nordic Housing Market, but No Crisis; Technical Report; Scope Ratings GmbH: Berlin, Germany, 2018. [Google Scholar]
- OECD. Housing Prices. Prices 2019. Available online: https://www.oecd-ilibrary.org/economics/housing-prices/indicator/english_63008438-en (accessed on 1 November 2021).
- Dermani, E.; Linde, J.; Walentin, K. Is there an evident housing bubble in sweden? Sver. Riksbank Econ. Rev. 2016, 2, 7–55. [Google Scholar]
- Maher, A. Is there a bubble in the Swedish housing market? J. Eur. Real Estate Res. 2018, 12. Available online: https://www.emerald.com/insight/content/doi/10.1108/JERER-03-2018-0013/full/html (accessed on 1 November 2021).
- Jordà, Ò.; Schularick, M.; Taylor, A.M. Leveraged bubbles. J. Monet. Econ. 2015, 76, S1–S20. [Google Scholar] [CrossRef]
- Pavlidis, E.; Yusupova, A.; Paya, I.; Peel, D.; Martínez-García, E.; Mack, A.; Grossman, V. Episodes of exuberance in housing markets: In search of the smoking gun. J. Real Estate Financ. Econ. 2016, 53, 419–449. [Google Scholar] [CrossRef]
- Phillips, P.C.B.; Shi, S.; Yu, J. Testing for multiple bubbles: Historical episodes of exuberance and collapse in the s&p 500. Int. Econ. Rev. 2015, 56, 1043–1078. [Google Scholar] [CrossRef]
- Bourassa, S.C.; Hoesli, M.; Oikarinen, E. Measuring House Price Bubbles. Real Estate Econ. 2016, 47, 534–563. [Google Scholar] [CrossRef]
- Lee, C.; Park, K. Analyzing the rent-to-price ratio for the housing market at the micro-spatial scale. Int. J. Strat. Prop. Manag. 2018, 22, 223–233. [Google Scholar] [CrossRef]
- Vitek, F. Spillovers to and from the Nordic Economies: A Macroeconometric Model Based Analysis; Number 13-225; International Monetary Fund: Washington, DC, USA, 2013. [Google Scholar]
- Mircheva, B.M.; Muir, D. Spillovers in the Nordic Countries; Number 15-70; International Monetary Fund: Washington, DC, USA, 2015. [Google Scholar]
Publisher’s Note: MDPI stays neutral with regard to jurisdictional claims in published maps and institutional affiliations. |
© 2022 by the authors. Licensee MDPI, Basel, Switzerland. This article is an open access article distributed under the terms and conditions of the Creative Commons Attribution (CC BY) license (https://creativecommons.org/licenses/by/4.0/).