Article

Innovation Pattern Heterogeneity: Data-Driven Retrieval of Firms’ Approaches to Innovation

1
NIFU (Nordic Institute for Studies in Innovation, Research and Education), Postboks 2815 Tøyen, NO-0608 Oslo, Norway
2
SSB (Statistics Norway), Postboks 2633 St. Hanshaugen, NO-0131 Oslo, Norway
*
Author to whom correspondence should be addressed.
Businesses 2022, 2(1), 54-81; https://doi.org/10.3390/businesses2010004
Submission received: 20 January 2022 / Revised: 20 February 2022 / Accepted: 24 February 2022 / Published: 1 March 2022

Abstract

:
According to a strong and diversified theoretical framework, innovation is one of the usual suspects in defining differences in firm performance. Understanding the diversity that exists within the population of innovative firms is essential for developing appropriate innovation policies. Our study explored the diversity of innovation patterns among Norwegian firms included in the 2018 Community Innovation Survey (CIS2018). By applying factor analysis to a wide array of survey variables and a large sample of firms, we identified eleven typical approaches to innovation, which connect innovation inputs and outputs at the firm level. A main outcome of our study is a novel fine-grained view of innovation as a multifaceted concept. Our research path helps us to find commonalities in innovation behavior across industries and, as a consequence, to better isolate those innovation patterns that differentiate industries from one another. We also show the relation between firm size, on one hand, and each of the firm scores associated to the eleven typical approaches to innovation, on the other hand, thus uncovering ways in which small firms may survive in sectors dominated by large firms.

1. Introduction

The firm’s ability to innovate is one of the usual suspects for explaining differences in firm performance according to a strong and diversified theoretical framework [1,2]. Innovation facilitates the high rate of growth of ‘‘superstars’’ as well as the establishment and continued existence of profitable companies that do not seek to become large enterprises [3]. Understanding the diversity that exists within the population of innovative firms is essential to develop appropriate innovation policies. Our study explored the diversity of innovation patterns among Norwegian firms and identified typical approaches to innovation, which connect innovation inputs and outputs at the firm level.
The mechanisms linking R&D, innovation success, and firm performance are largely indebted to the Schumpeterian endogenous growth representation, according to which firms strive to innovate so that they can enjoy monopoly rents [4]. The forward-looking firm makes a decision about its level of research input, based on the expected returns to R&D (in terms of sales or directly in terms of profits), which affects the stochastic innovation process. Innovation success, in turn, automatically raises the firm’s profitability or productivity level [5,6]. Such stochastic and optimizing representation has, however, been challenged by models in which agents constrained by bounded rationality search for more productive techniques in an uncertain environment, where the impact of innovation on firm growth is itself random [7]. In such a framework, firms are heterogeneous in their ability to innovate, not only because of their financial resources, but also because they differ in terms of their ability to exploit technological opportunities. Path dependency explains the concentration of many innovations in the hands of a limited number of firms [1], while there may also be growth pattern heterogeneity for the same levels of R&D due to the uncertain nature of the R&D process [8]. Even among successful innovators, heterogeneity persists: while innovators are likely to enjoy superior employment growth compared with non-innovators, the bulk of this differential derives from the exceptional job creation activities of a few firms [9].
If policy-makers are willing to help different firms (incumbents or entrants), a first way to group the target firms is by the type of products and processes they deal with, which, in turn, roughly defines the economic sector to which the firms belong. At high levels of aggregation, product-based classifications of sectors such as the NACE system have often been considered impractical for understanding the sectoral dynamics of innovation. Therefore, other classifications have been suggested for this purpose, which use a finer disaggregation level as a basis for new definitions of economic sectors. Pavitt [10] proposed a four-sector taxonomy based on size, innovation patterns, and sources of innovation: scale-intensive, supplier-dominated, science-based, and specialized supplier. Miozzo and Soete [11] proposed removing services from the supplier-dominated category in Pavitt’s original classification and suggested four additional categories: supplier-dominated services, physical network services, information network services, and knowledge-intensive business services. This led to an eight-fold taxonomy including four manufacturing and four service sectors; the taxonomy was later subjected to further aggregation by Castellacci [12].
However, these taxonomies have still grouped data at the level of industry rather than that of firms. Such a choice ignores the fact that firms in the same industry may have a very different technological base. This issue was raised by Archibugi [13], who said that “[h]opefully, over the next few years more statistical and econometric work will be carried out to group firms, as opposed to industries, into the taxonomic categories [...] according to their intrinsic characteristics such as the rate and direction of technical change and their sources of innovation” ([13] p. 420). Their hope was partially misplaced, since data limitations have often constrained the researchers in innovation studies into using output-based sectoral definitions. In our study, we used firm-level data from the Innovation Survey conducted in Norway in 2018 to identify various approaches to innovation. Drawing on De Jong and Marsili [14] and Leiponen and Drejer [15], we employed a factor analysis to reveal typical patterns of innovation behavior by analyzing correlations in the answers to the survey. Unlike in previous studies, we did not aim to label each firm as having one specific approach to innovation, but we allowed for the coexistence of several approaches to innovation within the same firm. The eleven innovation patterns we identified are therefore eleven different, but not exclusive, ways for a firm to be innovative.
We took stock of the findings by Baregheh et al. [16] who collected different definitions of innovation from various disciplinary literature and, following a content analysis, proposed that “Innovation is the multi-stage process whereby organizations transform ideas into new/improved products, service or processes, in order to advance, compete and differentiate themselves successfully in their marketplace” ([16] p. 1334). This definition helps us to reaffirm, on one hand, that innovation is a process rather than a discrete act and, on the other hand, that the presence of an aim is necessary to reconnect the rhetoric of innovation to its strategic contexts. Our analysis uncovered the innovation patterns of Norwegian firms by studying not only the variables associated with innovation inputs and outputs, but also variables describing the goals and hindrances in the innovation process, as emerging from the answers to the 2018 Norwegian Innovation Survey.
Furthermore, Section 2 describes the existing literature on which our study is based. Section 3 explains how we constructed and used variables for our factor analysis. Section 4 describes the results of the analysis, while Section 5 provides a discussion of the results. Section 6 presents our conclusions.

2. Literature

Empirical studies and practical experience have often revealed a variety in the sources, nature, and use of innovation. One of the pioneers was Pavitt [10], who proposed classifying industries according to a four-sector taxonomy based on size, innovation patterns, and sources of innovation: scale-intensive, supplier-dominated, science-based, and specialized supplier. Similarities and differences amongst sectors in the sources, nature, and impact of innovation were defined by the sources of knowledge inputs, by the size and principal lines of the activity of innovating firms, and by the products and main uses of the innovation sectors. The dataset comprised 2000 significant innovations, and the corresponding innovating firms existed in the UK from 1945 to 1979. Notably, these data covered only eleven 2-digit industries. The data did not measure the significance of innovations, nor did they precisely capture incremental innovations. The four sectors resulting from the analysis by Pavitt (1984) are:
  • Scale-intensive (SI), which includes both complex and consumer durables (food, chemicals, motor vehicles) and processed raw materials (e.g., metal manufacturing, glass and cement). Firms tend to be large and to rely mainly on internal resources for their innovations;
  • Supplier-dominated (SD), which includes industries where firms mostly produce technologically simple goods (e.g., textiles, leather goods, pulp and paper), where the capital and intermediate components suppliers are the main sources of innovation;
  • Science-based (SB), which includes industries where innovation is linked directly to advances in academic research (e.g., pharmaceuticals, electronics, scientific instruments). Innovation rates are particularly high. Carrier industries in the ICT paradigm; and
  • Specialized supplier (SS), includes equipment building, design, and mechanical engineering, where innovation typically emerges from informal activities. Firms in this group tend to be small, and innovation rates are particularly high. Supportive of the Fordist paradigm.
Miozzo and Soete [11] proposed withdrawing services from the supplier-dominated category in Pavitt’s original classification and suggested four additional categories: supplier-dominated services, physical network services, information network services, and knowledge-intensive business services, defined as follows:
  • Supplier-dominated services (SDS) rely on the purchase of capital goods for their innovation. They are mostly small companies providing services directly to customers (e.g., hotels, restaurants, rental services and personal services). Innovation rates are particularly low;
  • Physical network services (PNS), which, which include all transport, retail, and wholesale trade-related services;
  • Information network services (INS), which include all information-intensive activities (communication, financial intermediation, insurance, real estate). Firms tend to be large and to innovate in interaction with suppliers and users; and
  • Knowledge intensive business services (KIBS), which include R&D services, consultancy, and computer-related activities. Firms tend to be small and medium-sized firms and to generate their own innovation. Innovation rates are particularly high.
The taxonomy by Pavitt [10] is often considered in studies of innovation patterns and industrial dynamics, both directly to categorize firms in empirical studies, and indirectly to frame the theoretical relations between industries in innovation models or innovation processes within firms. For instance, Paananen [17] used the taxonomy to investigate the balance between internal and external sources of knowledge for firms belonging to a given sector. Inter-industry differences in technological trajectories, as represented by Pavitt’s taxonomy, were taken into account by Spithoven [18] in his study of firm sales from product innovation. Di Berardino and Onesti [19] explained the international processes of deindustrialization by considering Pavitt’s taxonomy as an empirically based framework of vertical linkages between industries. Ascani et al. [20] categorized inward foreign direct investments according to Pavitt’s taxonomy when inspecting which types of investments could be a systematic source of knowledge inputs, on the assumption that foreign activities are inherently industry-specific. Dosi et al. [21] considered the sectoral patterns of innovative activities identified by Pavitt [10] to disentangle the sectoral patterns of job-creation/destruction. Labor markets were also the object of analysis for Felice et al. [22], who relied on the Pavitt taxonomy (as revisited by [23]) to analyze the impact of additive manufacturing technology on employment. Schneider et al. [24] adopted a sectoral perspective to examine the influence of human capital on innovation performance, noticing that the criteria used by Pavitt [10] to classify sectors implied that sectors had different skill requirements.
Bonaccorsi et al. [25] combined the taxonomies by Pavitt [10] and by Miozzo and Soete [11] to cluster new firms on the basis of the characteristics of their innovation patterns to study the impact of the scientific specialization of universities on local new firm creation (we call this joint taxonomy the “Pavitt–Miozzo–Soete”, since it evolved directly from the original taxonomy by Pavitt; see also [26]). On a similar topic, Baroncelli and Landoni [27] conducted a comparative analysis of university-level support practices and entrepreneurial behavior of spin-offs; they also used the taxonomies by Pavitt [10] and by Miozzo and Soete [11] to classify the technologies embodied and exploited by the spin-offs of their sample. Consoli and Rentocchini [28] identified structural characteristics of industry-specific know-how, and understood their results in light of “Pavitt’s renowned taxonomy, a point of reference for virtually all industry classifications” ([28] p. 1122) and of the Miozzo and Soete (2001) extension of the taxonomy to services. The Pavitt–Miozzo–Soete taxonomy was also adopted for studies of open innovation [29] and of regional development [30,31], while Flikkema et al. [32] only used sectoral categorization by Miozzo and Soete [11] for services, without its manufacturing counterpart, when studying trademark activities.
The Pavitt–Miozzo–Soete taxonomy was aggregated further by Castellacci [12], who took up the challenge of explicitly addressing the relationships between manufacturing and services. In this latter study, supplier-dominated goods and supplier-dominated services appeared together at the final stage of an ideal knowledge chain, at a position where they were able to implement new technologies created elsewhere in the economy. At the other end of the chain, there were the “advanced knowledge providers”: specialized manufacturing firms and knowledge-intensive business services, both characterized by great technological capability and a significant ability to manage and generate complex technological knowledge. All the other industries were divided between the “supporting infrastructure services” sector, upon which business and innovative activities in the whole economy were based, and the “mass production of goods” sectors, which are carriers of knowledge in the form of scale-intensive and science-based firms.
The aforementioned taxonomies have grouped data at the industry level rather than the firm level. This choice, however, ignores the fact that firms in the same industry may have a very different technological base. Micro-founded definitions of economic sectors could provide a foundation for a better understanding of the innovation processes and the development of more targeted innovation policies [13]. This empirical path was opened by Cesaratto and Mangano [33], who analyzed data from an extensive innovation survey conducted among Italian manufacturing firms and identified six main clusters or dominant technological firm profiles. The authors stated that a degree of technological determinism predominates in the model by Pavitt [10], while an established tradition in organization theory (see, e.g., [34]) has also emphasized the “strategic choice” available to firms for manipulating their internal and external environments. Applying cluster analysis to data on technological inputs and outputs and the impact of innovation on sales, Cesaratto and Mangano [33] identified the following six clusters of firms:
  • Cluster 1 represents the case of struggling companies competing in dynamic R&D-intensive technological trajectories;
  • Cluster 2 shows a smaller group of aggressive companies competing in dynamic trajectories through a blend of R&D, industrial design, and investment policy;
  • Cluster 3 contains firms that are less resolute in their innovative strategies;
  • Cluster 4 is representative of technological trajectories based on industrial design and incremental technical change; and
  • Clusters 5 and 6 both show embodied technical change as the main innovation channel, with Cluster 5 representing a more traditional component of the industrial landscape and Cluster 6 blending heavy capital accumulation and some in-house innovative activities.
In the words of the authors, “[t]he intersectoral nature of clusters seems to attest to the existence of a considerable degree of choice in company strategy as compared to the more marked sectoral determinism emerging from Pavitt’s taxonomy” ([33] p. 252).
Strategy also constitutes an important element for the subsequent micro-based taxonomy designed by De Jong and Marsili [14], who employed data from computer-assisted telephone interviews with managers and entrepreneurs of small- and micro-enterprises. The interviews aimed at capturing novel relevant variables such as managerial attitude, innovation planning, and external orientation. The focus on the bottom of the firm size distribution is motivated here by the disproportionate attention paid to large firms by previous studies including the study by Pavitt [10]. Somewhat surprisingly, after running a cluster analysis on their survey data, De Jong and Marsili [14] obtained a taxonomy of small- and micro-firms, which closely resembled the taxonomy of Pavitt [10]. Three of the four original categories were even defined under the same names as used in Pavitt [10], although they displayed additional qualities: supplier-dominated firms appeared to be relatively open, consulting on average with more than three external parties; specialized suppliers reached high levels of product innovation through more intensive use of specialized labor; and science-based firms were managed with a strongly positive attitude toward innovation, frequently accompanied by a written plan. The firms in the fourth category, called “resource-intensive” firms, allocated financial and time resources to innovation, but they limited their use of personnel employed in innovation and of external networks; their main difference from the “scale-intensive” firms in the Pavitt taxonomy consists of their not being associated with a large firm size. No clear-cut relationship emerged between industrial sectors and clusters of firms: following a definition introduced by Caves and Porter [35], De Jong and Marsili [14] also confirmed that different “strategic groups” coexisted within industries.
Leiponen and Drejer [15] used a similar approach to assess whether industry boundaries truly defined the boundaries of technological regimes. Again, the intuition behind their work lies in the idea that intra-industry heterogeneity may derive from strategic diversity. Importantly, their theoretical foundation strongly emphasizes the myopic trajectories followed by some firms, which, especially under rapidly changing conditions, must make strategic decisions under very limited knowledge conditions. Differences in knowledge could then pair up with differences in skills to produce different innovation patterns within industries. Their empirical analysis is based on cross-sectional Community Innovation Survey (CIS) datasets containing data on manufacturing and service firms located in Denmark and Finland covering the period 1994–1996. The study was conducted in two phases: first, a factor analysis was performed on a set of survey variables; then, the scores obtained from the factor analysis were input into a cluster analysis with the aim of grouping the firms into distinct categories, as homogeneous as possible with respect to factor dimensions. Both the factor analysis and the subsequent cluster analysis pointed to four types of innovative behavior that displayed a partial overlap with the Pavitt categories. Indeed, the analysis by Leiponen and Drejer [15] showed the existence of supplier-dominated firms; in Finland, suppliers are often direct collaborators with these firms, whereas in Denmark, they act simply as sources of information. On the other hand, market-driven firms tend to open new markets and extend current ones, sourcing information intensively from clients. Collaboration with universities, often associated with patenting, instead mark the behavior of science-based firms, while production-intensive firms mainly focus on improving existing products. Finally, one cluster in each country was termed “ad hoc”; its firms do not draw much on any sources nor are they driven by clear objectives in their innovation activities. Notably, only half of the four-digit (Denmark) and five-digit (Finland) NACE industries, with six or more observations, had more than 50% of firms associated with one cluster. In other words, about half of the industries did not have a dominant cluster, suggesting that firms have more room for strategic choice than is commonly believed in the innovation literature.
Our work follows directly on from Leiponen and Drejer [15] by conducting a factor analysis on the innovation survey data and by complementing the analysis with additional information from other data sources. We particularly stress the advantage of factor analysis over rigid clustering techniques, in that we were able not only to avoid restrictions from existing industry-based taxonomies (which represent the benchmark throughout our study), but also pointed out cases where several types of innovation behavior coexist. We conducted our factor analysis on a wide array of survey variables and on a large sample of firms to obtain a fine-grained view of the firms’ approaches to innovation.
The taxonomy by Pavitt [10] assigned a main role to firm size, to the point that one of the categories identified bears the name “scale-intensive”, to associate innovation processes to industries characterized by specific economies of scale. Miozzo and Soete [11] also showed that in services, firm size may concur to define the innovation patterns of a macro-sector, as in the case of “physical network services”. However, De Jong and Marsili (2006) argued that some smaller firms (which they labeled “resource-intensive”) may recreate similar innovation processes as scale-intensive firms. Therefore, an additional research question arose as to whether the intra-sectoral heterogeneity in innovation patterns detected through our data-driven approach may be, fully or partially, reconducted to firm size heterogeneity within economic sectors. Firms of different sizes aiming to produce the same good or to provide the same service might pursue different innovation strategies, for instance, because some technological bases are more effective than others for smaller firms. Therefore, we will also show the relation between firm size, on one hand, and each of the firm scores associated with the eleven typical approaches to innovation, on the other hand, first for the complete sample of firms and then separately within each Pavitt–Miozzo–Soete sector.

3. Materials and Methods

For the analysis, we used Norwegian microdata on the firms included in the 2018 Community Innovation Survey (CIS2018) covering the three-year period of 2016–2018. These data were collected by Statistics Norway and contain detailed information on then firms’ innovation activities including expenditures divided into intramural R&D, extramural R&D services, and expenditures on other aspects of innovation activities. They also contain information on the firm’s strategies, on whether the firm has introduced a new product or a process innovation (the definitions of these types of innovation comply with the recommendations of the OECD’s “Oslo manual”); whether it has cooperated with other firms/institutions in its innovation activities; and whether it has applied for a patent and/or other IPR over the corresponding three-year period. The survey sample was selected using a stratified method for firms with 10–50 employees, while all firms with more than 50 employees were included. The strata were based on industry classification (NACE codes) and firm size. CIS2018 contains information on 6360 firms.
Based on questions from CIS2018, we constructed a set of 88 binary indicators that covered various firm innovation activities and other relevant activities (see Appendix A for definitions). Using exploratory factor analysis, we investigated which of the indicators are highly correlated and hence interdependent, thus potentially reflecting a (smaller) set of unobserved/latent variables (called “factors”), which in our case, implied different approaches to innovation experienced by Norwegian firms. Our main assumption was that each firm may practice different approaches to innovation, so that scores obtained by factor analysis may highlight which of the approaches are applied by the firm (note that a firm might have very low or negative scores for all approaches to innovation, when that given firm does not perform any innovation activity).
Since all our indicators are binary variables, we calculated the tetrachoric correlation coefficients using Stata tools. The pairwise correlation matrix was then used to perform a factor analysis. Figure 1 summarizes the main output of the factor analysis (i.e., proportion of the variance in the data explained by each factor, cumulative proportion, and difference in eigenvalues by the factor number). The next step is to determine the number of factors that is reasonable to retain for further analysis.
In total, 22 factors had an eigenvalue larger than 1—this being larger than the information accounted for by a single indicator (the so-called “Kaiser criterion” for determining the number of factors: [36]). From Figure 1, we can see that the proportion of variance explained by each factor decreased sharply for the first nine factors and then flattened. Therefore, according to the “screen plot” criterion, there were nine factors (and, hence, the main approaches to innovation) in our data that should be retained.
At the same time, when we looked at the differences in eigenvalues, they fluctuated quite widely. If the difference in eigenvalues is to be associated with a fall in the importance of the next factor, it would be reasonable to stop after 3, 5, 7, 8, 11, or 24 factors (i.e., when all the following factors are less important than those mentioned). It was unreasonable to use 24 factors since they did not even adhere to the Kaiser criterion as all had eigenvalues larger than 1. Given the explorative nature of our analysis, we therefore retained eight factors as the main innovation approaches and the next three factors as additional innovation approaches. In total, eight factors accounted for about 54 per cent of variation, and 11 factors accounted for about 60 per cent of variation. We then repeated the factor analysis, restricting the number of factors to 11 and used “varimax” rotation to obtain the factor loadings. Using these factor loadings, we then predicted the scores for each factor for each individual firm. The higher the score, the higher the association of the given firm with the corresponding approach to innovation. The results are presented in the next section.

4. Results

In this section, we present the main approaches to innovation in Norwegian firms in the period 2016–2018 and their correspondence with the well-established Pavitt–Miozzo–Soete taxonomy. We also analyzed whether some of the approaches to innovation were more common among small firms, while others were more common among large firms.

4.1. Approaches to Innovation

Table 1 presents the names and main characteristics implied by the corresponding approach to innovation. The names were chosen to reflect the main features of each group of characteristics. The table with results for factor loadings from each particular indicator into the factor can be found in Appendix B.
We also explored whether there was any relationship between the reviled approaches to innovation based on the innovation survey data and the established industry-based taxonomies and whether some approaches are more common among small and some among large firms.

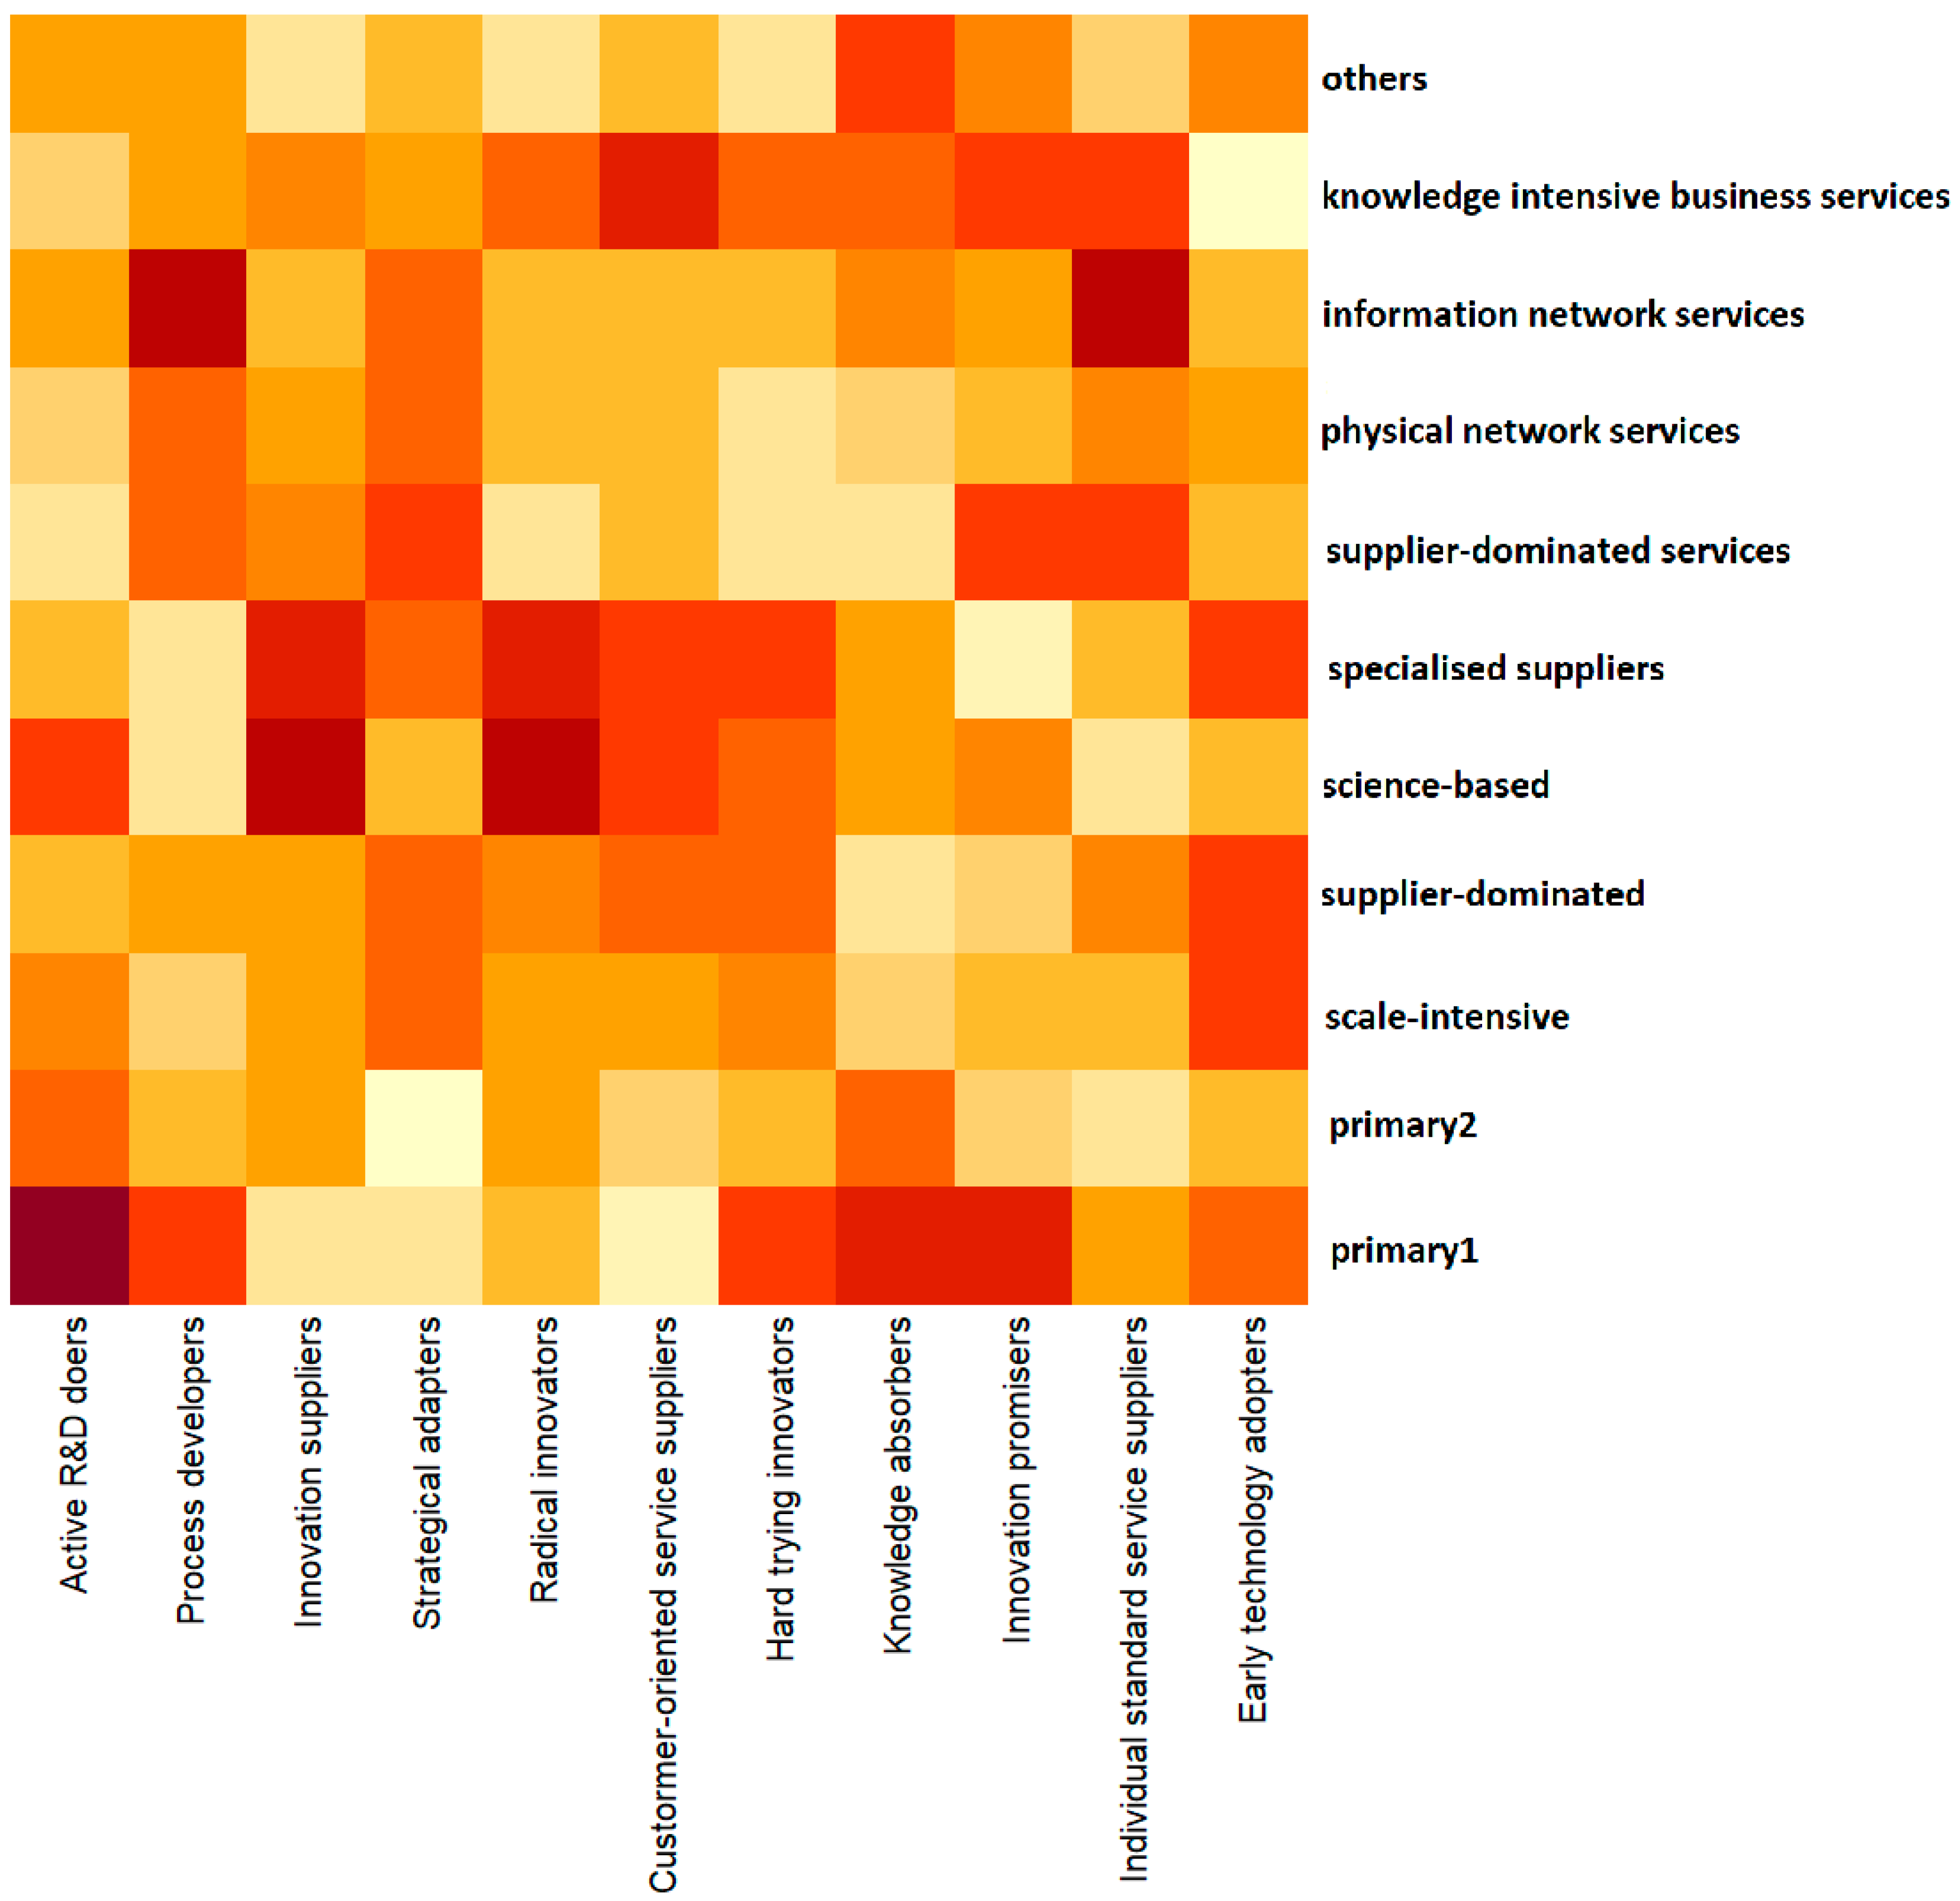
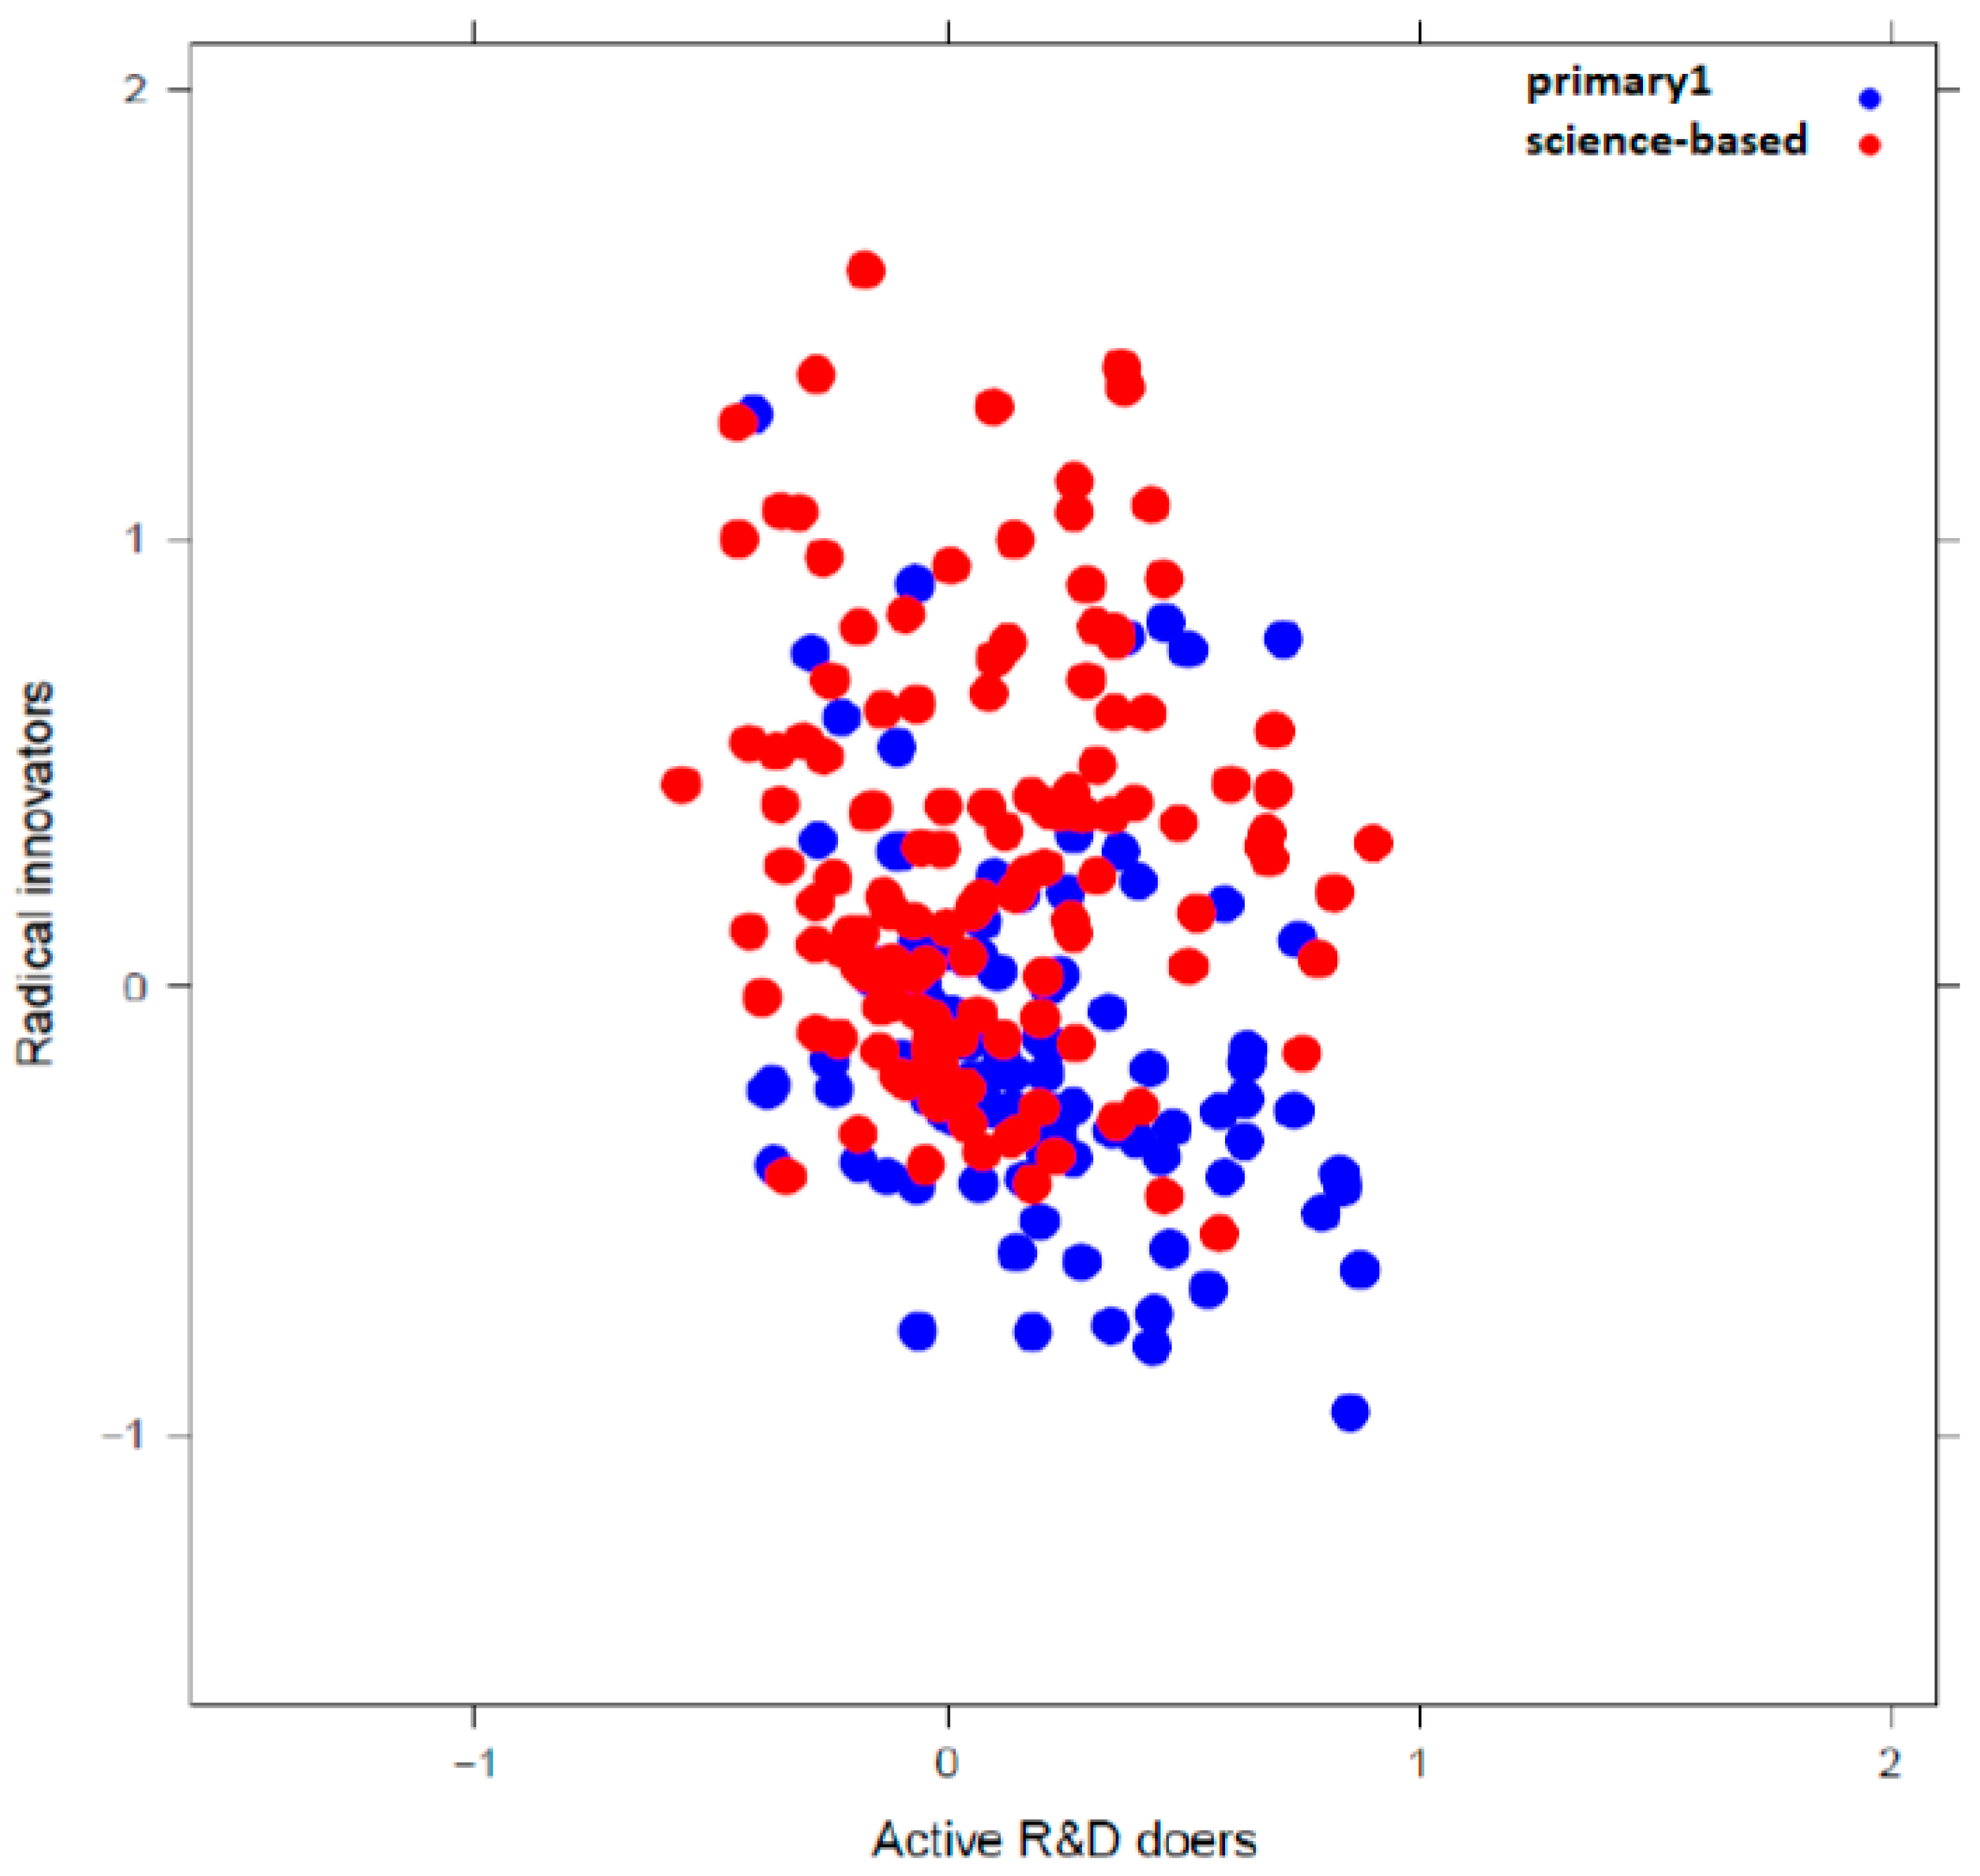
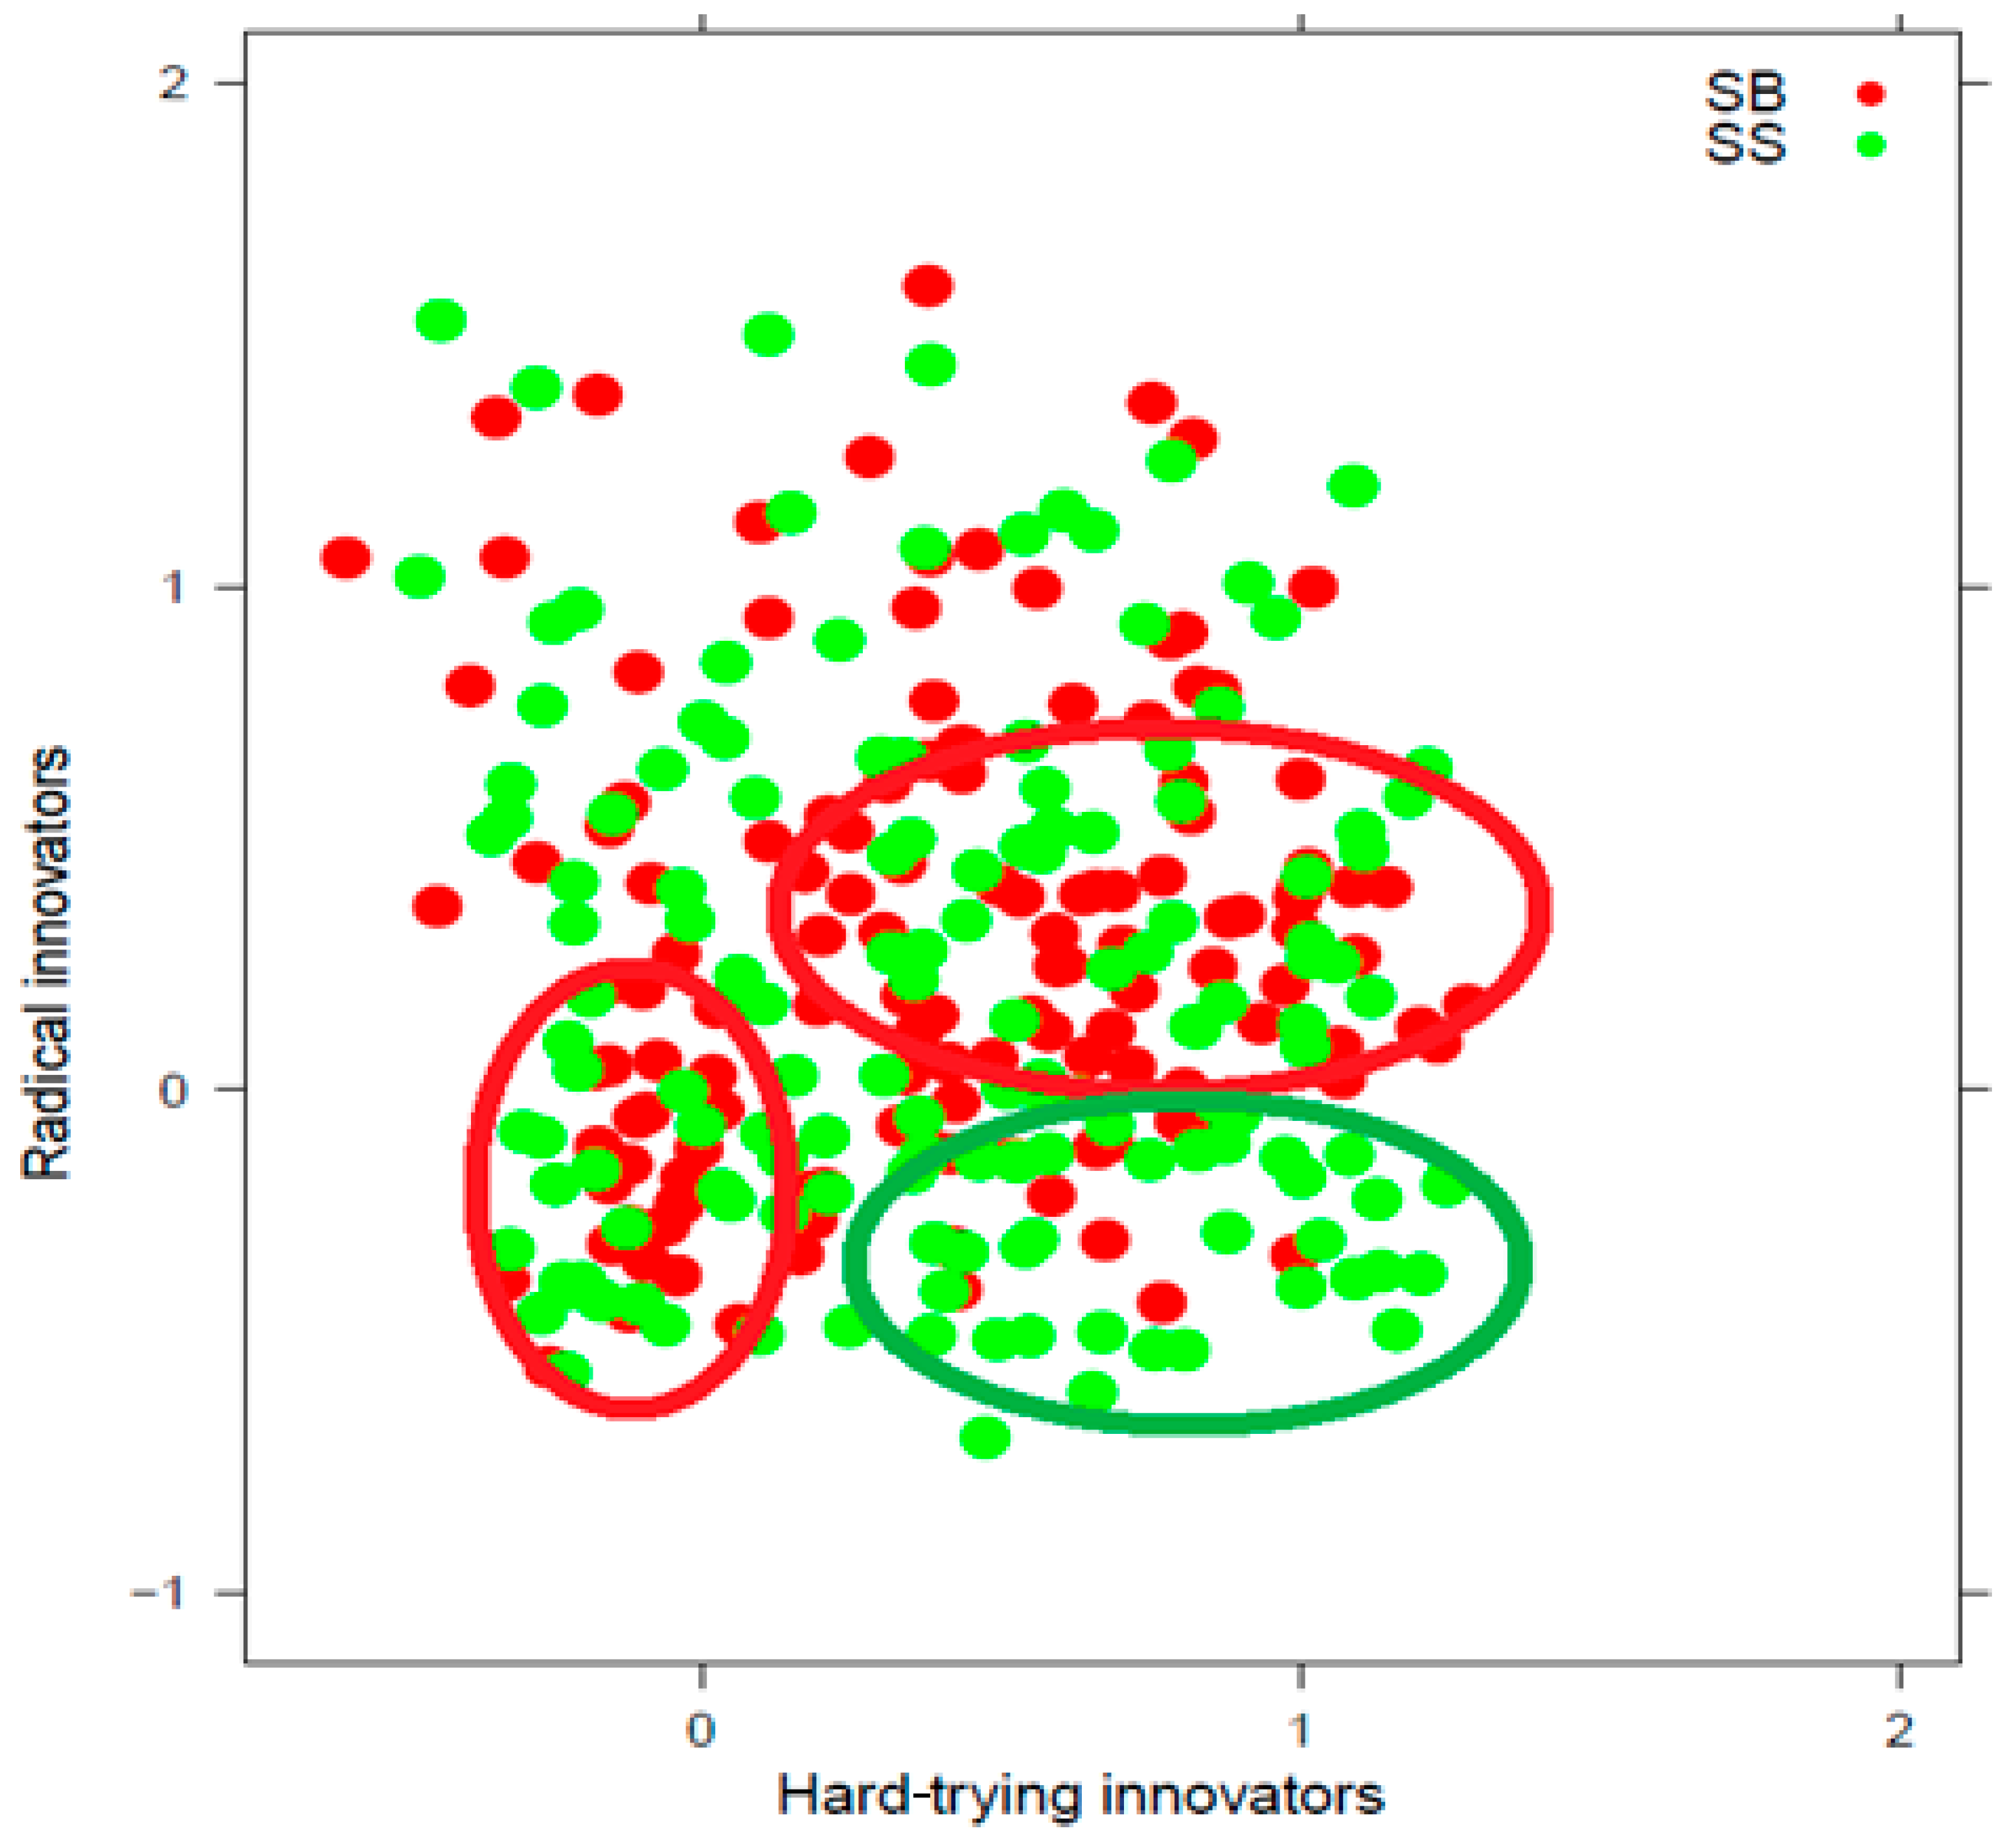
4.2. Relationships with the Pavitt–Miozzo–Soete Taxonomy

A first correspondence between the approaches to innovation that we retrieved and the traditional sectoral aggregations can be obtained by drawing the heat map in Figure 2. In the heat map, a darker cell color corresponds to a relatively higher average score for the associated factors listed horizontally, as obtained by the firms belonging to the industries listed on the vertical axis. In particular, the industries were aggregated according to an extended sector-based taxonomy, which uses the categories of Pavitt [10] for the manufacturing industries (science-based, specialized supplier, scale-intensive, supplier-dominated) and the categories of Miozzo and Soete [11] for the service industries (supplier-dominated services, physical network services, information network services, knowledge intensive business services). The simultaneous use of the two taxonomies has previously been shown, among others, by Castaldi [26]. Following Capasso et al. [37], we reclassified optical instrument manufacturing as a specialized supplier activity; we also included primary sectors in the extended taxonomy under the names “primary 1”, which refers to NACE sectors 01–03, and “primary 2”, which refers to NACE sectors 04–09. The heat map was constructed by adopting a column normalization; in other words, the factors scored were individually normalized, so that the heat map indicates (with a color tending towards red) the Pavitt–Miozzo–Soete sectors, which have the highest average score for each specific factor. On average, the firms belonging to the corresponding industries exhibited a higher intensity in their particular approach to innovation associated with the factor in question.
It is immediately noticeable in Figure 2 that specialized supplier industries and science-based industries scored relatively high on both the “radical innovators” and “innovation suppliers” factors. However, their score was substantially different for the first factor “active R&D doers”, an approach that appears to be followed more by science-based industries. Interestingly, the primary sectors also seemed to follow the “active R&D doers” approach, as shown by the darker color of the “primary 1” and “primary 2” sectors in the first column. We need to point out here that in the Norwegian Innovation Survey on which our study was based, the “primary 1” industries mainly consist of aquaculture firms and the “primary 2” industries mainly consist of “oil & gas” firms. Therefore, finding high levels of formal R&D in these sectors in Norway is less surprising than might be in other countries. Primary sectors also seem also to prioritize a “knowledge absorbers” approach, whereas knowledge-intensive business services score high, as expected, in the “customer-oriented service suppliers” column. Notably, the same column showed high scores for several manufacturing sectors. Information network services and physical network services seem to pair up in their preference for “process developers”, “strategic adapters”, and “individual standard service suppliers” approaches. In general, the “individual standard service suppliers” approach seems to be favored by service firms, while the “strategic adapters” approach seems to be favored by both manufacturing and service firms but not by primary firms.
The heat map in Figure 2 appears to confirm the intuitions behind the innovation taxonomies of Pavitt [10] and Miozzo and Soete [11] and, in general, seems to provide confirmation of the convenience of sector-based taxonomies. However, some firm-level patterns were missed in the averaging behind the heat map. We now show some scatter plots which, given the innovation approach factors we have retrieved, shed new light on the existing taxonomies. Following on from our observation of the heat map, as described in the previous paragraph, we zoom in on the science-based and the specialized supplier firms, who both exhibited high scores on the factors “radical innovators” but scored, at least on average, differently with respect to the factor “active R&D doers”. Therefore, we will see how their scatter plots appear when we measure the scores for the factors “active R&D doers” and “radical innovators”, respectively, on the two axes of the diagram. The comparison of the two scatters will allow us to shed new light on the relation between the two sectors: as we know from Pavitt [10], science-based firms provide technologies for the whole economy, but typically receive technology from specialized supplier firms. We will then use the same dimensions to visualize firms in the “primary 1” sectors, which were not considered by Pavitt [10], but have appeared to be important “active R&D doers” in the heat map we have shown. Finally, we will observe how the scatters of science-based firms and specialized suppliers appear when, in the first dimension on the diagram, we measured the scores for the “hard-trying innovators” and “innovation promisers” factors, respectively. We chose these two factors because they represent approaches to innovation that emerged from our analysis, but had not been previously isolated by the empirical literature. Therefore, a visual observation of the two corresponding scores can clarify the advantages of our method in bringing to light heterogeneities, both between and within economic sectors, through a nuanced vision of the firms’ innovation patterns. These scatter plots are therefore meant only as visual examples of the motivation behind our method, before we move, in the following subsection, to a more systematic analysis.
In Figure 3 we see a scatter plot where each point corresponds to a firm belonging, respectively, to science-based industries (red points) and specialized supplier industries (green points). The horizontal axis measures the score obtained by the firm for the factor associated with “active R&D doers”, while the vertical axis measures the score associated with the “radical innovators” factor. The scatter plot allows us to see both the differences between sectors (different positions of the clouds) and the firm heterogeneity within the sectors (shape of the clouds), in relation to the two factors under consideration. Figure 3 shows two clouds with a similar shape, elongated upward and reaching high scores in the “radical innovators” approach. In both cases, the body of the cloud appears to be lower and notably lower for specialized supplier industries than for science-based industries. The “radical innovators” approach thus appears to be more common in science-based industries, whereas the high average score in the specialized supplier industries seems to be driven by a subset of firms. The “active R&D doers” approach seems to coexist with the “radical innovators” approach, especially for science-based firms that are in the medium-range of the “radical innovators” score; indeed, the red cloud shows an extension toward the right, which departs from the middle of its body. In other words, a group of firms stands out from other firms in the same Pavitt macro-sector by following two different innovation approaches at the same time.
This was not the case for other sectors. Figure 4 shows a scatter plot of firms in the “primary 1” sectors (depicted in blue; they are mostly aquaculture firms) in a diagram with the same axes as in the previous figure. While a cluster of firms could be observed around the origin of the diagram, overlapping with the red “dots” of the science-based industries, an extension of the blue “cloud” could be observed toward the right, departing directly from the cluster and clearly lower than the right extension of the red cloud. The extension was composed of aquaculture and fishing firms, which scored relatively high on their “active R&D doers” approach; however, they had a low score on the “radical innovators” approach, even often lower than the average in their sectors. In other words, the coexistence of the “active R&D doers” approach and “radical innovators” approach is more likely if a firm belongs to a science-based industry than if it belongs to the aquaculture and fishing sector, and this observation cannot be explained only by the higher average score of science-based firms in the “radical innovators approach”. The scatter plot in Figure 4 thus suggests that intersectoral differences in innovation patterns may be ascribed not only to different average firm behaviors within each sector, but also to specific routes, different in each sector, that are available for improving innovation.
We can now go back to the comparison between science-based industries and specialized supplier industries, but this time with a scatter plot on which the horizontal axis represents the “hard-trying innovators” score. The result is shown in Figure 5; the red and green circles have been added to highlight where firms in science-based and specialized supplier industries tend to have similar scores for both the “radical innovators” and the “hard-trying innovators” factors. We need to first point out that both the green and the red cloud appeared relatively wide in both directions: firms can position themselves in different ways when it concerns these two approaches, even within the same Pavitt macro-sector. However, the green cloud referring to specialized supplier industries appeared denser in the bottom right corner: several firms display a low “radical innovators” score coupled with a high “hard-trying innovators” score. The red cloud of science-based industries showed two clusters of firms: one in the bottom left corner and one in the middle-right area. Firms in science-based industries can thus be low in both the “radical innovators” and the “hard-trying innovators” approach, or can have a high “hard-trying innovators” approach coupled with an average “radical innovators” approach. Therefore, the dispersion of the red cloud bears witness to heterogeneity within the science-based industries, while the density of the red cloud in two areas suggests some degree of behavior polarization within the same industries.
As a final example, in Figure 6, we show the same firms, once again with the “radical innovators” score measured by the vertical axis; however, this time, the horizontal axis measures the “innovation promisers” score. While the green cloud of firms in specialized supplier industries did not display any pattern, the red cloud of firms in science-based industries seemed to extend in a diagonal direction, from top-left toward the bottom-right. In other words, firms that do not belong to the central denser area seemed to tend more strongly toward one of the approaches, with some degree of substitution between these two approaches. Namely, a firm from a science-based industry scoring high on the “innovation promisers” factor is likely to score relatively low on the “radical innovators” factor. In other words, a firm in a science-based industry might be able, at a given point in time, to attract investors with high innovation expectations without displaying a propensity for radical innovation. Tentative explanations could be postulated including the possibility of cycles from planning to implementing innovation processes in science-based firms; in any case, a main message from the scatter plot is the possibility of negative correlations between approaches, even within the same Pavitt macro-sector.

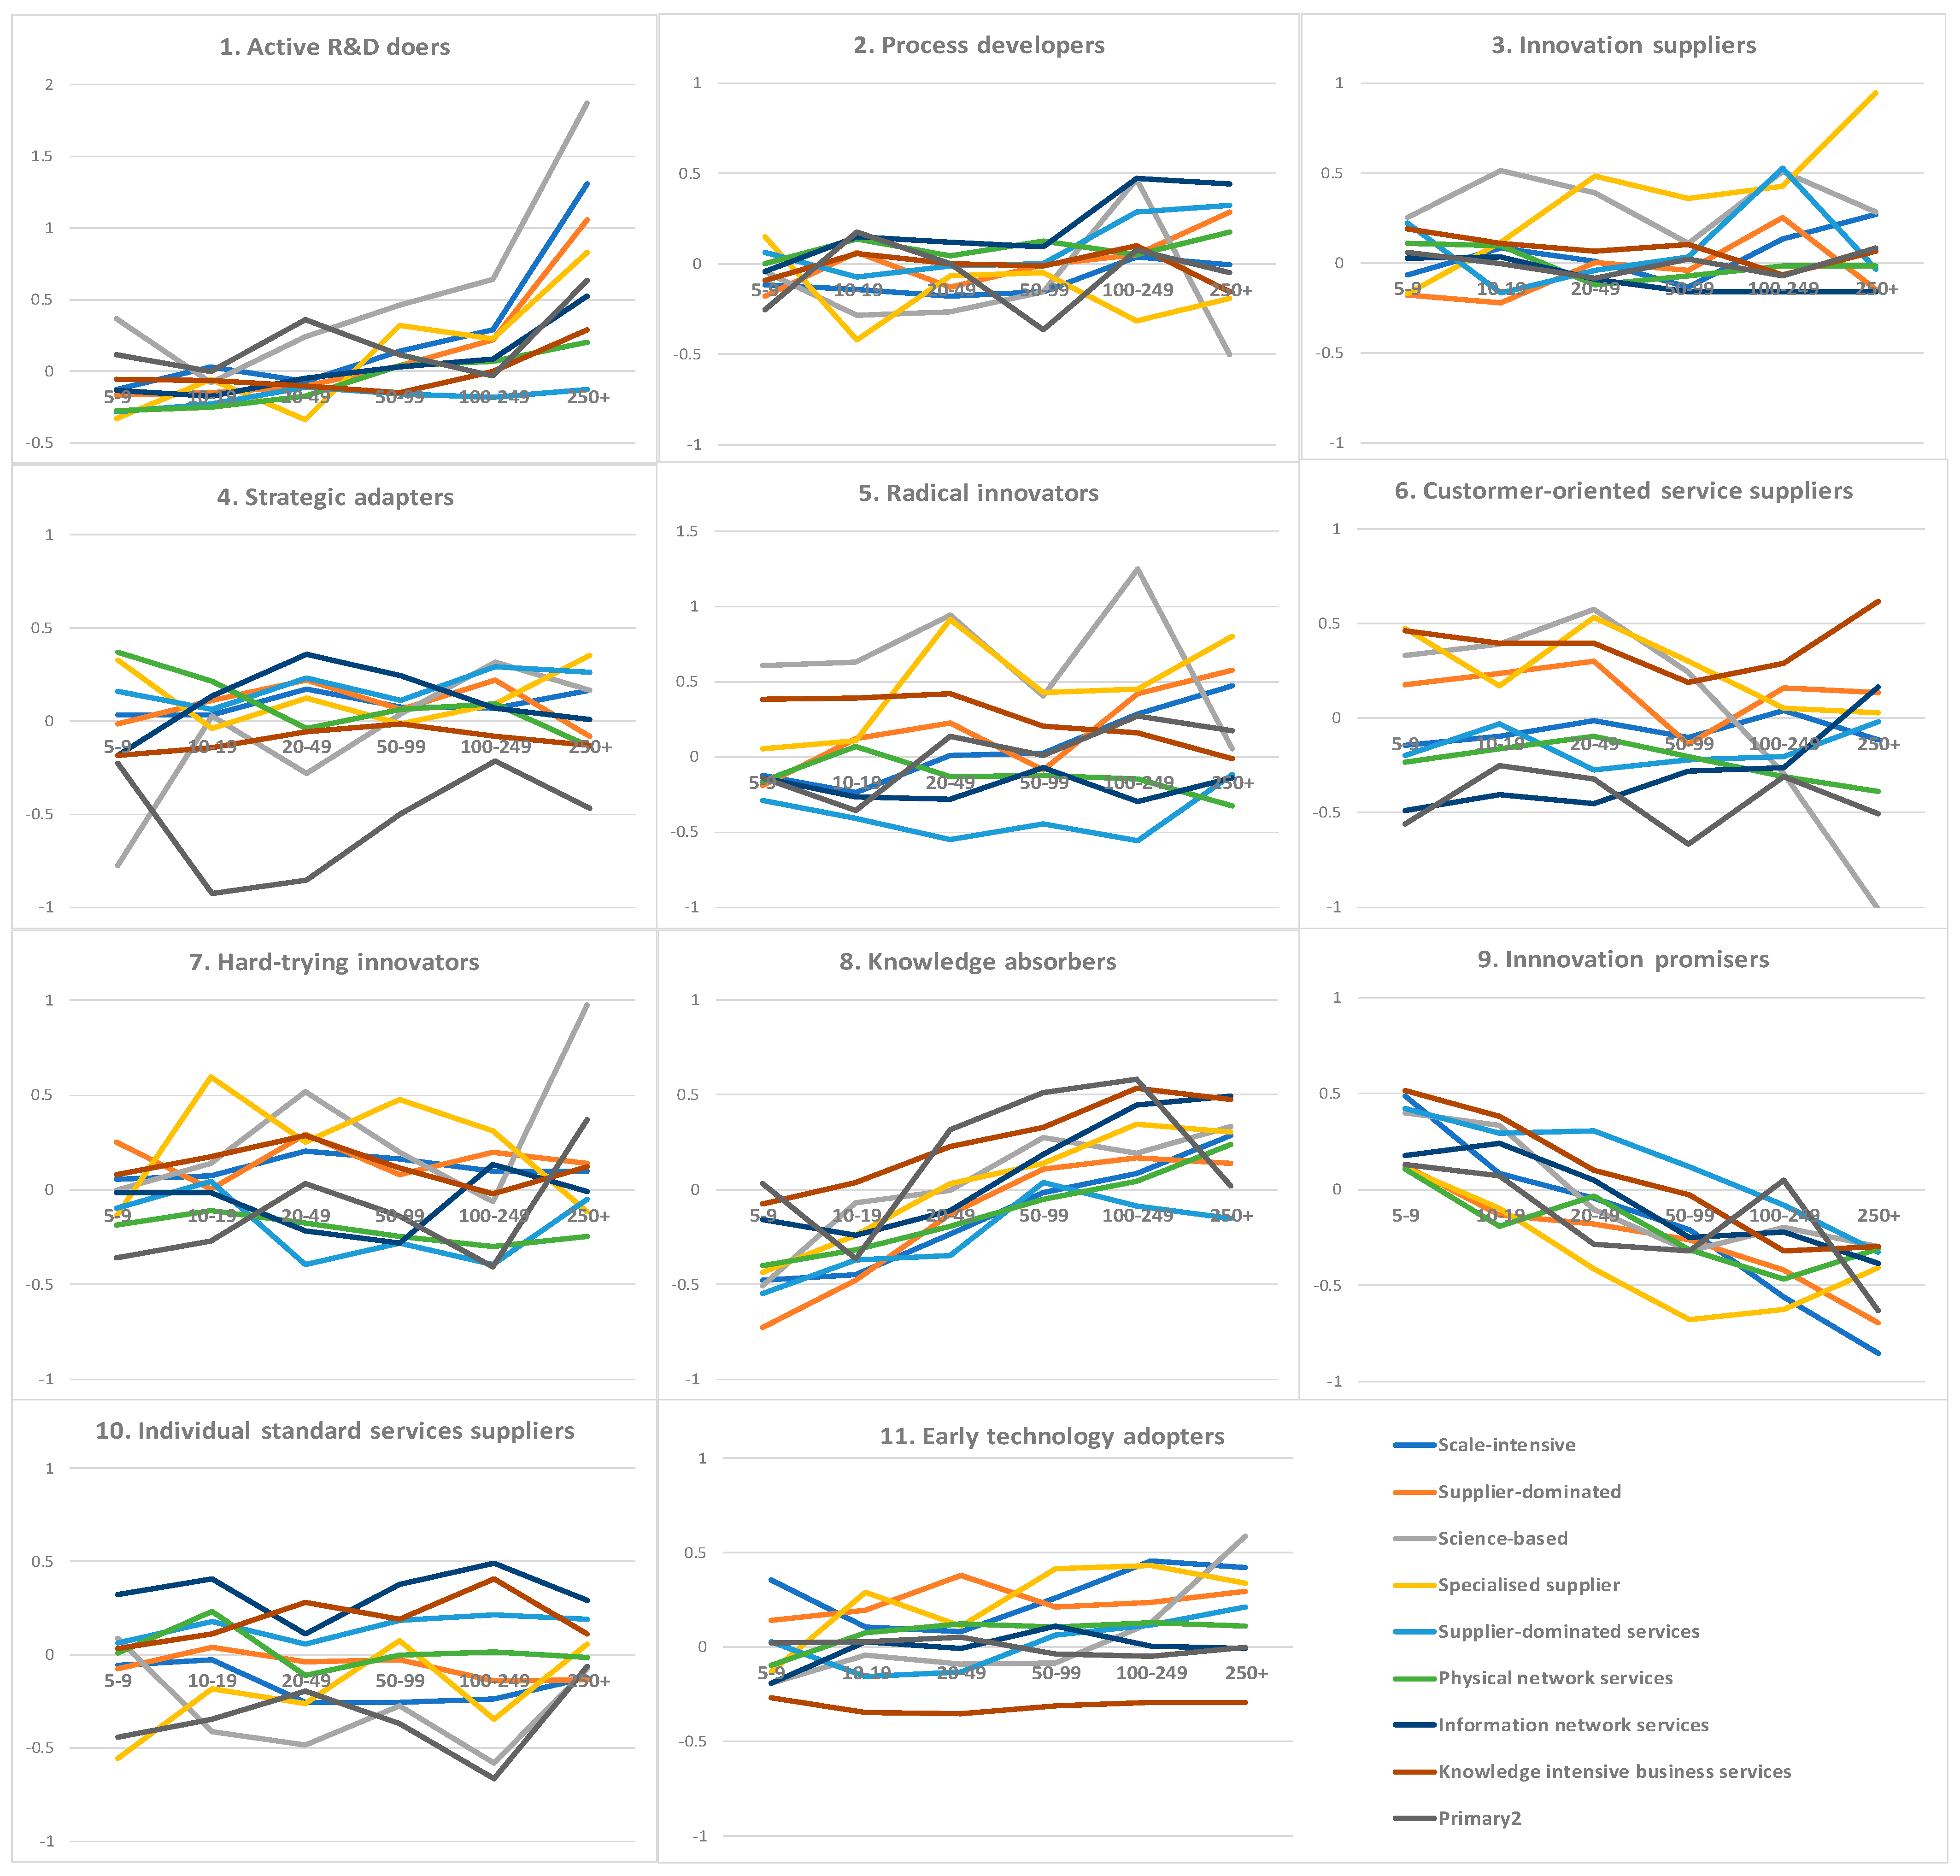
4.3. Relationship with Firm Size

In this section, we explore the relationship between different approaches to innovation and firm size, measured by number of employees. Are some of these approaches more common among small, and some among large firms? To undertake this, we first centralized the factor scores by subtracting the mean value and dividing by the standard value of the corresponding factor:
S i j c = ( S i j μ j ) / σ j ,
where i is the number of firms (i = 1, …, 6360); j is the number of factors (j = 1, …, 11); μ j is the mean value of all scores for factor j; and σ j is the standard deviation. Then, we calculated, for each of the factors, the correlation between the centralized score and firm size, as proxied by the number of employees (firms with less than five employees were not covered by the survey). Most of the firms in the survey were small firms (only 6% of the firms in the survey were large firms in the OECD context) as the survey covered all firms with at least 50 employees and a representative sample of firms with 5–49 employees, thus reflecting the fact that most Norwegian firms are small. Nine of the eleven approaches to innovation showed positive correlation between factor score and firm size. In particular, “active R&D doers” (correlation equal to 0.11) and “knowledge absorbers” (0.08) appeared to have the strongest association with firm size. All the other approaches exhibited less important correlations (between −0.01 and 0.05), with the exception of “innovation promisers” whose negative correlation almost reached −0.08. We also need to point out that “innovation suppliers” and “radical innovators” seemed to have a U-shaped correspondence with firm size (i.e., they yielded high scores for the smallest and largest firms and low scores in the middle of the size distribution).
To check whether these patterns hold irrespective of the firm’s industry, we constructed a set of graphs plotting factor scores against firm size and against the Pavitt–Miozzo–Soete (PMS) sector. These are presented in Appendix C (note that the factor was measured on the vertical axis; we do not consider firms in the “primary 1” group here, since only few observations were available for some size categories).
The first factor identified through our procedure corresponded to the innovation pattern that we called “Active R&D doers”. When we plotted the factor against firm size, we obtained lines with positive slopes irrespective of the Pavitt–Miozzo–Soete (PMS) sector to which firms belong, an exception being supplier-dominated services. In other words, regardless of which PMS macro-sector the firm belongs to, a larger firm size implies a likely higher “active R&D doers” approach to innovation. However, for almost every size class, science-based firms seem to adopt an “active R&D doers” approach to innovation more than all the other macro-sectors.
The second pattern detected by our procedure, namely the “process developers” pattern, seemed to be positively associated with firm size for supplier-dominated services, information network services, and supplier-dominated manufacturing. Notably, information network services appeared to generally be more inclined to have this approach than other sectors. Science-based industries displayed an inverse-U shaped relationship, in the sense that very small or very large science-based firms are less likely to follow a “process developers” pattern. Both science-based and specialized supplier firms displayed a stronger tendency to adopt an “innovation suppliers” approach in relation to firms of a similar size from other macro-sectors. Specialized suppliers seem more likely to be “innovation suppliers” when their firm size is larger. Meanwhile, for science-based firms, a larger size is associated with a stronger likelihood of being “strategic adapters”. This fourth factor denomination also seemed to be relevant for information network services, but only when their average size entered the “20–49 employees” size class. However, this approach to innovation appeared to be less common among firms in the “primary 2” group, irrespective of their size.
The association previously detected of both science-based and specialized supplier firms with the “radical innovators” pattern seems to be confirmed for all levels of firm size. At the same time, supplier-dominated services did not often appear to be in the “radical innovators” set, regardless of their size. An interesting case is constituted by the knowledge-intensive business services, which are more likely to be “radical innovators” when their size is smaller. Knowledge-intensive business services also typically appear to be “customer-oriented service suppliers” (our sixth identified pattern), irrespective of size. Interestingly, the same pattern was also associated with science-based firms, but only smaller ones: large science-based firms are highly unlikely to be “customer-oriented service suppliers”. Such a pattern may be associated with knowledge-intensive business services and supplier-dominated manufacturers, irrespective of size. Here, specialized suppliers were in line with science-based firms, in that their identification as “customer-oriented service suppliers” holds mainly for small firms. Information-network services, meanwhile, became more strongly associated with being “customer-oriented service suppliers” as their size increases. Firms in the “primary 2” group did not seem to conform to this pattern, irrespective of their size.
On average, information-network services, physical network services, and supplier-dominated services displayed a low “hard-trying innovators” factor, irrespective of their size. Specialized suppliers and science-based firms scored high in this factor. However, firm size did not appear to play an important role for these macro-sectors either. A totally different figure was obtained from the depiction of the “knowledge absorbers” factor in relation to firm size. Here, an increase in average firm size seemed to correspond to a higher “knowledge absorbers” factor for most macro-sectors; an exception was provided by firms in the “primary 2” group, whose relation to the factor was inverse U-shaped. Given the firm size, knowledge-intensive business services are more likely to be “knowledge absorbers”, together with science-based firms, information network services, and specialized suppliers; supplier-dominated services, however, are less likely to be “knowledge absorbers”. Small firms of supplier-dominated manufacturers are unlikely to be “knowledge absorbers”.
The “innovation promisers” factor seemed to be negatively correlated with size, with this relationship holding for all PMS sectors. However, the negative correlation appeared to be even stronger for supplier-dominated and scale-intensive manufacturers. Given firm size, supplier-dominated services and knowledge intensive business services are more likely to be “innovation promisers”, while specialized suppliers are less likely to be. Size does not seem to play a role in the likelihood of a firm being an “individual standard service supplier” (our tenth identified innovation pattern). Here, services such as information network services, knowledge intensive business services, and supplier-dominated services scored high, while manufacturers such as science-based firms, specialized suppliers, and scale-intensive firms scored low, irrespective of size. Finally, the “early technology adopters” pattern does not seem to be typical of knowledge-intensive business services, regardless of their size. Fairly large specialized suppliers and science-based firms are more likely to be “early technology adopters”, while medium-sized scale-intensive firms are less likely to be.

5. Discussion

The innovation pattern designated “early technology adopters” seems to be particularly relevant for firms that would be classified as “supplier-dominated” manufacturing under the PMS taxonomy. Indeed, this approach to innovation involves acquiring knowledge as embedded in machinery, equipment, and software, and profits from cooperation with suppliers, and thus appears fully in line with the designation of supplier-dominated industries applied by Pavitt [10]. We also noticed that firms in the PMS supplier-dominated industries (including now also service firms, as in the extension by [11]) are more likely to be “process developers” when they are larger.
To understand this phenomenon, we need to return to the work of Cesaratto and Mangano [33], who detected two clusters of firms (named Cluster 5 and Cluster 6), both relying on embodied technical change. Both clusters would be supplier-dominated according to the definition by Pavitt [10] and the PMS taxonomy. However, the latter cluster (Cluster 6) comprises firms that are larger, more focused on process innovation, and more able to conduct in-house research. In our study, the higher possibilities for in-house R&D (Factor 1) and for knowledge absorption (Factor 8) appeared for larger firms, irrespective of their industry. Instead, the focus on process innovation emerged from a separate dimension of innovation, as revealed by our factor analysis, a dimension where supplier-dominated firms score higher when they are larger. In our work, the complex view of Cesaratto and Mangano [33] of the role of firm size in supplier-dominated industries thus appears to be disentangled into four separate dimensions. We can also add that smaller supplier-dominated firms seem to resort more often to an “innovation promiser” approach, characterized by a focus on a small number of key goods and services as well as by externally financed ideas for future innovation. The high “innovation promiser” scores obtained by small firms in many economic sectors might also signal an ongoing rejuvenation of some industries including the supplier-dominated industries, with technological opportunities caught by younger firms.
The relationship between firm size and process innovation also appeared clearly in our data for firms belonging to information network services, as defined by the PMS taxonomy. However, here, size also correlated positively with a factor score in the “customer-oriented service suppliers” approach. Therefore, while information network services generally tend to score high as “individual standard service suppliers”, a larger firm size offers them more possibilities for process innovation as well as for the “co-creation” of products in cooperation with private customers and with the public sector.
The opposite holds true for firms in the PMS-defined science-based and specialized supplier industries, whose attempts to customize products seemed, according to our analysis, to diminish with firm size. Both science-based and specialized supplier firms tended to adopt an “innovation supplier” approach (Factor 3) and a “radical innovator” approach (factor 5), in line with what Pavitt [10] could have predicted. However, firms in specialized supplier industries tend to score even higher on the “innovation supplier” factor when they are larger, while larger firms in science-based industries become more likely to be “strategic adapters” (Factor 4), and thus to provide a higher quality of products in the market segment they serve. The different results in these two PMS macro-sectors suggest that for science-based industries, an increase in firm size may translate into more direct connections with the final markets, without an increased reliance on intellectual property rights.
Another important difference between science-based and specialized supplier industries, already outlined in the previous section, was the former’s higher score on the “active R&D doers” factor, irrespective of size, pointing at wider collaborations and greater access to public funding. This behavior, consistent with the observations by Pavitt [10], is complemented by other strategies depending on firm size: for smaller science-based firms, we found higher scores for Factor 5 (“customer-oriented service suppliers”), while for larger science-based firms, we found higher scores for Factor 11 (“early technology adapters”). Firms in science-based industries, according to the PMS taxonomy, therefore seem to be able to acquire knowledge embedded in equipment, also by resorting to loans when they are bigger (a behavior they share with specialized suppliers); however, when their firm size is small, they more often pursued customization of their products.
Specialized supplier industries complement instead their “radical innovator” and “innovation supplier” approaches, irrespective of firm size, with the strategies identified by high scores on Factor 5 (“customer-oriented service suppliers”) and Factor 7 (“hard-trying innovators”). Knowledge-intensive business services are also “customer-oriented service suppliers” irrespective of firm size, and to even greater extent than specialized suppliers; this observation marks a difference with respect to firms in science-based industries for which customization seems to become a necessity for survival only for smaller firms. On the other hand, knowledge-intensive business services have a higher chance of being “radical innovators” when they are smaller, unlike firms in science-based industries that have a generally high chance of being “radical innovators”. Our results here seem to confirm the vision of De Jong and Marsili [14], whose micro-based clustering identified some small service firms as “science-based”: with our designations, the corresponding firms in our dataset would probably be those firms in knowledge-intensive business services that score high in Factor 5 (“radical innovators”).

6. Conclusions

The main outcome of our study is a novel view of innovation as a multifaceted concept. Many observable variables can be connected to a measure of innovation, which in turn appears at the firm-level through a plurality of processes and products. Labeling an industry or a firm as more or less innovative may sometimes neglect the specificity that each industry and each firm has in pursuing innovation. Sectors that in traditional views would be considered supplier-dominated may give rise to novel pathways toward innovation, and even when their innovation occurs through the absorption of knowledge from other sectors, they must often actively foster their absorptive capacity.
Our analysis also brings to the fore the importance of firm size in defining innovation possibilities. Previous attempts at building taxonomies of innovation behavior have already pointed out that a larger average firm size within an industry would tend to characterize the innovation possibilities of the industry. When taxonomies were built at the firm level, the association of a firm with a specific set of characteristics often depended on the size of the firm. We have shown that the interaction of size and industry also plays a part in defining the firm’s approach to innovation: for instance, product and service customization may occur more frequently among smaller firms in science-based industries and among larger firms in information network services. The acknowledgement of the coexistence of different approaches to innovation, even within the same firm, is also crucial for uncovering the ways in which small firms may survive in sectors dominated by large firms including the sectors traditionally labelled scale-intensive.
The increasingly blurred boundary between manufacturing and services, a known fact already studied previously in the literature, was illustrated in this study in terms of innovation behavior. Our approach is rather the reverse of studies that have grouped industries according to prevailing innovation patterns. Instead, we have detected recurring innovation patterns across firms independently of the industry to which the firms belong. This research path has helped us to find commonalities in innovation behavior across industries and, as a consequence, to better isolate the innovation patterns that differentiate industries from one another. For instance, both specialized suppliers and firms in science-based industries may pursue radical innovation and may use intellectual property rights, but access to, and dependence on, public funding is greater in science-based industries while collaboration with customers is more extensive for specialized suppliers. Notably, a radical innovation approach may also be employed by business services, whose possibility of being “knowledge-intensive” depends on their approaches to innovation, decided at firm level as much as by the type of services they provide, as marked by industry codes.
We also need to point out some limitations in our work, which can also be seen as challenges for future research. We have tried in our study to connect, as much as possible, our empirical results with the theoretical base that motivated us to enter this subject. However, the existence of several dimensions in the innovation process also entails that a proper comparison with the existing literature would need much more time, in terms of work, and much more text, in terms of explanations, than one scientific article can offer. We hope that some of our results could later be further evaluated in the light of specific strands of literature, dealing respectively with particular aspects of innovation, so that finer analyses can be suggested for a deeper understanding of the empirics in our study.
Stronger connections with the existing literature might also allow for the construction of theoretical methods, which would provide possible aggregations of the eleven approaches to innovation retrieved by our analysis. Indeed, as we have mentioned in the methodological section, our focus on the eleven approaches is suggested by the preliminary results, but is not immune to some arbitrariness. A different number of approaches to innovation may be considered, corresponding to a selection of a different number of driving factors pushing the firms’ answers to the Innovation Survey. In turn, a different number of factors would correspond to some aggregation or disaggregation of the eleven retrieved approaches. A researcher could borrow ideas from clustering techniques; for instance, an inspection of the dendrogram resulting from hierarchical clustering where firms are clustered according to their answers to the survey or according to their scores in the factor analysis might lead to important details about the firms’ innovation patterns. Moreover, theoretical methods might propose aggregations of the eleven “typical” patterns we retrieved by adopting frameworks built in previous studies.
Along the same line of reasoning, a researcher may further explore the complementarities that exist between the firms’ decisions and which hide behind our eleven retrieved patterns. In technical terms, a specific innovation pattern was, in our analysis, associated with a specific factor which, through a vector of weights, connected to the answers provided by firms to the Innovation Survey. Our analysis has indeed assumed that each specific innovation pattern explains part of the correlations between the firms’ answers to the different questions of the survey. If we think that a strategy lies behind the innovation pattern, for instance, a strategy for product customization or for radical innovation, then we can think that some of the answers to the different questions of the survey represent the different decisions that a firm must make in order to pursue this strategy. These decisions would thus be complementary to one another. Further algebraic analyses of the relations between factors and variables, that is, between the firms’ typical approaches to innovation and the firms’ answers to the Innovation Survey, might uncover further complementarities within and across firms.
It is also important for the reader to keep in mind the specificities of Norway with respect to other countries where previous empirical studies on the same subject have been conducted. Such specificities include, and are not limited, the frequent use of technology in primary sectors, the economic importance of oil extraction and refinement, the strong connections between the private and public sector and, more generally, the high level of development reached by a relatively small country with worldwide economic relations. Comparisons with other countries, where similar data sources exist to the one we used in this study, could suggest to which extent the innovation patterns retrieved by our analysis are replicated in different contexts.
As a final note, we can present an element of reflection to policy-makers. Considering only one approach to innovation as an optimal path to be promoted through innovation policies might mean overlooking the different needs and possibilities that firms have for pursuing innovation. Instead, acknowledging the variety of paths to innovation may make it possible to build policies targeted at a wider range of actors. For instance, further research could investigate how firms with different approaches to innovation behave under a crisis. We know that some industries may suffer more than others in a crisis. However, given the heterogeneity among the applied approaches to innovation within each industry, policy-makers may want to know whether some of the approaches to innovation (irrespective of industry and other firm characteristics such as size) make firms more resilient to crises.

Author Contributions

Conceptualization, M.C.; methodology, M.C. and M.R.; software, M.C. and M.R.; validation, M.C. and M.R.; formal analysis, M.R.; investigation, M.C. and M.R.; resources, M.C. and M.R.; data curation, M.R.; writing—original draft preparation, M.C. and M.R.; writing—review and editing, M.C.; visualization, M.C. and M.R.; supervision, M.C. and M.R.; project administration, M.C.; funding acquisition, M.C. and M.R. All authors have read and agreed to the published version of the manuscript.

Funding

This research was funded by the Research Council of Norway (grant number 316585).

Institutional Review Board Statement

Not applicable.

Informed Consent Statement

Not applicable.

Data Availability Statement

The data from the 2018 Norwegian Innovation Survey can be requested to SSB (Statistics Norway) at www.ssb.no/en (accessed on 1 January 2022).

Acknowledgments

The authors thank all the participants to the Innovation Norway seminar held in Oslo on 23 April 2021 and to the EU-SPRI session on “Innovation in times of crises” held in Oslo on 9–11 June 2021 for useful comments and suggestions. The responsibility for any error and the views expressed are solely of the authors.

Conflicts of Interest

The authors declare no conflict of interest.

Appendix A. Definition of Indicators Based on Community Innovation Survey 2018 for Norway. The Question Number from the Norwegian Version of CIS2018 Used to Construct the Corresponding Set of Indicators Is in Parentheses

  • Market location (Question 1.1): A set of dummy variables indicating whether a firm sells its products (goods or services) mainly in local/regional, national, European, or other international markets. This question indicates the location of a firm’s main competitors. The corresponding dummy variables are d_sigmarloc, d_sigmarnat, d_sigmareur and d_sigmaroth.
  • Firm’s strategies (Question 2): A set of dummy variables indicating whether the following strategies were important (the corresponding indicator is set equal to 1 in the case of high or medium importance, and 0 in the case of low or no importance) to the economic performance of a firm in 2016–2018:
    o
    Focus on improving your existing goods or services, d_straimp
    o
    Focus on introducing new goods or services, d_straint
    o
    Focus on low-price (price leadership), d_stralow
    o
    Focus on high-quality (quality leadership), d_straqua
    o
    Focus on a broad range of goods or services, d_straran
    o
    Focus on one or a small number of key goods or services, d_strafoc
    o
    Focus on satisfying established customer groups, d_straest
    o
    Focus on reaching out to new customer groups, d_stranew
    o
    Focus on standardized goods or services, d_strasta
    o
    Focus on customer-specific solutions, d_stracus
  • Customization and co-creation (Questions 3 and 3.1). The difference between customization and co-creation is that in ‘customization’ the enterprise designed and developed the product alone, whereas in ‘co-creation’ the enterprise designed and developed the product together with the user. A set of dummy variables indicating whether a firm offered any of the following types of goods or services to meet user requirements in 2016–2018 and the group of users involved:
    o
    Goods or services co-created with users (i.e., the user had an active role in the creation of the idea, design, and development of the product (co-creation)), d_specoc
    o
    Goods or services designed and developed specifically to meet the needs of particular users (customization), d_specom
    o
    Standardized goods or services offered to different users in the same way (mass customization), d_specus
    o
    Users involved in customization and co-creation included private business enterprises, d_spedpr
    o
    Users involved in customization and co-creation included public sector and non-profit organizations, d_spedpu
    o
    Users involved in customization and co-creation included individuals or households, d_spedhi
  • Use of intellectual property rights, IPR (Question 4): A set of dummy variables indicating whether a firm applied for a patent, registered an industrial design right or trademark, claimed a copyright, or used trade secrets in 2016–2018. The corresponding dummy variables are d_propat, d_prodes, d_protm, d_prosec, and d_procp.
  • IPR marked (Question 5): A set of dummy variables indicating whether a firm sold its own IPR or purchased IPR from others in 2016–2018:
    o
    Sold its own IPRs (or assign IP rights) to others, d_intoth
    o
    Licensed out its own IPRs to others, d_intlic
    o
    Exchanged IPRs (pooling, cross-licensing, etc.) with others, d_intsha
    o
    Purchased or licensed-in patents or other IPRs from private business enterprises or individuals, d_intbpr
    o
    Purchased or licensed-in patents or other IPRs from public research organizations, universities, or other higher education institutions, d_intbpu
  • Acquisition of knowledge (Question 6): A set of dummy variables indicating whether a firm used any of the following channels to acquire knowledge in 2016–2018:
    o
    Conferences, trade fairs or exhibitions, scientific/technical journals or trade publications, d_kno_research
    o
    Information from professional or industry associations, d_kno_proforg
    o
    Information from open databases, published patents, standardization documents or committees, d_kno_data
    o
    Social web-based networks, crowd-sourcing, open business-to-business platforms, or open-source software, d_kno_network
    o
    Extracting knowledge or design information from goods or services (reverse engineering), d_kno_other
  • Skills management (Question 7): A set of dummy variables indicating the importance to the management of a firm of the following methods of organizing work in 2016–2018:
    o
    Planned job rotation of staff across different functional areas, d_worrot
    o
    Regular brainstorming sessions for staff to consider how improvements could be made within the business, d_worbra
    o
    Cross-functional work groups or teams (combined across different working areas or functions), d_worwor
    o
    In-house training and/or possibility of professional development and skills upgrading through continuing education and external courses, d_worcom
  • Product innovation (Questions 8, 8.2, 8.3): A set of dummy variables indicating whether a firm introduced any product innovation in 2016–2018 and whether this product was new to the market (the broadest market is shown here, e.g., the European market in the case of both the Norwegian and the European markets; various answers are possible only in the case of multiple innovation) or only to the firm:
    o
    New or improved goods, d_inpd_good
    o
    New or improved services, d_inpd_serv
    o
    These new or improved products were not previously available on the local/regional market, d_newmktloc
    o
    On the national market, d_newmktnat
    o
    On the European market, d_newmkteur
    o
    On other international markets, d_newmktoth
    o
    These new or improved products were new only to the firm (identical or very similar products were already offered by a firm’s competitors on the market), d_newfrm
  • Process innovation (Question 9): A set of dummy variables indicating whether a firm introduced any of the following process innovations in 2016–2018:
    o
    Methods for producing goods or providing services (including methods for developing goods or services), d_inpcs_prod
    o
    Logistics, delivery, or distribution methods, d_inpcs_log
    o
    Methods for information processing or communication, d_inpcs_ict
    o
    Methods for accounting or other administrative operations, d_inpcs_adm
    o
    Business practices for organizing procedures or external relations, d_inpcs_nw
    o
    Methods for organizing work responsibility, decision-making, or human resource management, d_inpcs_hr
    o
    Marketing methods for promotion, packaging, pricing, product placement, or after-sales services, d_inpcs_mkt
  • Formal R&D activities (Questions 10, 10.1): A set of dummy variables indicating whether a firm had in-house and/or contracted-out R&D activities in 2016–2018 and whether the firm performed in-house R&D continuously (had permanent R&D staff) or occasionally. The corresponding dummy variables are d_rrd_int, d_rrd_ext, and d_rrd_cont.
  • Other innovation activities (Question 11): A set of dummy variables indicating whether a firm’s expenditures on other innovation activities (excluding formal R&D) was higher than the average share in the population of innovative firms for the corresponding type of expenditures (expenditures on innovation activities such as marketing of innovation, product design, preparation of production/distribution of innovation activities other than R&D have an average share of less than 0.08, and hence are not represented by a separate indicator):
    o
    Share of expenditures on own personnel working on innovation is higher than or equal to 0.52, d_invinno_pers
    o
    Share of expenditures on services, materials, supplies purchased from others for innovation is higher than or equal to 0.2, d_invinno_ext
    o
    Share of expenditures on capital goods for innovation (acquisition of machinery, equipment, software, IPRs, buildings etc.) is higher than or equal to 0.2, d_invinno_tech
    o
    Firm did not have any other innovation activities, d_invinno_zero
  • Expectations regarding innovation expenditures (Question 13): A set of dummy variables indicating whether a firm expected an increase or decrease in their total innovation expenditures (including formal R&D) in 2019 compared to 2018. This question indicates the innovation ambitions of the firm.
    o
    Increase by more than 5%, d_exp_up
    o
    Stay about the same (+/−5%), d_exp_fixed
    o
    Decrease by more than 5%, d_exp_down
    o
    No innovation expenditures expected, d_exp_zero
    o
    Do not know, d_exp_not
  • Collaboration (Question 14.1): A set of dummy variables indicating whether a firm co-operated with other firms or organizations in their innovation activities (including formal R&D) in 2016–2018 by type and location of cooperation partner:
    o
    Enterprises within the same enterprise group (other types are outside enterprise group), d_coop_group
    o
    Consultants, commercial labs, or private research institutes, d_coop_ consult
    o
    Suppliers of equipment, materials, components, or software, d_coop_suppl
    o
    Enterprises that are your clients or customers, d_coop_custom
    o
    Enterprises that are your competitors, d_coop_compet
    o
    Other enterprises, d_coop_otherf
    o
    Universities or other higher education institutions, government or public research institutes, d_coop_high
    o
    Public sector customers, non-profit organizations, d_coop_publ
    o
    Non-innovative collaboration, d_coop_noinno
    o
    Cooperation with partner(s) from the same region, d_coop_loc
    o
    From other regions of Norway, d_coop_norw
    o
    From other Nordic countries, d_coop_nordic
    o
    From other European countries (EU or EFTA), d_coop_eur
    o
    From all other countries, d_coop_world
  • Hampering factors (Question 15): A set of dummy variables (the corresponding indicator was set equal to 1 in the case of high or medium importance, i.e., if the answer is 2 or 3 of at least one of the sub-indicators, and 0 otherwise) indicating how important the following factors were in hampering the firm’s decision to start innovation activities, or its execution of innovation activities in 2016–2018:
    o
    Financial issues (i.e., lack of internal finance for innovation, lack of credit or private equity, difficulties in obtaining public grants or subsidies), d_hemp_fin
    o
    Costs are too high, d_hemp_cost
    o
    Skills needs (i.e., lack of skilled employees within the firm and/or lack of collaboration partners, lack of access to external knowledge), d_hemp_skills
    o
    Market and competition issues (i.e., uncertain market demand for the ideas, too much competition in the relevant market, different priorities within the firm), d_hemp_mkt
  • Funding for innovation activities (Questions 16.2 and 17.1): A set of dummy variables indicating whether a firm obtained the following types of funding for its innovation activities in 2016–2018:
    o
    Equity finance (finance provided in exchange for a share in the ownership of the enterprise), d_fin_owni
    o
    Debt finance (finance that the enterprise must repay), d_fin_loan
    o
    Public financial support (i.e., from local or regional authorities, central government agencies or ministries and/or from the EU), d_fin_publ
  • Technology adoption (Question 18): A set of dummy variables indicating whether a firm purchased machinery, equipment, or software in 2016–2018 that was based on:
    o
    An improved version of technology previously used in the firm, d_tech_pro
    o
    New technology not previously used in the firm, d_tech_new

Appendix B. Factor Loadings of Indicators in 11 Approaches to Innovation

Table A1. Factor loadings of the indicators for the eleven approaches to innovation. The table rows correspond to the indicator variables, built on the firms’ answers to the 2018 Norwegian Innovation Survey; the columns correspond to the eleven approaches to innovation retrieved by the factor analysis. The names of the approaches to innovation have been chosen according to the indicator variables with highest factor loadings.
Active R&D DoersProcess DevelopersInnovation SuppliersStrategical AdaptersRadical InnovatorsCustormer-Oriented Service SuppliersHard Trying InnovatorsKnowledge AbsorbersInnnovation PromissersIndividual Standard Services Suppliers Early Technology Adopters
VariableFactor1Factor2Factor3Factor4Factor5Factor6Factor7Factor8Factor9Factor10Factor11
d_sigmarloc−0.20660.0486−0.2724−0.0200−0.4982−0.0164−0.1144−0.01120.03200.0059−0.0453
d_sigmarnat0.0657−0.07370.11550.06040.06480.10800.07830.0752−0.17600.43450.0777
d_sigmareur0.14760.03620.1361−0.08530.2916−0.09270.0406−0.02790.0278−0.14940.0319
d_sigmaroth0.2161−0.01610.15950.02800.30400.02410.0701−0.01800.2364−0.2970−0.0569
d_straimp0.08230.20670.07780.71760.10450.15700.12330.1271−0.03190.1876−0.0293
d_straint0.18950.13850.31480.55130.20220.21340.0662−0.00800.16150.2403−0.0555
d_stralow−0.11100.0387−0.04510.4775−0.0267−0.02620.1023−0.0476−0.1315−0.26470.0922
d_straqua0.07130.08460.01900.83580.09550.19810.10430.1751−0.00810.05640.0838
d_straran−0.11710.1055−0.00240.5465−0.06620.1517−0.07060.0412−0.3508−0.01250.1324
d_strafoc0.12340.03180.05030.46800.0386−0.05480.0935−0.08930.4137−0.0383−0.1418
d_straest0.01000.0636−0.07810.7439−0.04540.15500.10950.1057−0.1506−0.06340.0537
d_stranew−0.03550.06310.15590.68170.04840.1548−0.02400.05450.13490.00370.0291
d_strasta0.05230.1062−0.06410.6297−0.0408−0.15750.06590.01280.07910.0977−0.0209
d_stracus0.01880.0919−0.00470.55680.05170.42850.07920.0497−0.0789−0.24230.0228
d_specoc0.25850.09860.02090.09320.14880.80150.14210.08980.0093−0.0275−0.0122
d_specom0.25780.13540.28550.18550.13320.74160.10010.00540.11400.17280.0983
d_specus0.13760.1509−0.00190.24000.14920.66480.15340.0893−0.0745−0.01530.0921
d_spedpr0.19420.12550.15150.15830.24620.80760.16640.03700.01790.01260.0960
d_spedpu0.14330.10410.08800.0915−0.14550.6947−0.07270.22820.05860.1161−0.1561
d_spedhi−0.00700.11990.25160.1623−0.49980.3568−0.0946−0.02870.01910.23810.1765
d_propat0.3503−0.04660.60920.01120.42760.06550.10430.09160.1901−0.17360.1336
d_prodes0.14060.05290.71230.08780.18420.03110.00060.11670.02330.07990.2910
d_protm0.22500.07320.65470.03280.18010.0526−0.02020.11930.16610.18650.1593
d_prosec0.40590.12420.45850.04600.30970.20210.11010.13390.1328−0.04460.0128
d_procp0.15810.04170.68930.05680.07390.13890.09310.0903−0.00240.10530.0253
d_intoth0.07800.12610.78340.05740.02540.14330.12970.0460−0.0086−0.0003−0.0906
d_intlic0.25910.04290.6318−0.01520.19600.05670.13320.01760.01300.0398−0.1981
d_intsha0.39340.11850.5938−0.01550.01370.19190.08590.00200.04020.0055−0.1972
d_intbpr0.31620.11990.6271−0.02200.04420.00830.08130.05610.02720.0130−0.0393
d_intbpu0.35780.03790.6072−0.00030.00660.08480.0929−0.08390.2515−0.2325−0.1334
d_kno_viten0.44550.15260.10230.21380.07990.15060.10070.66040.06360.06680.1247
d_kno_bransje0.24570.08060.04490.1494−0.10890.01010.00120.6848−0.13380.02230.0775
d_kno_data0.32950.04810.28680.03840.19740.12220.07910.55860.0519−0.21520.0732
d_kno_nettverk0.18740.25340.03370.12630.04590.20380.10390.54700.21440.1570−0.0945
d_kno_other0.12540.16590.14210.07100.16380.18910.14210.52900.1178−0.0009−0.0444
d_worrot0.00650.28110.00770.31680.00660.05690.12860.26860.0057−0.0503−0.1385
d_worbra0.20190.32480.15990.34950.07560.20190.10880.33930.17270.1445−0.1245
d_worwor0.29060.29430.22190.30350.14240.17540.11750.43020.07630.0751−0.1492
d_worcom0.09700.2672−0.00890.3493−0.05220.05890.06130.5043−0.01080.0155−0.1436
d_inpd_good0.36410.21730.21780.20180.49180.25810.1564−0.05450.06130.28090.2156
d_inpd_serv0.28600.3578−0.00750.19080.26930.29020.12660.07180.09850.50670.0101
d_newmktloc0.30380.2422−0.01860.15150.40800.30310.00660.00770.08460.34410.0288
d_newmktnat0.37660.14080.09140.12080.58700.29910.03990.05070.02870.3636−0.0007
d_newmkteur0.38050.13240.17350.06290.75480.18850.02150.02460.09850.1041−0.0227
d_newmktoth0.33830.08480.22260.05680.78310.17170.03010.01240.1500−0.05780.0103
d_newfrm0.21420.23050.08180.19680.04380.19380.22490.03150.05840.38290.2199
d_inpcs_produksjon0.31730.57430.06030.12560.21000.24730.14770.08630.16050.17810.0871
d_inpcs_logistikk0.15690.68380.06850.16180.00240.00990.0591−0.03190.05980.10070.1828
d_inpcs_ikt0.19590.77820.07960.07840.07620.12750.06750.13090.00230.17260.0221
d_inpcs_regn_adm0.04700.76150.07710.0220−0.02240.08240.07500.0451−0.0207−0.06720.0684
d_inpcs_relasjoner0.20080.81980.04040.04520.09000.09150.07140.11280.0081−0.0834−0.0313
d_inpcs_hrm0.14810.8258−0.01560.09250.02420.07420.09020.1089−0.0210−0.0663−0.0028
d_inpcs_marketing0.14180.70560.21420.19590.08450.11620.05200.02840.05070.15430.1401
d_rrd_int0.68030.05540.16550.08060.41280.16240.24020.10410.22670.12520.0532
d_rrd_ext0.69890.08660.2241−0.00570.28170.02520.14930.08670.17130.03210.0336
d_rrd_cont0.57530.02510.23440.05760.47380.11020.14200.12180.28080.0923−0.0104
d_invinno_perc0.22370.14440.08690.03340.16590.17890.33010.10130.02540.3294−0.2258
d_invinno_extj0.18680.17990.10710.07750.10640.14390.1571−0.02040.12430.13920.4499
d_invinno_tech0.16400.3162−0.09350.0965−0.05670.09750.10690.03600.0768−0.01040.6495
d_invinno_null−0.3828−0.3524−0.1060−0.0735−0.1472−0.2117−0.3078−0.0338−0.1314−0.2723−0.3953
d_exp_vekst0.22510.07140.04290.03170.10820.05460.12550.06480.40420.1051−0.0235
d_exp_fast0.21450.14870.15240.09750.17540.09600.09270.0505−0.25150.2268−0.0014
d_exp_ned0.2107−0.00740.04980.04080.04080.06080.1478−0.02560.0303−0.08010.3081
d_exp_null−0.21970.0456−0.2193−0.01980.0281−0.0684−0.08530.1175−0.21650.17290.0279
d_exp_usikker−0.11690.2152−0.00120.0231−0.18360.1004−0.0035−0.02120.1195−0.2024−0.0956
d_coop_konsern0.73040.20210.12310.10230.11410.02080.10380.0611−0.2335−0.00480.0405
d_coop_konsult0.79610.12630.11950.03940.12490.05010.10060.07740.11530.04070.0772
d_coop_leveran0.79370.17880.06190.06090.10140.07270.10530.09940.00170.02050.1889
d_coop_kunder0.67900.08700.18960.07580.20190.30040.11580.02780.0135−0.05560.0257
d_coop_bransje0.63110.14900.1157−0.1459−0.21630.05490.16740.1946−0.00730.1548−0.0248
d_coop_andref0.55760.12270.04810.1096−0.00950.09720.1116−0.03020.01550.2276−0.0292
d_coop_fuh0.78260.03180.1421−0.06850.17860.09640.07580.17080.1971−0.0654−0.0474
d_coop_off0.66340.11930.00940.0487−0.06350.23980.00100.15540.06520.1732−0.2756
d_coop_ikke_inno0.65310.16900.05610.0307−0.01750.08870.13510.1100−0.00530.0643−0.0344
d_coop_lokalt0.79800.1884−0.00440.0031−0.00420.14680.14640.02000.10450.06580.0262
d_coop_norge0.82010.08860.18830.04700.07860.08770.12060.09620.00320.09410.0806
d_coop_norden0.70640.08740.09630.05980.17780.13210.02450.0624−0.04830.05120.0740
d_coop_eur0.72630.08280.32280.02340.27480.08570.04220.0759−0.0338−0.10460.0715
d_coop_verden0.67190.08100.19760.03750.37120.12040.05670.02910.1019−0.1589−0.0410
d_hemp_fin0.29060.10230.06560.10570.15150.15260.7327−0.02650.2408−0.00930.0087
d_hemp_kost0.24100.09660.07170.09740.08980.12130.79660.01130.1019−0.00820.0605
d_hemp_kunn0.18800.13830.15090.0807−0.00030.09350.74010.09130.02600.03380.0574
d_hemp_mkt0.21410.11500.11860.1148−0.00520.08750.78230.1567−0.19280.06250.0392
d_fin_owni0.28440.06420.2689−0.11380.29890.06260.02440.07530.74800.01450.0651
d_fin_loan0.31570.13200.09160.03000.18060.11090.14740.04780.50670.00080.3048
d_fin_publ0.59730.02860.16790.01660.27160.15570.16660.05110.38130.06280.0659
d_tech_pro0.23960.20710.06990.1018−0.07750.04430.14950.3328−0.1616−0.04870.3505
d_tech_new0.38320.32400.07590.03890.04610.09340.13910.27830.06290.07110.3093

Appendix C. Scores for Each of the Approaches to Innovation by Firm Size and by Pavitt–Miozzo–Soete Sector

Figure A1. Scores for each of the approaches to innovation by firm size and by Pavitt–Miozzo–Soete sector. Each subpanel shows the variation in normalized factor scores (measured on the vertical axis; see Section 4.3) for different firm size categories (measured on the horizontal axis) and for different Pavitt-Miozzo-Soete sectors (each one on a separate line; see the figure’s legend).
Businesses 02 00004 g0a1

References

  1. Dosi, G.; Marsili, O.; Orsenigo, L.; Salvatore, R. Learning, market selection and the evolution of industrial structures. Small Bus. Econ. 1995, 7, 411–436. [Google Scholar] [CrossRef]
  2. Nelson, R.; Winter, S. An Evolutionary Theory of Economic Change; Belknap Press of Harvard University: Cambridge, MA, USA, 1982. [Google Scholar]
  3. Tether, B.S. Growth diversity amongst innovative and technology–based new and small firms: An interpretation. New Technol. Work Employ. 1997, 12, 91–107. [Google Scholar] [CrossRef]
  4. Aghion, P.; Howitt, P. A Model of Growth Through Creative Destruction. Econom. J. Econom. Soc. 1992, 60, 323–351. [Google Scholar] [CrossRef]
  5. Klette, T.J.; Griliches, Z. Empirical patterns of firm growth and R&D investment: A quality ladder model interpretation. Econ. J. 2000, 110, 363–387. [Google Scholar]
  6. Pakes, A.; Ericson, R. Empirical implications of alternative models of firm dynamics. J. Econ. Theory 1998, 79, 1–45. [Google Scholar] [CrossRef] [Green Version]
  7. Nelson, R.; Winter, S. In search of useful theory of innovation. Res. Policy 1977, 6, 36–76. [Google Scholar] [CrossRef]
  8. Coad, A.; Mathew, N.; Pugliese, E. What’s good for the goose ain’t good for the gander: Heterogeneous innovation capabilities and the performance effects of R&D. Ind. Corp. Chang. 2020, 29, 621–644. [Google Scholar]
  9. Freel, M.S. Do small innovating firms outperform non-innovators? Small Bus. Econ. 2000, 14, 195–210. [Google Scholar] [CrossRef]
  10. Pavitt, K. Sectoral patterns of technical change: Towards a taxonomy and a theory. Res. Policy 1984, 13, 343–373. [Google Scholar] [CrossRef]
  11. Miozzo, M.; Soete, L. Internationalization of services: A technological perspective. Technol. Forecast. Soc. Chang. 2001, 67, 159–185. [Google Scholar] [CrossRef] [Green Version]
  12. Castellacci, F. Technological paradigms, regimes and trajectories: Manufacturing and service industries in a new taxonomy of sectoral patterns of innovation. Res. Policy 2008, 37, 978–994. [Google Scholar] [CrossRef] [Green Version]
  13. Archibugi, D. Pavitt’s taxonomy sixteen years on: A review article. Econ. Innov. New Technol. 2001, 10, 415–425. [Google Scholar] [CrossRef]
  14. De Jong, J.P.; Marsili, O. The fruit flies of innovations: A taxonomy of innovative small firms. Res. Policy 2006, 35, 213–229. [Google Scholar] [CrossRef]
  15. Leiponen, A.; Drejer, I. What exactly are technological regimes?: Intra-industry heterogeneity in the organization of innovation activities. Res. Policy 2007, 36, 1221–1238. [Google Scholar] [CrossRef]
  16. Baregheh, A.; Rowley, J.; Sambrook, S. Towards a multidisciplinary definition of innovation. Manag. Decis. 2009, 47, 1323–1339. [Google Scholar] [CrossRef]
  17. Paananen, M. I’ll find it where I can: Exploring the role of resource and financial constraints in search behaviour among innovators. Ind. Innov. 2012, 19, 63–84. [Google Scholar] [CrossRef]
  18. Spithoven, A. Open innovation practices and innovative performances: An international comparative perspective. Int. J. Technol. Manag. 2013, 62, 1–34. [Google Scholar] [CrossRef]
  19. Di Berardino, C.; Onesti, G. Explaining deindustrialisation from a vertical perspective: Industrial linkages, producer services, and international trade. Econ. Innov. New Technol. 2021, 30, 685–706. [Google Scholar] [CrossRef]
  20. Ascani, A.; Balland, P.-A.; Morrison, A. Heterogeneous foreign direct investment and local innovation in Italian Provinces. Struct. Chang. Econ. Dyn. 2020, 53, 388–401. [Google Scholar] [CrossRef]
  21. Dosi, G.; Piva, M.; Virgillito, M.E.; Vivarelli, M. Embodied and disembodied technological change: The sectoral patterns of job-creation and job-destruction. Res. Policy 2021, 50, 104199. [Google Scholar] [CrossRef]
  22. Felice, G.; Lamperti, F.; Piscitello, L. The employment implications of additive manufacturing. Ind. Innov. 2021, 1–34. [Google Scholar] [CrossRef]
  23. Bogliacino, F.; Pianta, M. The Pavitt Taxonomy, revisited: Patterns of innovation in manufacturing and services. Econ. Politica 2016, 33, 153–180. [Google Scholar] [CrossRef]
  24. Schneider, L.; Günther, J.; Brandenburg, B. Innovation and skills from a sectoral perspective: A linked employer–employee analysis. Econ. Innov. New Technol. 2010, 19, 185–202. [Google Scholar] [CrossRef]
  25. Bonaccorsi, A.; Colombo, M.G.; Guerini, M.; Rossi-Lamastra, C. University specialization and new firm creation across industries. Small Bus. Econ. 2013, 41, 837–863. [Google Scholar] [CrossRef]
  26. Castaldi, C. The relative weight of manufacturing and services in Europe: An innovation perspective. Technol. Forecast. Soc. Chang. 2009, 76, 709–722. [Google Scholar] [CrossRef]
  27. Baroncelli, A.; Landoni, M. Exploring differences in university support practices and the effects on spin-off companies in Boston. Int. J. Entrep. Innov. Manag. 2017, 21, 366–394. [Google Scholar] [CrossRef]
  28. Consoli, D.; Rentocchini, F. A taxonomy of multi-industry labour force skills. Res. Policy 2015, 44, 1116–1132. [Google Scholar] [CrossRef] [Green Version]
  29. Colombo, M.G.; Foss, N.J.; Lyngsie, J.; Lamastra, C.R. What drives the delegation of innovation decisions? The roles of firm innovation strategy and the nature of external knowledge. Res. Policy 2021, 50, 104134. [Google Scholar] [CrossRef]
  30. Flores, M.; Medellín, S.; Villarreal, A. Global Markets and the Role of Geographical Proximity in Mexico’s Employment Growth. Growth Chang. 2018, 49, 548–568. [Google Scholar] [CrossRef]
  31. Padilla-Perez, R.; Villarreal, F.G. Structural change and productivity growth in Mexico, 1990–2014. Struct. Chang. Econ. Dyn. 2017, 41, 53–63. [Google Scholar] [CrossRef]
  32. Flikkema, M.; De Man, A.-P.; Castaldi, C. Are trademark counts a valid indicator of innovation? Results of an in-depth study of new benelux trademarks filed by SMEs. Ind. Innov. 2014, 21, 310–331. [Google Scholar] [CrossRef]
  33. Cesaratto, S.; Mangano, S. Technological profiles and economic performance in the Italian manufacturing sector. Econ. Innov. New Technol. 1993, 2, 237–256. [Google Scholar] [CrossRef]
  34. Miller, R.; Blais, R.A. Configurations of innovation: Predictable and maverick modes. Technol. Anal. Strateg. Manag. 1992, 4, 363–386. [Google Scholar] [CrossRef]
  35. Caves, R.E.; Porter, M.E. From entry barriers to mobility barriers: Conjectural decisions and contrived deterrence to new competition. Q. J. Econ. 1977, 91, 241–261. [Google Scholar] [CrossRef]
  36. Kaiser, H.F. The application of electronic computers to factor analysis. Educ. Psychol. Meas. 1960, 20, 141–151. [Google Scholar] [CrossRef]
  37. Capasso, M.; Cefis, E.; Frenken, K. On the existence of persistently outperforming firms. Ind. Corp. Chang. 2014, 23, 997–1036. [Google Scholar] [CrossRef] [Green Version]
Figure 1. Proportion of variance explained by each factor, cumulative proportion of variance, and difference in eigenvalues by factor number.
Businesses 02 00004 g001
Figure 2. Heat map (column normalized): approaches to innovation (bottom, horizontal line) versus sectors in the Pavitt–Miozzo–Soete extended taxonomy (right, vertical line). High values are signaled by a red color; low values are signaled by a yellow color.
Businesses 02 00004 g002
Figure 3. Scatter plot: firms in science-based industries vs. firms from specialized supplier industries; dimensions: “active R&D doers” approach, “radical innovators” approach.
Businesses 02 00004 g003
Figure 4. Scatter plot: firms from science-based industries vs. firms from fishing and aquaculture; dimensions: “active R&D doers” approach, “radical innovators” approach.
Businesses 02 00004 g004
Figure 5. Scatter plot: firms from science-based industries vs. firms from specialized supplier industries; dimensions: “hard-trying innovators” approach, “radical innovators” approach. Circles in red and in green are added by the authors to signal thicker areas of, respectively, the red and the green scatters.
Businesses 02 00004 g005
Figure 6. Scatter plot: firms from science-based industries vs. firms from specialized supplier industries; dimensions: “innovation promisers” approach, “radical innovators” approach.
Businesses 02 00004 g006
Table 1. Approaches to innovation base on CIS2018 for Norwegian firms.
NameMain Characteristics
1. Active R&D doers Practice formal R&D activities on a regular basis (both intramural and extramural)
Cooperate often with others
Receive mainly public support for R&D and innovation
Main market: outside Norway
2. Process developers High score on all types of process innovation
Main strategy: improving existing goods or services
Cooperate within own group on the local/regional level
Innovation expenditures go mainly to machinery, equipment, and software based on new technology
3. Innovation suppliers Use actively different types of IPR
Sell, license out, and exchange their own IPRs to/with others
Innovation expenditures go mainly to purchasing services from others
Main market: not local/regional
4. Strategic adaptorsMain strategies: focus on high-quality products, on improving existing products and on satisfying established customer groups
Practice customization of their products
Implement machinery, equipment, and software based on new technology
5. Radical innovators Conduct formal R&D activities on a regular basis
Introduce product innovation with a high degree of novelty (new product on the national or international market)
Engage in active patenting and license out their IPRs
Cooperate with customers outside Norway
Main market: outside Norway
6. Customer-oriented service suppliersMain strategy: focus on customer-specific solutions
Practice “co-creation” and “customization” of their products
Introduce service innovation with local/regional/national novelty
Cooperate with private customers and public sector
7. Hard-trying innovatorsIrregular R&D activity, innovation expenditures go mainly on own personnel
High score on all types of factors that hamper innovation
Try to cooperate with competitors locally
Introduce product innovation that is new for firm or for the local market
8. Knowledge absorbers Actively use all channels for knowledge acquisition
Offer goods and services co-created with users, often public sector organizations
Practice skills upgrading, regular brainstorming sessions, cross-functional work groups or teams
No formal R&D activities or significant innovation expenditures and no innovation introduced
Implement machinery, equipment, and software based mainly on existing technology
9. Innovation promisersHave not introduced any innovation, but have plans to increase their innovation spending
Have recently obtained funding (both private and public) for innovation
Have some formal R&D activities
Main strategy: focus on one or a small number of key goods or services
Main marked: outside the EU
10. Individual standard services suppliers Main strategy: introducing new goods or services
Oriented towards households and individuals as main customers
Innovation spending mainly on own personnel
Introduce service innovation with novelty at local/regional/national level
Main market: Norway
11. Early technology adoptersInvest in machinery, equipment, and software based on new technology
Expect reduction in innovation expenditures in the next period
Have recently obtained funding for innovation through a loan
Introduce new products that are new to the firm
Cooperate with suppliers
Publisher’s Note: MDPI stays neutral with regard to jurisdictional claims in published maps and institutional affiliations.

