1. Introduction
There are many potential reasons for an organization performing below the level of its competitors: the inability to adapt to a changing market [
1,
2], a value creation process inferior to that of the broader industry [
3], the low motivation or inadequate training and flexibility of personnel [
4,
5], and many others. One cause might also be an internal organizational structure of high complexity, so much so that management cannot efficiently collect the information needed, cannot take high-quality decisions, and, once decisions are taken, cannot effectively implement them—with all of this, in turn, negatively impacting all the aspects mentioned above: the flexibility of market adaptation processes, value creation chains, human resource management, and other processes.
In this context, we understand organizational complexity as the degree of differentiation within the entities that constitute an organization [
6], thereby generally following Luhmann [
7] and his more general concept of system complexity. Based on that—or a similar—definition, many authors examine the internal structure of organizations and its complexity, acknowledging the general necessity to manage the complexity of a structure for product-, process-, and organization-related reasons [
8,
9].
To manage complexity, it first has to be modeled and understood by the decision maker. That necessitates modeling techniques that encapsulate the two fundamental views of an organization: the structural model describes the fundamental composition of the system without the detailed examination of elapsing time. On the other hand, the dynamic model of a system describes processes and other characteristics dependent on elapsing time.
The modeling of organizational dynamics has a long research history [
10,
11], and is still a very active field of study both from a methodological point of view [
12,
13,
14] and regarding its applications in specific industries [
15,
16,
17]. In the same vein, modeling methods for the structure of organizations have seen both historical [
8,
18,
19] and active research [
20,
21,
22]. In addition to methods specifically designed to capture organizational structures [
9,
22,
23], conceptual modeling techniques first developed for simulation modeling, such as event-activity chains and other methods [
24], can help to gain insights into the structure of an organization. Specifically, complex organizations can be seen as complex systems due to their typical attributes such as non-linearity, adaptation to external change, internal feedback loops, and emergence [
25], thereby enabling the use of methods and tools developed as part of complex systems theory [
26]. In the domain of modeling business organizational structures and behavior over time [
27], that might include modeling evolutionary change in organizations [
28], facilitating increased organizational resilience [
29], and modeling mergers and acquisitions [
30]. Based on such research and modeling methods for organizational structure, over the years, a number of approaches for assessing organizational complexity have been proposed for specific areas such as manufacturing [
23,
31], supply-chain management [
32], and software architecture [
33]. A more general method is Tree Attribute Matrix (TAM) modeling [
34,
35], one building block of the NES classification system discussed below, where organizational structures are decomposed in tree- and matrix-like aspects—which then allows their degree of organizational complexity to be assessed and measured.
In this paper, we describe a modeling framework designed to enable management and consultants to assess organizational complexity, which also helps to identify complexity “hot spots” that can contribute to organizations underperforming compared to their competitors. Our approach is anchored in cognitive theory and based on the NES classification method, which we present here to an international audience for the first time (The NES classification framework has been introduced to a German-speaking audience in [
34]). NES aims to help decision makers with assessing the organizational complexity of an organization, a step that serves as a starting point for active complexity management. In NES, any system is classified as belonging to one of three categories: natural systems (class N), engineered systems (class E), or slipped systems (class S). This classification of systems is based on the cognitive limits of human understanding as researched in cognitive theory, specifically by Miller [
36] and others. In his seminal study, Miller reports that nearly all human beings can fully understand and consider only up to seven different units of information at the same time; his findings were confirmed and refined by neurophysiological studies [
37,
38], with later researchers claiming a lower short-term memory limit of five items or less [
39,
40]. Operationalizing Miller’s findings, his “magical number” gives an indication for a desirable upper limit for the complexity of an organization: to enable optimal decision making, no more than seven—preferably, no more than five—facts, items, or connections should have to be considered in any given action or decision. The NES method classifies organizations that adhere to that upper limit of complexity as class E. Such systems might be designed by humans for human use, so they can be understood and controlled by human operators or managers. Class N natural systems are not the focus of this paper: they might be part of nature or the environment, often complex or seemingly chaotic. The third category is the class S of slipped systems—organizations designed by humans that do not adhere to cognition limits. Such systems might start out as class E systems but grow over time into a state of high complexity, and so become harder and harder to understand and to control.
To operationalize NES, we apply TAM modeling—a simple method to assess and measure complexity in organizations. While applying NES and TAM itself does not reduce complexity, the gained insights about specific complexity “hot spots” can be used as a starting point for complexity reduction in specific parts of the organization—bringing a class S system back to a class E state. To illustrate the application of NES and TAM, we describe some examples and typical remedies that are often encountered later in the complexity assessment and management process. While the shared symptom–remedy combinations are only intended as illustrations, not as strongly justified recommendations, they can be seen as steps towards defining patterns [
41].
This paper continues with a short introduction to the NES classification method, putting a specific focus on the structure, dynamics, value creation, and inertia of natural, engineered, and slipped systems (
Section 2). It then goes on to discuss a method to operationalize the NES classification method to identify organizations with a high potential for underperformance, proposing to use the TAM modeling method [
35] to discern such slipped systems from their natural and engineered counterparts (
Section 3). To illustrate the process, we then discuss a number of typical symptoms of slipped systems encountered during consulting projects, including potential methods that might be employed to mitigate them (
Section 4). The paper concludes with a short summary of the lessons learned and an outlook on further research (
Section 5).
2. The NES Classification Method
The NES classification method [
34]—the abbreviation NES stands for Natural, Engineered, and Slipped—was designed to facilitate and formalize the discussion of human-centric systems, with a special focus on modeling, assessing, and, in further steps, improving organizational complexity. In this context, we define any system as human-centric if it is designed and constructed by humans and for human usage.
NES examines any given system and, using a number of methods and tools described below, classifies it as class N, E, or S. Informally, class N natural systems consist of real-world systems that have not been designed and built by humans, including, in particular, physical systems that are part of nature and subject of classical and relativistic mechanics, thermodynamics, or quantum mechanics. These systems are not the focus of this paper. Class E engineered systems are real-world systems that have been designed and constructed by humans to serve a specific purpose, and that adhere to certain complexity characteristics described below. These systems typically include technical systems such as machines, but also organizations such as businesses, associations, and authorities. Engineered systems are designed to be controlled by humans—to do that effectively, a human operator or manager has to be able to understand the causality of modification and effect; only if that condition holds can an operator/manager purposely use modifications to control the system.
Class S slipped systems also include systems designed by humans. In contrast to class E systems, though, a class S organization does not adhere to the limits of cognition. Typically, that results from a too-complex structure, unmanageable dynamic properties, or the lack of a valid, comprehensible value creation chain. An important subset of class S consists of systems that, at the time of their design, could be well described as class E, but have undergone iterative changes that have led to them not adhering to class E conditions anymore, typically by an increase in their structural complexity over time. Such slipped systems have thus slipped from the control of their designers, and have evolved into systems that are not well understood or controllable.
To formalize the discussion, any NES system is represented as a triple of the system’s structure S, its value creation W, and its inertia T. Here, a system’s structure S describe the organizational structure, without regarding elapsing time or corresponding changes in the system state. Accordingly, the structure of a system can be described without applying the concept of time. The value creation W describes the aims or the meaning of a system created by humans. The inertia T describes the changeability of the system, with value creation kept constant.
In addition to S, W, and T, a system’s dynamics D describe the processes occurring when the system is “switched on,” in particular when its state changes over time. Modeling a system’s dynamics corresponds to the calculation of time evolution in a partial differential equation model [
42].
While structure and dynamics can be found in all systems, the aspects of value creation and inertia are only relevant in the context of human-designed systems. Additionally, the adequate measures for value creation and inertia are strongly dependent on the characteristics of the specific system under examination and the objectives of the modeling and/or assessment process.
Structure. In NES, we describe a system’s organizational structure with as a set of variables with . With denoting the value of at time t, the set of variable values at time t is defined as . The set G consists of individual transitions between potential variable states. Here, is the time step of the state change described as , with denoting the set of parameters of the transition, i.e., the variables of . The number of elements of is called the span of transition .
Through a suitable choice for the value set of , both quantitative and qualitative dependencies of the variables can be represented. If is assigned a stochastic function, stochastic dependencies of the variables can be represented as well.
The structural complexity of the system is defined as , with as the number of variables and the maximum span any transition of the system includes. A system’s structure can be modelled and assessed using the TAM modeling method described below.
Dynamics. To model a system’s dynamics over time, we first define an episode as a sequence of states the system iterates through if it is executed from a start configuration with time steps . If is the set of permitted start configurations, then describes the dynamics of the system with time step , i.e., all potential sequences of states. In the case that is nondeterministic, i.e., some or all are stochastic functions, the sets for the respective variables consist of the associated distributions. As this is usually the case in examined real-world systems, it is often not possible to determine closed-form solutions for the dynamics of the system. Usually, though, solutions for a subset of the episodes can be approximated by appropriate sampling, e.g., by applying the Monte Carlo method.
An episode is called a finite episode if is a finite sequence of system states. Dynamics are called finite dynamics if the number of all episodes contained in set is finite and all episodes are finite as well.
Value creation. Human-centric systems are designed, built, and operated with a purpose that is usually some type of value creation. To model that value creation, the value creation indicator
of an episode
is defined as a function indicating whether the aims or purpose of the system has been contributed to through the execution of a finite episode
of
. It is defined as
For a given set
of
initial configurations of a system, the value creation
for any time increment
is defined as
It describes the ratio to which the system achieves its goals for a given . Here, has to be a finite episode for all . To simplify the notation, a specification of can be omitted; value creation is then denoted as .
Inertia. The inertia of an NES system quantifies its ability to resist changes. In a human-made system, e.g., a business, this corresponds to restructuring cost, which can be measured in units of money or time.
Approaching a definition of inertia, we examine the transformation of system to system . We also assume that for the permitted initial states of , an equivalent set of initial states of exists describing the equivalent initial states.
The transition energy with is the energy to be raised to convert to . Inertia is the least transition energy required to transform into a system with (greater or) equal value creation and with lower complexity. In general: the lower the inertia of a system, the easier it is to simplify it while preserving value creation.
In real-world businesses or organizations, a transformation to a system with lower complexity or lower inertia often requires a high transition energy. Transformation to a more complex or inert system, on the other hand, is usually easy, e.g., simply requiring additional variables. If interpreted as an effect of thermodynamics, that observation shows that simple and less inert systems have a lower entropy (or a higher order). In principle, incremental changes of the system state tend to increase the system’s entropy and make it more complex and inert.
3. Classifying Slipped Systems
To use NES to identify slipped systems, i.e., systems with a high degree of organizational complexity, the framework has to be operationalized. To reach that aim we propose to apply the Tree Attribute Matrix (TAM) modeling method as a tool to assess and measure a system’s structure
with regard to its organizational complexity, and thereby to identify class S systems. TAM, recapped below based on [
35], represents the examined organizational structure as a collection of interconnected tree and matrix structures annotated with attributes.
A number of organizational and process modeling methods based on matrices exist. Those include Design Structure Matrices (DSM) [
43,
44] and their extensions, notably Multiple-domain Matrices [
45,
46] and Domain Mapping Matrices [
47]. DSM, based on adjacency matrices from graph theory [
48], allows for the representation of the interdependencies of elements, for example, steps in business processes [
49] or product families [
47]. DSM are used as input data for complex clustering, sequencing, and other algorithms and operators [
43,
50] designed to analyze the modeled system. While traditionally applied in the Artificial Intelligence context [
51,
52], Bayesian Networks [
53,
54] are another modeling technique that can be used to assess internal dependencies in the business context [
55,
56], including stochastic elements. Specifically, the tree aspects of TAM models can be translated to Bayesian Networks—even though, for the purpose of the assessment of the organizational complexity of businesses, TAM trees can be modeled with less overhead. Designed for that specific purpose, TAM combines stripped-down versions of matrix analysis methods and graph/tree analysis models. Those simplifications eliminate the option to run more complex analysis algorithms; however, for our simple method, those are not needed. The simplified modeling process also saves overhead during the consulting projects.
The following paragraphs explain the basics of TAM and describe how to apply it to gain systematic metrics to discern natural, engineered, and slipped systems.
3.1. Metrics
The TAM modeling method is based on the observation that the organizational structures of well-formed human-centric systems, i.e., systems designed by humans and for human usage, typically exhibit similar patterns that can be visualized by arranging the system into components (here called aspects) that can be seen as trees, attributes and matrices [
34,
35,
57]. These components can be formally described as three equivalence relations
,
, and
.
Trees. The TAM modeling process begins with the decomposition of the set of variables to equivalence classes
, with
being the set of all equivalence classes, using an equivalence relation
with
. Each class
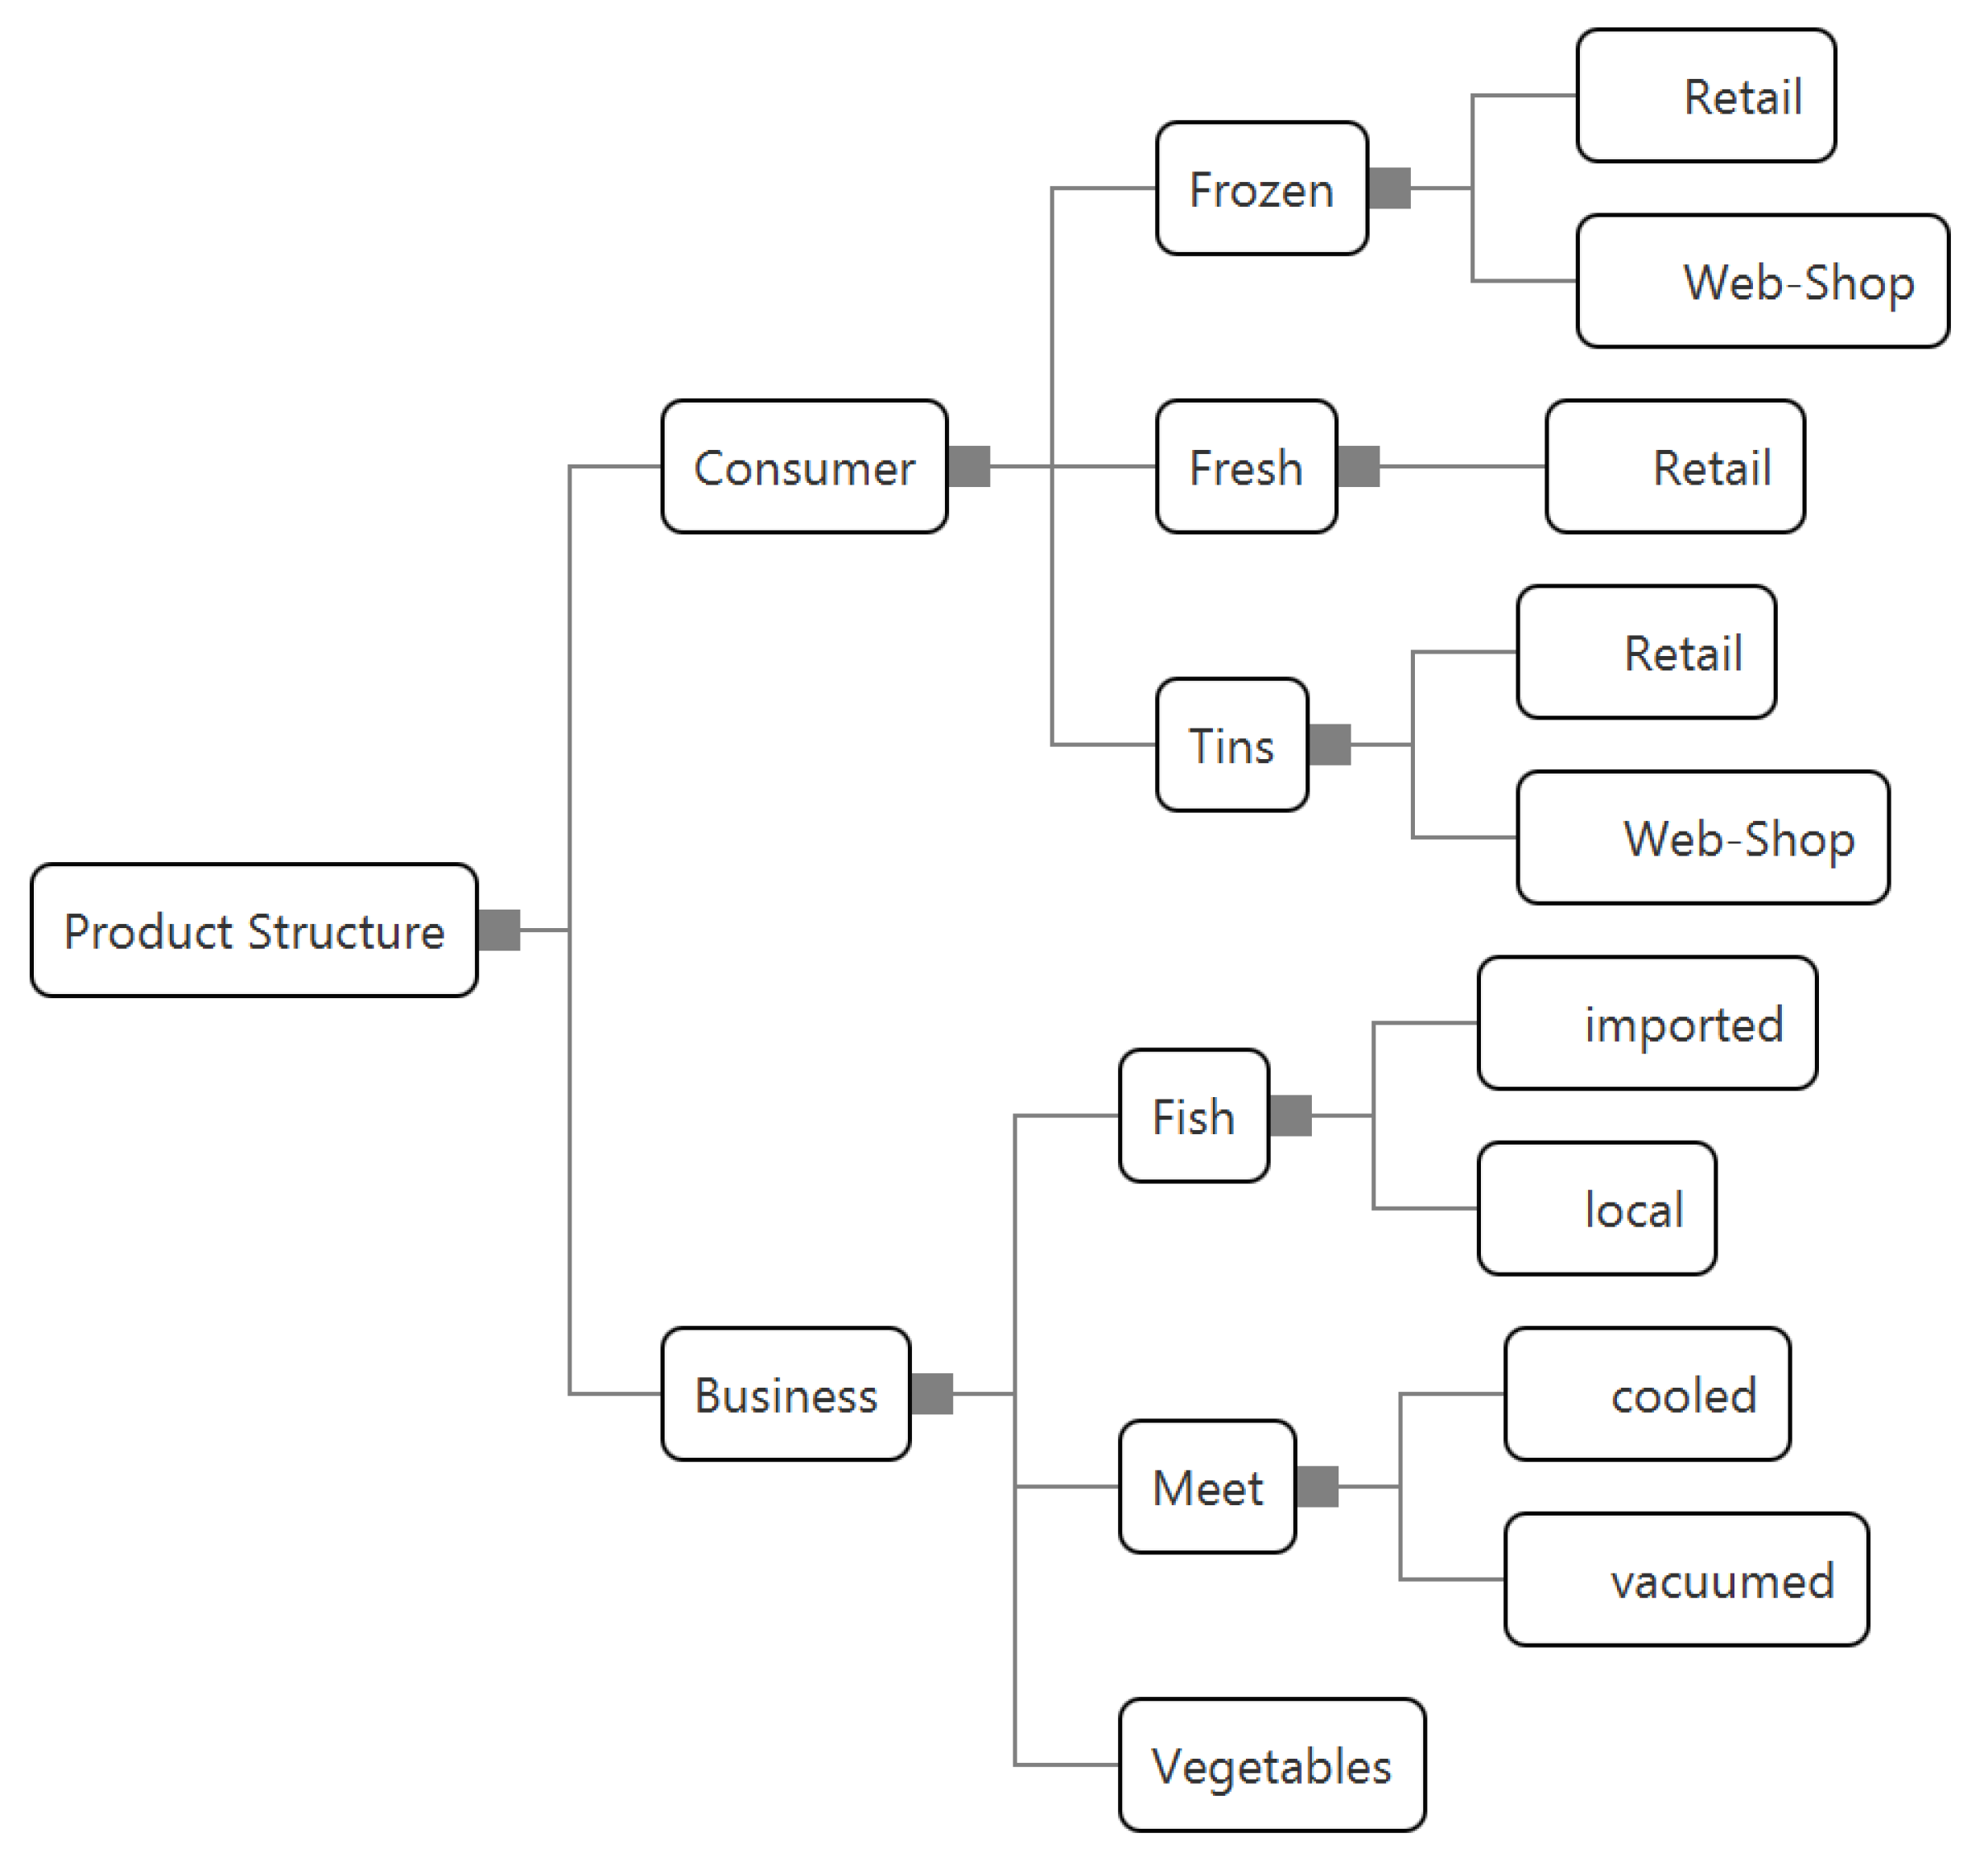
orders its variables to a hierarchical, tree-like structure that, in TAM, is called an aspect of the system. Within each aspect, the variables are arranged hierarchically into levels—each variable is only dependent on variables of the level below. The aspect resulting from this procedure is a tree-like graph (see
Figure 1), with the dependencies of the transitions depicted as edges between the nodes.
In practical applications, the transitions inside an aspect are often qualitative functions. These functions often can be translated to plain English statements such as “ is present, if and are present,” with leaf-like variables often carrying more complex semantics. Usually, the composition and internal structure of an aspect represent an interdependent part of the real-world system, e.g., raw materials and pre-products in a production line, the hierarchies in a department, or the steps of a production process. Based on our experience, the typical simplicity and elegance of the decomposition of a system into aspects results from the often-observed hierarchical build-up of human-centric systems from functionally isolated sub-systems.
For each aspect
, the aspect complexity
is defined as the maximum number of levels of the aspect tree and the maximum span of any node in
. Based on that, the aggregated aspect complexity
is defined as the maximum number of aspects in the model and the maximum aspect complexity
of any
:
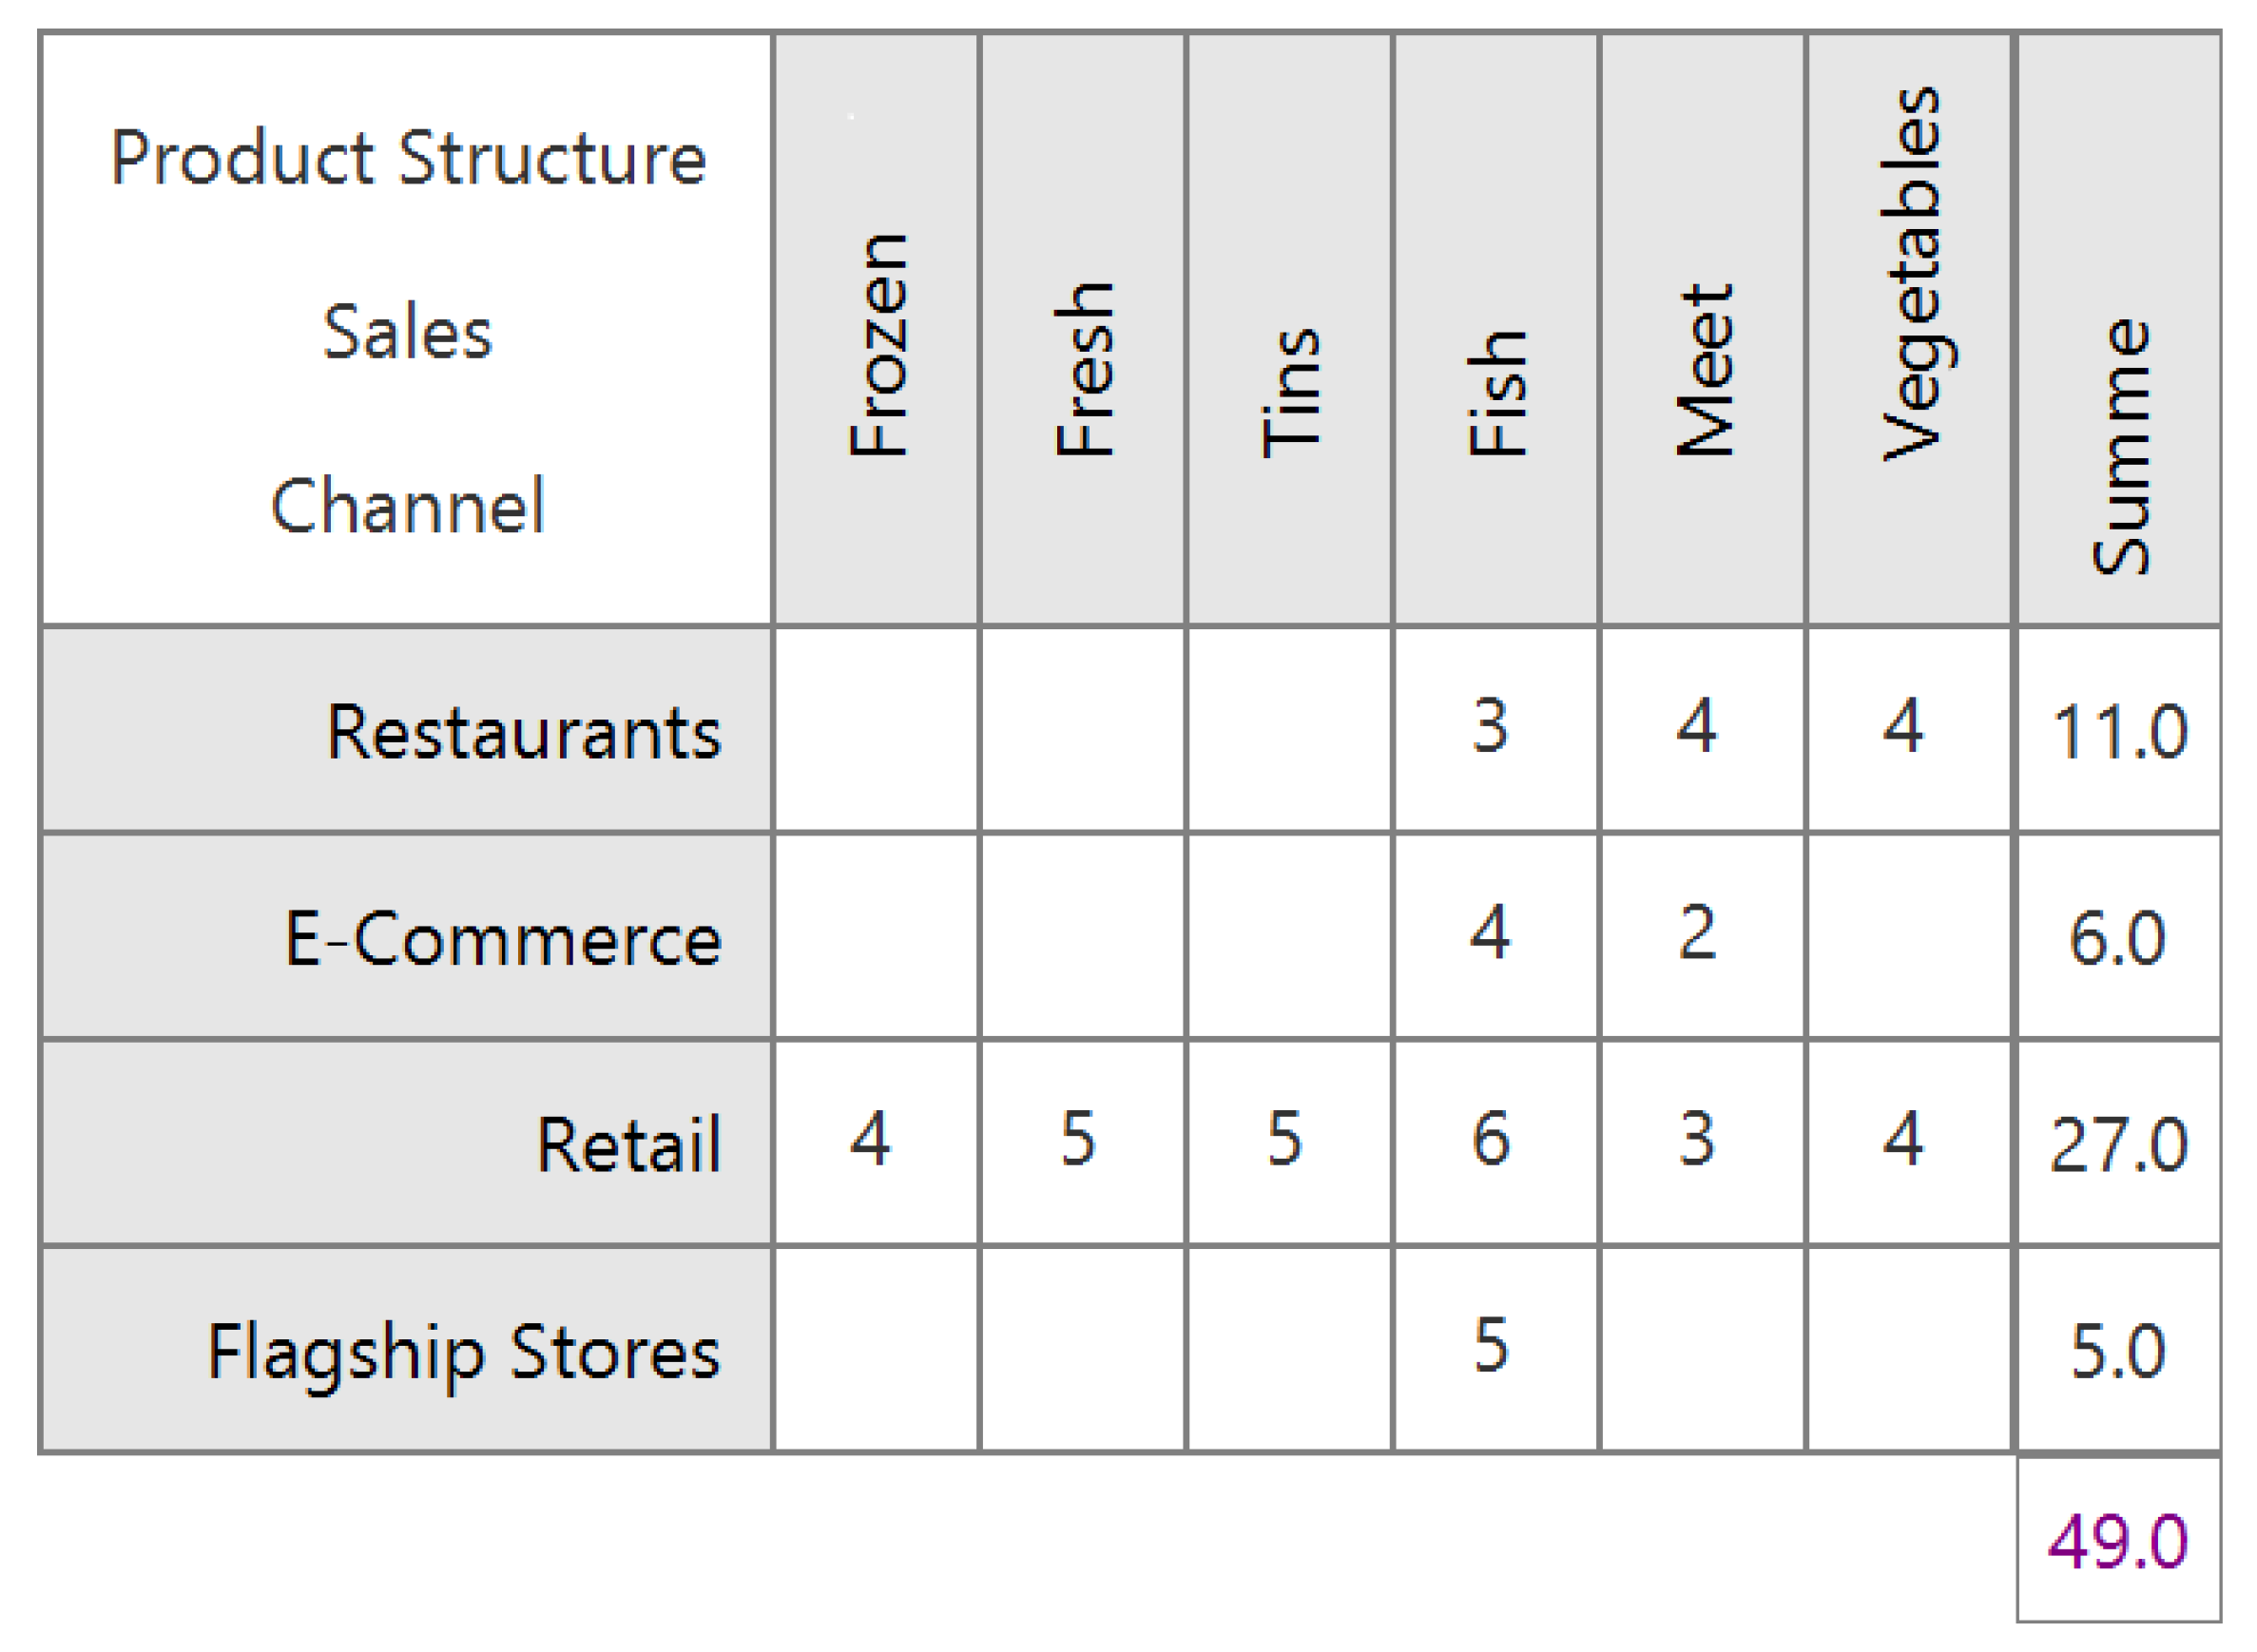
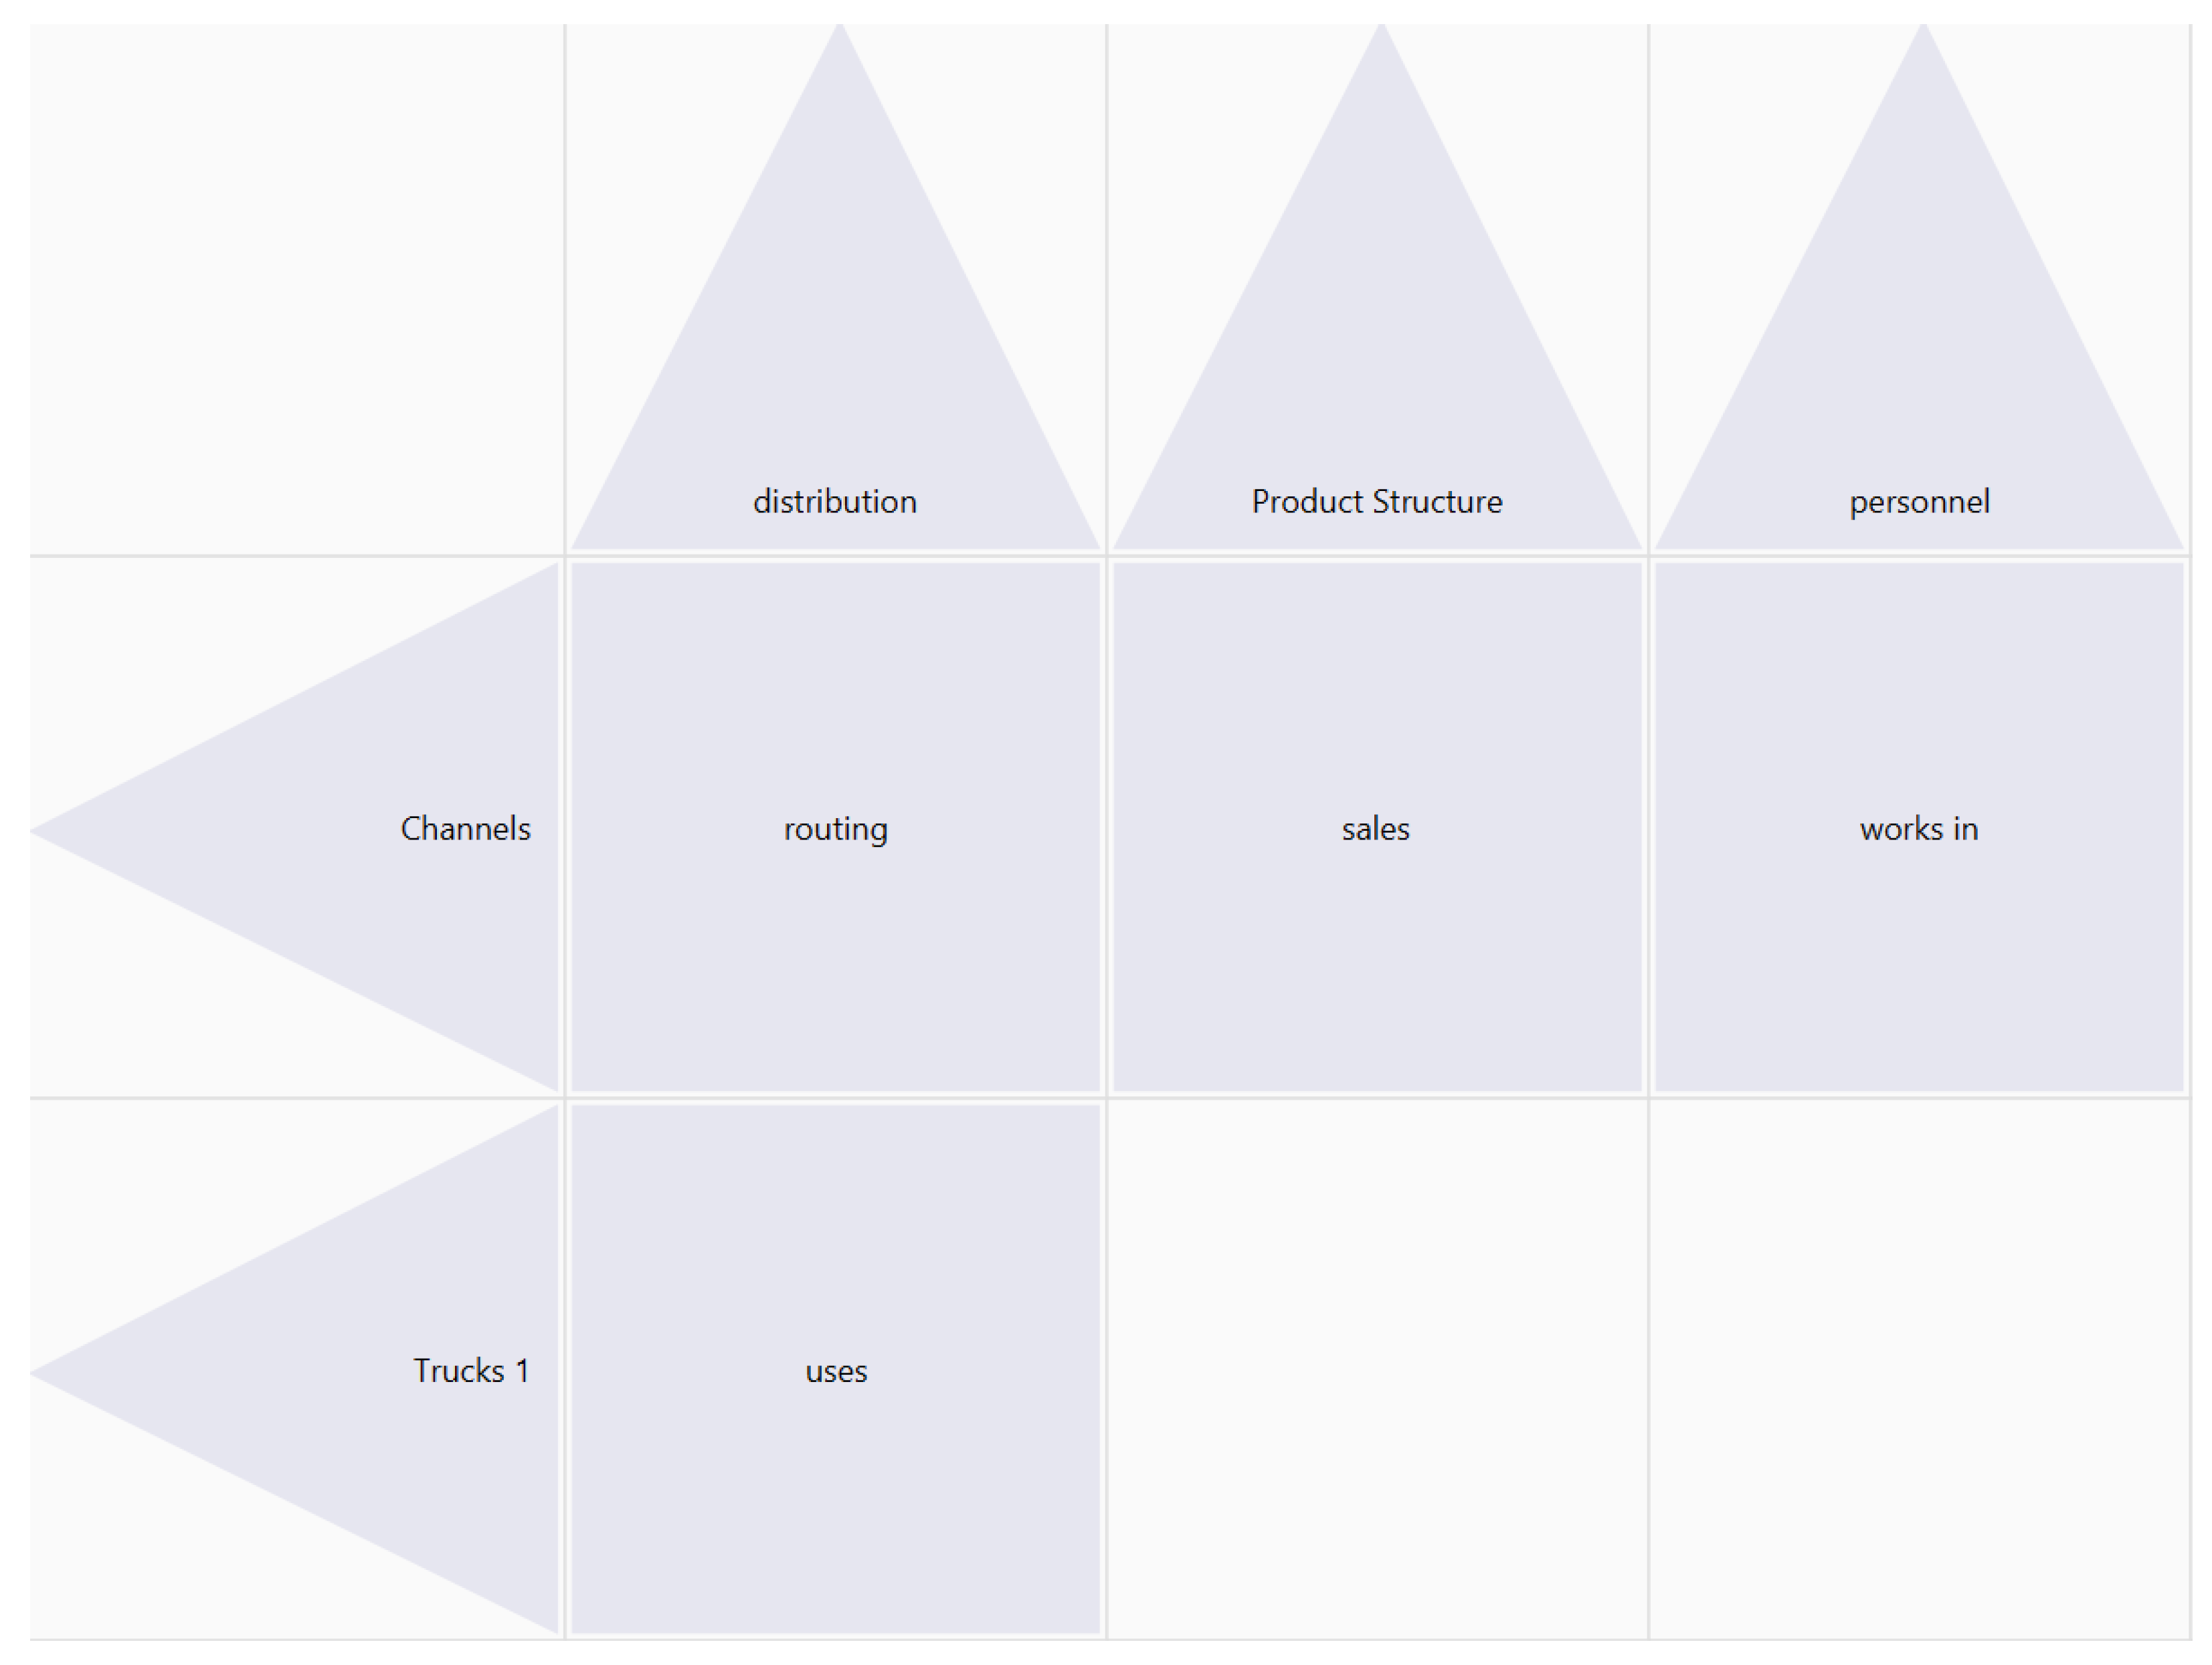
Matrices. While aspects represent sub-systems with hierarchical dependencies, interactions between different aspects are represented by matrices. Here, we focus on the subset of transitions that belong to variables from one aspect, but which depend on variables from a different aspect. To that extent we define an equivalence relation that decomposes this subset of transitions into equivalence classes . Assume and are two different aspects with transition sets and . If there is that depends on at least one variable of , and also exists depending on at least one variable from , those two transitions are considered equivalent in relation to , or . creates sets of transitions (equivalence classes) , with being the set of all those classes.
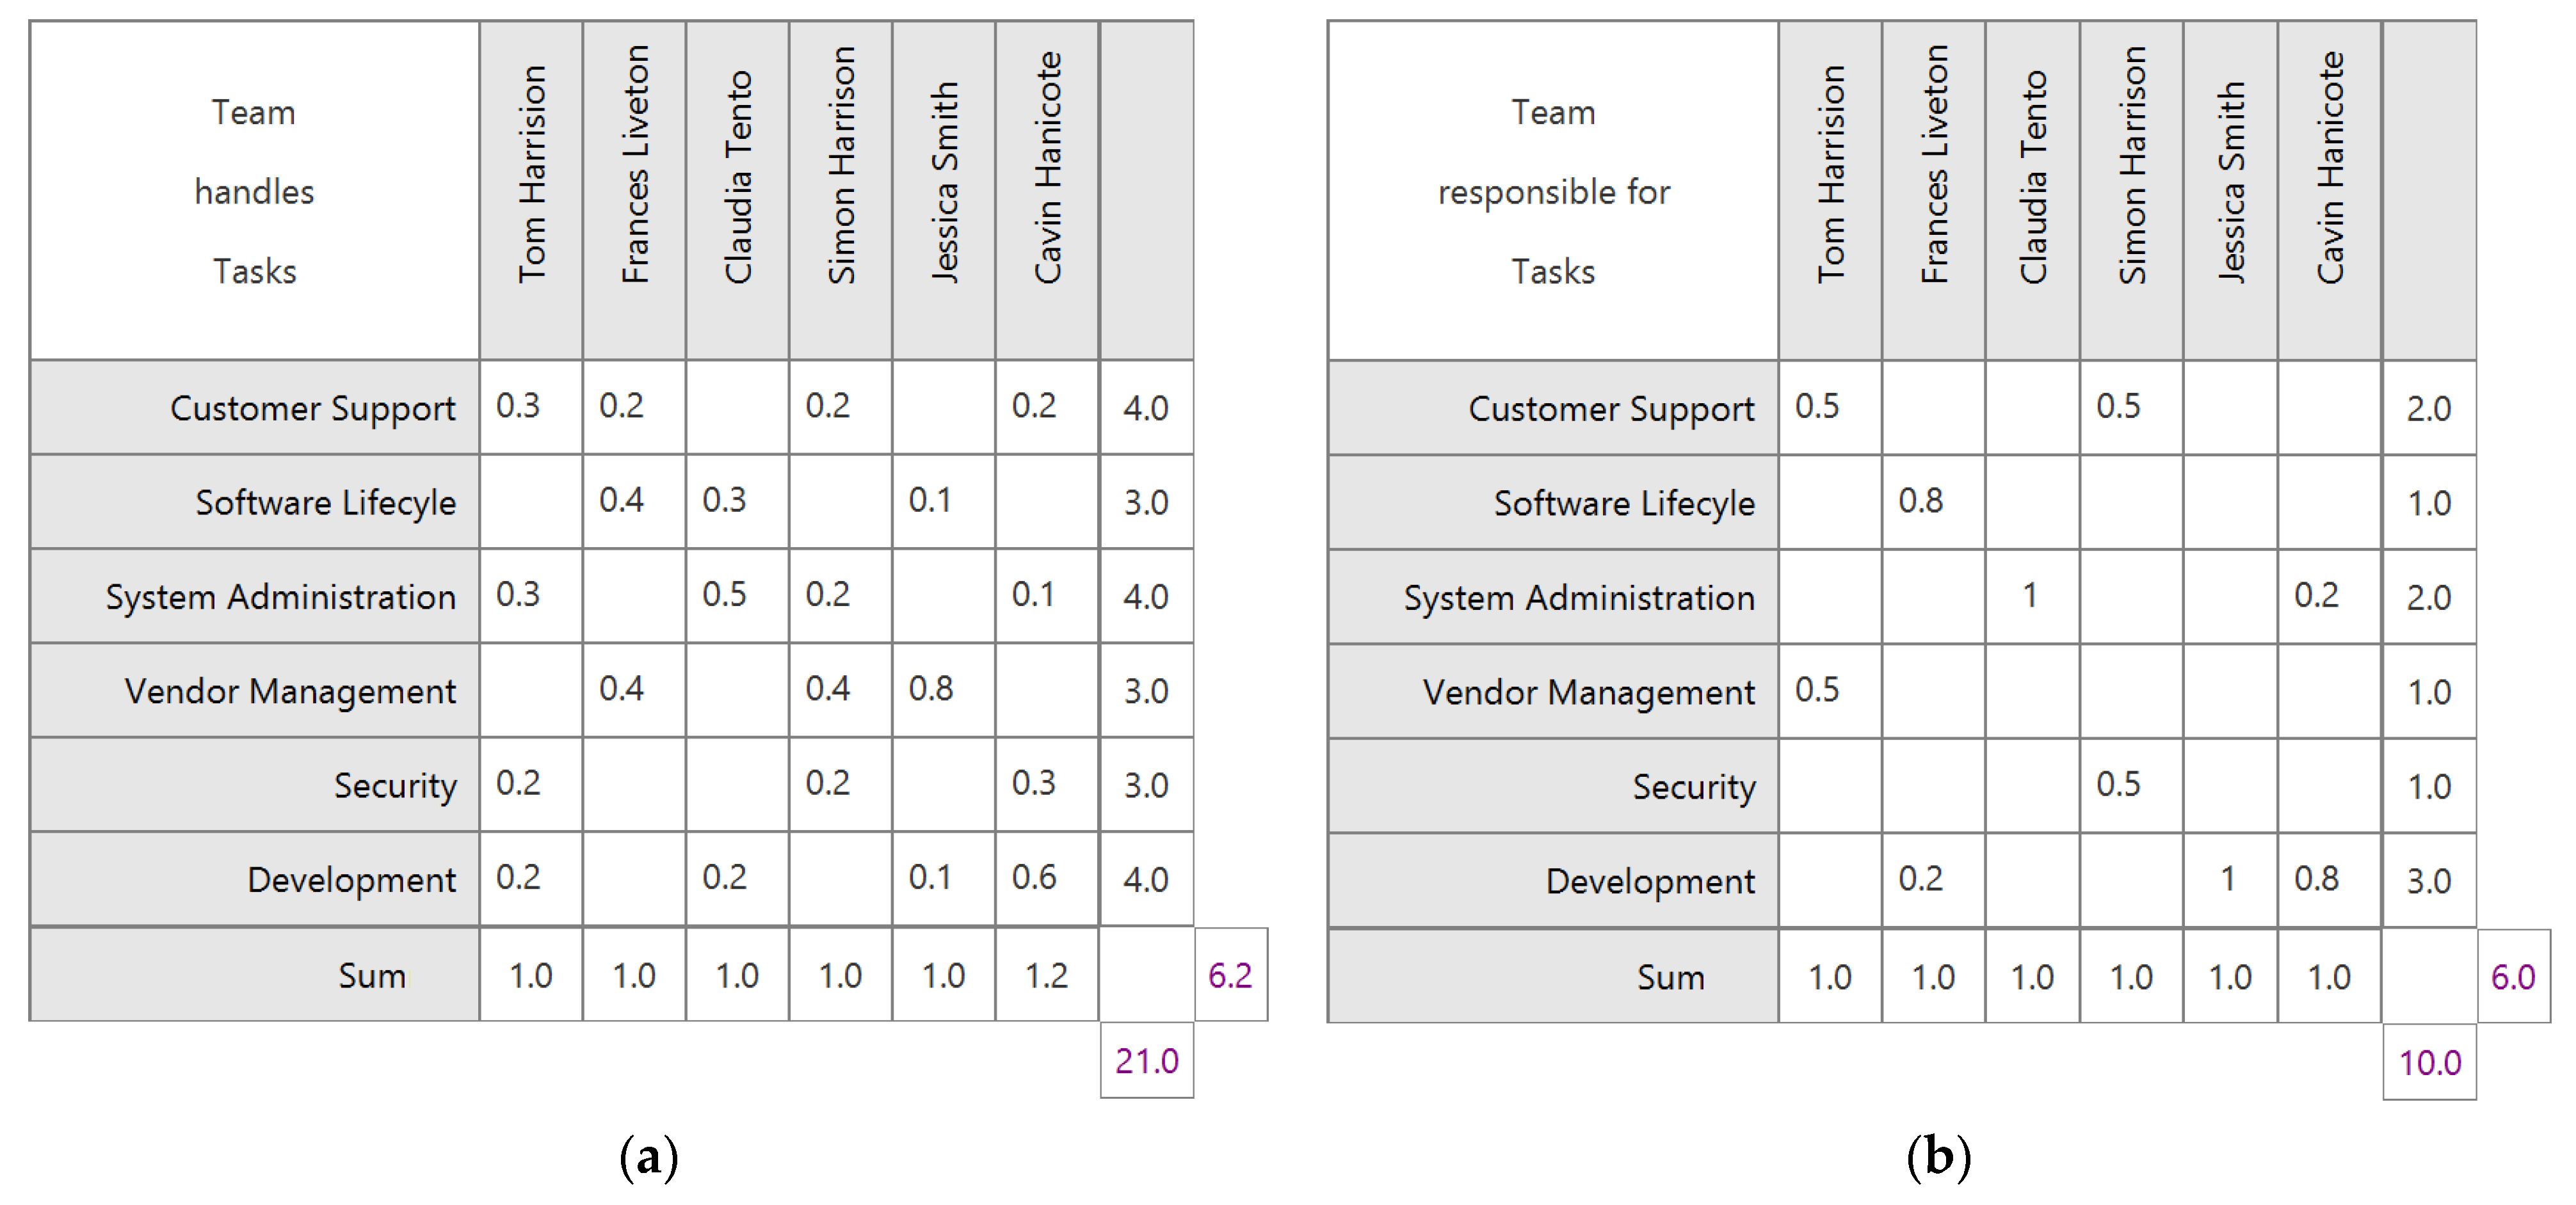
In practical applications, matrices (see
Figure 2) represent dependencies between aspects of an organization, e.g., products with different sets of features, the responsibility of department personnel for different products, or interfaces between applications in a software landscape.
Any two variables connected by a matrix element are considered dependent, directly or indirectly, and are denoted by a pair . Similarly, is a connected pair. Extending that logic, those two pairs can be considered related, because both have a common element, . This procedure leads to a number of disjointed sets of connection pairs. In general, this decomposition is denoted as . The cardinalities of those sets are called the lengths , and provide a measure of complexity for matrices. The matrix complexity of a class connecting and is defined as the maximum of the lengths of all : .
We can now define the aggregated matrix complexity
of all
classes as:
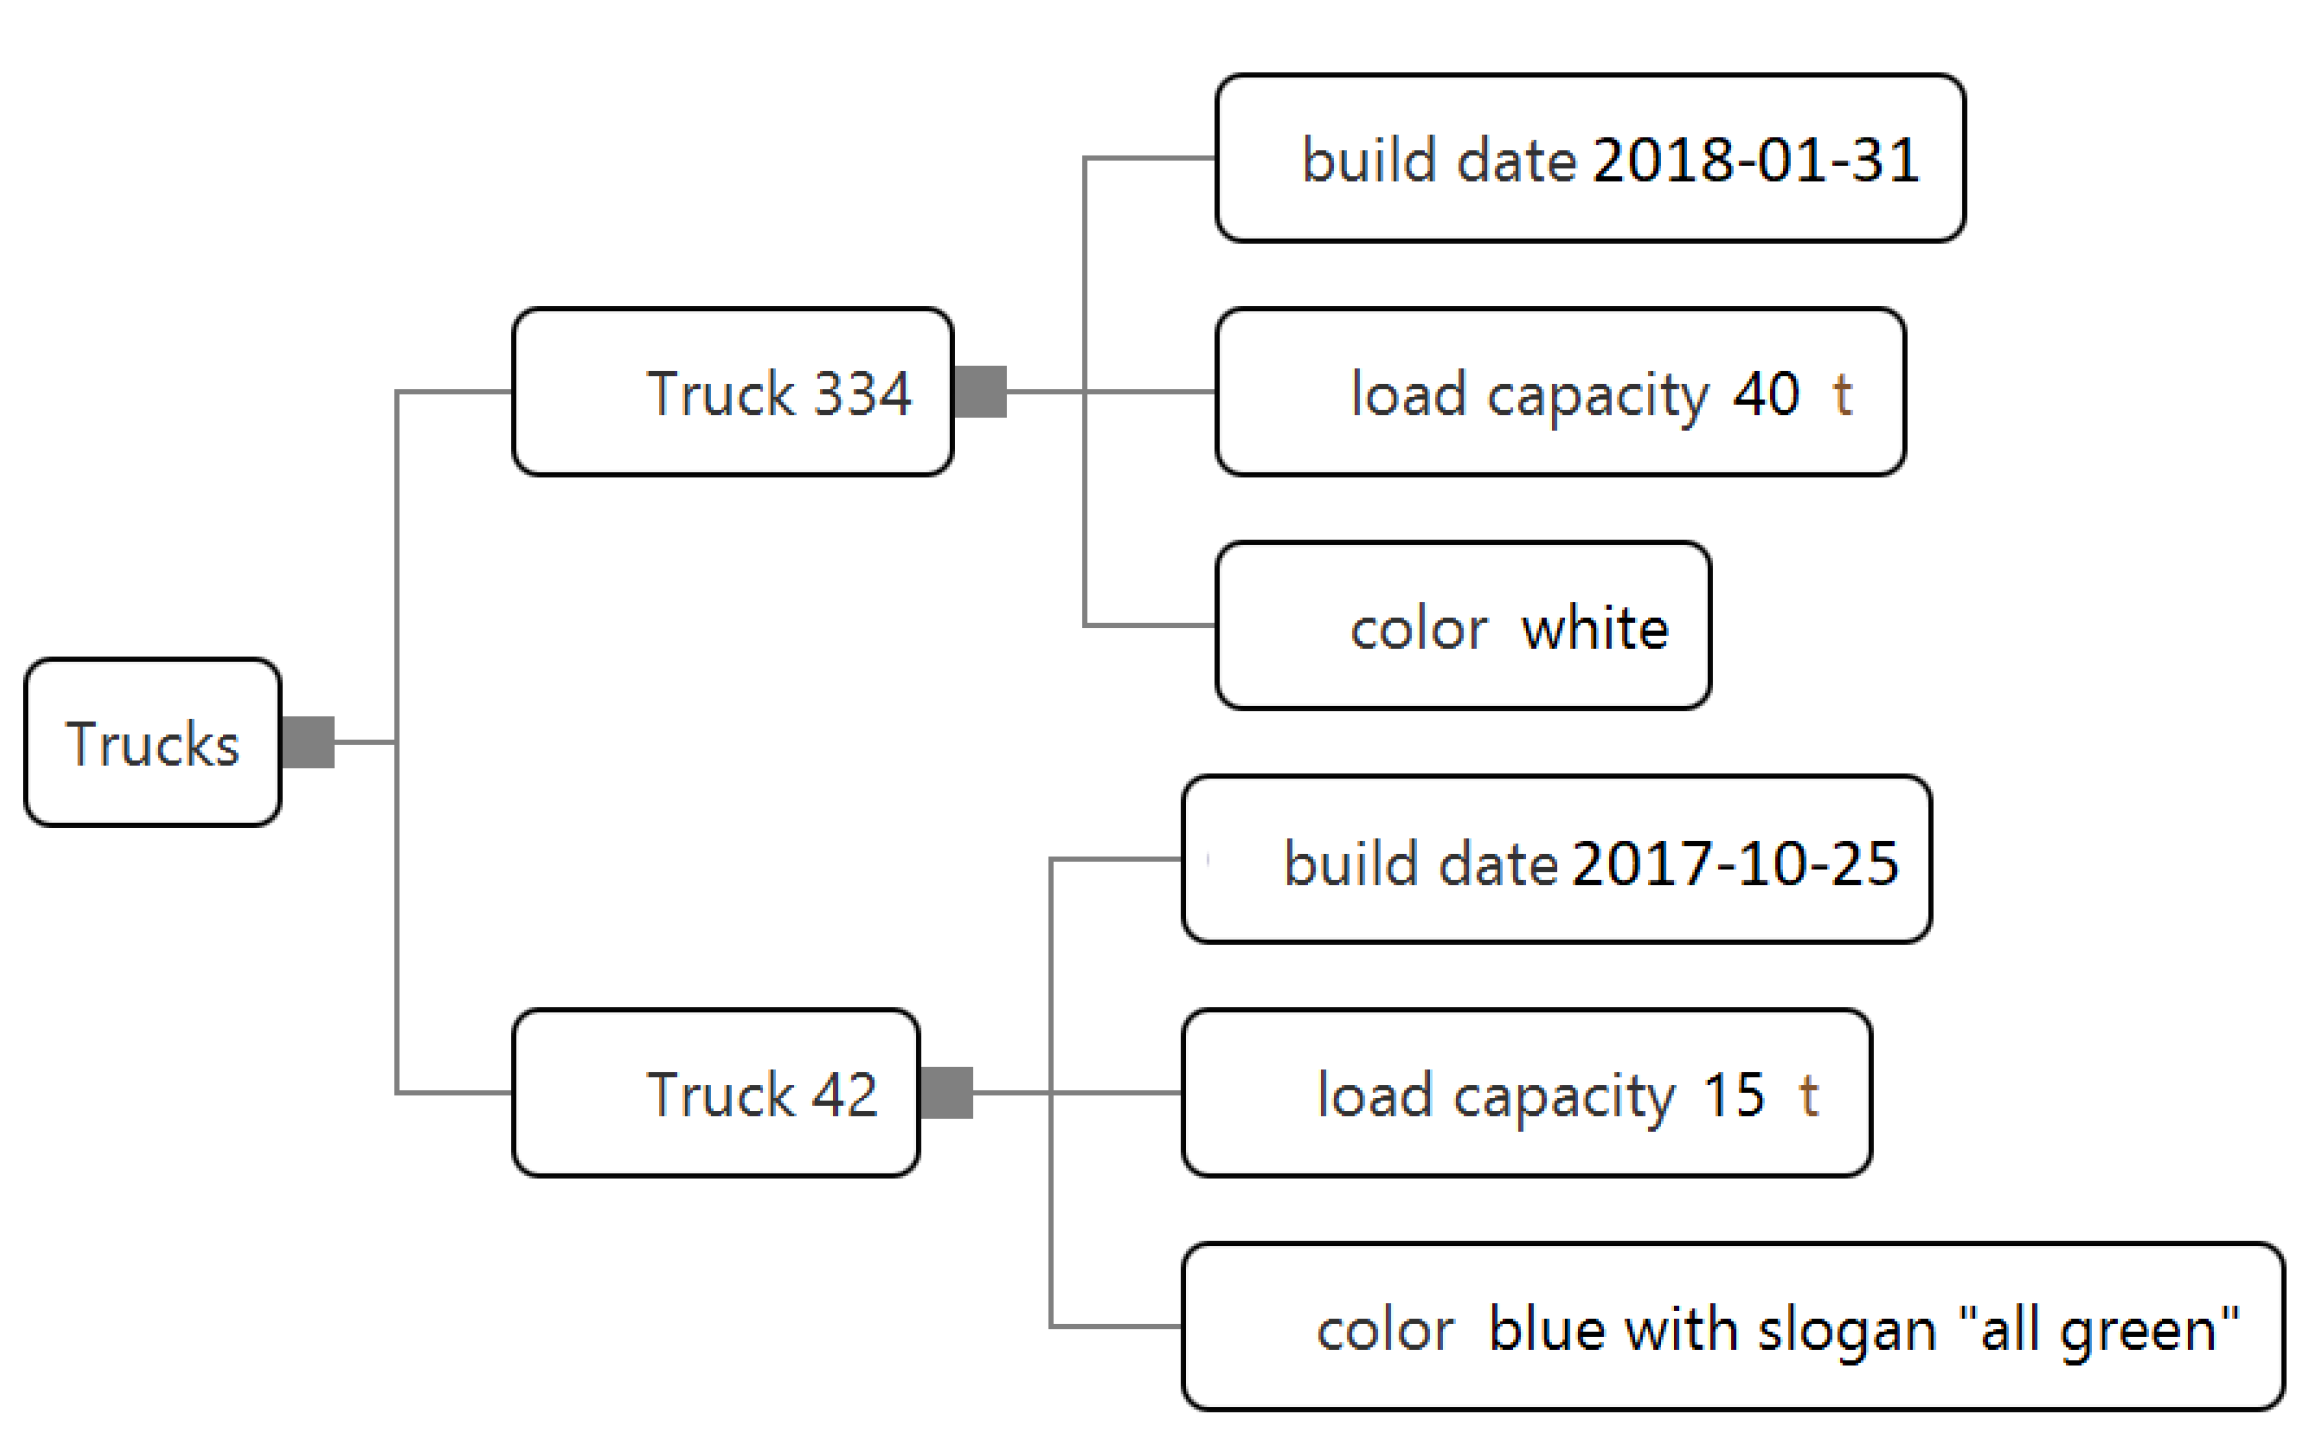
Attributes. In TAM, attributes are defined as variables whose dependencies are contained in one single aspect (see
Figure 3), and thus do not contribute to any matrices. Even if an organization has a large number of these attributes, they would not increase its structural complexity; attributes are, therefore, not taken into account when determining the aspect complexity
and the aggregated aspect complexity
. To model attributes, the set of transitions
is dissected into sets of attributed transitions
and of non-attributed transitions
. This separation of transitions
and
enables the distinction of structure-creating transitions in
and attribute transitions in
.
With the instruments of aggregated tree complexity
and aggregated matrix complexity
in place, we can now assess the aggregated TM complexity of a system, our central metric to identify slipped systems:
3.2. Discerning Natural, Engineered, and Slipped Systems
Once the examined enterprise is modelled using TAM (see
Figure 4), the described metrics can now be applied to quantitatively discern class N, E, and S systems—with a focus on identifying and assessing slipped systems. As TAM mainly quantifies and highlights organizational complexity in a system, that is the main metric applied. In this sub-section we discuss how the NES classification system discerns the three system classes, beginning with well-formed class E systems, then describing characteristics of a system that slipped from class E to class S, and ending with some thoughts on class N systems.
Any system is a class E system, if it adheres to the following characteristics:
and relations are defined with , , and therefore , with each existing variable being part of a T or A class.
The value creation W is defined. An algorithm with linear complexity for the determination of the value creation indicator w exists.
For each state transition , a transitional energy is defined, with a feasible method to calculate being available.
The set of transitions does not contain any with temporal uncertainty.
Characteristic 1 prescribes that class E systems can only have a certain maximum size that is based on the cognitive limits of human understanding (see
Section 1). The permissible number of variables and edges is de facto not a limitation; however, a maximum of seven T and M classes exists. That clearly limits the degree of structural complexity for companies. The long-term viability and controllability of companies therefore requires a deliberate limitation of its structural complexity. Characteristic 2 translates to the demand that operators and management can actually understand how to achieve the organization’s purpose—value creation. Characteristic 3 prescribes that for any potentially planned alteration of the system state, the cost of transition is known or can at least be estimated—if a manager wants to change a department’s organizational structure, they should be able to understand the cost of such a move. Characteristic 4 ascertains that a valid assessment of the duration of transitions is possible, therefore excluding transitions that lead to uncontrollable bifurcations.
A system is a class S system, if it adheres to all of the following characteristics:
is not a class E system.
and relations are defined with and .
The value creation W is defined, but whether an algorithm to determine the value creation indicator w exists is inconsequential.
For each state transition , a transitional energy is defined, with a feasible method to calculate being available.
The set of transitions does not contain any with temporal uncertainty.
Characteristic 1 (in combination with characteristics 3, 4, and 5) prescribes for a class S system an organizational structure that does not adhere to Miller’s rule of a maximum of seven structural units at any given location in the structure. Then, characteristic 2 reins in structural requirements a bit, and prescribes that the organization is structured in some meaningful way, even if it does not adhere to class E requirements. In comparison to the corresponding class E demand, characteristic 3 requires a value creation chain to exist in principle, thereby making it at least possible to realize the organization’s purpose. It is not necessary, though, that value creation indicators are defined. Characteristics 4 and 5 are carried over from the class E system definition.
In case a system is neither class E nor class S, then it is class N. It is possible that systems were designed as class E systems, evolved into class S systems, and finally reached a state where no value creation W can be calculated for them—so they end up as class N. An example of this can be a failed state with collapsing central authorities, in which several groups with different interests fight for regional or local dominance.
4. Typical Symptoms of Slipped Systems
To illustrate the application of NES and TAM, and to further highlight the risk of organizations gliding from class E to class S over time, and thus becoming more prone to suffer from high complexity as a factor contributing to underperformance, we describe a number of examples of typical symptoms of slipped systems. The scenario and the observations are only slightly abstracted; they are found regularly in any number of companies examined as part of our consulting projects. To each example we add a potential countermeasure aimed at reduce complexity and to re-establishing on-par performance. However, these potential countermeasures are for illustration only, and should not be regarded as scientifically justified recommendations.
In research, the design and selection of countermeasure actions and action plans against a lack of performance are considered a part of normative decision theory [
58], with its long research tradition [
59,
60]. While advanced methods and models are actively researched [
61,
62,
63], for our specific purpose, a short discussion of the specific complexity “hot spots” provided by TAM and their contexts is sufficient to illustrate potential countermeasures. Often, we encounter these recurring observations in medium-sized companies with historically grown structures. Typically, a closer investigation shows the lack of a unifying structure in process and task definition, rules, qualifications, and communication—individual efforts by employees and management exist, but, in business practice, an overarching and universally accepted approach is often missing. This historically grown but inadequate structure induces extra complexity, which burns a significant share of the resources of the company.
Assume the following scenario based on a mid-sized company with an IT department of approx. 150 employees. At first glance, the number of employees seems adequate based on the usual key performance indicators (KPIs). Nevertheless, department performance is continuously rated poorly, and there is a large backlog of delayed activities. Many employees show signs of overload and stress, and most customers are unsatisfied with the services provided. Department management states the need for more personnel to improve the service level and to clear the backlog. However, several past increases in the budget and employee numbers have not improved KPIs—the department’s issues do not seem to disappear with any increase in personnel.
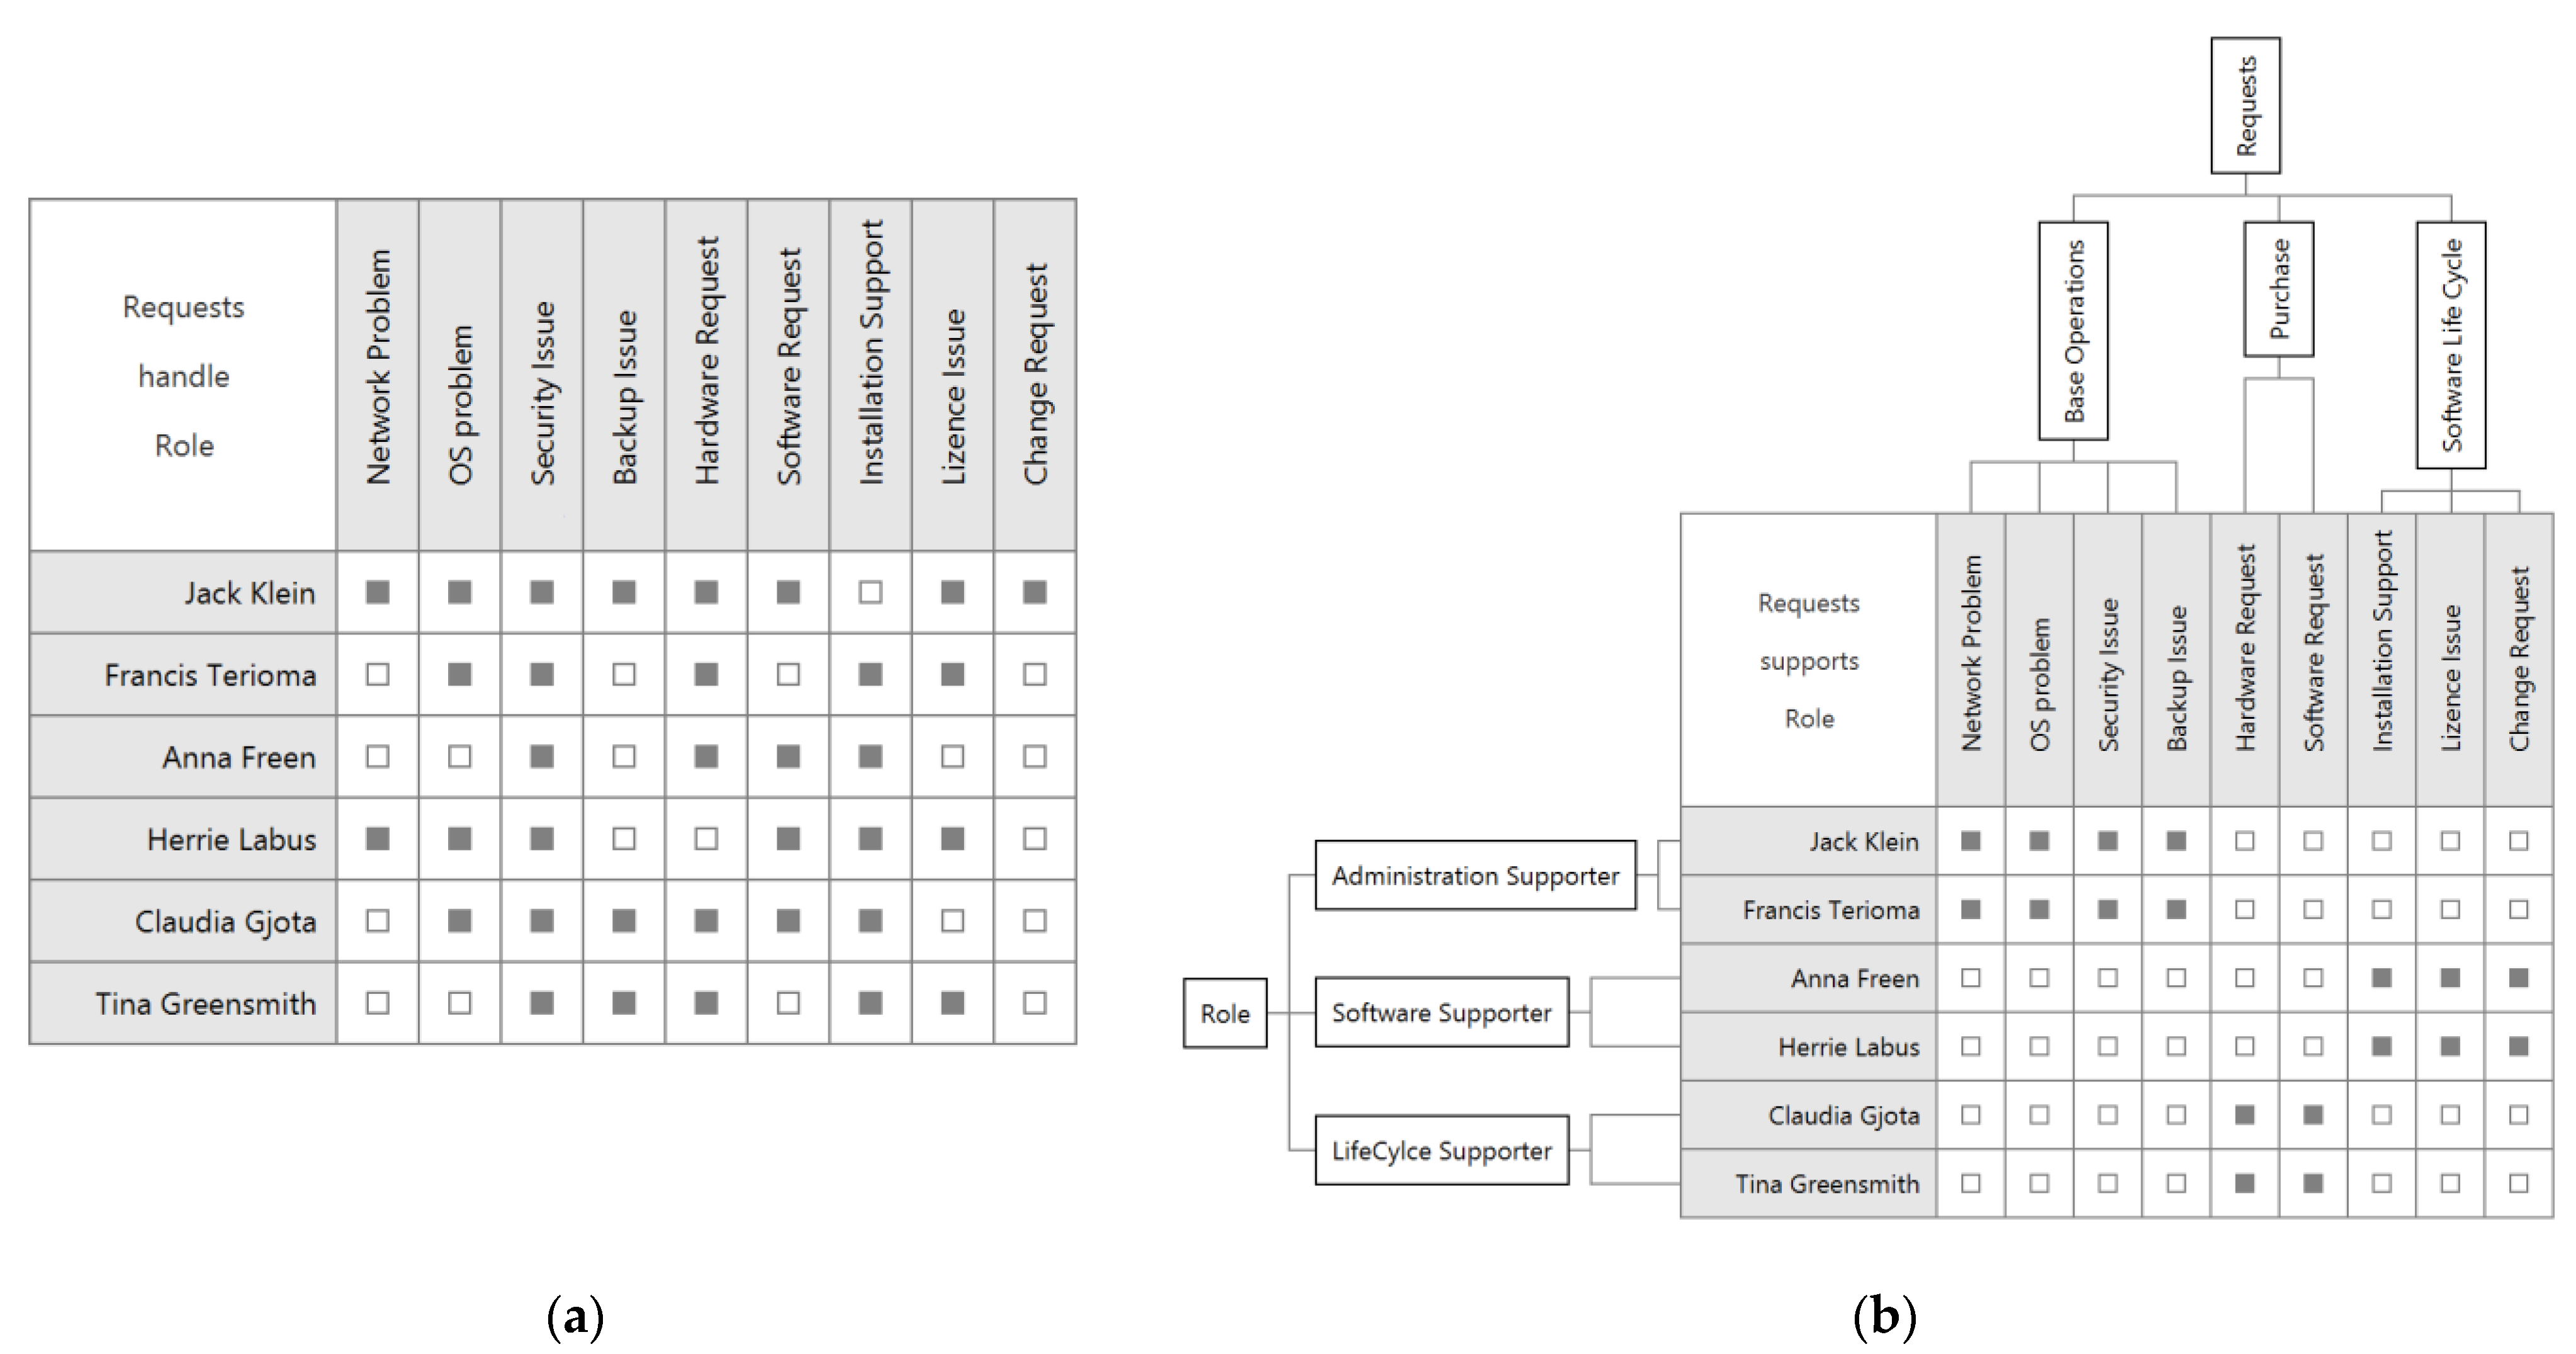
Observation A: Tasks are not well defined. In many of the examined IT departments, the process of handling customer requests and their resulting activities is not well defined—a TAM model of the department would show that the “tasks” aspect is not managed very well (see
Figure 5). As no systematization exists for customer requests, resulting personnel tasks, and potentially internal projects, each customer request (out of the number
of customer requests) is treated individually. This produces additional complexity and consumes additional resources for repetitive task analysis.
Measures: A mandatory aspect including all the tasks resulting from customer requests is established for the IT department. That means that task definitions are created for activities such as system operations, IT security, and application development and support. To reduce the TM complexity from , and thus fulfill characteristic 1 of a class E system, there should not be more than seven different categories.
Observation B: Roles and responsibilities are not well defined. We often find that no explicit definition of the roles and responsibilities of the department personnel exist. As best as they can, the employees practice impromptu “teamwork” where everybody tries to help as much as possible (see
Figure 6). Each employee is working on all kinds of tasks because they feel responsible for the whole group. Typically for those cases, more than 30% of the working time is invested to arrange the work into these “teams.”. In the worst case, this management principle requires keeping up to
communication channels for
employees, to ensure that everybody is in the loop and enabled to accomplish their respective tasks. This extremely high degree of complexity leads to an organization mainly busy with continuously organizing and re-organizing itself—such a way of structuring teams obviously does not contribute to an organization’s competitiveness.
Measures: To reduce organizational complexity by better defining roles and responsibilities, a small TAM aspect containing mandatory job categories is established, typically including roles such as supporter, administrator, operator, and project manager. Mandatory regulations regarding roles and responsibilities are established by assigning specific tasks to specific job profiles. At the same time, a qualification roadmap is established for each job profile, thereby enabling each employee to fulfil their task more effectively and efficiently over time. No employee is assigned to more than two job categories. With representing the number of distinct roles, this simple restructuring reduces organizational complexity from to .
Observation C: No clear understanding by customers. Because of the overall TM complexity of of the—still unreformed—department, its value creation chain is hard to understand and barely manageable. More specifically, the department is unable to release valid and robust forecasts for cost, project schedules, and resource usage. Stakeholders and customers fail to understand the department head’s overall strategy and lines of thinking because of the spaghetti ball of dependencies. IT employees are demotivated because each management decision is seen as ad-hoc and—without any clearly recognizable strategy—has a smack of being despotic.
Measures: The task categories (see Observation A) are systematically applied to establish standard support and request interfaces towards users. The top-level aspects capturing the department’s organization are communicated to users and stakeholders to facilitate their understanding of the IT department’s structures and services. In addition, operative human resources planning is based on the task and job profiles, ensuring the availability of services. Individualized work on tickets and services outside of established categories is only taken up if important needs exist—thereby further reducing the complexity of day-to-day task organization.
The application of these—or similar—basic management mechanisms should be a matter of course—however, we observe quite often that that is not the case. For small teams of only a very few members, ad-hoc management of individual issues may make sense, e.g., for an IT department of a very small company. However, if these structures are not readjusted once the company grows to a certain size, organizational complexity is sneaking in without being perceived. For a company growing in such a way, originally sleek and competitive tasks and processes become more and more complex, eating up more and more resources—reducing the organization’s competitiveness. In short: companies that, over time, slip from class E to class S suffer from a growing risk to underperform in comparison to the market.
As described, countermeasures can be taken against that complexity increase: in the above example, the implementation of the measures A to C based on the introduction of TAM aspects reduces complexity from (with denoting the number of requests and the number of employees) down to (with denoting the number of task categories and as the number of job profiles). The organizational structure supporting the business’ value-creating activities becomes understandable and easy to communicate, procedures and tasks are replicable and do not call for individualized decision making, and job training becomes more structured. In short: the organization becomes more competitive.
We do not claim that the described measures were highly innovative in themselves: instead, they are applications of standard management measures derived from the point of view of complexity reduction—with the specific aim to move the examined organization from class S back to class E, and thus to increase its competitiveness.
In most cases, complexity-reduced management leads to smaller teams with more, but clearly defined, categories of tasks. These tasks are synchronized by a small but mandatory set of scheduling principles. With the division of labor thus increasing, the work profiles of the employees become smaller, increasing their specialization and level of training [
3]. Compared to the naïve concept of ad-hoc teams, where everybody helps out with everything, it seems as if the attractivity and broadness of the jobs is reduced by mandatory regulations. However, we observed the opposite effect: broadness and a lack of focus induce stress because there are no supporting guidelines and clear responsibilities [
64]. Reducing complexity in the described way facilitates the growth of excellence and the experience of successful teamwork.
5. Conclusions
This paper examined a high degree of organizational complexity as a potential reason why organizations underperform. Following an introduction on aims and scope, it presented the NES classification method that classifies human-designed organizations of high complexity as class S slipped systems. The paper then recapped the TAM modeling method as a means to measure organizational complexity—and thus to operationalize NES—and presented specific characteristics on how to discern natural, engineered, and slipped systems. It then highlighted several typical examples of specific “hot spots” of complexity in such slipped systems, and outlined potential countermeasures and their impact.
Generally, a degree of organizational complexity lying above the cognitive limits of employees and management can contribute to sub-standard organizational performance. As often noticed in the consulting practice, businesses that grew “organically” over time tend to slip into structures of a high organizational complexity—that complexity leads to typical symptoms that increase the ratio of the available resources necessary for a continuous and ad-hoc reorganization, and thus to a reduction in competitiveness. As a first step towards mitigation, organizational complexity—both the general complexity of an organization as well as specific points of high complexity—can be assessed using the NES classification and TAM assessment methods. Then, complexity-reducing measures can be systemically applied that mitigate the diagnosed symptoms and help to reduce that complexity, moving systems from the “slipped” back to the “engineered” state. For an organically growing organization, it is therefore beneficial to undertake an active approach to complexity management.
Those measures are, as described above, typically not outside of standard management methods—and, therefore, no significant effort has to be taken to convince management and employees of their benefit. However, they are derived and applied with the specific aim of complexity reduction, of moving the organization from class S to class E, and thus aim at increasing its competitiveness and reducing its risk of failure in the market.
We foresee two main areas as a focus for further research.
First, we plan to further validate to what degree the application of the NES toolset increases the effectiveness and efficiency of organizations. As organizational success is dependent on a variety of diverse factors such as general economic trends, local or national policy decisions, the personality of singular entrepreneur figures, or sheer good or bad luck, a data-driven validation approach would be of enormous complexity, involving surveys with a large sample size. Instead, we aim to perform a model-based validation process, where we examine the business processes of a typical organization, decompose them into individual steps or elements, and weigh these elements by their frequency of occurrence and impact on operations. Next, each element is run by the NES toolset; simply put, we examine whether its efficiency would increase or decrease from reductions in organizational complexity. By summing up the product of the increase/decrease and weight, an indicator for the general improvement of effectiveness and efficiency can be calculated.
Second, we plan to extend and systemize the presented collection of observations into a pattern language [
41] for typical organizational inefficiencies. Here, the main challenges include structuring, generalizing, and systemizing the observations perceived as typical symptoms, so they adhere to the criteria of patterns without losing their specific validity. Such a structured collection of connected patterns, including archetypical examples and pathways to solve the inefficiencies, would be based on the validation approach described above, and would be beneficial for the research community and managers, as well as consulting practitioners.


