Article

A Mathematical Model for the Pullout Response of Hooked-End Shape Memory Alloy Fibres Embedded into Concrete


by
Demewoz W. Menna
1,* and
Aikaterini S. Genikomsou
2,*
1
Department of Civil Engineering, Queen’s University, Kingston, ON K7L 3N6, Canada
2
Department of Civil Engineering, University of Patras, 26 504 Rio, Greece
*
Authors to whom correspondence should be addressed.
Constr. Mater. 2026, 6(2), 22; https://doi.org/10.3390/constrmater6020022

Submission received: 2 October 2025 / Revised: 25 February 2026 / Accepted: 26 March 2026 / Published: 2 April 2026

Abstract

This study investigates the pullout behaviour of hooked-end superelastic shape memory alloy (SMA) fibres embedded in concrete with the aim to develop an analytical model. Single fibre pullout experiments were performed to evaluate the mechanical response of SMA fibres with various hook geometries. A mathematical model based on the friction pulley method was then developed to predict the experimental pullout load versus displacement plots. The model integrates the tensile stress–strain response and the elastic–plastic constitutive behaviour of superelastic SMA materials, while also accounting for fibre slip and superelastic deformation during the pullout process. The pullout process is modelled through staged mechanisms including elastic response and debonding, progressive mechanical anchorage, and frictional pullout. The contribution of mechanical anchorage is governed by the elastic–superelastic strain distribution within the hook bends. The proposed model reasonably reproduces the overall load-slip response, peak pullout load, slip at peak load, and pullout energy for the three different fibre geometries extracted from normal strength and high-performance concrete matrix. The proposed mathematical model offers a transferable and predictive tool for assessing the pullout performance of hooked-end SMA fibres and supports their integration into design of SMA fibre-reinforced cementitious composites.

1. Introduction

Concrete is a quasi-brittle material with low tensile strength. The addition of randomly distributed fibres in concrete could significantly increase the post-cracking tensile strength, ductility, impact resistance and durability due to the fibre’s tendency towards tensile stress resistance and limiting crack propagation [1,2]. The recent development of fibres made of smart materials, like shape memory alloys (SMAs), has shown promising results in not only improving the mechanical properties of concrete but also the crack closing and recentering capabilities [3,4,5,6]. SMAs are characterized by their unique behaviour of spontaneously recovering from significant strain up to 8%, either by heating or stress removal. This strain recovery is attributed to their reversable solid-to-solid phase transformation from austenite-to-martensite phases [7]. The strain recovery can be induced either by applying external heat (called shape memory effect) or when the applied load is removed (superelastic effect) [8].
Large efforts have been devoted to the investigation of crack closing and energy dissipation capabilities of shape memory alloy fibre-reinforced cementitious composites. One of the shortcomings of SMA fibres is their weak bond with concrete. In an effort to improve the limited anchorage properties of SMA fibres in concrete, various methods such as sand coating, surface roughening, and deformed shapes have been suggested and studied. Deformed fibres with crimpled, end-dogbane, and hooked-end shapes were found to be effective in developing a sufficient fibre bond with mortar and concrete [9,10,11]. Menna, et al. [12] combined heat-treatment procedures to improve the mechanical properties of the SMAs with end-hook geometry to produce engineered SMA fibres with significantly higher pullout resistance. These fibres were proven to have produced SMA fibre-reinforced concrete prisms with high energy dissipation and crack closing capabilities.
The interfacial bond between fibre and the cementitious matrix is one of the main factors that influence the post-cracking behaviour of fibre-reinforced concrete [1,13,14]. A too-low interfacial bond results in the pullout of fibres at low load without contributing much to the tensile strength of the fibre-reinforced concrete, while a too-high bond causes the fibre to rupture without gradual transfer of stress across cracks. Thus, understanding the pullout resistance of fibres is a key factor in producing efficient fibre-reinforced concrete [15,16]. Single fibre pullout experiments have been widely used to investigate the fibre–matrix bond characteristics [9,10,15].
Various investigations have been carried out to model the pullout response of steel fibres embedded in the cementations matrix [14,17,18]. Early analytical formulations by Naaman et al. [19] established a framework for modelling the pullout behaviour of straight steel fibres by relating interfacial shear stress to relative slip through a staged bond slip approach. This framework was later extended by Alwan et al. [18] to hooked-end steel fibres, where the pullout process was classified into three distinct stages: (i) elastic response and progressive debonding along the embedded length, (ii) activation of mechanical anchorage through hook straightening accompanied by increased bearing stresses in the surrounding concrete, and (iii) frictional pullout after full hook straightening and local concrete damage. This allowed the prediction of both peak pullout load and post-peak softening. Their work demonstrated that mechanical anchorage, rather than interfacial friction alone, governs the enhanced pullout resistance of hooked fibres, and that this contribution is strongly influenced by fibre geometry and concrete strength.
Subsequent studies extended the staged pullout concept to a more complex hook geometry. Abdallah et al. [15] introduced an enhanced analytical model to capture the anchorage contributions of multiple plastic hinges in 4D and 5D hooked-end fibres, explicitly accounting for the cumulative effect of successive hook straightening events. Collectively, these models established the coupled roles of bond degradation, hook geometry, and concrete strength in governing pullout behaviour. However, they share a fundamental assumption that hook straightening is accompanied by plastic fibre deformation as they are developed for. As a result, existing formulations are inherently limited to elastic–plastic fibres and cannot capture the distinctive tensile stress–strain behaviour of superelastic SMA fibres like stress-induced martensitic transformation, reversible bending, stress plateau, and strain recovery associated with superelastic shape memory alloy (SMA) fibres. No model currently exists, to the authors’ knowledge, for superelastic shape memory alloy fibres. In this research, the pullout behaviour of single hooked-end SMA fibres embedded into concrete was analyzed and a mathematical model was developed. This model could establish the basis for accurately predicting the structural performance of composites with SMA fibres.

2. Experimental Programme

2.1. Specimen Preparation and Experimental Setup

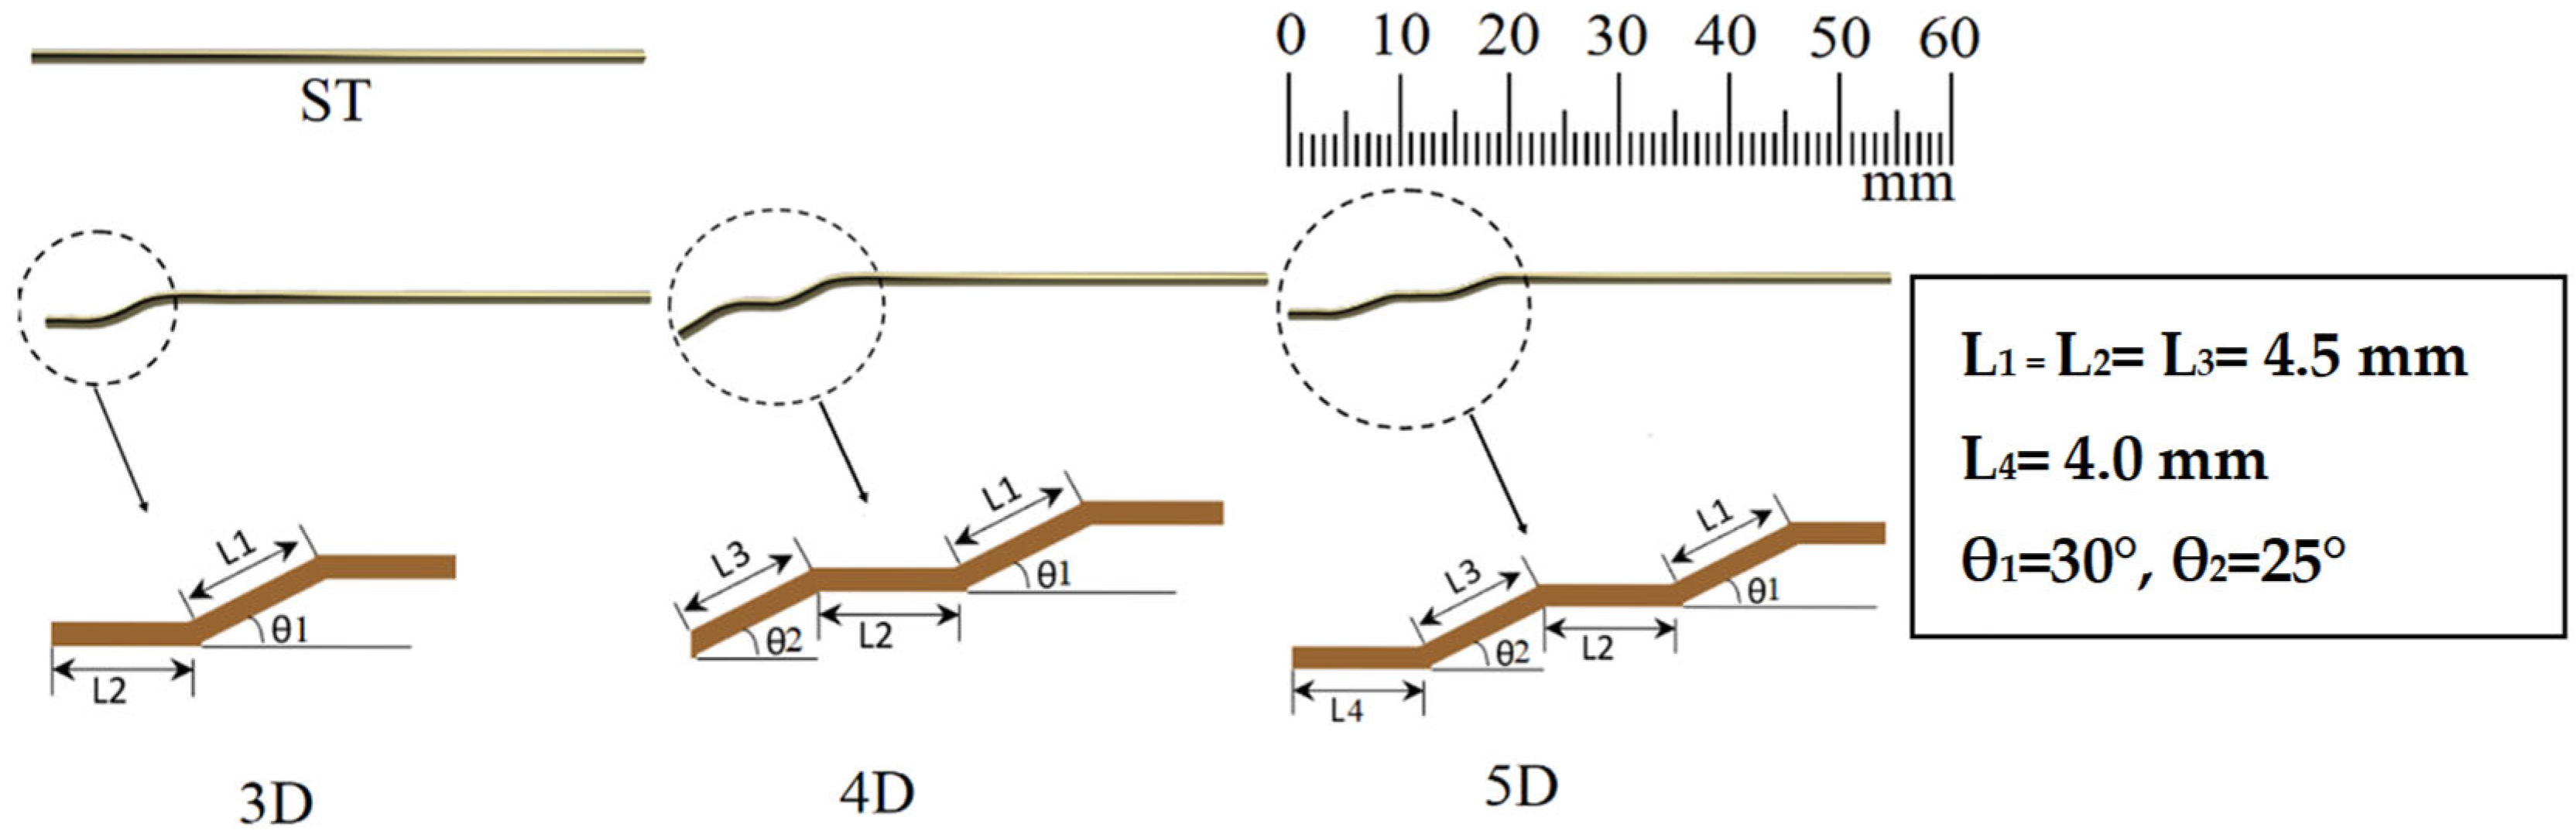
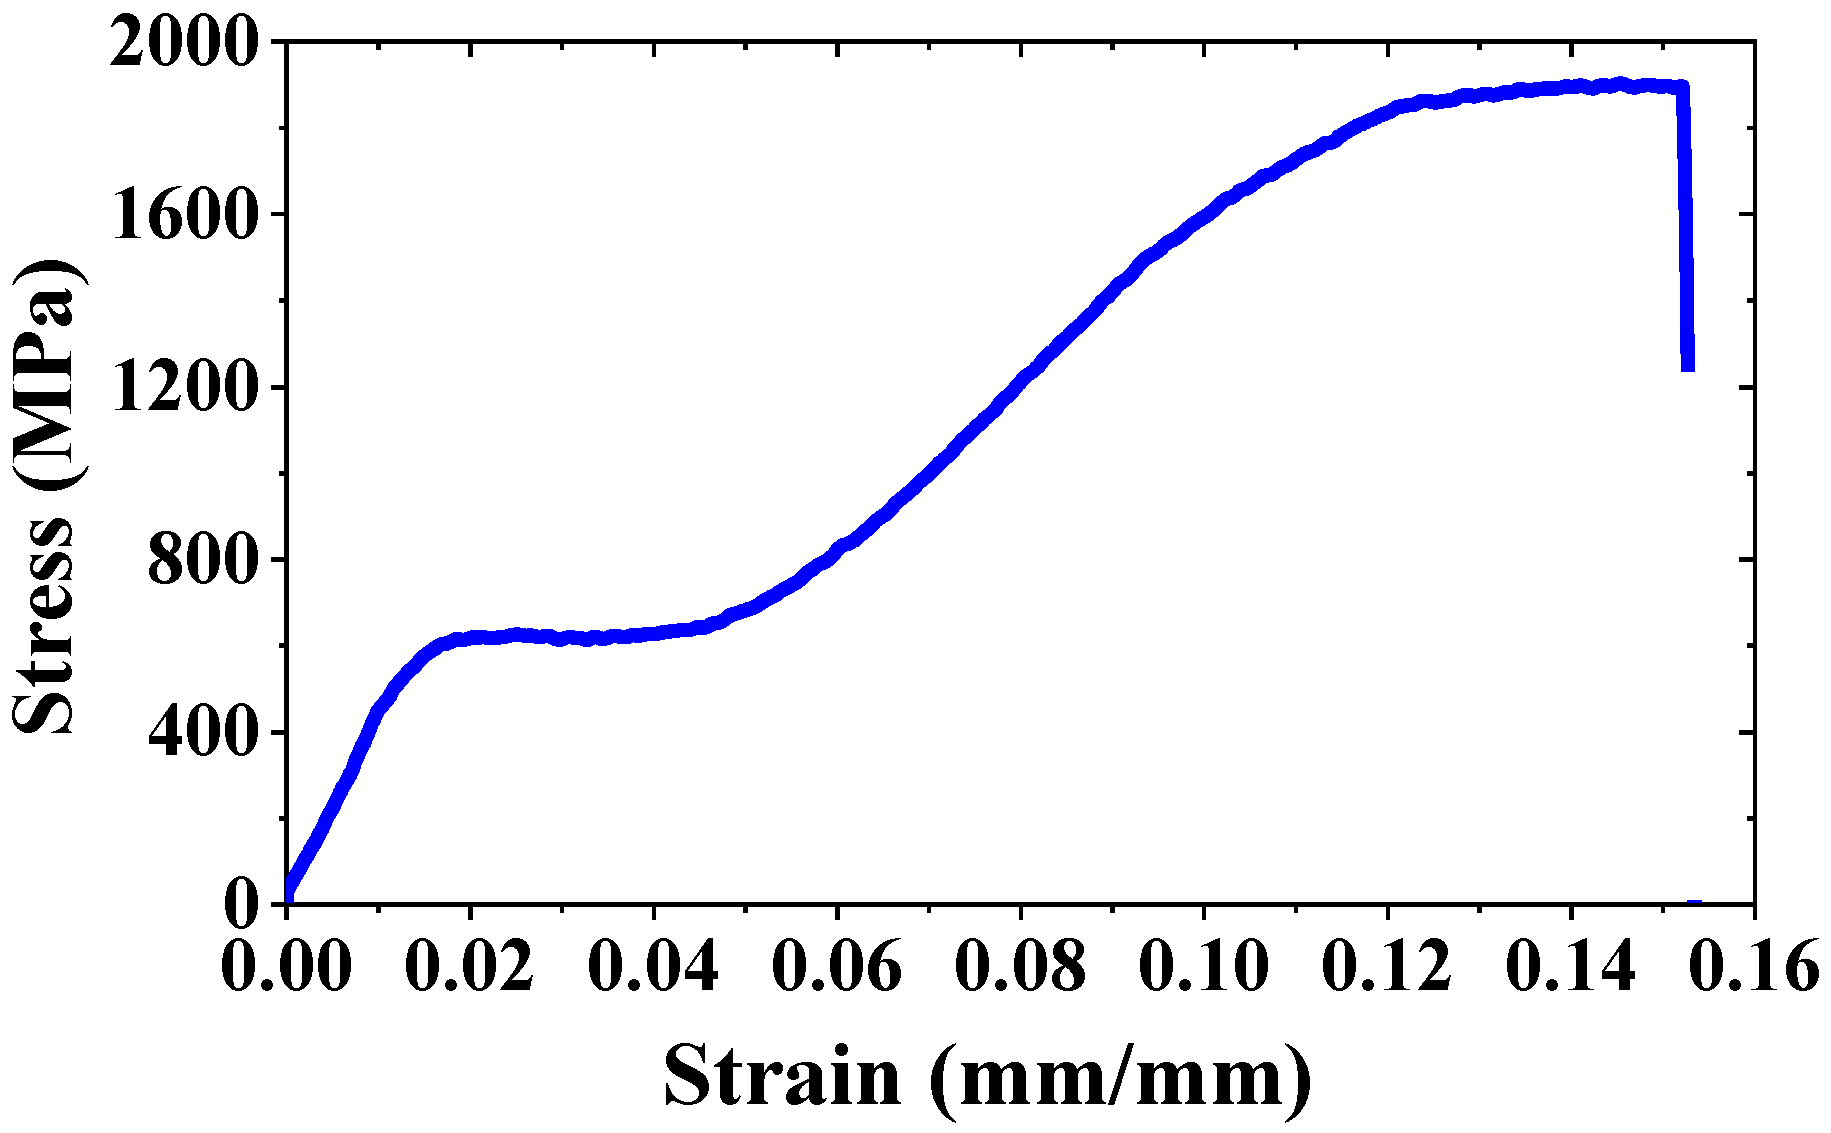
The SMA fibres used in this study were fabricated from commercially available heavily cold-worked (48% cold-work) NiTi alloy wire supplied by Memry Corporation (Bethel, New York, NY, USA). The wire’s austenite start (As) and austenite finish (Af) temperatures were −15 °C and −5 °C, respectively, making it superelastic above −5 °C. Three different end-hook geometries (3D, 4D, and 5D) were created and then the fibres were heat-treated at 350 °C for 40 min and air-cooled to room temperature. In addition to the hooked-end fibres, a straight fibre (ST) was also fabricated. The geometry and dimensions of the SMA fibres are shown in Figure 1. Each fibre measured 1 mm in diameter and 55 mm in length, with 30 mm embedded into concrete and the remaining 25 mm reserved for gripping. Figure 2 shows the uniaxial tensile stress–strain response of the superelastic wire coupon, from which the fibres were fabricated. The wire underwent a heat-treatment process similar to the one applied to the fibres. The stress–strain curve begins with a linear elastic region, followed by a stress plateau at approximately 614 MPa, corresponding to a strain of about 2%. This plateau is then succeeded by a strain-hardening phase leading up to failure. The wire reached an ultimate tensile strength of approximately 1900 MPa at a strain of 15%, just before fracture.
Two types of concrete matrices were used in this study. The first was normal strength concrete (NSC) with a compressive strength of 35 MPa. This mix contained 456 kg/m3 of Portland-limestone (Type GUL) cement, 228 kg/m3 of gravel, and 891 kg/m3 of sand. The water-to-cement ratio was 0.50, and the maximum nominal aggregate size was 6 mm. The second matrix was a high-performance concrete (HPC), commercially supplied by King packaged materials (Oakville, ON, Canada), with a compressive strength of 60 MPa. The HPC was composed of Portland cement, silica fume, an air-entraining admixture, and aggregate with a maximum nominal size of 6 mm.
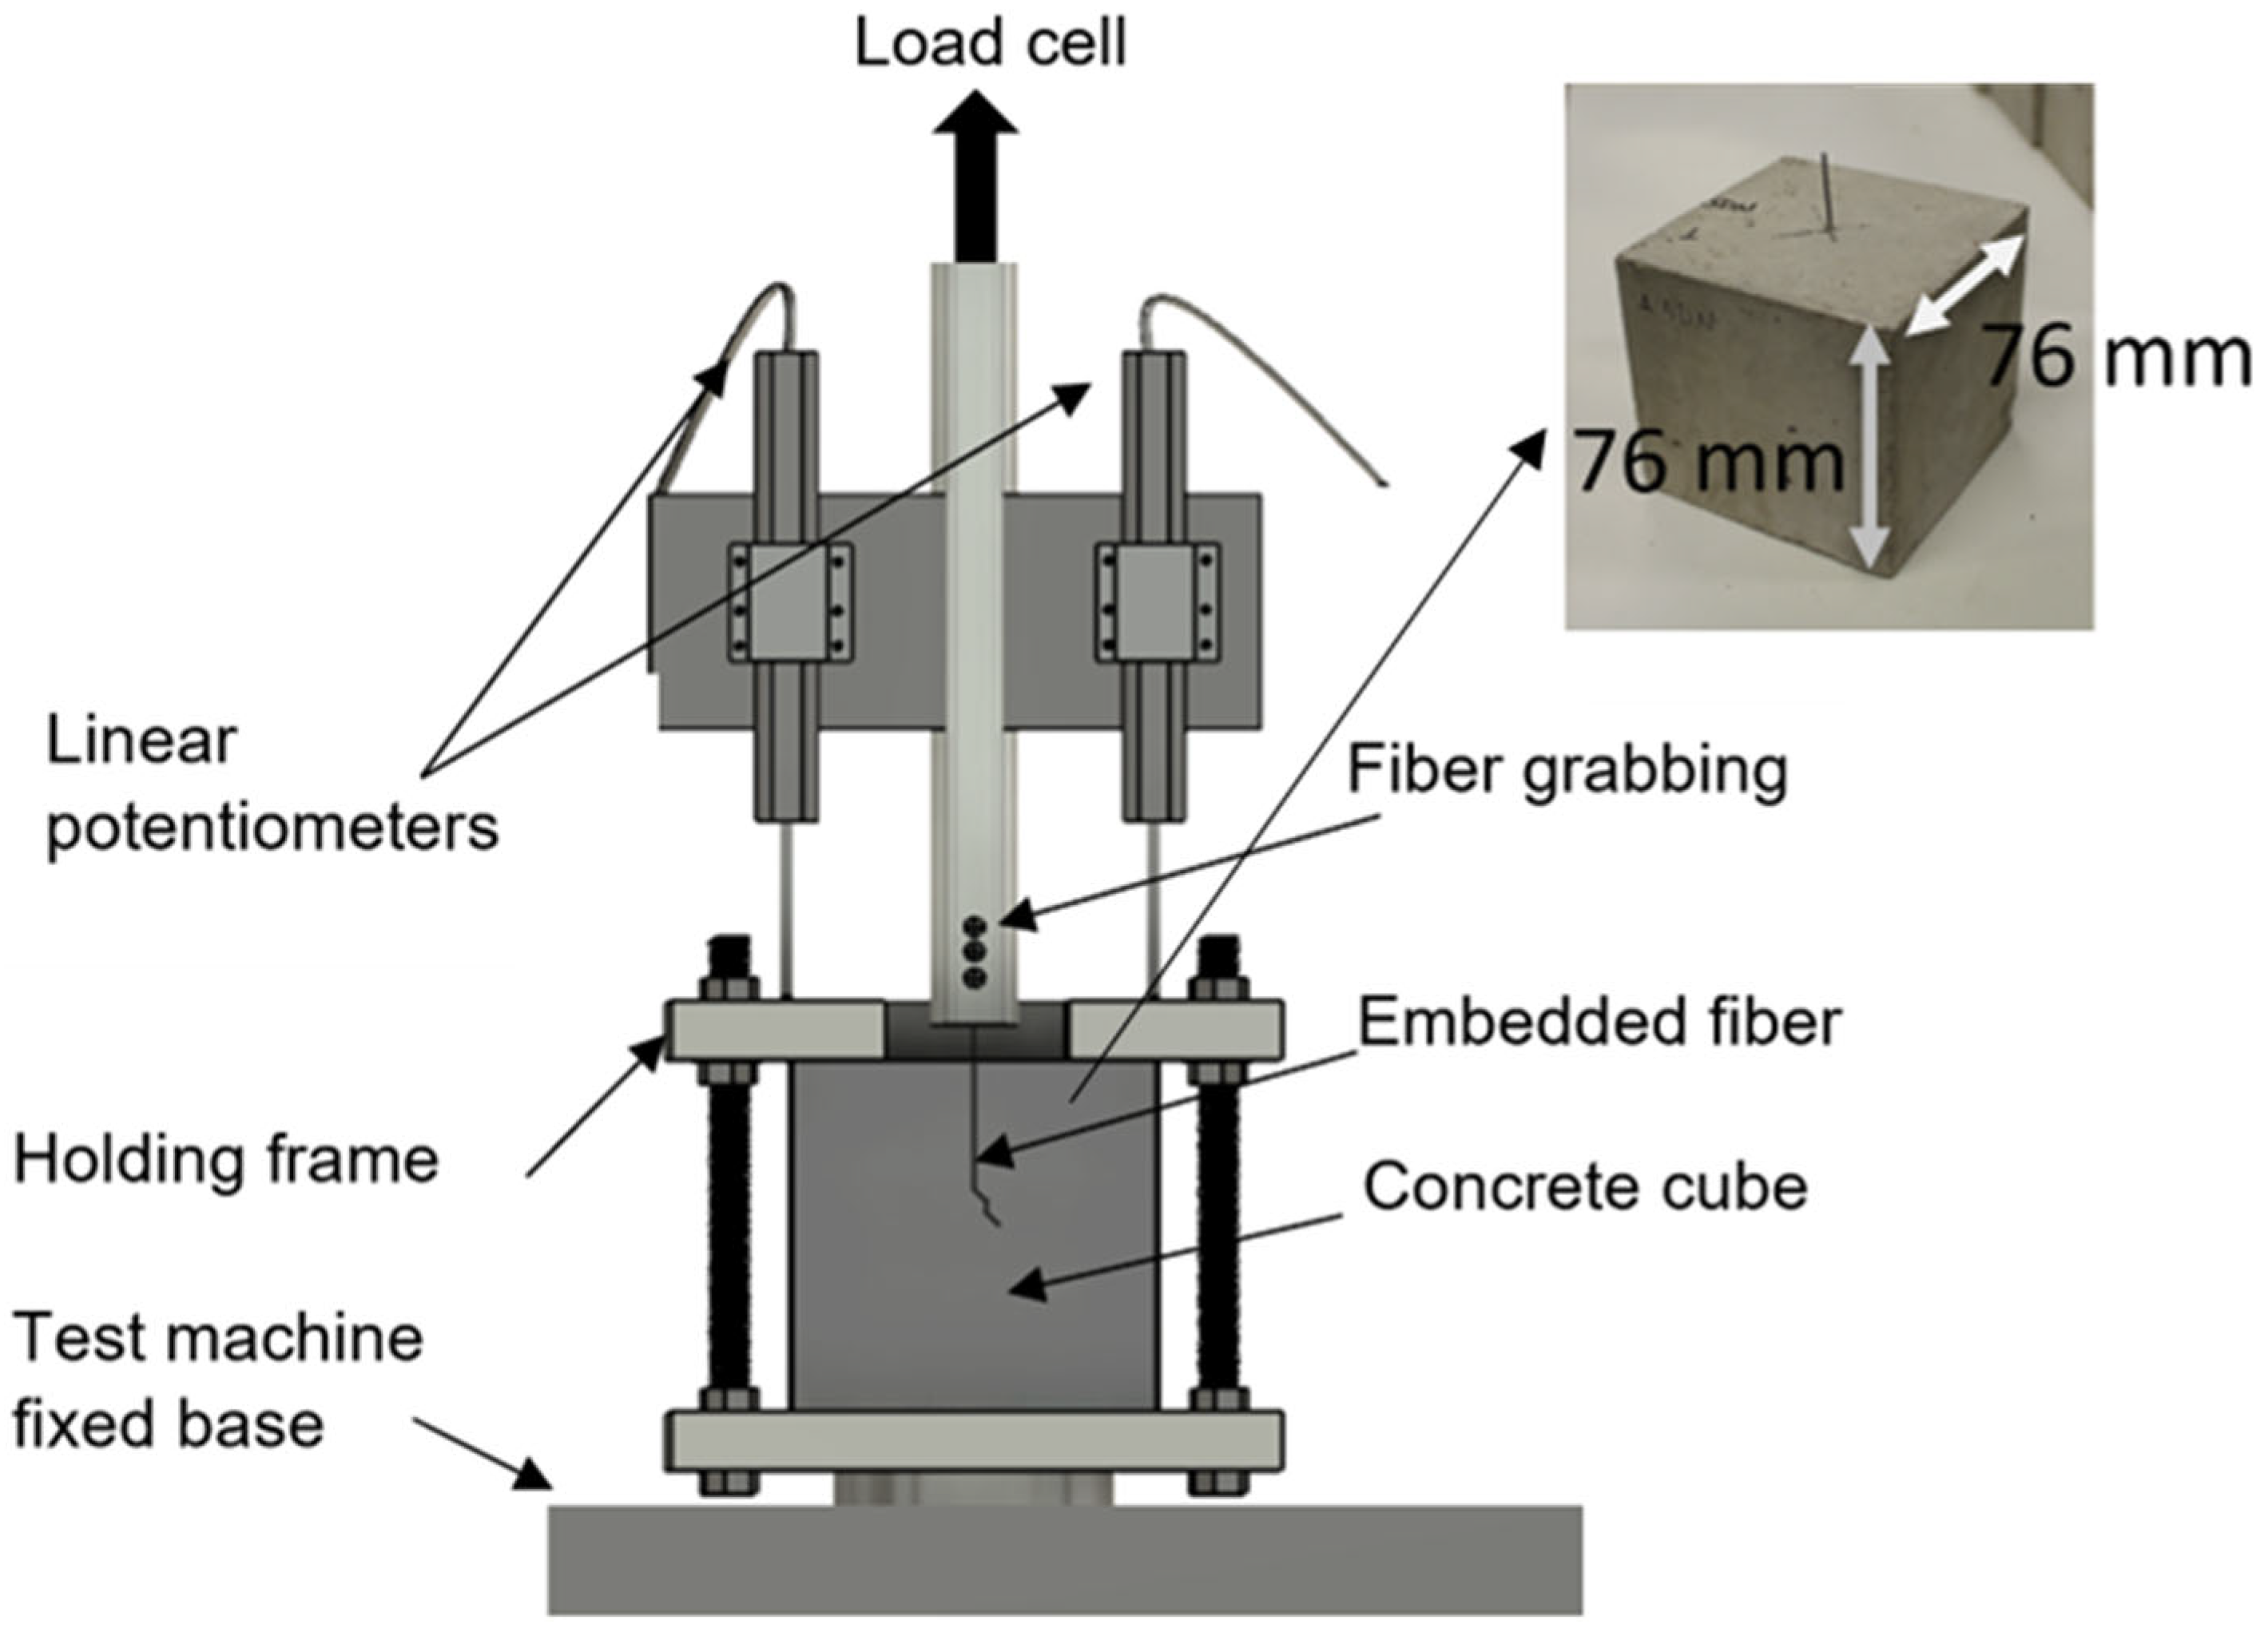
The pullout specimens were prepared by embedding single fibres in a concrete cube with dimensions of 76 mm × 76 mm × 76 mm. The specimens were cured for 28 days at a relative humidity of 90 ± 3% and a temperature of 22 ± 3 °C. The experiment was conducted using a Zwick/Roell machine with a 5 kN load cell. Figure 3 presents the experimental setup for the single fibre pullout tests. An adjustable steel frame was used to securely attach the specimen to the machine base. A grab screw fixture connected to the load cell was used to hold the free end of the fibre. Two liner potentiometers were attached to the gripping fixture to measure the fibre end displacement. The pullout tests were conducted using a constant displacement–controlled load at a rate of 1 mm/min. The applied pullout load was measured by the load cell.

2.2. Experimental Results

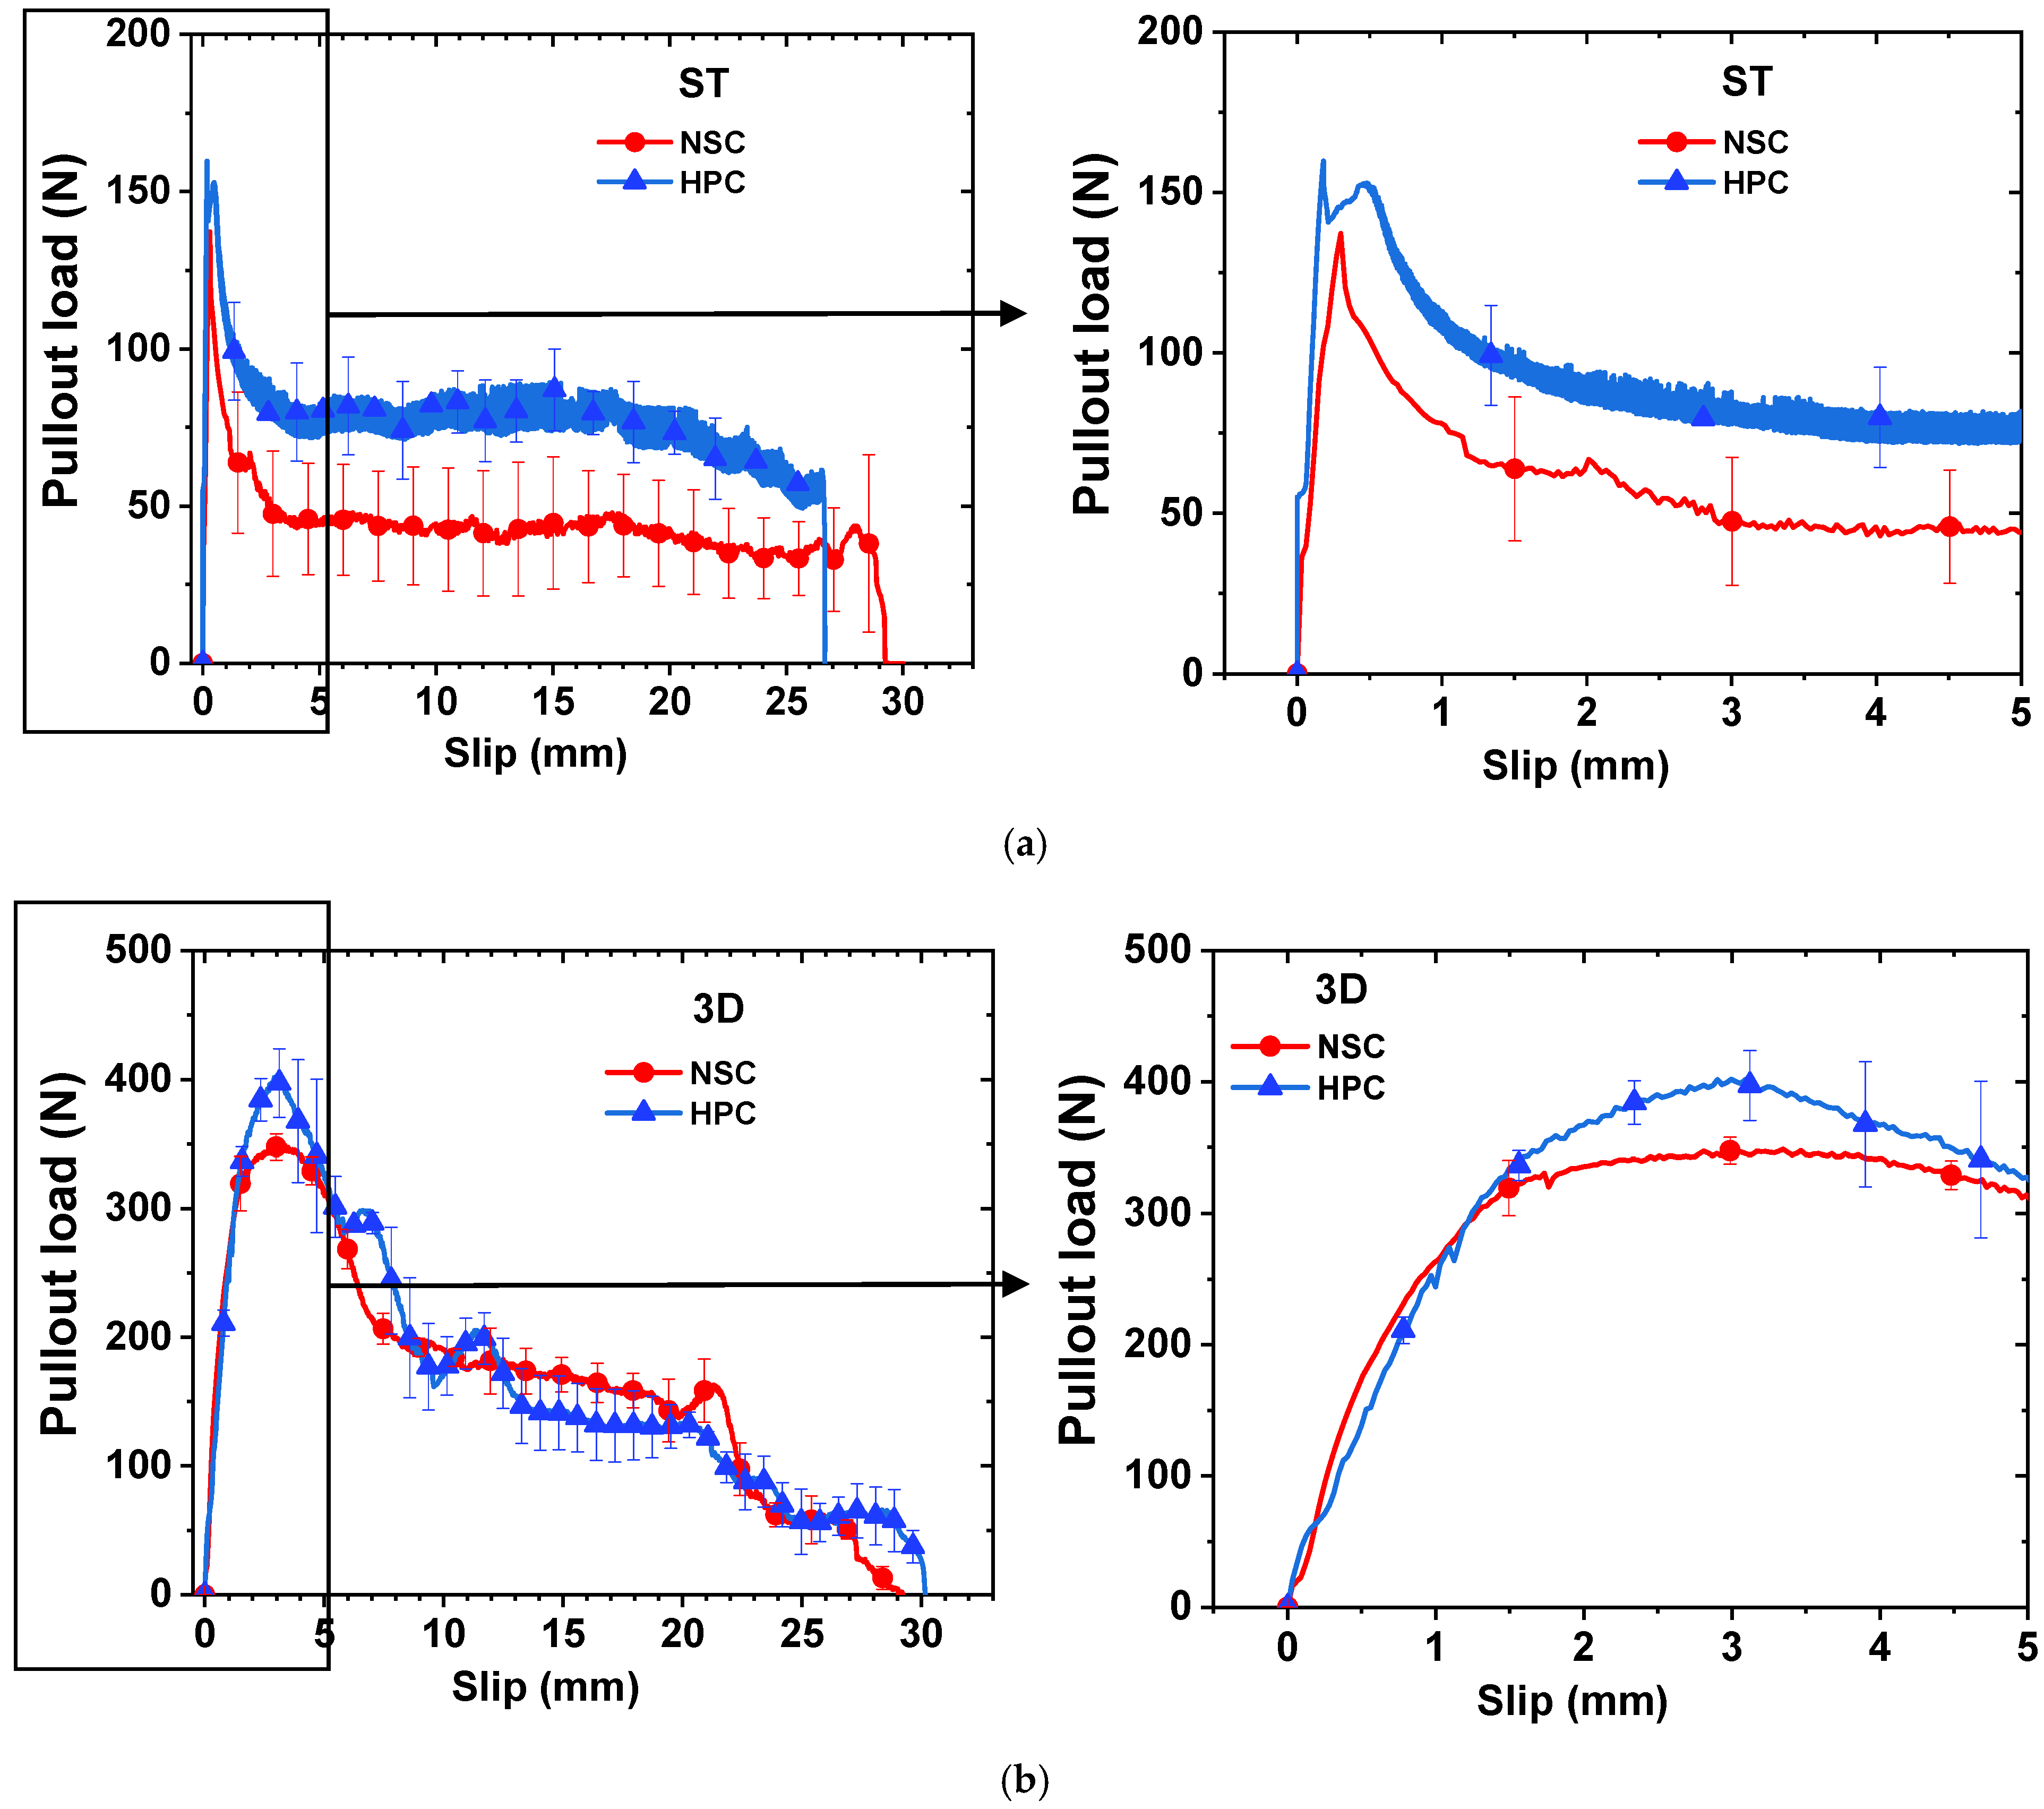
The pullout tests of the straight fibres were considered as a reference for the bond characteristics. Figure 4 shows the response of the full embedment length and a close view for the initial 5 mm fibre displacement. It can be observed from Figure 4a that the pullout resistance of straight fibres increased when the matrix strength increased from NSC to HPC. The pullout resistance for straight fibres is mainly a contribution of chemical adhesion and the matrix–fibre frictional resistance [19]. For straight superelastic fibres, the load-slip curves initially exhibited a linear increase, followed by a sudden drop in load due to debonding. This was then followed by a gradual decline as the fibre progressively pulled out from concrete, eventually leading to complete fibre pullout. The nonlinear behaviour observed after the peak was attributed to the frictional resistance between the fibre and the matrix.
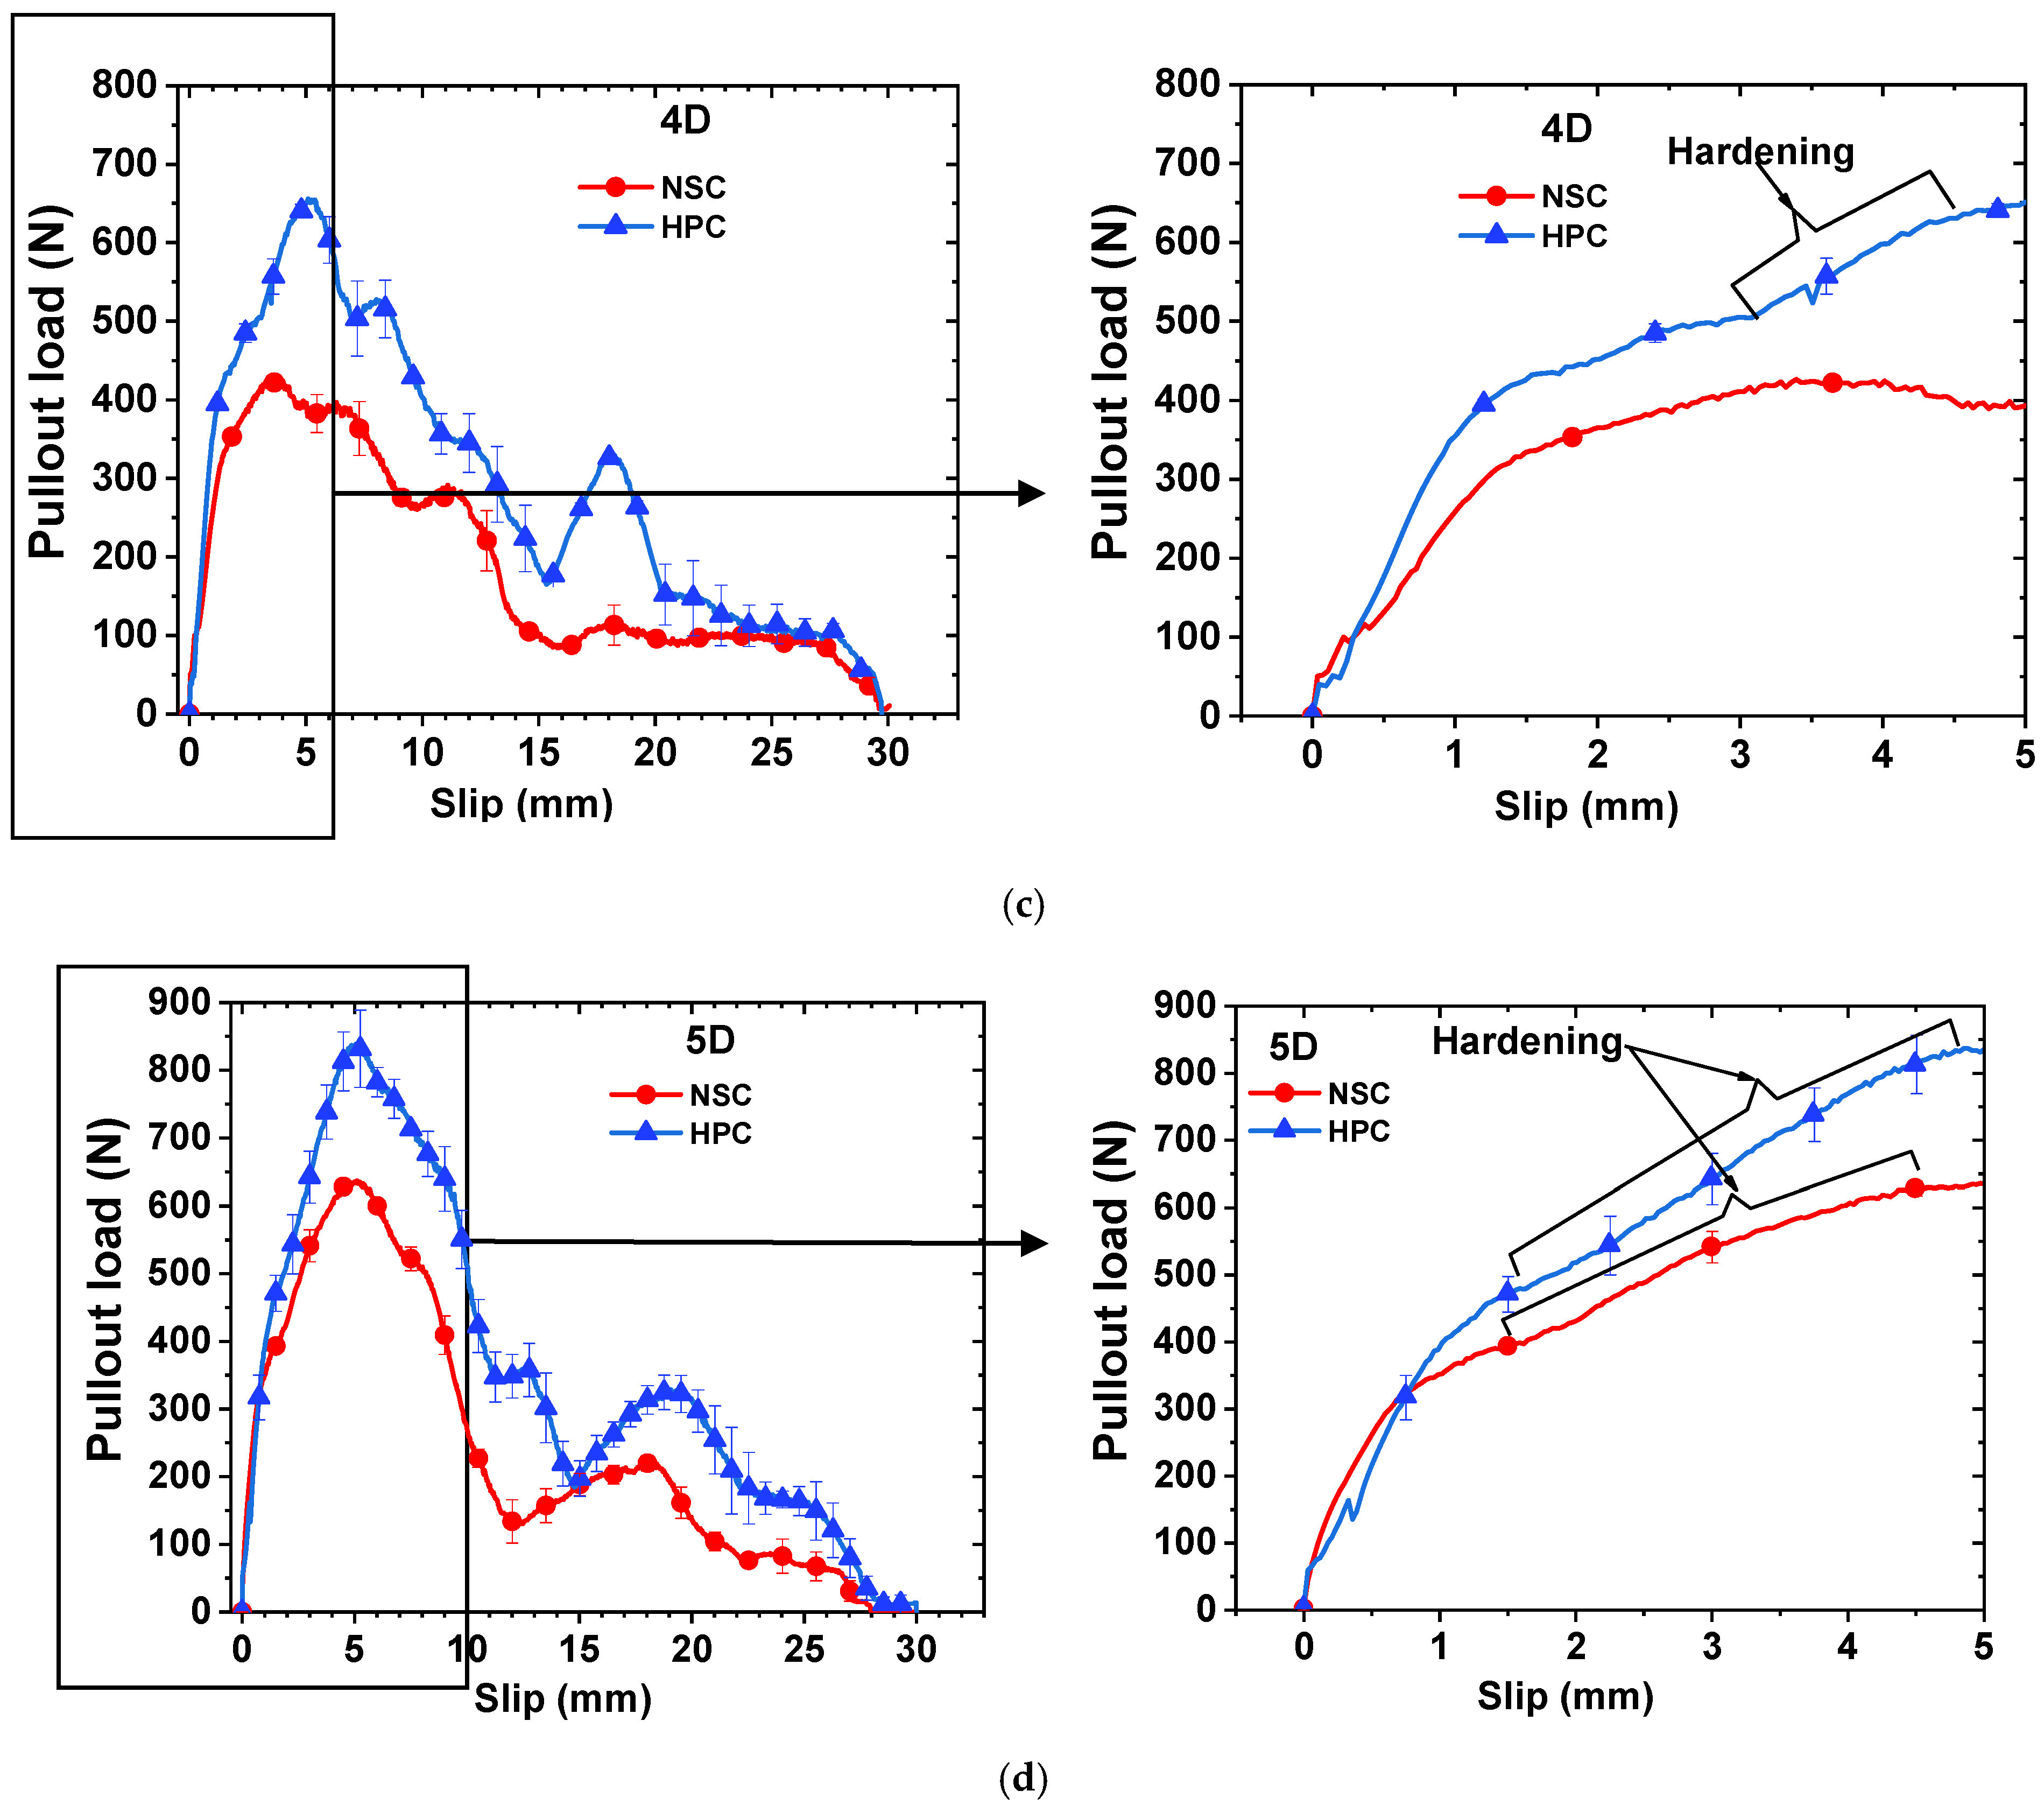
The average pullout load versus fibre end displacement plots of the superelastic SMA fibres with various end hook geometries are shown in Figure 4b–d. Hooked-end fibres exhibit an initial linear response like that of straight fibres. However, after debonding, the pullout load of the hooked-end fibres increases due to mechanical anchorage. The load continues to rise linearly up to approximately 300–400 kN, after which nonlinear behaviour occurs. It has been observed that when the stress in the fibre is less than the loading plateau stress, in case of 3D fibres in both NSC and HPC and the 4D fibres in NSC, the graph forms a plateau near the peak load and gradually decreases as the fibre continues to be extracted. However, when the peak stress exceeds the loading plateau, for the 4D fibres in HPC and the 5D fibres in NSC and HPC, short plateau is formed between the load of 400 N and 500 N followed by hardening until the peak load is reached. This nonlinear plateau and hardening behaviour are due to the development of sufficient stress to initiate the loading plateau and strain-hardening of the SMA fibres, as observed in SMA wire tensile tests (Menna, et al. [12]. It is worth noting that the fibre slip presented in Figure 4 is a combination of fibre pullout displacement plus the fibre tensile deformation. The hardening behaviour gives a unique future of higher ductility and grater energy dissipation capacity for superelastic SMA fibres compared to other types of fibres such as steel [6,12]. After reaching maximum resistance, the pullout load begins to decrease, with local peak points appearing due to the presence of the end-hooks.
Failure mode can describe the pullout behaviour of fibres. In the literature three types of failure modes have been identified: fibre pullout, fibre rupture, and concrete spalling [10,15]. Fibre pullout occurs when the entire embedded length is completely extracted from the matrix, while fibre rupture happens when the fibre breaks before it is fully pulled out. Finally, concrete spalling refers to the failure of the matrix during the fibre extraction process. The experimental study used for the development of the mathematical model showed fibre pullout failure mode for all specimens.

3. Mathematical Model

As presented above, the hooked-end fibres demonstrate an initial linear response similar to that of straight fibres. However, after debonding, the pullout load increases due to the mechanical anchorage provided by the hooked-ends. The mathematical formulation for the pullout response of the straight steel fibres was proposed by Naaman, et al. [19]. The model is based on a relationship between shear stress and relative slip by dividing the process into multiple stages. The model was further developed by Alwan, et al. [18] to predict the pullout process of 3D hooked-end steel fibres extracted from various strength cementitious matrices. Herein, the model from Alwan, et al. [18] is modified considering the tensile stress–strain relationship and elastic–plastic constitutive behaviour of the superelastic SMA fibre to predict its pullout response. The pullout process of hooked-end fibres can be classified into three stages, as follows: the elastic and debonding stage, the mechanical anchorage stage and the frictional pullout stage [18].

3.1. Stage I—Elastic and Debonding Stage

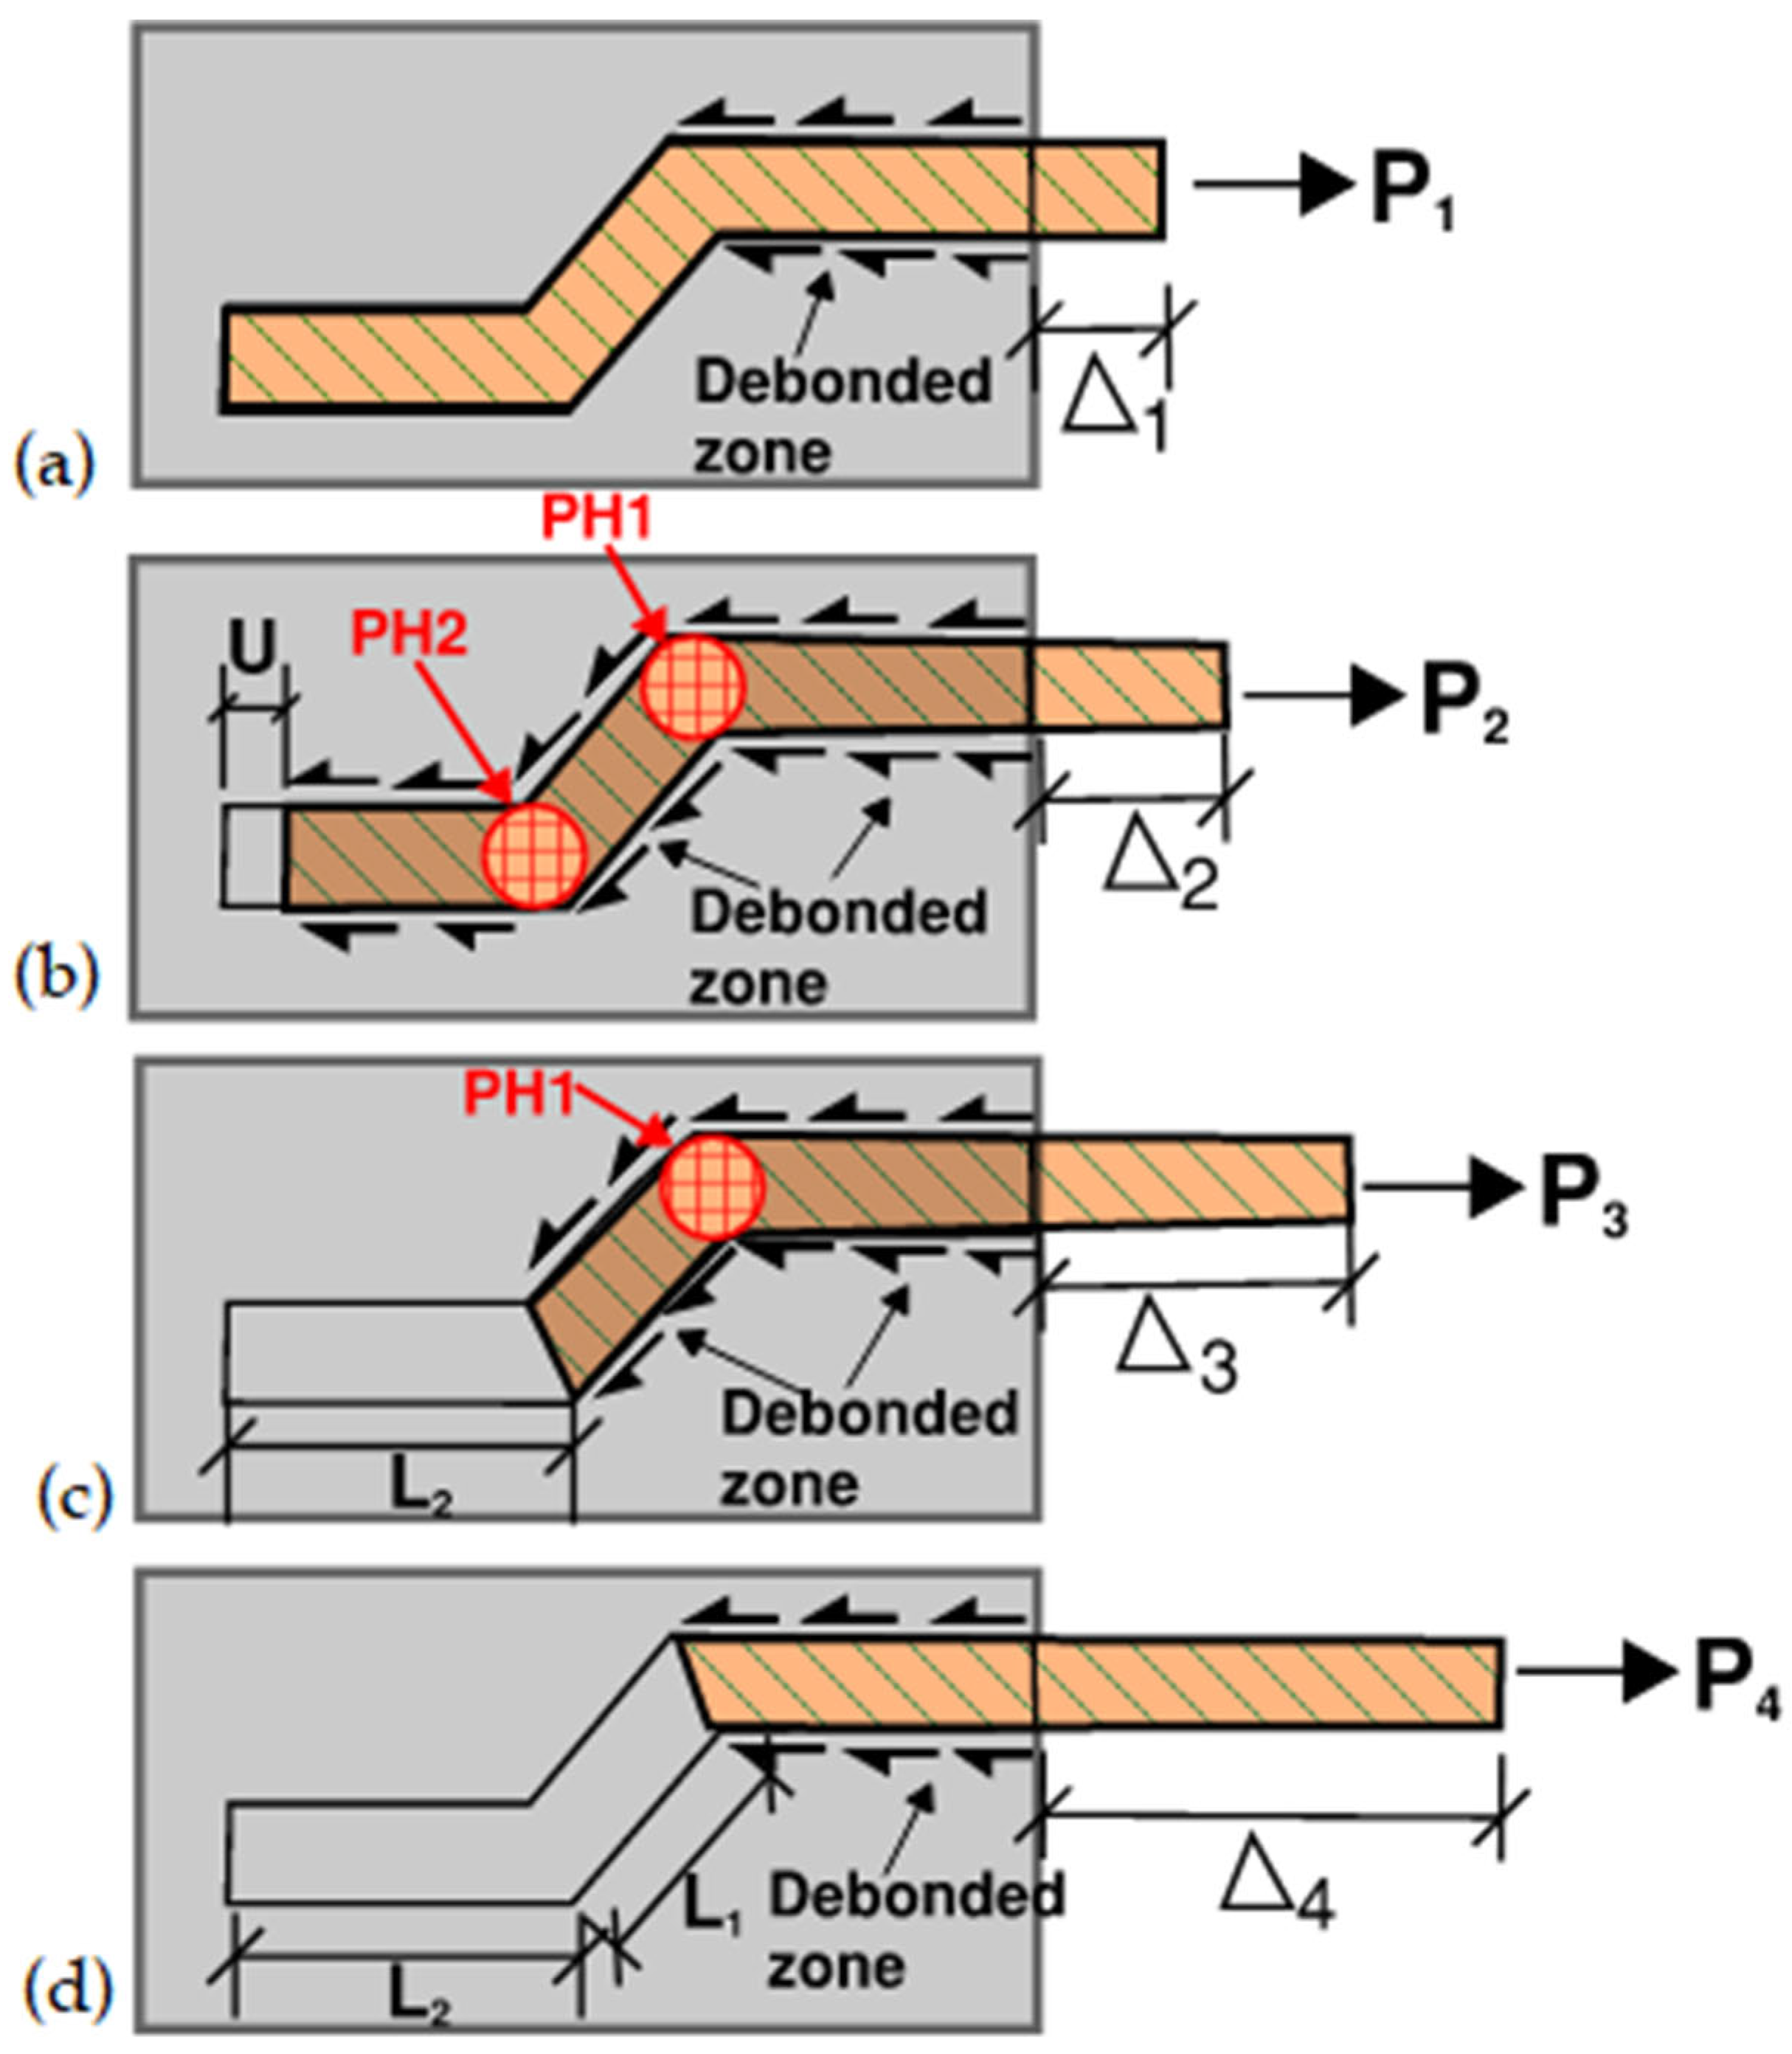
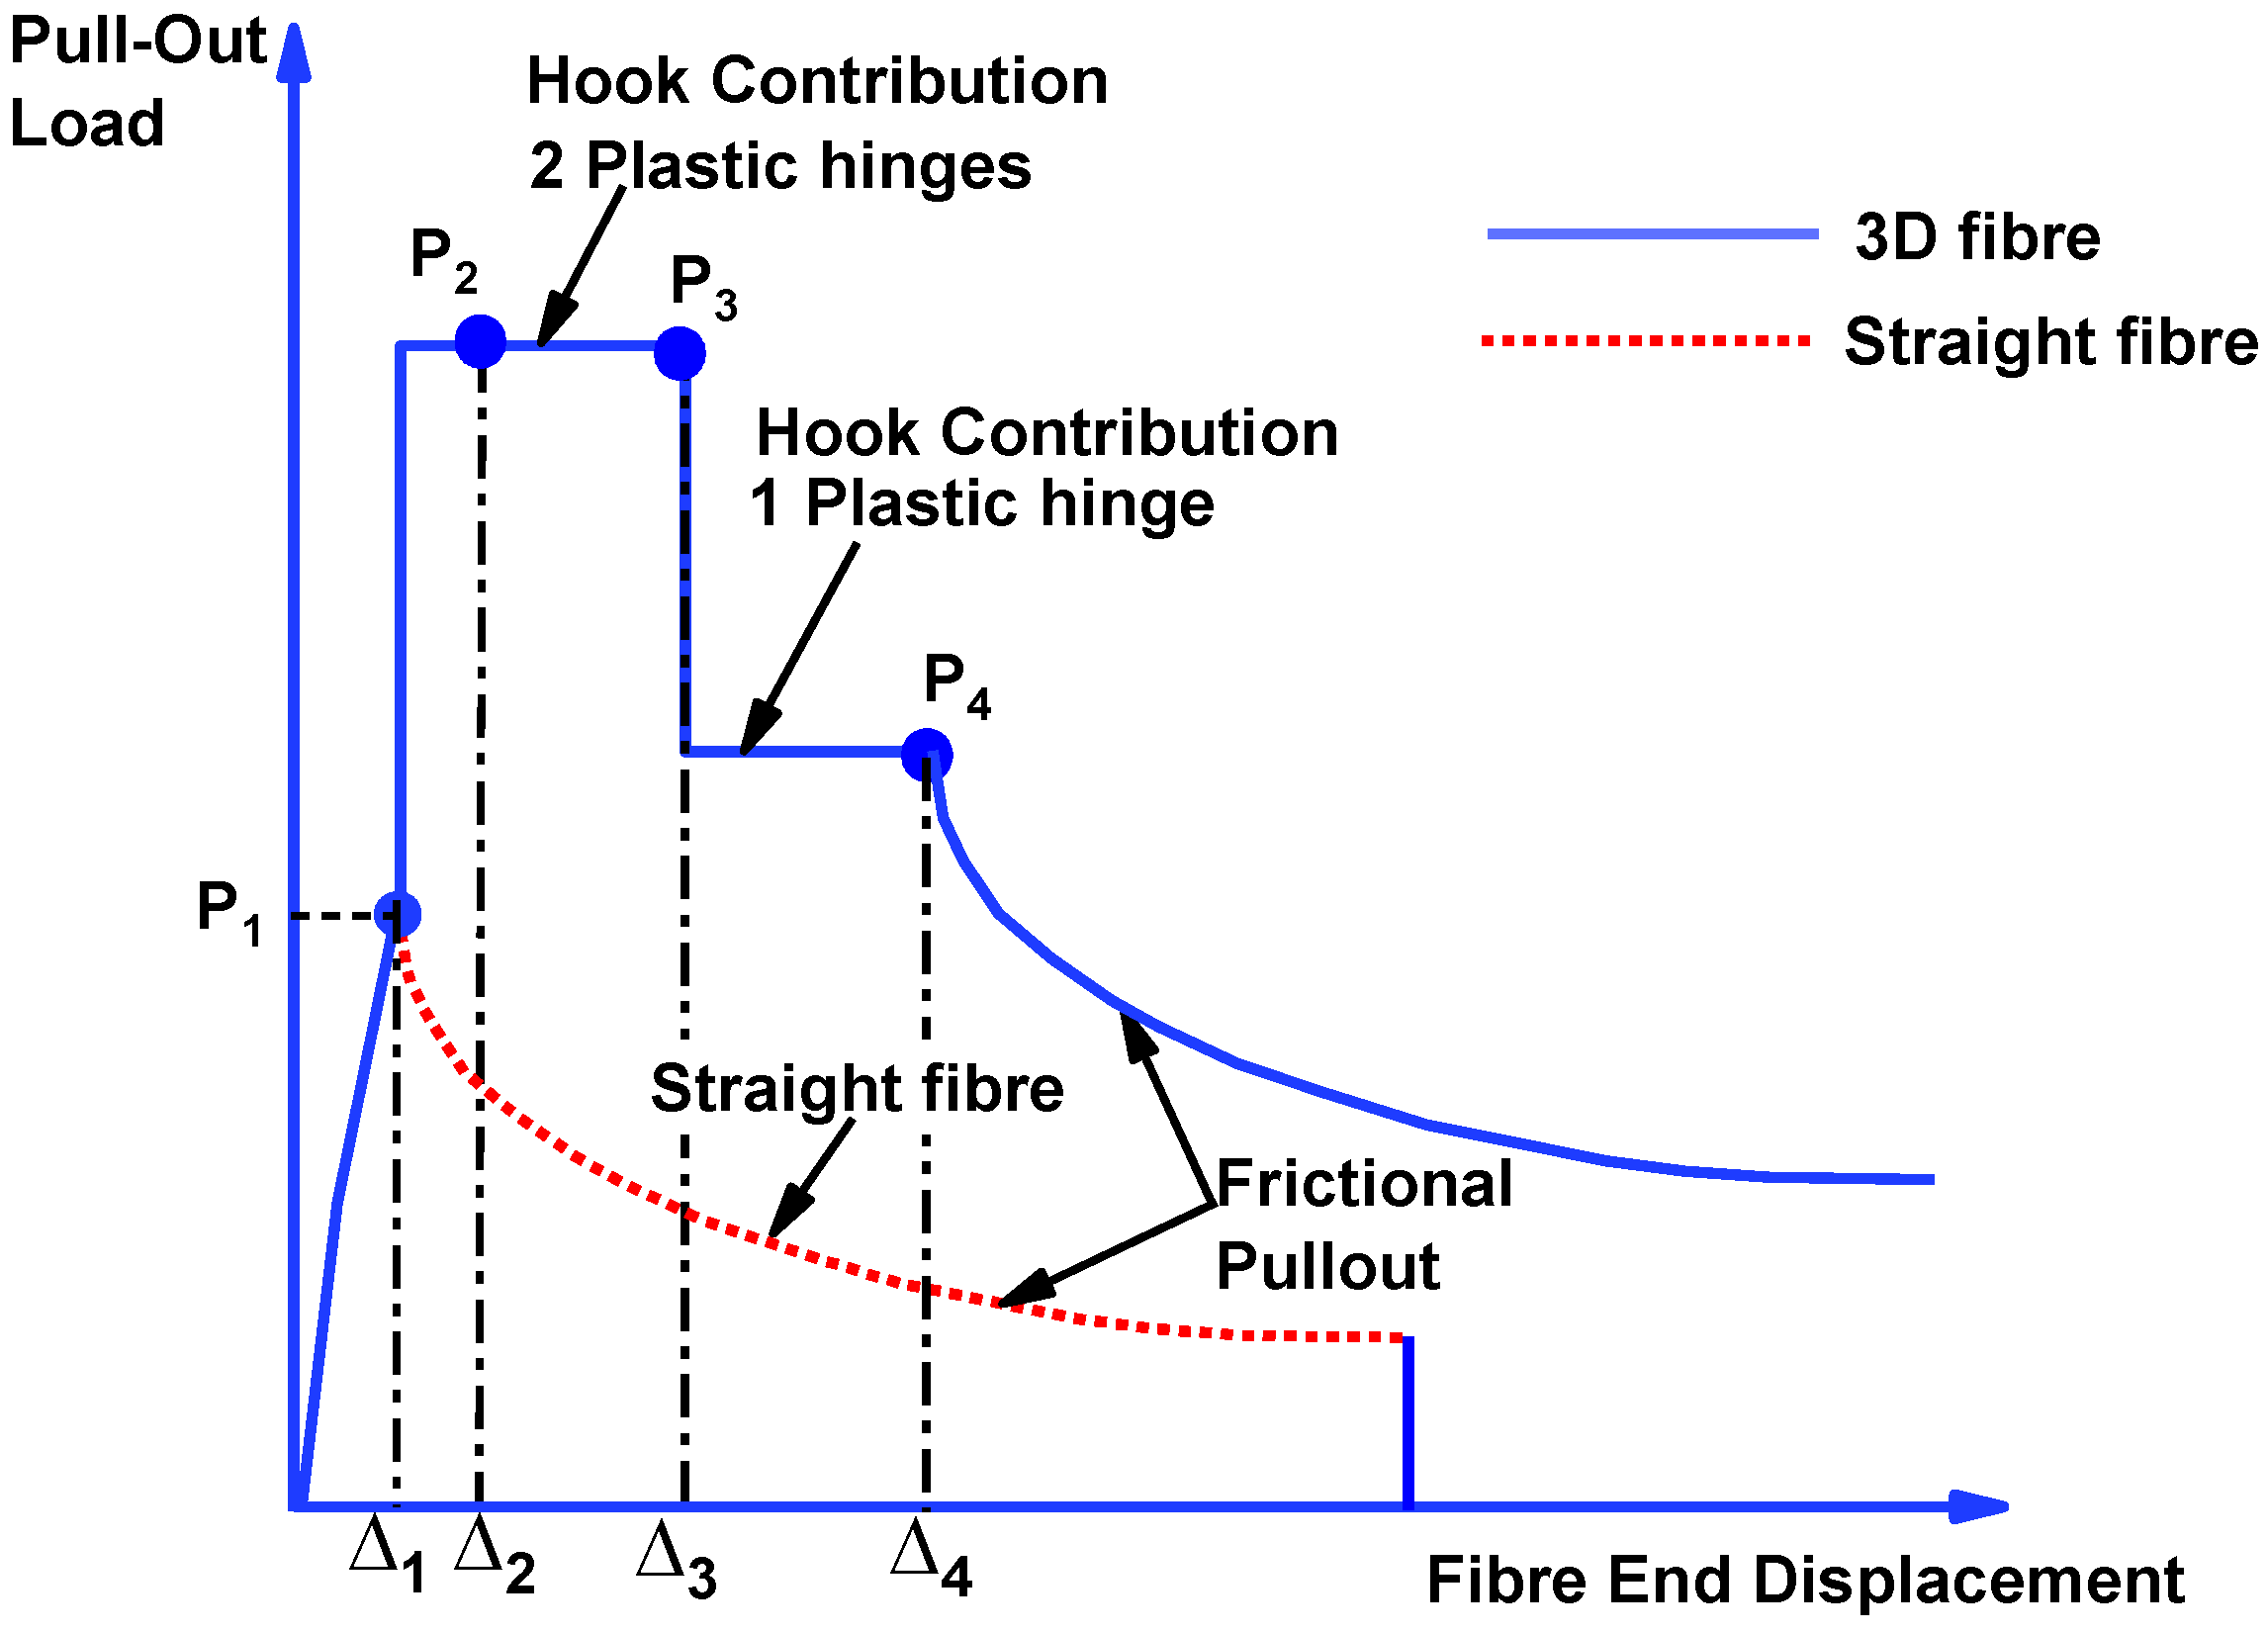
Initially, the load is resisted by the elastic shear stress at the fibre–matrix interface. As the load increases, debonding initiates and gradually propagates along the fibre, causing the load to be resisted by a combination of elastic shear and interfacial frictional stresses. With further increase in load, the fibre becomes fully debonded, and the resistance transitions entirely to interfacial frictional stress, as seen in Figure 5a. At this point, the load reaches the peak resistance of the straight fibre, marked as P1 in Figure 6, where it is described through a schematic sketch showing the theoretical pullout curve for a 3D SMA hooked-end fibre.

3.2. Stage II—Mechanical Anchorage Stage

Once the fibre is fully debonded, mechanical anchorage begins as the superelastic fibre undergoes deformation at the hooks, as illustrated in Figure 5b,c. As the fibre is pulled out, the end hooks straighten to slide through the matrix tunnel. The fibre makes plastic hinges (PH) at locations where there is abrupt change in the fibre print (tunnel) direction, where the fibre undergoes large deformations. Initially, the fibre will have two plastic hinges, PH1 and PH2 (Figure 5b), and only one plastic hinge remains at a later portion of mechanical anchorage stage. At this stage, unlike steel fibers, the free end of the superelastic SMA fibre experiences significant elongation due to the lower initial modulus of elasticity of the SMA. The axial deformation of the straight portion of the fibre can be calculated from the stress–strain curve, following the determination of the load using the relevant equations.

3.3. Stage III—Frictional Pullout Stage

In this stage, the hooked end has been fully extracted from the matrix tunnel, and the pullout behaviour follows a similar decaying pattern to that of a straight fibre (Figure 5d). The load is resisted by the interfacial frictional stress until the fibre is fully pulled out of the matrix.

3.4. Mathematical Derivation

The developed analytical model is based on the theoretical pullout curve proposed by Alwan, et al. [18]. A schematic sketch of the model for the pullout load versus fibre end displacement is presented in Figure 6. The portion of the graph from the beginning of the test to P1 can be considered to follow the load-slip relationship of straight fibres developed by Naaman, et al. [19]. Although the Naaman, et al. [19] model was developed for steel fibres, the model can be used for superelastic SMA fibres assuming that the straight superelastic fibre does not reach the loading plateau stress. This assumption is practical, as the straight fibre’s stress at maximum pullout resistance is significantly less than the transformation stress [9,10,12]. Thus, P1 can be calculated using Equations (1) and (2) [19]. In both equations, ψ represents the fibre perimeter; ∆0 represents the relative slip of the fibre after full debonding (can be taken equal to the slip at maximum load); τf is the frictional bond stress at the fibre’s matrix interface; and l is the fibre’s embedment length. Vf and Vm are Poisson’s ratios for the fibres and matrix respectively. Ef and Em are the modulus of elasticity of the fibresand matrix, respectively, and δ0 represents the fibre–matrix misfit at the onset of the dynamic mechanism, according to Naaman, et al. [19].
P 1 = ψ τ f ( Δ 0 ) ( l Δ 0 )
τ f ( Δ 0 ) = 1 exp 2 v f μ l E f r f ( 1 + v m ) E m + ( 1 v f ) E f δ 0 E f π r f ψ l v f
After complete debonding, the mechanical anchorage becomes effective with the 3D fibre forming two plastic hinges. The mechanical contribution can be added to P1, resulting in a plateau load between P2 and P3 (Figure 6). At P3, the embedded end of the fibre is pulled out at a distance equal to L2, as shown in Figure 5c. As observed in the experimental results, during plastic hinge formation, unlike steel fibres, the free end of the SMA fibre undergoes significant elongation due to the lower initial modulus of elasticity of the SMA. Thus, the fibre end displacements ∆2 and ∆3 (corresponding to P2 and P3) are a combination of slip and axial deformation. This implies that when the load reaches P2 (Figure 5b), the slip is equal to U, and the free end displacement ∆2 is the sum of the slip U and the axial deformation (δ) of the straight portion of the fibre, as shown in Equations (3) and (4). The axial deformations can be determined from the stress–strain diagram of the SMA wire (Figure 2) once the loads P2 and P3 are determined.
Δ 2 = U + δ 2
Δ 3 = L 2 + δ 3
P 3 = P 1 + Δ P
P 4 = P 1 + Δ P
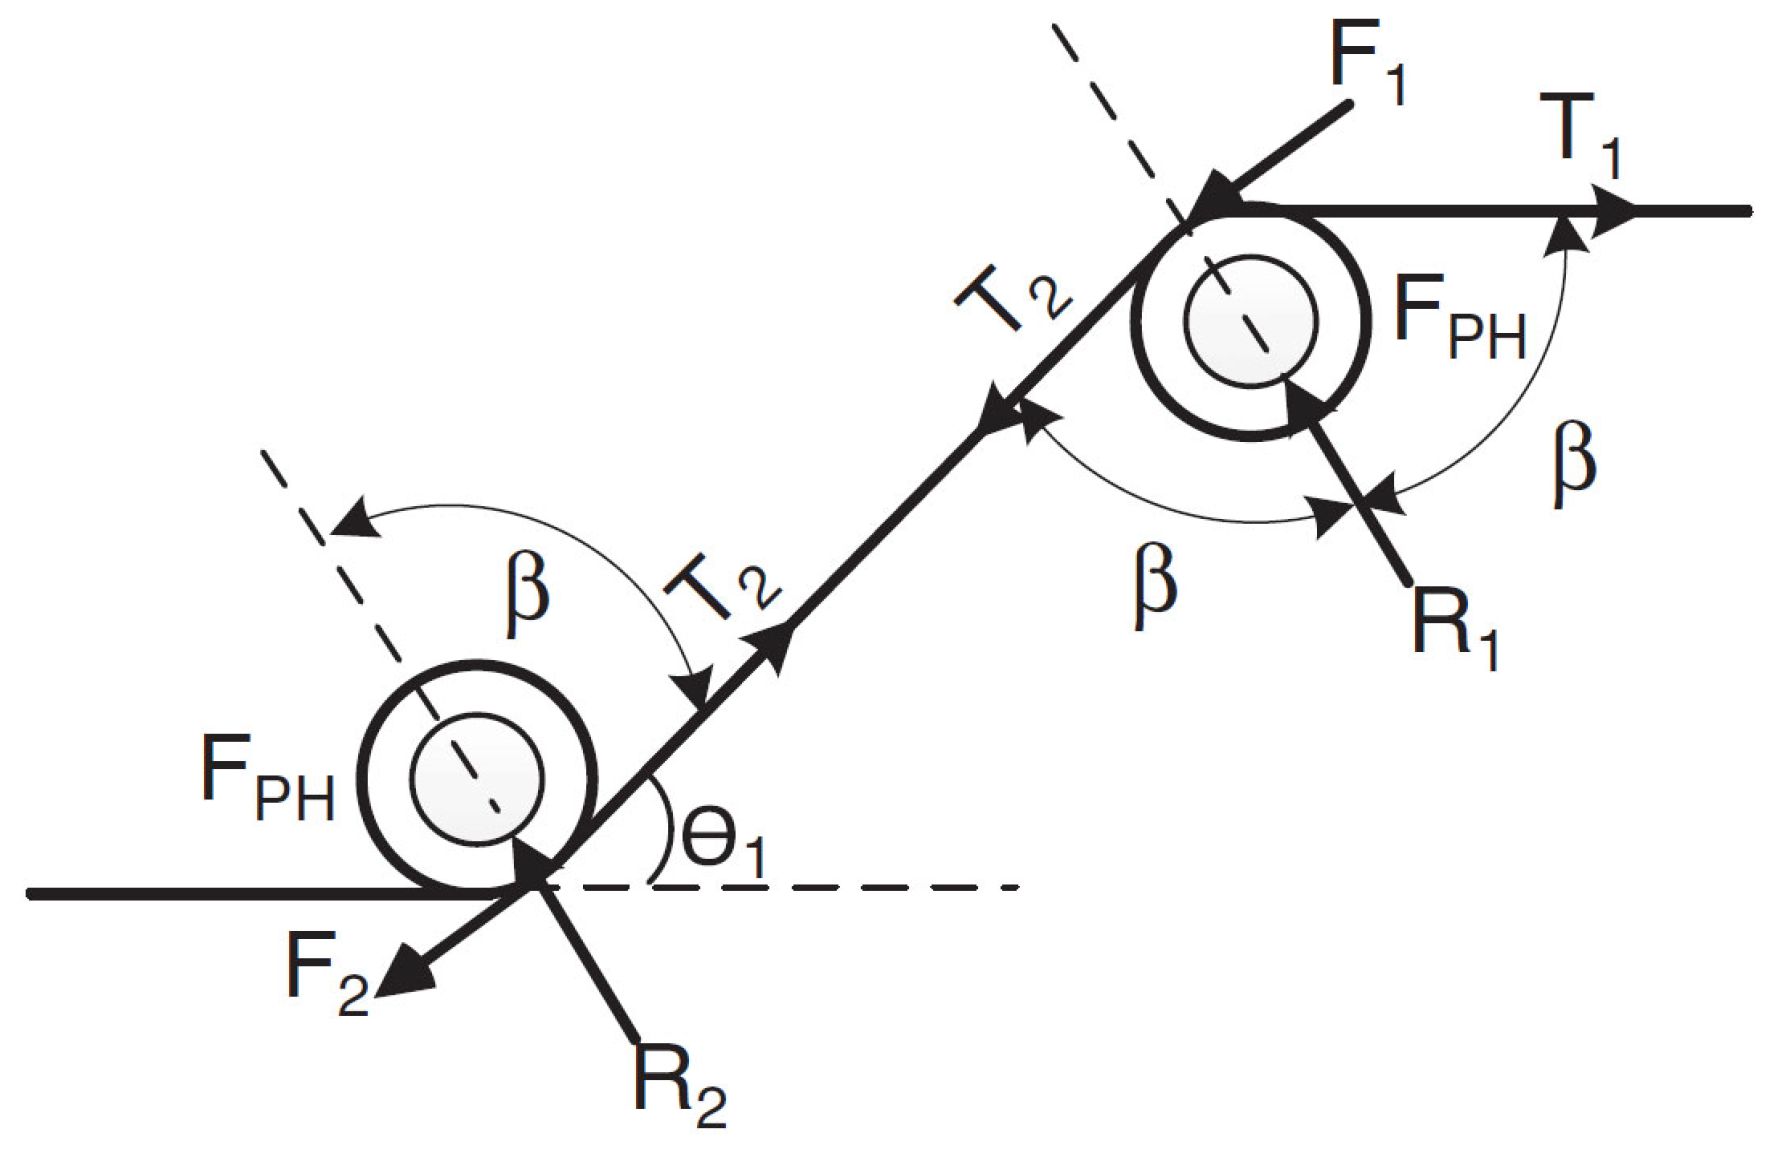
where P1 is the pullout load at the onset of complete debonding; ∆P′ is the pullout load due to two plastic hinges; ∆P″ is the pullout load due to one plastic hinge. The values of ∆P′ and ∆P″ can be determined using an equivalent frictional pully model proposed by Alwan, et al. [18], shown in Figure 7. The 3D fibre model consists of two frictional pulleys, each one with rotational (FPH) and tangential (F1 and F2) components. The rotational frictional component corresponds to the force needed to straighten the fibre at the plastic hinge locations. While the tangential component is the Coulomb friction between the fibre and the matrix at the contact corner during fibre straightening. T1 and T2 correspond to the chord tension prior to and after the first pulley, respectively. Thus, T1 and T2 can be equated to the pullout loads due to one and two plastic hinges (Equations (7) and (8)). The tangential forces F1 and F2 are the product of the kinetic frictional coefficient (µ) and reaction forces R1 and R2, respectively (Equations (9) and (10)).
T 1 = Δ P
T 2 = Δ P
F 1 = R 1 μ
F 2 = R 2 μ
Furthermore, equilibrium can be used to express T1 and T2 in terms of rotational and tangential components (Equations (11) and (12)).
T 1 = 2 F P H + F 1 + F 2
T 2 = F P H + F 2
Also, R1 and R2 can be expressed using Equations (13) and (14).
R 1 = T 1 cos β + T 2 cos β
R 2 = T 2 cos β
Substituting Equation (13) into Equation (9) and Equation (14) in Equation (10) yield to Equations (15) and (16), respectively.
F 1 = μ   cos β   [ T 1 + T 2 ]
F 2 = μ     cos β   [ T 2 ]
Substituting Equation (16) into Equation (12) and rearranging results to Equation (17).
T 2 = F P H 1 μ cos β
Similarly, substituting Equations (15) and (16) into Equation (11) yields to Equation (18).
T 1 = 2 F P H + μ     cos β   [ T 1 + T 2 ] + μ     cos β   [ T 2 ]
And substituting Equation (17) into Equation (18) and rearranging gives us Equation (19).
T 1 = 2 F P H 1 + μ cos β 1 μ cos β 1 μ cos β
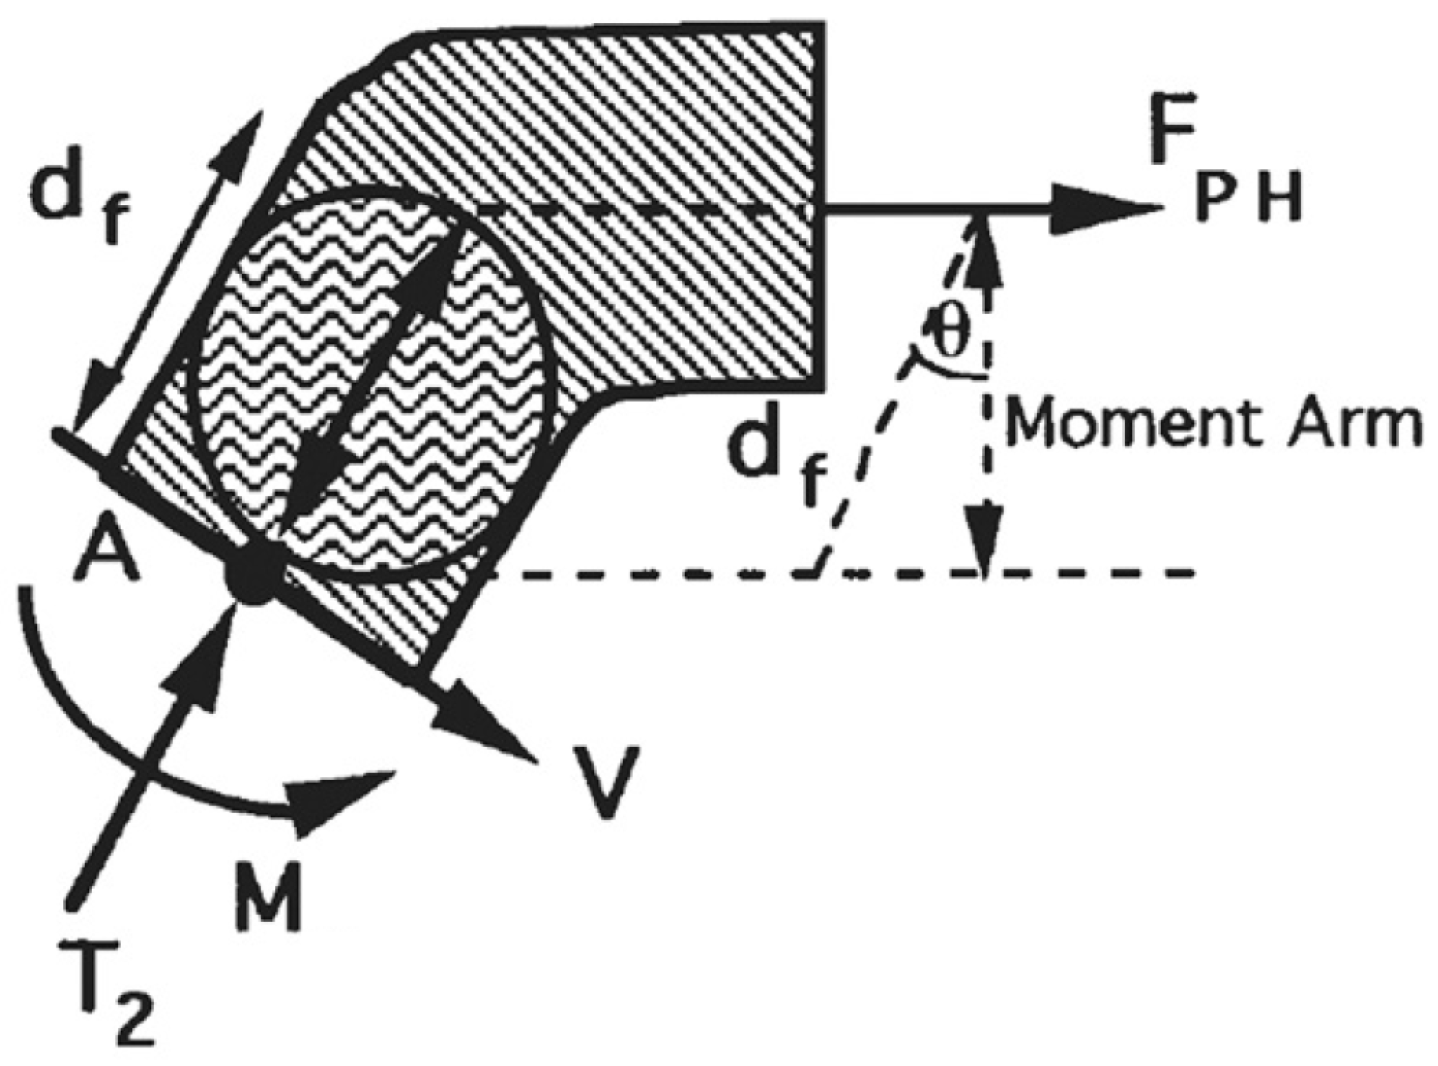
Alwan, et al. [18] proposed using the free-body diagram of the fibre section at the plastic hinge location to quantify the value of FPH, as illustrated in Figure 8. By summing up the moments at point A in Figure 8, we arrive at Equation (20), where df represents the fibre diameter and M is the moment developed in the fibre at the hinge location. Thus, Equation (20) can be rearranged to determine the value of FPH once the moment resistance of the fibre is computed.
M = F P H   d f   cos θ  

Moment Resistance of a Superelastic Fibre

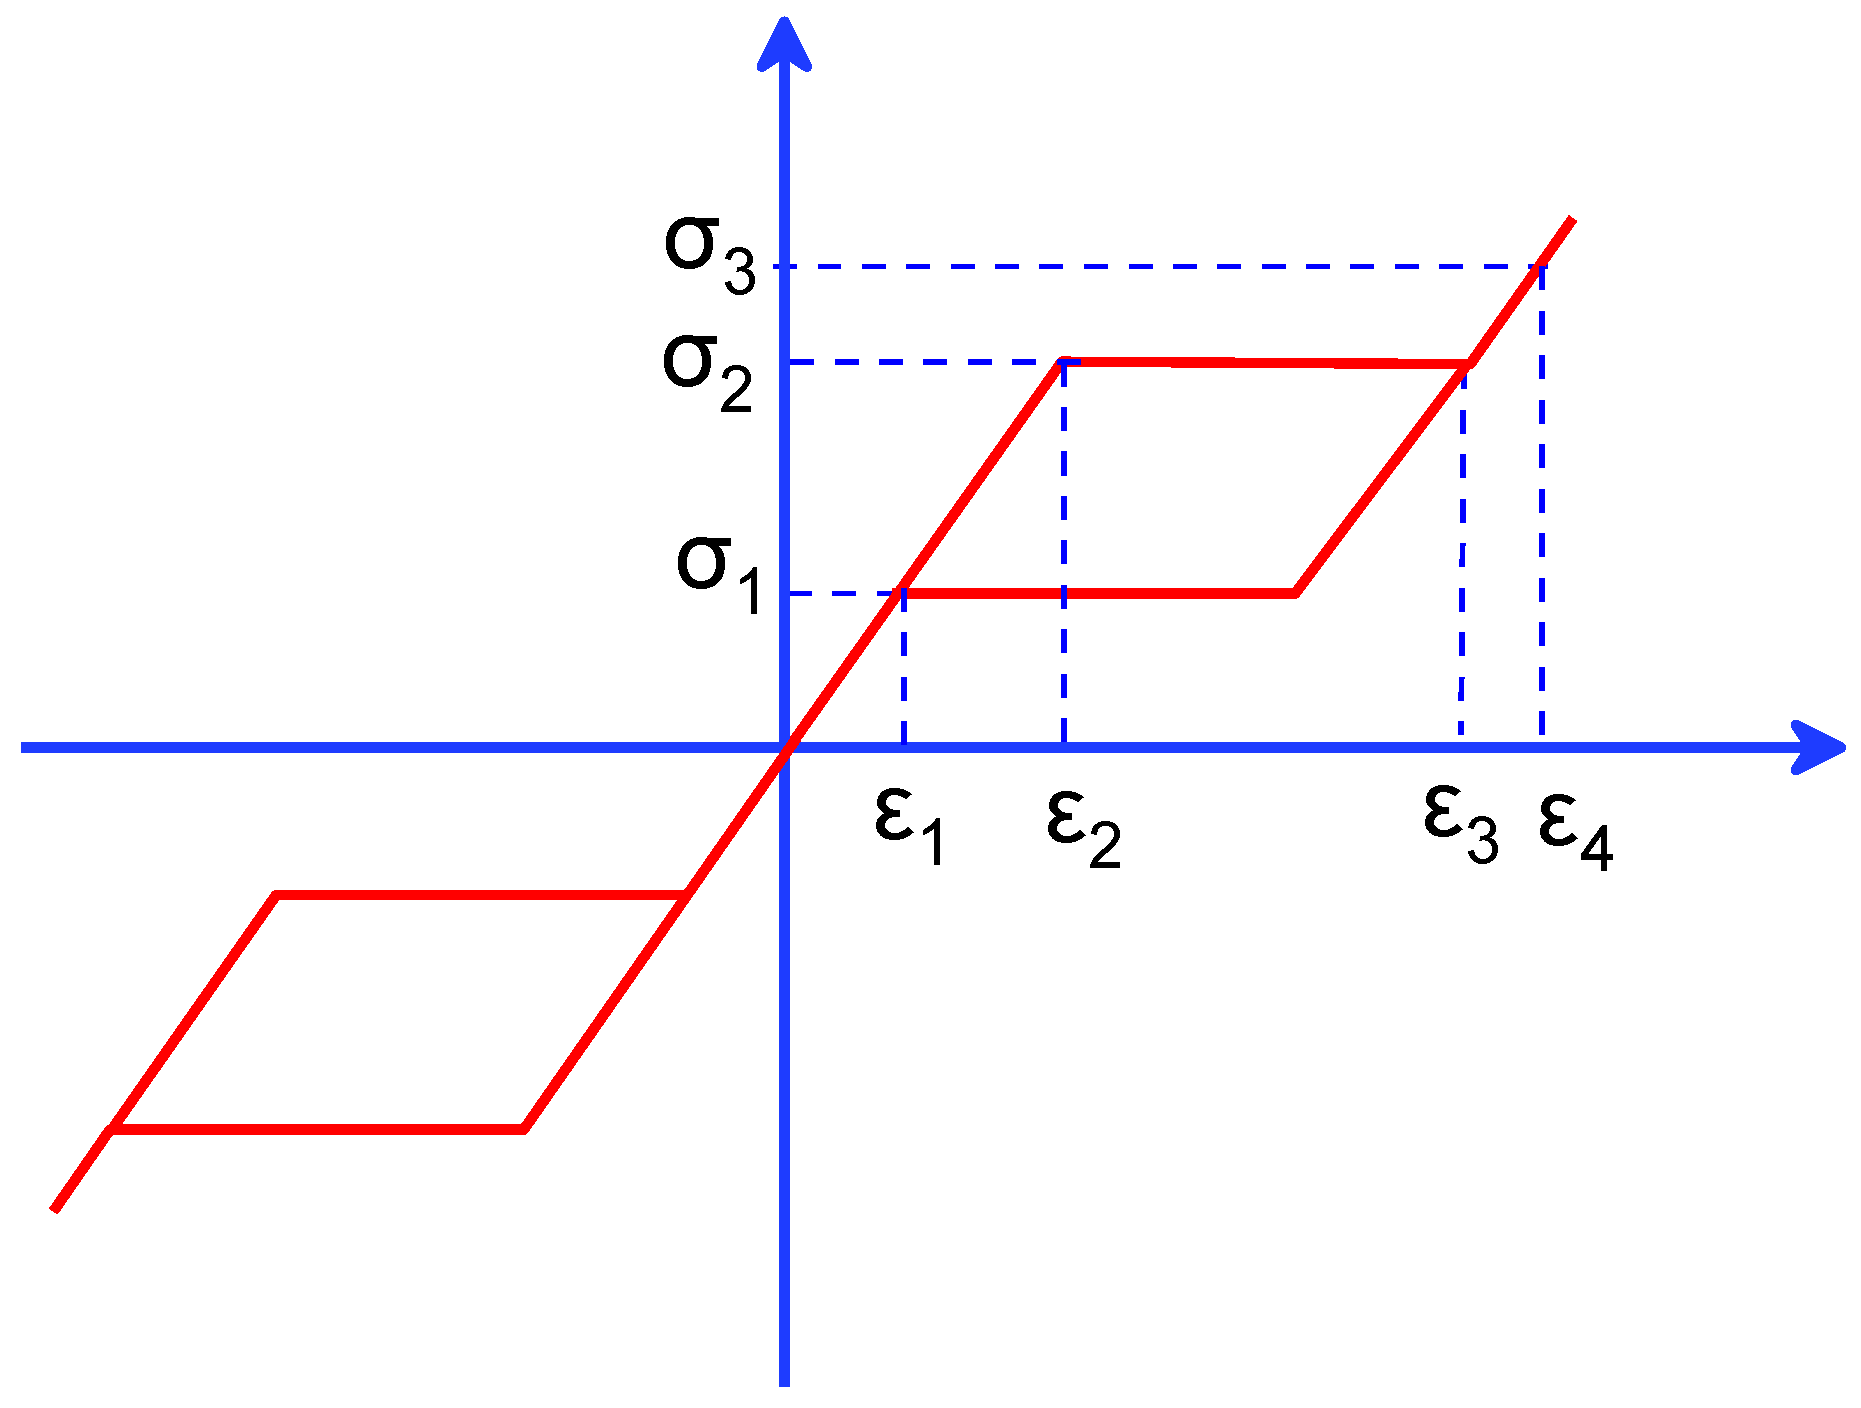
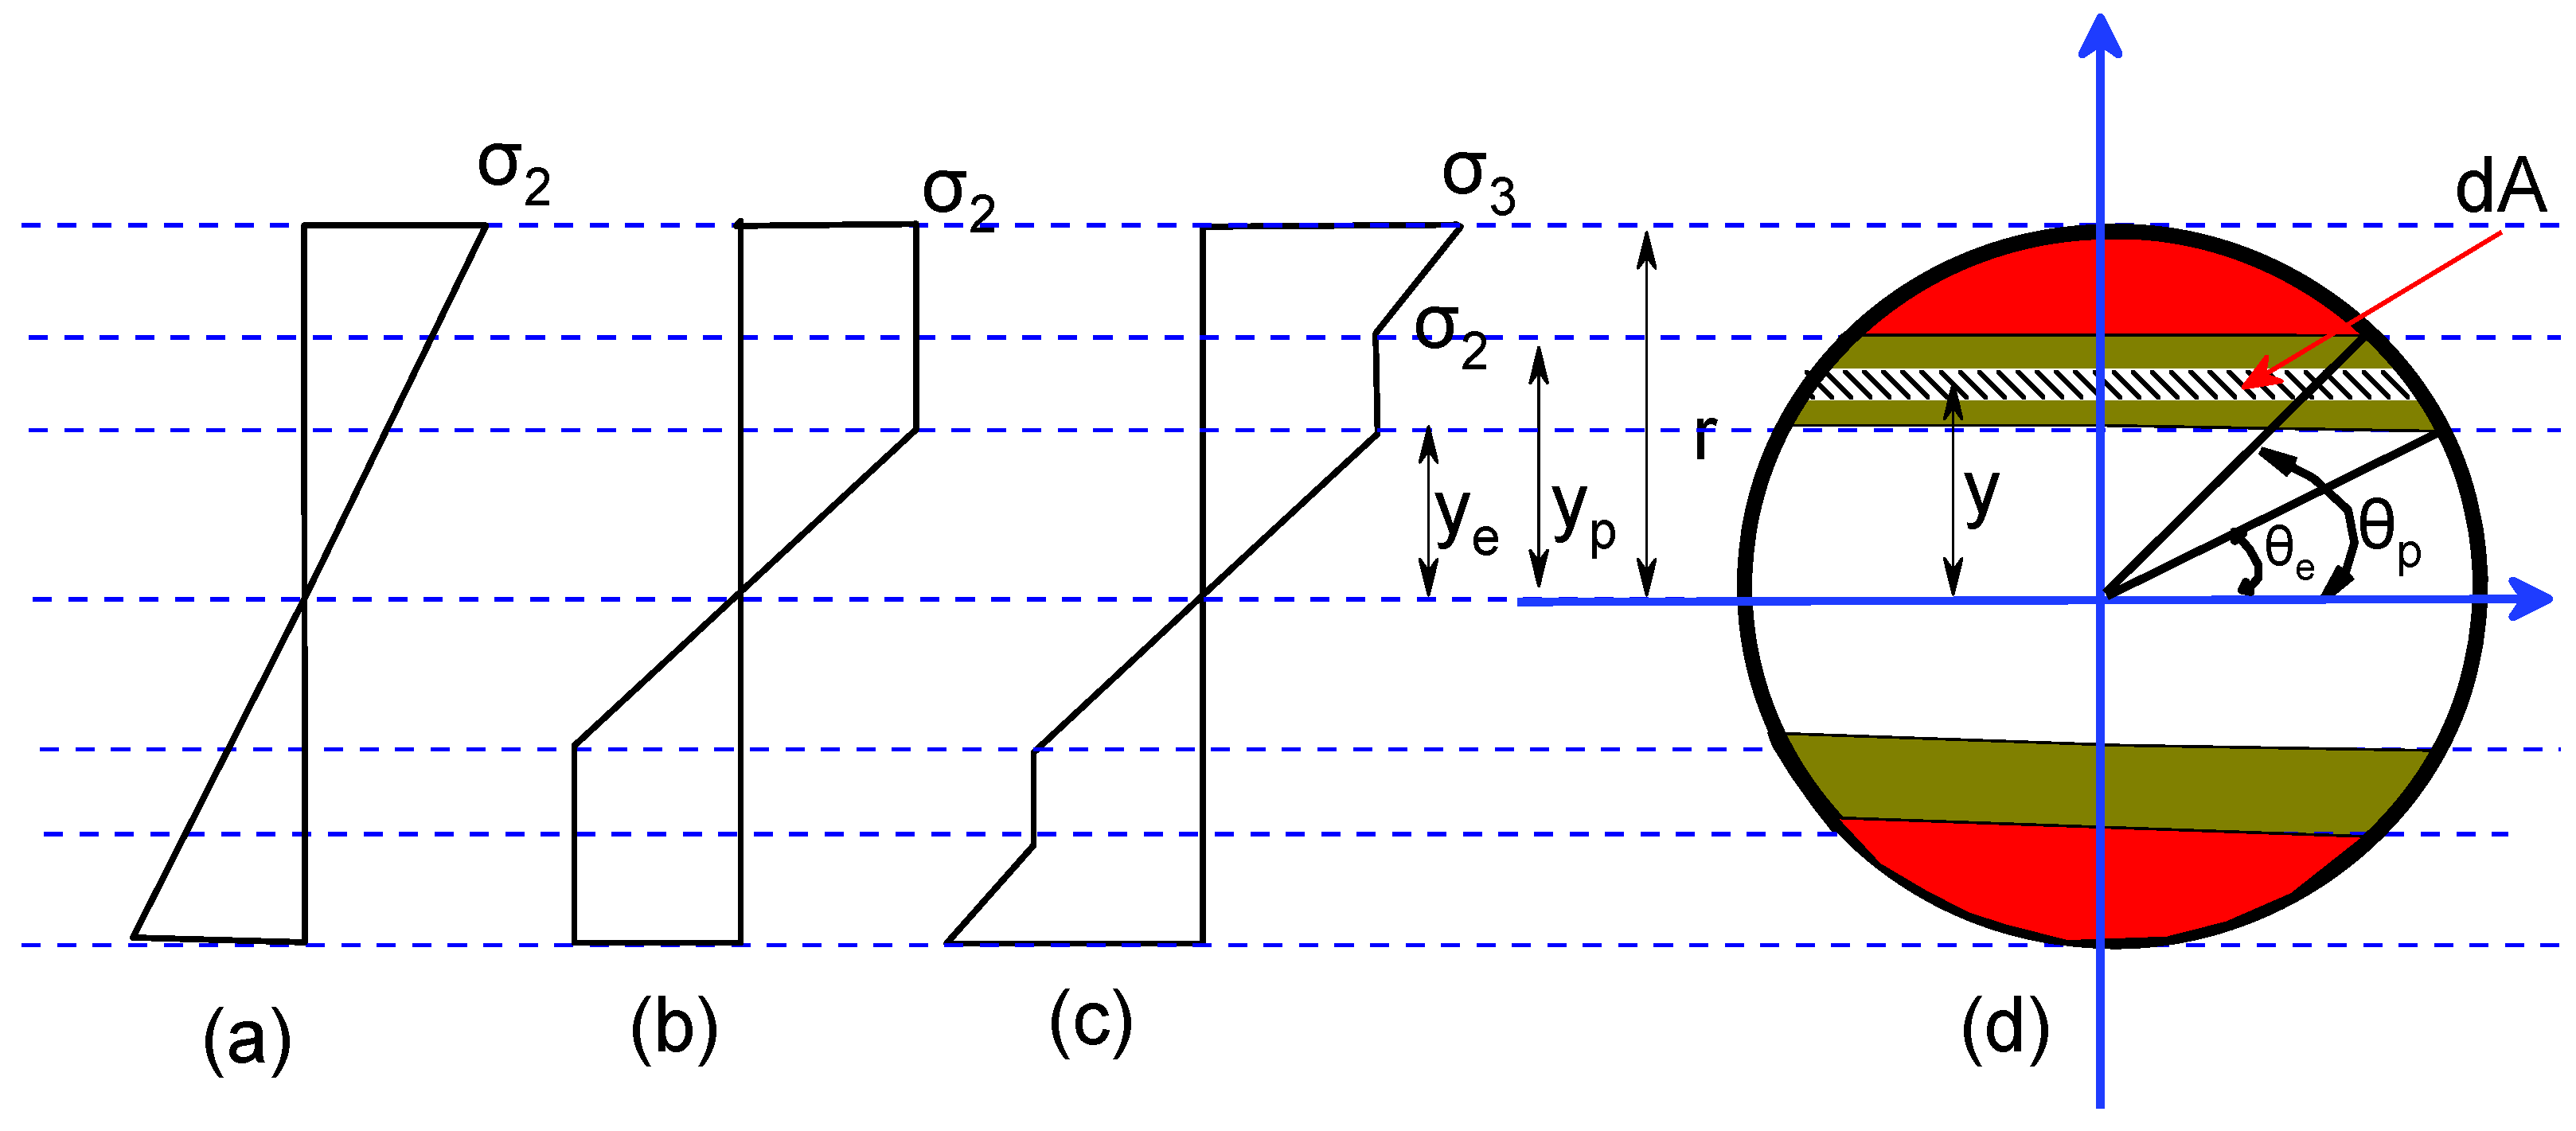
The main contribution of this paper is using stress–strain distribution in a superelastic wire section to drive for the moment resistance. To evaluate the pullout resistance of pseudo-elastic fibres, it is essential to first assess the elastic–superelastic strain distribution within the hook bends. A simplified model, as shown in Figure 9, can be derived from the uniaxial stress–strain curve of a superelastic wire [20]. In the initial loading phase, stress increases linearly until reaching the forward transformation stress, denoted as σ2, after which a stress plateau is formed. Yielding begins at the point (σ2, ε2) and continues until (σ2, ε3). Beyond this point, further increase in stress results in a linear increase, as the superelastic material enters the martensitic phase, reaching (σ3, ε4) [12]. The fibre can be modelled as a beam under bending, where plane sections prior to bending remain plane in the deformed state. The stress distribution in a circular superelastic beam subjected to a uniform bending moment, M, is illustrated in Figure 10 [20]. At the elastic stage, shown in Figure 10a, the stress distribution reaches the loading plateau or yield stress at the top and bottom edges of the fibre section, defining what is referred to as the elastic moment. In the elastic–plastic stage, illustrated in Figure 10b, the yield moment penetrates deeper into a portion of the section. As the stress surpasses σ2, the fibre cross-section divides into three regions: an elastic core, a plastic layer, and an outer superelastic portion, as shown in Figure 10c,d. The total moment resistance is derived by summing the contributions from each of these three regions. A generalized derivation for calculating the moment resistance of a superelastic fibre under the elastic–plastic-superelastic stage is presented below.
Moment contribution from the elastic portion; 0 ≤ yye
σ ( y ) =   σ 2 y e y   = σ 2 r s i n ( θ e ) y
M e =   y e y e σ ( y )   y   d A =   2 0 y e σ ( y )   y   d A
d A =   2 r 2 y 2 d y
σ ( y ) =   σ 2 r sin ( θ e ) y
M e =   4 σ 2 r sin ( θ e ) 0 y e y 2 r 2 y 2 d y
where y =   r sin θ ,   d y = r cos θ d θ
M e =   4 σ 2 r 3 sin ( θ e ) 0 θ e sin 2 θ cos 2 θ d θ
M e =   σ 2 r 3 2 sin ( θ e ) θ e sin ( 4 θ e ) 4
Moment contribution from the plastic portion yeyyp
M p =   2 y e y p σ 2 y   d A
M p =   4 σ 2 r 3 θ e θ p sin θ cos 2 θ d θ
M p = 4 σ 2 r 3 3 ( cos 3 θ e cos 3 θ p )
Moment contribution from the superelastric portion ypyr
M s e =   2 y p r σ ( y )   y   d A
σ ( y ) =   σ 2 + σ 3 σ 2 r y p   ( y y p )
M s e =   4 y p r σ 2 + σ 3 σ 2 r y p   ( y y p )   y r 2 y 2 d y
M s e =   4 r 3 θ p π 2 σ 2 + σ 3 σ 2 π 2 θ p   ( θ θ p )   sin θ cos 2 θ d θ
M s e =   4 r 3 σ 2 θ p π 2 ( sin θ cos 2 θ d θ ) +   σ 3 σ 2 π 2 θ p θ p π 2 ( θ θ p )   sin θ cos 2 θ d θ  
M s e =   4 r 3 3 σ 2 cos 3 θ p + ( σ 3 σ 2 0.5 π θ p ) ( 2 3 sin θ p sin 3 θ p 3 )
The total moment resistance of the superelastic fibre at a plastic hinge location will be the sum of elastic, plastic and superelastic moment contributions (Equations (37) and (38)).
M = M e + M p + M s e
M     =   σ 2 r 3 2 sin ( θ e ) θ e sin ( 4 θ e ) 4 + 4 σ 2 r 3 3 cos 3 θ e cos 3 θ p +       4 r 3 3 σ 2 cos 3 θ p + ( σ 3 σ 2 0.5 π θ p ) ( 2 3 sin θ p sin 3 θ p 3 )
Once the moment resistance is calculated using Equation (38), the FPH can be obtained from Equation (20). Finally, the values of T1 and T2 can be determined using Equations (17) and (19), respectively. The angles θe and θp represent the penetrations associated with the elastic, plastic, and superelastic regions, as illustrated in Figure 10d. The values of θe and θp depend on the matrix strength and the stress–strain property of the superelastic fibre. The experimental studies by Menna, et al. [12] indicated higher matrix strength and shorter loading plateau stress (smaller difference between ε2 and ε3) will result in a higher penetration of the superelastic zone leading to larger pullout resistance, where a more detailed discussion of the effects of matrix strength and methods to enhance the pullout response of superelastic fibres through cold working followed by heat-treatment is also presented.

3.5. Model for 4D and 5D Hooked-End Fibres

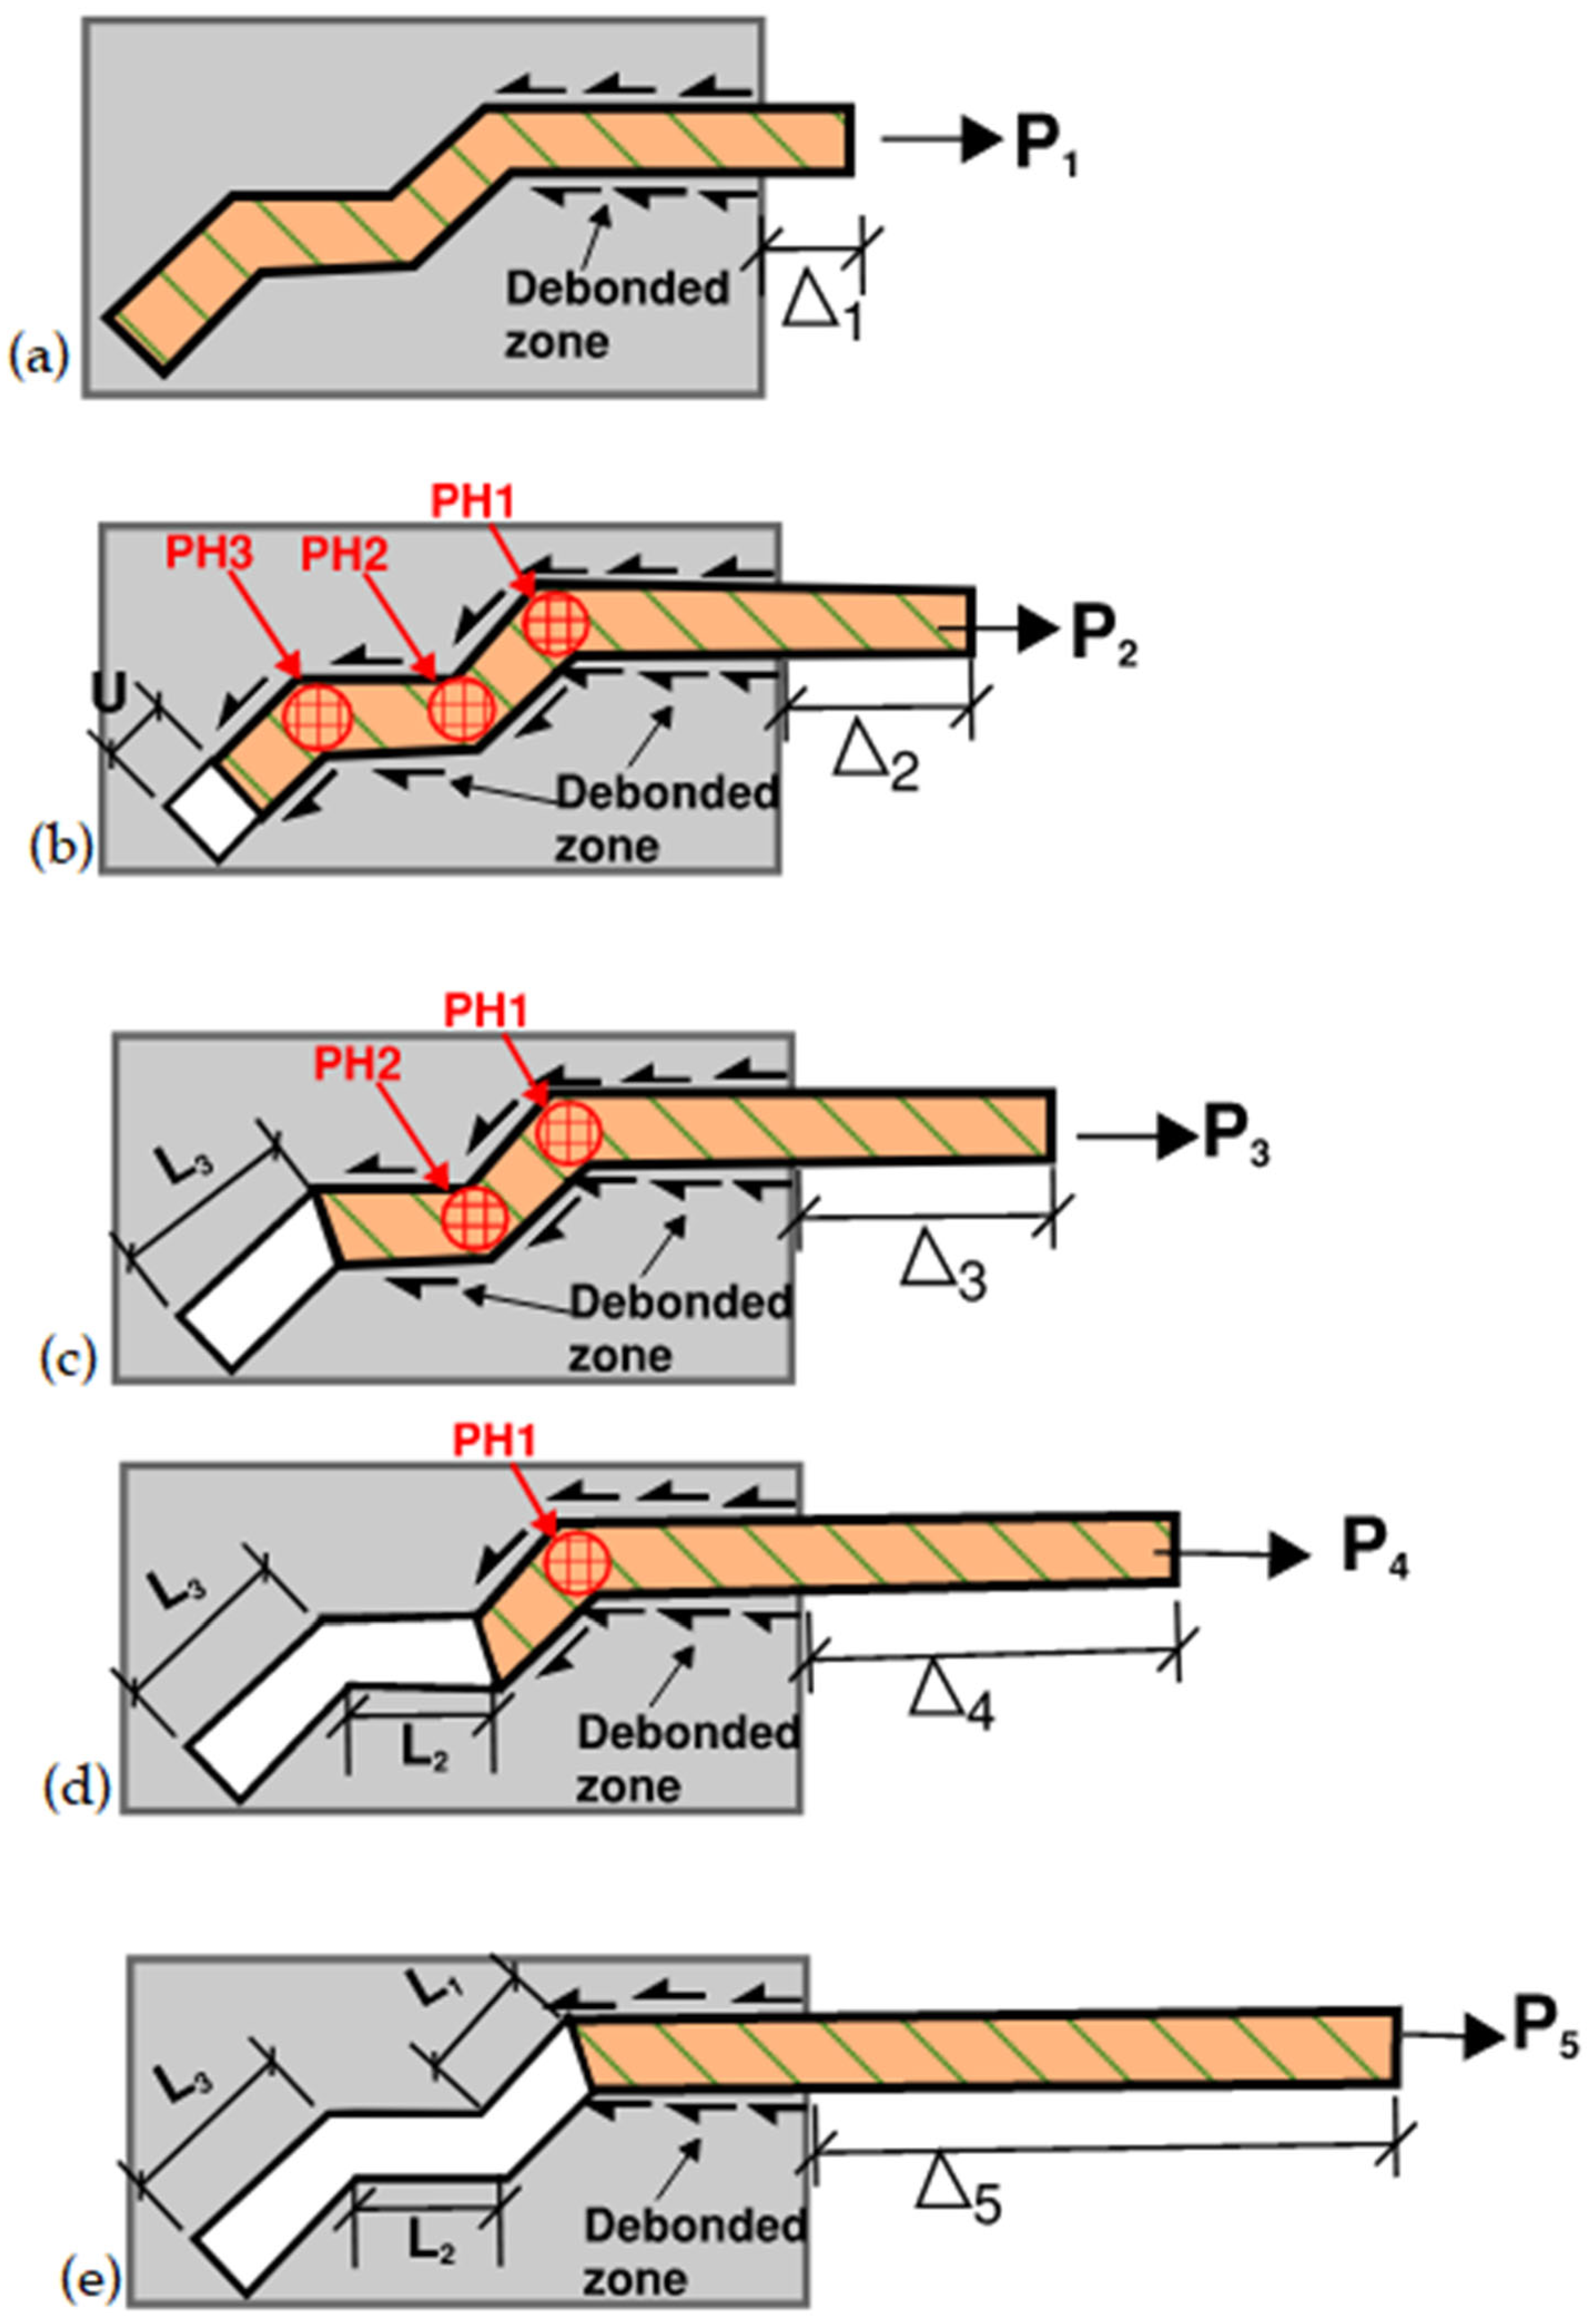
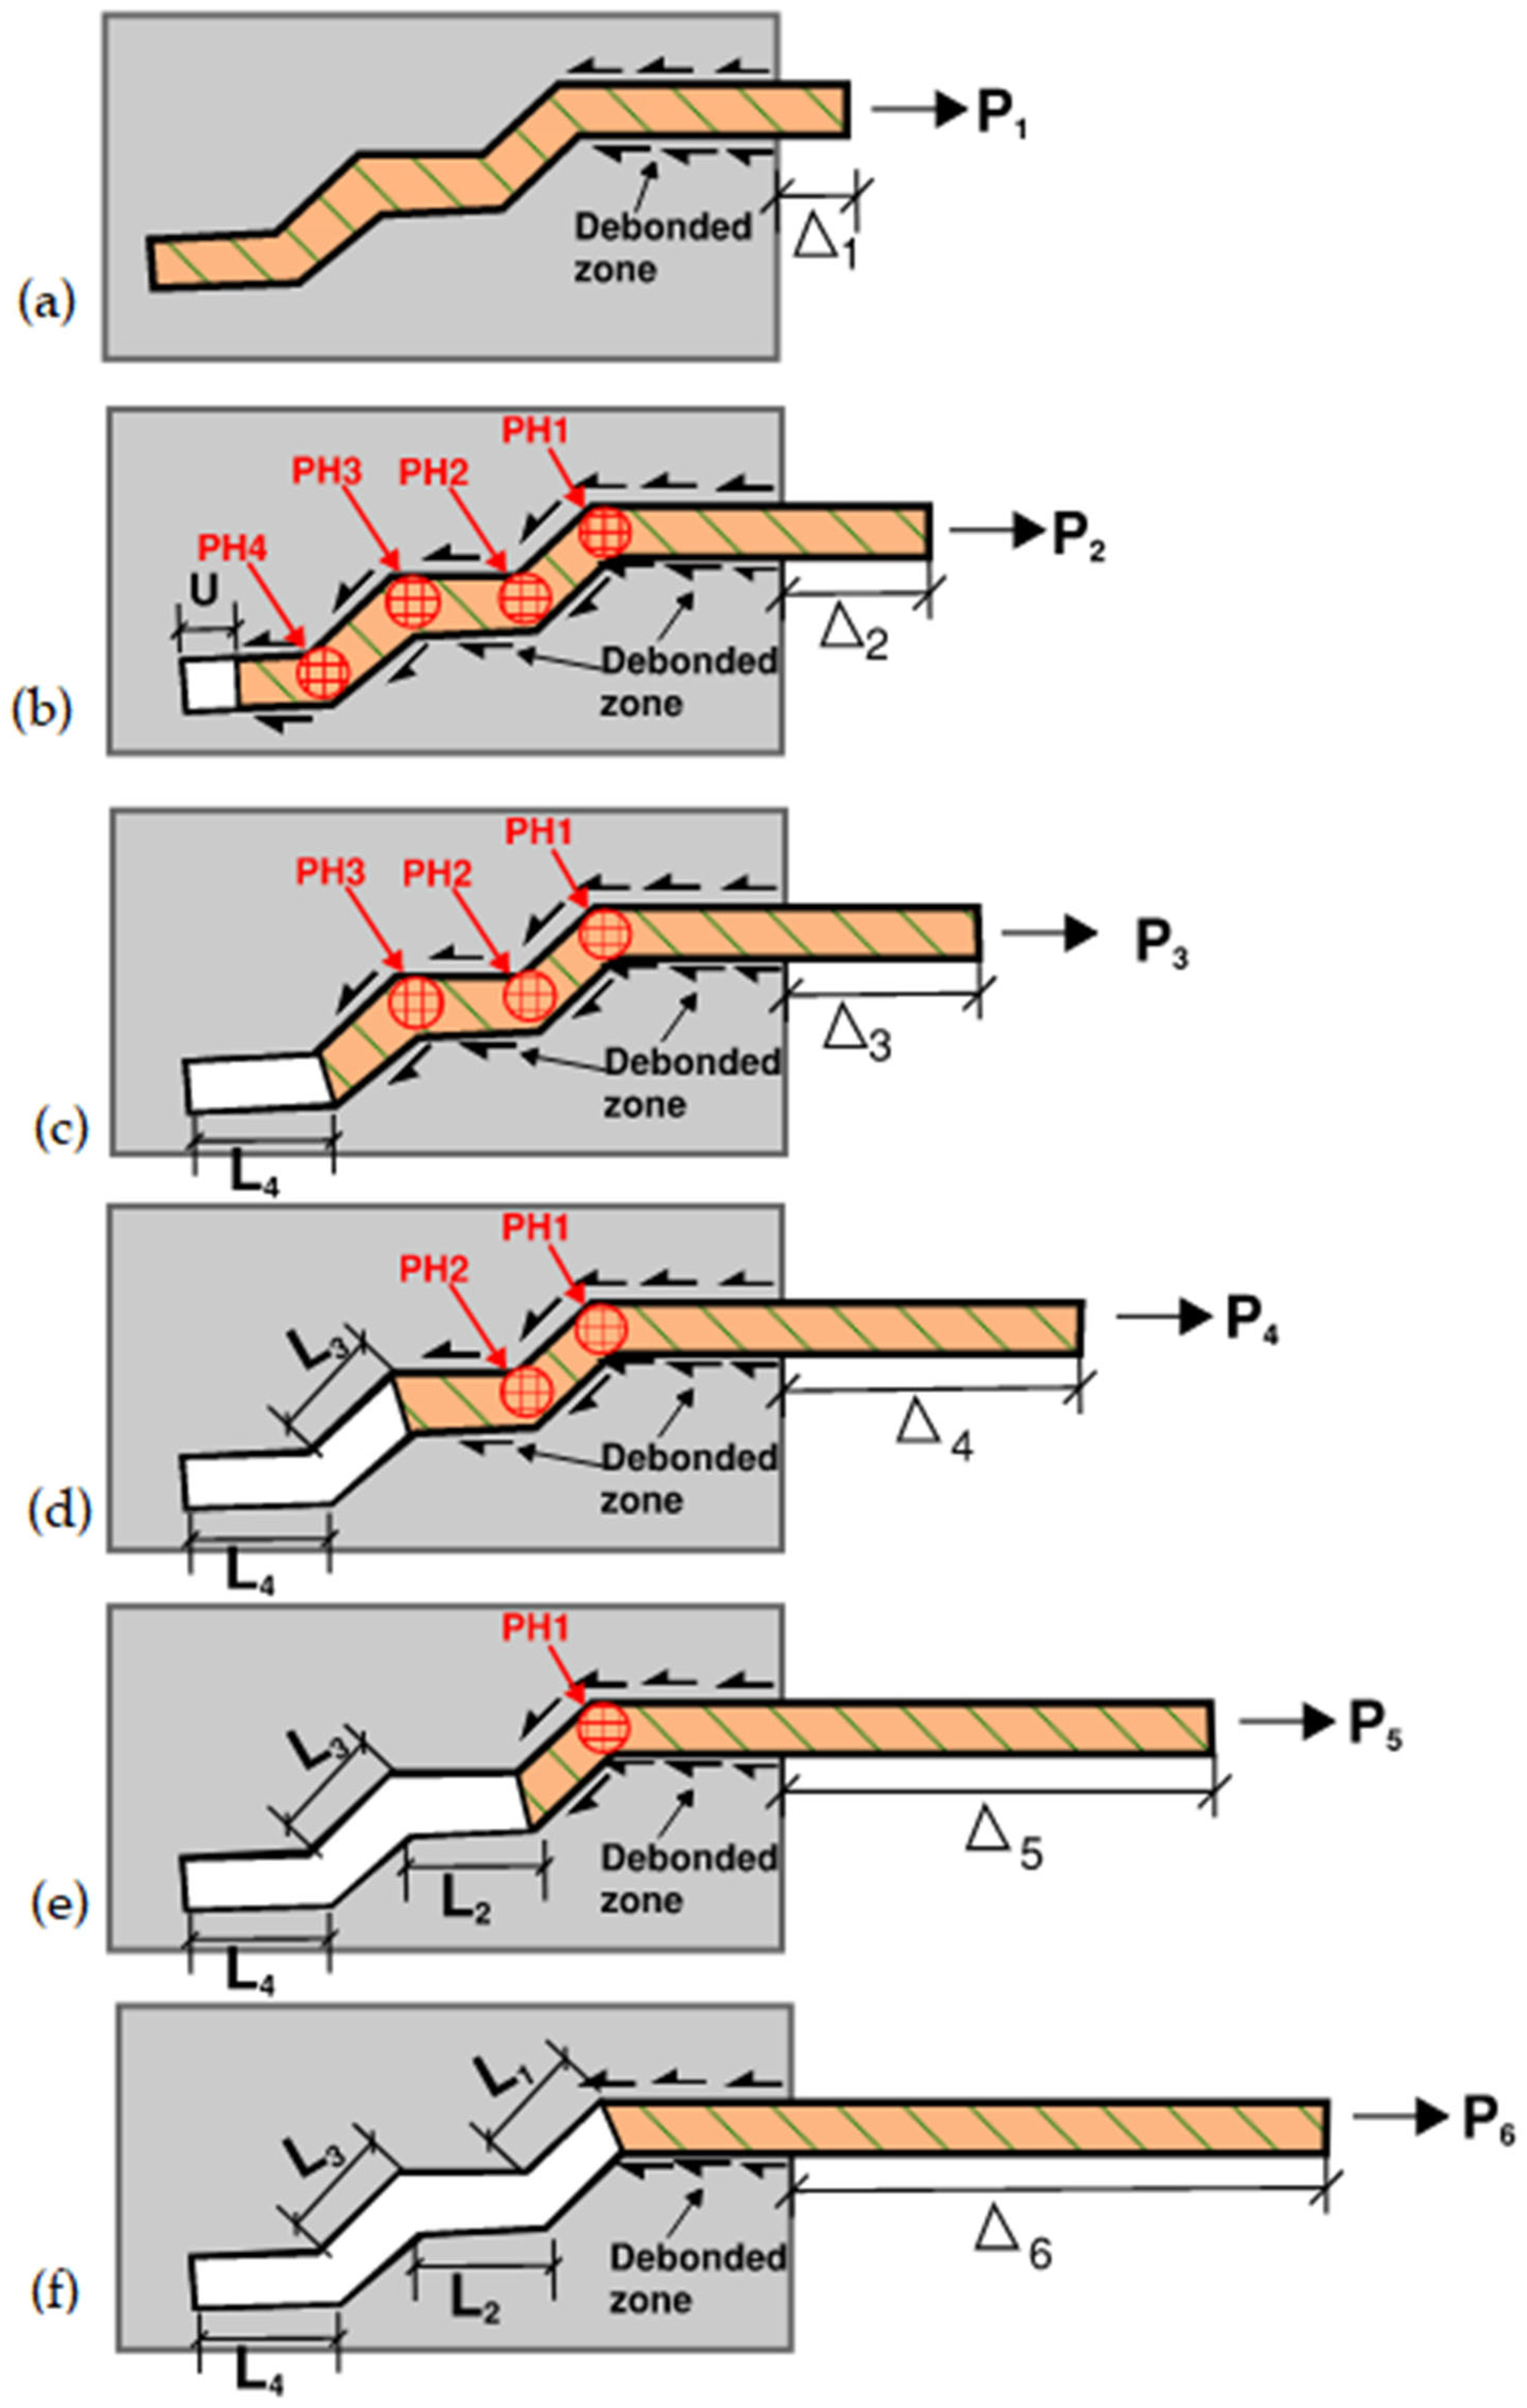
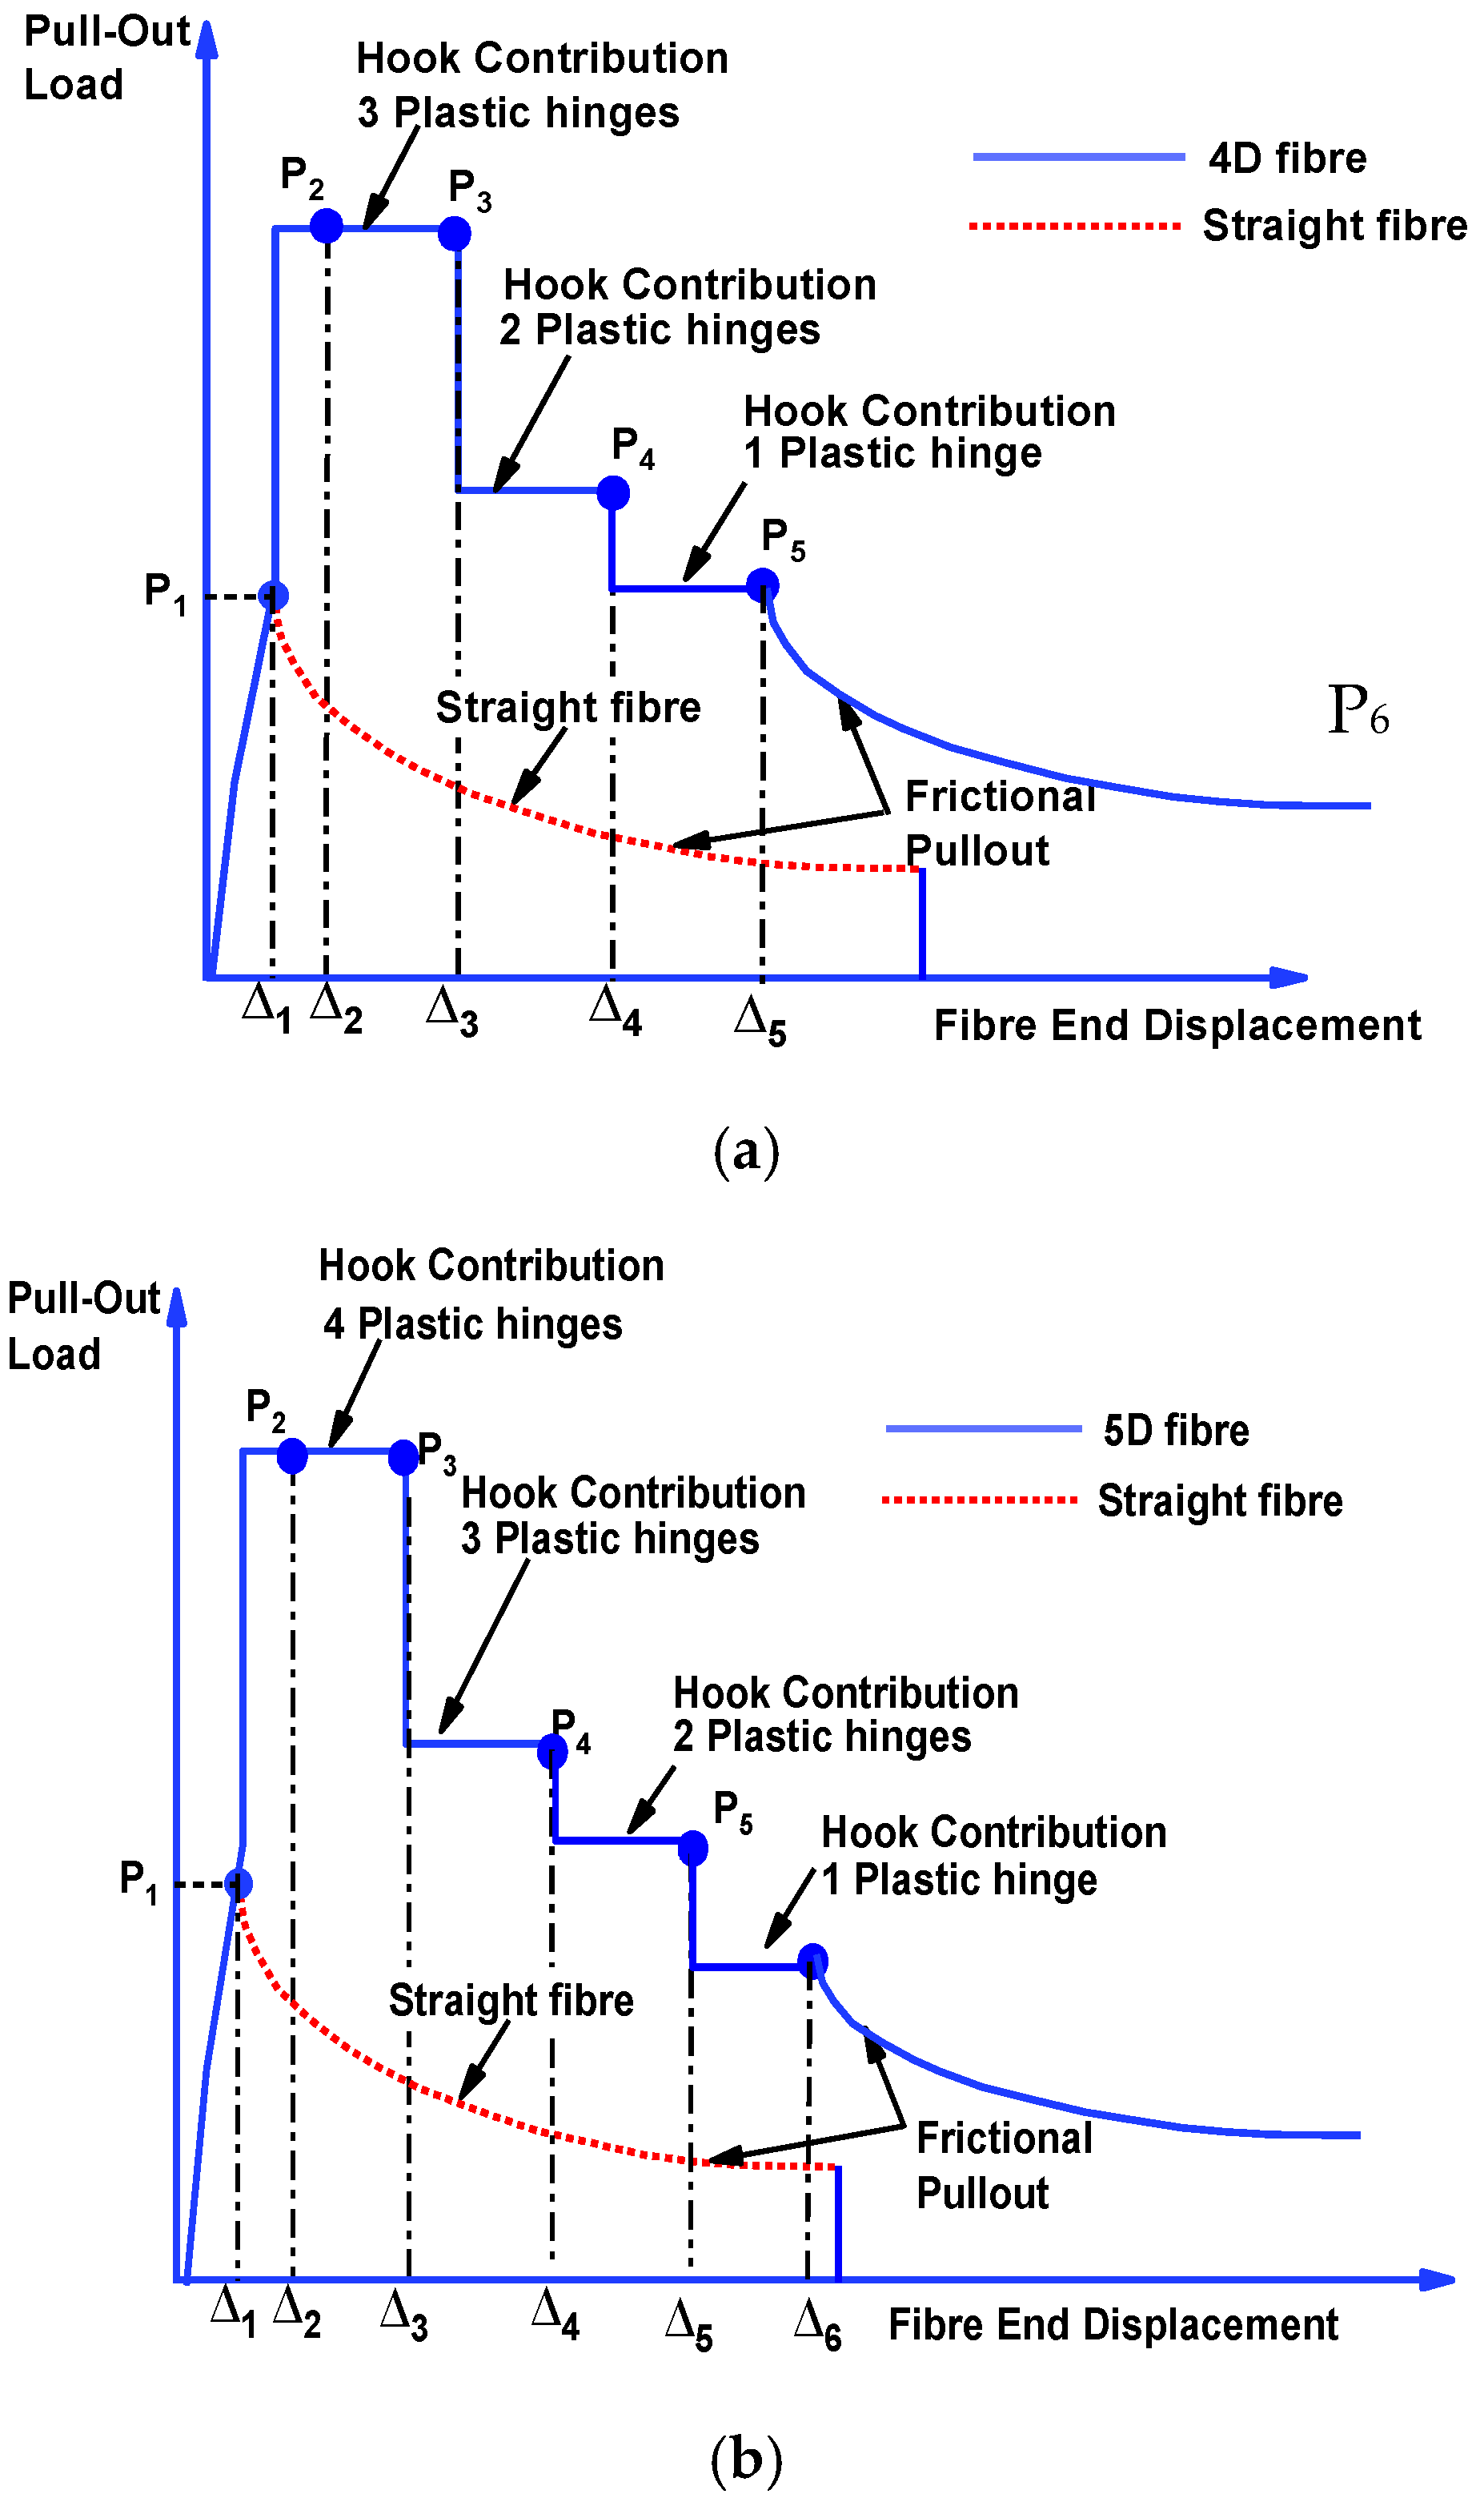
The mathematical derivations for 3D fibres described above can be extended to calculate the pullout response of 4D and 5D fibres, which include additional anchoring bends. Abdallah, et al. [17] proposed an enhanced model that accounts for the anchorage contributions of 4D and 5D hooked-end fibres. Their model builds upon the work of Alwan, et al. [18], which forms the basis for the approach used in this paper. The model proposed by Abdallah, et al. [17] is applied here to compute the contributions of the additional plastic hinges of 4D and 5D fibres. The corresponding pullout stages for these fibres are presented in Figure 11 and Figure 12. It can be seen in Figure 10 and Figure 11 that the 4D and 5D fibres were represented to have three and four hinges, respectively. Following the four distinct points outlined for 3D fibres (Figure 6), the 4D and 5D fibres were represented with five and six points, as depicted in Figure 13. The mechanical anchorage stage of 3D fibres, described in Section 3.4, was extended to account for the additional plastic hinge points present in 4D and 5D fibres. To determine the pullout forces for these fibers, an equivalent pulley method based on Abdallah, et al. [17] was adopted. Following similar equilibrium formulation discussed previously, herein the pullout force T1 in 4D fibres at three hinges, can be expressed according to Equation (39). The rest of the points on the pullout–slip curve will be similar to the 3D fibre with just shifting one coordinate. Similarly, the pullout force T1 in 5D fibres at three hinges, can be expressed according to Equation (40), and the remaining points are like the 4D fibres with one shifting coordinate. Note that FPH can be calculated using Equations (20) and (38). The corresponding fibre end displacements are computed by adding the slip at the opposite end of the grip and the axial deformation of the fibre on the right of the plastic hinge. In the Appendix A are given all needed steps as a summary for the developed final model.
4D fibre with three hinges:
T 1 = F P H 3 + 2 μ cos β 1 μ cos β 3 + 2 μ cos β 1 μ cos β 1 μ cos β = Δ P
5D fibre with three hinges:
T 1 = F P H 4 + 2 μ cos β 1 μ cos β 6 + 2 μ cos β 3 + 2 μ cos β 1 μ cos β + 2 μ cos β 1 μ cos β 1 μ cos β = Δ P

4. Model Verification

The predictive capability of the proposed frictional pulley-based mathematical model is validated through comparison with experimental pullout load-slip data for various hooked-end fibres. For all fibres used in the experiments, the values of σ2 and σ3 are considered equal to 614 MPa and 815 MPa, respectively. It is worth mentioning that σ2 is the stress corresponding to the beginning of the loading plateau and σ3 is the stress corresponding to 6% strain from the uniaxial tensile test of the superelastic wire used to fabricate the fibres. This 6% strain was selected because, based on the tensile stress–strain response, it corresponds to a stress level beyond the loading plateau, at which the austenite-to-martensite transformation is complete, representing the outer superelastic region, shown in Figure 10. As described in Section 2, the SMA fibres used in the experiments exhibit superelastic behaviour at temperatures above −5 °C, and both the pullout and tensile tests were conducted at an ambient temperature of 22 ± 3 °C. Accordingly, the proposed model assumes that the fibres remain fully within the superelastic temperature regime, with 22 ± 3 °C adopted as the modelling temperature. After trial and error, the values of θe and θp adopted for all fibres under HP concrete were 25° and 45°, respectively. While the θe and θp values adopted for NS were 45° and 48°, respectively. The kinetic frictional coefficient (µ) values used for NS and HP concrete were 0.2 and 0.5 obtained using trial and error.
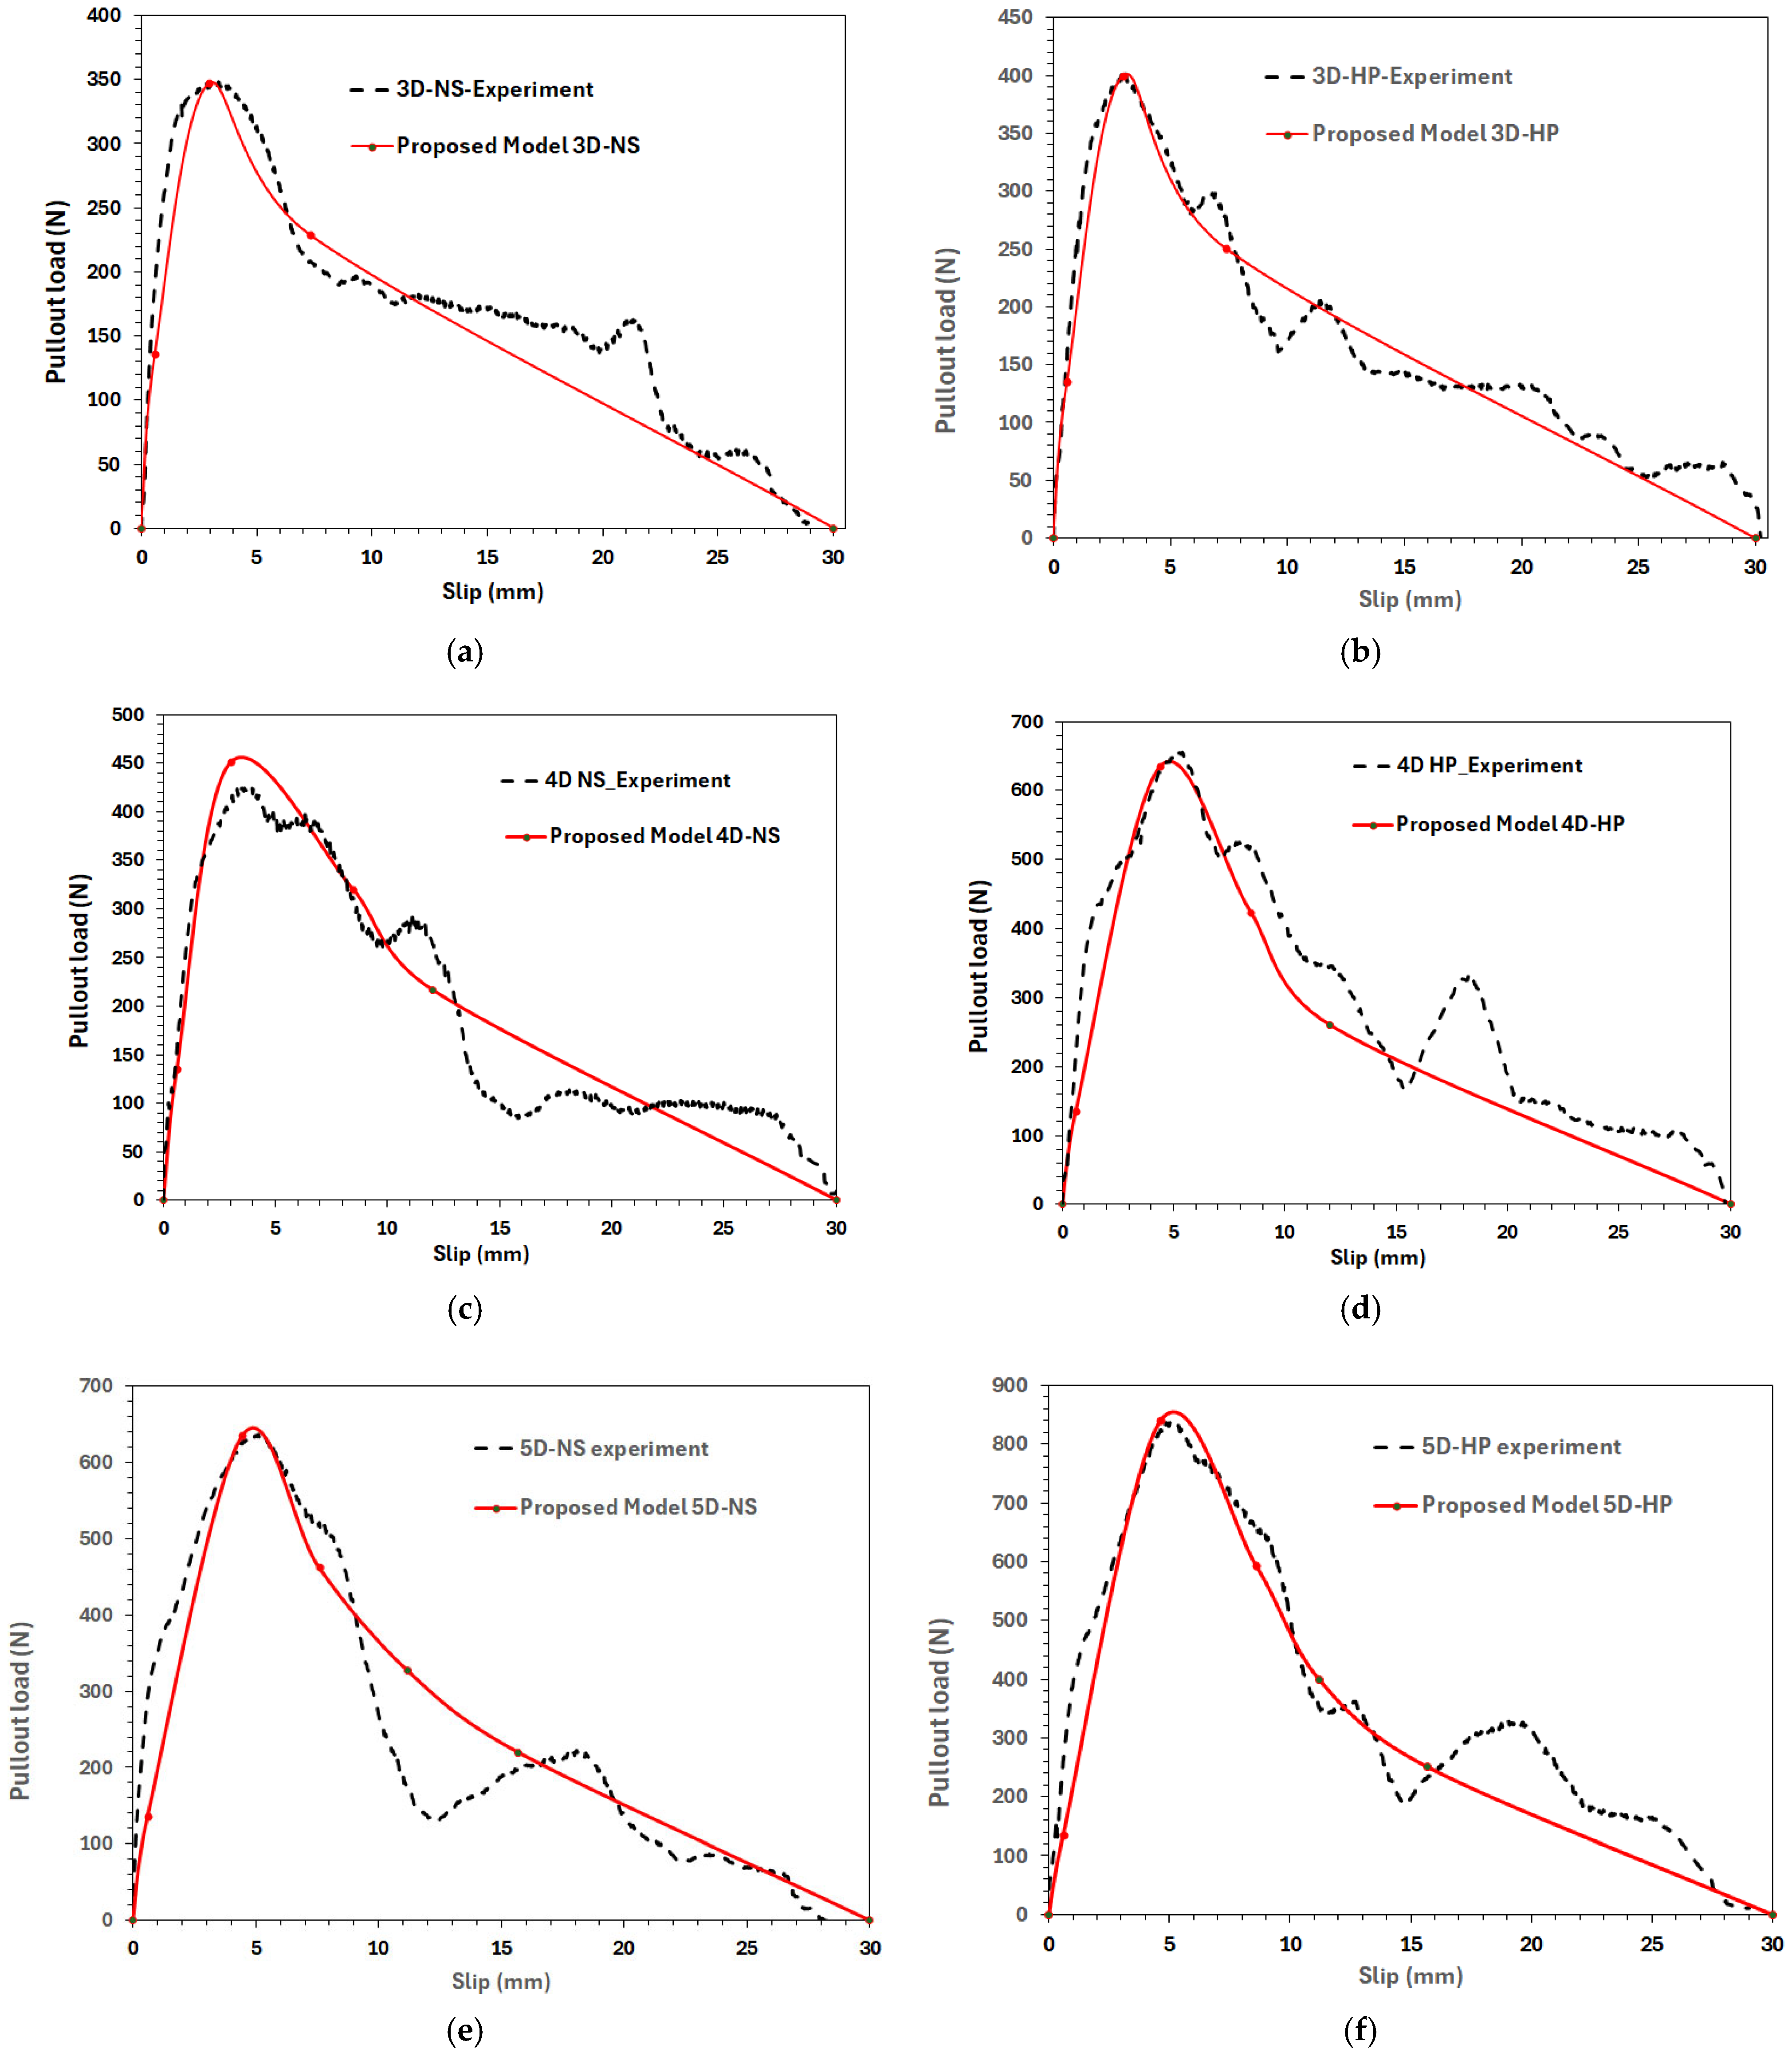
Figure 14 presents a comparison between the experimental and the proposed model pullout responses for 3D (Figure 14a,b), 4D (Figure 14c,d), and 5D (Figure 14e,f) fibres embedded in normal strength (NS) and high performance (HP) concrete. Across all specimens, the model reproduced the overall shape of the load-slip response, including the initial stiffness, the development of a pronounced peak load due to mechanical anchorage, and the subsequent softening associated with frictional pullout. For most of the specimens the initial bond stiffness was less than the experiment, this could be due to the assumption full debonding earlier than the actual experiment [18]. Future studies may focus on refining the representation of the initial bond stage to better capture early-stage stiffness. The experimental curves showed post-peak oscillations while the model only captured a smooth decay behaviour. These post-peak oscillations are the result of progressive hook straightening and localized concrete crushing and non-uniform stress distribution [12,19]. Despite these simplifications, the model provides a conservative and consistent representation of post-peak decay, reasonably predicting the overall energy dissipation capacity and residual resistance trends.
Table 1 provides a quantitative comparison between experimental results and model predictions in terms of peak pullout load, slip at peak load, and pullout energy (area under the pullout load-slip curve) for all fibre geometries and concrete types. The peak pullout load is predicted with high accuracy for most specimens, with errors below 2% for all NS cases and for the 5D-HP specimen, confirming that the anchorage mechanics and concrete confinement effects are appropriately represented. Slightly larger deviations are observed for the 4D-HP specimen (8.5%), which may be attributed to enhanced local concrete crushing and non-uniform stress redistribution associated with multiple hook engagements in high-strength matrices, effects that are not explicitly captured in idealized analytical formulations. The slip at peak load shows higher discrepancies, particularly for higher-order hook geometries, which is consistent with previous observations that slip capacity is highly sensitive to localized damage, hook rotation kinematics, and experimental variability [16,19]. Despite this, the model reproduces the overall trend of increasing slip capacity with hook complexity and concrete strength. The pullout energy is predicted within 1–11% for most cases, demonstrating that the model effectively captures both pre-peak hardening and post-peak softening behaviour. Larger energy underestimation for the 4D-HP specimen (16.7%) likely reflects the absence of progressive concrete damage and crack bridging mechanisms that can prolong post-peak resistance in dense matrices. Overall, the results demonstrated the proposed frictional pully-based model captures the pullout behaviour of superelastic SMA fibres through incorporation of material constitutive behaviour, and hook geometry, and matrix strength.

5. Limitations and Future Scope

While the proposed model shows good agreement with experimental results, its limitations can be addressed in future research. The model assumes uniform concrete confinement and idealized hook straightening mechanisms, and therefore does not explicitly capture localized concrete crushing, or non-uniform stress redistribution along the fibre embedment, which contributes to the post-peak oscillations observed experimentally. In addition, the initial bond stage is simplified by assuming early full debonding, leading to a slight underestimation of the initial stiffness. The current formulation is restricted to monotonic pullout loading and does not account for cyclic, or rate-dependent effects. Furthermore, fibre inclination (misalignment) is not addressed.
Future research should focus on extending the model to incorporate progressive concrete damage and non-uniform stress distributions to better capture post-peak response, particularly for higher-order hook geometries embedded in high-performance concrete. Additionally, probabilistic approaches could be employed to account for variability in fibre orientation and embedment length in practical applications. Validation of the model at the composite and structural levels, including multi-fibre pullout and flexural response of SMA fibre-reinforced concrete elements, is also recommended to facilitate integration of the proposed formulation into performance-based design frameworks.

6. Conclusions

Investigation of the pullout performance of various hooked-end superelastic SMA fibres embedded into concrete was studied using experimental methods and the obtained results were used to develop a mathematical model that can capture the response of the SMA fibres. The hook shapes designated as 3D, 4D, and 5D correspond to hooks with two, three, and four plastic hinges, respectively, which form during the mechanical anchorage stage of pullout.
The proposed mathematical model integrates a frictional pulley mechanism with the tensile stress–strain response and the elastic–plastic constitutive behaviour of hooked-end superelastic SMA fibres. Key input parameters include the SMA’s tensile stress–strain curves, fibre geometry, and the strength of the cementitious matrix. The model accounts for superelastic deformation and fibre slip to estimate displacements across different stages of resistance. The resistance force generated by mechanical anchorage is calculated based on the elastic and superelastic strain distribution within the hook bends.
The predictive capability of the proposed frictional pulley-based mathematical model was validated in comparison with the experimental pullout load-slip data. The model demonstrated excellent agreement with the experimental observations, reasonably capturing the pullout behaviour.

Author Contributions

Conceptualization, D.W.M. and A.S.G.; Methodology, D.W.M. and A.S.G.; Validation, D.W.M.; Formal analysis, D.W.M.; Investigation, D.W.M. and A.S.G.; Resources, A.S.G.; Writing—original draft, D.W.M.; Writing—review & editing, A.S.G.; Supervision, A.S.G.; Project administration, A.S.G.; Funding acquisition, A.S.G. All authors have read and agreed to the published version of the manuscript.

Funding

This research was funded by Natural Sciences and Engineering Research Council of Canada, grant number RGPIN-2017-04197 NSERC DG.

Informed Consent Statement

Not applicable.

Data Availability Statement

The original contributions presented in this study are included in the article. Further inquiries can be directed to the corresponding authors.

Conflicts of Interest

The authors declare no conflict of interest.

Appendix A. Summary of the Final Model

Step 1-Input parameters:
  • Fibre geometry (3D, 4D or 5D), determine
    Fibre radius (rf),
    hook lengths and angle θ
    Embedment length L
  • SMA stress–strain plot; determine
    σ2 loading plateau stress; and
    σ3 the stress corresponding to 6% strain (end of stress plateau)
  • Concrete strength: NS, HP, determine
    Frictional constant µ
    θe and θp; HP: θe = 25° and θp = 45°, NS were θe = 45° and θp = 48°
Step 2-Pullout load of straight fibre and corresponding slip (P1, ∆1): First point on the load-slip curve.
  • Use experimental data or calculate using Equations (1) and (2)
Step 3-Pullout load and slip for hooked-end fibres:
  • Step 3.1. Calculate M using Equation (38)
M     =   σ 2 r 3 2 sin ( θ e ) θ e sin ( 4 θ e ) 4 + 4 σ 2 r 3 3 cos 3 θ e cos 3 θ p +       4 r 3 3 σ 2 cos 3 θ p + ( σ 3 σ 2 0.5 π θ p ) ( 2 3 sin θ p sin 3 θ p 3 )
  • Step 3.2. Calculate FPH by rearranging using Equation (20)
M = F P H   d f   cos θ  
  • Step 3.3. Calculate ∆P′ and ∆P″ using Equations (19) and (17)
Δ P = T 1 = 2 F P H 1 + μ cos β 1 μ cos β 1 μ cos β
Δ P = T 2 = F P H 1 μ cos β
  • Step 3.4. Calculate P3 and P4 using Equations (5) and (6)
P 3 = P 1 + Δ P
P 4 = P 1 + Δ P
  • Step 3.5. Obtain the stress due to P3 by dividing the force P3 to the cross sectional area of the fibre.
  • Step 3.6. Obtain the strain corresponding to the stress due to P3 from the SMA tensile stress–strain curve
  • Step 3.7. Use the strain from step 3.6 to calculate the deformation (δ3) corresponding to P3 (use the straight portion of fibre, beyond the last hook as length)
  • Step 3.8. Calculate the slip corresponding to P3 using Equation (4), refer Figure 5, Figure 11 and Figure 12 for the values of L2 and other lengths.
Δ 3 = L 2 + δ 3
  • Step 3.9. use P3, ∆3 as the second point on the load-slip curve
  • Repeat steps 3.5 to 3.8 to calculate the ∆4 and P4, ∆3
  • For 3D fibres Use polynomial curve fit from points (0,0); (∆1, P1), (∆3, P3), (∆4, P4), and (embedment length L, 0).
  • Repeat steps 3.3 to 3.9 for 4D and 5D fibres for points on the graph; Refer to Figure 11, Figure 12 and Figure 13 and Equations (39) and (40).

References

  1. Menna, D.W.; Genikomsou, A.S.; Green, M.F. Compressive and cyclic flexural response of double-hooked-end steel fiber reinforced concrete. Front. Struct. Civ. Eng. 2022, 16, 1104–1126. [Google Scholar] [CrossRef]
  2. Zollo, R.F. Fiber-reinforced concrete: An overview after 30 years of development. Cem. Concr. Compos. 1997, 19, 107–122. [Google Scholar] [CrossRef]
  3. Choi, E.; Kim, D.J.; Chung, Y.-S.; Kim, H.S.; Jung, C. Crack-closing of cement mortar beams using NiTi cold-drawn SMA short fibers. Smart Mater. Struct. 2014, 24, 015018. [Google Scholar] [CrossRef]
  4. Elbahy, Y.I.; Youssef, M.A. Flexural behaviour of superelastic shape memory alloy reinforced concrete beams during loading and unloading stages. Eng. Struct. 2019, 181, 246–259. [Google Scholar] [CrossRef]
  5. Lee, K.-J.; Lee, J.-H.; Jung, C.-Y.; Choi, E. Crack-closing performance of NiTi and NiTiNb fibers in cement mortar beams using shape memory effects. Compos. Struct. 2018, 202, 710–718. [Google Scholar]
  6. Menna, D.W.; Genikomsou, A.S.; Green, M.F. Flexural performance and crack closing capacity of double-hooked-end superelastic shape memory alloy fibre-reinforced concrete beams under cyclic loading using digital image correlation. Constr. Build. Mater. 2023, 409, 133744. [Google Scholar] [CrossRef]
  7. Lagoudas, D.C. Shape Memory Alloys: Modeling and Engineering Applications; Springer: Berlin/Heidelberg, Germany, 2008. [Google Scholar]
  8. Krishnan, R.V.; Delaey, L.; Tas, H.; Warlimont, H. Thermoplasticity, pseudoelasticity and the memory effects associated with martensitic transformations: Part 2 The macroscopic mechanical behaviour. J. Mater. Sci. 1974, 9, 1536–1544. [Google Scholar] [CrossRef]
  9. Dehghani, A.; Aslani, F. Effect of 3D, 4D, and 5D hooked-end type and loading rate on the pull-out performance of shape memory alloy fibres embedded in cementitious composites. Constr. Build. Mater. 2021, 273, 121742. [Google Scholar] [CrossRef]
  10. Choi, E.; Kim, D.; Lee, J.-H.; Ryu, G.-S. Monotonic and hysteretic pullout behavior of superelastic SMA fibers with different anchorages. Compos. Part B Eng. 2017, 108, 232–242. [Google Scholar] [CrossRef]
  11. Choi, E.; Mohammadzadeh, B.; Hwang, J.-H.; Kim, W.J. Pullout behavior of superelastic SMA fibers with various end-shapes embedded in cement mortar. Constr. Build. Mater. 2018, 167, 605–616. [Google Scholar] [CrossRef]
  12. Menna, D.W.; Genikomsou, A.S.; Green, M.F. Effect of heat treatment and end-hook geometry on pullout behaviour of heavily cold worked superelastic NiTi shape memory alloy fibres embedded in concrete. Constr. Build. Mater. 2022, 361, 129630. [Google Scholar] [CrossRef]
  13. Park, J.K.; Ngo, T.T.; Kim, D.J. Interfacial bond characteristics of steel fibers embedded in cementitious composites at high rates. Cem. Concr. Res. 2019, 123, 105802. [Google Scholar] [CrossRef]
  14. Xu, B.; Ju, J.; Shi, H. Progressive micromechanical modeling for pullout energy of hooked-end steel fiber in cement-based composites. Int. J. Damage Mech. 2011, 20, 922–938. [Google Scholar] [CrossRef]
  15. Abdallah, S.; Fan, M. Anchorage mechanisms of novel geometrical hooked-end steel fibres. Mater. Struct. 2017, 50, 139. [Google Scholar] [CrossRef]
  16. Pi, Z.; Xiao, H.; Li, H. Influence of interfacial microstructure on pullout behavior and failure mechanism of steel fibers embedded in cement-based materials. Constr. Build. Mater. 2021, 304, 124688. [Google Scholar] [CrossRef]
  17. Abdallah, S.; Fan, M.; Rees, D.W. Analysis and modelling of mechanical anchorage of 4D/5D hooked end steel fibres. Mater. Des. 2016, 112, 539–552. [Google Scholar] [CrossRef]
  18. Alwan, J.M.; Naaman, A.E.; Guerrero, P. Effect of mechanical clamping on the pull-out response of hooked steel fibers embedded in cementitious matrices. Concr. Sci. Eng. Struct. 1999, 1, 15–25. [Google Scholar]
  19. Naaman, A.E.; Namur, G.G.; Alwan, J.M.; Najm, H.S. Fiber pullout and bond slip. I: Analytical study. J. Struct. Eng. 1991, 117, 2769–2790. [Google Scholar] [CrossRef]
  20. Atanacković, T.; Achenbach, M. Moment-curvature relations for a pseudoelastic beam. Contin. Mech. Thermodyn. 1989, 1, 73–80. [Google Scholar] [CrossRef]
Figure 1. Geometry of SMA fibres.
Constrmater 06 00022 g001
Figure 2. Tensile stress–strain response of the superelastic SMA.
Constrmater 06 00022 g002
Figure 3. Pullout experimental setup.
Constrmater 06 00022 g003
Figure 4. Average pullout load-slip plots for (a) Straight, (b) 3D, (c) 4D, and (d) 5D fibres in normal strength and high-performance concrete matrix.
Constrmater 06 00022 g004aConstrmater 06 00022 g004b
Figure 5. 3D hooked-end SMA fibre at (a) debonding stage, (b) mechanical anchorage stage with two plastic hinges (c) mechanical anchorage with one plastic hinge and (d) frictional pullout stage [18].
Constrmater 06 00022 g005
Figure 6. Schematic sketch of theoretical pullout curve for 3D SMA hooked-end fibre [18].
Constrmater 06 00022 g006
Figure 7. Frictional pulley model for 3D fibre [18].
Constrmater 06 00022 g007
Figure 8. Free-body diagram of the fibre plastic hinge [18].
Constrmater 06 00022 g008
Figure 9. SMA wire stress–strain model with characteristic points.
Constrmater 06 00022 g009
Figure 10. Stages of stress distribution for SMA wire subjected to bending (a) elastic stage, (b) elastic–plastic stage, (c) superelastic stage, and (d) section profile at superelastic stage.
Constrmater 06 00022 g010
Figure 11. 4D hooked-end SMA fibre at (a) debonding stage, (b) mechanical anchorage stage with three plastic hinges, (c) two plastic hinge (d) one plastic hinge and (e) frictional pullout [17].
Constrmater 06 00022 g011
Figure 12. 5D hooked-end SMA fibre at (a) debonding stage, (b) mechanical anchorage stage with four plastic hinges, (c) three plastic hinges (d) two plastic hinges, (e) one plastic hinge and (f) frictional pullout [17].
Constrmater 06 00022 g012
Figure 13. Schematic sketch of theoretical pullout curve for (a) 4D and (b) 5D SMA fibre [17].
Constrmater 06 00022 g013
Figure 14. Pullout load-slip plots comparison between experimental data and proposed model for 3D (a,b), 4D (c,d) and 5D (e,f) fibres in NS and HP concrete.
Constrmater 06 00022 g014
Table 1. Comparison between experiment (Exp.) and model results for peak load, sip at peak load and pullout energy.
End Hook
Geometry
Matrix StrengthPeak Load (N)Slip at Peak Load (mm)Pullout Energy (N·mm)
Exp.ModelError (%)Exp.ModelError (%)Exp.ModelError (%)
3DNS344.4346.90.733.42.914.7484244518.1
4DNS444.2451.21.583.33.09.1579558661.2
5DNS640.5635.50.785.14.511.8725875914.6
3DHP419.3400.94.393.43.011.8509248654.5
4DHP693.8634.88.55.14.413.78804733616.7
5DHP854.9840.11.735.54.714.610,753958210.9
Disclaimer/Publisher’s Note: The statements, opinions and data contained in all publications are solely those of the individual author(s) and contributor(s) and not of MDPI and/or the editor(s). MDPI and/or the editor(s) disclaim responsibility for any injury to people or property resulting from any ideas, methods, instructions or products referred to in the content.