1. Introduction
The use of alkali-activated binders (AAB) has been extensively studied as an alternative to Portland cement (PC), since AAB can exhibit comparable mechanical performance and significantly lower greenhouse gas emissions [
1,
2]. Moreover, the practical application of AAB has increased in recent decades, despite several reported limitations, such as supply chain constraints, high shrinkage of the hardened material, and variations in slag composition, which remain barriers to large-scale implementation [
3]. Additionally, there is still a gap in experimental data involving different types and concentrations of precursors and activators, particularly from non-destructive testing methods, whose data are readily available in the literature for Portland cement systems [
4,
5,
6,
7,
8,
9,
10]. Therefore, further research is needed to provide comprehensive non-destructive testing data for AAB materials.
The use of non-destructive tests is an alternative to destructive techniques, especially for compressive strength and modulus of elasticity. Several non-destructive tests are utilized, such as ultrasound, rebound hammer (sclerometer test), and thermography, in addition to other methods that are commonly used in civil construction [
11].
The ultrasound test is a quick and friendly technique that instantly provides data on the pulse velocity (
UPV) traveling through the specimen. With this data, it is possible to estimate concrete compressive strength and modulus of elasticity. Regarding the compressive strength (
S), there are several ways to correlate this property with
UPV. According to Trtnik et al. [
12], the most popular formula that establishes this relationship is.
According to Trtnik et al. [
12], the most popular formula that establishes this relationship is:
where
α and
β are empirical parameters determined by the least squares method after the linearization of the model. In the study of Silva et al. [
13], the exponential curve presented in Equation (1) presents a better fit compared to the exponential equation
.
On the other hand, Neville [
4] states that there is no physical basis for correlating compressive strength and pulse velocity; however, as
UPV relates to concrete density, an indirect and limited estimation can be performed to predict compressive strength. This limitation is also discussed in a study with recycled aggregate developed by Estolano et al. [
14], who showed that compressive strength might not correlate with ultrasound parameters depending on the situation analyzed.
In this context, an adequate manner of employing an ultrasound test is to predict the dynamic modulus of elasticity (
Ec,d), as this property is physically linked to density. The most used formula to predict the modulus of elasticity from
UPV is
where
ρ is the density and
µ is the Poisson’s ratio of the specimen. This formula (Equation (2)) is widely employed by standards worldwide, such as ASTM C597 [
15], EN 12504-4 [
16], and ABNT NBR 15630 [
17].
In alkali-activated binders, there are few research using ultrasound to predict hardened properties. Mahmood et al. [
18] employed the ultrasound pulse velocity technique to study the early-age properties of alkali-activated slag-fly ash mixtures. The authors compared the values with calorimetry data and observed that the determination coefficient between cumulative heat and
UPV was higher than 0.95, showing a strong correlation. However, it was impossible to measure any pulse velocity in the first 24 h owing to the natural limitation of the equipment. In another study employing only blast furnace slag, Mahmood et al. [
19] noticed that the high reaction rate associated with high silica modulus (Ms) of the activation solution allowed the identification of the increase in
UPV on the first 24 h, which could not be identified in slag-fly ash mixtures. Assad et al. [
20] studied the properties of metakaolin-slag alkali-activated mixtures at 180 and 360 curing days. In this paper, strong correlations were observed among
UPV, compressive strength, and weight loss due to acid attack, and it was concluded that the mechanical behavior of the mortars increased as the slag content increased.
This article aims to evaluate the potential of ultrasound techniques for predicting the hardened properties of alkali-activated slag mixtures. The study seeks to address an existing gap in the literature, particularly concerning the relationship between ultrasonic parameters and the mechanical behavior of alkali-activated binders. Current standards are largely based on ordinary Portland cement systems, highlighting the need for further research to establish specific guidelines for alkali-activated materials. As the global use of these binders continues to expand, ongoing investigations are essential for developing a standardized framework for their characterization and assessment.
2. Materials and Methods
2.1. Materials
The precursor employed was blast furnace slag (BFS) to produce the alkali-activated mixtures. The BFS was characterized through chemical, physical, and mineralogical analyses to provide a better understanding of its properties. The chemical composition of BFS was assessed by XRF using a RIX 3000 Instrument (Rigaku, Tokyo, Japan). A D2 Phaser diffractometer (Bruker, Billerica, MA, USA) was employed to obtain the mineralogical characteristics of BFS. The parameters used in XRD were the following: 5–80° scan range, 0.02° angular step, 1.2°∙min−1 scan speed, Cu-kα radiation with λ = 1.5406 Å, i = 10 mA and U = 30 kV. The qualitative analysis was conducted using the software Diffrac.EVA v.5.0 and the patterns from the ICDD database. Also, to complement the data of mineralogical and chemical characterization, thermogravimetric analysis (TGA) was performed through a thermobalance instrument (Mettler Toledo, Greifensee, Switzerland) in the temperature range of 30–1000 °C, heating rate of 10 °C·min−1, and 40 mL·min−1 of N2 rate. Finally, the physical characteristics of BFS were assessed by density test using the Le Chatelier flask, Blaine fineness, and particle size distribution through laser diffraction.
The activators used were pentahydrate sodium metasilicate (SMP) (Na2SiO3·5H2O) (Pernambuco Química, Jaboatão dos Guararapes, Brazil) and sodium silicate (SS) (Pernambuco Química, Jaboatão dos Guararapes, Brazil). SMP was provided as a solid and granular material, with silica modulus (Ms) (molar SiO2/Na2O ratio) = 1.01 and solid content = 57.56%. SS was acquired as a liquid solution with Ms = 1.75 and solid content = 45.25%.
The fine aggregate used to produce the mortars was quartz sand with the following parameters: maximum diameter size = 2.40 mm; fineness modulus = 2.00; d10 = 0.169 mm; d30 = 0.320 mm; d50 = 0.446 mm; d60 = 0.505 mm. According to these results, the aggregate was classified as fine well-graded sand.
2.2. Methods
2.2.1. Mix Design and Casting
The mixtures were prepared varying the concentration of Na
2O (%) of the alkaline activators, the type of activator, and the water/binder ratio, totaling 24 mixtures according to
Table 1.
The proportioning of the blends followed other studies published in the literature [
21,
22,
23,
24]. The content of Na
2O (%), defined as one of the variables, was calculated following Equation (3):
where
Na2O and
SiO2 are the masses of the respective components in the activators, and BFS is the mass of blast furnace slag. The sum of the denominator (
Na2O + SiO2 + BFS) is the total mass of the binder in the mixtures; thus, in this research, the solids of the activators were also considered as binders.
After, the water/binder ratio was calculated according to Equation (4):
where
wactivator is the water already counted from the alkaline activator, and
wadditional is the added deionized water necessary to reach the target water/binder ratio.
Lastly, the proportion used to calculate the content of fine aggregate was 1:2 (total binder:sand).
The mixtures were formulated using a planetary mixer. Initially, 50% of the activator and the extra water were blended for 30 s. Concurrently, BFS was introduced into the mixture. Following an additional minute of mixing, the fine aggregate was incorporated, and mixing continued until reaching a total duration of 4 min and 30 s. The final step involved adding the remaining activator and continuing the mixing process for an additional minute, resulting in a cumulative mixing time of 5 min and 30 s.
To cast the specimens, cylindrical molds measuring 5 cm in diameter and 10 cm in height were employed. The mixtures were poured into four layers and compacted using a metallic rod with 30 strokes. Following demolding, the specimens were submerged in water for curing until they underwent hardened tests.
2.2.2. Testing
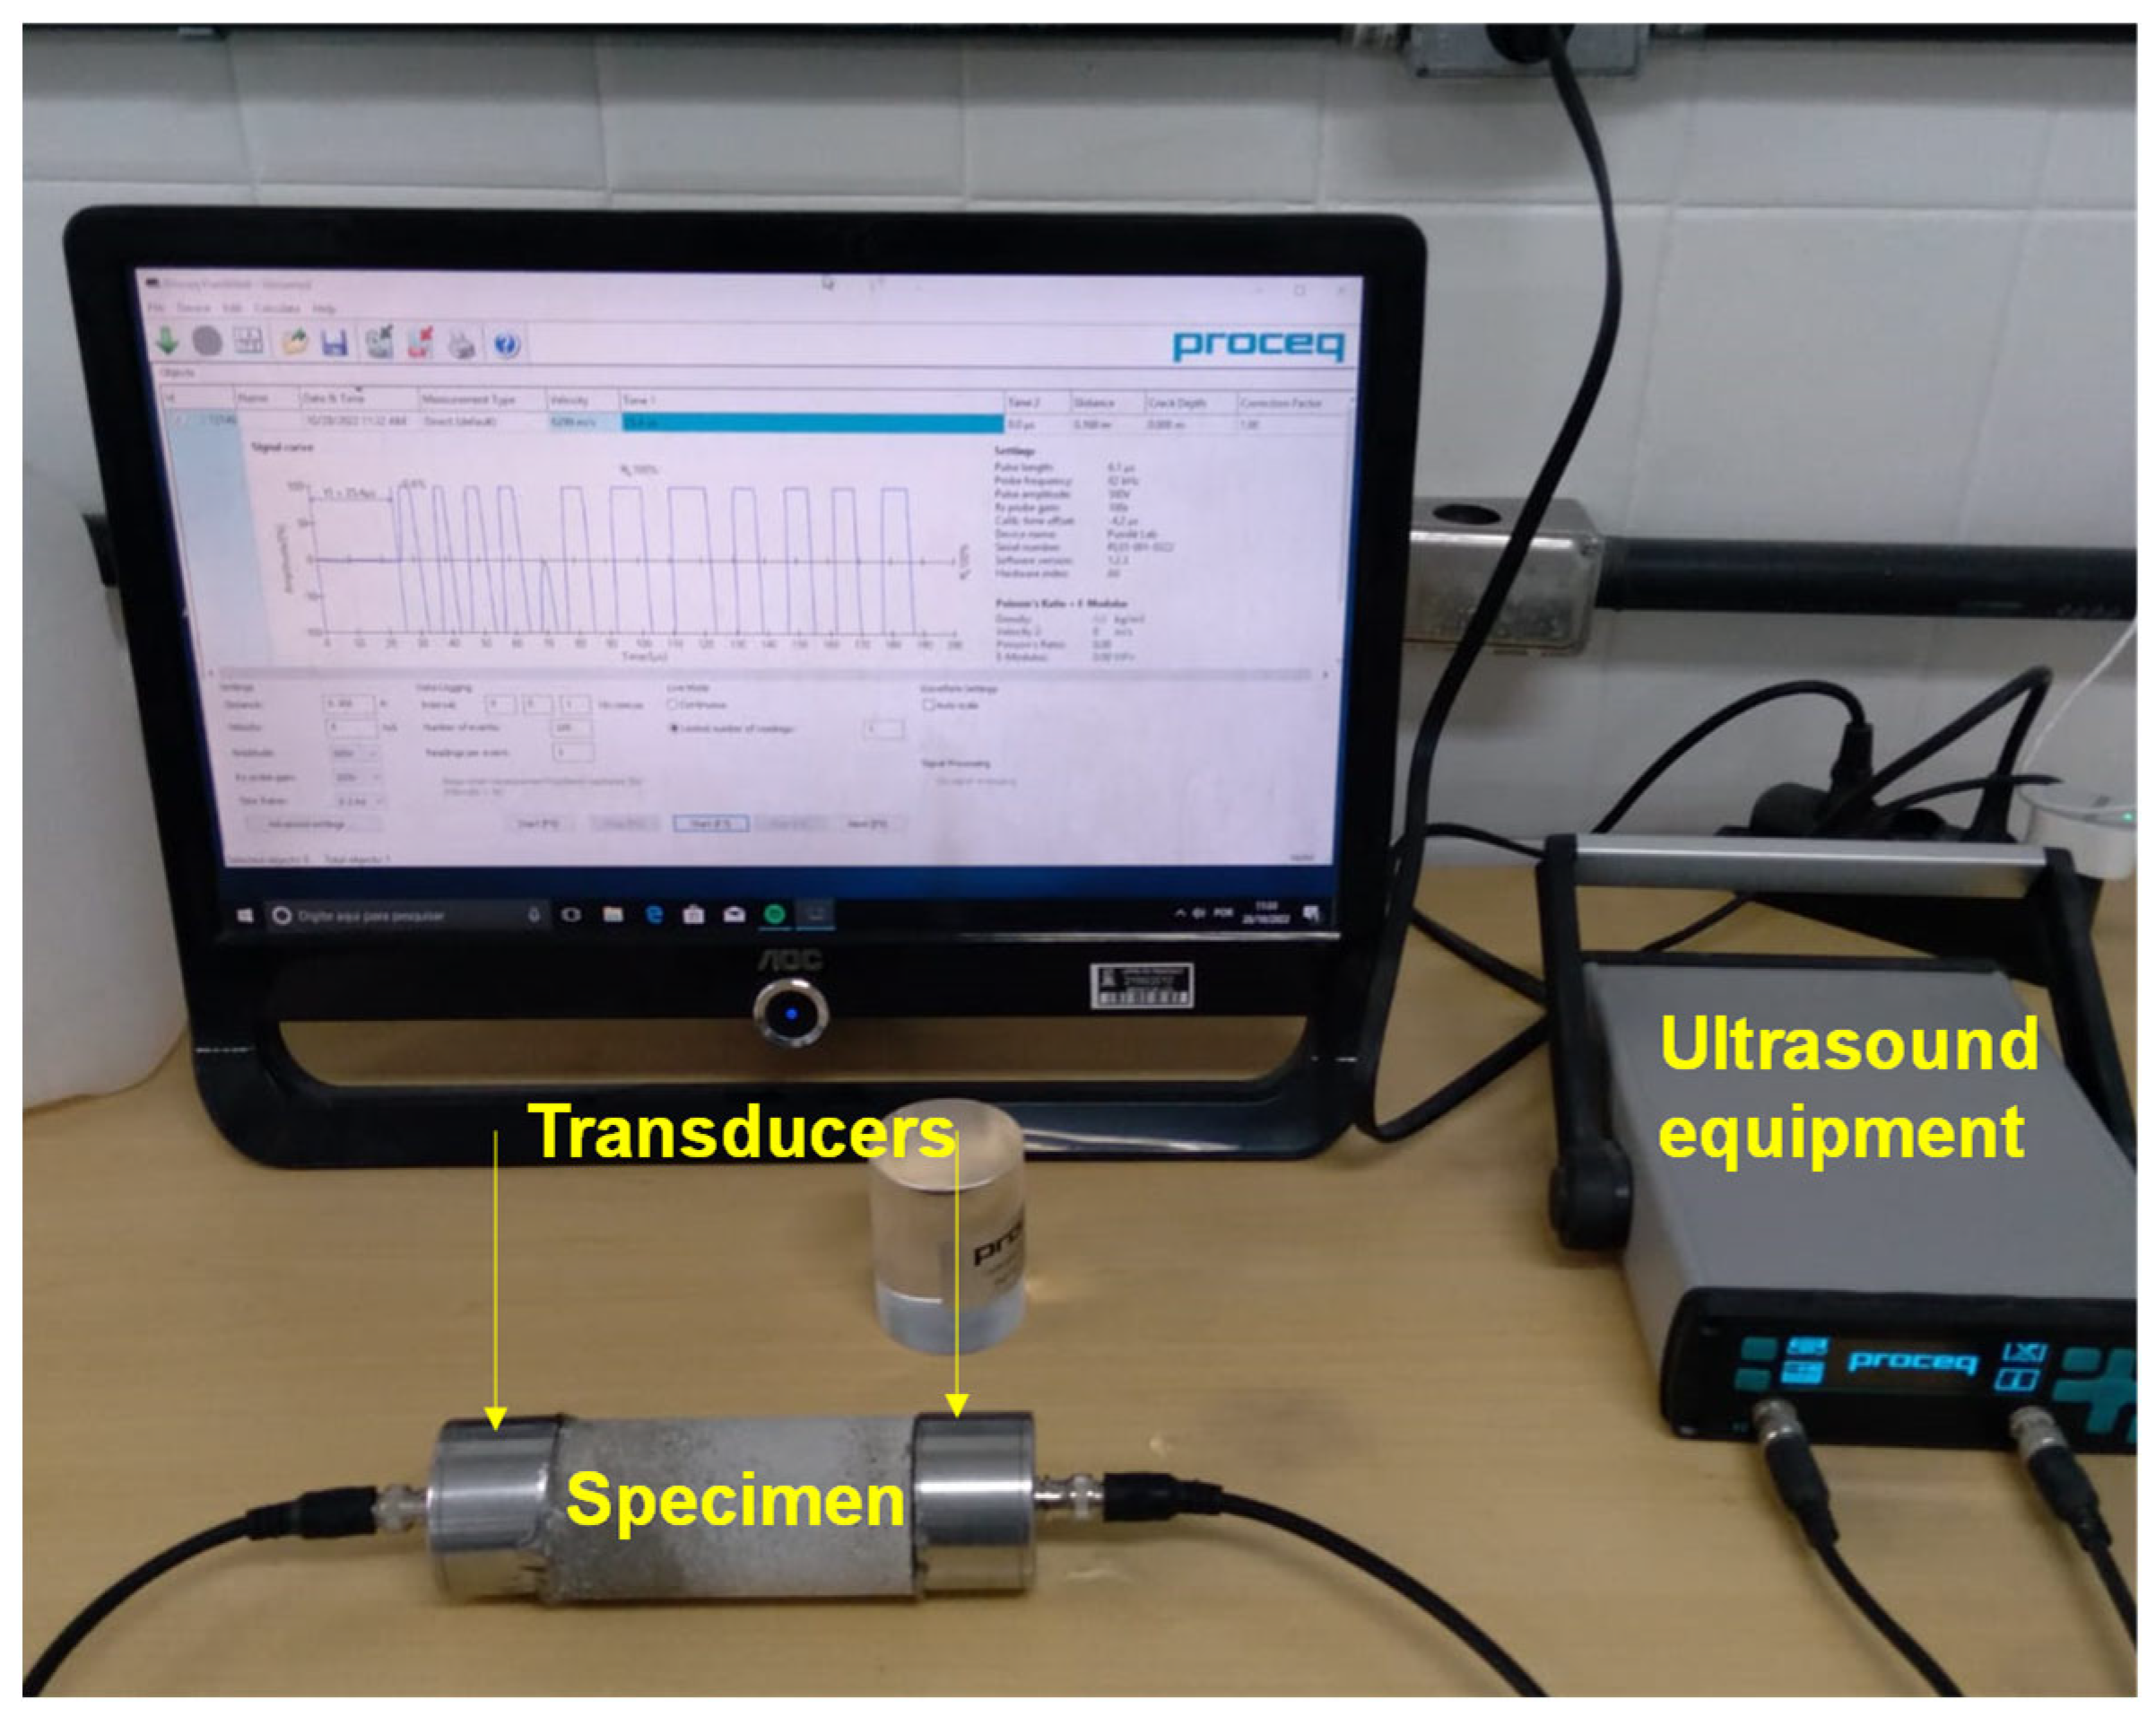
Ultrasound pulse velocity. Ultrasound tests were conducted using Pundit Lab equipment (Proceq, Schwarzenbach, Switzerland). The ultrasonic pulse transmission occurred at a frequency of 54 kHz and a width of 9.3 µs. The time the pulse travels across the specimen was calculated. With this time, the pulse speed (
UPV) was obtained. The tests were conducted on cylindrical specimens, obtaining the pulse in the longitudinal direction. The conductive gel was employed to improve the electrical conductivity between the transducer and the specimen.
Figure 1 shows the system assembled to measure
UPV.
To calculate the dynamic modulus of elasticity (
Ecd), it is necessary to have the dry density (
ρ) and Poisson’s coefficient (
µ) (Equation (3)). There are few investigations on Poisson’s coefficient of alkali-activated materials, and the studies are generally conducted in concrete and present a large variation in
µ (0.13 to 0.22) [
25,
26,
27,
28]. Therefore, scenarios with
µ varying from 0.15 to 0.25 were drawn for this study.
It is worth mentioning that the samples were tested in the saturated condition (saturated surface dry); that is, the analysis was carried out immediately after removing the specimen from the submerged curing, and it was slightly dried on its surface.
Compressive strength. The compressive strength test was performed in a AGX-V load machine (Shimadzu, Kyoto, Japan) with a load rate of 0.25 MPa/s for the cylindrical specimens according to ABNT NBR 7215 [
29].
Dry density. The dry density test was obtained following the Brazilian standard ABNT NBR 9778 [
30]. In this test, the specimens were subjected to saturation in water, and then the saturated mass (
msat) and submerged (
msub) in water were weighed using a hydrostatic balance. Then, the specimens were dried in an oven for 72 h, and the dry mass (msec) was obtained. The formula to calculate the dry density (
ddry) is:
Thermogravimetric analysis. A discussion was conducted using data from the thermogravimetric analysis. This test measured the continuous mass loss of pastes prepared with the same mix design of the mortars (except for the fine aggregate). This test was performed by a Mettler Toledo equipment, with a temperature range of 30–1000 °C, a heat rate of 10 °C·min−1, and a purge N2 gas equal to 45 mL·min−1.
3. Results
3.1. Characterization of BFS
The chemical composition of BFS was assessed by X-ray fluorescence (XRF) and featured the presence of CaO (42.00%), SiO
2 (37.73%), Al
2O
3 (10.91%), MgO (6.04%), TiO
2 (0.52%), K
2O (0.46%), Na
2O (0.40%), and Fe
2O
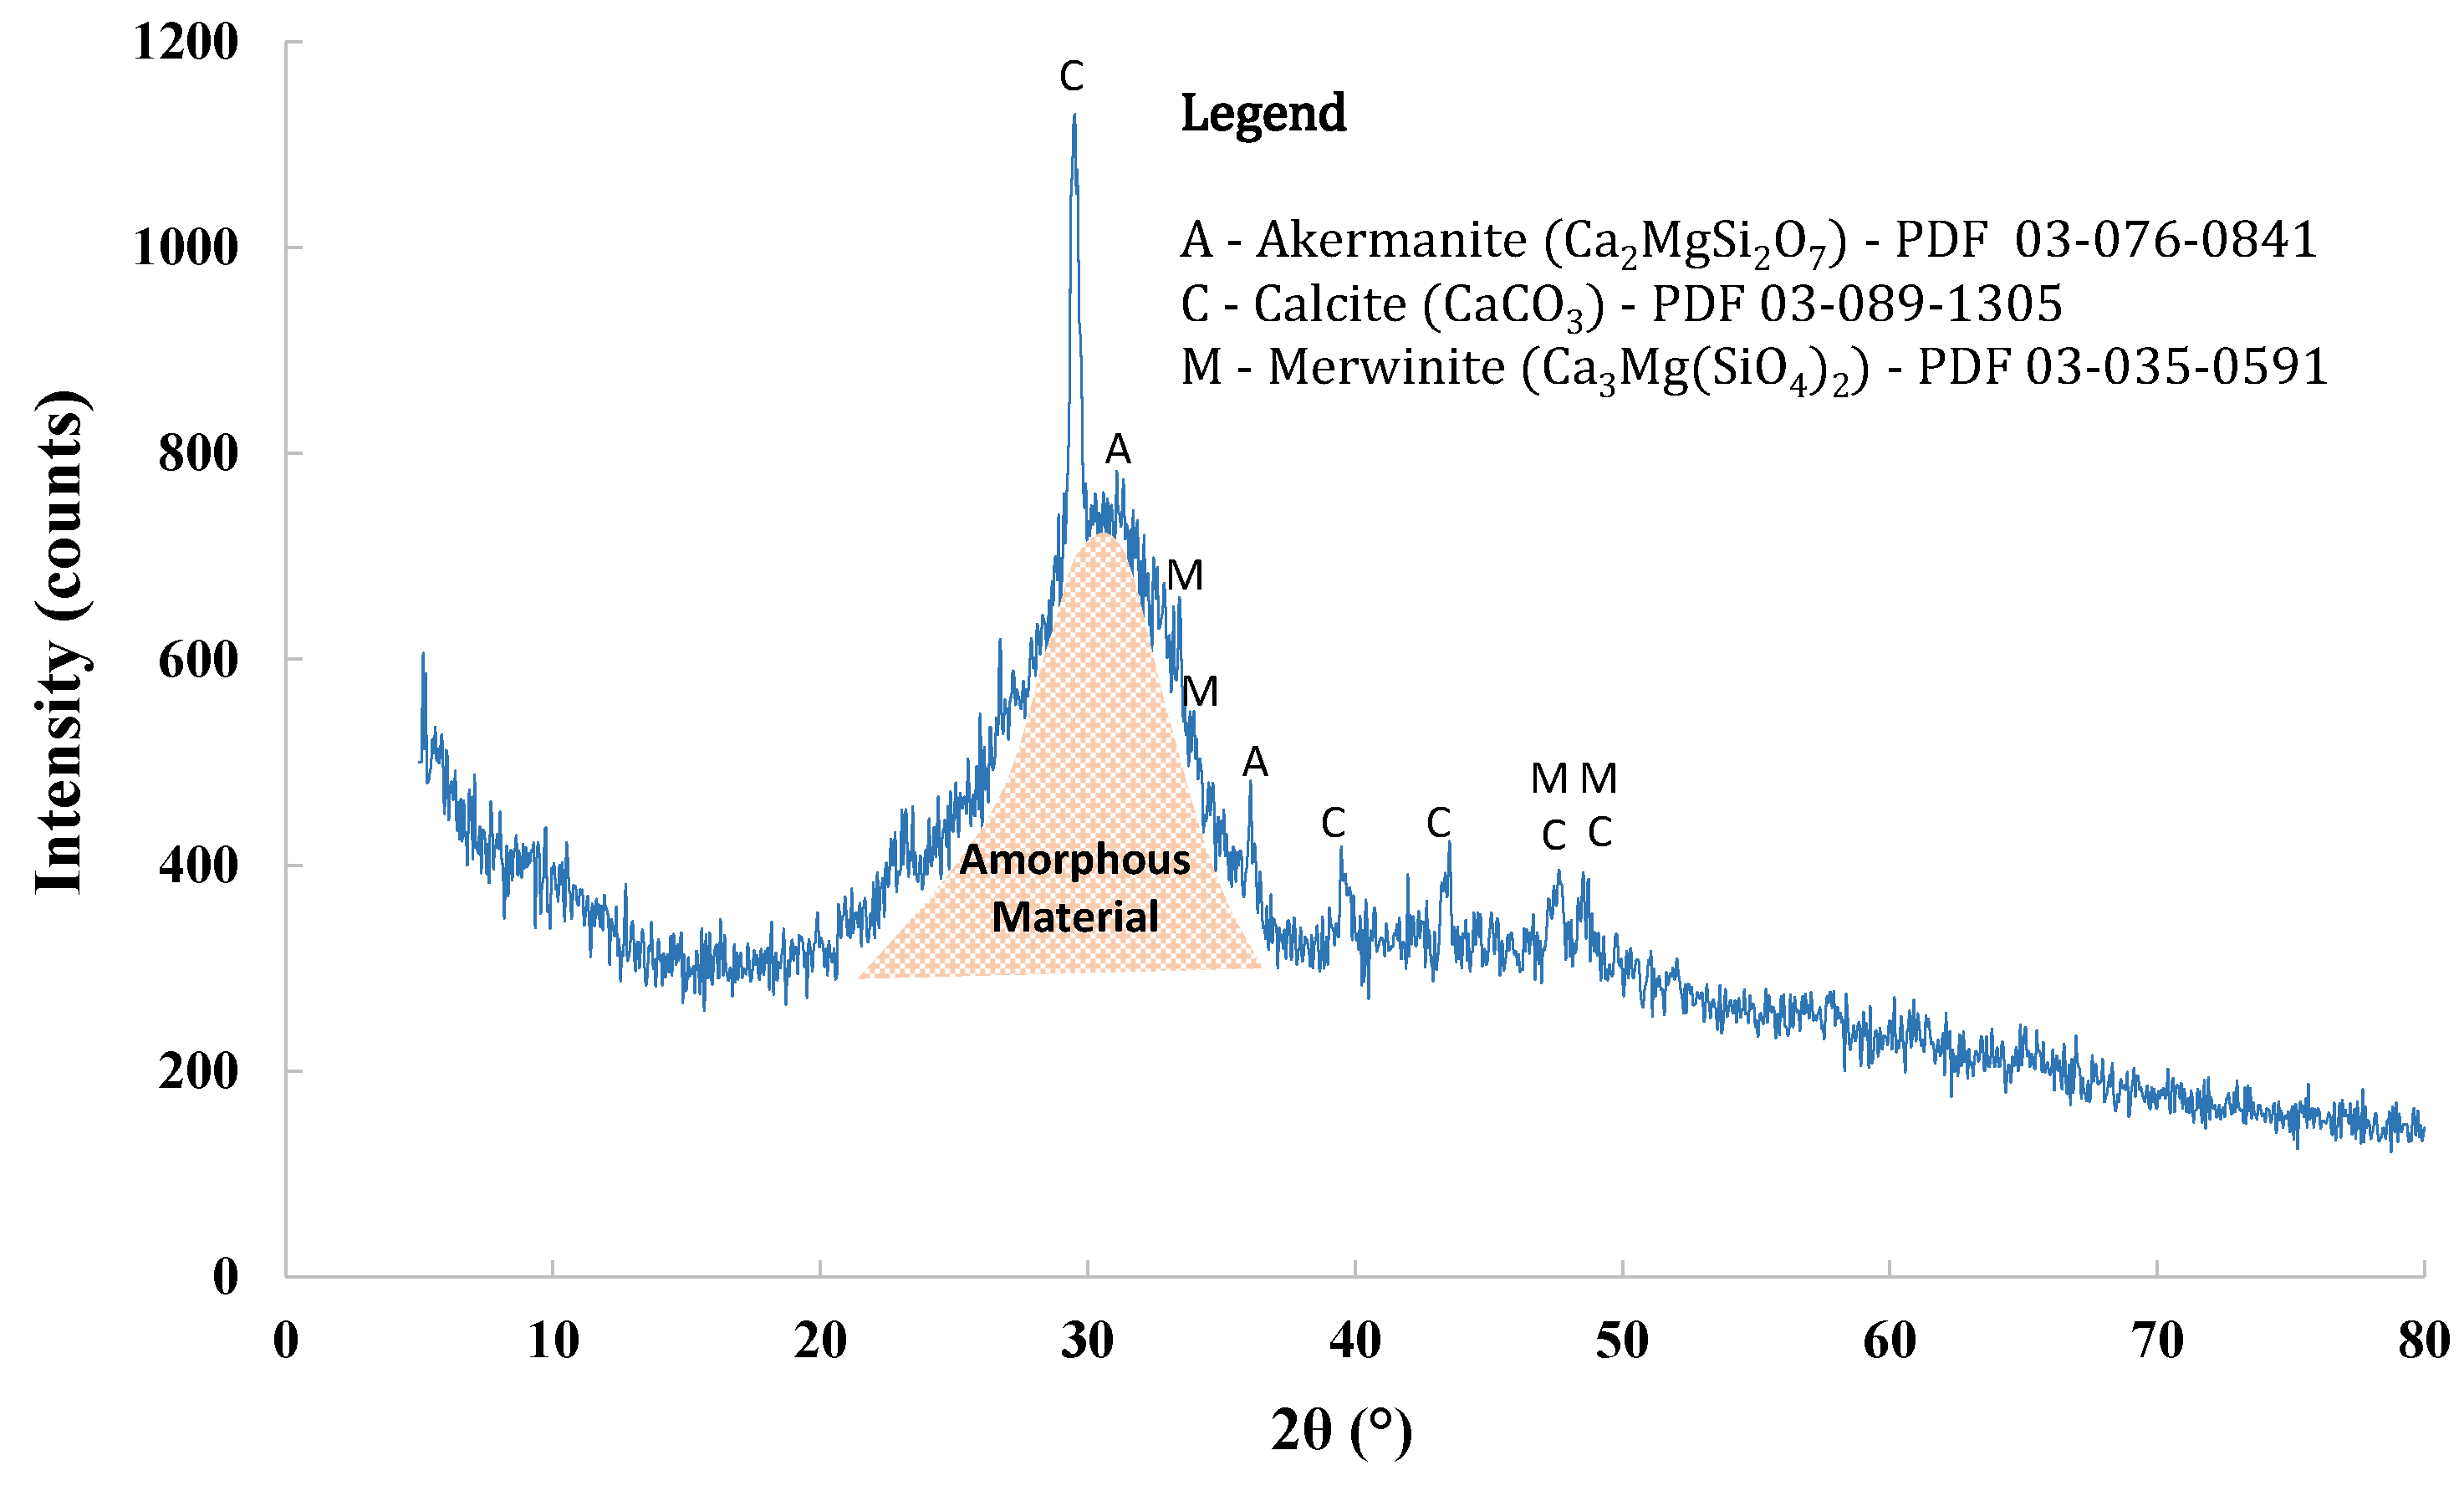
3 (0.38%). The mineralogical composition evaluated through X-ray diffraction (XRD) showed the presence of 70.2% amorphous material, and the mineralogical phases observed were calcite, merwinite, and akermanite. The diffractogram of BFS, with identification of the mineralogical phases and their corresponding pattern codes, is presented in
Figure 2.
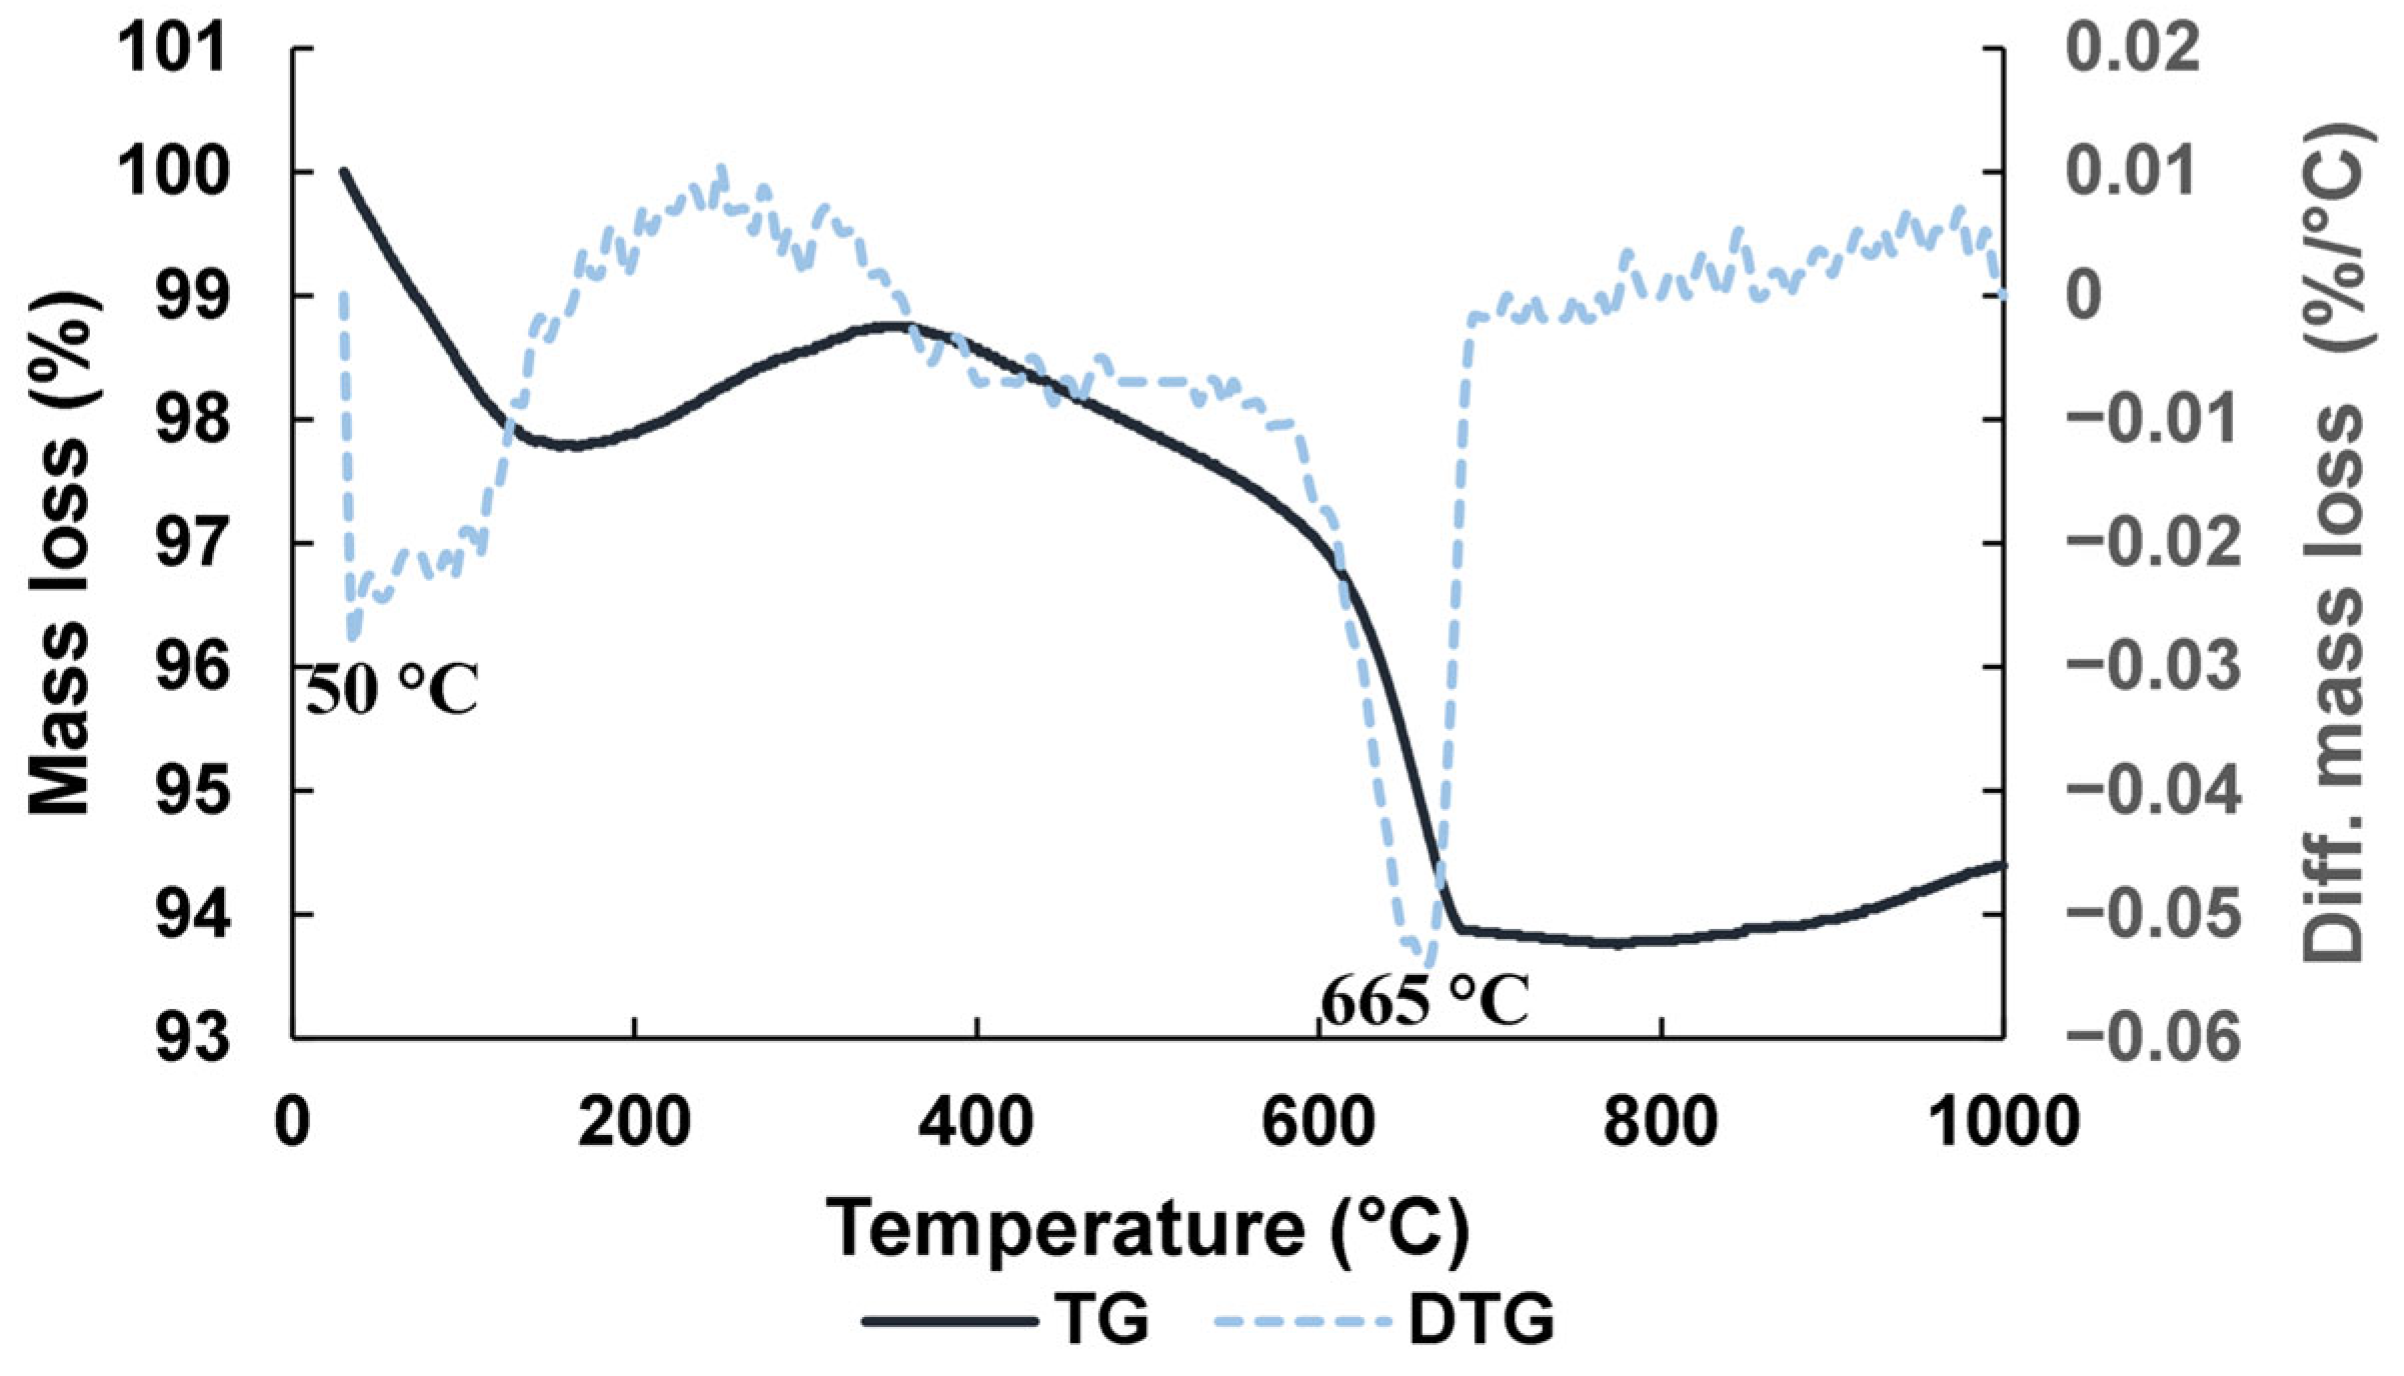
Figure 3 shows the result of thermogravimetric analysis (TGA) on BFS. As shown, a peak of mass loss at 50 °C appears owing to loss of humidity, and another remarkable peak at 665 °C, because of the decarbonation of calcite and poor crystalline phases of calcium carbonate. Concerning the physical characteristics of BFS, the results of tests were specific gravity = 2.79 g/cm
3; Blaine fineness = 442.2 m
2/kg; and the laser diffraction test provided a d
50 value equal to 12.33 µm.
3.2. Ultrasonic Pulse Velocity
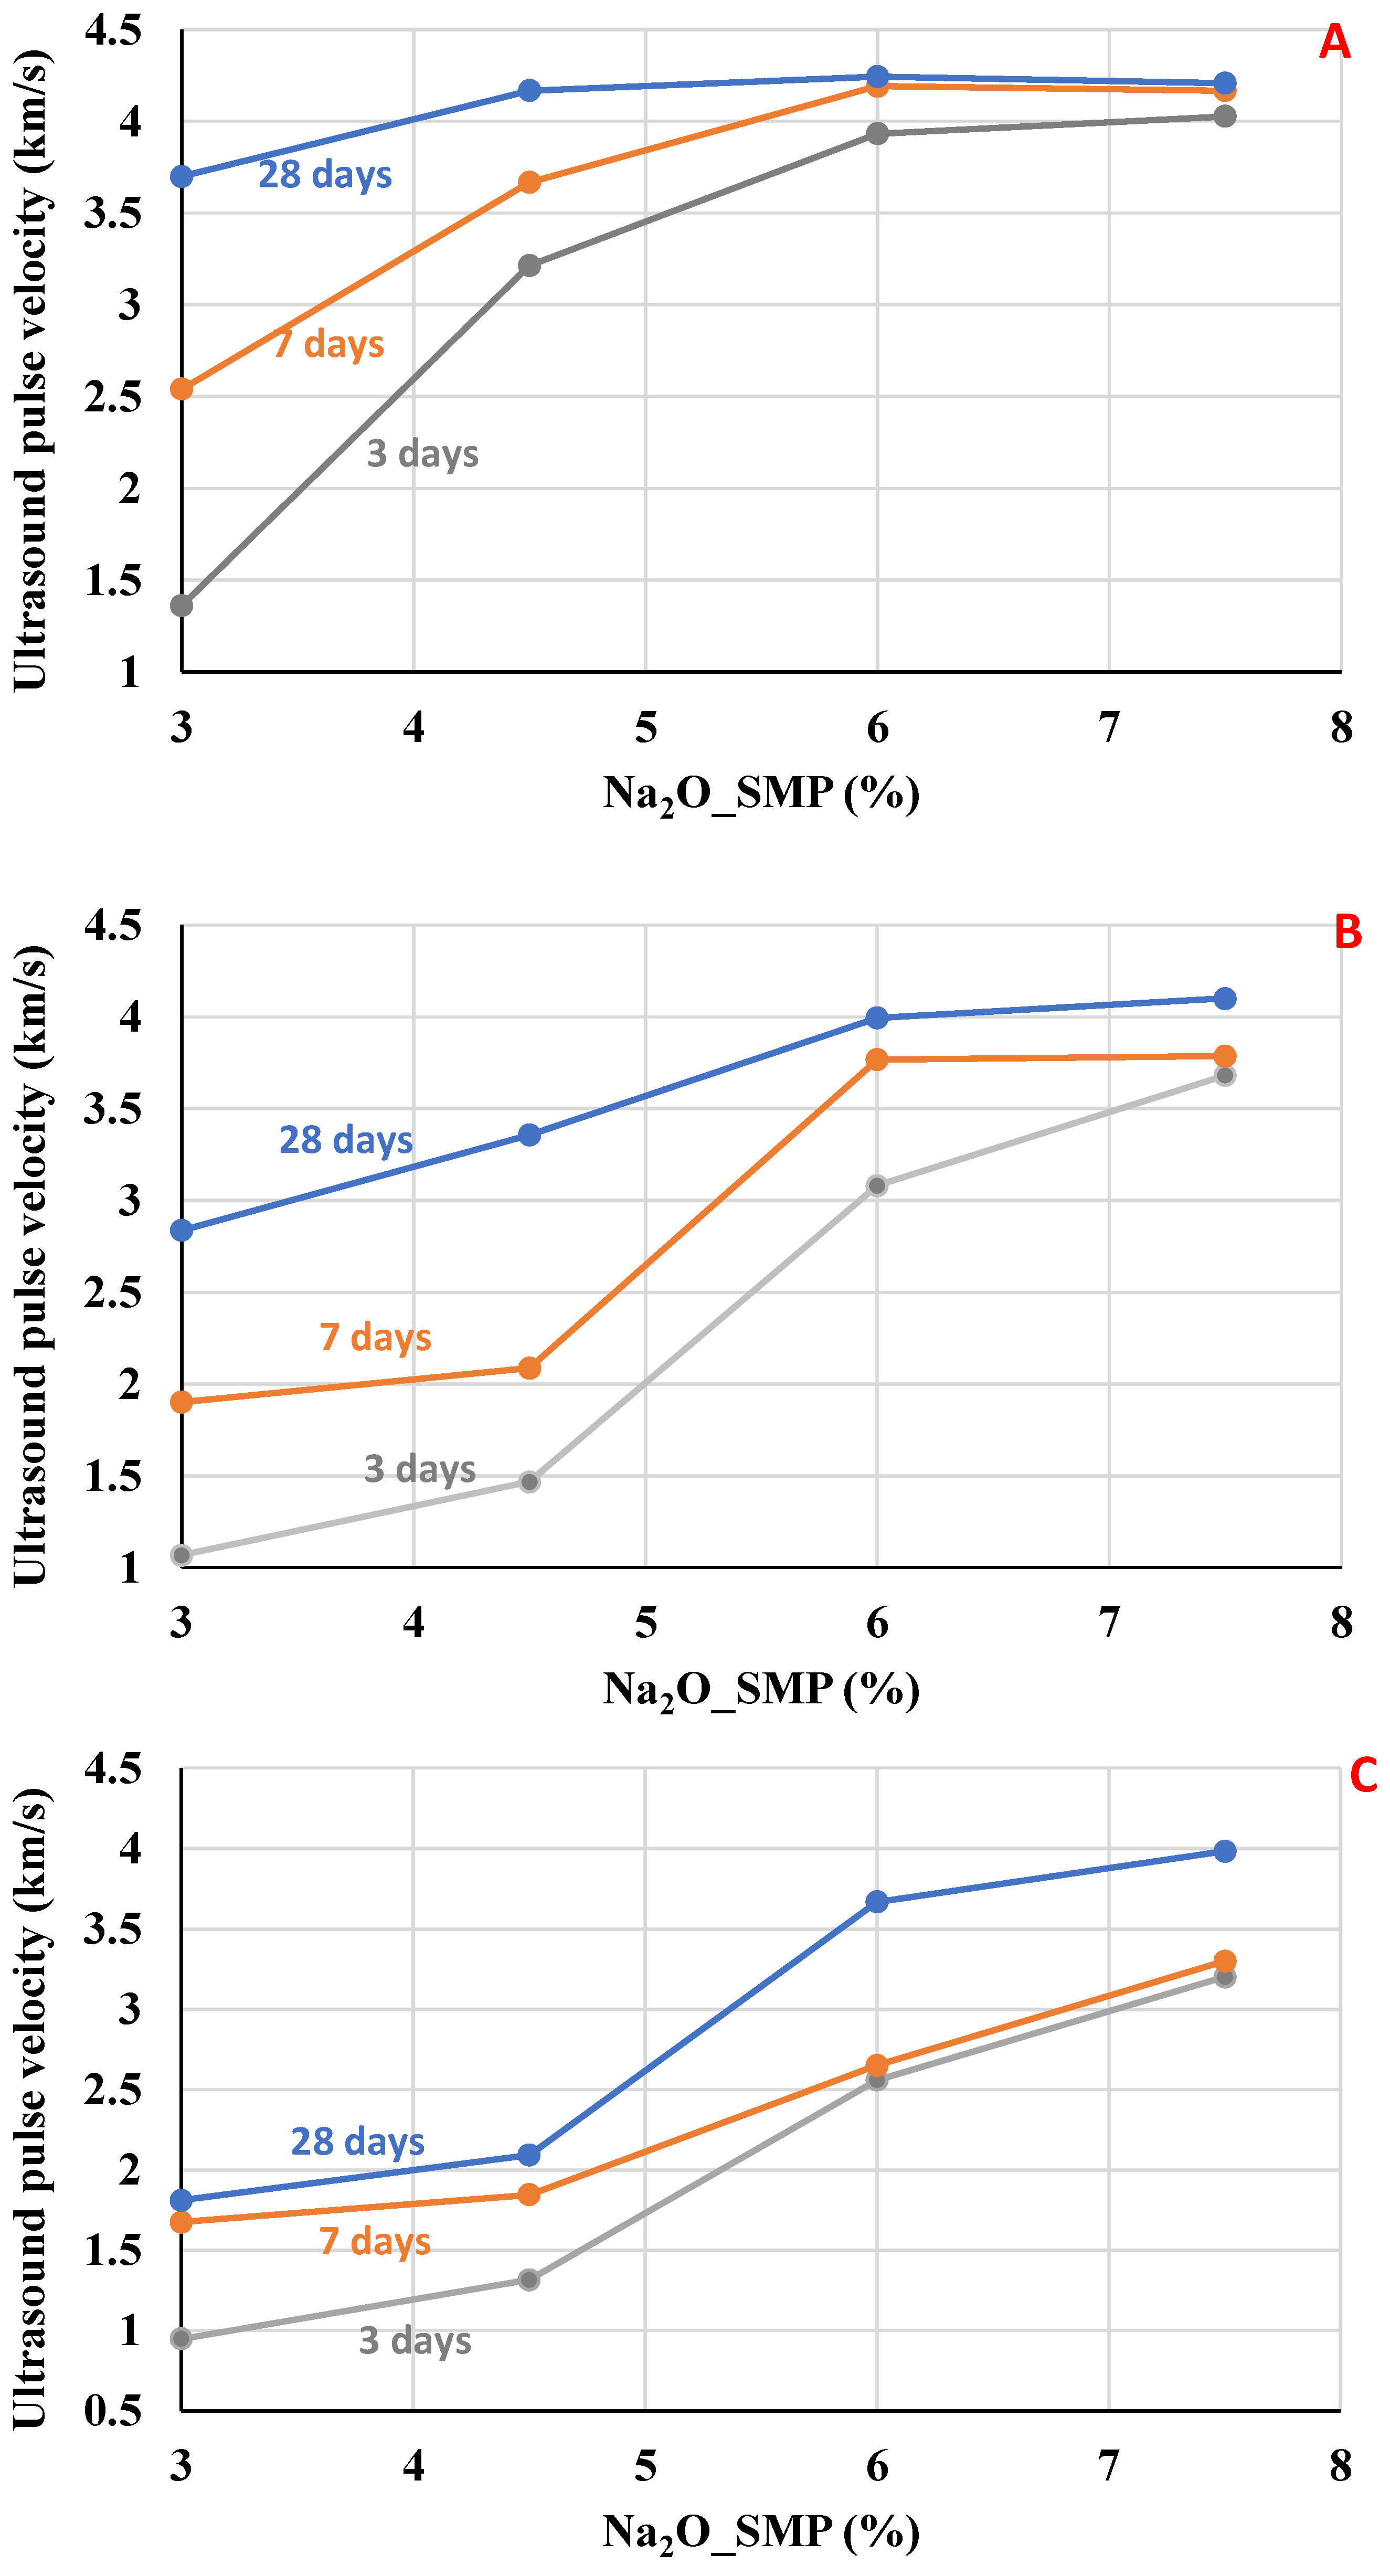
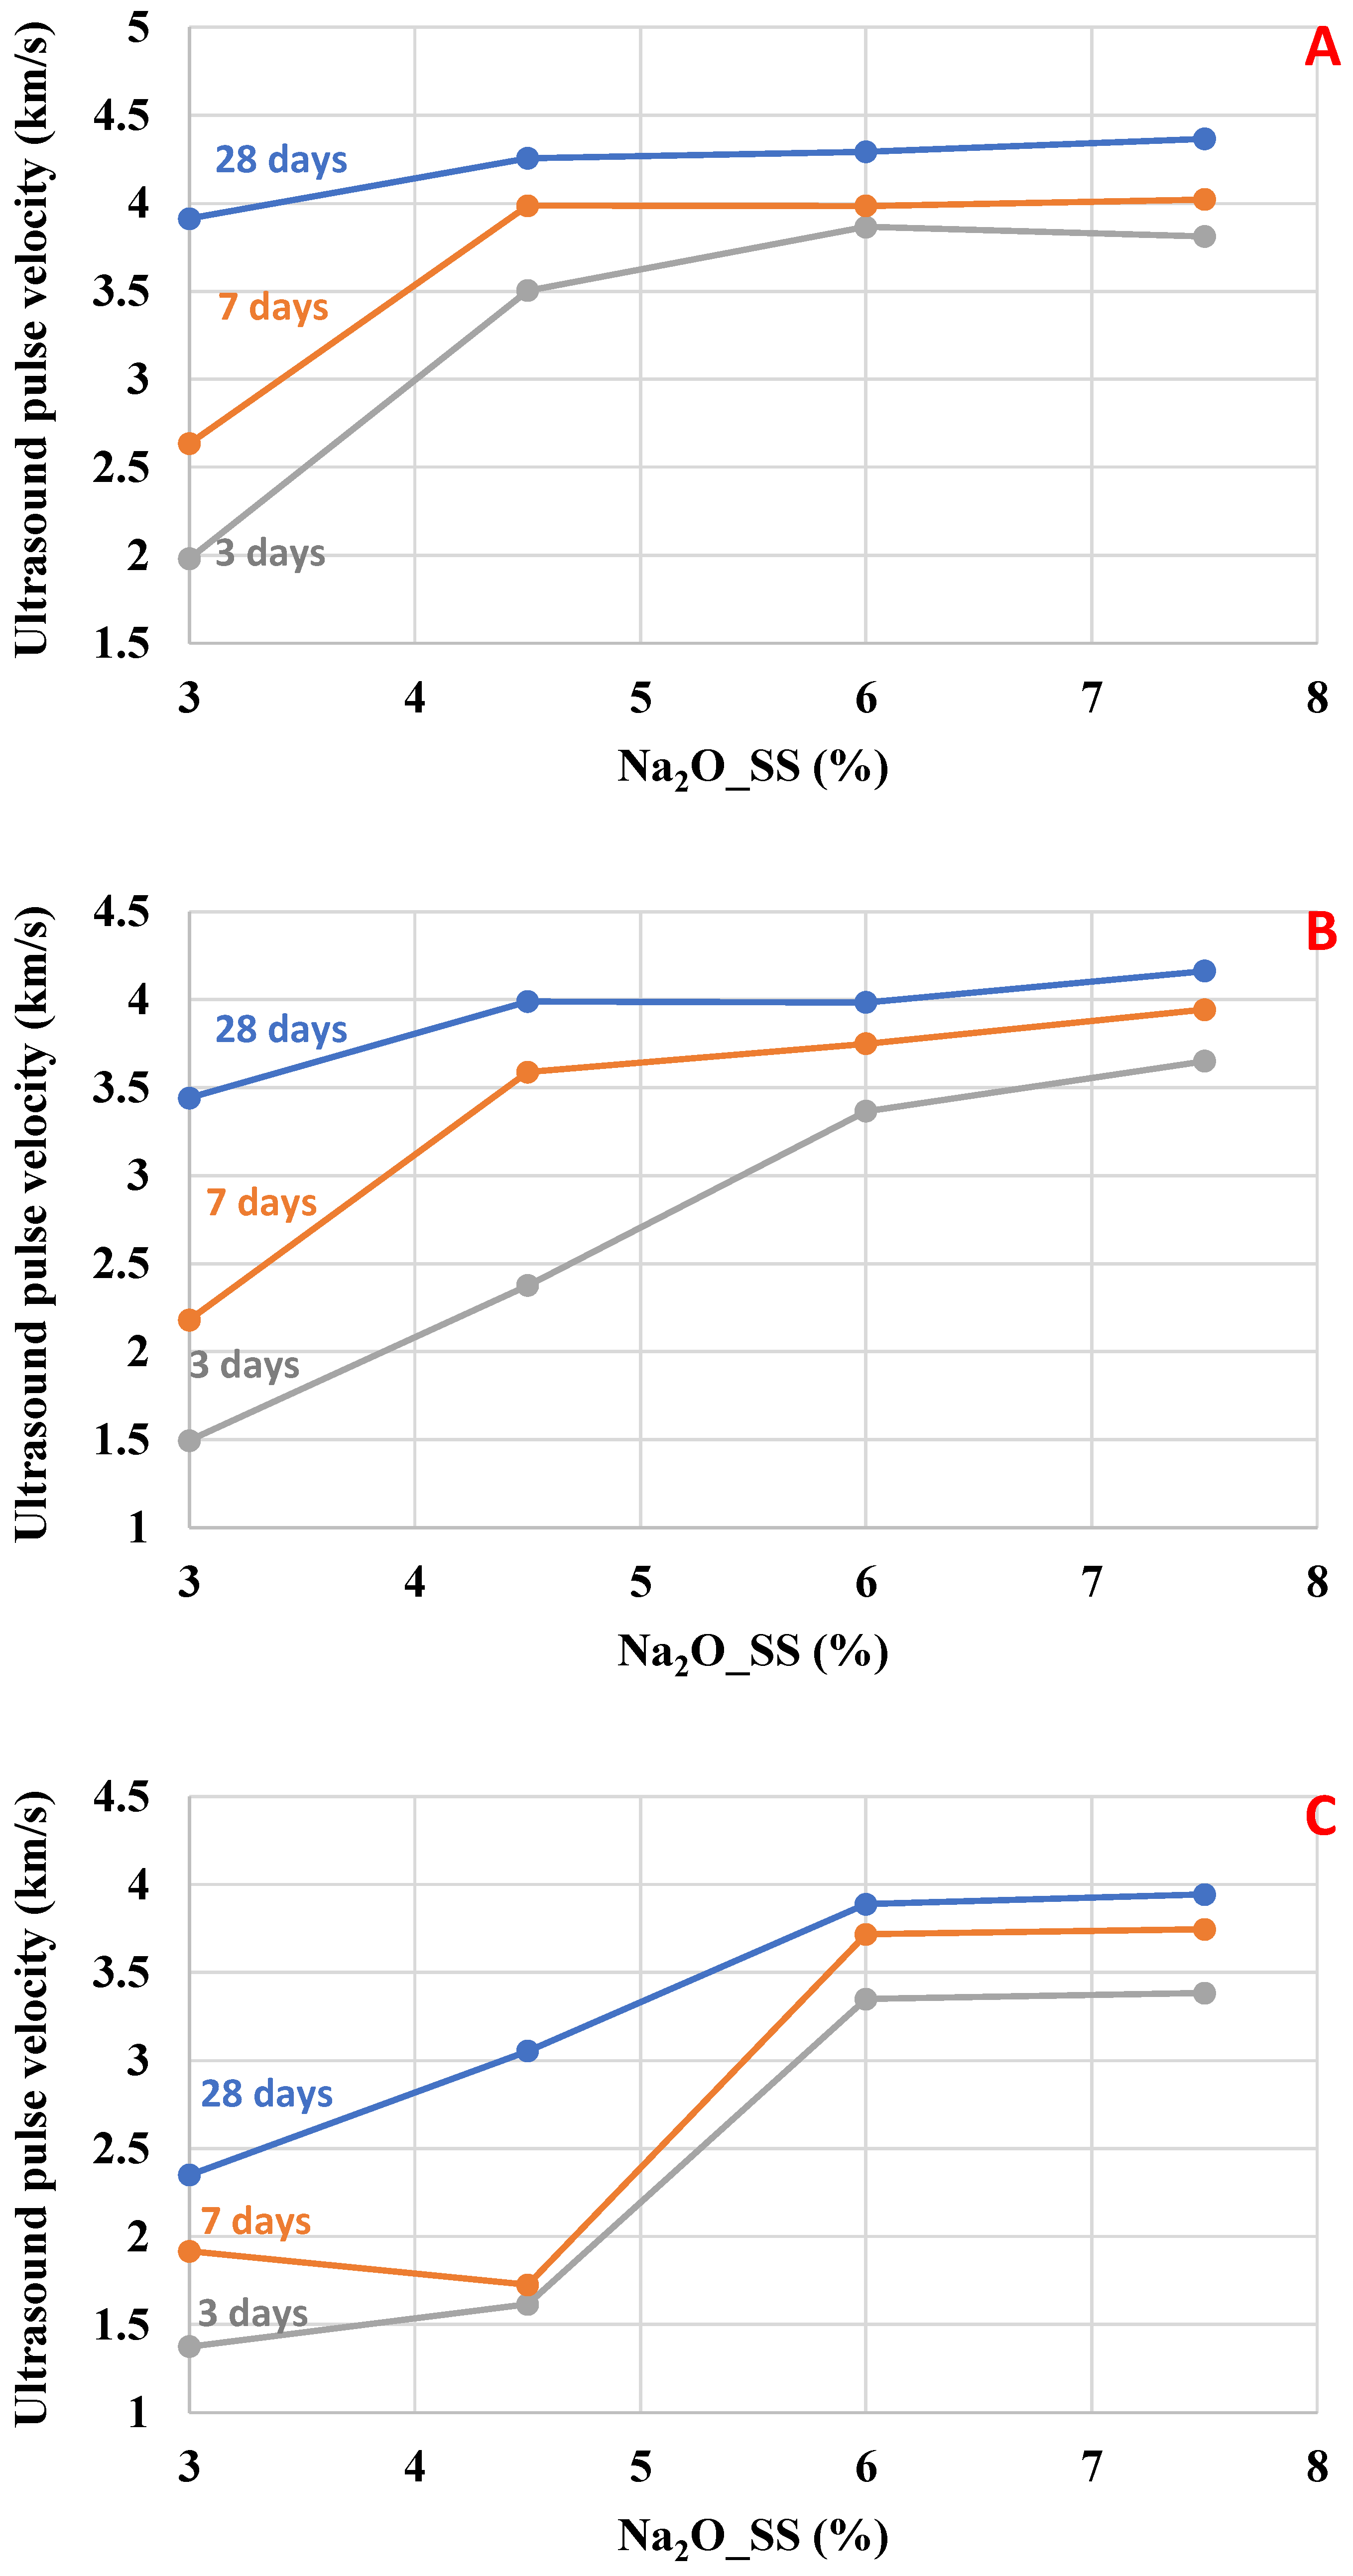
As observed in
Figure 4 and
Figure 5, the
UPV increased as the Na
2O content increased, which is attributed to the higher dissolution rate of the slag and the accelerated formation of C–(A)–S–H, leading to a denser microstructure and faster stiffness gain. Also, the influence of the water/binder ratio on
UPV decreased as the water/binder ratio increased.
Toward the mixtures activated by SMP (
Figure 4), the upper range value for
UPV is 4.2 km/s. This value was reached by the mixtures with w/b = 0.45 and Na
2O dosages of 6.0 and 7.5%. This behavior agrees with microstructural data published in another paper [
24], in which the high alkaline dosage accelerates the dissolution of BFS and, consequently, increases the hardening of the mixtures. Regarding the early ages, the influence of Na
2O (%) concentration of the alkaline activator is noticeable. The dosage of 7.5% Na
2O increased
UPV at 3 days, which reached values close to 7 and 28 days, which suggests that high alkali dosages strongly accelerate the hardening at 3 days; however, at 28 days,
UPV values are close between the dosages of 6.0% and 7.5%.
Similar conduct was found for the mixtures activated with SS (
Figure 5). The samples reached a maximum of 4.4 km/s with the 7.5% Na
2O dosage. Especially with 4.5% Na
2O activator content, the velocities at 3 days are lower compared to mixtures with higher Na
2O content, but the results are close at 28 days for w/b = 0.45 and 0.55. The values at 28 days were very close, comparing the mixtures activated with 6.0 and 7.5% Na
2O (%), suggesting that the system reached a saturation point where the excess alkali did not further enhance hydration, and microcracking may have limited the final densification.
3.3. Correlation with Compressive Strength
The compressive strength,
UPV, and dry density results can be checked in this paper’s
Appendix A. The correlation between compressive strength and
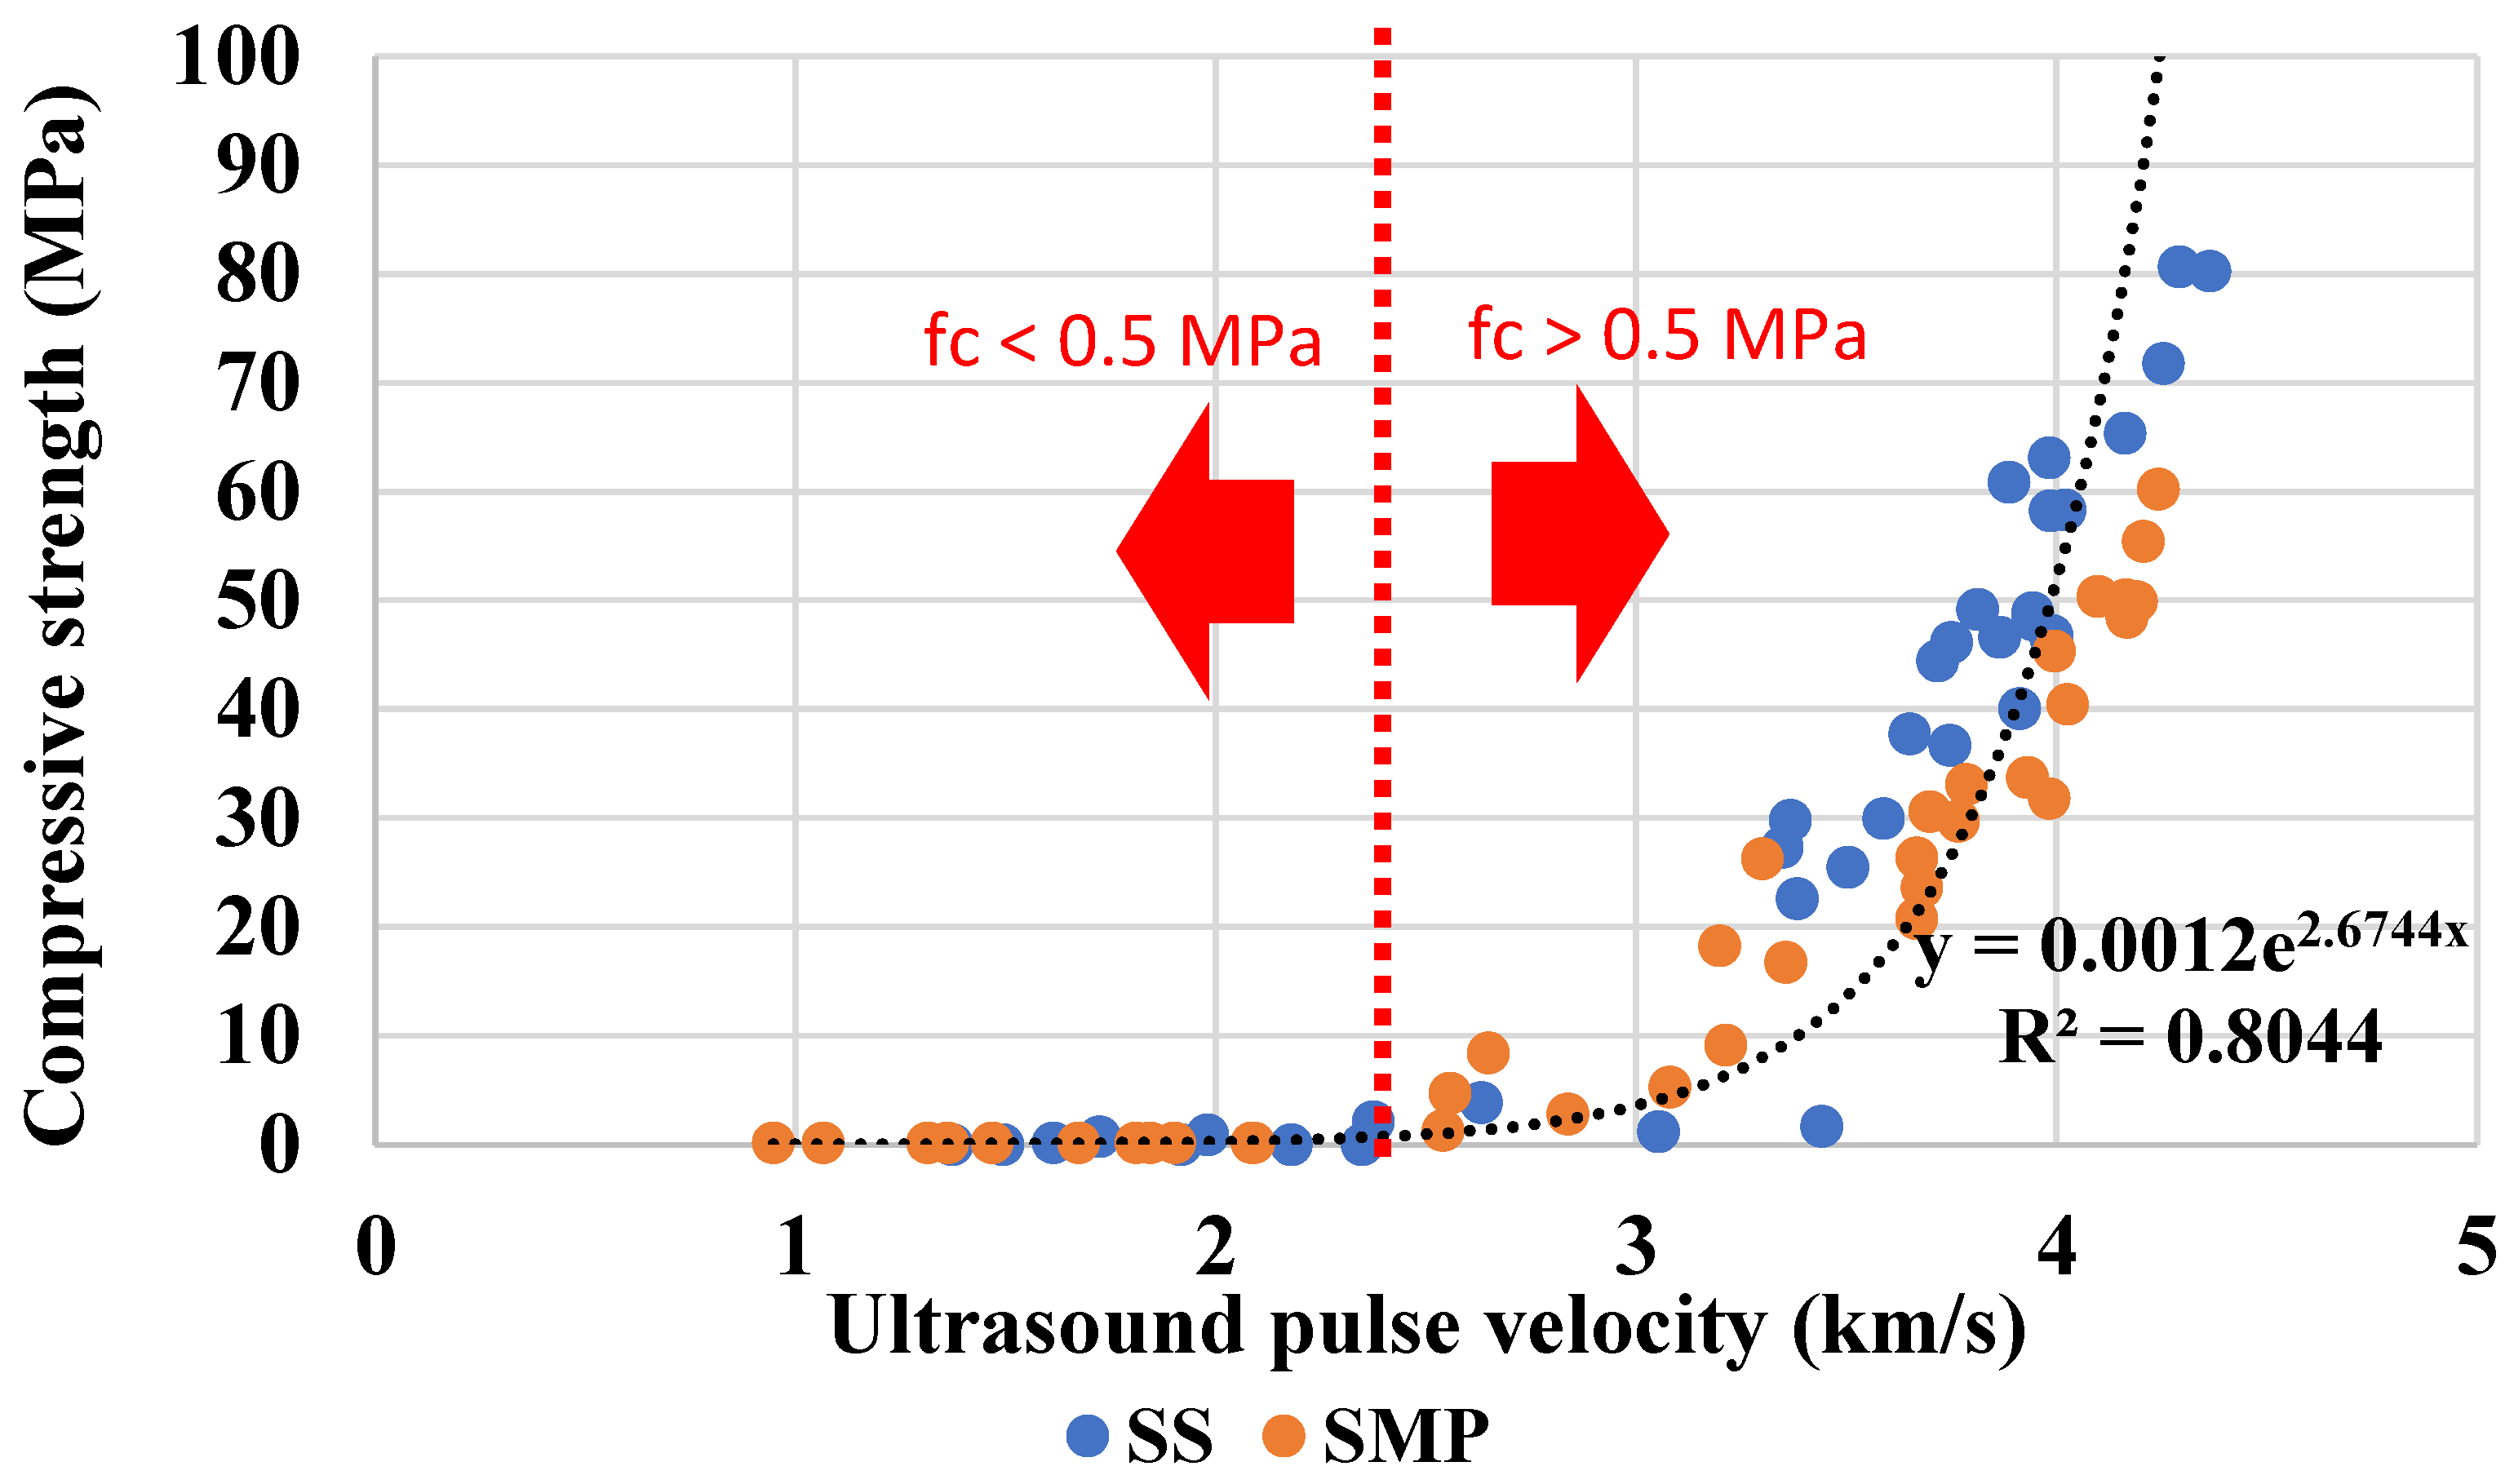
UPV is exposed in
Figure 6. One of the questions raised by this paper concerns the ability of the ultrasound technique to predict the variations in the hardened properties caused by the difference in the alkali dosage of the activators.
Figure 6 shows slight variations in compressive strength when the dosages of 6.0 and 7.5% were compared. Notwithstanding, it is possible to note the strength development due to the hydration reactions over time. Although limitations have been presented for the ultrasound test,
Figure 6 shows an important correlation of this technique with compressive strength data.
The exponential correlation reflects two distinct stages of material consolidation: a low-velocity regime dominated by early gel formation, and a high-velocity regime associated with significant strength development and matrix densification. Up to approximately 2.1 km/s, compression results are zero. Even if some hydration reactions occur and the specimen presents some rigidity, it is still insufficient to gain strength. On the other hand, samples with a velocity greater than 2.2 km/s begin to show significant compressive strength, and the curve tends to a steep straight line. It can also be observed that the samples activated with SMP presented slightly higher velocities for an equivalent resistance than the samples with SS.
The global equation with data of mixtures activated by SMP and SS was
fc = 0.0012e
2.6744UPV, according to
Figure 4. Nevertheless, the samples activated by SMP and SS must be analyzed separately to predict the compressive strength more accurately. The equations found were
fc = 0.0032e
2.39UPV (R
2 = 0.92) for mixtures with SMP and
fc = 0.0021e
2.55UPV (R
2 = 0.81) for mixtures with SS. Analyzing the general equation (Equation (1)), in a study with concrete developed by Trtnik et al. [
12], the coefficients of the equation were distant from the equations found by the authors, which were 0.0312 and 1.4896 for α and β, respectively. In another study with paste and concrete, Irrigaray et al. [
7] found equations in the format
fc = α(
UPV)
β and found the values of 3 × 10
−14 and 4.2778 for α and β in the pastes, respectively, with R
2 = 0.9766. Compared to the mixtures of concretes, the determination coefficient of the correlation between
UPV and compressive strength was higher when pastes were tested. Comparing this study with the literature is limited because the studies are usually conducted in concrete, which presents higher values for
UPV owing to the presence of coarse aggregate. It is also worth mentioning that most studies that delve into the study of ultrasound are conducted in Portland cement, as is the case with the articles cited in the current paragraph. Furthermore, those equations did not consider that, until a specific
UPV, the compressive strength of the specimens is near zero. Therefore, in those studies, the extrapolation of the curves can lead to errors in the prediction of compressive strength.
Another possibility with the employment of the ultrasound is to provide rapid information about the range of compressive strength that the sample is inserted. This way, the predicted compressive strength values were sorted into ranges, as shown in
Table 2. As previously stated, specimens with
UPV below approximately 2.1 km/s show compressive strength near zero. On the other hand, there is a limitation to identifying compressive strengths above 50 MPa; thus,
UPV values barely surpass 4.0 km/s.
3.4. Correlation with Dry Density
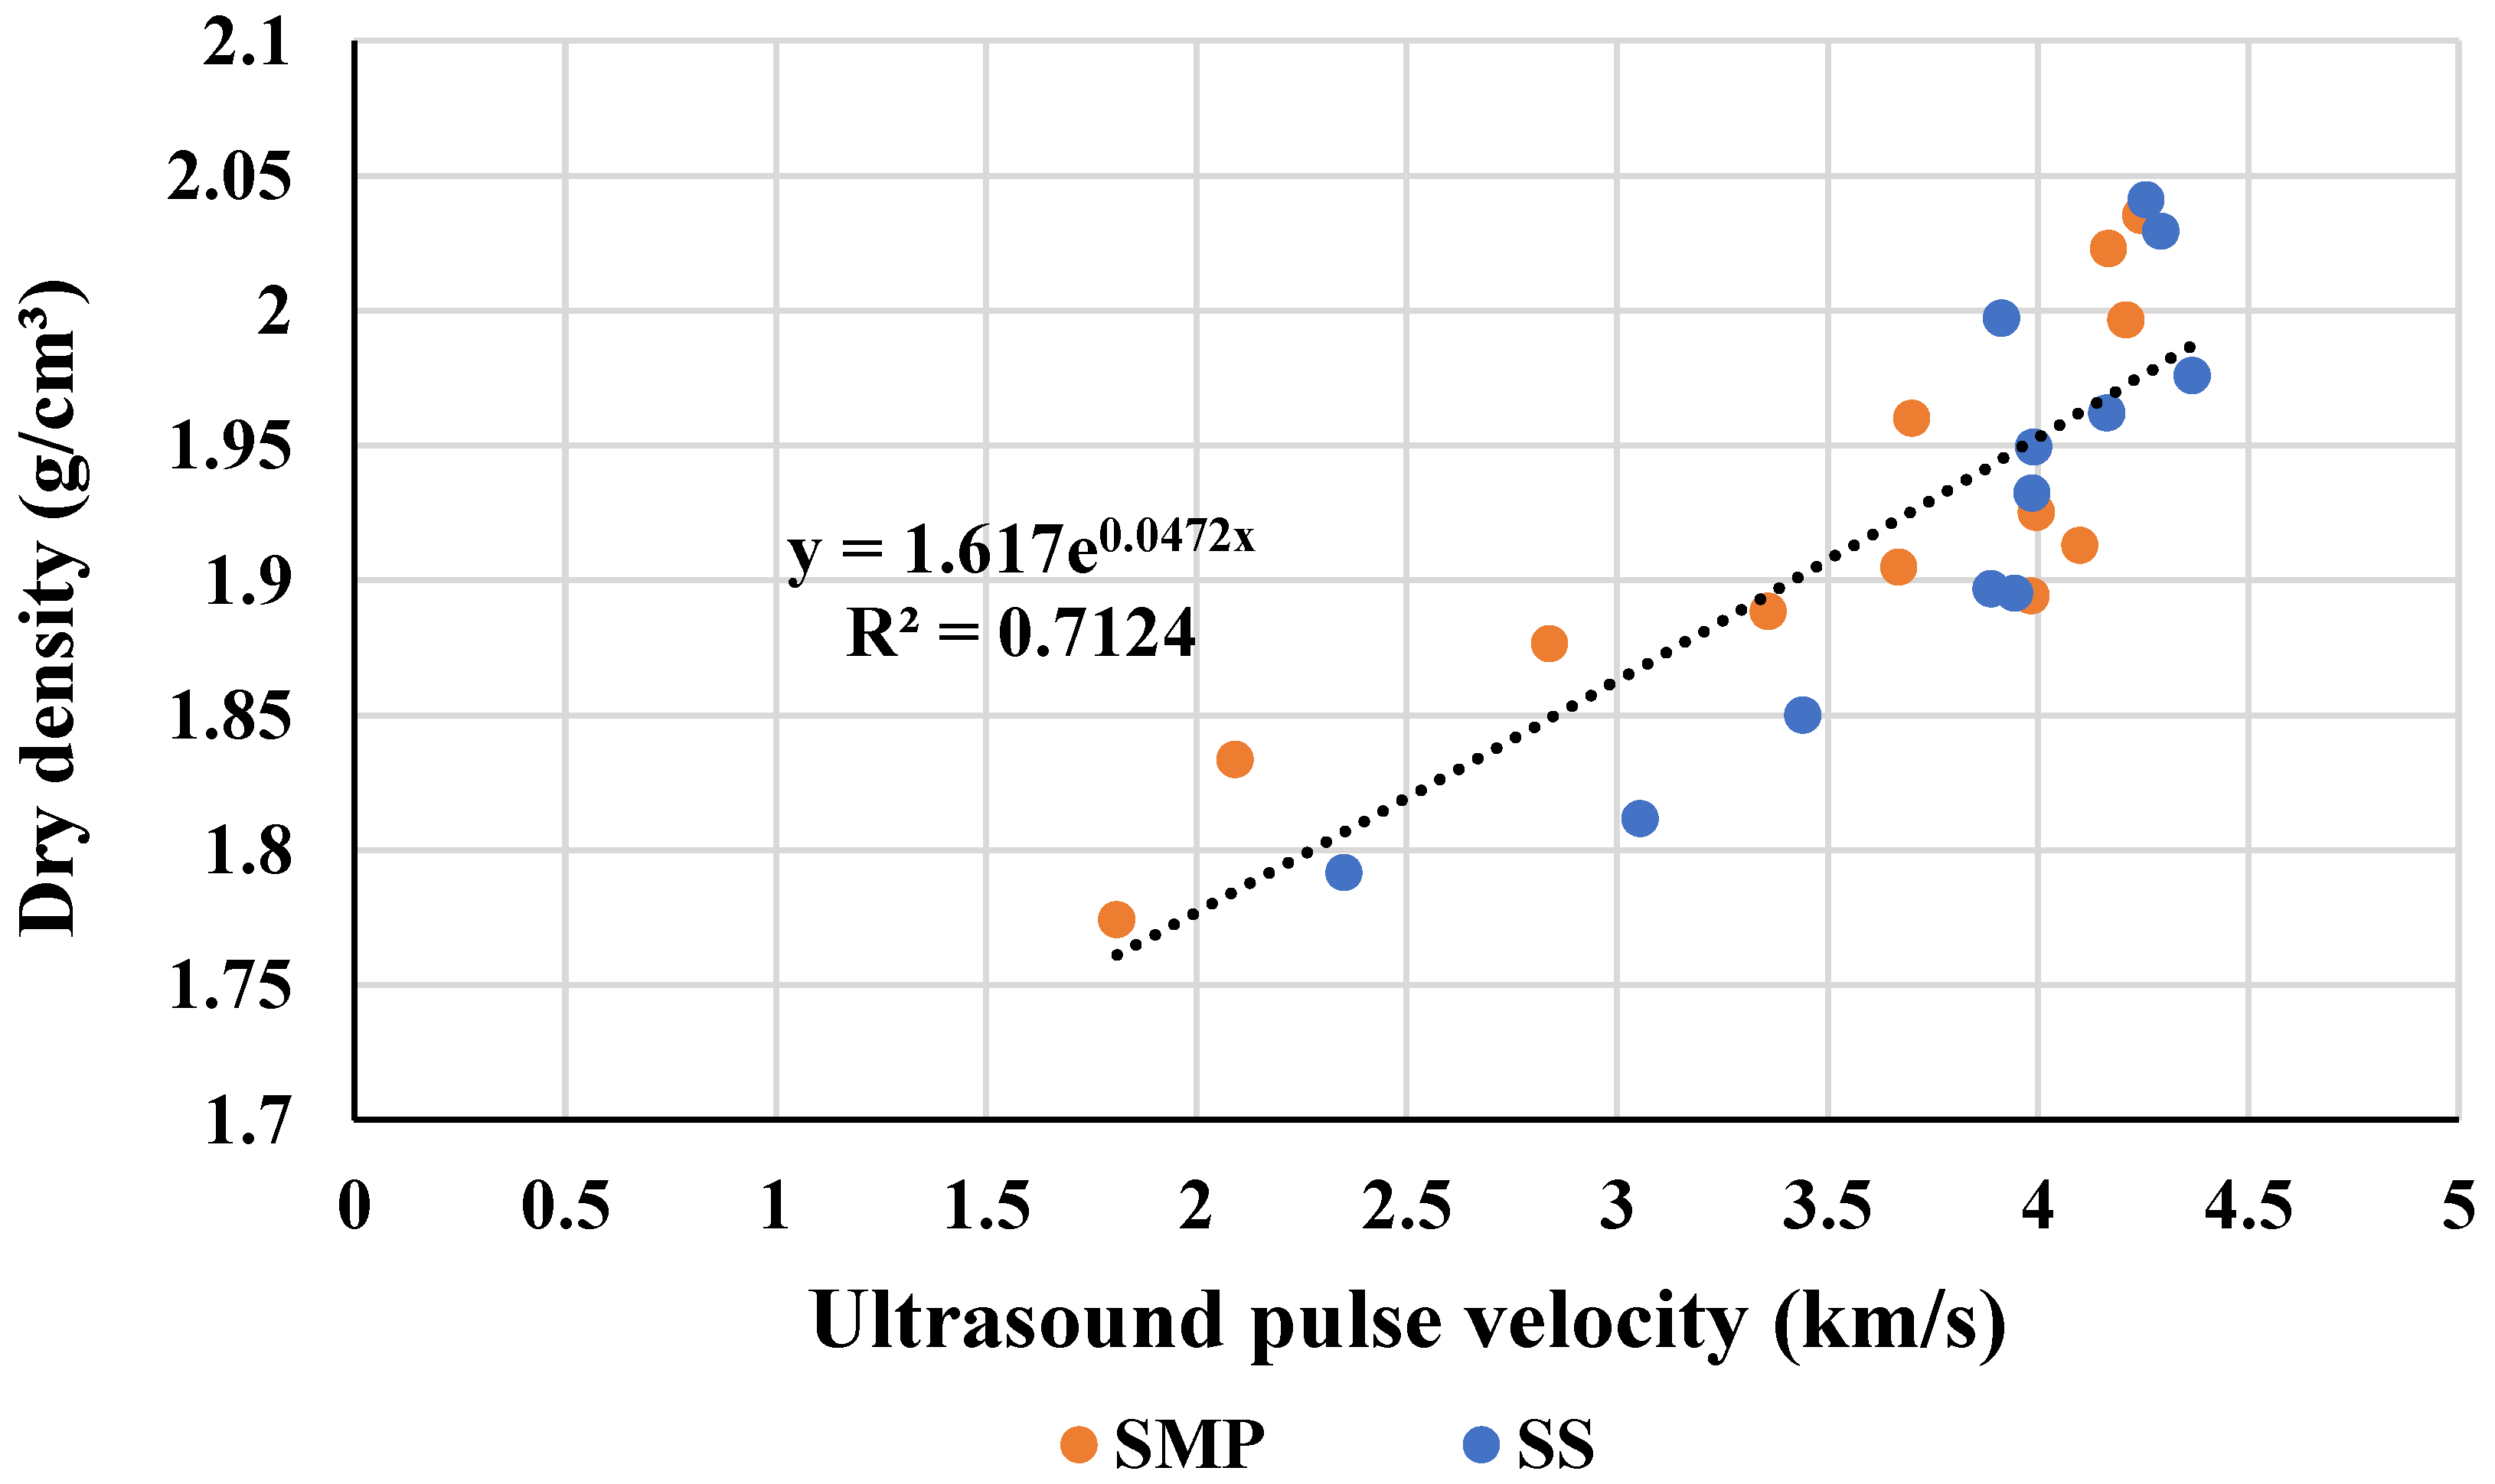
The correlation between dry density and
UPV is shown in
Figure 7. The global equation, including data of activation with SMP and SS, can be represented by an exponential relationship, with α = 1.6170 and β = 0.0472, following the model of Equation (1). Separating the data between the types of activators used, the coefficients were
α = 1.6591 and
β = 0.0412 for mortars activated by SMP, and
α = 1.5127 and
β = 0.0635 for mixtures active with SS.
Results of non-destructive tests usually correlate with hardened density because the ultrasonic pulse takes longer as the porosity of the specimen increases [
31]. Thereby, a high correlation between specimens is expected. Revilla–Cuesta et al. [
32] found Pearson coefficients varying between 0.80 and 0.82, since the correlation between density and
UPV. In another study with recycled aggregate, Estolano et al. [
14] concluded that a linear equation can explain the correlation between dry density and dynamic modulus of elasticity with R
2 = 0.94.
Here, an exponential curve was chosen to explain the correlation between dry density and UPV following the same logic of Equation (1). However, the coefficient of determination (R2) showed a medium correlation (0.70–0.80), and some reasons may explain this. First, as explained with the compressive strength results, the UPV technique shows some limitations in identifying cracks and microcracks caused by the excess of Na2O dosage in the activators. Another possibility is the occurrence of gelling caused by the low silica modulus of SS, which the ultrasound may not capture. Even so, UPV can provide a reliable estimate to predict dry density.
3.5. Predicting Dynamic Modulus of Elasticity
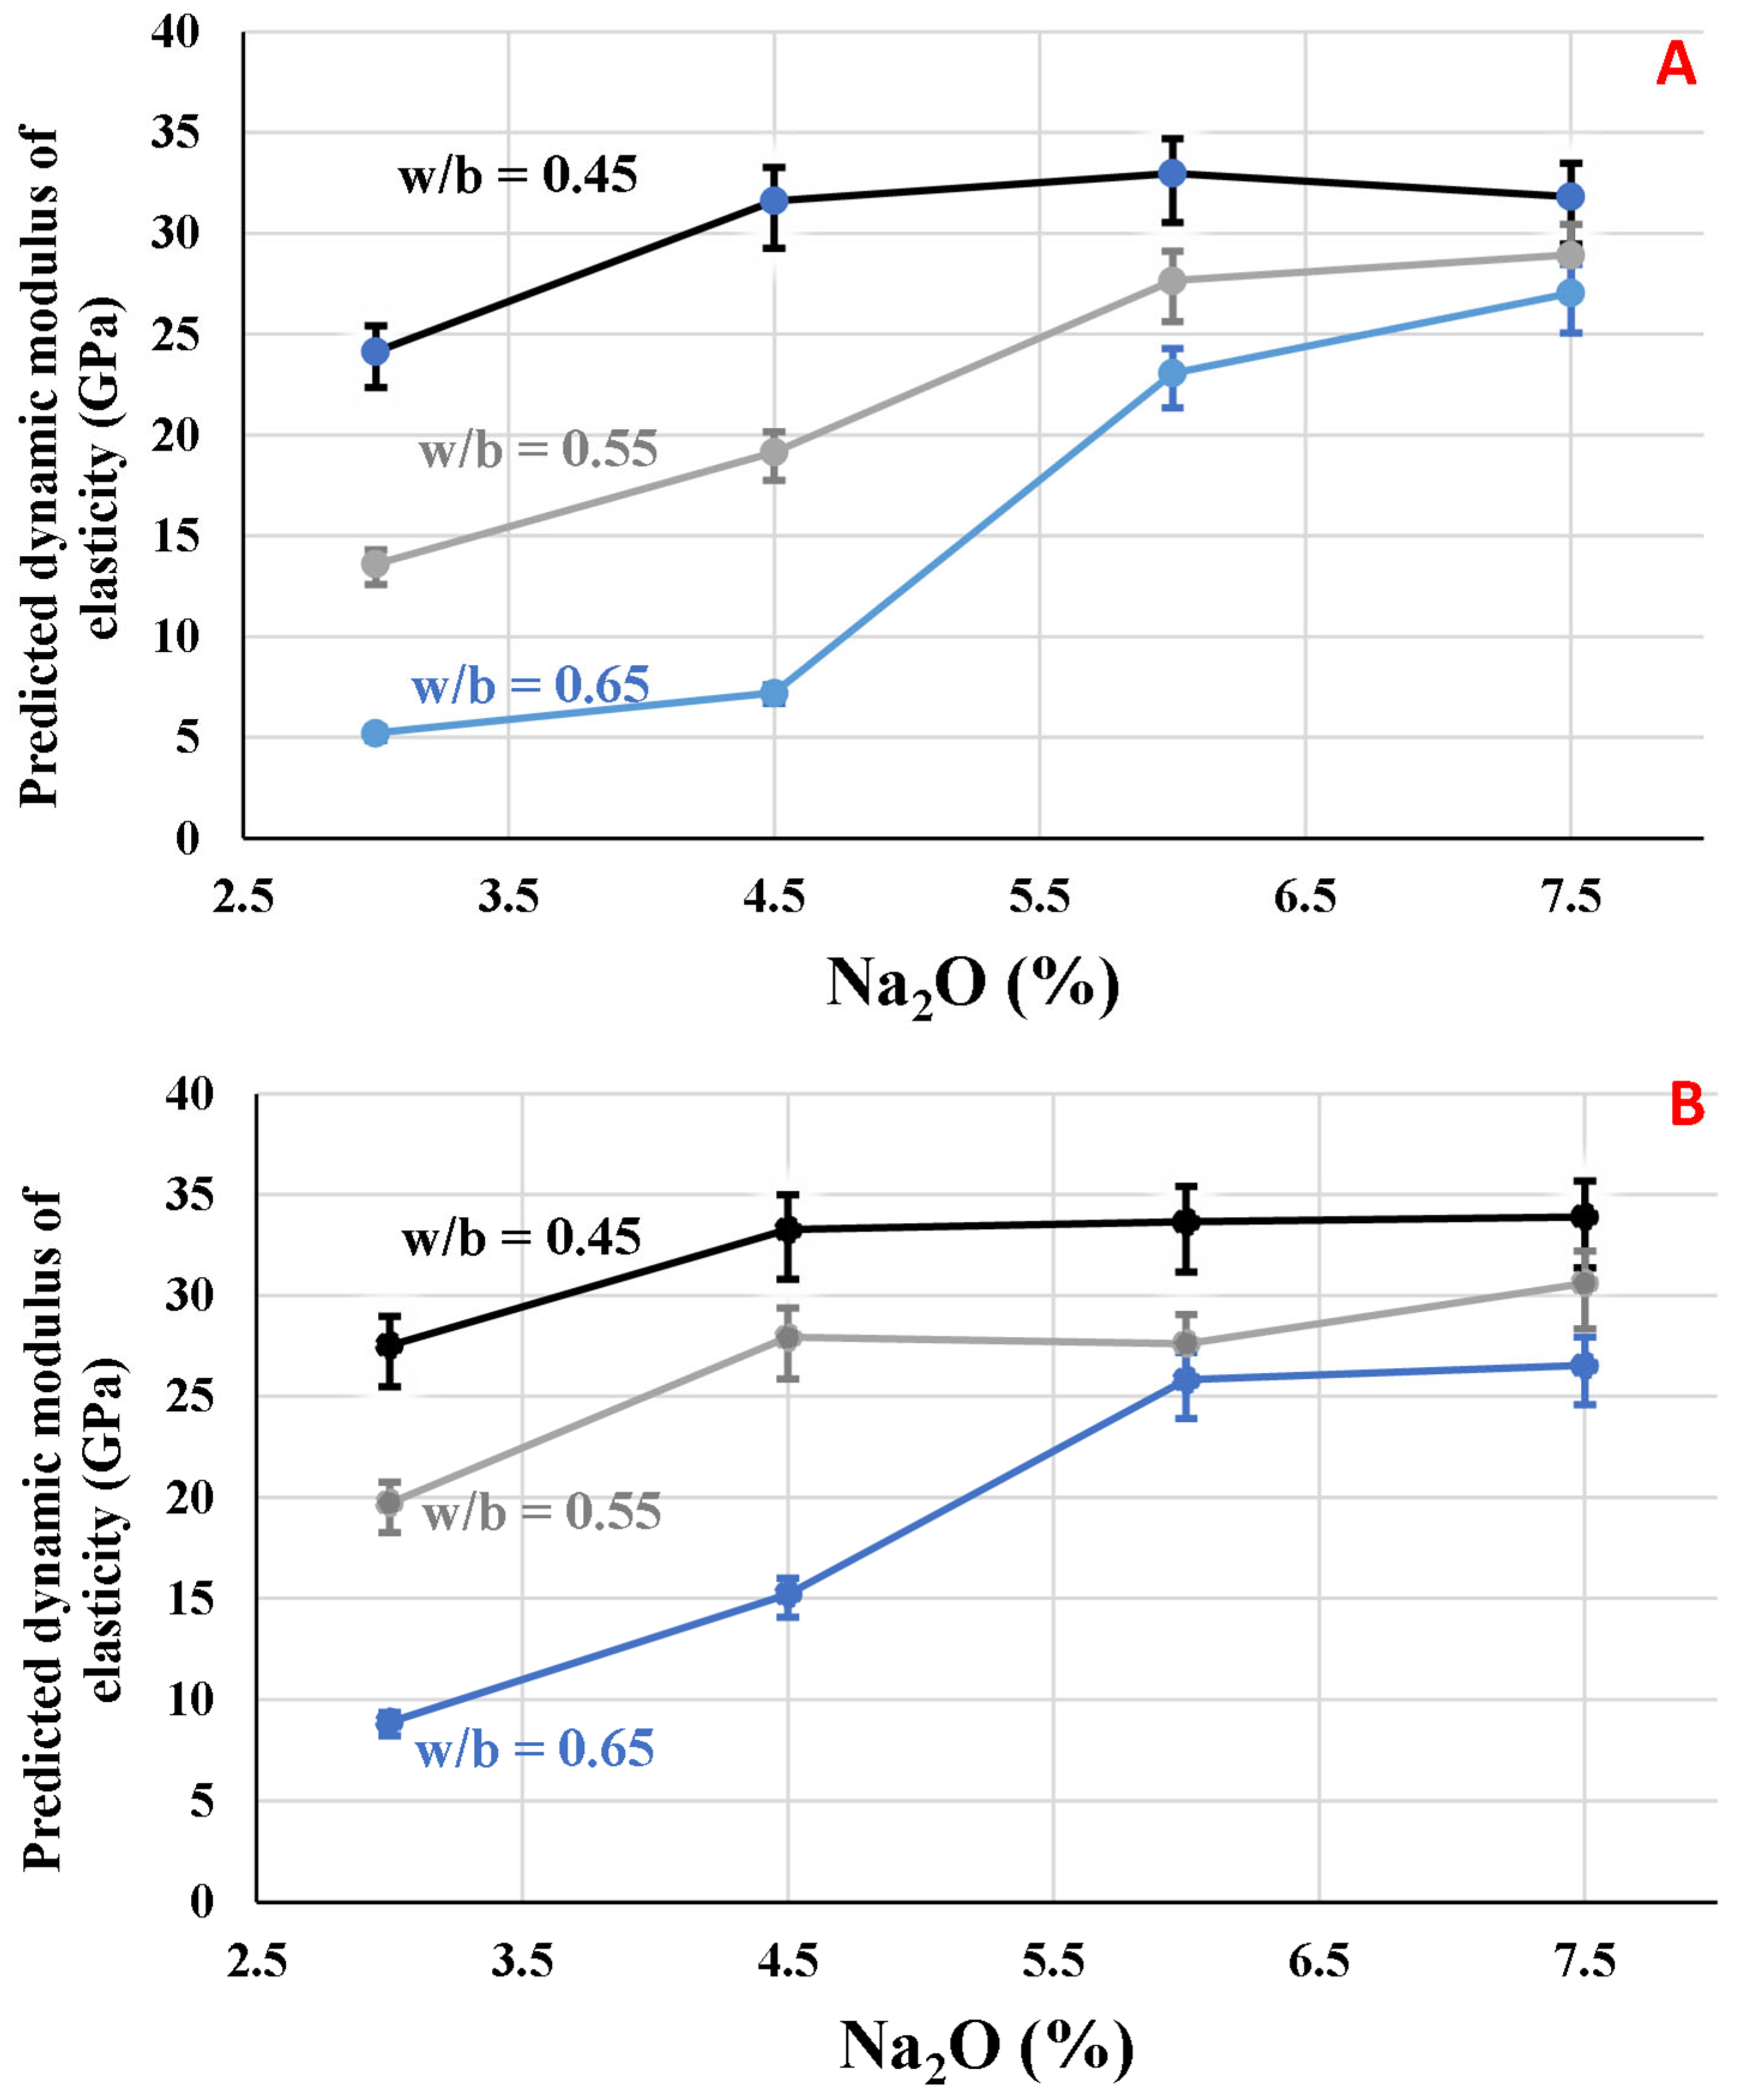
To predict the dynamic modulus of elasticity (
Ec,d), Equation (2) was utilized, varying the Poisson’s coefficient among 0.15, 0.20, and 0.25.
Figure 8 shows these results, where the data using
µ = 0.20 corresponds to the spots, and the predicted values with
µ = 0.15 and 0.25 correspond to the superior and inferior bars, respectively.
The maximum value found for the slag mixtures activated by SMP with w/b = 0.45 was obtained for the mixture with 6.0% Na2O, which was 32.98 GPa, varying between 34.71 and 30.54 GPa, considering the variation in Poisson’s ratio. However, for the other water/binder ratios, the mixtures with 7.5% Na2O presented the highest values for dynamic modulus of elasticity, following the behavior of the compressive strength results. Concerning the mixtures activated with SS, the mixtures with 4.5, 6.0, and 7.5% presented similar values, which were 33.27, 33.65, and 33.90, respectively, considering µ = 0.20 and w/b = 0.45. The influence of Na2O is more pronounced in the w/b = 0.65, in which Ec,d was only 8.89 GPa for Na2O dosage = 3.0% and increased to 15.21 and 25.81 GPa when the Na2O content increased to 4.5 and 6.0%, respectively.
Due to the difference in precursors, activators, and mix design methods, it is worth stating that the comparison among studies has several limitations. In a study with fly ash-based geopolymers, Alanazi et al. [
33] found that the dynamic modulus of elasticity was about 20 GPa for mixtures with compressive strengths varying between 40 and 50 MPa. In the same article, mixtures with Portland cement with the same compressive strength range presented a modulus of elasticity surpassing 30 GPa. This occurred because the process of hardening of geopolymers is essentially by geopolymerization. On the other hand, in the alkali-activated slag mixtures, the formation of the C-(A)-S-H matrix occurs by geopolymerization and hydration [
34], leading to stiffer mixtures with a higher modulus of elasticity compared to geopolymers. Thus, the behavior of the modulus of elasticity is similar between alkali-activated slag and ordinary Portland cement hardened blends. In the current paper, the modulus of elasticity varied between 25 and 33 GPa for mixtures with compressive strength in the range of 40–50 MPa, similar to the cement Portland mixtures of the referred study [
33].
4. Discussion
In this study, the ultrasonic pulse velocity (UPV) technique was employed to predict the hardened properties of alkali-activated slag mixtures, following a similar rationale to that used for ordinary Portland cement systems. However, in the case of alkali activation, the analysis becomes more complex because several parameters influence the reaction kinetics and the final microstructure. These parameters can be defined either from an engineering dosage perspective or from chemical formulation variables. In the present research, the key parameter was the Na2O content of the activator, which—as observed here and in other studies from the same doctoral project—strongly affects the dissolution rate of the slag and the subsequent hydration reactions, thereby controlling the hardening behavior of the mixtures.
Regarding the ultrasonic analysis, the results confirmed that UPV can effectively monitor the hardening evolution of alkali-activated slag mortars. An increase in UPV corresponds to a reduction in total porosity and to the progressive development of the elastic modulus and compressive strength. In alkali-activated slag systems, these improvements are intrinsically related to the formation of the C–(A)–S–H gel, which is the predominant hydration product, unlike geopolymers that typically form zeolitic and other aluminosilicate phases.
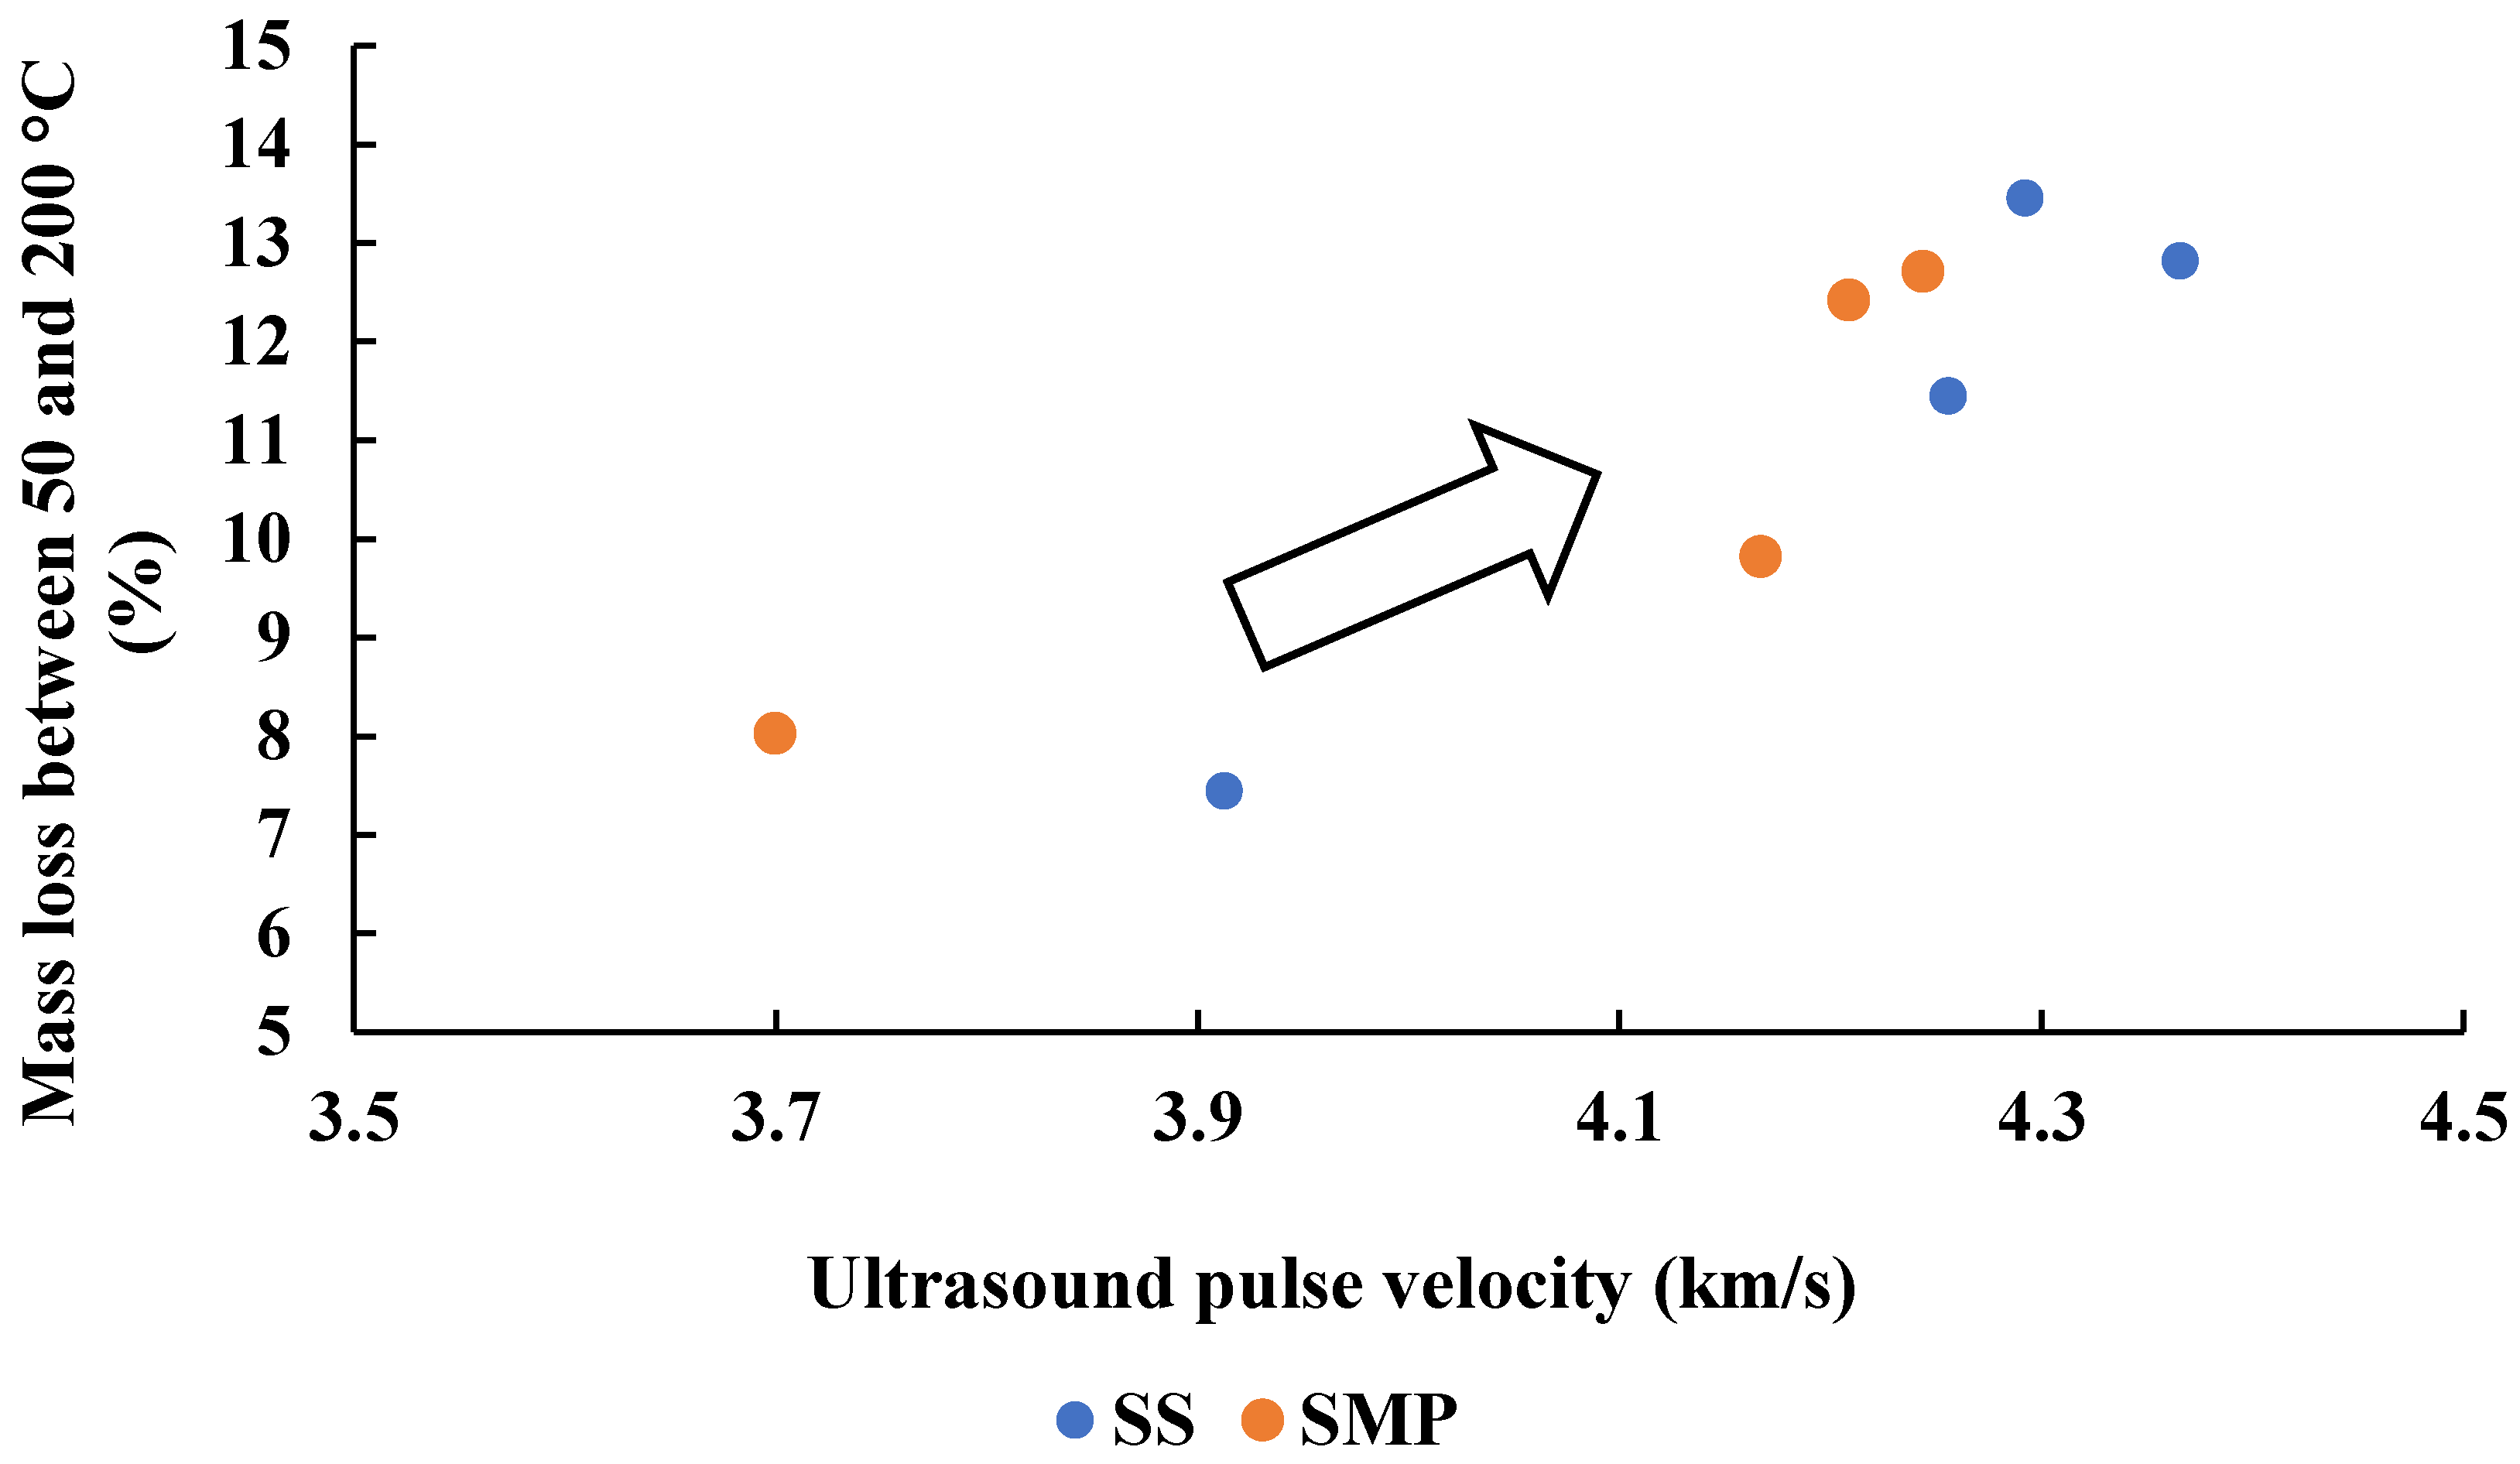
In this context,
Figure 9 presents the relationship between
UPV and the mass loss recorded between 50 and 200 °C in the thermogravimetric analysis, attributed to the release of physically bound water from the C–S–H structure. The figure shows a clear increasing trend in mass loss with increasing
UPV, indicating that the ultrasonic response is sensitive to the rate of dissolution and precipitation processes that govern C–S–H formation. These processes occurred more intensively at Na
2O contents of 6.0 and 7.5%, where the reaction kinetics were accelerated. Therefore,
UPV proved to be a reliable indirect indicator of hydration progress and microstructural refinement in alkali-activated slag mortars.
Previous studies have already demonstrated the potential of ultrasound to monitor the hydration and early-age development of cementitious systems [
18,
19,
35]. Nevertheless, further investigations are still required for alkali-activated binders, since their reaction mechanisms, gel composition, and microstructural evolution differ substantially from those of Portland cement-based materials.
5. Conclusions
This article aimed to use the UPV technique to predict the hardened properties of alkali-activated slag mixtures.
Mixtures with 3.0% Na2O had the lowest UPV values due to the lack of sufficient alkalinity to activate the slag. From 4.5% Na2O, a significant increase in UPV was observed compared to 3%, and it continued to increase less intensely until 6 and 7.5% Na2O. The maximum limit in the UPV values was observed close to 6.0% Na2O.
There was a medium R2 to explain the relationship between dry density and UPV. This can be explained as this velocity is an outcome of the pulse that crosses the length of the sample, so it does not seem capable of identifying the voids caused by the high alkali content. The employment of a 7.5% Na2O dosage led to a decrease in compressive strength and dry density compared to lower Na2O contents.
The dynamic modulus of elasticity of alkali-activated mortars varied proportionally to UPV and compressive strength results. The mixtures obtained a maximum of 33.90 GPa for the mixture with 7.5% activated by SS and 32.98 for the mixture with 6.0% activated by SMP. Even varying the Poisson ratio between 0.15 and 0.25, small variations were observed, confirming that the interval shown was reliable in predicting the dynamic modulus of elasticity.
Lastly, it was noticed that these measurements from UPV correlated with chemical data from the thermogravimetric analysis regarding the estimation of C-S-H content. This indicates that the UPV technique can also be employed to assess the evolution of the reaction hydration of the mixtures.
The ultrasound test proved to be a useful tool in predicting compressive strength ranges. A limit was detected for compressive strength values above 50 MPa. Furthermore, it was found that the hardening of the material is achieved when the pulse speed is above approximately 2.15 km/s. Therefore, although the usefulness of the UPV technique in estimating hardened properties of alkali-activated slag mixtures, care must be taken when measuring high-strength mixtures (>50 MPa), as no significant differences can be observed from this strength level. To confirm this, a more detailed analysis is needed with the application of statistical tools to allow a reliable conclusion about the effectiveness of the use of ultrasound. Nevertheless, the findings indicate that UPV can also be applied as a non-destructive method for monitoring the hardening process and for quality control of alkali-activated slag mortars, providing a practical approach for both laboratory and field applications.
