3.1. Mechanical Behavior
Figure 3 shows the UCS as a function of curing time for (a) 1.0 M, (b) 1.5 M, (c) 2.0 M, and (d) 2.5 M NaOH concentrations, comparing the One-Part and Two-Part mixing methods. In general, UCS values increased with curing time, indicating that the binder reactions continued throughout the entire curing period [
48].
With respect to activator molarity, 1.5 M and 2.0 M yielded higher average strengths compared to the extreme values of 1.0 M and 2.5 M. Overall, an increase in strength was observed with increasing molarity; however, at SCBA/CL ratios close to 1.50, the average UCS values decreased. This reduction can be attributed to the limited solubility at higher molarities, which requires a greater amount of CL to sustain adequate strength development [
48].
Intermediate SCBA/CL ratios of 2.33 and 4.00 yielded higher average UCS values compared to the extreme ratios of 1.50 and 9.00. The SCBA/CL ratio plays a critical role in strength development of alkali-activated materials, as Ca
2+ cations react with silicates in SCBA to form calcium silicate hydrate (C-S-H) phases [
60]. However, both very low and very high calcium contents can impair mechanical strength. Insufficient calcium delays the formation of cementitious products, whereas excessive calcium may lead to Ca
2+ saturation and subsequent carbonation [
48,
60].
The comparison of mixing methods revealed similar results overall, with the Two-Part method showing slightly higher UCS values. This can be explained by the fact that in the Two-Part system, the alkaline activator is fully dissolved prior to mixing, which facilitates reaction with the precursor. In contrast, in the One-Part system, when water is added at the final stage, part of it is absorbed onto the surface of dry precursors and distributed within particle voids, reducing the extent of reaction despite the localized temperature increase [
61]. At 2.0 M NaOH, the highest strength recorded in this study was 1.60 MPa at 28 days with an SCBA/CL ratio of 2.33 using the Two-Part method, while the One-Part system under the same conditions reached 1.39 MPa.
Some possible ways to increase these UCS values would be to evaluate higher curing temperature and longer curing times and to work with a SCBA originating from a controlled burn, which has more amorphous content, greater reactivity and consequently greater formation of cementing gels.
The AAC investigated exhibited a significant increase in UCS values after 7 days of curing.
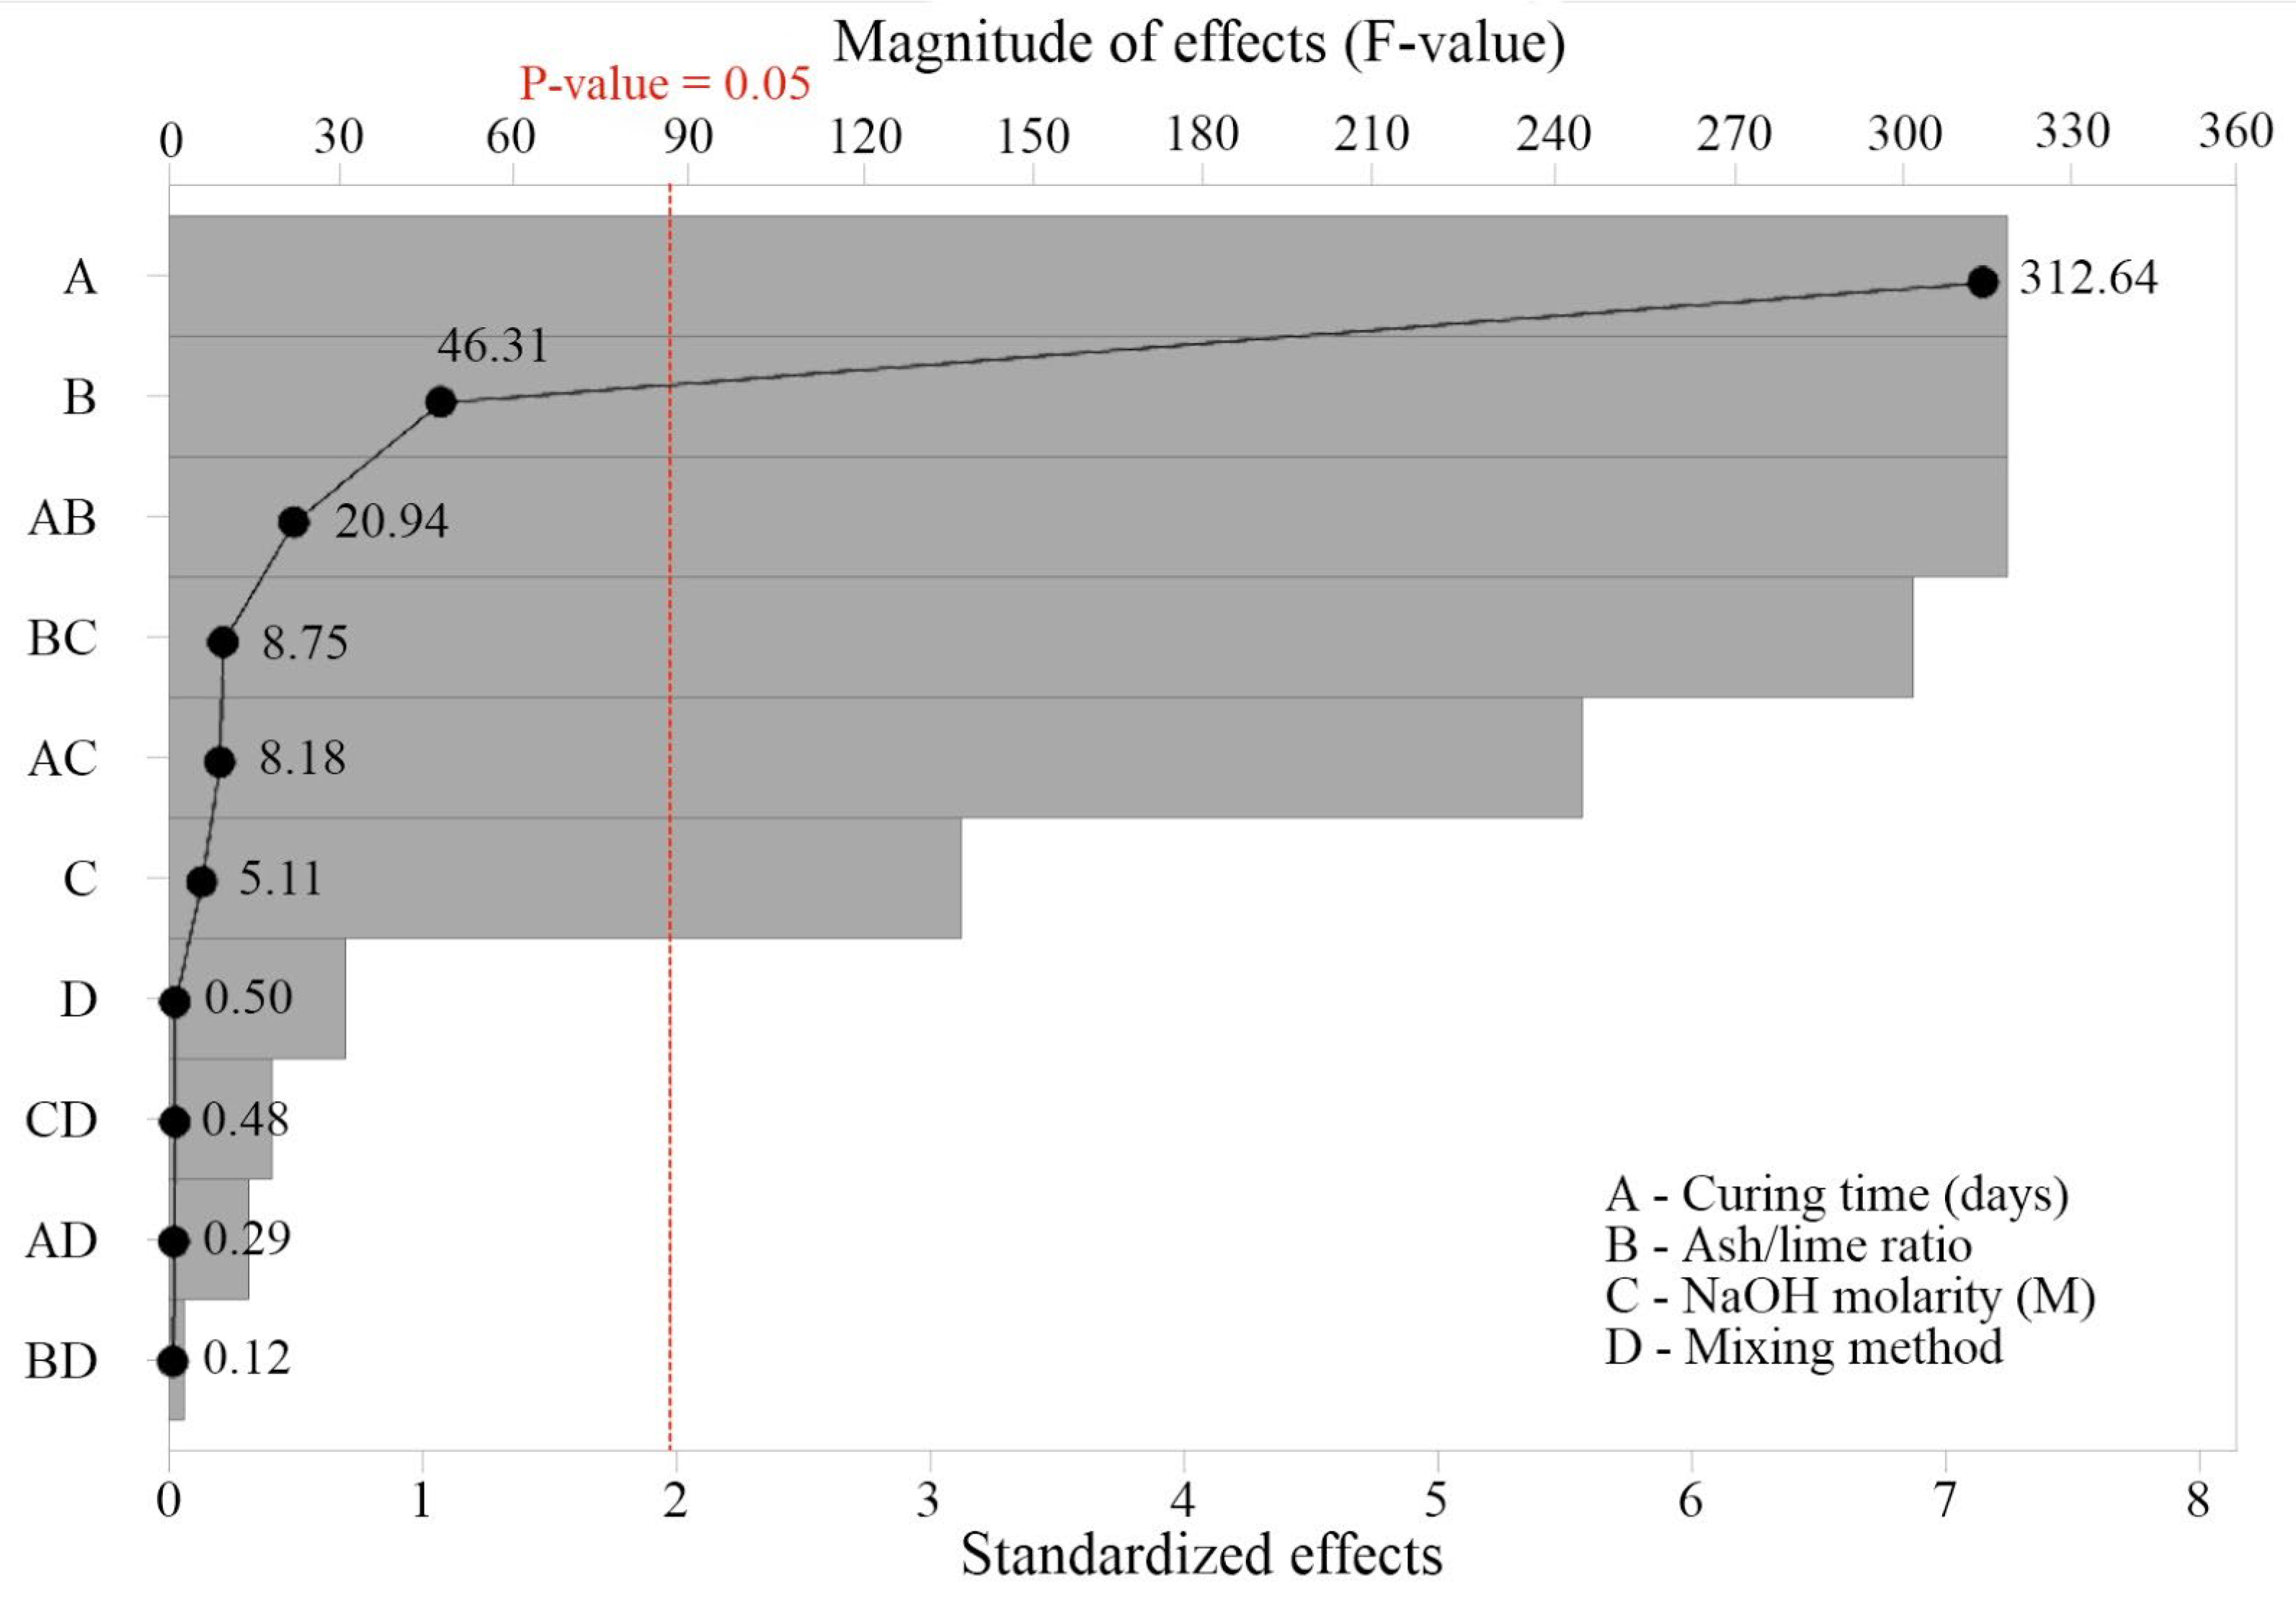
Figure 4 presents the ANOVA results, showing the significance of the controlled variables (A, B, C, and D) and their interactions on UCS. The significant variables (
p-value > 0.05, corresponding to Standardized Effect = 2) were, in order of magnitude of the F-value: curing time (F-value = 312.64), SCBA/CL ratio (F-value = 46.31), and activator molarity (F-value = 5.11).
This behavior is consistent with the results shown in
Figure 3, as curing time was the variable with the strongest influence on UCS. This can be explained by the fact that the hydration and geopolymerization reactions continue to progress over time, provided that reactive constituents remain available in the system. Second-order interactions between the variables were also significant, particularly AB, BC, and AC. In contrast, the mixing method (
p > 0.05; F = 0.50) and its interactions were not statistically significant, confirming the trends shown in
Figure 3, since UCS values for both One-Part and Two-Part methods were very similar.
Table 5,
Table 6 and
Table 7 present the comparison of mean values for the variables considered in isolation, without interactions, based on Tukey’s test at a 95% confidence level. It can be observed that all curing times produced statistically different UCS responses (
Table 5). Strength values consistently increased with curing time, indicating that calcium from CL and silica from SCBA were still reacting, although not fully consumed [
41].
Table 6 shows that SCBA/CL ratios of 4.00 and 2.33 produced statistically similar UCS values, while the extreme ratios of 1.50 and 9.00 yielded significantly lower strengths. Thus, intermediate levels of CL (ratios of 4.00 and 2.33) resulted in higher UCS, whereas extreme values led to strength reduction. Similar findings were reported by Pompermaier et al. [
62]. This behavior occurs because calcium content plays a critical role in the strength development of alkali-activated materials: Ca
2+ cations react with silicates in SCBA to form calcium silicate hydrate (C-S-H). However, insufficient calcium limits the formation of cementitious products and compromises strength [
48,
60], while excessive calcium leads to saturation and carbonation, also impairing mechanical performance [
60,
63].
Among the ratios with statistically similar UCS results, the ratio of 4.00 is recommended, since it incorporates a higher proportion of SCBA. This is advantageous as SCBA is produced in large quantities [
31,
32] and contains a wider variety of oxides, which increases disposal challenges.
Table 7 presents the effect of activator molarity, showing that 1.5 M and 2.0 M yielded statistically similar UCS values, both corresponding to the highest strengths. This suggests the existence of a saturation point in the alkaline activation reaction, where a minimum concentration of Na
+ is sufficient to maximize the formation of cementitious gels [
64]. Therefore, 1.5 M is preferable, as it requires less activator, reducing costs and environmental impacts.
Figure 5 illustrates the main effects of the studied variables on UCS. With increasing curing time, UCS rises continuously due to ongoing reactions. The SCBA/CL ratio shows a linear increase in UCS up to 4.00, followed by a decrease. Regarding NaOH molarity, UCS increased from 1.0 M to 1.5 M, then decreased at higher concentrations. These trends are consistent with Tukey’s comparisons: a minimum concentration of NaOH is necessary to dissolve silica and alumina, but excessive alkalinity reduces compressive strength. Higher alkali concentrations hinder the dissolution of calcium oxide from CL, thereby limiting the formation of C-A-S-H gels and ultimately decreasing UCS [
65,
66].
Although the UCS values obtained with the Two-Part method were slightly higher than those of the One-Part method, the results from both approaches were statistically equivalent within the variables and levels evaluated in this study. The effects of the investigated factors on UCS confirmed the trends already observed in
Figure 3.
Figure 6 presents the contour surface plot for the two most significant variables, curing time and SCBA/CL ratio. The plot shows that higher curing times combined with lower SCBA/CL ratios resulted in the highest UCS values. Accordingly, for the AAC studied, the optimal conditions identified from the statistical analysis were: curing time of 28 days, SCBA/CL ratio of 80/20 (4.00), NaOH concentration of 1.5 M, and One-Part mixing method. Under these conditions, the UCS reached 1.23 MPa, which is close to the maximum value obtained in this study (1.60 MPa).
3.2. Microstructure
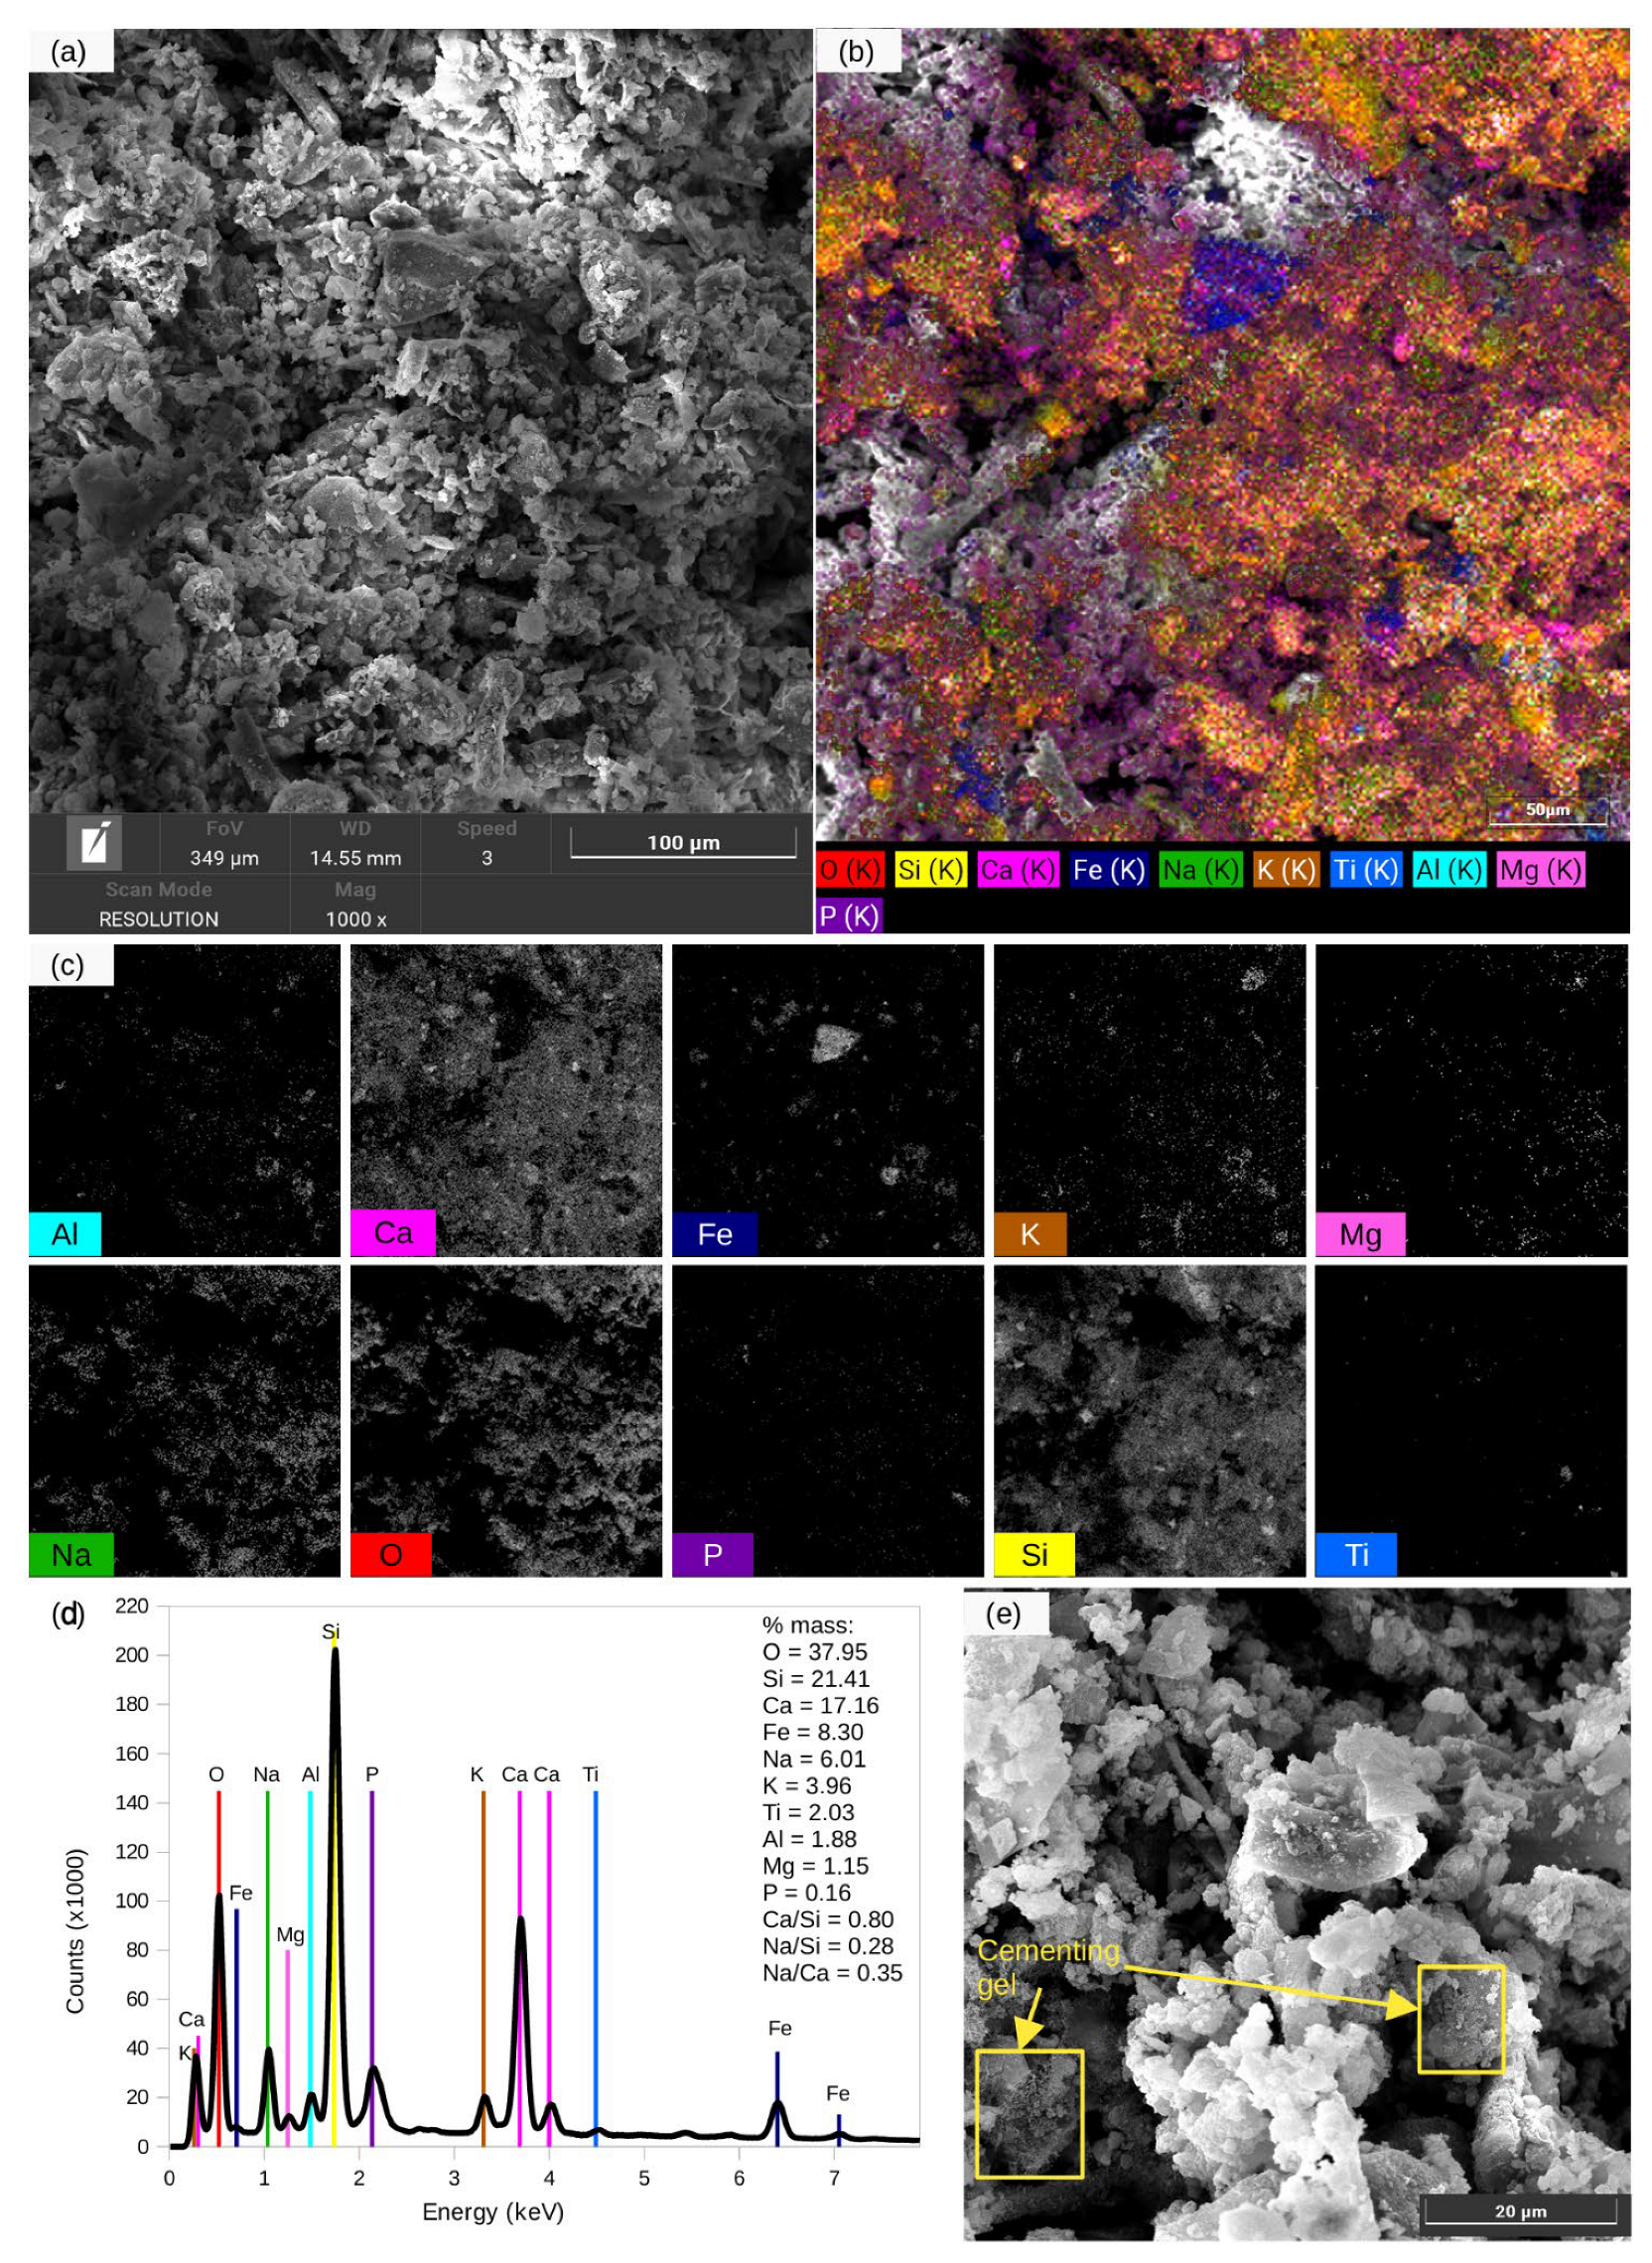
SEM/EDS images of the samples with the best results at 3, 7, and 28 days of curing for the Two-Part method are shown in
Figure 7,
Figure 8 and
Figure 9. As observed in
Figure 7a,
Figure 8a and
Figure 9a, all specimens exhibited a heterogeneous microstructure with intrinsic porosity. The particles displayed varied geometrical morphologies, attributed to the presence of silicon oxides (SiO
2) and iron oxides (Fe
2O
3), as well as the possible formation of hybrid gels C(Na,K)-A-S-H, primarily in the form of calcium silicate hydrates (C-S-H) and sodium-calcium aluminosilicate hydrates (C(Na)-A-S-H).
At 1000× magnification, little difference was visually observed between the samples cured for 3 and 7 days, which is consistent with the UCS results: a significant increase in strength was only achieved after 7 days of curing (see
Figure 5). The specimen cured for 28 days, in contrast, exhibited a denser microstructure and the formation of larger particles.
Elemental mapping by EDS revealed a homogeneous distribution of Al, Ca, Mg, Na, K, P, and O across the surface, while Si, Fe, and Ti showed less uniform distributions and localized clusters, as illustrated in
Figure 7c,
Figure 8c and
Figure 9c. The detection of Al, P, Mg, K, and Ti oxides in minor amounts is consistent with the composition of the raw materials.
Surface composition determined by EDS spectra (
Figure 7d,
Figure 8d and
Figure 9d) showed that the 3-day and 7-day cured samples, both prepared with 1.5 M NaOH and SCBA/CL ratio of 4.00, presented similar concentrations of Na, Si, and Ca. The 28-day cured sample, produced with a higher activator concentration (2.0 M NaOH) and lower SCBA/CL ratio (2.33), exhibited an increase in Na and a decrease in Si content, in agreement with the precursor proportions. For all samples, the elemental ratios ranged within 0.75 < Ca/Si < 1.08 and 0.28 < Na/Si < 0.44.
The EDS spectra of the samples confirmed the formation of cementitious gels in all materials. The presence of Si, together with higher O contents in some regions, reiterates the availability of dissolved silica (SiO2) within the pores.
Higher-magnification SEM images (
Figure 7e,
Figure 8e and
Figure 9e) revealed that longer curing times led to smoother surfaces, suggesting pore closure and increased compaction, which explains the improved mechanical performance. Similar results were reported by Corrêa-Silva et al. [
67]. In addition, EDS analyses identified the formation of gel structures on silica particles, which became denser and less fibrous with curing progression, particularly between 7 and 28 days (
Figure 8e and
Figure 9e).
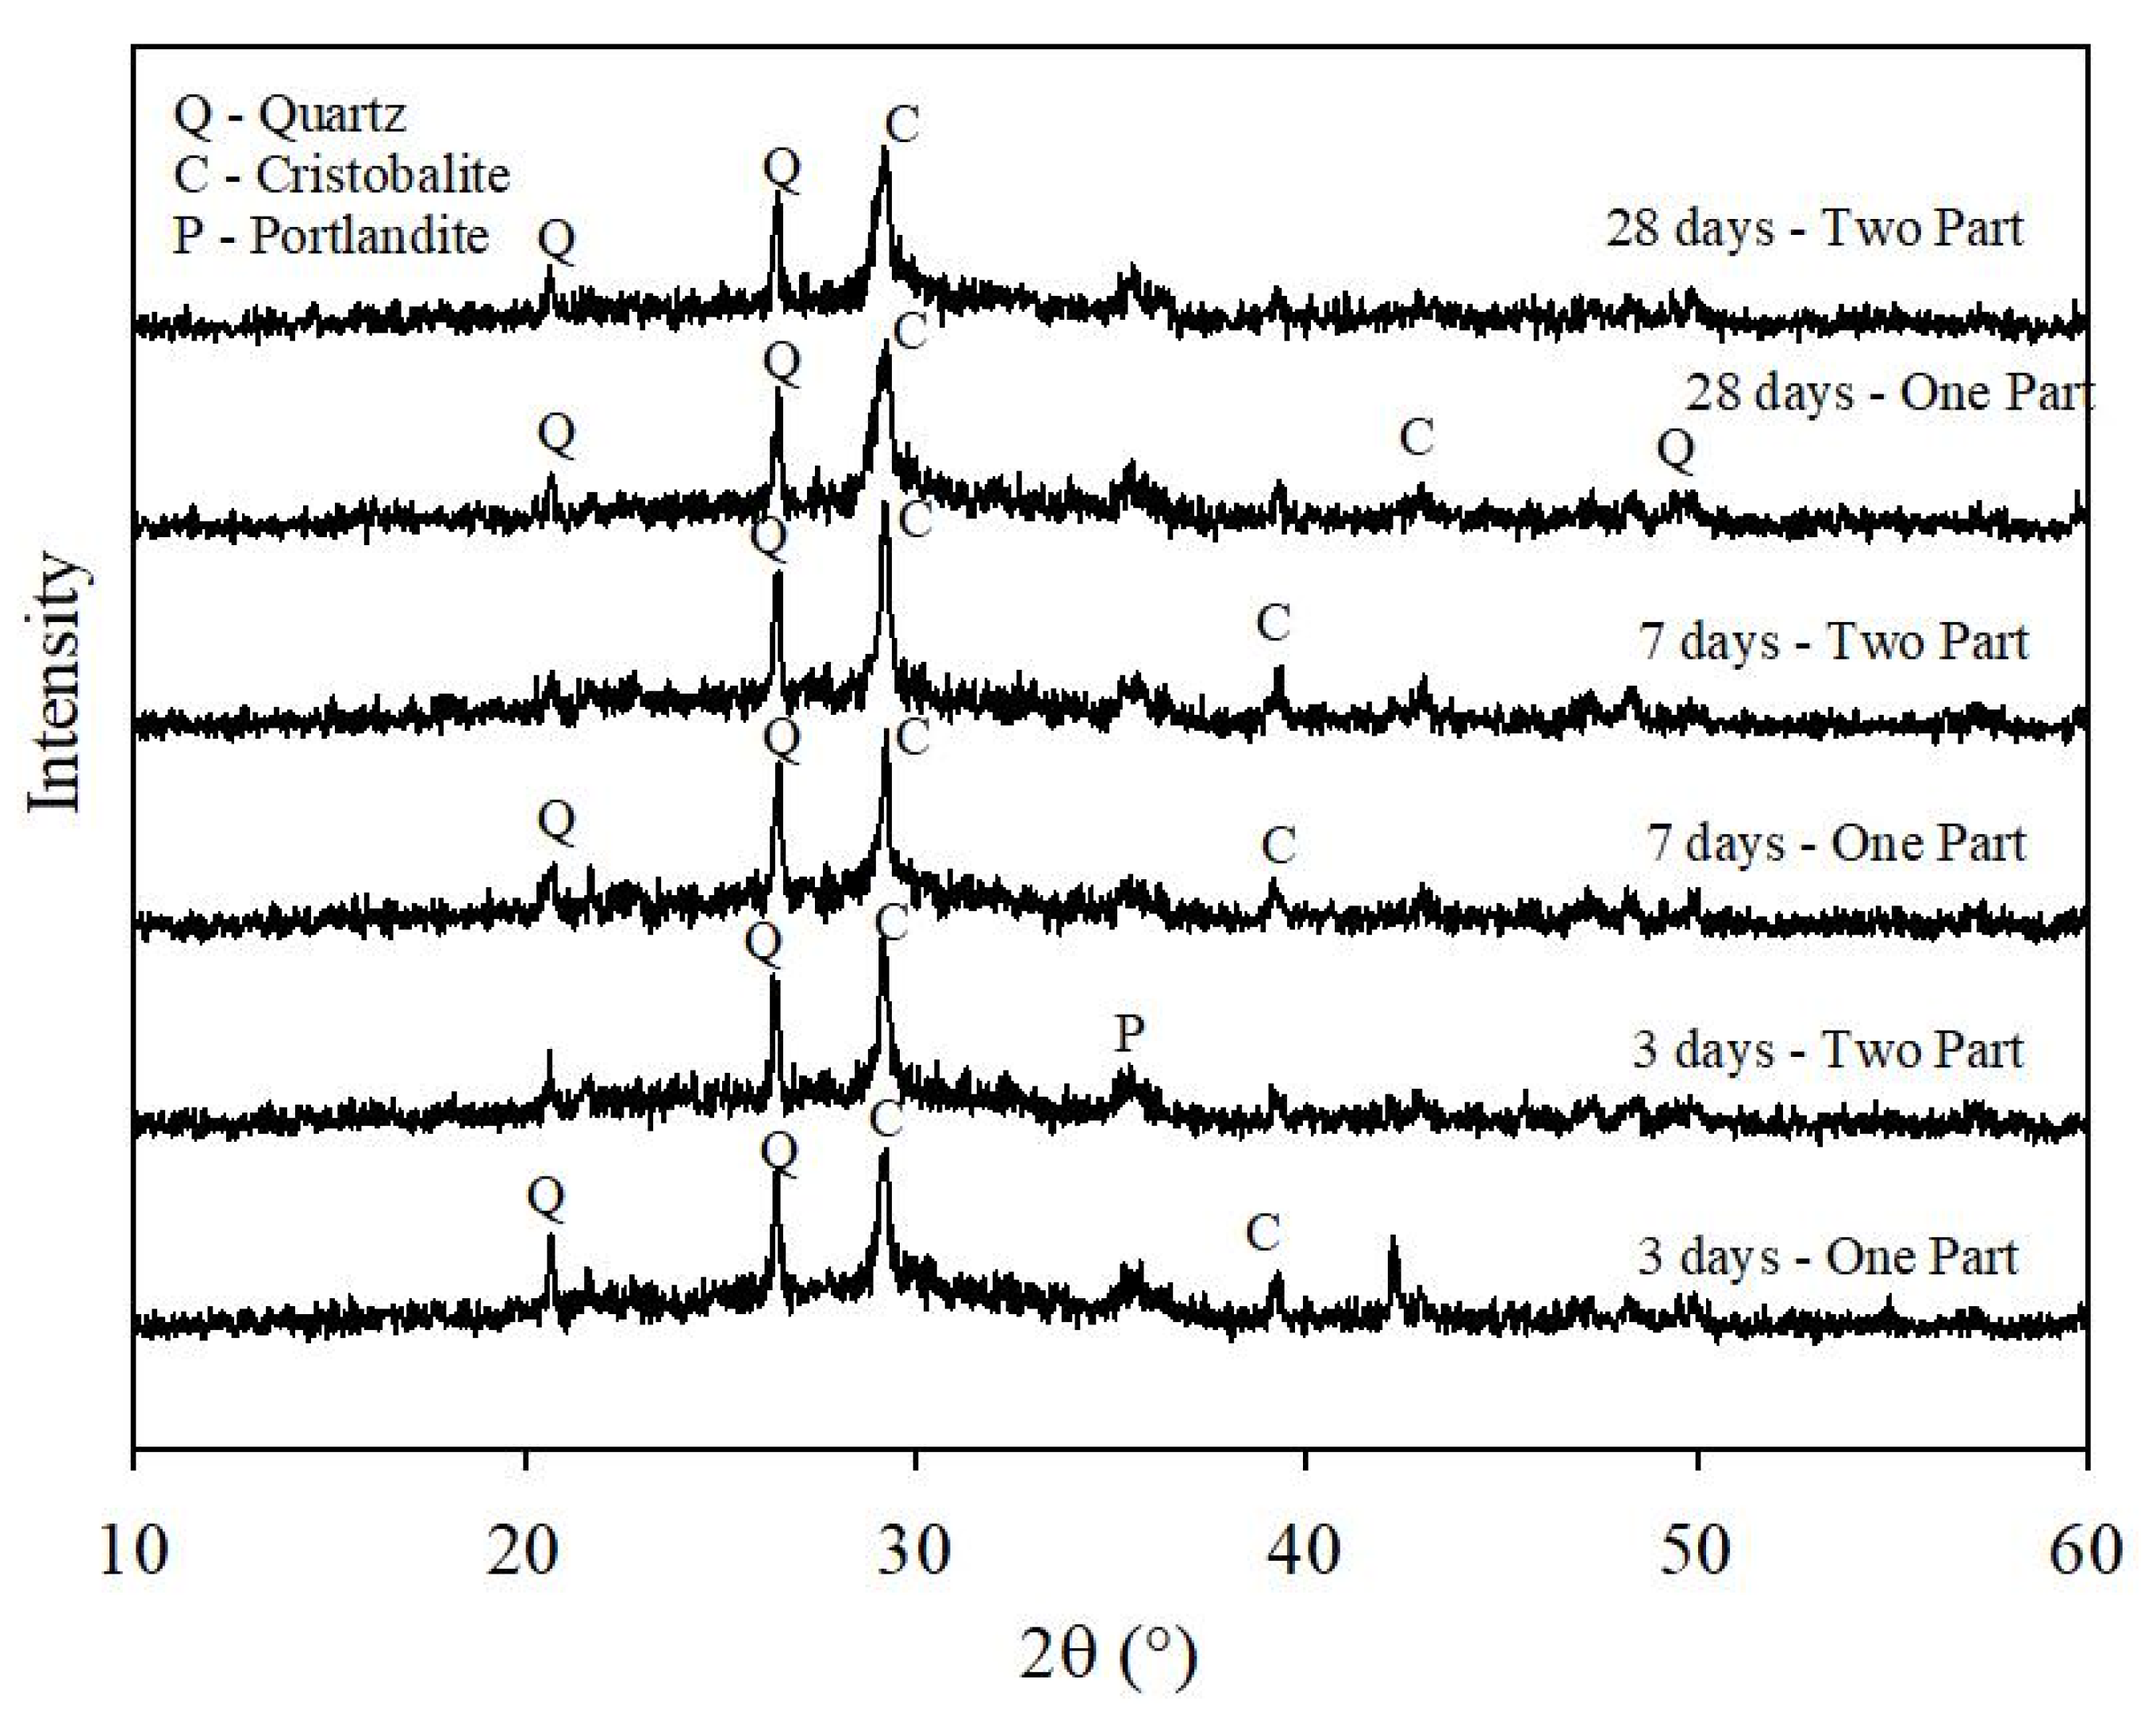
XRD analyses (
Figure 10) indicated a very similar mineralogy among all selected samples, with the presence of semicrystalline and crystalline phases. All samples contained quartz (SiO
2) and cristobalite (SiO
2), originating from SCBA, as well as calcite (CaCO
3) from CL. Only the 3-day Two-Part sample showed portlandite [Ca(OH)
2], derived from CL, which had not yet been fully consumed in the formation of cementitious products at early curing stages.
The formation of N-A-S-H gel fills the voids within the mixtures, contributing to improved UCS results. The presence of this gel is suggested by the amorphous phases observed in the 2θ range of 20–35° [
8]. Although the high intensity of quartz peaks makes it more difficult to clearly identify amorphous phases in the mineralogy of the samples [
68], the diffraction band between 28° and 32° indicates the possible formation of cementitious gels (C-S-H and C-A-S-H), generated by reactions with calcite. This suggests that hydration processes are ongoing, corroborating the results obtained from SEM/EDS analyses [
69]. FTIR analysis was conducted to complement and support the XRD results.
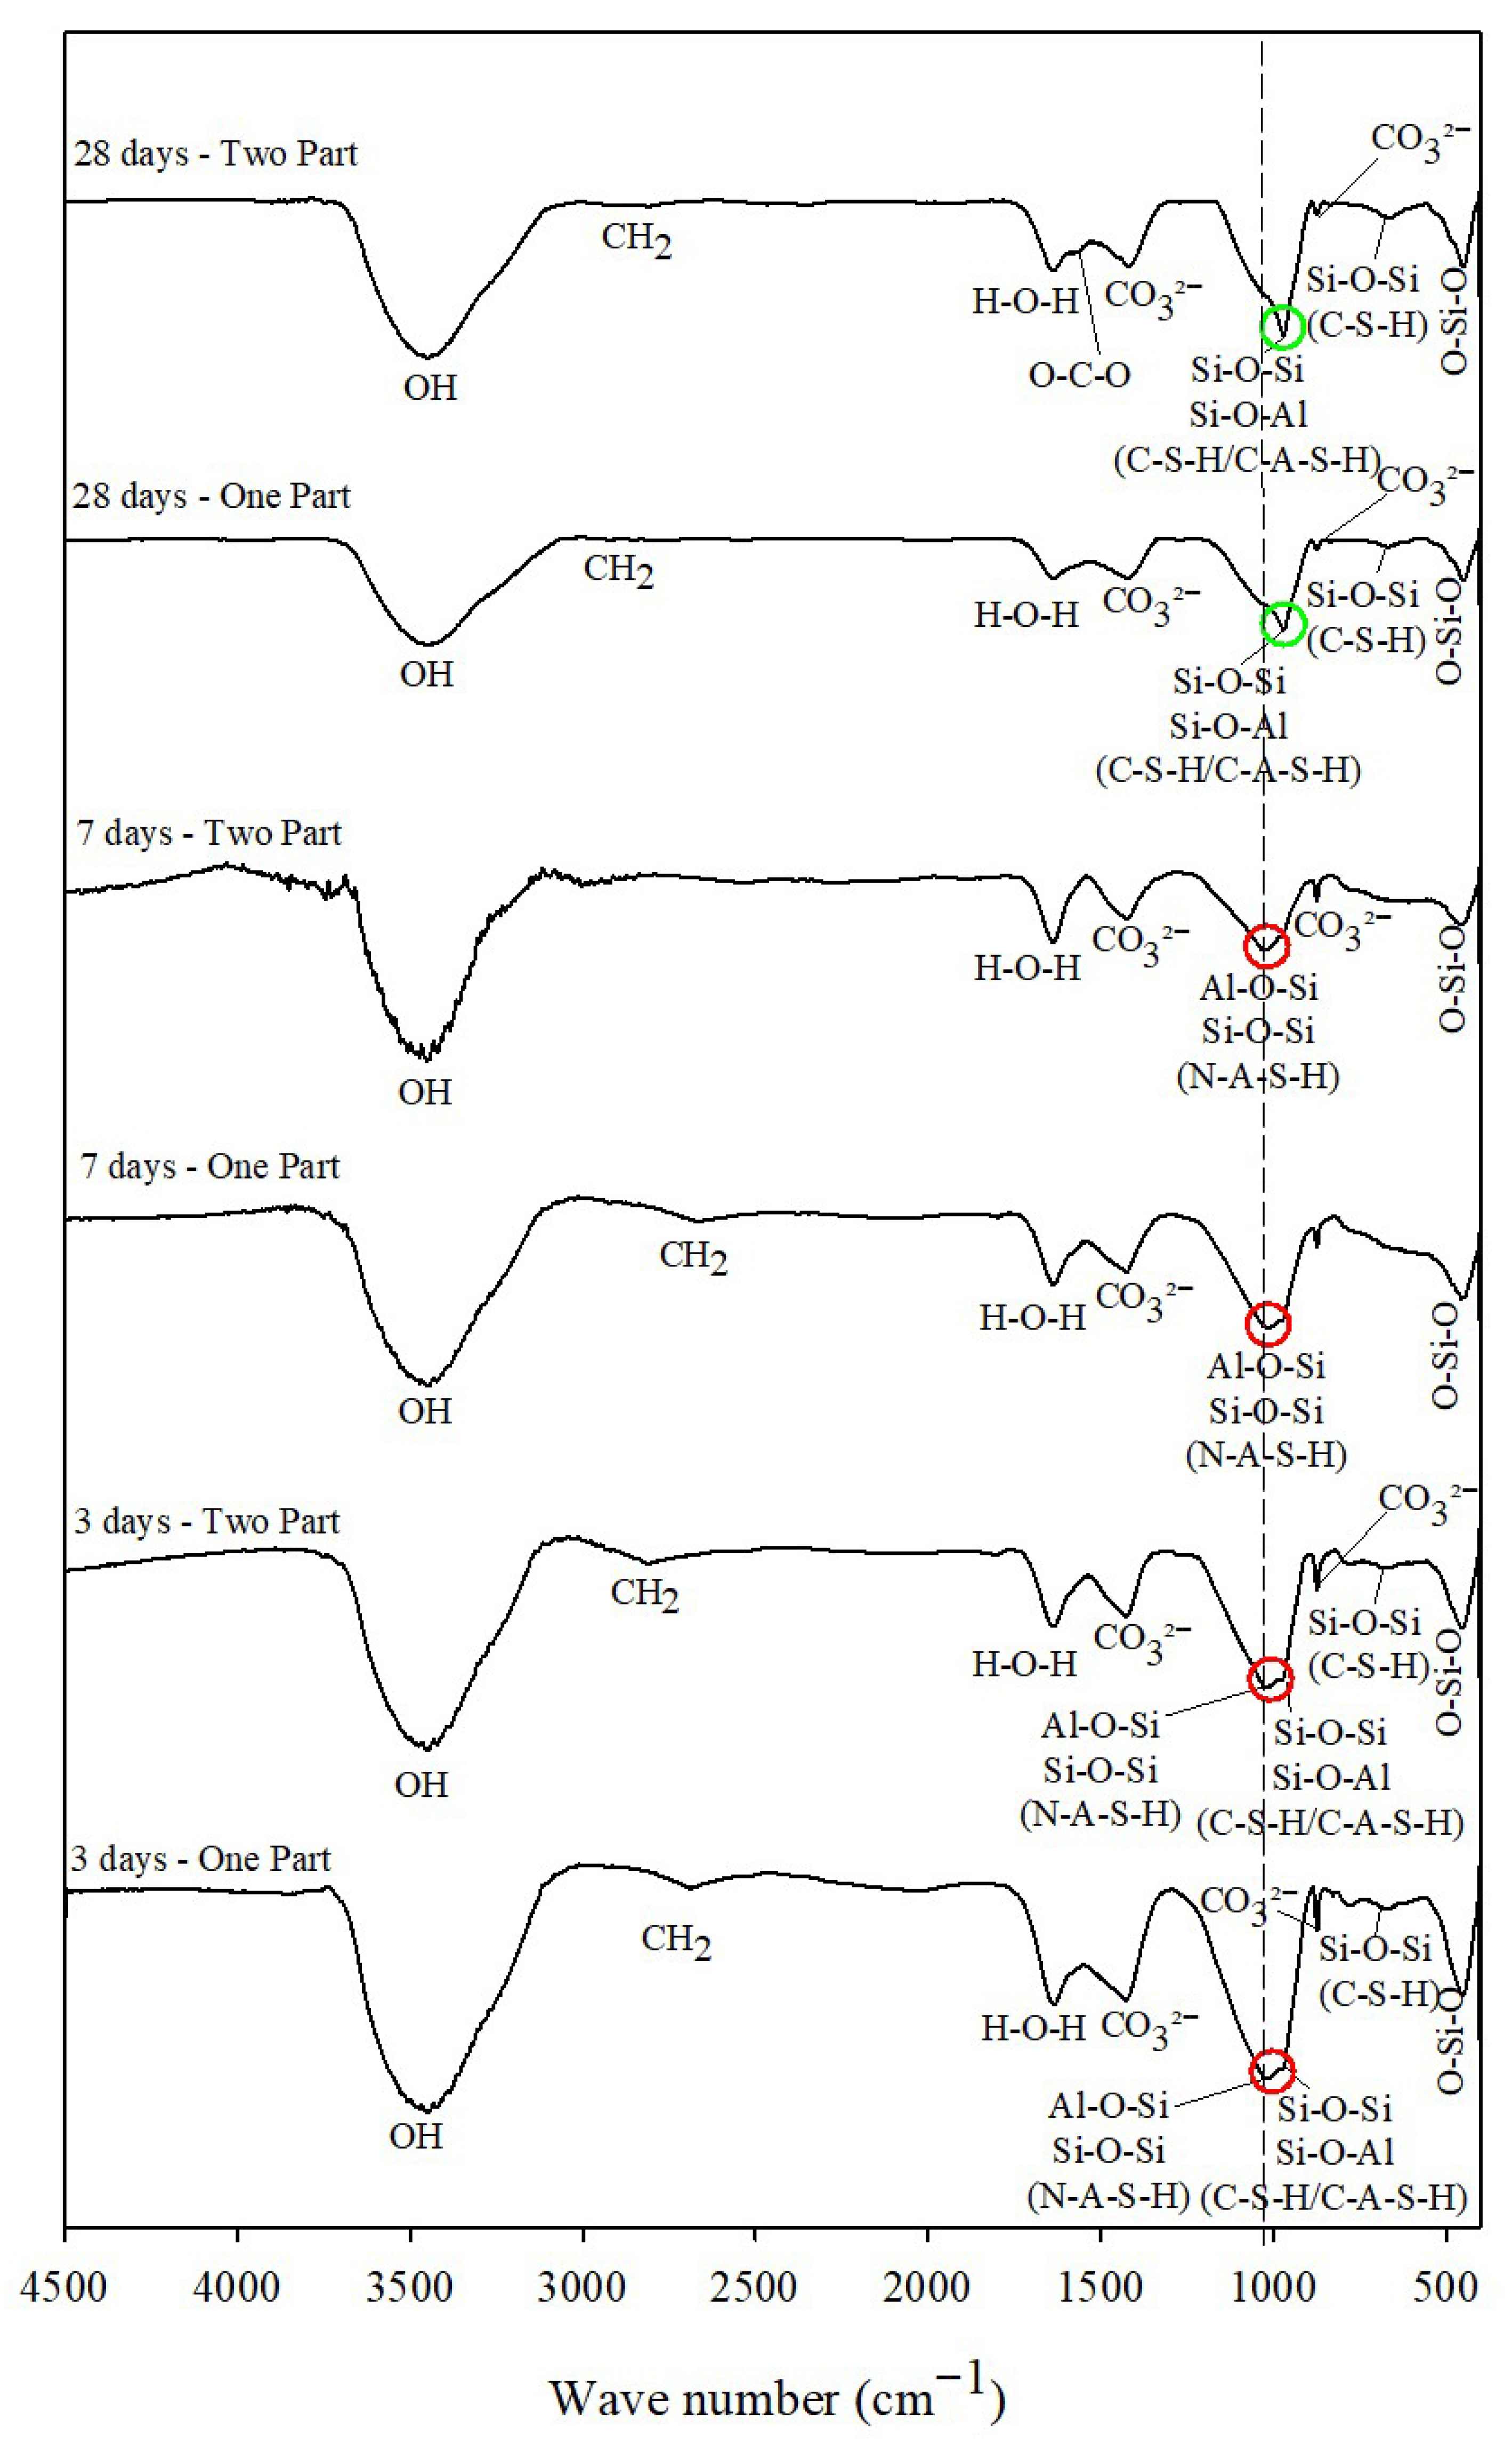
The FTIR spectra (
Figure 11) allowed the identification of cementitious products and chemical compounds present in the mixtures. The absorption bands near 3500 cm
−1 and 3400 cm
−1, observed in all samples, correspond to hydrated products associated with O–H bonds and hydroxyl groups from adsorbed water, respectively [
37,
70,
71].
The absorption bands near 2900 cm
−1 and 2800 cm
−1 correspond to methylene (CH
2) groups, associated with symmetric and asymmetric stretching vibrations [
72]. In all samples, an absorption band between 1645 and 1627 cm
−1 was observed, attributed to H–O–H bending vibrations [
73]. Only the 28-day cured Two-Part sample exhibited a band around 1500 cm
−1, related to O–C–O bonds, suggesting possible carbonation [
74].
All samples showed absorption bands in the range of 1450–1417 cm
−1 or near 870 cm
−1, corresponding to C–O bonds and the presence of CO
32− groups. These are typical of unsealed or untreated alkali-activated binders, arising from carbonate formation through the reaction of NaOH with atmospheric CO
2 [
8,
75,
76,
77,
78].
The bands between 1025 and 1016 cm
−1, identified in all 3-day and 7-day cured samples, are associated with asymmetric stretching vibrations (T–O–T, with T = Si or Al) characteristic of N-A-S-H gel [
8,
77]. As curing progresses (3, 7, and 28 days), the peaks shift and change shape as gel polymerization increases, as seen in
Figure 11, the peak near 1000 cm
−1 (red circles) is observed moving to slightly lower frequencies (green circles), indicating greater Si–O–T condensation. Studies confirm that an initial peak at ~998 cm
−1 disappears and gives way to a band at ~960–943 cm
−1 in the final product, reflecting greater order and polymerization of the structure [
79].
In the Two Part mix (activator already in solution), the alkaline reagent is immediately available, while in the One Part mix (mixed solid activator), there is greater heat release and simultaneous dissolution of all phases, accelerating the reaction mechanisms. It can be inferred that One Part systems exhibit similar or even faster spectral changes than Two Part systems, but both eventually converge around 28 days, when gel polymerization is greater.
Peaks near 970 cm
−1 and between 800 and 700 cm
−1 are attributed to asymmetric Si–O–T stretching vibrations (T = Si or Al tetrahedra), serving as distinctive markers of gels formed after alkali activation [
8,
80,
81]. These bands may correspond to both C-S-H and C-A-S-H gels [
82,
83].
The absorption bands between 700 and 600 cm
−1 are mainly related to Si–O–Si bending vibrations, attributed to C-S-H gels [
76], while the lower-frequency bands around 450 cm
−1 are associated with O–Si–O vibrations [
84]. Thus, all samples exhibited characteristic FTIR bands corresponding to alkali-activated gels (C-S-H, C-A-S-H, and N-A-S-H).
However, the FTIR results do not directly reflect the UCS trends (which increased with curing time), likely because the alkali-activation reactions are of low intensity, and their spectroscopic features are not linearly correlated with mechanical strength development.
3.3. Leaching Behavior
Table 8 presents the concentrations of metals in the leachates of the mixtures that achieved the highest UCS values at each curing age and for each mixing method (One-Part and Two-Part). For all alkali-activated matrices, the concentrations of leached metals were below the threshold limits established in Annex F of NBR 10004 [
54]. Therefore, the alkali-activated materials tested in this study can be classified as non-toxic with respect to metal leaching.
In the case of barium (Ba), it was detected in the leachates of both SCBA and CL residues, as well as in all cementitious samples, at concentrations exceeding the most restrictive thresholds, namely those for water quality standards [
85,
86]. The leaching of Ba from both residues and alkali-activated mixtures can be explained by its amphoteric nature, which increases its mobility and solubility under highly alkaline conditions, such as those found in AAC systems [
51,
87]. Unlike sodium, Ba does not readily integrate into the cementitious gel structure, making it more susceptible to leaching [
88]. Furthermore, barium oxide can react with dissolved carbon dioxide (CO
2) in water, forming barium carbonate (BaCO
3), which is soluble in the acetic acid solution used in the leaching tests [
89].
Table 8.
Chemical composition of leachate extracts from raw materials and mixtures (mg·L−1).
Table 8.
Chemical composition of leachate extracts from raw materials and mixtures (mg·L−1).
| Metal | SCBA | CL | 3 Days | 7 Days | 28 Days | NBR 10004 Annex F | CONA-
MA 420 1 | Dutch List 2 | EPA 3 |
|---|
| 1.5 M | 1.5 M | 2.0 M |
|---|
| Ash/Lime Ratio 4.00 | Ash/Lime Ratio 4.00 | Ash/Lime Ratio 2.33 |
|---|
| One Part | Two Part | One Part | Two Part | One Part | Two Part |
|---|
| Ag | * | * | * | * | * | * | * | * | 5 | 0.05 | - | - |
| Al | * | * | * | * | * | * | * | * | - | 3.5 | - | - |
| As | * | * | * | * | * | * | * | * | 1 | 0.01 | 0.01 | 0.01 |
| Ba | 0.08 ** | 0.18 | 0.41 | 0.43 | 0.42 | 0.40 | 0.28 | 0.36 | 70 | 0.07 | 0.05 | 2 |
| Cd | * | * | * | * | * | * | * | * | 0.5 | 0.005 | 0.0004 | 0.005 |
| Cr | * | * | * | * | * | * | * | * | 5 | 0.05 | 0.001 | 0.1 |
| Cu | * | * | * | * | * | * | * | * | - | 2 | 0.015 | 1.3 |
| Fe | * | * | 0.01 | 0.012 | 0.024 | 0.020 | 0.033 | 0.022 | - | 2.45 | - | - |
| Hg | * | * | * | * | * | * | * | * | 0.1 | 0.001 | 0.00005 | 0.002 |
| Mn | * | * | * | * | * | * | * | * | - | 0.4 | - | - |
| Pb | 0.06 | * | * | * | * | * | * | * | 1 | 0.01 | 0.015 | 0.015 |
| Se | * | * | * | * | * | * | * | * | 1 | 0.01 | - | 0.05 |
| Zn | * | * | * | * | * | * | * | * | - | 1.05 | 0.065 | - |
According to NBR 10005 [
52], samples were fragmented into particles smaller than 9.5 mm, increasing the surface area and thereby enhancing the dissolution of certain metals [
91]. In this case, for future studies, it would be interesting to investigate some mitigation strategies for Ba, as an additive for encapsulation or pH control to reduce its leaching.
On the other hand, the alkali-activated mixtures did not exhibit leaching of lead (Pb), which was present in the leachate of SCBA (
Table 8). This indicates that the cementitious matrix was able to immobilize Pb from the residue. This immobilization may have occurred through Pb precipitation followed by encapsulation within cementitious gel phases. In alkali-activated materials, heavy metals such as Pb can be immobilized by charge-balancing incorporation into the gel structure [
92,
93]. In addition, iron (Fe), originating from SCBA, did not exceed any regulatory limits in the mixtures. These results can be attributed to the use of acetic acid as the extraction solution, which creates a more acidic medium and promotes the dissolution of metals with a cationic behavior [
94].

