Article

Re-Imagining Waste: CBA-Modified High-Strength Mortar as a Blueprint for Greener Construction

Department of Civil Engineering, Manipal Institute of Technology, Manipal Academy of Higher Education, Manipal 576104, Karnataka, India
*
Author to whom correspondence should be addressed.
Constr. Mater. 2025, 5(4), 76; https://doi.org/10.3390/constrmater5040076 (registering DOI)
Submission received: 20 July 2025 / Revised: 4 September 2025 / Accepted: 8 September 2025 / Published: 5 October 2025
(This article belongs to the Topic Green Construction Materials and Construction Innovation)

Abstract

The search for viable alternative resources is essential for advancing sustainable development in the construction industry. A significant global concern is the substantial generation of industrial waste, particularly coal ash byproducts such as fly ash (FA) and coal bottom ash (CBA) from thermal power plants (TPPs). India ranks as the third-largest producer of coal ash globally and the second-largest in Asia, generating approximately 105 million metric tonnes annually. While TPP-derived wastes have been extensively studied in masonry mortars, the potential of CBA as a partial or complete replacement for natural fine aggregates (NFA) in high-strength mortar (HSM) remains significantly underexplored. This study investigates the fresh, mechanical, and microstructural properties of mortar incorporating CBA as a substitute for NFA, specifically up to a 100% replacement level Flow table tests revealed improved workability with increasing CBA content, which is attributed to its porous microstructure; however, significant bleeding was observed at higher replacement levels (≥75%). The dry density consistently decreased with the addition of CBA with a reduction of up to 19.27% at full replacement. Ultrasonic pulse velocity (UPV) values declined with higher levels of CBA but improved with curing age. The mortar incorporating up to 100% CBA retains appreciable mechanical properties despite a progressive reduction in compressive strength (CS) with increasing CBA content. The observed compressive strengths for the different mixes were as follows: control mix (CM) at 36.72 MPa, mix with 25% CBA (CBA25) at 25.56 MPa, mix with 50% CBA (CBA50) at 19.69 MPa, mix with 75% CBA (CBA75) at 16 MPa, and mix with 100% CBA (CBA100) at 9.93 MPa. All mixes exceeded the minimum strength criteria, confirming their classification as HSMs at all replacement levels. These results highlight the potential of CBA as a sustainable alternative in construction materials, supporting efforts toward resource efficiency and environmental sustainability in the industry.

1. Introduction

The construction industry is a rapidly growing sector, driven by current trends in infrastructural and industrial development [1]. Concrete and steel are the two most used construction materials. Of the two, concrete is particularly prevalent in the construction sector, and its demand is steadily increasing alongside the growth and expansion of infrastructure and construction projects [2,3]. India’s construction sector currently consumes approximately 400 million tonnes of concrete annually, with projections indicating a rise to 1000 million tonnes within the next decade. By 2050, global concrete demand is expected to reach nearly 7.5 billion m3, equivalent to 18 billion tonnes. This escalating demand will significantly increase the consumption of both aggregates and cement, the latter contributing substantially to CO2 emissions [2]. Excessive use of concrete impacts the environment by increasing the demand for cement and natural aggregates. Since coarse aggregate (CA) and NFA constitute around 60–70% of the volume of concrete, there may soon be a shortage of these natural materials, particularly sand, due to their widespread use. The availability of NFA is increasingly limited by mining restrictions in certain regions, along with growing emphasis on ecological sustainability. Given the current scarcity of river sand and the rising rate of construction, it is now more important than ever to find an alternative material for river sand in concrete [3]. As a result, identifying and utilising novel recycled materials has become crucial for promoting ecological sustainability. This approach can significantly reduce the consumption of natural resources and help safeguard the interests of future generations.
India primarily generates its electricity from coal-based TPPs. In the fiscal year 2022–2023, 264 coal-based thermal power stations across the country, with a capacity of 237,268 MW, produced 57.03% of India’s energy, using coal that contained 30–35% ash content [4]. The fly ash (FA) constitutes 75% of the by-products generated by the coal industry, while coal bottom ash (CBA) makes up the remaining 25% [5]. CBA particles, which are similar in size to NFA, can be used as a replacement in concrete. This substitution promotes resource conservation and offers a sustainable solution to environmental concerns. Additionally, Figure 1 illustrates the annual CBA production in various countries for the year 2022.

1.1. CBA as an Aggregate or Cement Replacement in Mortar and Concrete

CBA has been utilised as a substitute for aggregates in both concrete and mortar. Due to its porous structure and relatively low particle density, numerous studies have investigated CBA as a viable alternative aggregate in concrete production. Research findings highlight that CBA can significantly improve the mechanical strength, pozzolanic activity, and microstructural characteristics of concrete [10].
The particle size distribution (PSD) of NFA is comparable to that of CBA. Replacing NFA with CBA in concrete results in reduced concrete density. This substitution offers several advantages, including lower density, superior thermal and acoustic insulation, enhanced durability and mechanical strength, reduced expansion, easier handling during construction, and improved cost efficiency. Although the initial strength of concrete made with CBA may be lower, its strength at later stages can match that of conventional concrete [11].
In addition to being used as an aggregate substitute, CBA has also been investigated as a partial replacement for cement, due to its similar chemical composition, as both are classified as Class F materials. CBA typically contains over 25% SiO2, and the combined content of SiO2, Al2O3, and Fe2O3 exceeds 70%, making it suitable for cement substitution [6]. While raw FA can be directly used as a cement replacement, CBA must be ground to achieve the necessary fineness and reactivity. This grinding process increases the initial production costs due to the need for specialised equipment. However, using CBA as a cement replacement can help reduce CO2 emissions and improve energy efficiency [12].

1.2. Other Applications of CBA

The pozzolanic properties of CBA, which is produced from the combustion of lignite, sub-bituminous, bituminous, and anthracite coal, provide significant benefits that support its use in the construction industry [13]. Its unique surface texture and pozzolanic behaviour make CBA suitable for civil engineering applications, such as road construction, embankments, the substitution of NFA, and the manufacture of bricks, fire-resistant products, cement, and ceramics. Other applications include waste stabilisation and municipal solid waste management [14,15]. Figure 2 illustrates the current use of CBA.

1.3. Fresh and Hardened Properties of CBA Mortar

Several investigations have examined how fine CBA (FCBA) aggregates influence the flow characteristics of mortar at various strength levels. Control mortars that included NFA exhibited flow values ranging from 150 to 200 mm. In contrast, when FCBA aggregates were partially or completely substituted for NFA, flowability increased by 10% to 20%. This improvement is primarily due to the higher water absorption capacity of FCBA aggregates relative to NFA, which leads to the release of absorbed water during mixing, thereby reducing the viscosity of the cementitious matrix [17]. Research has also shown that the complete replacement of NFA with CBA in mortar mixes can result in a flowability reduction of up to 34%. This reduction is attributed to the increased porosity of CBA particles, which require more water to achieve complete surface saturation, negatively impacting the rheological properties of the mortar [7].
While the increase in water content significantly affects the fresh properties of the mortar, the rate of water release from CBA aggregates is a key factor in the bleeding observed in the mix [18]. Compared to mixes using NFA, CBA mixes tend to experience greater water loss from bleeding due to the gradual release of absorbed water in the CBA particles [19]. This issue can become more severe as the CBA content increases, potentially compromising the durability of the mix. Therefore, controlling bleeding is crucial for ensuring the long-term performance [18].
Compressive strength (CS) serves as a fundamental indicator of the material performance in CBA-based paste, mortar, and concrete specimens [19]. Yang et al. [20] reported that the CS of mixes incorporating CBA decreased as the CBA content increased after 28 days of curing. Similarly, when NFA was replaced with FCBA, a decreasing trend in CS was observed, with relative strength values ranging between 80% and 95% compared to the control mixes. In contrast, reference specimens utilising only NFA exhibited CS within the 40 to 90 MPa range. This decrease in strength is primarily due to the increased porosity introduced by FCBA aggregates, which adversely affects the mechanical performance in comparison to mortars made with NFA [17]. In a related study, Hyeong-Ki Kim investigated the use of sieved and ground CBA powders as coarse supplementary binders in HSM to enhance workability and mechanical performance. The CS assessments indicated that CBA performed comparably to FA at early ages (3 and 28 days), while also contributing to reduced hydration heat and autogenous shrinkage, thereby enhancing the overall durability of the composites. These findings underscore the potential of CBA powders as sustainable, high-performance alternatives in high-strength cementitious systems [17].

1.4. Significance of the Study

Several studies have extensively researched the use of CBA as a substitute for NFA in cement and concrete. However, research on HSM remains relatively limited compared to studies on normal-strength mortar and concrete. With the rising demand for construction materials, escalating scarcity of river sand, and increasing environmental degradation caused by excessive resource consumption, identifying and utilising recycled materials like CBA are crucial for promoting sustainable development [3].
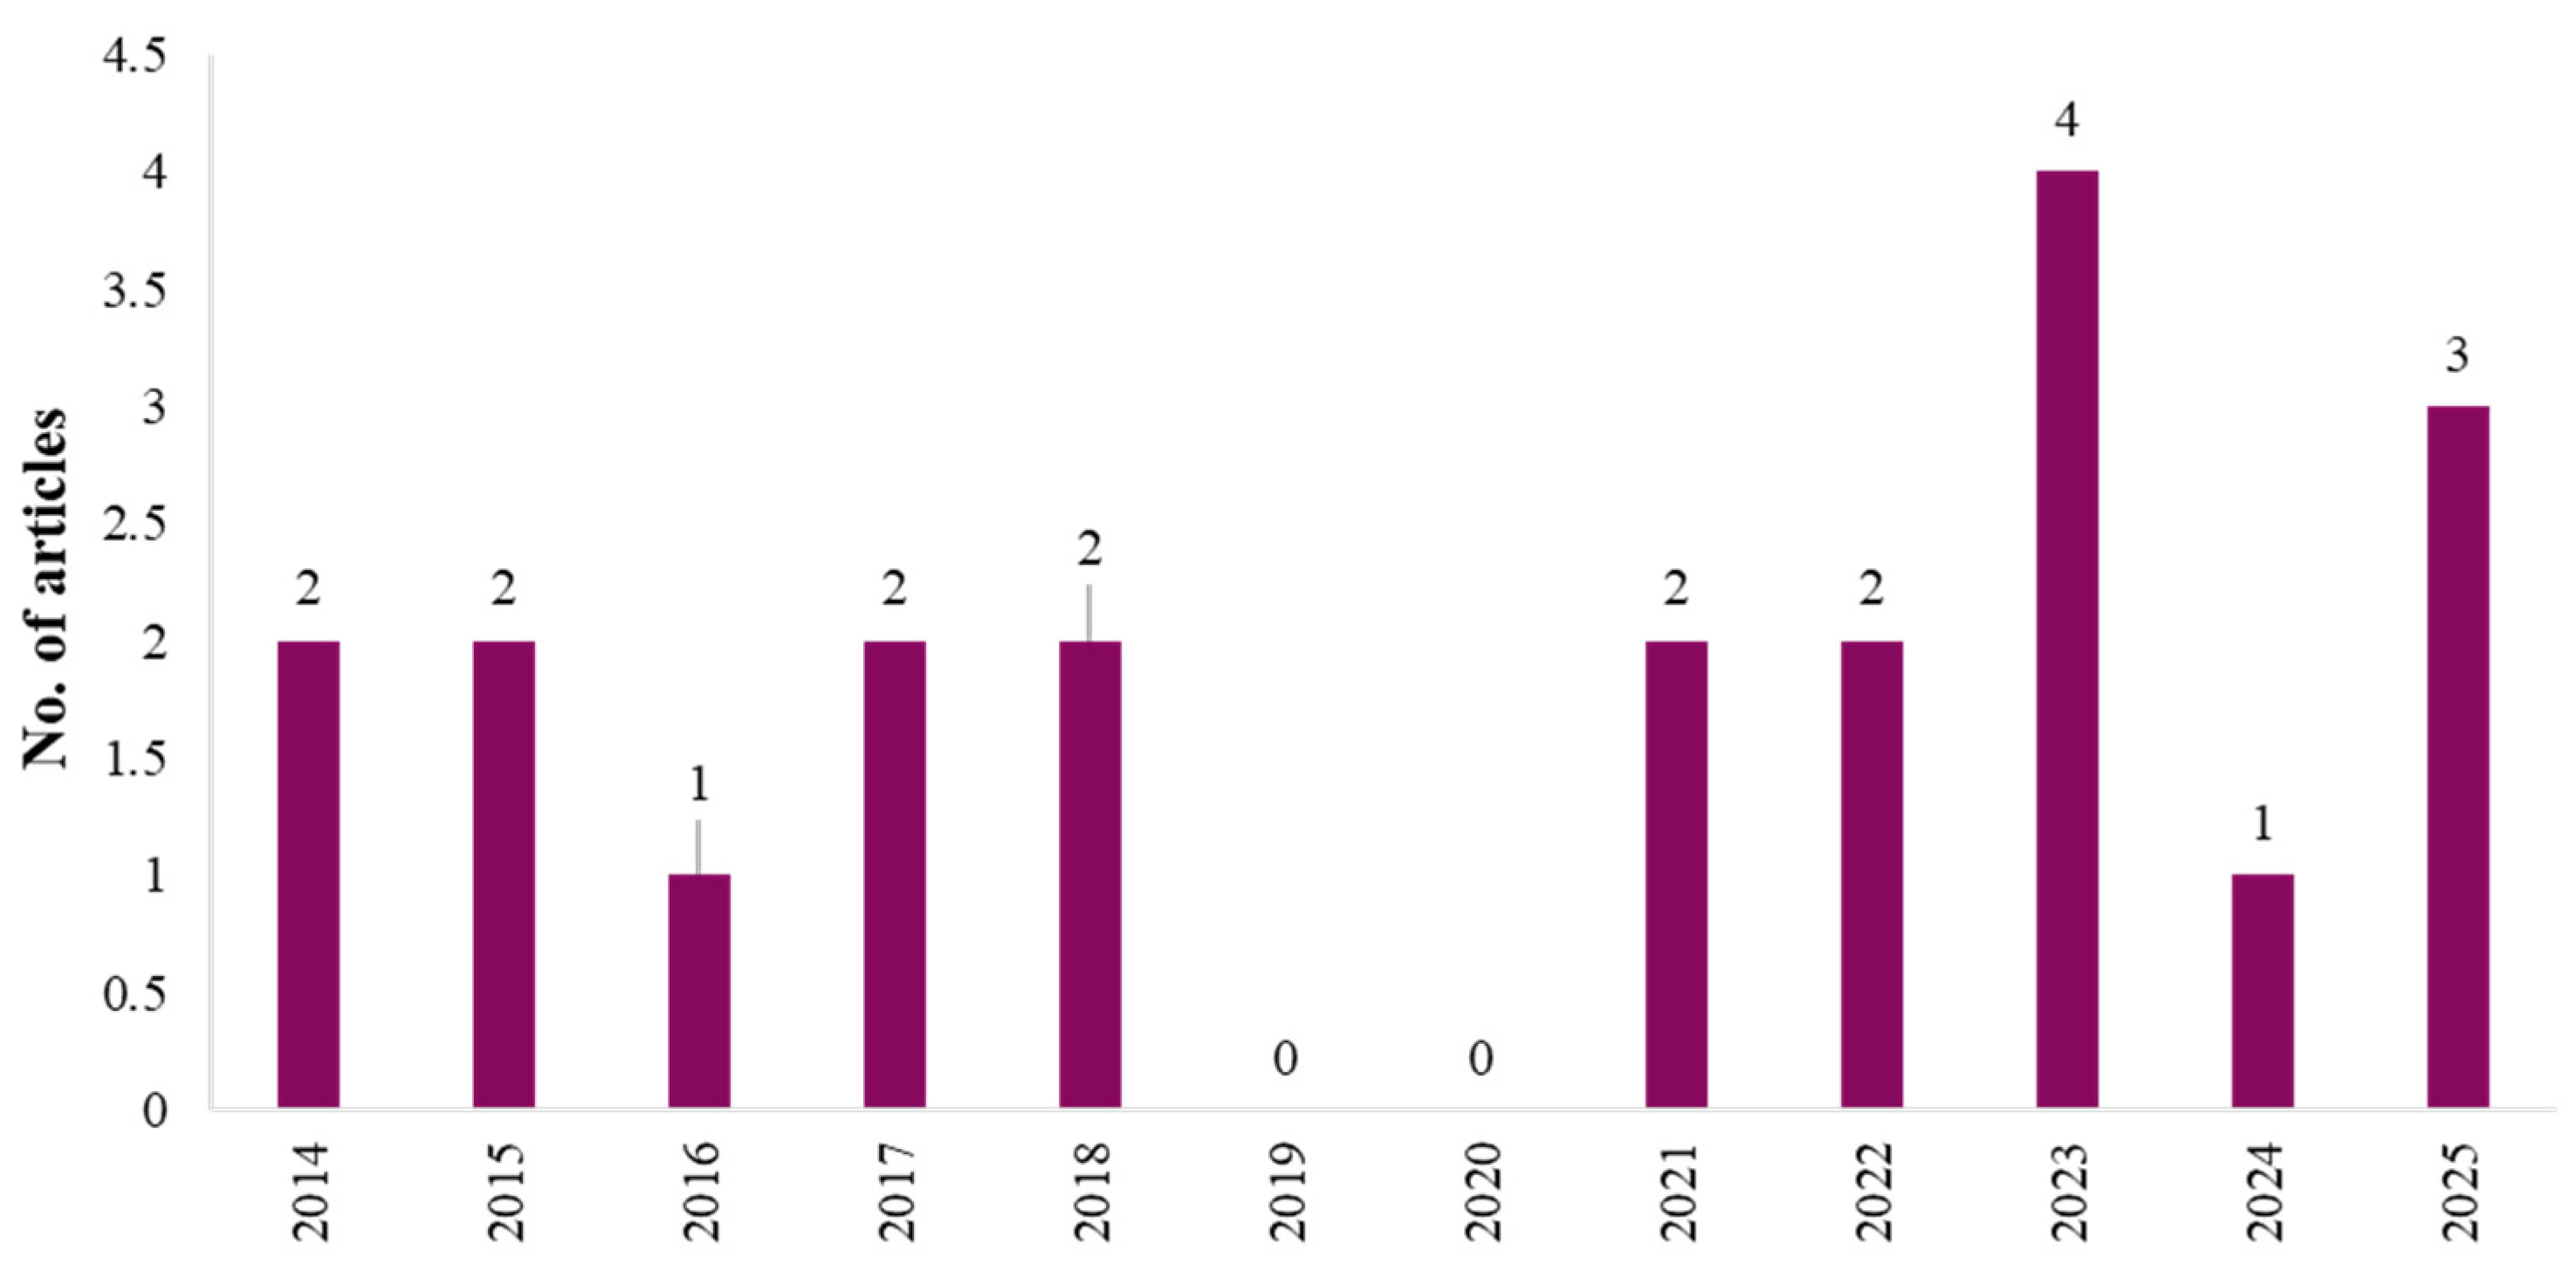
In sustainable construction, filler materials significantly influence the properties of the cementitious matrix. A denser mortar phase enhances aggregate bonding, reduces microcracking, and improves structural performance. Therefore, optimising the binder and filler composition in HSM is essential for producing high-strength concrete (HSC) with superior mechanical and durability properties. A bibliometric analysis of subject-specific publications retrieved from the Scopus database (as shown in Figure 3) highlights a substantial research gap in exploring CBA in the context of HSM. The temporal distribution of publications over the past decade reveals that studies specifically focusing on the utilisation of CBA in HSM are largely underrepresented, with minimal research contributions addressing this niche area. Furthermore, there is a significant lack of investigations conducted within the Indian context, despite India being one of the largest producers of coal combustion by-products. Using the keyword-based search strategy that includes terms such as ‘Coal Bottom Ash’, ‘High-Strength Mortar’, ‘Aggregate Replacement’, ‘High Volume Fly Ash’, and ‘Mechanical Properties,’ no comprehensive studies directly addressing the integration of CBA in HSM were found. This absence of scholarly contributions highlights both a regional and thematic research void.
Overall, the bibliometric evidence emphasises the need for systematic investigations into the role of CBA in HSM, particularly in the Indian context, to bridge the evident knowledge gap and advance sustainable practices in high-performance construction materials. To address this gap, the study evaluates the feasibility of incorporating high-volume CBA (HVCBA) in HSM by replacing NFA with CBA at replacement levels of 25%, 50%, 75%, and 100%. It also examines the fresh and mechanical properties of the resulting mortar, providing valuable insights into its potential applications in sustainable construction. Additionally, this study addresses practical challenges associated with workability, offering useful insights to guide future research in optimising mortar mixes with similar compositions. The significance of this study also lies in the development of a sustainable mix for HSM using locally available industrial by-products—CBA, FA and microsilica—thereby directly aligning with Sustainable Development Goals (SDG 11: Sustainable Cities and Communities, SDG 12: Responsible Consumption and Production, and SDG 13: Climate Action).

2. Experimental Programme

2.1. Materials and Methodology

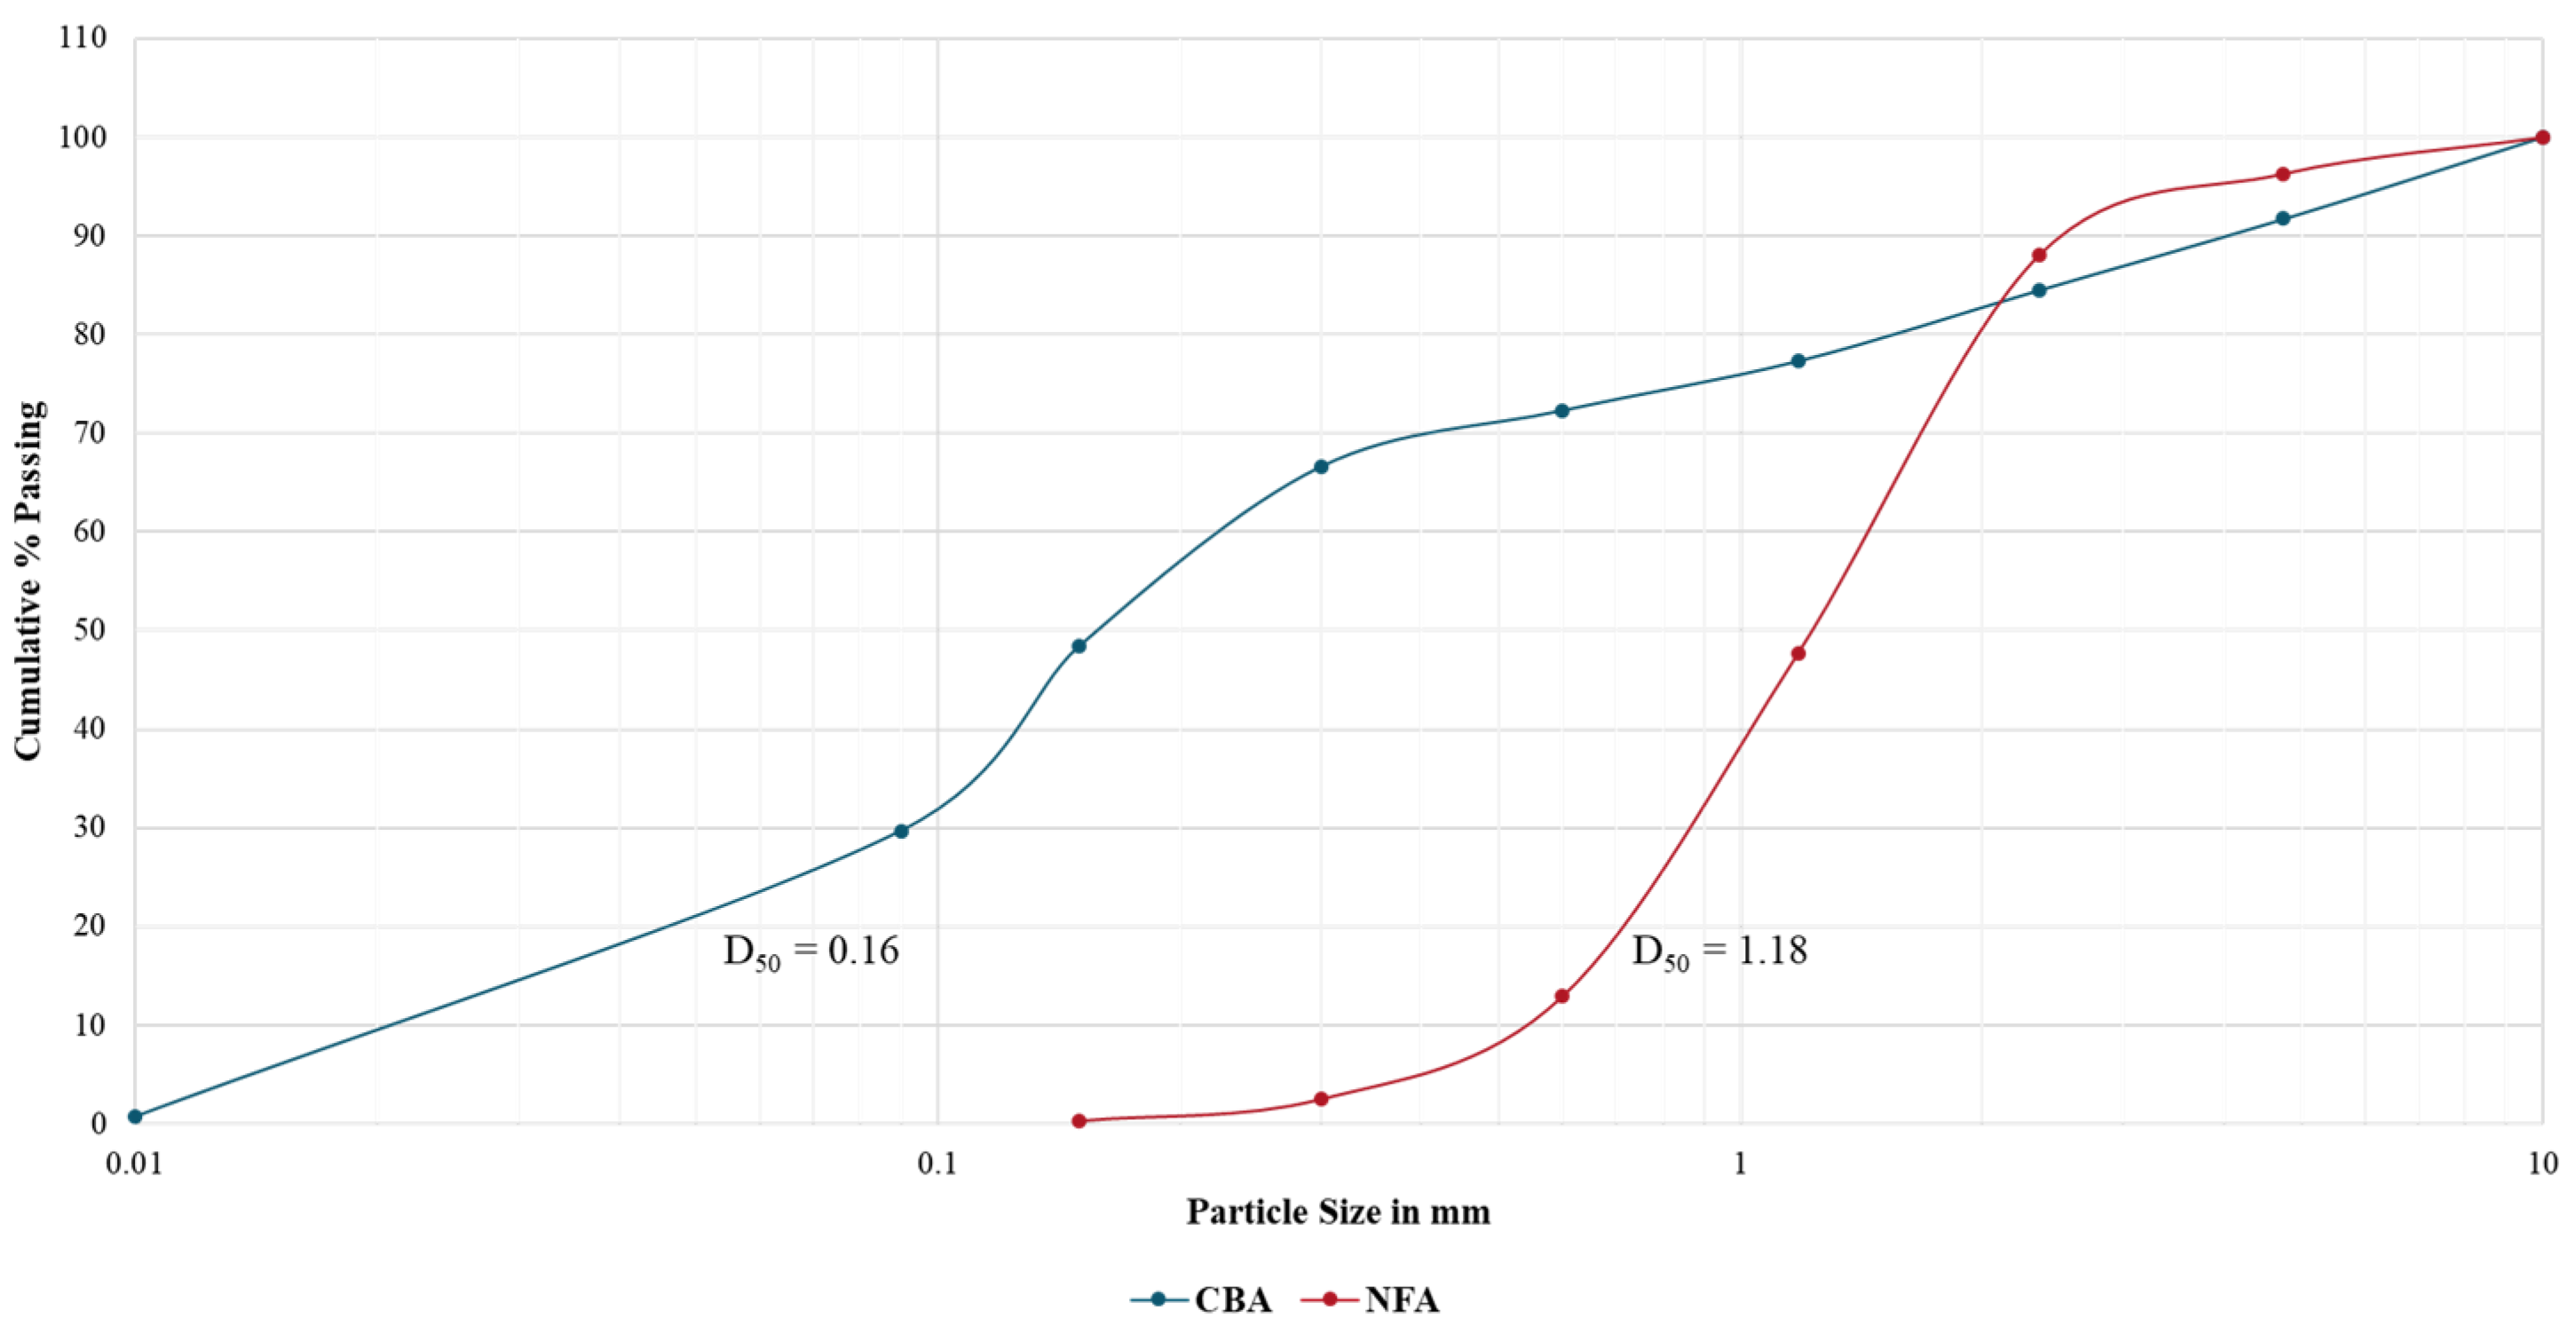
In the present study, Ordinary Portland Cement (OPC) 53 grade, Class F FA, and microsilica were utilised as binding materials. The Blaine fineness values for these materials were 480.54 m2/kg for OPC, 524.51 m2/kg for FA, and 64,840 m2/kg for microsilica. Table 1 outlines the physical properties of the binder materials. Locally sourced river sand was used as the NFA. Additionally, CBA, obtained from Udupi Power Corporation Limited (UPCL), Udupi, Karnataka, India, was employed as a partial replacement for NFA at varying substitution levels of 25%, 50%, 75%, and 100%. Table 2 presents the physical properties of the filler materials, while Figure 4 illustrates their PSD.
The D50 (median particle size) parameter represents the median particle size at which 50% of the material (by weight) is finer. As a median reference point on the gradation curve, D50 provides an indicator of the overall PSD trend of both NFA and CBA. As shown in Figure 4, the D50 values of NFA and CBA correspond to 1.18 mm and 0.16 mm, respectively. A smaller D50 indicates finer material. These values allow for a direct comparison of the relative fineness of NFA and CBA, supporting the assessment of their suitability as construction materials and promoting uniformity in material selection. A balanced D50 value contributes to higher packing density and reduced porosity, complementing each other in filling voids.
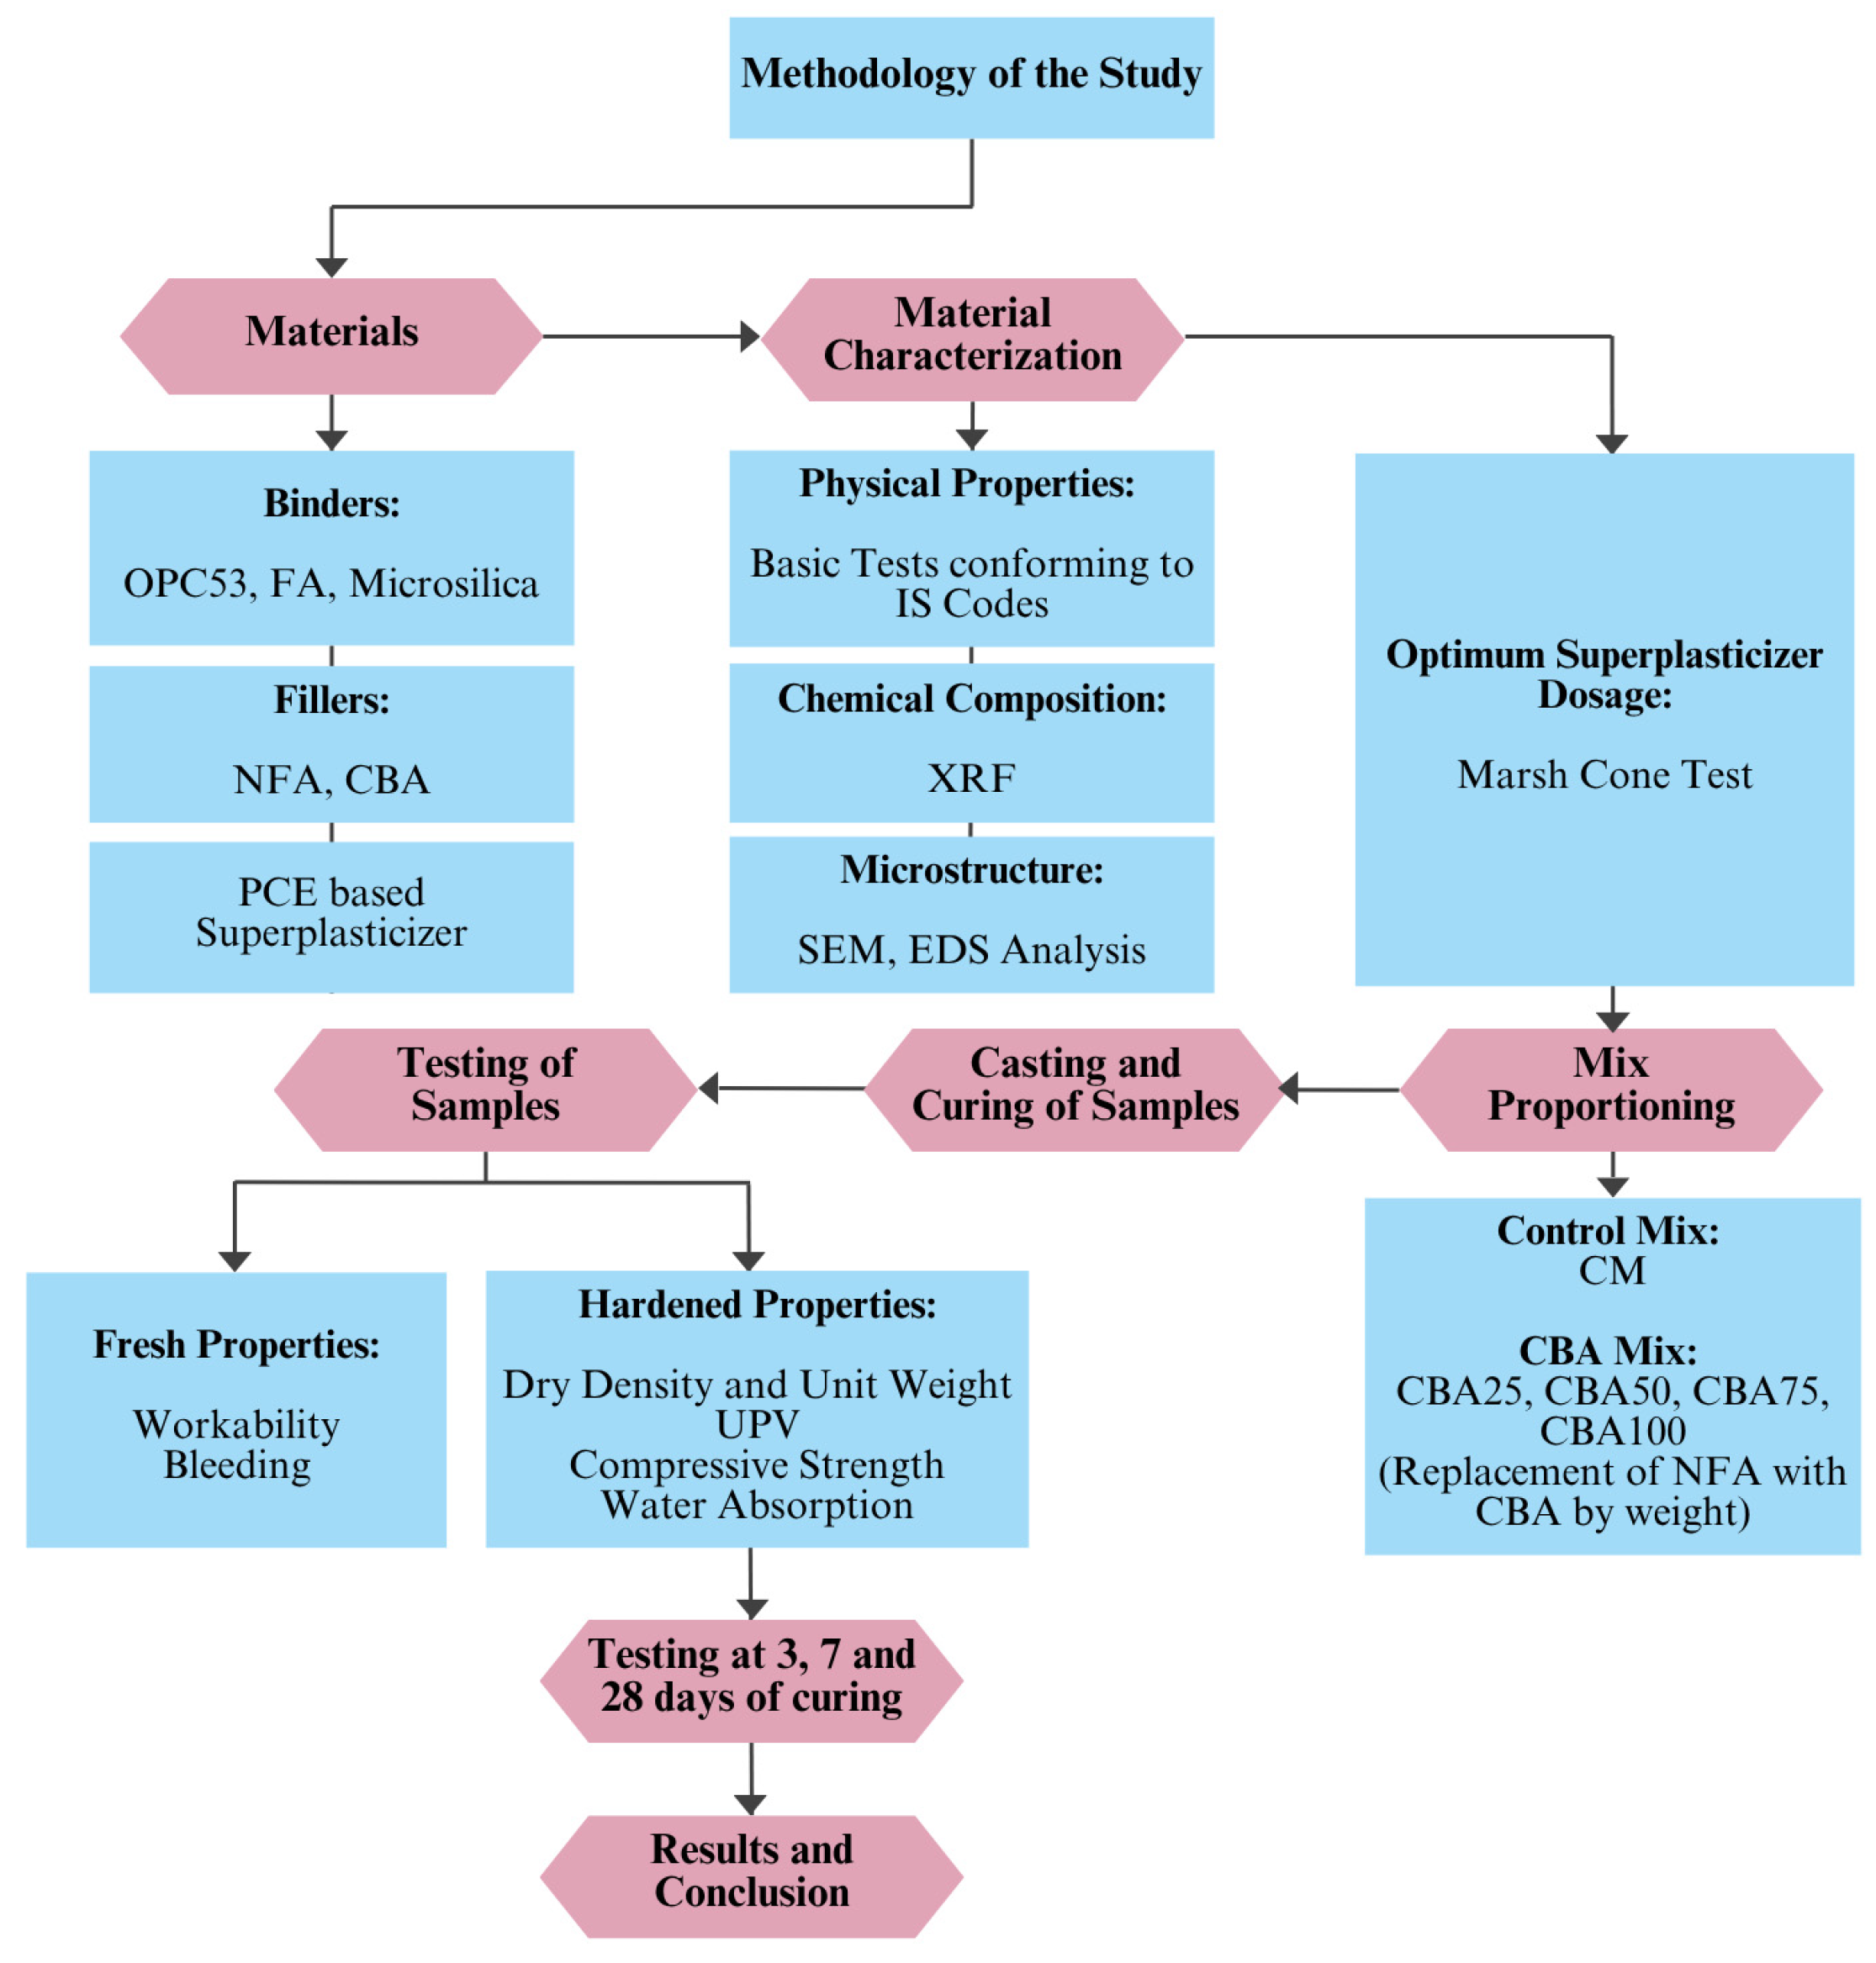
Table 3 summarises the chemical properties of the materials obtained from X-ray fluorescence (XRF) analysis. According to IS 3812 (Part 1): 2013 [21], the combined content of SiO2, Al2O3, and Fe2O3 should be ≥70% for a material to be classified as pozzolanic. As presented in Table 3, the respective values for FA and CBA are 88.40% and 83.37%, confirming their pozzolanic nature. In the case of microsilica, the SiO2 content is 90.25%, which exceeds the minimum requirement of 85% specified in IS 15388: 2003 [22] indicating its high reactivity and strong pozzolanic characteristics. A polycarboxylate ether (PCE)-based superplasticiser was used to achieve a low water-to-binder (w/b) ratio. The optimal dosage of the superplasticiser was determined through the Marsh Cone test, which was conducted prior to mix preparation. Figure 5 depicts a schematic representation of the methodology adopted in this study.
Table 1. Physical properties of binders.
BinderParameterResultsConformity to the IS CodeIS Code Reference
OPC53Fineness (90µ)5.66%YesIS 4031 (Part 1): 1996[23]
Consistency25%YesIS 4031 (Part 4): 1988[24]
Specific Surface480.54 m2/kgYesIS 4031 (Part 2): 1988[25]
Specific Gravity3YesIS 4031 (Part 11): 1988[26]
STI *80 minYesIS 4031 (Part 5): 1988[27]
STF #230 minYesIS 4031 (Part 5): 1988[27]
Soundness1 mmYesIS 4031 (Part 3): 1988[28]
CS IS 4031 (Part 6): 1988[29]
3 days39.5 MPaYes
7 days45.5 MPaYes
28 days53 MPaYes
FAFineness (45µ)12%YesIS 1727: 1967[30]
Specific Surface524.51 m2/kgYesIS 3812 (Part 1): 2013[21]
Specific Gravity2.19YesIS 1727: 1967[30]
PAI1.29YesIS 1727: 1967[30]
MicrosilicaFineness (45µ)2.2%YesIS 1727: 1967[30]
Specific Surface64.84 m2/gmYesIS 15388: 2003[22]
Specific Gravity2.25YesIS 1727: 1967[30]
* Initial Setting Time; # Final Setting Time.
Table 2. Physical properties of filler materials.
FillerParameterResultsConformity to IS CodeReference
NFASpecific Gravity2.66YesIS 2386 (Part 3): 1963[31]
Fineness Modulus3.52,
Zone II
YesIS 2386 (Part 1): 1963
IS 383: 2016
[32,33]
Water Absorption1%YesIS 2386 (Part 3): 1963[31]
Compacted Bulk Density1047 kg/m3YesIS 2386 (Part 3): 1963[31]
Uncompacted Bulk Density960 kg/m3YesIS 2386 (Part 3): 1963[31]
CBASpecific Gravity2.36YesIS 2386 (Part 3): 1963[31]
Fineness Modulus2.31,
Zone II
YesIS 2386 (Part 1): 1963
IS 383: 2016
[32,33]
Water Absorption30%YesIS 2386 (Part 3): 1963[31]
Compacted Bulk Density620 kg/m3YesIS 2386 (Part 3): 1963[31]
Uncompacted Bulk Density540 kg/m3YesIS 2386 (Part 3): 1963[31]
Table 3. Chemical composition of materials.
MaterialsSiO2Al2O3Fe2O3CaOMgOK2ONa2OSO3P2O5Mn2O3TiO2
OPC21.194.834.6262.41.08--2.24---
FA62.2720.655.483.040.691.260.080.10.020.061.4
Microsilica90.250.650.70.550.751.450.70.35---
CBA54.6621.856.864.450.581.040.160.170.310.061.47

2.2. Mix Proportion

Mortar mixes with a ratio of 1:3 was prepared, consisting of one part OPC and three parts of NFA. The NFA was partially replaced with CBA at substitution levels of 25%, 50%, 75% and 100% by weight. To ensure adequate workability at lower w/b, a PCE-based superplasticiser was added at a dosage of 0.4% by weight of the total binder contents. All mortar mixes were designed with a constant w/b ratio of 0.29. The control mix, which contains 100% NFA, is designated as CM. The mixes with CBA replacement are labeled as CBA25, CBA50, CBA75, and CBA100 corresponding to 25%, 50%, 75%, and 100% CBA replacement, respectively. Additionally, FA and microsilica were used as supplementary cementitious materials, replacing 50% and 5% of the cement content by weight, respectively. Table 4 provides the detailed mix proportions of the mortar mixes.

2.3. Mortar Mixing, Casting, and Curing of Samples

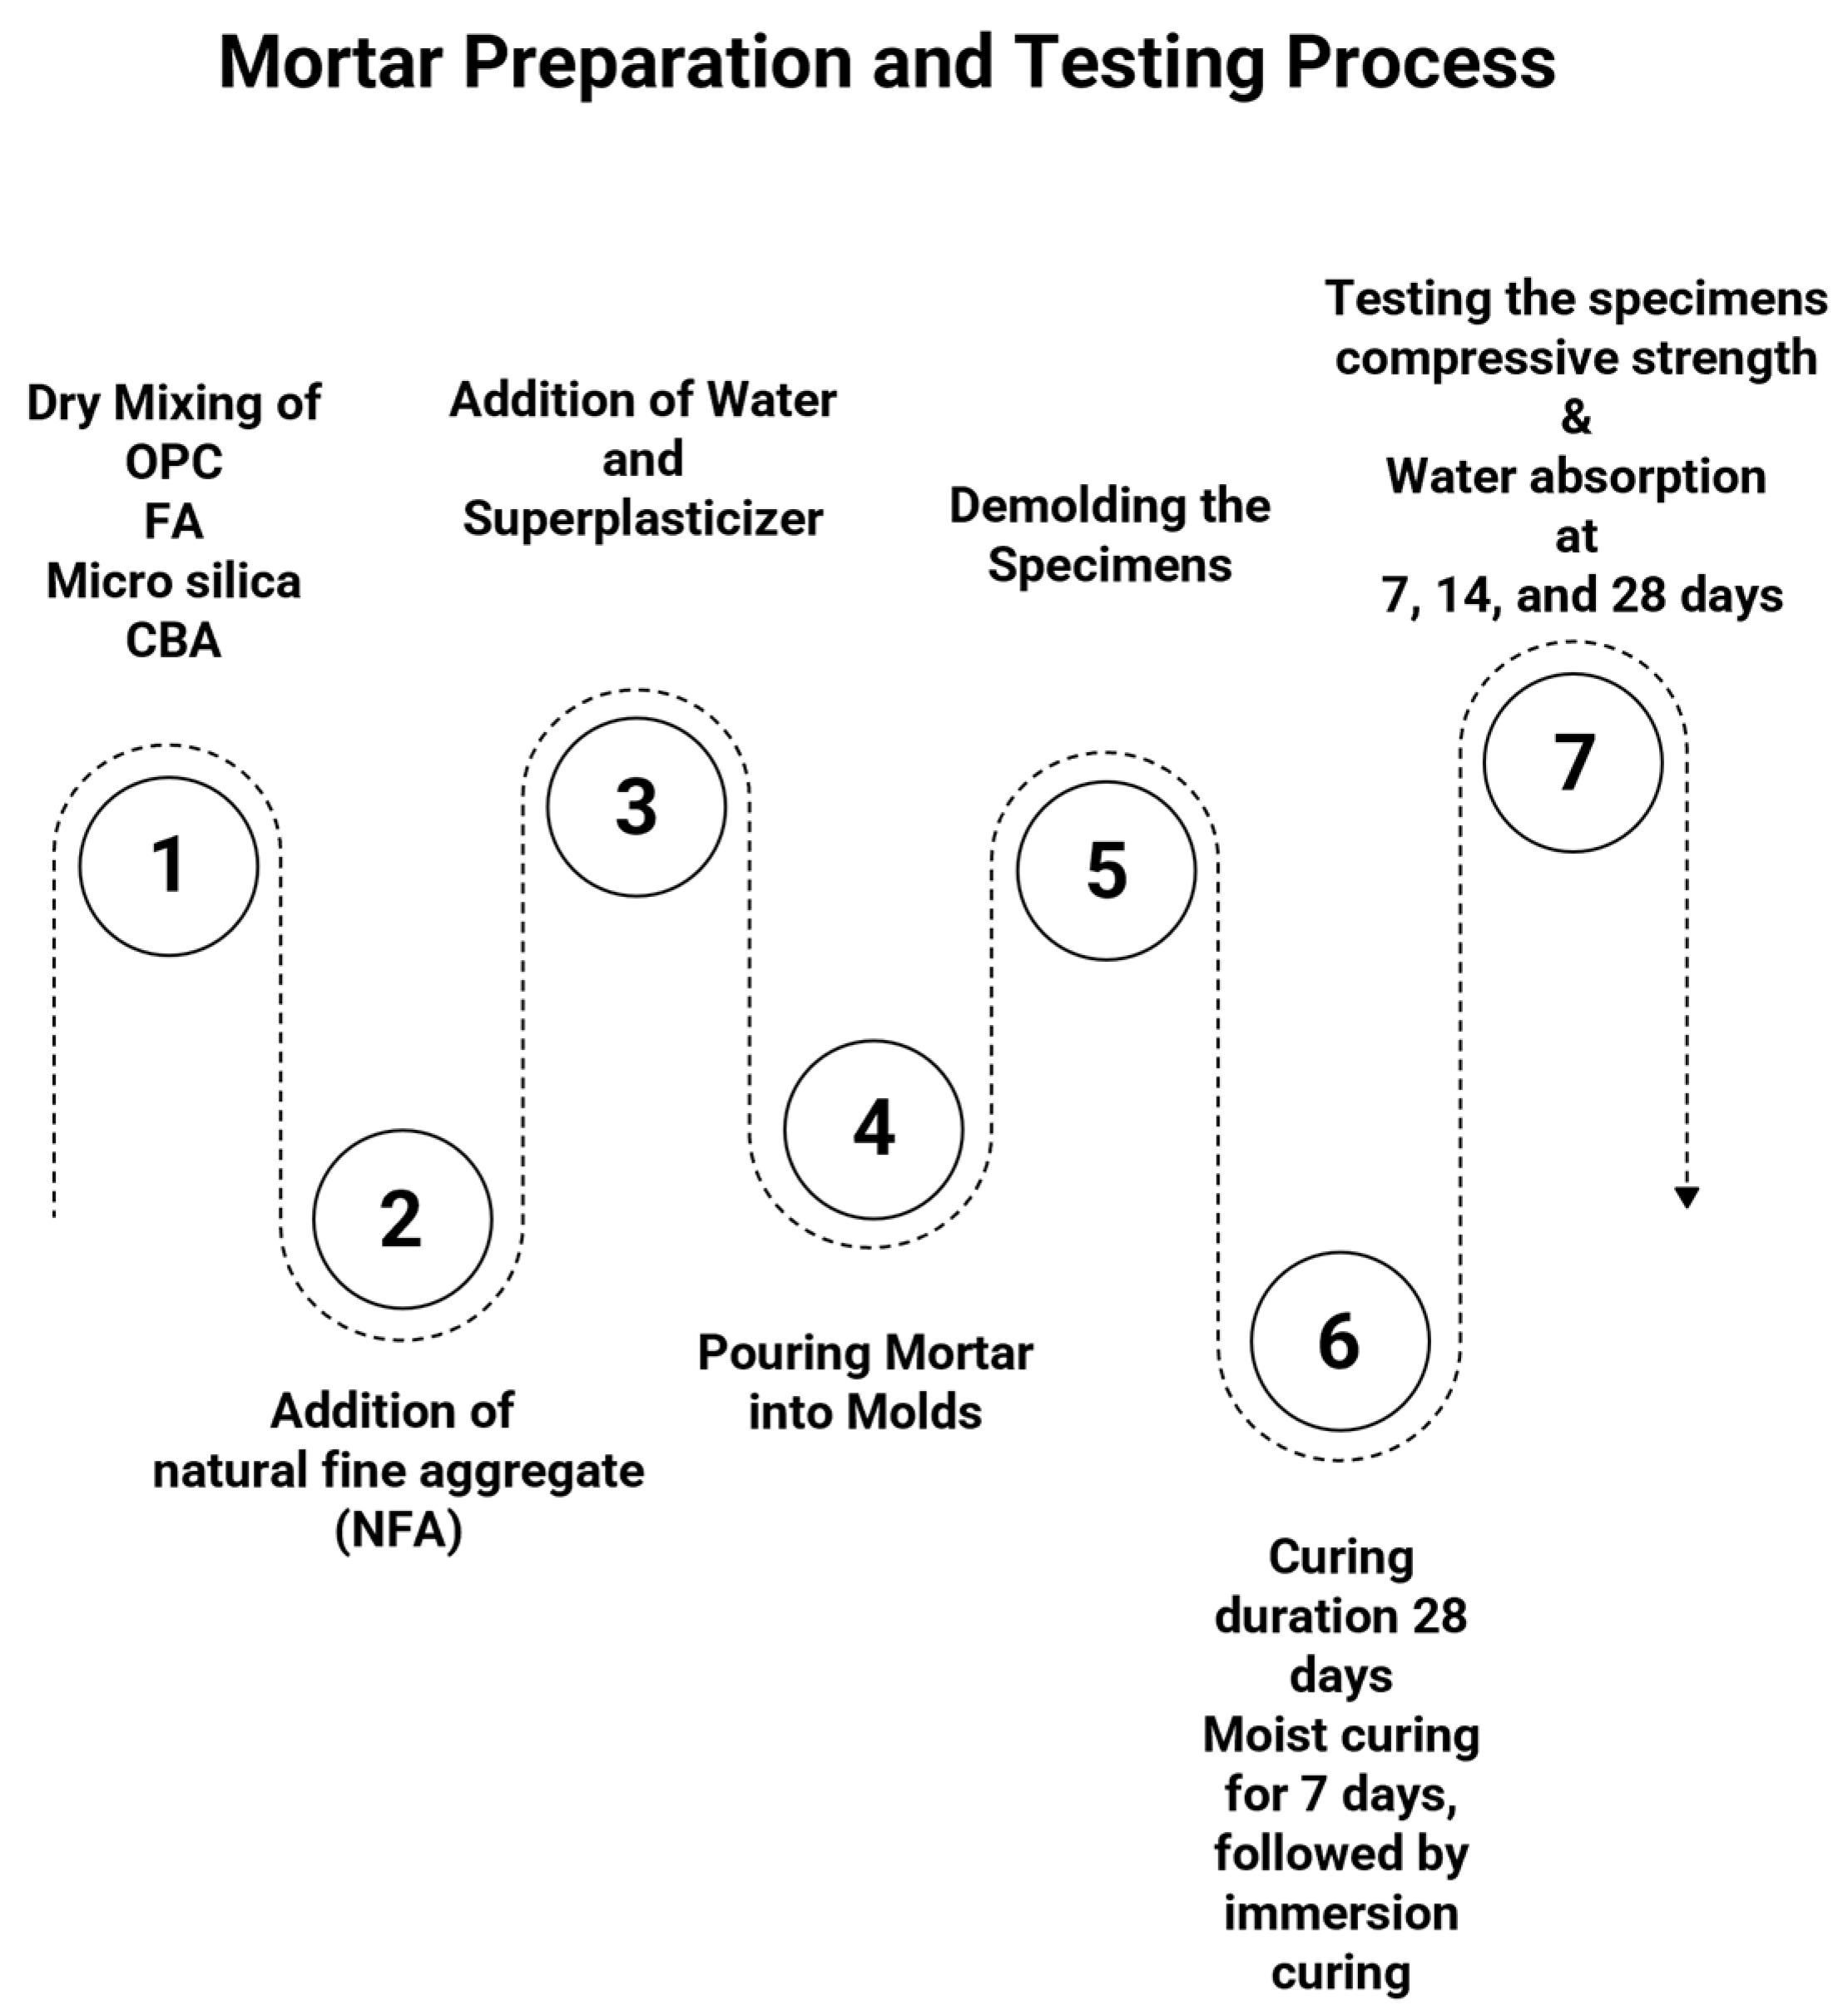
Mortar mixes were prepared using a 5-litre capacity Automatic/Manual Digi Mortar Mixer. The mixing procedure followed a standard sequence: first, the CBA and the binder components—OPC, FA, and microsilica—were added to the mixer and blended at medium speed to create a uniform dry mix. Next, NFA was gradually added to the dry mixture. After the dry blending was completed, a pre-mixed solution of water and superplasticiser was slowly added, and mixing continued at high speed until a homogeneous mortar consistency was achieved. The entire mixing process lasted for 5 min: the first 2 min at medium speed to achieve a uniform dry mix of binders and aggregates, followed by another 2 min at medium speed during the gradual addition of the water–superplasticizer solution, and concluding with 1 min at high speed to ensure a uniform and workable mortar mix.
Once the mortar mix was prepared, it was cast into 70.6 mm cube moulds in three layers. Each layer was compacted by tamping 25 times and subsequently subjected to vibration for 25 to 30 s to ensure proper compaction. After a 24 h setting period under ambient conditions, the specimens were demoulded and transferred to a moist curing environment for the initial 7 days. Following this, they were immersed curing till 28-day. Figure 6 and Figure 7 illustrate the mortar samples used for various tests and the schematic of the mortar mixing process, respectively.

2.4. Experimental Details

2.4.1. Flow Table Test

The flow table test was conducted to assess the workability and bleeding characteristics of the mortar in accordance with IS 2250:1981 [34]. A standard cone was placed centrally on the flow table and filled with mortar in two layers, with each layer compacted by 25 tamping strokes. Subsequently, the flow table was then dropped 25 times from a height of 12.5 mm within a duration of 15 s. The extent of mortar spread was measured in two perpendicular directions, and the average value was recorded as the flow value [34].

2.4.2. Bleeding

The procedure for measuring bleeding in mortar was based on ASTM C232-07 [35]. Freshly mixed mortar was placed into a cylindrical jar in successive layers, with each layer compacted by tamping or light vibration to minimise segregation and to ensure uniform consistency. The surface was levelled, and the specimen was left undisturbed under controlled conditions. At specified time intervals, any bleed water that appeared on the surface was carefully extracted and measured. The cumulative volume of bleed water was then expressed as a percentage of the initial mixing water, providing a quantitative measure of the bleeding behaviour of the mortar.

2.4.3. Compressive Strength

For the evaluation of CS, a total of 9 cube specimens of 70.6 mm × 70.6 mm × 70.6 mm were cast for each mortar type—CM, CBA25, CBA50, CBA75, and CBA100. The specimens were tested at curing intervals of 7, 14, and 28 days in accordance with IS 516:1959 [36]. Following moist curing, any surface water and loose particles were removed, and the specimens were positioned in the compression testing machine (CTM). A uniformly increasing load was applied at a constant rate of 2.9 kN/s until the specimens failed, with the corresponding CS recorded [36].

2.4.4. Ultrasonic Pulse Velocity (UPV)

For mortar mixes, UPV tests were conducted on 70.6 mm cube samples at 7 days, 14 days, and 28 days in accordance with IS 516 (Part 5): 2018 [37]. Pulse velocity of mortar cubes was measured using a portable ultrasonic non-destructive digital tester. The UPV tests were performed to assess the quality and uniformity of the mortar mixes. A higher pulse velocity value is associated with improved mix quality, indicating higher density and greater homogeneity of the material [18].

2.4.5. Morphology and Microstructural Analysis

The microstructural characterisation of the mortar specimens was conducted using Scanning Electron Microscopy (SEM) across multiple locations and magnification scales. However, the results discussed in this study correspond specifically to images captured at 10,000× magnification. Additionally, SEM was coupled with Energy Dispersive X-ray Spectroscopy (EDS) to enable elemental analysis and to observe morphological changes in the mortar mix.

3. Results and Discussion

3.1. Fresh Properties of Mortar

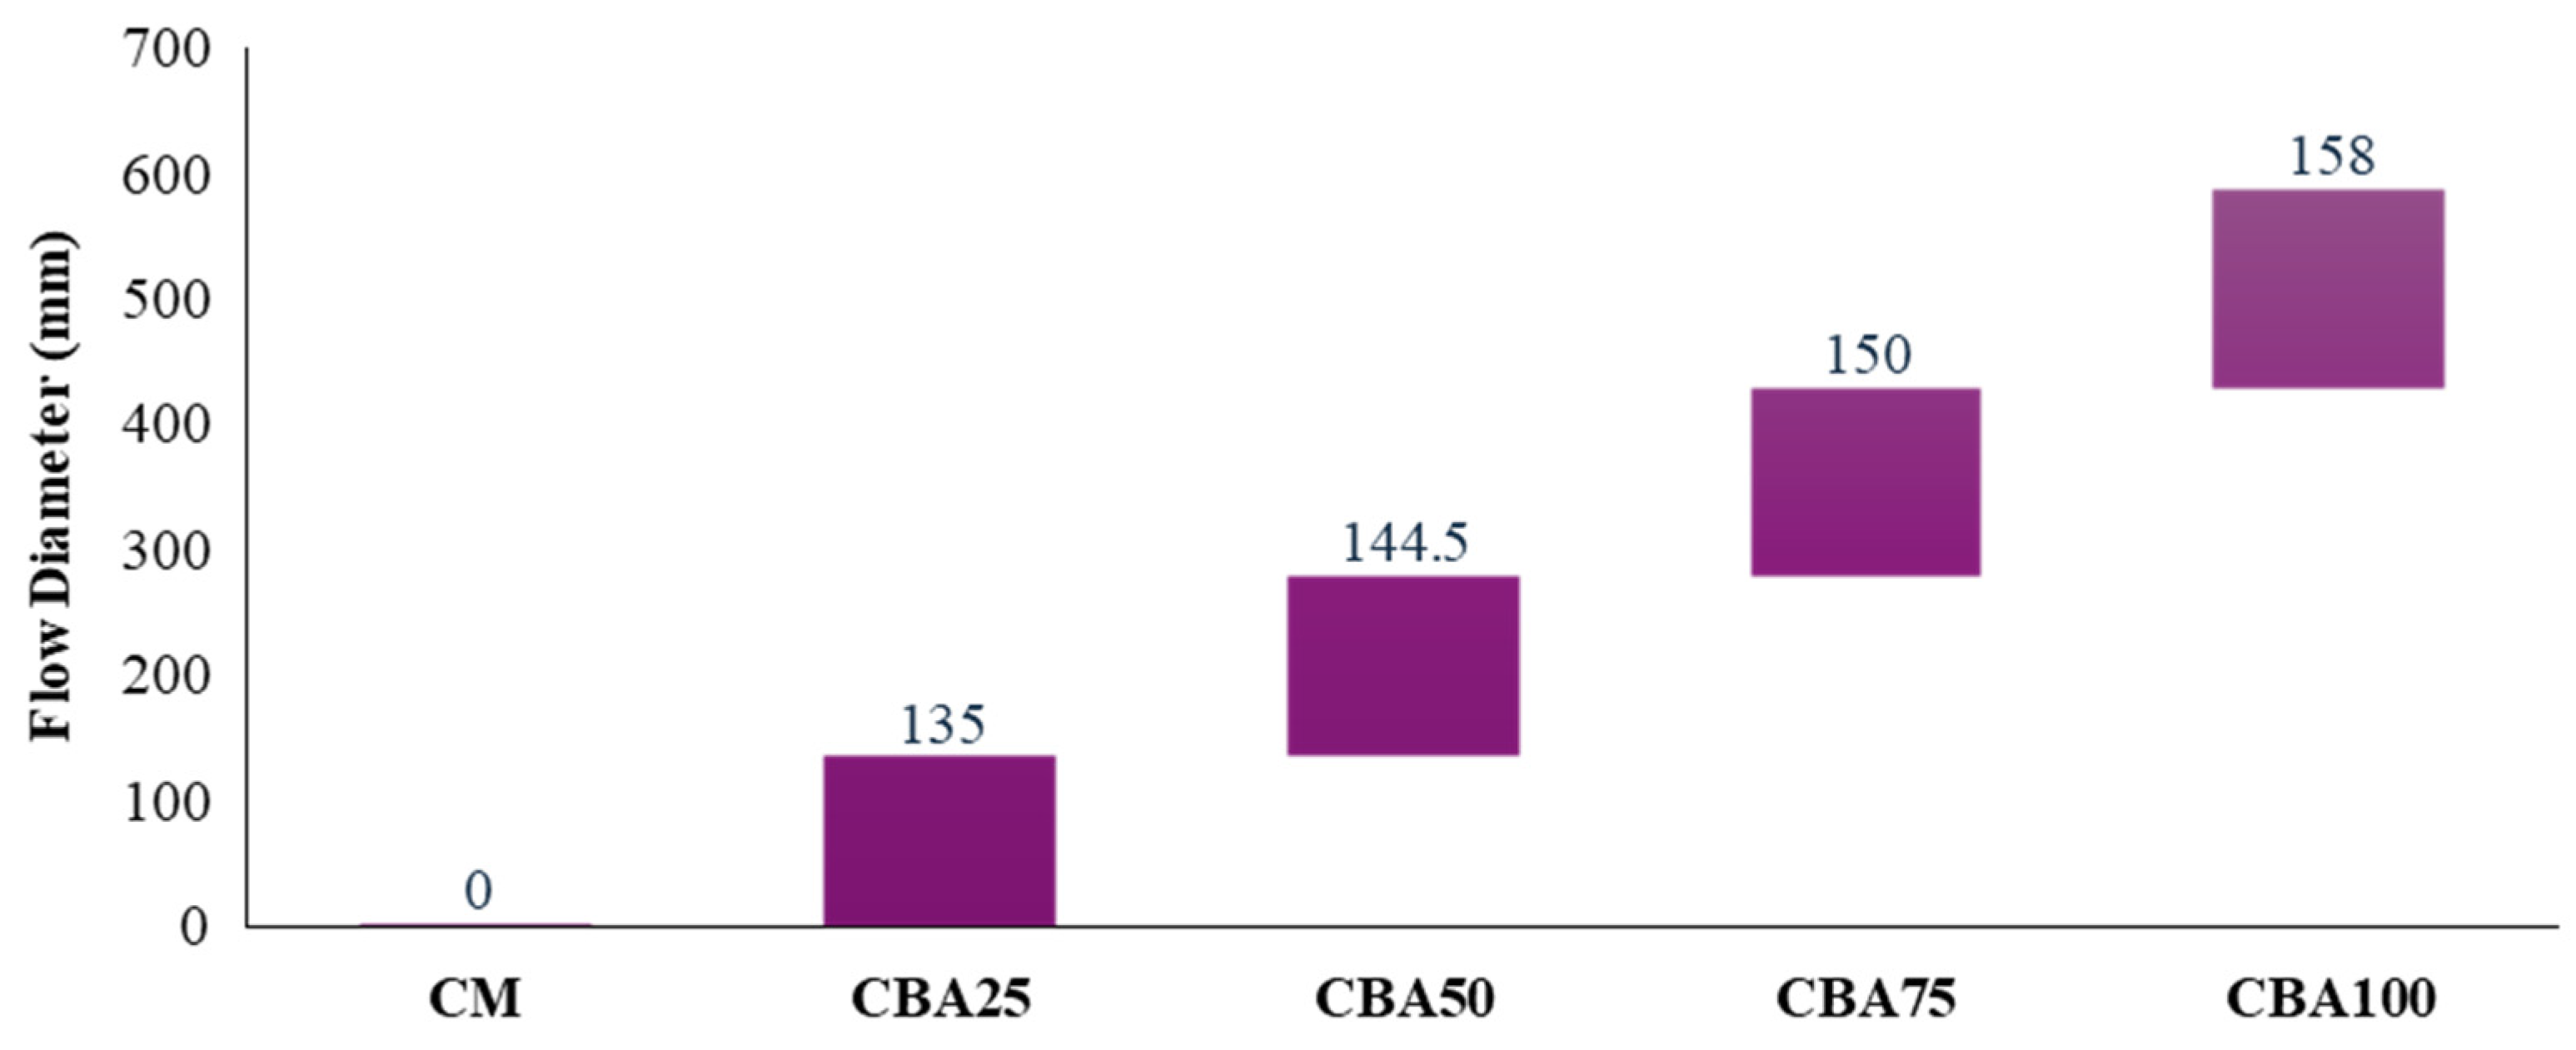
Figure 8 illustrates the results of the flow table tests conducted on CM and CBA mortar. The data reveal a progressive increase in flow diameter with higher CBA replacement levels, indicating enhanced workability. Both the CM and CBA25 mixes recorded a flow diameter of zero, reflecting minimal workability. However, subsequent increases in CBA content resulted in flow diameter improvements of 7.03% from CBA25 to CBA50, 3.80% from CBA50 to CBA75, and 5.33% from CBA75 to CBA100. This trend can be attributed to the higher porosity of CBA compared to NFA, which enhances pore connectivity [15]. Increased porosity facilitates greater water absorption, requiring more water to coat the particle surfaces and ultimately improving the flowability of the mortar [38,39]. Figure 9 illustrates the trend of the flow diameter across various mortar mixes.
Figure 10 illustrates the bleeding behaviour of various mortar mixes, showing a clear correlation between flow diameter and bleed water content. As flowability increases, a proportional rise in bleeding is observed. No bleeding was recorded for the mixes CM and CBA25, indicating these are harsh mixes. This lack of bleeding can be attributed to significantly low w/b of 0.29 used in the mix, which minimises the amount of excess water that can separate out. However, the quantity of bleed water increased with the increasing replacement levels of CBA. The more significant increases in bleed water, particularly notable from CBA75 to CBA100, suggest that the water demand of CBA becomes more pronounced as its proportion in the mix increases. When CBA in saturated surface dry (SSD) is used as a replacement for NFA, it results in greater water loss through bleeding due CBA particles’ lower water retention capacity. This is because the porous structure of CBA allows water to escape more easily, unlike NFA, which retains water more effectively. Furthermore, over time, the water initially absorbed by the CBA is gradually released into the mortar mix, increasing the overall water content [40].

3.2. Hardened Properties of Mortar

3.2.1. Dry Density and Unit Weight

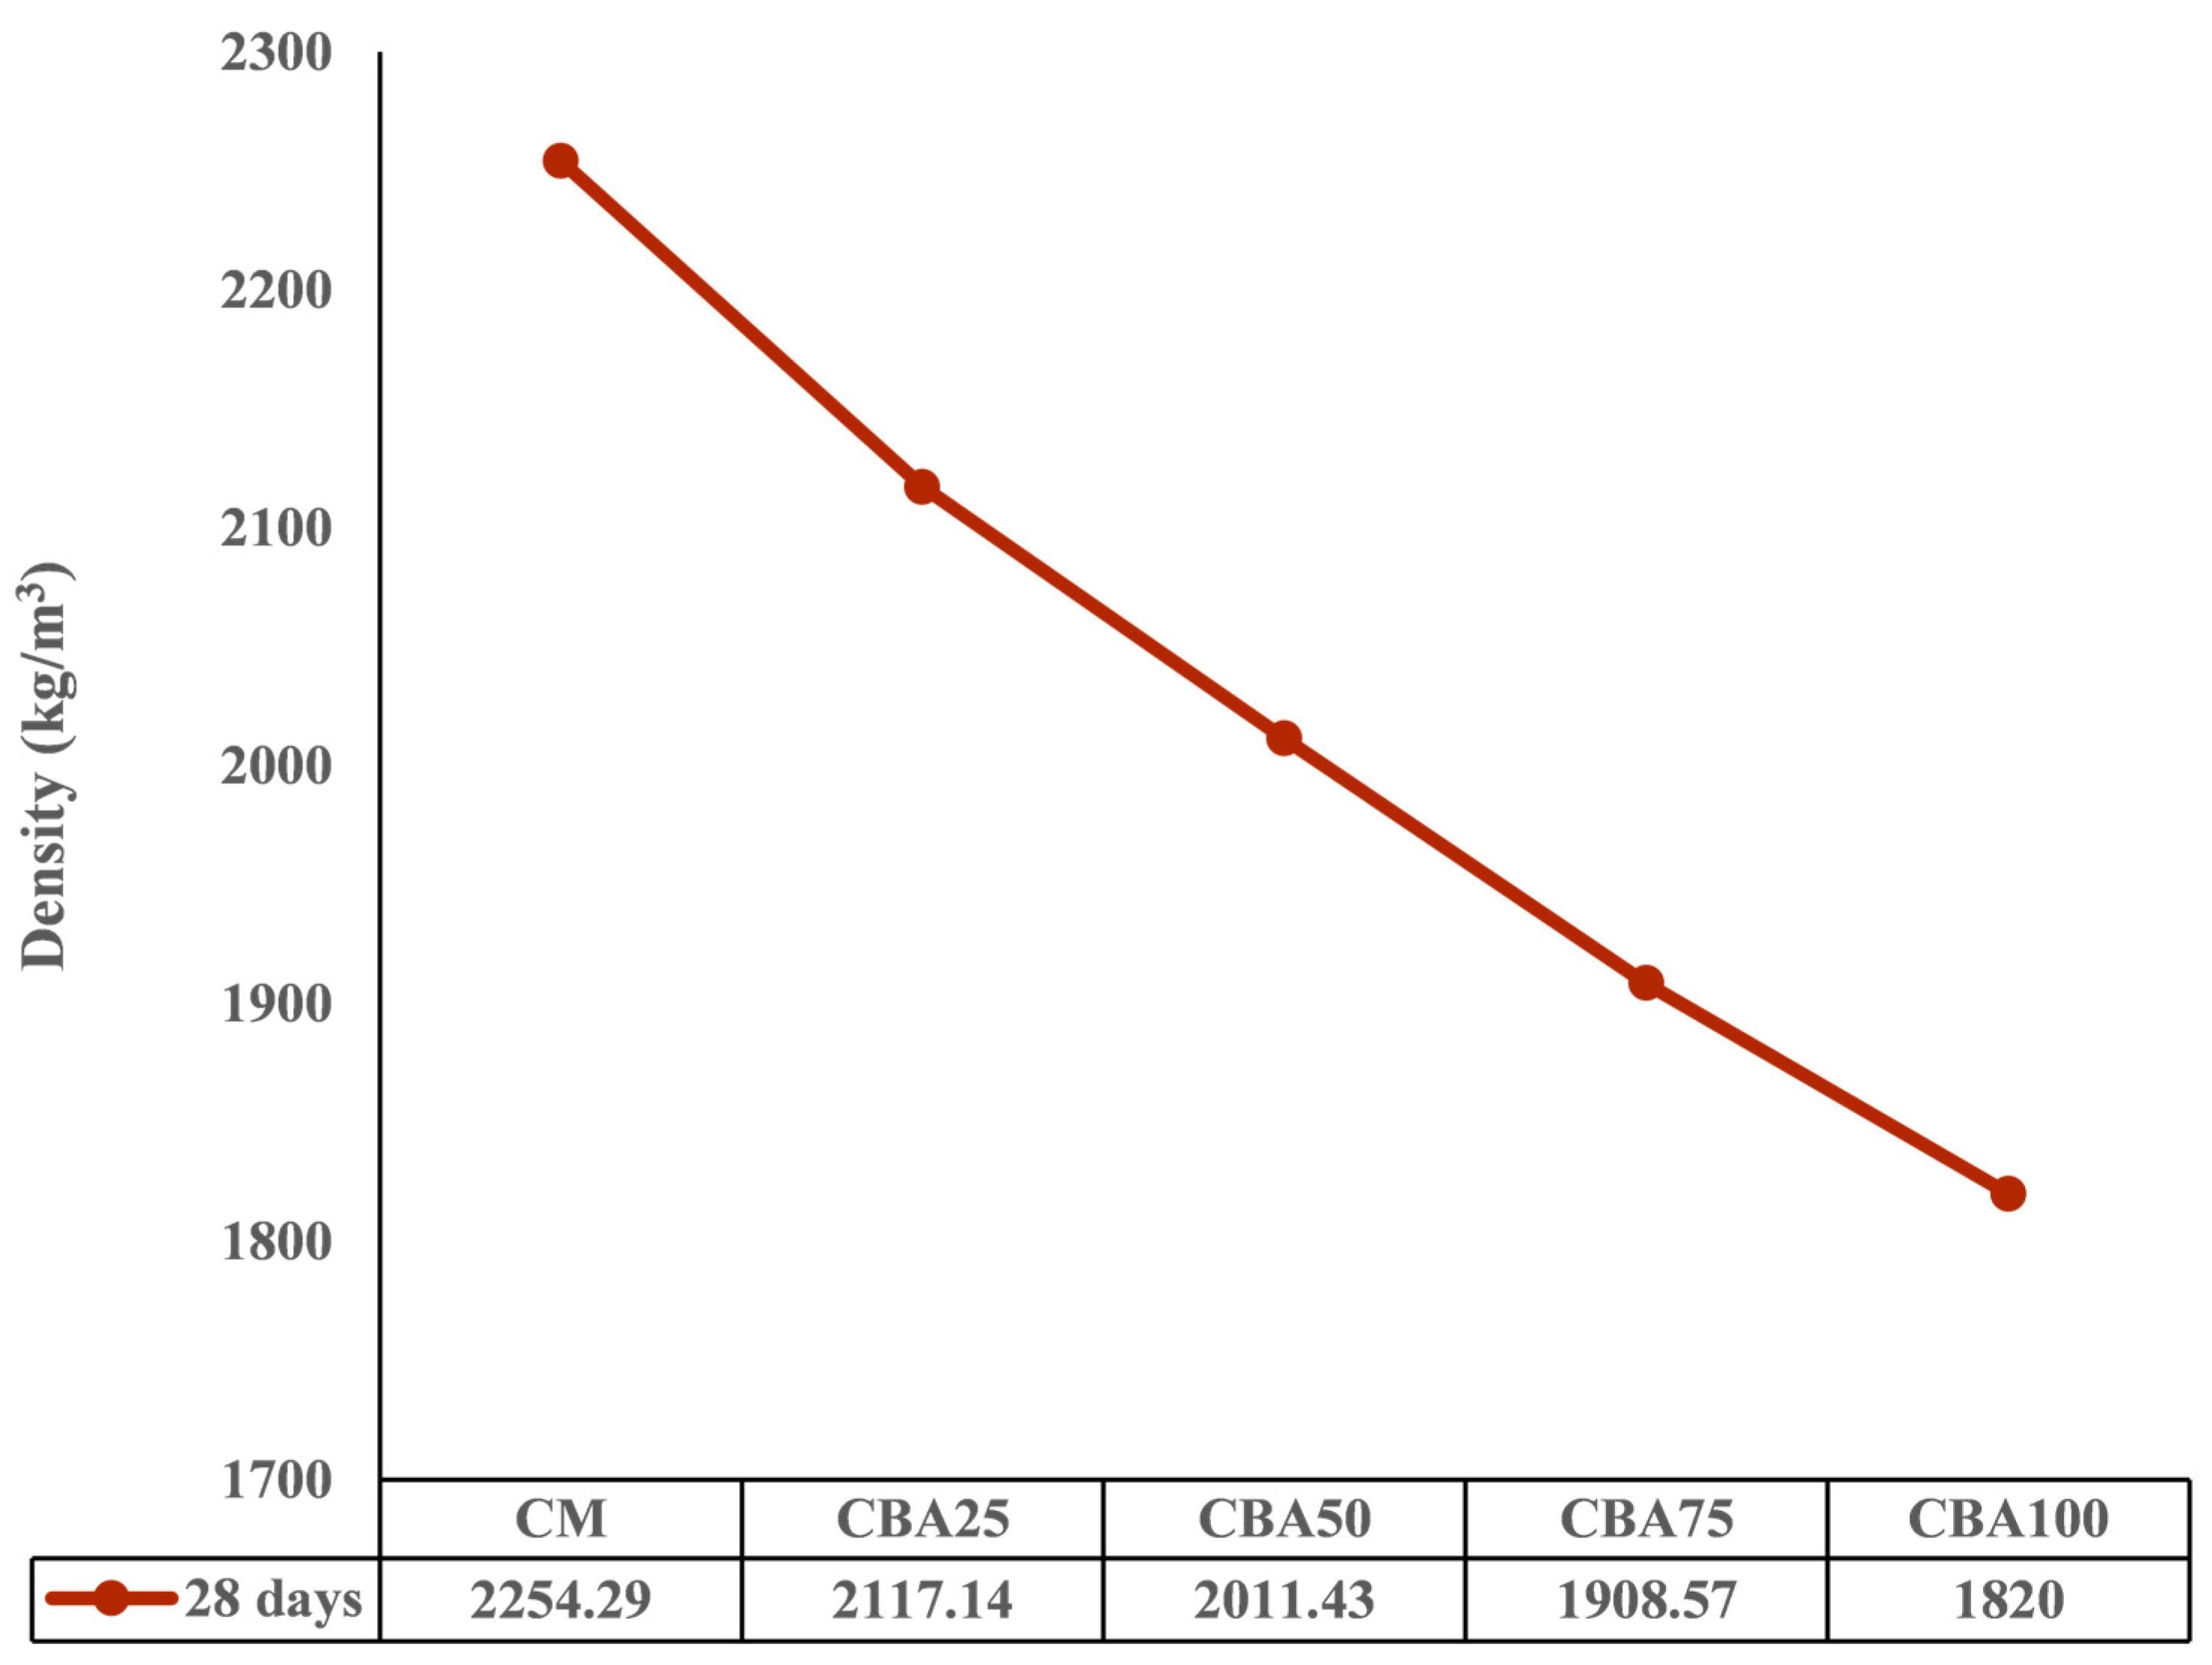
Figure 11 shows the 28-day dry density of the CM and mortars containing varying proportions of CBA. As illustrated, mortars modified with CBA generally exhibit lower dry densities at 28 days compared to the CM. This trend is further supported by Figure 12, which depicts the weight variations in the CM and CBA-modified mortars at 7, 14, and 28 days. At 28 days, the dry density decreased with increasing CBA content—specifically by 6.08%, 10.77%, 15.33%, and 19.27% for replacement levels of 25%, 50%, 75%, and 100% replacements, respectively. The lowest density was observed in CBA100. This decrease in density is primarily due to the lower bulk density and specific gravity of CBA. These findings align with prior research [38,39,41,42], confirming the impact of lightweight aggregate properties on mortar density.
The CM and CBA-modified mortars exhibited progressive weight increases over 7, 14, and 28 days. At 7 and 14 days, a higher content of CBA was associated with greater weight gain due to CBA’s greater water absorption capacity compared to NFA. However, this trend changed at 28 days, where a higher CBA content resulted in reduced weight gain. Overall, across all mixes, the rate of weight increase declined sharply from 7 to 14 days and then moderately from 14 to 28 days.

3.2.2. UPV

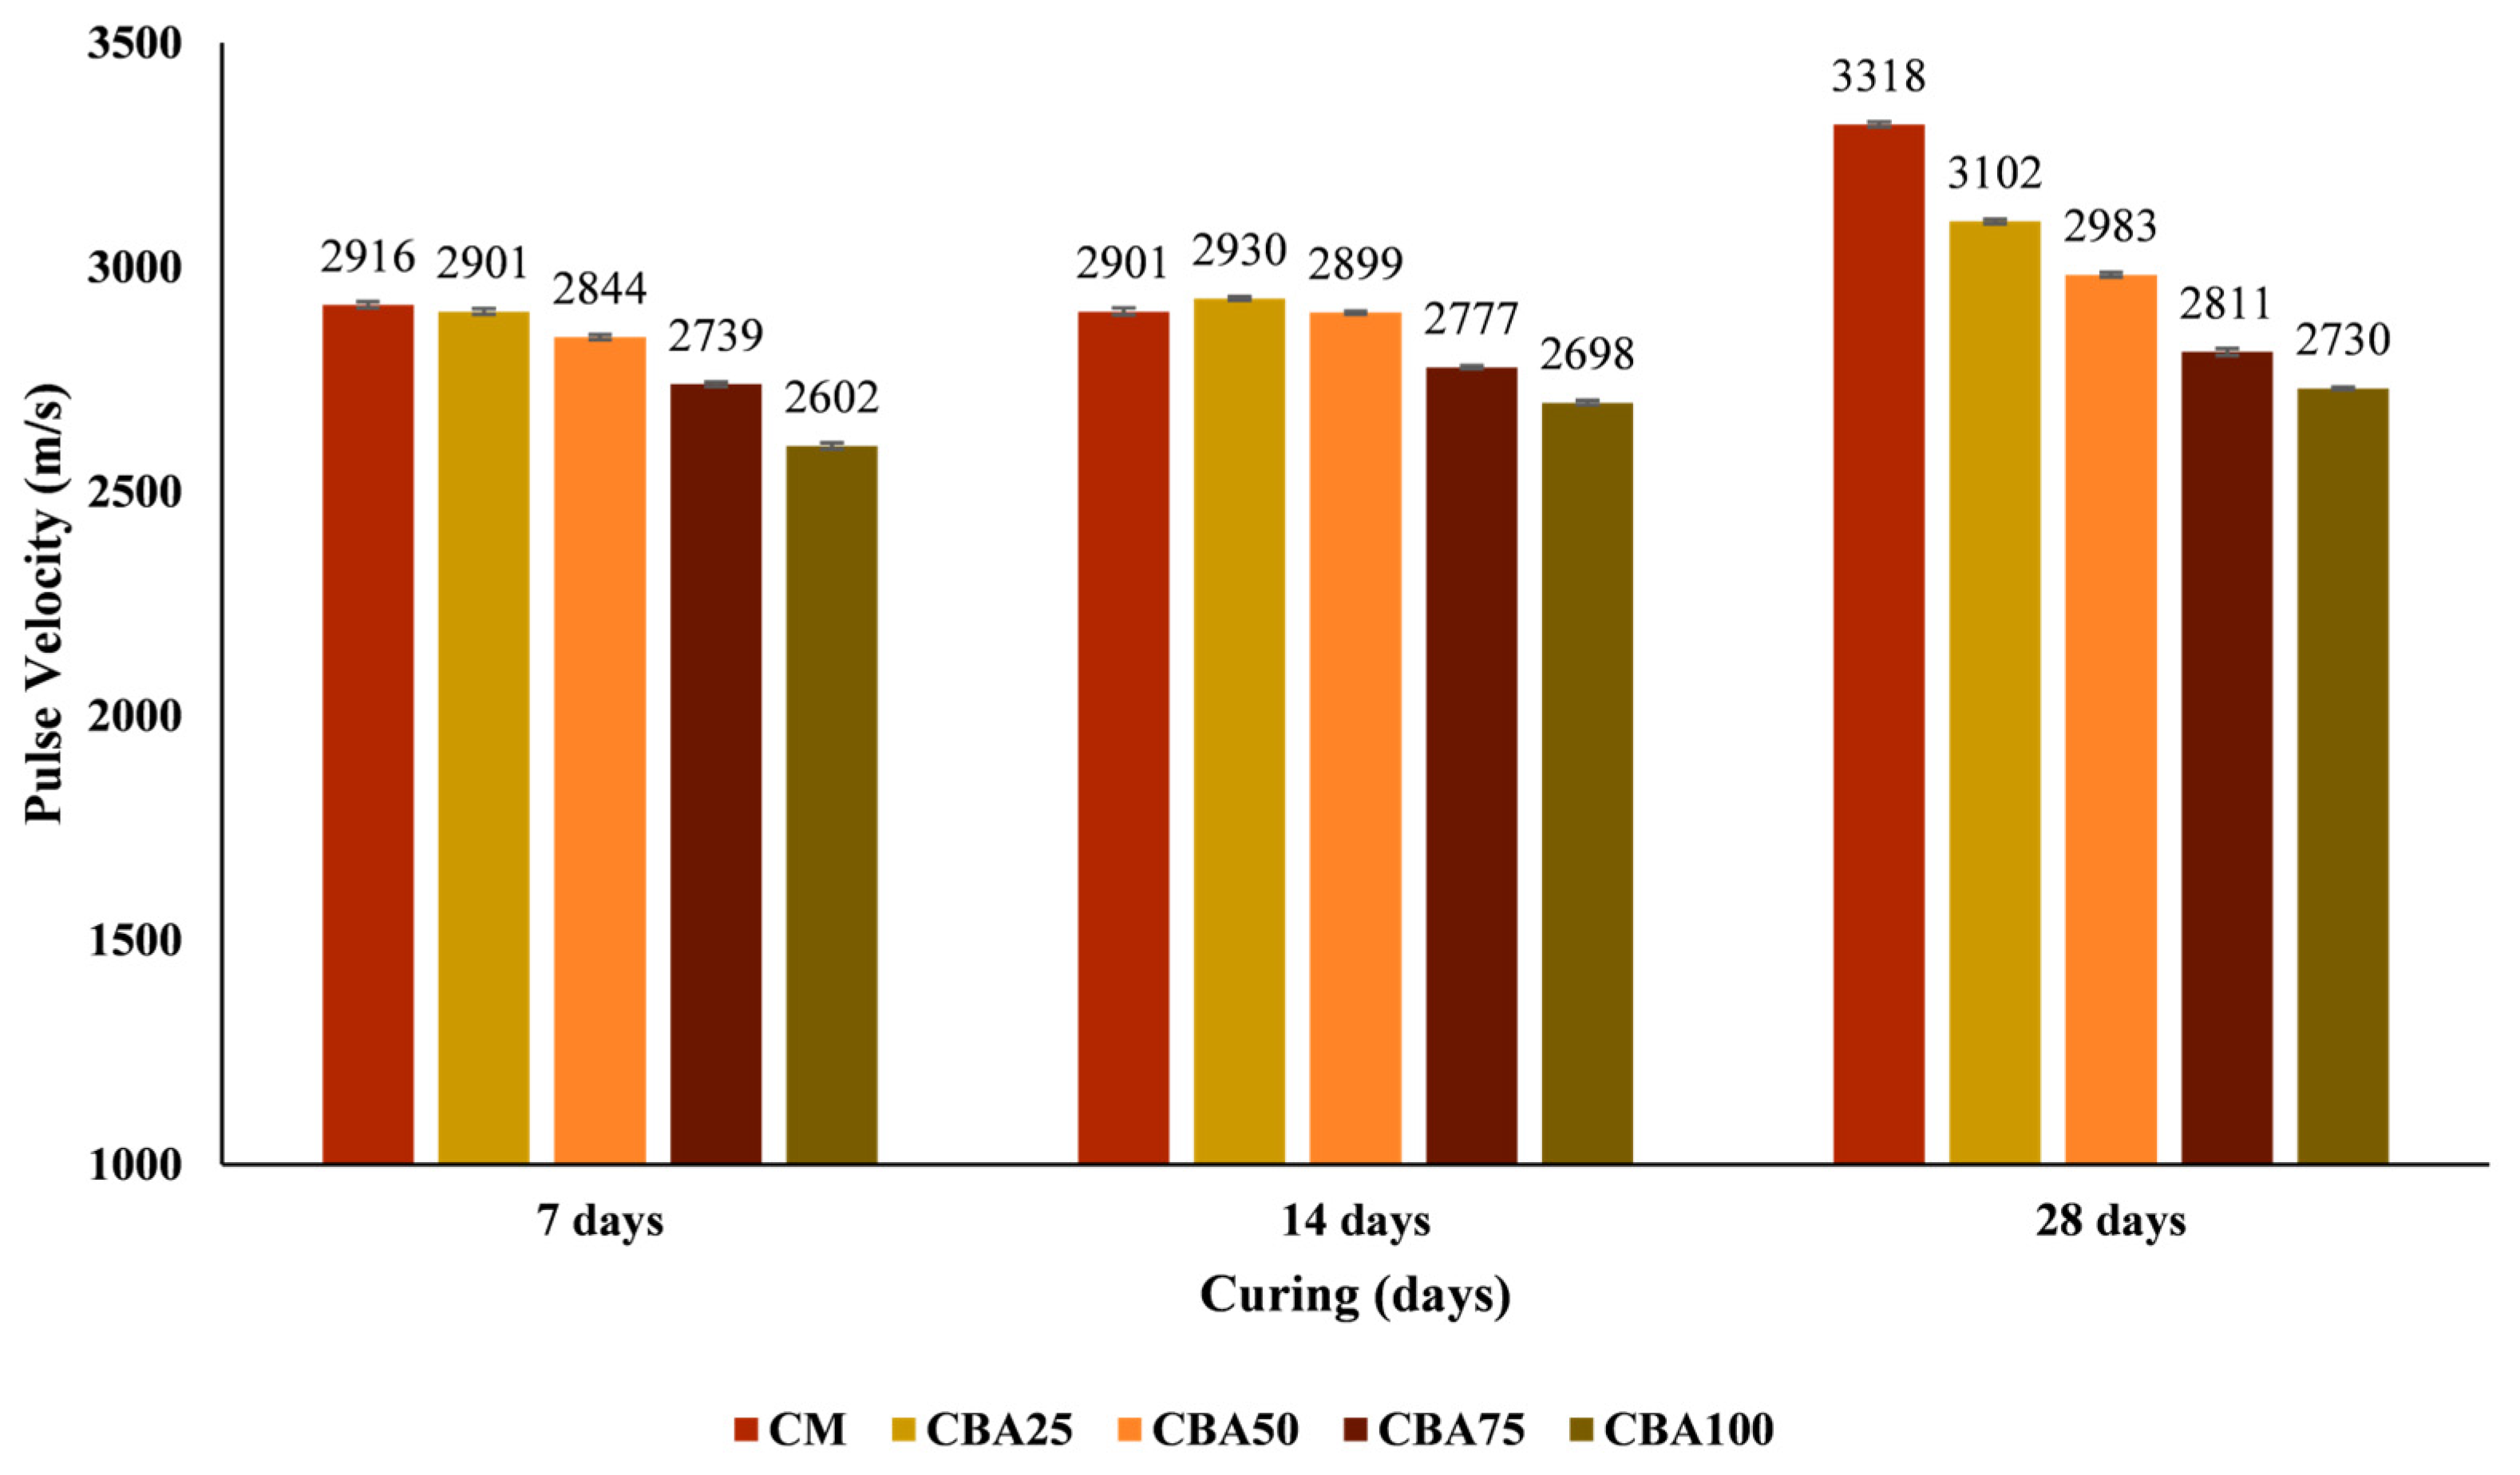
Figure 13 shows the UPV results for CM and CBA mortars with 25%, 50%, 75%, and 100% CBA replacement levels, tested at 7, 14, and 28 days of curing. UPV values for CBA mortars decreased as the CBA content increased, but they showed an upward trend with longer curing age. At 14 days, the UPV values increased by 9.40%, 1.00%, 1.93%, 1.39%, and 3.69% for 0%, 25%, 50%, 75%, and 100% CBA mixes, respectively. By 28 days, the increases were 4.01%, 5.87%, 2.89%, 1.21%, and 1.18%. These improvements are attributed to ongoing hydration, which fills capillary pores with hydration products. This process reduces porosity and enhances the overall density of the matrix.
However, higher levels of CBA resulted in smaller gains in UPV values across curing ages. The reductions in UPV values for CBA mixes compared to the CM at 7 days were 0.51%, 1.96%, 3.69%, and 5.00%; at 14 days, 8.15%, 1.05%, 4.20%, and 2.84%; and at 28 days, they were 6.50%, 3.83%, 5.77%, and 2.88%, for the 25%, 50%, 75%, and 100% CBA replacements, respectively. According to IS 516 (Part 5)—2018 [37], UPV values > 3000 m/s (Type III) indicate medium quality, while values < 3000 m/s (Type IV) indicate doubtful quality. Based on this, CM and CBA25 are classified as Type III, while CBA50, CBA75, and CBA100 fall into Type IV. These classifications align with previous findings of Huynh et al. and Srivastava et al. [38,41].

3.2.3. Compressive Strength (CS)

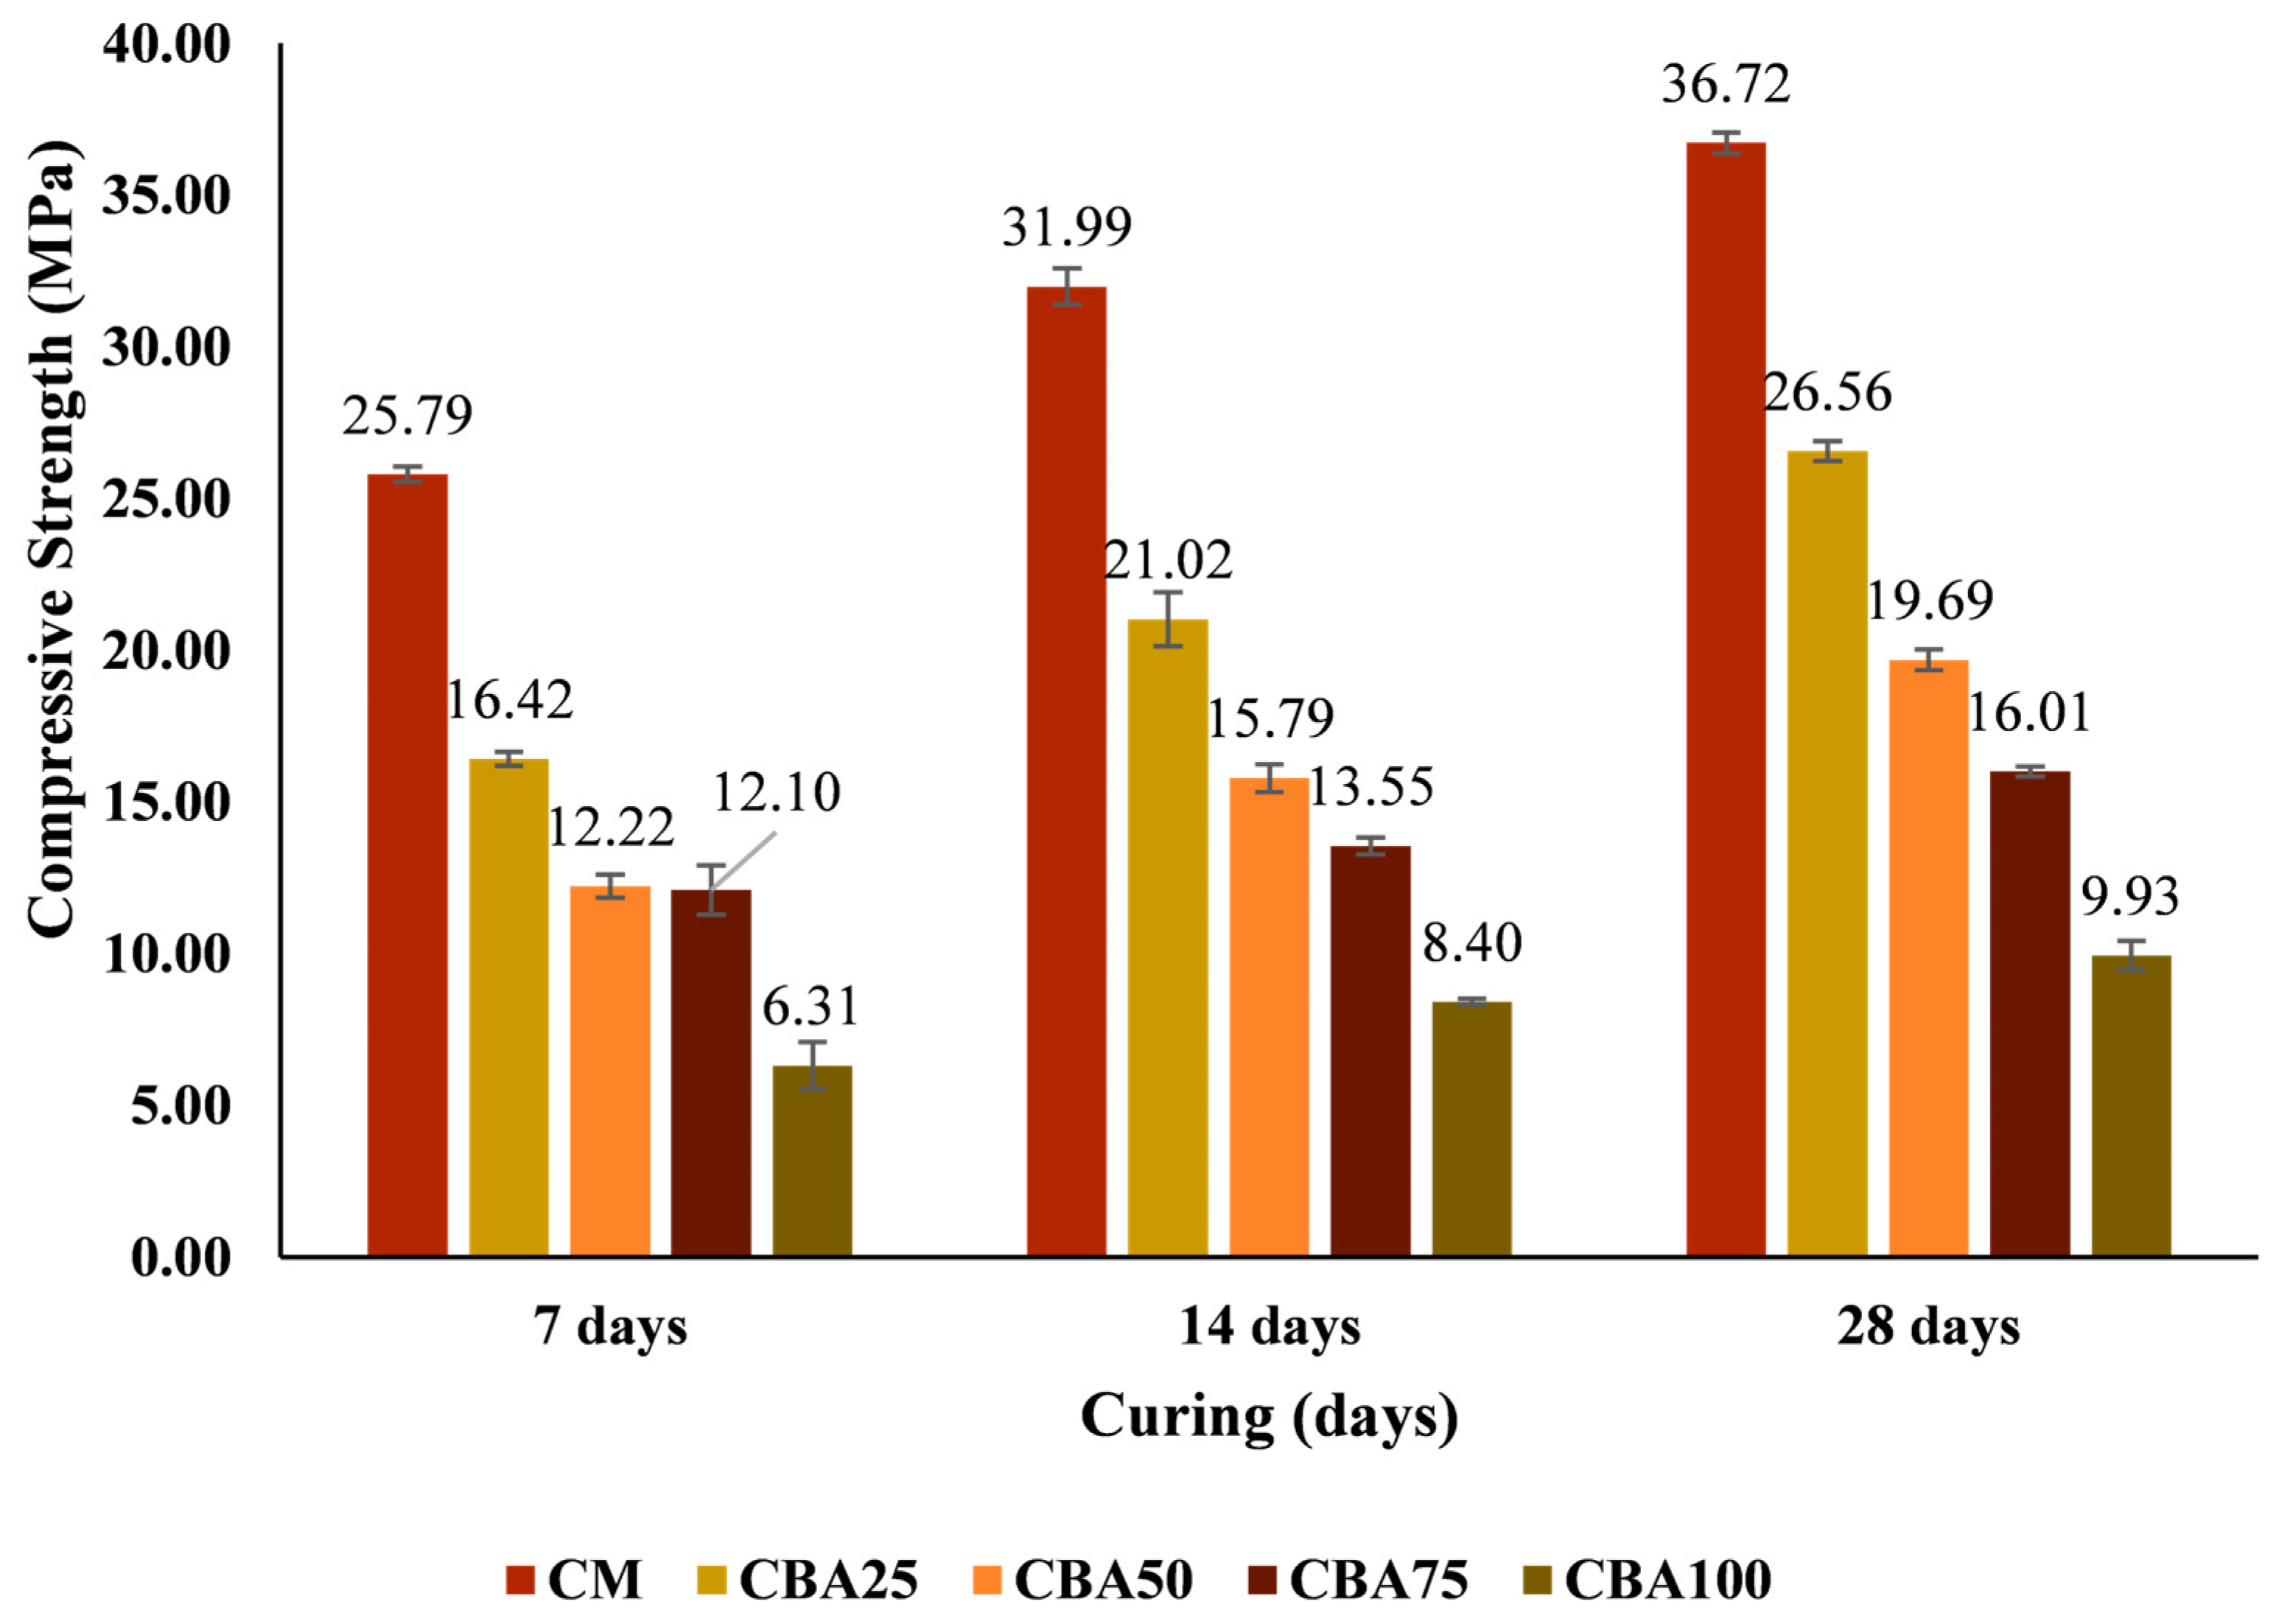
Figure 14 presents the CS of CM and mortars with 25%, 50%, 75%, and 100% CBA, evaluated at 7, 14, and 28 days. The results indicate that the CS declined as the CBA content increased; however, it improved with the curing time across all mixtures; however, with increasing CBA content but improved with curing time across all mixtures, consistent with previous research findings [38,39,41,43].
At 14 and 28 days, the strength gains observed ranged from 13% to 29%. These gains can be attributed to continued hydration and pozzolanic activity, with CBA contributing to long-term strength through internal curing and the formation of C–S–H gel. Despite these improvements, there were significant reductions in strength compared to the CM. Specifically, at 28 days, the mix contents 25%, 50%, 75% and 100% exhibited losses of 30.39%, 46.38%, 56.42%, and 72.96%, respectively. The full CBA replacement decreased strength from 36.72 MPa to 9.93 MPa, which is considerably greater than the ~48% loss reported by Huynh et al. [41].
This decline in strength is attributed to the lower specific gravity of CBA, increased porosity, and weaker particle bonding [44], all of which compromise the integrity of the matrix. Additionally, early age strength development in the CBA mixes was slower, with the 7-day strengths reaching only 62% to75% of 28-day values, compared to 70% for the CM. Nevertheless, all mixes met the minimum CS required by IS 2250:1981 [34].
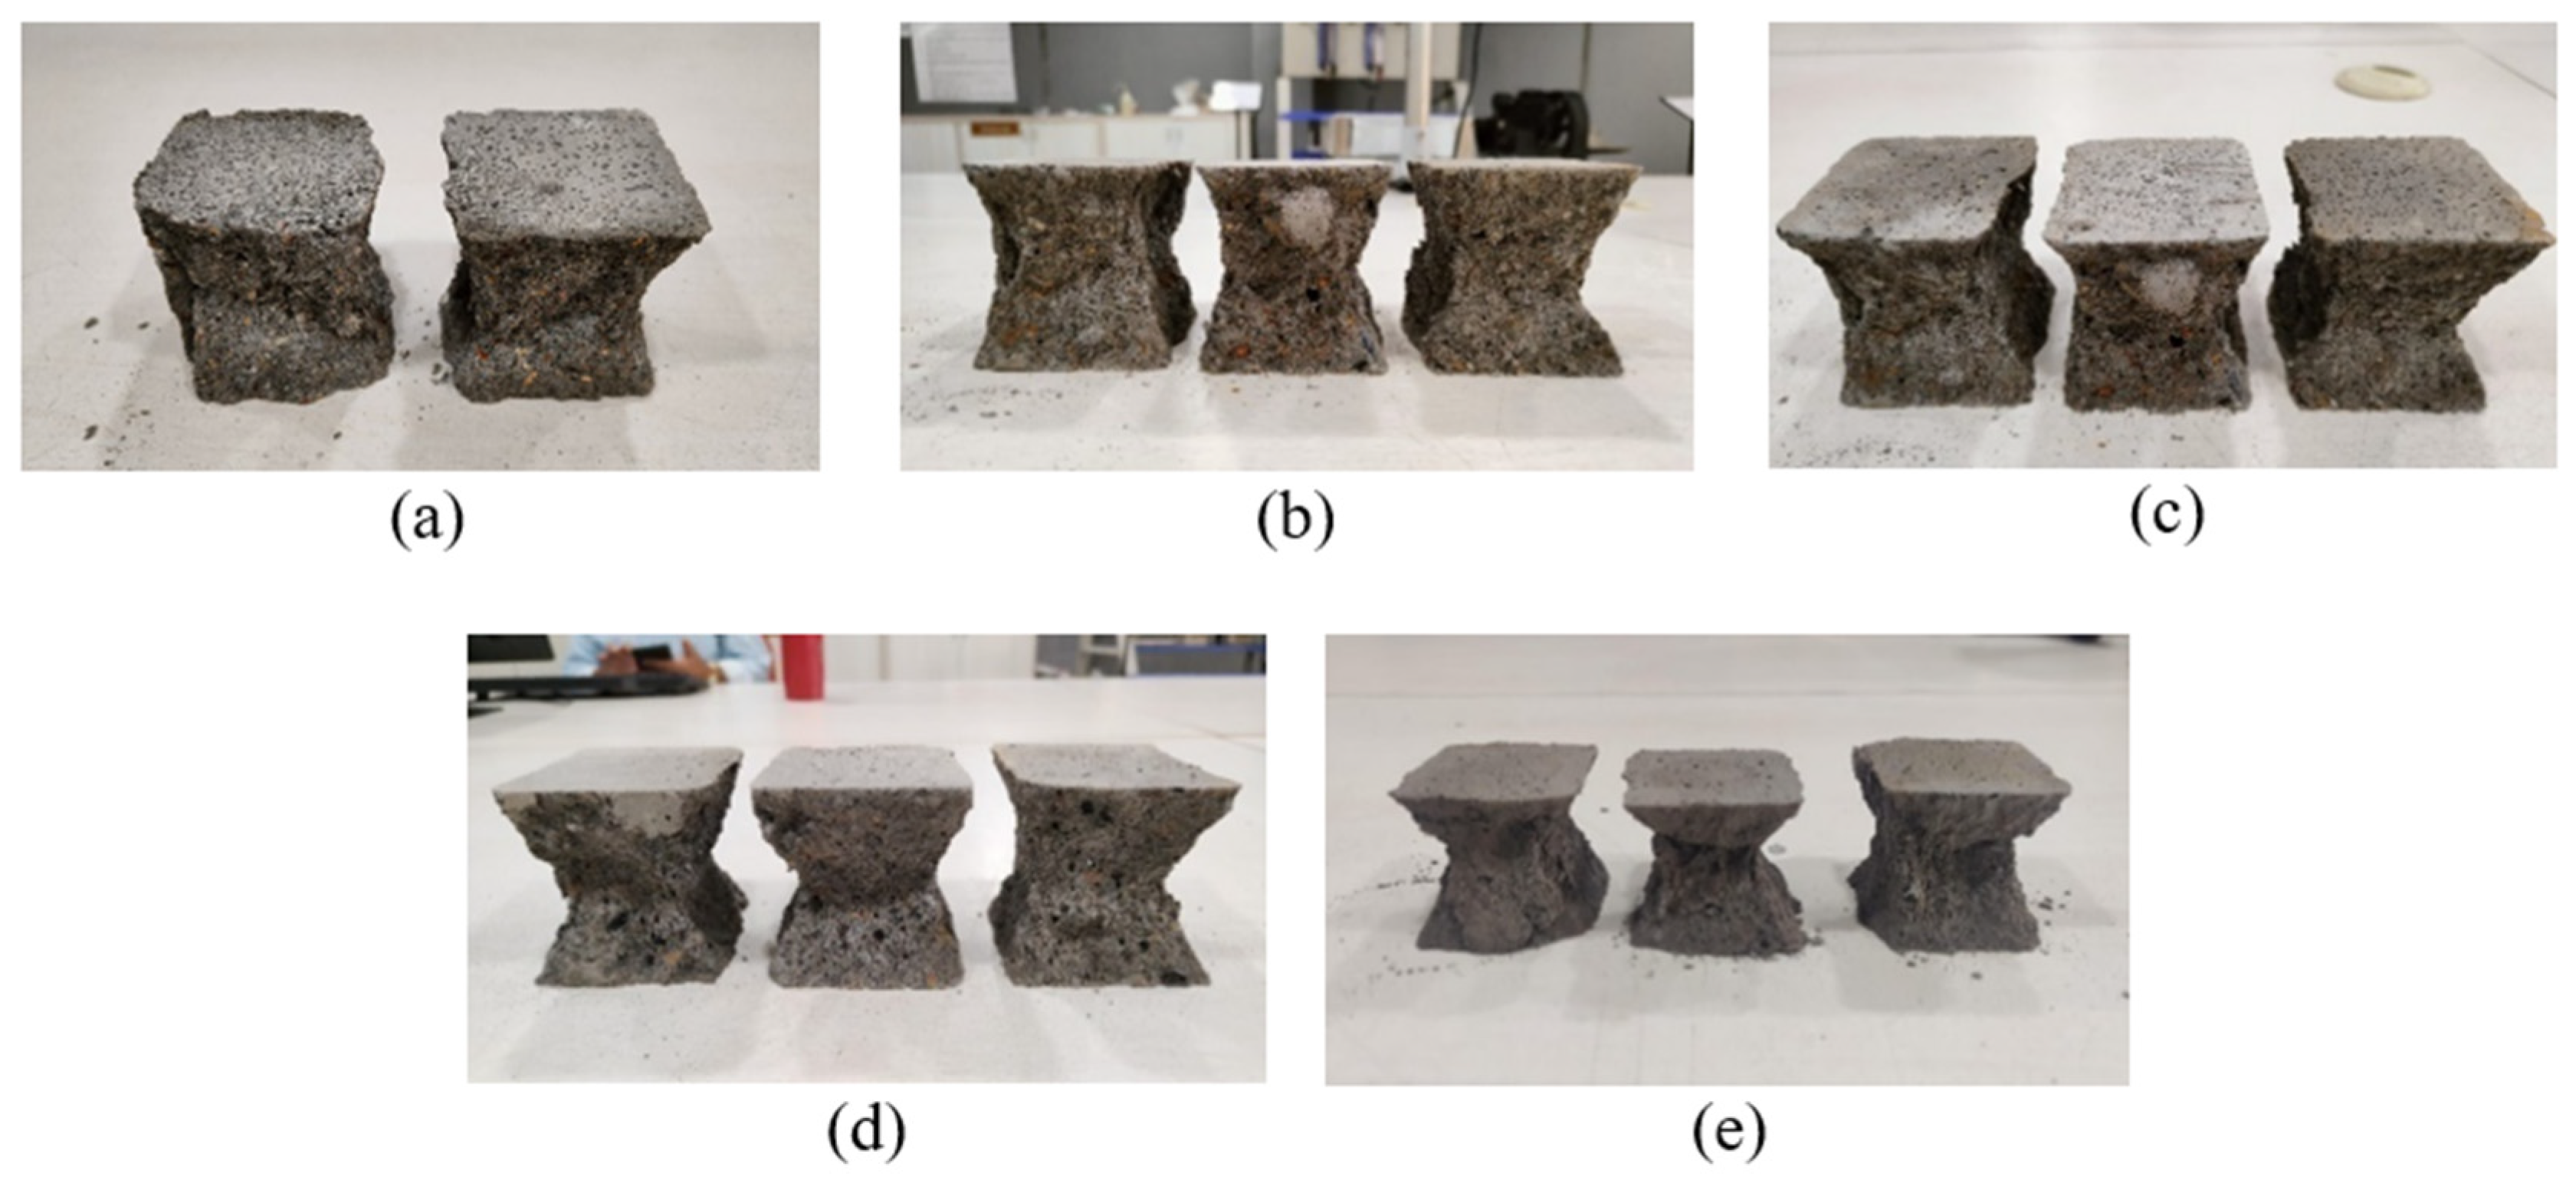
All specimens displayed brittle failure. However, CBA mortars experienced earlier crack initiation and faster crack propagation due to their high porosity and poor interfacial bonding, which led to sudden failure. Figure 15 illustrates the fracture patterns of CBA and CMs under compressive stress.

3.2.4. Water Absorption

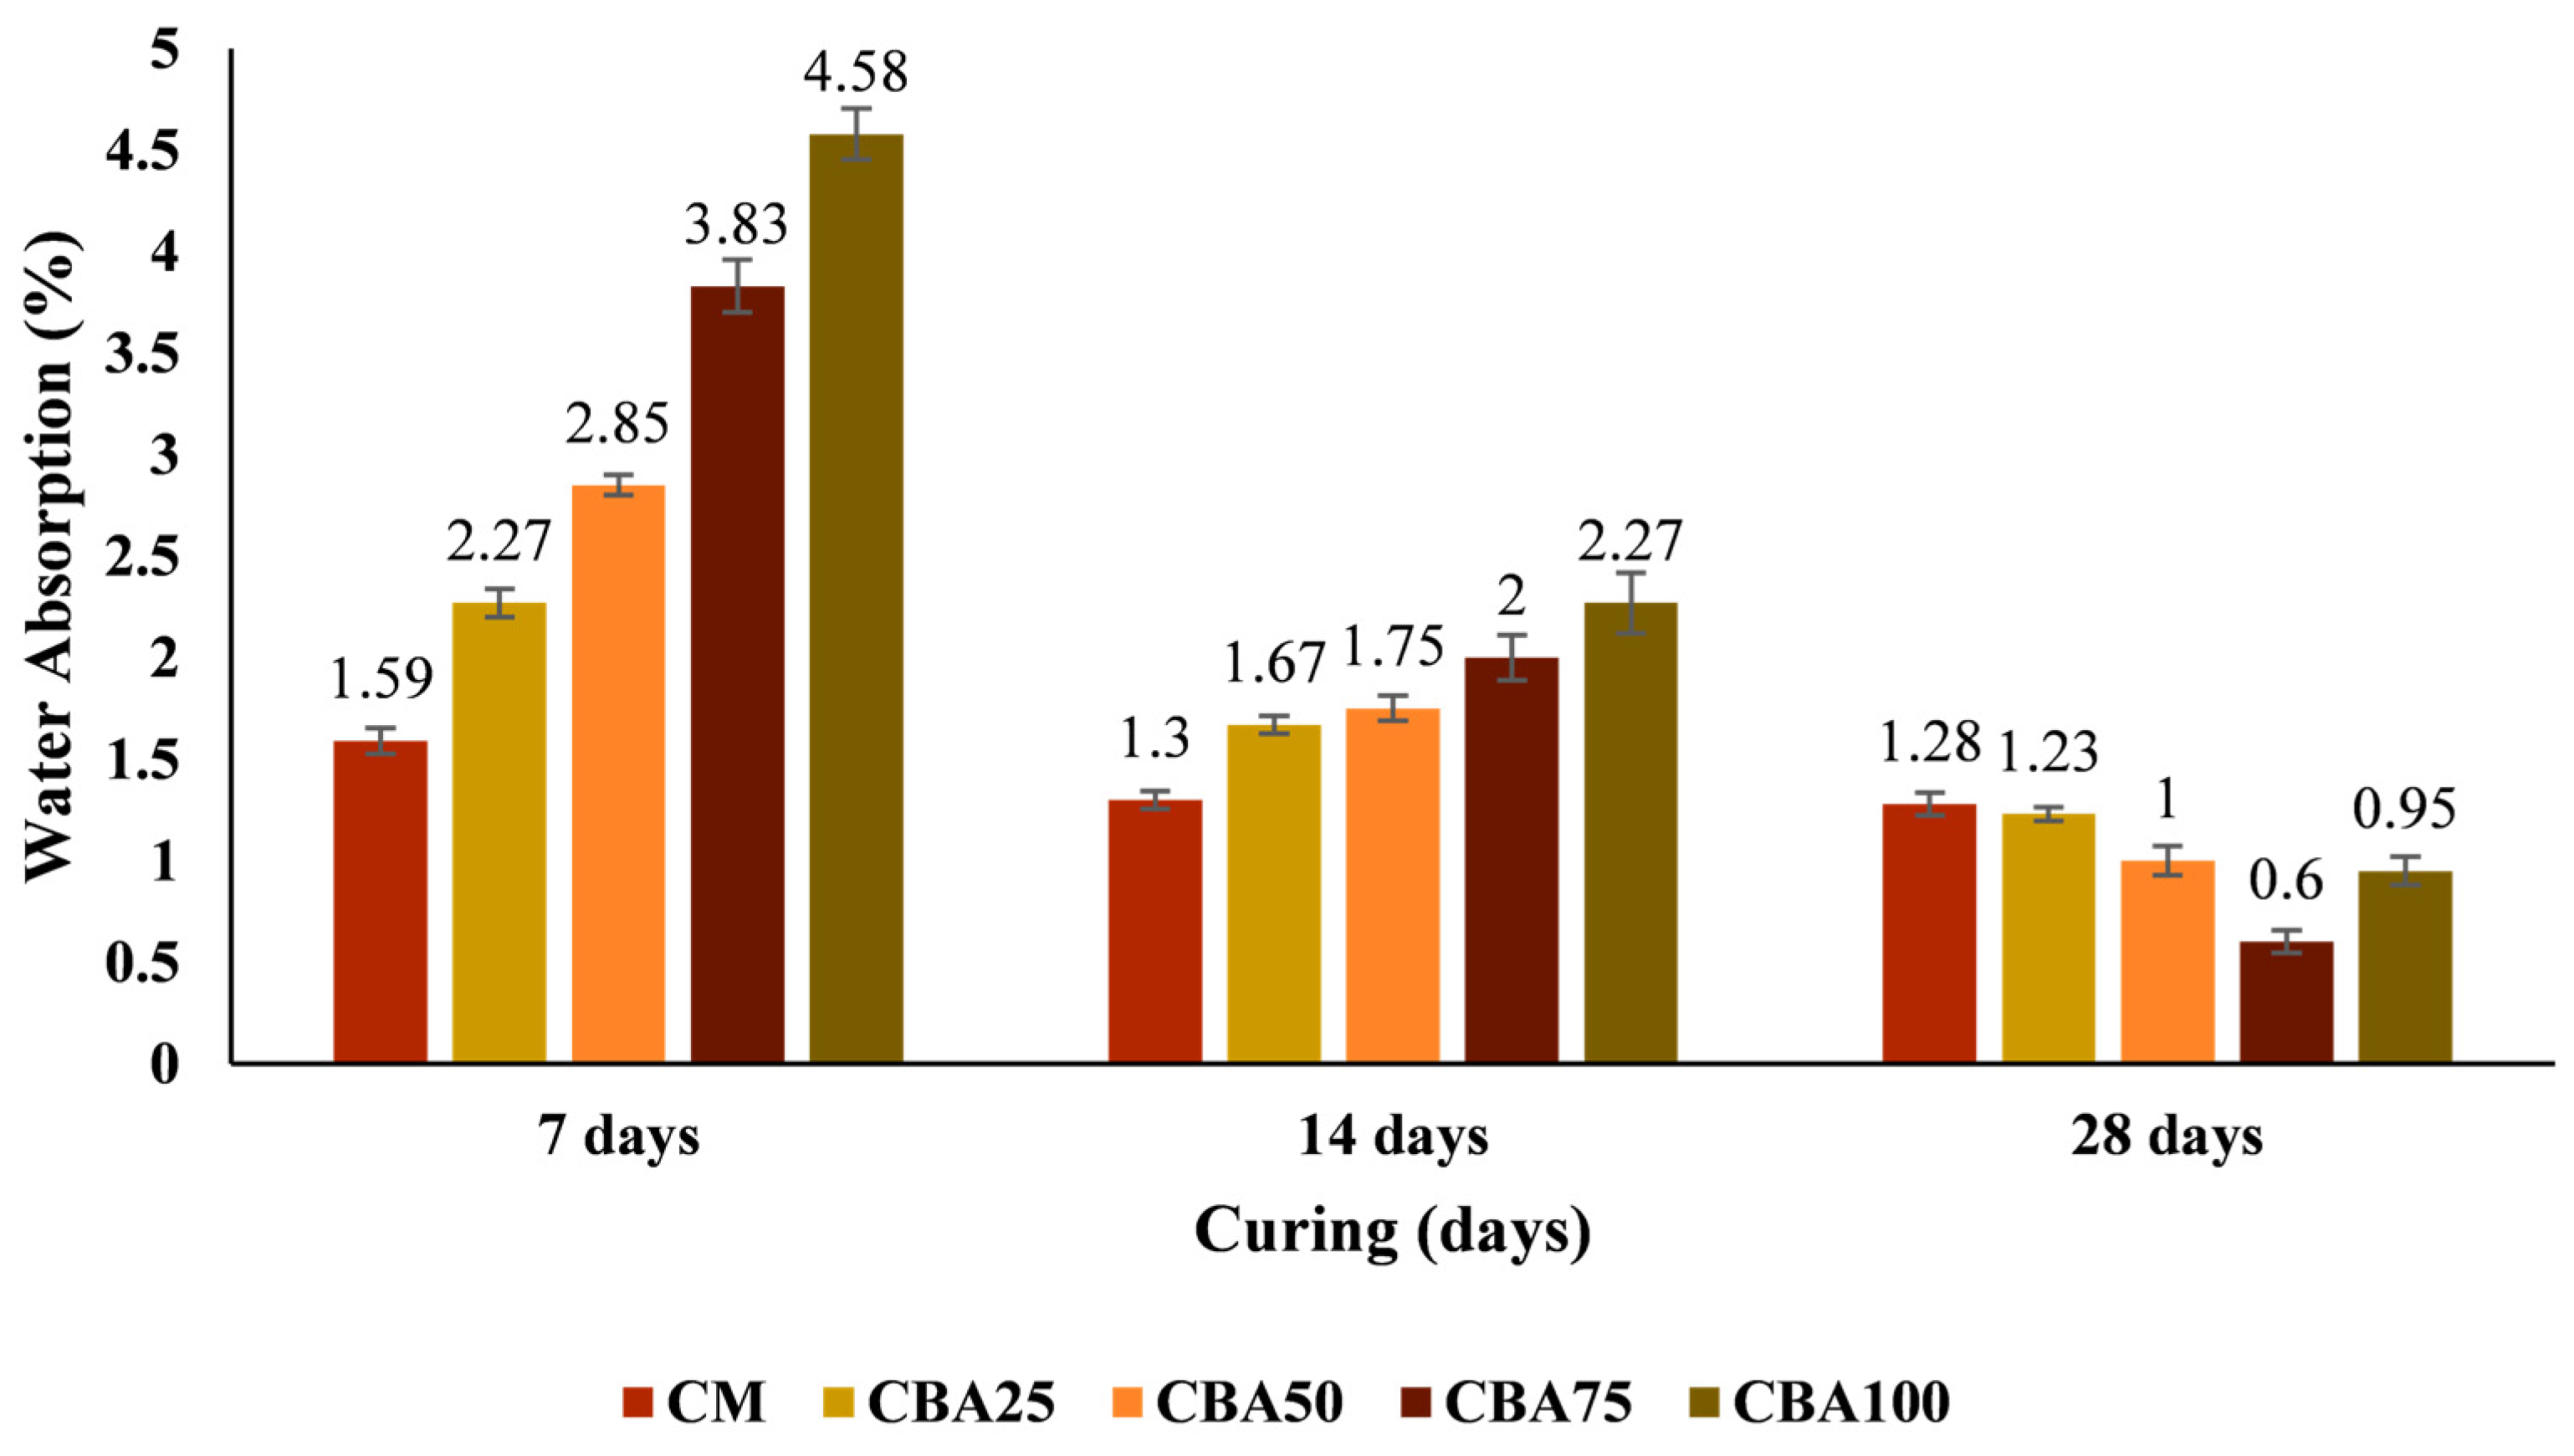
Figure 16 shows the water absorption trends of various mortar mixes. Water absorption increased with higher CBA replacement but decreased with longer curing durations. At 7 and 14 days, mortar with CBA had greater water absorption than CM. However, this trend reversed at 28 days, where mortars with CBA had reduced absorption, indicating improved long-term densification. Curing age significantly affected the absorption behaviour of the mixes. Between 7 and 14 days, water absorption decreased as follows: 18.24% for CM, 26.43% for CBA25, 38.60% for CBA50, 47.78% for CBA75, and 50.44% for CBA100. Further reductions at 28 days were 1.54%, 26.35%, 75.00%, 70.00%, and 58.15%, respectively. This reflects ongoing hydration and densification of the microstructure, as hydration products fill capillary voids and reduce pore connectivity and water permeability [38].
At 7 days, the highest absorption occurred in the CBA100 mortar, while the lowest was in CM. By 28 days, the CM had the highest value and CBA75 had the lowest. The deviation of the absorption trend for the CBA100 mix is likely due to excessive porosity offsetting hydration-induced densification. These findings align with previous studies by Huynh et al., which found that higher CBA replacement led to increased water absorption initially but decreased with extended curing, highlighting the effects of aggregate type and curing on pore structure [41].

3.3. Strength Correlations

3.3.1. Relationship Between UPV and CS

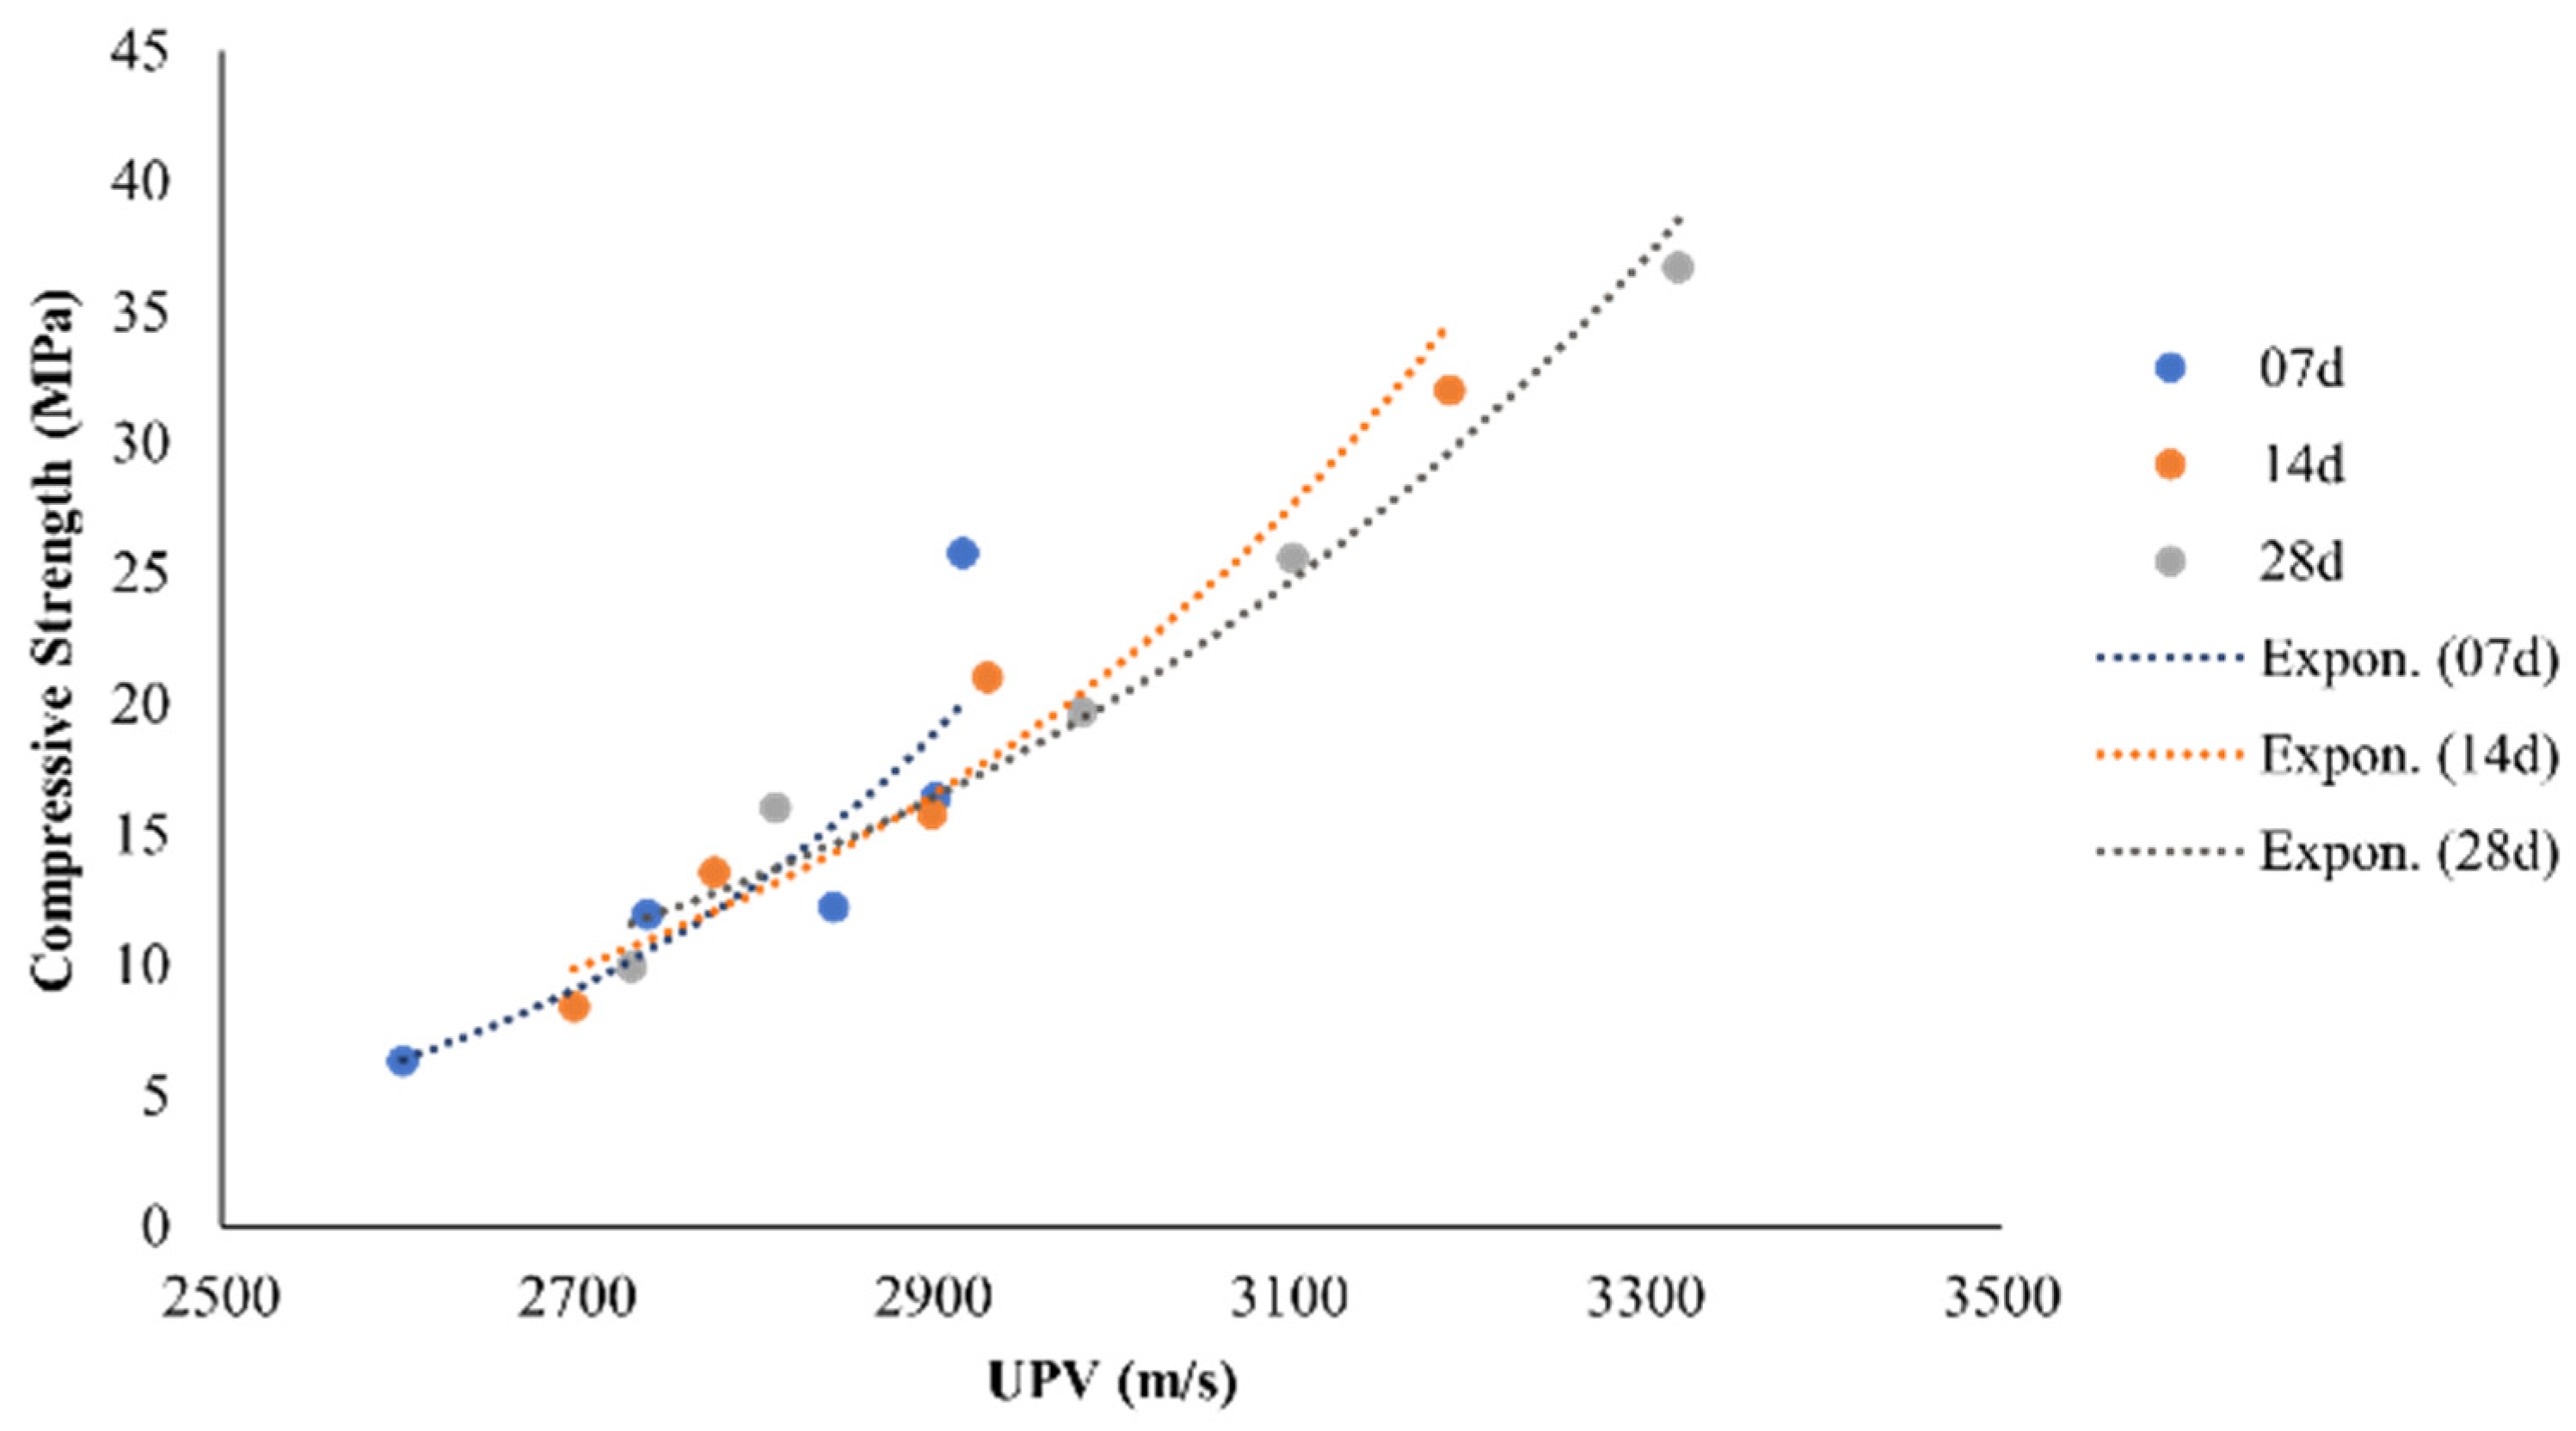
Figure 17 illustrates the correlation between CS and UPV for CM and CBA mortars at 7, 14, and 28 days. The data points for each curing age exhibit a clear exponential relationship, modelled using Equation (1):
f c   = A · e B · V
where fc is the CS and A and B are empirical constants. V is Pulse velocity in m/s
Table 5 represents the correlation between the UPV and CS of the mortar mixes. A strong positive correlation is observed across all curing ages, with R2 values between 0.93 and 0.97. Although there are variations in CS due to different levels of CBA replacement, the exponential correlation remains strong and consistent. These findings reinforce the notion that UPV is a reliable non-destructive indicator for predicting CS in CBA mortars. Additionally, the empirical constants derived from this study closely align with values reported in previous research by M. Singh et al., Srivastava et al., and Yang et al. [20,38,44]. However, the correlation coefficients in this study are slightly higher, indicating an improvement in predictive accuracy.

3.3.2. Relationship Between CS and Flowability

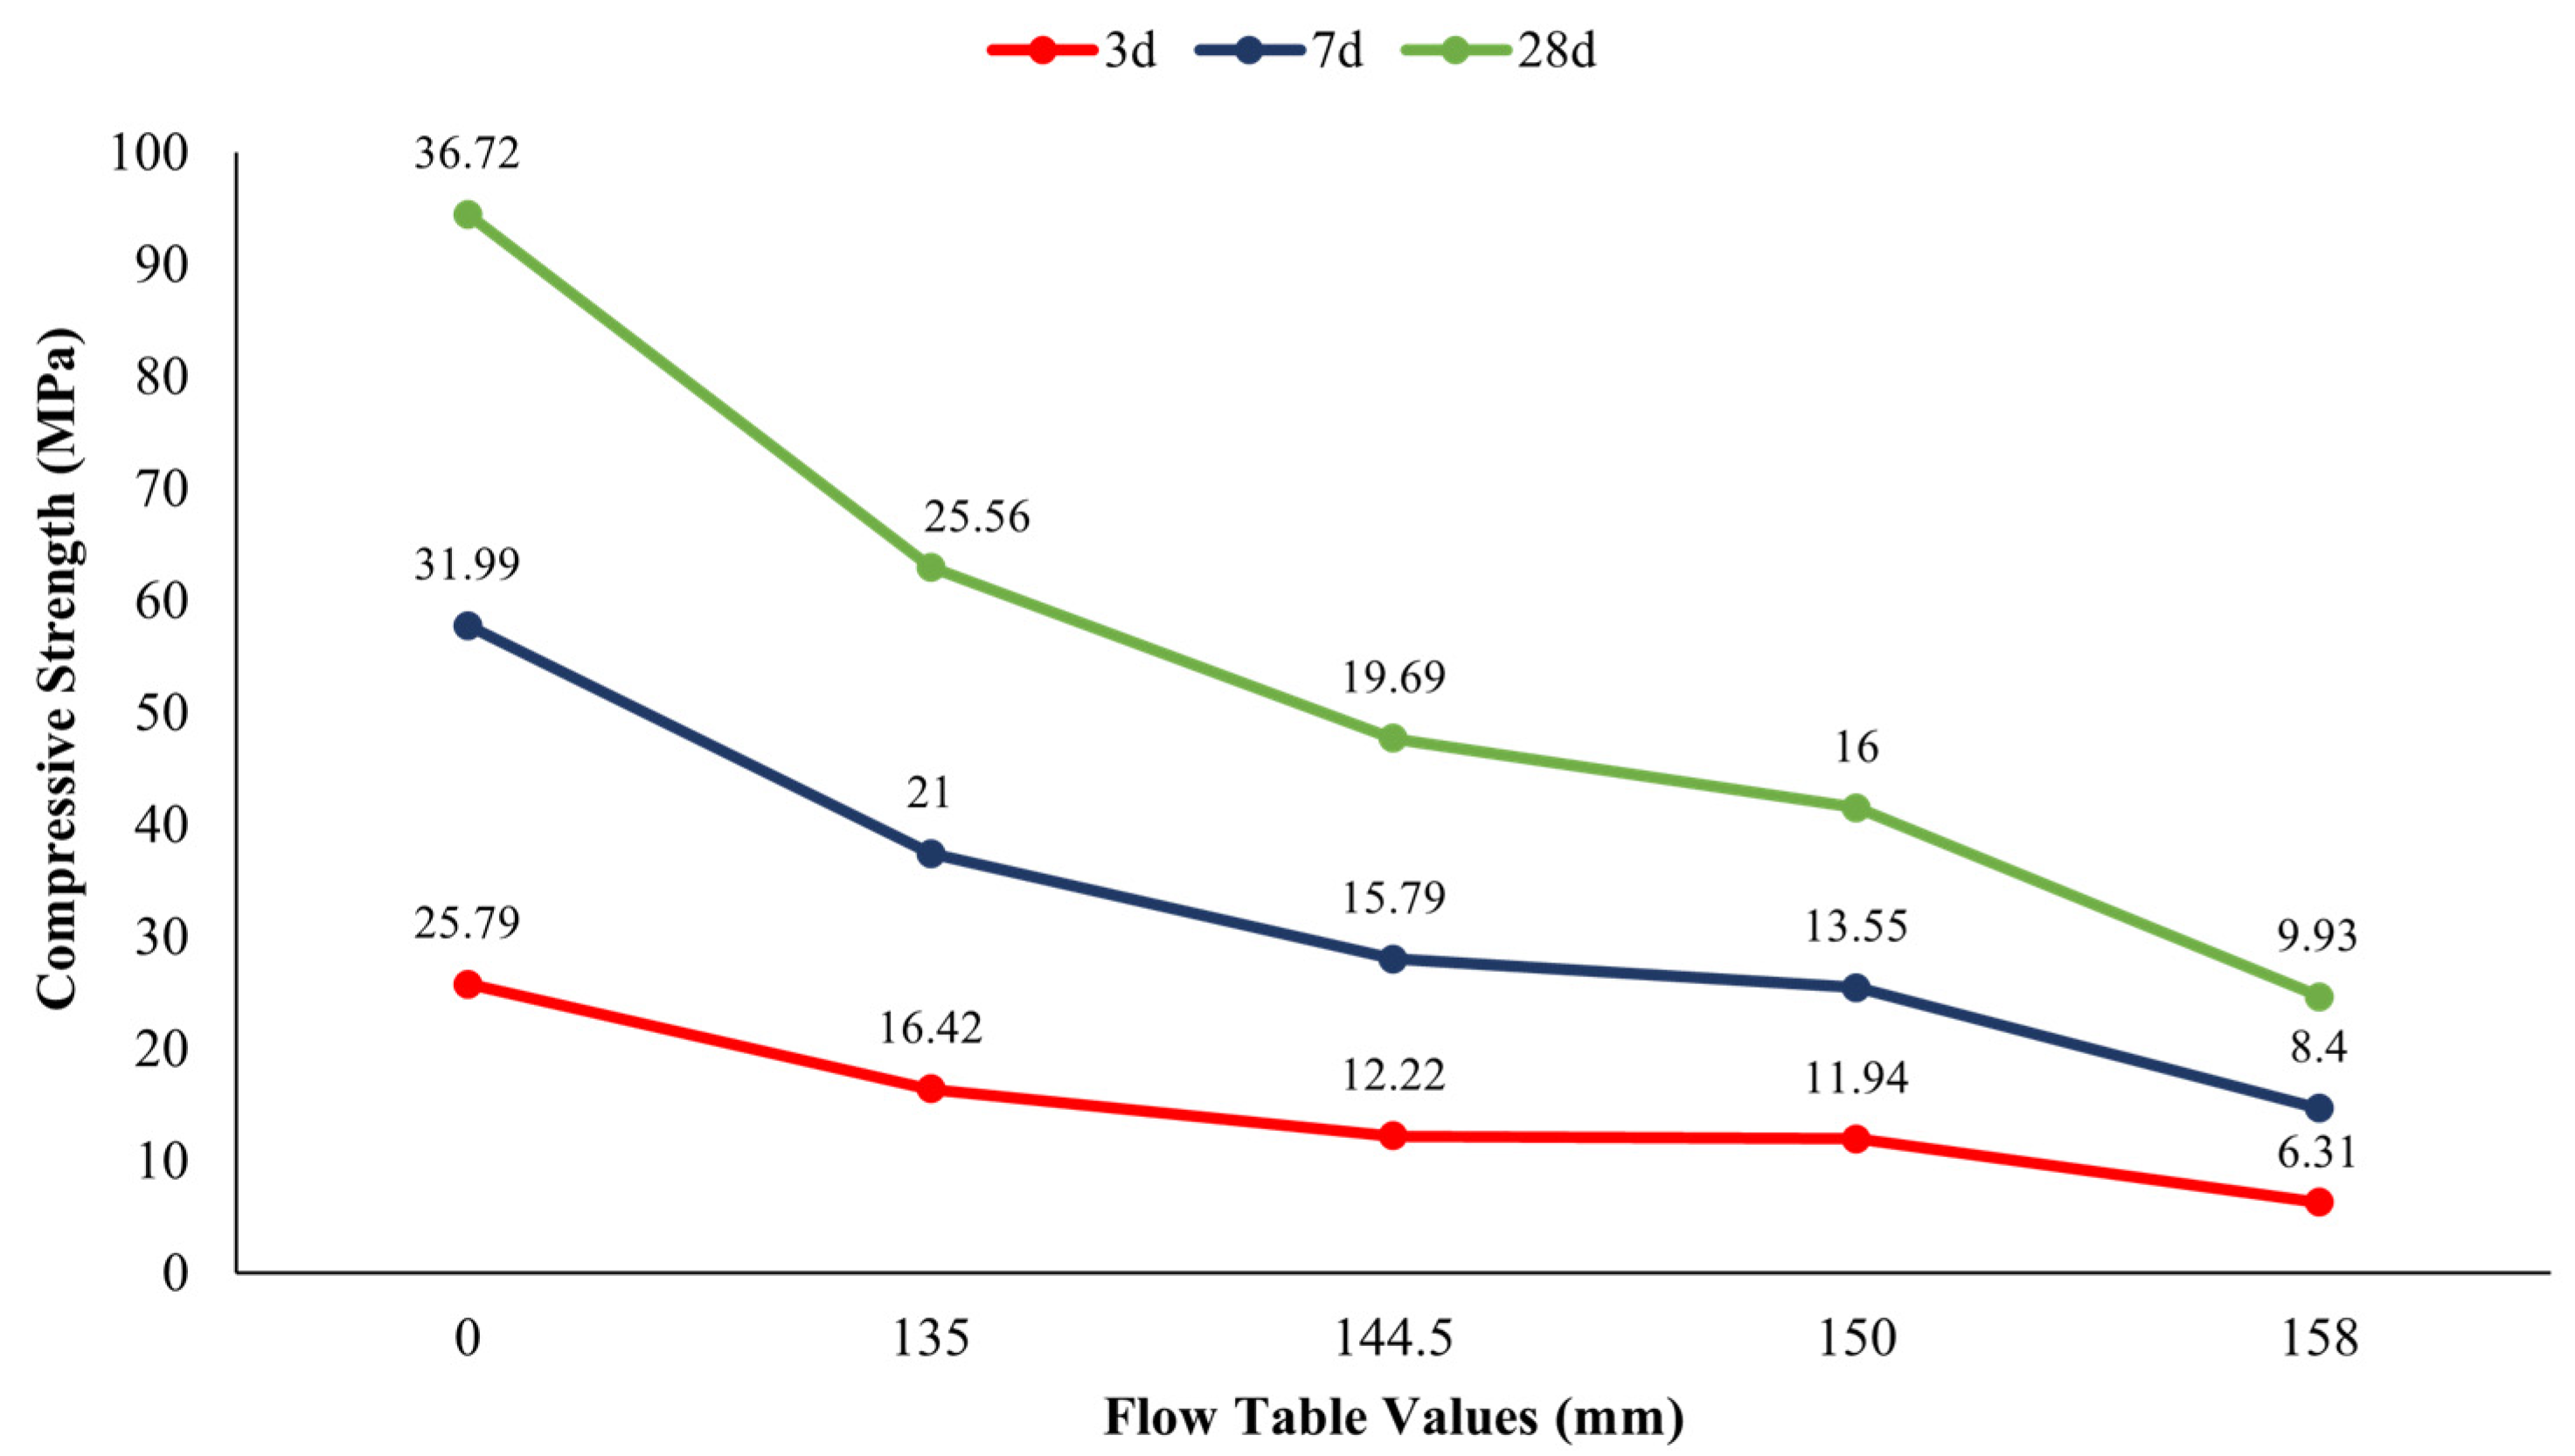
Figure 18 illustrates the CS of CM and CBA-modified mortars at 7, 14, and 28 days compared to their respective flow table values. For each level of CBA replacement, the CS increased with curing age. However, an inverse relationship was noted between flow value and CS—higher workability consistently corresponded to lower strength. This trend was particularly evident at higher CBA replacement levels, where increased flow values were associated with significant losses in strength.

3.4. Morphology and Microstructural Analysis

Figure 19 displays SEM images of various mortar mixtures after 28 days of curing. The images reveal a well-developed microstructure characterised by the prominent formation of hydration products, particularly ettringite and portlandite. Ettringite appears as needle-like crystals, indicating early-stage hydration, while portlandite is seen as well-defined hexagonal platelets, which reflects the hydration of tricalcium silicate (C3S) and dicalcium silicate (C2S). The abundant and well-formed Portlandite platelets suggest substantial generation of Ca(OH)2. Additionally, the SEM images show the presence of C–S–His, which is identified as an amorphous to poorly crystalline gel that fills capillary pores and serves as the primary contributor to mechanical strength. Calcium aluminosilicate hydrate (C–A–S–H), which is morphologically similar to C–S–H but contains aluminium, is also observed. Its formation is typically associated with the pozzolanic reaction of supplementary cementitious materials (SCMs). The coexistence of C–S–H and C–A–S–H phases confirms that SCMs contribute to the refinement of the microstructure and enhance long-term performance.
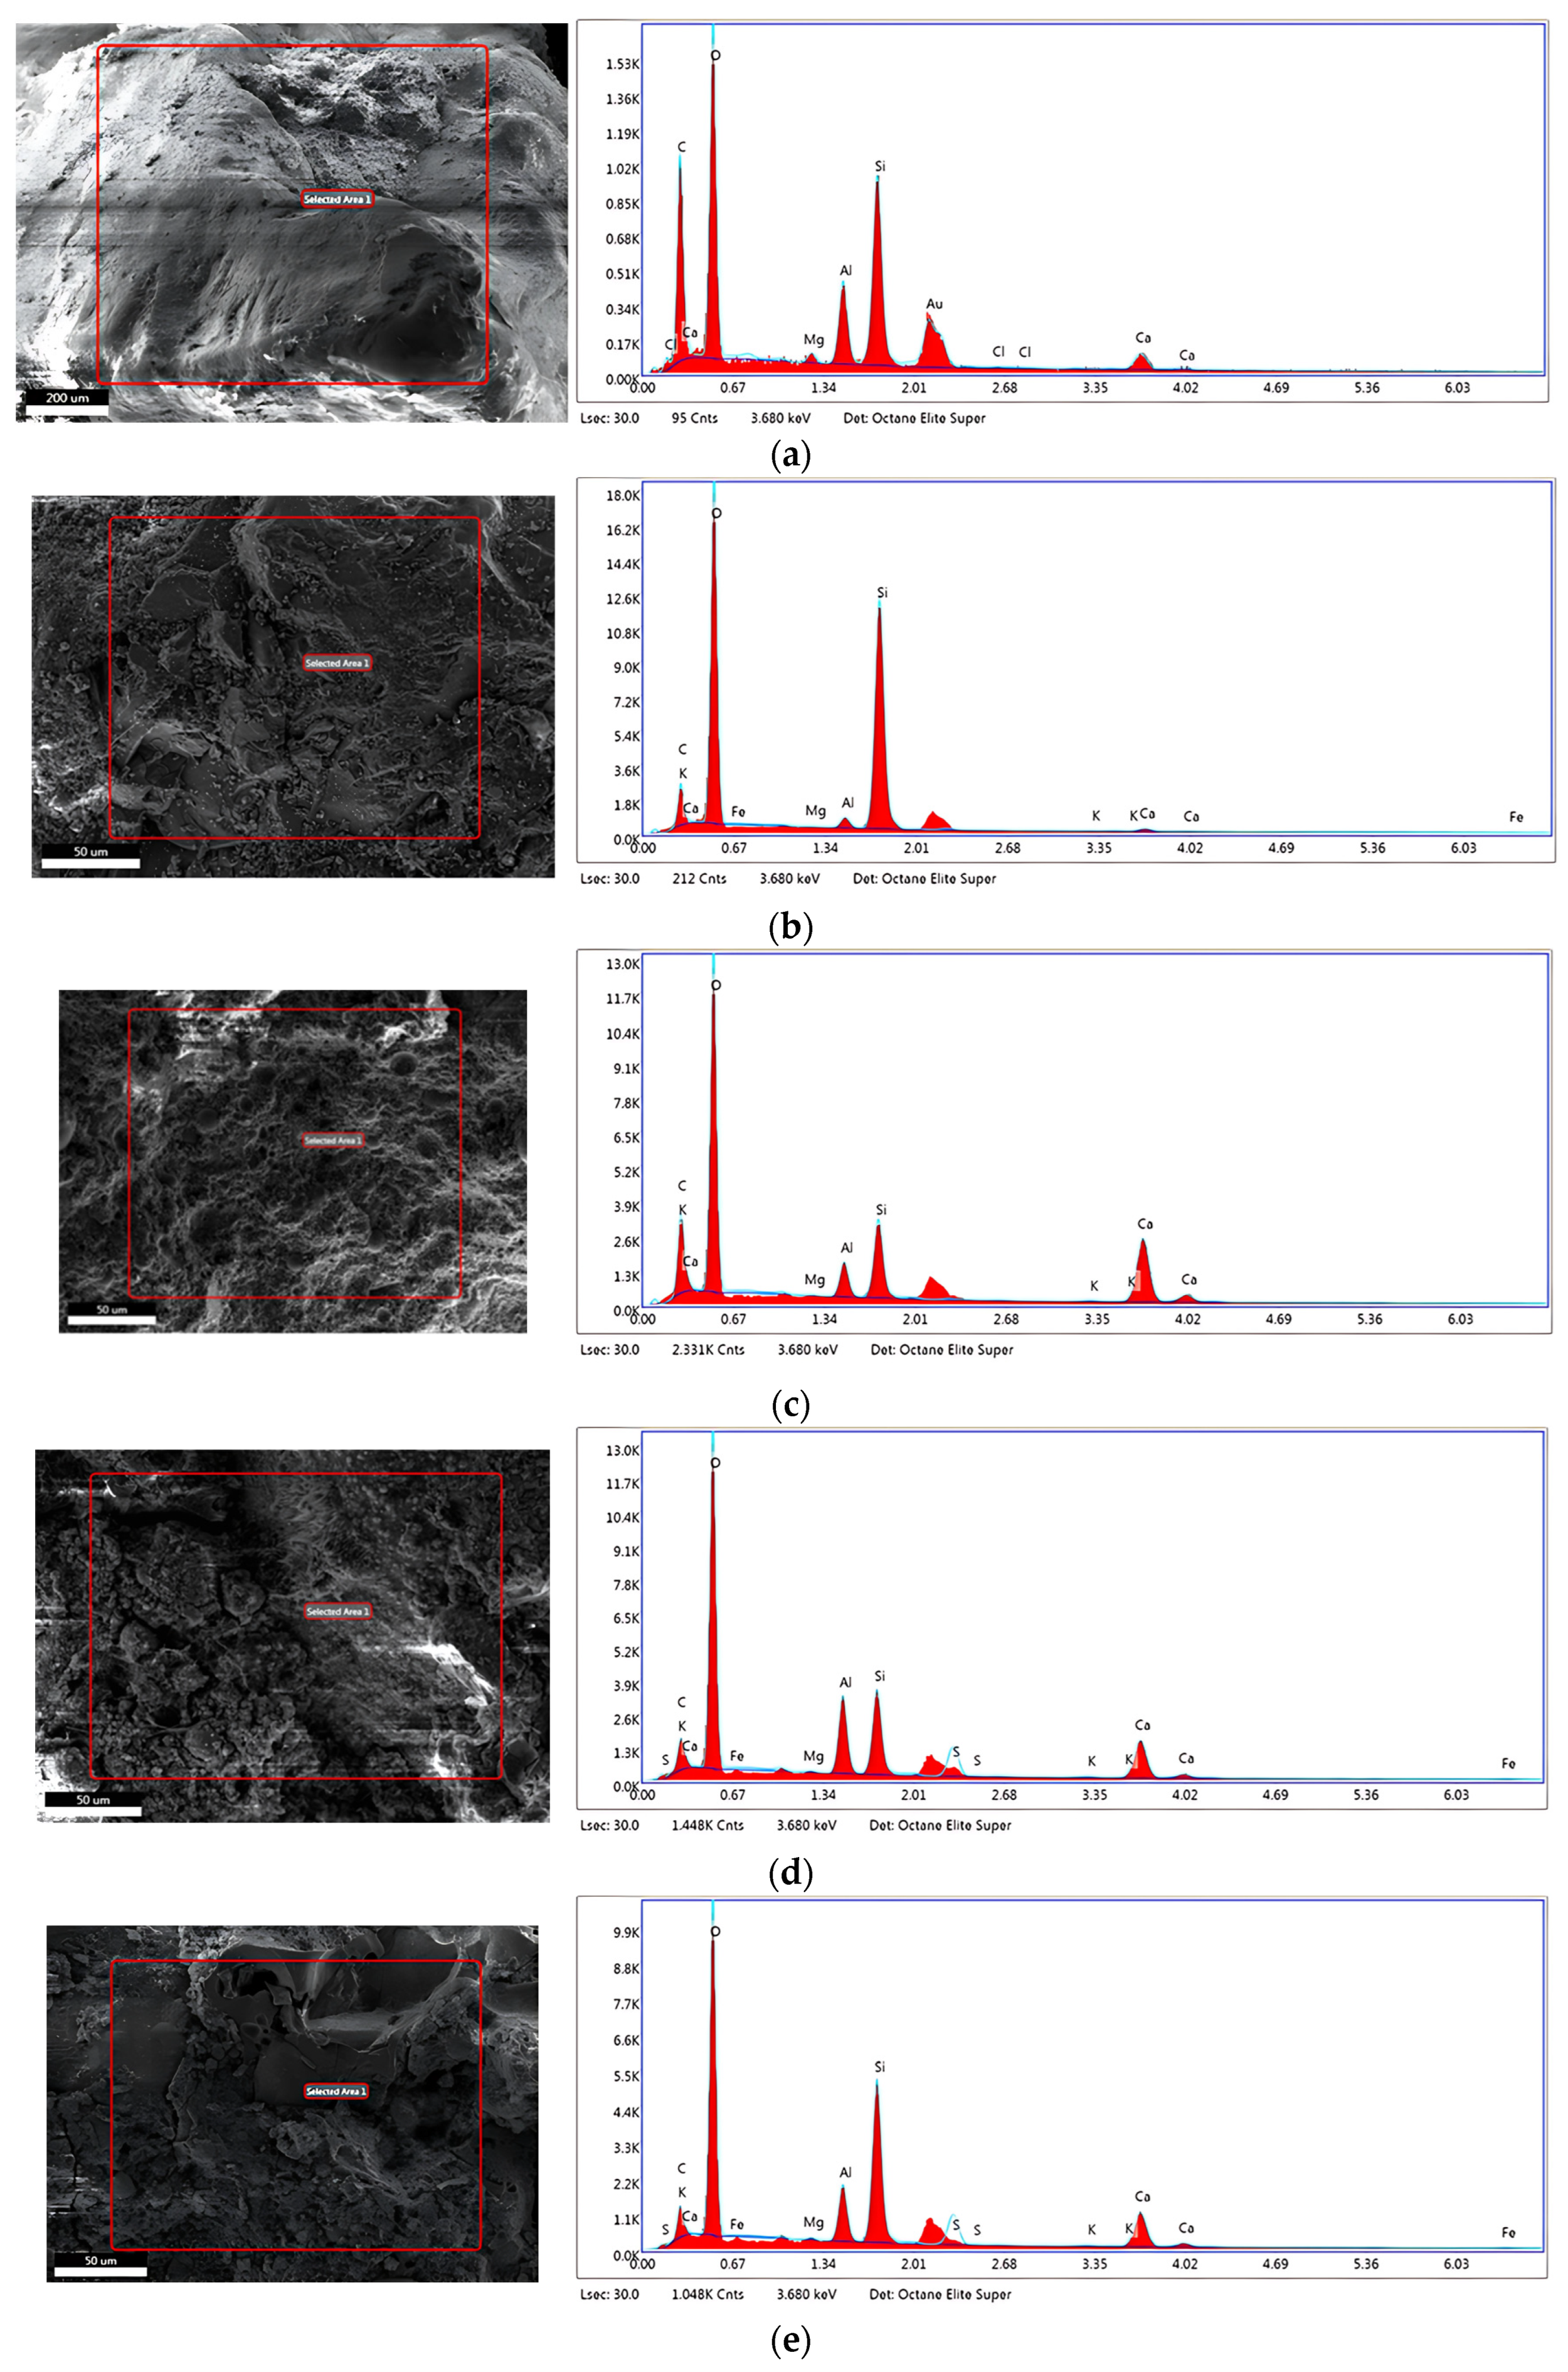
Figure 20 illustrates the EDS spectra of the mortar mixes CM, CBA25, CBA50, CBA75 and CBA100 captured at 28 days of curing. The analysis confirms the presence of silicates, aluminates, and oxides of magnesium and calcium as the primary constituents of the mortar mixes. Table 6 summarises the chief oxides identified through EDS, presented based on their atomic weights. The Ca/Si ratio shows variable results; however, there is a general trend indicating that an increased Ca/Si ratio correlates with reduced CS of the mortar. This trend aligns with the observed reductions in strength as the proportion of CBA increases in the mix. Notably, the EDS data reveal a significant drop in strength at the CBA50 mix. According to the EDS results presented in Table 6, the CM demonstrates the highest strength, while the CBA50 mix exhibits the lowest. A corresponding pattern in the Al/Si ratio further supports the conclusion that increasing CBA content negatively impacts the structural integrity of the mortar mixes.

4. Conclusions

This experimental investigation systematically examined the impact of substituting CBA for NFA in mortar, with replacement levels ranging from 25% to 100%. Based on the results obtained from tests on fresh and hardened states, strength correlations, and microstructural analysis, the following key conclusions were drawn:
  • Flow table results indicated improved workability with increasing CBA content, which can be attributed to CBA’s porous microstructure, which enhances water demand and flowability. Bleeding remained negligible at lower CBA levels (0–25%) but increased significantly at higher replacements, especially in CBA75 and CBA100 mixes, indicating reduced water retention.
  • Dry density progressively decreased with increasing CBA content, with a reduction of up to 19.27% observed at full replacement. Mortars exhibited weight gain over time due to continued hydration, but this trend reversed after 14 days in HVCBA mixes, reflecting reduced long-term densification.
  • UPV values showed a decline with increasing CBA content, while demonstrating a rise with extended curing age. Based on IS 516 (Part 5): 2018 classifications, only the CM and CBA25 mortars maintained medium quality (Type III), while others were classified as poor quality (Type IV) due to high porosity and weak matrix.
  • Strength increased with curing but decreased with higher CBA replacement. At 28 days, the CS dropped by up to 72.96% in the CBA100 mix. Despite these reductions, all mixes exceeded the minimum CS required by IS 2250:1981, thereby validating the high-strength categorisation at all replacement levels.
  • A strong exponential correlation (R2 > 0.93) was established between UPV and CS across all curing ages. An inverse relationship was observed between flowability and strength, particularly pronounced in the higher CBA mixes due to increased porosity and weaker particle bonding.
  • SEM images revealed extensive formation of hydration products such as C–S–H, ettringite, and portlandite, with improved matrix development in low-CBA mortars. EDS analysis indicated that higher Ca/Si and Al/Si ratios, particularly at 50% CBA replacement, correlated with significant strength reduction, confirming the adverse effect of excessive CBA on microstructural integrity.
  • The use of HVCBA in mortar promotes sustainability and contributes to achieving high-strength properties. However, further optimisation of the mix is necessary to ensure suitability for high-strength applications.

Author Contributions

Conceptualization, H.K.S. and L.P.K.; methodology, H.K.S., L.P.K. and D.S.; formal analysis, S.K., V.V., K.C. and D.S.; investigation, S.K., V.V., K.C. and D.S.; resources, H.K.S. and L.P.K.; data curation, S.K., V.V., K.C. and D.S.; writing—S.K. and D.S.; writing—review and editing H.K.S. and L.P.K.; visualization, H.K.S. and L.P.K.; supervision, H.K.S. and L.P.K.; project administration, H.K.S. and L.P.K. All authors have read and agreed to the published version of the manuscript.

Funding

This research received no external funding.

Data Availability Statement

The original contributions presented in this study are included in the article. Further inquiries can be directed to the corresponding authors.

Conflicts of Interest

The authors declare no conflict of interest.

References

  1. Golewski, G.L. The Effect of the Addition of Coal Fly Ash (CFA) on the Control of Water Movement within the Structure of the Concrete. Materials 2023, 16, 5218. [Google Scholar] [CrossRef]
  2. Singh, G.; Ram, S. Microstructural and other properties of copper slag–coal bottom ash incorporated concrete using fly ash as cement replacement. Innov. Infrastruct. Solut. 2023, 8, 78. [Google Scholar] [CrossRef]
  3. Ali, T.; Buller, A.S.; Abro, F.U.R.; Ahmed, Z.; Shabbir, S.; Lashari, A.R.; Hussain, G. Investigation on Mechanical and Durability Properties of Concrete Mixed with Silica Fume as Cementitious Material and Coal Bottom Ash as Fine Aggregate Replacement Material. Buildings 2022, 12, 44. [Google Scholar] [CrossRef]
  4. Central Electricity Authority Annual Report (2022–23), CEA Annual Report, Central Electricity Authority Ministry of Power Government of India. 2023, pp. 1–292. Available online: https://cea.nic.in/annual-report/?lang=en (accessed on 24 February 2024).
  5. Goudar, S.K.; Shivaprasad, K.N.; Das, B.B. Mechanical properties of fiber-reinforced concrete using coal-bottom ash as replacement of fine aggregate. In Lecture Notes in Civil Engineering; Springer: Berlin/Heidelberg, Germany, 2019; Volume 25, pp. 863–872. [Google Scholar] [CrossRef]
  6. Mohammed, S.A.; Koting, S.; Katman, H.Y.B.; Babalghaith, A.M.; Patah, M.F.A.; Ibrahim, M.R.; Karim, M.R. A review of the utilization of coal bottom ash (CBA) in the construction industry. Sustainability 2021, 13, 8031. [Google Scholar] [CrossRef]
  7. Tamanna, K.; Raman, S.N.; Jamil, M.; Hamid, R. Coal bottom ash as supplementary material for sustainable construction: A comprehensive review. Constr. Build. Mater. 2023, 389, 131679. [Google Scholar] [CrossRef]
  8. Sutcu, M.; Erdogmus, E.; Gencel, O.; Gholampour, A.; Atan, E.; Ozbakkaloglu, T. Recycling of bottom ash and fly ash wastes in eco-friendly clay brick production. J. Clean. Prod. 2019, 233, 753–764. [Google Scholar] [CrossRef]
  9. Putilova, I.V. Current state of the coal ash handling problem in Russia and abroad, aspects of the coal ash applications in hydrogen economy. Int. J. Hydrog. Energy 2023, 48, 31040–31048. [Google Scholar] [CrossRef]
  10. Savadogo, N.; Messan, A.; Hannawi, K.; Agbodjan, W.P.; Tsobnang, F. Durability of mortar containing coal bottom ash as a partial cementitious resource. Sustainability 2020, 12, 8089. [Google Scholar] [CrossRef]
  11. Zhou, H.; Bhattarai, R.; Li, Y.; Si, B.; Dong, X.; Wang, T.; Yao, Z. Towards sustainable coal industry: Turning coal bottom ash into wealth. Sci. Total Environ. 2022, 804, 149985. [Google Scholar] [CrossRef]
  12. Gooi, S.; Mousa, A.A.; Kong, D. A critical review and gap analysis on the use of coal bottom ash as a substitute constituent in concrete. J. Clean. Prod. 2020, 268, 121752. [Google Scholar] [CrossRef]
  13. Kim, H.-K. Utilization of sieved and ground coal bottom ash powders as a coarse binder in high-strength mortar to improve workability. Constr. Build. Mater. 2015, 91, 57–64. [Google Scholar] [CrossRef]
  14. Singh, N.; Mithulraj, M.; Arya, S. Influence of coal bottom ash as fine aggregates replacement on various properties of concretes: A review. Resour. Conserv. Recycl. 2018, 138, 257–271. [Google Scholar] [CrossRef]
  15. Aydin, E. Novel coal bottom ash waste composites for sustainable construction. Constr. Build. Mater. 2016, 124, 582–588. [Google Scholar] [CrossRef]
  16. Debasree; Amrin, A.; Biswal, D.R.; Sahoo, K.K.; Dhir, P.K. Utilization of Bottom Ash and Pond Ash as a Partial Replacement for Sand in Cement Mortar and Concrete: A Critical Review. Pract. Period. Struct. Des. Constr. 2023, 28, 03123004. [Google Scholar] [CrossRef]
  17. Kim, H.; Lee, H. Use of power plant bottom ash as fine and coarse aggregates in high-strength concrete. Constr. Build. Mater. 2011, 25, 1115–1122. [Google Scholar] [CrossRef]
  18. Shenoy, D.; Sugandhini, H.K.; Kudva, P.L. Towards a New Approach in Designing High-Strength Concrete: Challenges in Replacing Three-Fourth of Natural Fine Aggregate with Coal Bottom Ash. Civ. Eng. Archit. 2025, 13, 522–542. [Google Scholar] [CrossRef]
  19. Singh, M.; Siddique, R. Effect of coal bottom ash as partial replacement of sand on properties of concrete. Resour. Conserv. Recycl. 2013, 72, 20–32. [Google Scholar] [CrossRef]
  20. Yang, I.-H.; Park, J.; Le, N.D.; Jung, S.; Stevulova, N. Strength Properties of High-Strength Concrete Containing Coal Bottom Ash as a Replacement of Aggregates. Adv. Mater. Sci. Eng. 2020, 2020, 4246396. [Google Scholar] [CrossRef]
  21. IS 3812 (Part 1); Pulverized Fuel Ash—Specification; Part 1: For Use as Pozzolana in Cement, Cement Mortar and Concrete. Bureau of Indian Standards: New Delhi, India, 2013; pp. 1–18.
  22. IS 15388; Silica Fume—Specification. Bureau of Indian Standards: New Delhi, India, 2003; pp. 1–13.
  23. IS 4031 (Part 1); Method of Physical Tests for Hydraulic Cement, Part 1: Determination of Fineness by Dry Sieving; Reaffirmed 2016. Bureau of Indian Standards: New Delhi, India, 1996; pp. 1–7.
  24. IS 4031 (Part 4); Methods of Physical Tests for Hydraulic Cement, Part 4: Determination of Consistency of Standard Cement Paste. Reaffirmed 2019. Bureau of Indian Standards: New Delhi, India, 1988; pp. 1–4.
  25. IS 4031 (Part 2); Methods of Physical Tests for Hydraulic Cement, Part 2: Determination of Fineness by Blaine Air Permeability Method. Reaffirmed 2004. Bureau of Indian Standards: New Delhi, India, 1999; pp. 1–13.
  26. IS 4031 (Part 11); Methods of Physical Tests for Hydraulic Cement, Part 11: Determination of Density. Bureau of Indian Standards: New Delhi, India, 1988; pp. 1–6.
  27. IS 4031 (Part 5); Methods of Physical Tests for Hydraulic Cement, Part 5: Determination of Initial and Final Setting Times. Bureau of Indian Standards: New Delhi, India, 1988; pp. 1–5.
  28. IS 4031 (Part 3); Methods of Physical Tests for Hydraulic Cement, Part 3: Determination of Soundness. Bureau of Indian Standards: New Delhi, India, 1988.
  29. IS 4031 (Part 6); Methods of Physical Tests for Hydraulic Cement, Part 6: Determination of Initial and Final Setting Times; Reaffirmed 2019. Bureau of Indian Standards: New Delhi, India, 1988; pp. 1–9.
  30. IS 1727; Methods of Test for Pozzolanic Materials. Bureau of Indian Standards: New Delhi, India, 1967; pp. 1–55.
  31. IS 2386 (Part 3); Methods of Test for Aggregates for Concrete, Part 3: Specific Gravity, Density, Voids, Absorption and Bulking; Reaffirmed 2016. Bureau of Indian Standards: New Delhi, India, 1963; pp. 1–22.
  32. IS 2386 (Part 1); Methods of Test for Aggregates for Concrete, Part 1: Particle Size and Shape; Reaffirmed 2016. Bureau of Indian Standards: New Delhi, India, 1963; pp. 1–23.
  33. IS 383; Coarse and Fine Aggregate for Concrete. Bureau of Indian Standards: New Delhi, India, 2016; pp. 1–24.
  34. IS 2250; Code of Practice for Preparation and Use of Masonry Mortars. Bureau of Indian Standards: New Delhi, India, 1981.
  35. ASTM C232-07; Standard Test Methods for Bleeding of Concrete. ASTM International: West Conshohocken, PA, USA, 2007. Available online: www.astm.org (accessed on 24 February 2024).
  36. IS 516; Methods of Tests for Strength of Concrete. Bureau of Indian Standards: New Delhi, India, 1959; pp. 1–25.
  37. IS 516 (Part 5)-; Hardened Concrete —Methods of Test Part 5 Non-destructive Testing of Concrete. Bureau of Indian Standards: New Delhi, India, 2018. Available online: www.standardsbis.in (accessed on 24 February 2024).
  38. Srivastava, A.; Singh, S.K.; Sharma, C.S. Correlation Between Ultrasonic Pulse Velocity (UPV) and Compressive Strength of Coal Bottom Ash Mortar. J. Inst. Eng. 2021, 102, 421–433. [Google Scholar] [CrossRef]
  39. Ankur, N.; Singh, N. Performance of cement mortars and concretes containing coal bottom ash: A comprehensive review. Renew. Sustain. Energy Rev. 2021, 149, 111361. [Google Scholar] [CrossRef]
  40. Singh, M. Coal bottom ash. In Waste and Supplementary Cementitious Materials in Concrete: Characterisation, Properties and Applications; Elsevier: Amsterdam, The Netherlands, 2018; pp. 3–50. [Google Scholar] [CrossRef]
  41. Huynh, T.-P.; Ngo, S.-H. Waste incineration bottom ash as a fine aggregate in mortar: An assessment of engineering properties, durability, and microstructure. J. Build. Eng. 2022, 52, 104446. [Google Scholar] [CrossRef]
  42. Kumar, P.K. Workability Strength and Elastic Properties of Cement Mortar with Pond Ash as Fine Aggregates. 2020. Available online: https://www.sciencedirect.com/science/article/pii/S2214785320331060 (accessed on 24 February 2024).
  43. Hashemi, S.S.G.; Bin Mahmud, H.; Djobo, J.N.Y.; Tan, C.G.; Ang, B.C.; Ranjbar, N. Microstructural characterization and mechanical properties of bottom ash mortar. J. Clean. Prod. 2018, 170, 797–804. [Google Scholar] [CrossRef]
  44. Singh, M.; Siddique, R. Properties of concrete containing high volumes of coal bottom ash as fine aggregate. J. Clean. Prod. 2015, 91, 269–278. [Google Scholar] [CrossRef]
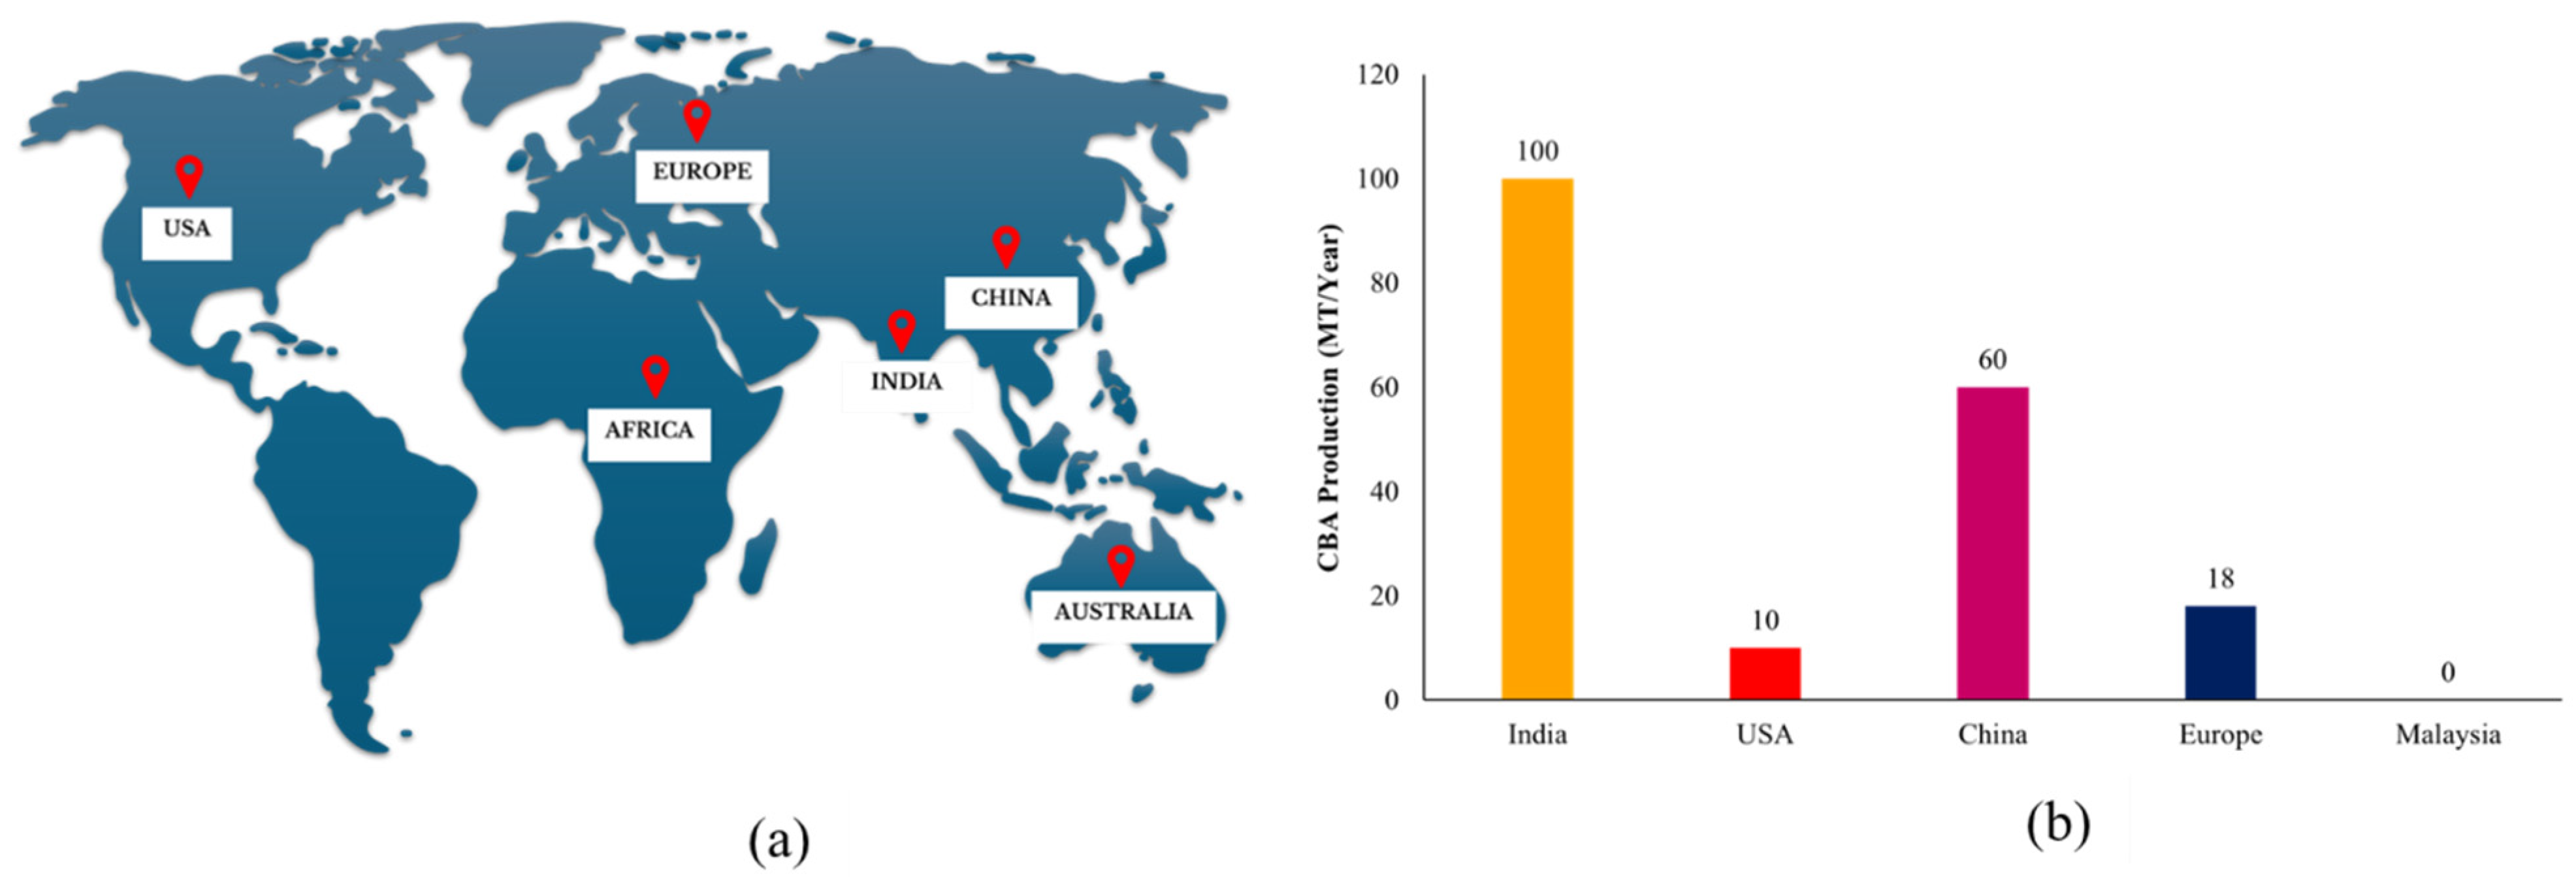
Figure 1. (a) Major contributors of Coal Ash Production in the world; (b) Annual CBA production in various countries in 2022 [6,7,8,9].
Constrmater 05 00076 g001
Figure 2. Current applications of CBA [15,16].
Constrmater 05 00076 g002
Figure 3. Bibliometric analysis of subject-related publications retrieved from the Scopus database (Note: The figure depicts the publication trend over a decade for research articles identified using the keywords ‘Coal Bottom Ash’ and ‘High-strength Mortar’).
Constrmater 05 00076 g003
Figure 4. PSD of filler materials.
Constrmater 05 00076 g004
Figure 5. Methodology of this study.
Constrmater 05 00076 g005
Figure 6. Mortar samples were cast for various tests.
Constrmater 05 00076 g006
Figure 7. Schematic Diagram of Mortar Mixing Process.
Constrmater 05 00076 g007
Figure 8. Spread of flow table test for (a) CM, (b) CBA25, (c) CBA50, (d) CBA75 and (e) CBA100.
Constrmater 05 00076 g008
Figure 9. Trend of flow diameters of various mortar mixes.
Constrmater 05 00076 g009
Figure 10. Trend of bleed water quantity of various mortar mixes.
Constrmater 05 00076 g010
Figure 11. 28-day dry densities of various mortar mixes.
Constrmater 05 00076 g011
Figure 12. Trends in the weight of various mortar samples at different curing ages.
Constrmater 05 00076 g012
Figure 13. Trend of UPV values for various mortar mixes.
Constrmater 05 00076 g013
Figure 14. CS development of CM and CBA mortars at 7, 14, and 28 days of curing.
Constrmater 05 00076 g014
Figure 15. Failure patterns of (a) CM, (b) CBA25, (c) CBA50, (d) CBA75 and (e) CBA100 tested under compressive load.
Constrmater 05 00076 g015
Figure 16. Trend of water absorption for various mortar mixes.
Constrmater 05 00076 g016
Figure 17. Correlation between the UPV and CS of mortar mixes at different curing ages.
Constrmater 05 00076 g017
Figure 18. Trend of CS with the flow table values of mortar mixes.
Constrmater 05 00076 g018
Figure 19. SEM images of (a,b) CM, (c) CBA25, (d) CBA50, (e) CBA75 and (f) CBA100 tested at 28 days.
Constrmater 05 00076 g019
Figure 20. EDS spectrum images of (a) CM, (b) CBA25, (c) CBA50, (d) CBA75 and (e) CBA100 tested at 28 days.
Constrmater 05 00076 g020
Table 4. Mix proportions of the mortar mix (ingredients measured in gm).
Mix DesignationCBA Replacement%w/bOPCFAMicrosilicaNFA (SSD)CBA (SSD)WaterPCE
CM00.298109009018000523.87.2
CBA25250.29810900901350450264.67.2
CBA50500.2981090090900900354.67.2
CBA75750.29810900904501350444.67.2
CBA1001000.298109009001800534.67.2
Where SSD—Saturated Surface Dry condition.
Table 5. UPV and CS correlation for mortar mixes.
Curing Age (Days)Regression Coefficient (fc = A·eB·V)Correlation Coefficient, R2
AB
70.0440.0020.9757
140.010.00260.9454
280.00050.00360.9305
Table 6. Chief oxides identified in various mortar mixes through EDS analysis at 28 days.
MixSiAlCaMgCa/SiCa/AlAl/Si
CM18.647.644.880.830.260.640.41
CBA2534.541.411.480.050.041.050.04
CBA509.383.9924.980.102.666.260.43
CBA7511.239.8216.250.221.451.650.87
CBA10020.086.5713.800.250.692.100.33
Disclaimer/Publisher’s Note: The statements, opinions and data contained in all publications are solely those of the individual author(s) and contributor(s) and not of MDPI and/or the editor(s). MDPI and/or the editor(s) disclaim responsibility for any injury to people or property resulting from any ideas, methods, instructions or products referred to in the content.