Article

Probabilistic Evaluation of Flexural Demand in RC Beams Through Monte Carlo Simulation

1
Escuela Profesional de Ingeniería Civil, Universidad Nacional Mayor de San Marcos, Lima 15081, Peru
2
Facultad de Ingenieria Civil, Universidad Nacional Federico Villarreal, Lima 15088, Peru
*
Author to whom correspondence should be addressed.
Constr. Mater. 2025, 5(4), 72; https://doi.org/10.3390/constrmater5040072
Submission received: 27 July 2025 / Revised: 15 September 2025 / Accepted: 18 September 2025 / Published: 29 September 2025
(This article belongs to the Special Issue Pathology and Performance of Constructions)

Abstract

This study presents a stochastic approach to assess bending moment demand in reinforced concrete beams subjected to vertical loads, incorporating uncertainties in material properties, geometry, and loading conditions. A Monte Carlo simulation framework was developed in Python version 3.9.3 using the OpenSeesPy library to analyze the variability of internal forces based on probabilistic input parameters. The analysis focuses on a four-span continuous beam representative of typical structural configurations in buildings. Probability distributions were assigned to key structural design parameters such as the unit weight of concrete ( ρ ), beam dimensions (b, h), column dimension (a), and applied loads, based on standard statistical assumptions and design guidelines. A total of 10,000 simulations were performed to obtain statistical descriptors of bending moment demand across the different spans. The results reveal significant variability in moment magnitudes, underscoring the importance of accounting for uncertainty in structural design. The proposed methodology enables the estimation of demand distributions and the identification of critical spans with higher sensitivity to parameter variations. Although the study does not evaluate structural capacity or failure probability, it contributes to the integration of stochastic techniques in the preliminary stages of design. Future work may include the incorporation of reliability 16 indices and comparisons with design code values.

1. Introduction

The design of reinforced concrete structural elements is typically based on deterministic methods that rely on characteristic values of material properties and applied loads. However, semi-probabilistic approaches currently adopted in design codes may lead to an incomplete assessment of structural demand. This occurs when statistical models are simplified or when phenomena such as cumulative degradation and extreme actions are considered separately, without accounting for their interaction. Such omissions may compromise design reliability, particularly for existing structures or those subjected to changing conditions. In contrast, probabilistic approaches allow for a more realistic representation of the inherent uncertainties in structural behavior, providing a more consistent basis for engineering decision-making [1]. For instance, Ribeiro et al. [2] demonstrated through nonlinear finite element analysis and comparison with experimental data that, in continuous reinforced concrete beams subjected to column-loss scenarios, deterministic models based on ACI 318-19 [3] significantly underestimate flexural and shear demands at beam ends, potentially triggering premature failures by flexure–shear interaction or reinforcement rupture. According to Jahani et al. [4], Monte Carlo simulation is a widely used technique for evaluating failure probability, as it enables the treatment of complex limit state functions without requiring mathematical simplifications. Although this method requires a large number of simulations to obtain accurate results for low-probability events, its capability to capture the overall structural behavior makes it a fundamental tool in modern structural engineering. In the work of Scherer et al. [5], a structural reliability analysis of reinforced concrete beams designed according to the Brazilian code NBR 6118:2014 [6] was presented. Using the First-Order Reliability Method (FORM) combined with finite element analysis, the authors evaluated the influence of inherent variables and demonstrated that the reliability index decreases significantly when live loads govern the load combination, due to their higher statistical uncertainty compared to dead loads. Similarly, Ramezanianpour et al. [7] argue that purely deterministic approaches “are not capable of adequately assessing the service life of corroded concrete structures,” emphasizing the need to incorporate probabilistic methods. In this context, Ahsana [8] developed a stochastic framework for flexural resistance considering the progressive reduction in reinforcement cross-section due to corrosion, within Monte Carlo simulations. By incorporating random variables such as chloride concentration, diffusion coefficient, and corrosion rate, the study demonstrated the possibility of generating fragility curves to evaluate deterioration over time. Moreover, Zhou [9] highlighted that structural reliability depends not only on the natural variability of parameters but also on epistemic uncertainties inherent to modeling assumptions, reinforcing the need for probabilistic approaches in design and assessment. The ultimate flexural strength of reinforced concrete beams is influenced by factors such as the concrete compressive strength and loading conditions, all of which involve quantifiable degrees of uncertainty. Recent studies have demonstrated that Monte Carlo simulation is an effective tool to model such uncertainties and evaluate structural reliability. For instance, Li et al. [10] developed a probabilistic model for the shear strength of deep beams, based on a database of 645 experimental tests, confirming the potential of this approach for ultimate strength analysis. Similarly, Nunes et al. [11] used probabilistic methods—specifically FORM and Monte Carlo simulation—along with random variable characterization to estimate the failure probability of reinforced concrete beams and crack widths, incorporating the effects of shrinkage and creep in accordance with NBR 6118:2023. In the same vein, Félix et al. [12] applied Monte Carlo simulation to estimate the probability of steel depassivation in structures exposed to carbonation or chlorides, showing that variables such as concrete strength and cover significantly influence structural durability. Likewise, Kim et al. [13] developed a probabilistic model to evaluate the flexural strength of reinforced concrete elements used in underground box culverts, accounting for uncertainties in material properties, geometric dimensions, and construction errors. Based on flexural experimental testing and Monte Carlo simulations, they statistically characterized the load-bearing capacity of these structural elements. Additionally, Blagojevic’ et al. [14] analyzed how variability in the properties of steel fiber reinforced concrete (SFRC) affects the flexural behavior of beams. Through numerical simulations and sensitivity analysis using Sobol indices, they identified that residual tensile strength is the principal source of uncertainty. Several studies have also explored the application of probabilistic methods to the flexural behavior of reinforced concrete elements. Zhang [15] reported differences of over 6% between deterministic and probabilistic estimates in beams reinforced with high-strength steel. Szép [16] compared the behavior of reinforced concrete beams exposed to elevated temperatures and demonstrated that probabilistic modeling provided better agreement with experimental results, particularly in terms of nonlinear response. Nevertheless, to date, few studies have focused exclusively on reinforced concrete beams under flexure, integrating a probabilistic approach with direct application to urban buildings in Lima, where factors such as material variability and environmental conditions can influence structural response. This research aims to fill that gap by proposing a probabilistic model to estimate the acting bending moment in typical reinforced concrete beams, considering variability in materials, geometry, and loads. As shown in Figure 1, this study addresses the limitations of calculating bending moments using deterministic methods, which do not reflect the inherent variability of structural parameters. To this end, results obtained through deterministic calculations will be compared with those from a probabilistic approach based on Monte Carlo simulations. This methodology allows for the inclusion of uncertainties arising from the construction process itself and from poor practices—often linked to informality—as well as variations in loading due to changes in use throughout the service life of the structure. This leads to a more realistic assessment of structural performance, avoiding both the oversizing of some elements and the underdesign of others. Such conditions directly impact structural efficiency and resource optimization.

2. Methods

A probabilistic evaluation of the ultimate bending moment in reinforced concrete beams is carried out. For this purpose, a model was developed to incorporate the uncertainty of variables that influence flexural design in beams, including concrete properties, geometric dimensions and applied loads. Through Monte Carlo simulation, the probabilistic distribution of maximum positive and negative bending moments acting on the beam can be obtained. The procedure incorporates construction practices commonly used in buildings in Lima, aiming for a more realistic assessment of the structural performance of beams.

2.1. Definition of the Structural Model

The structural system considered corresponds to reinforced concrete frames, commonly used in mid-rise residential and commercial buildings in Peru. A total of ten frames were analyzed, each consisting of one primary and one secondary beam, with variations in geometry to evaluate their influence on flexural behavior. Table 1 summarizes the dimensions, including story height, column and beam sections, and clear spans. Although these ten cases are not the result of a statistical sampling, they were selected to cover ranges and configurations representative of common practice in local design, providing a practical basis for the probabilistic evaluation. It should be noted that, although the span ratios in some cases fall within the range typically associated with bidirectional slab action (0.5 ≤ lx/ly ≤ 2.0), the present study adopts a one-way slab simplification. In this approach, the load is assumed to act mainly along the shorter direction, transferring the majority of the load to the primary beams. This modeling choice was made to maintain consistency across the ten frame configurations and to focus the analysis on the variability of flexural demands in beams, avoiding additional complexity related to bidirectional load distribution. While these ten cases provide a practical and representative basis for the probabilistic evaluation, it is acknowledged that they do not capture the full diversity of reinforced concrete frame configurations in practice. Therefore, the conclusions should be interpreted within this scope.
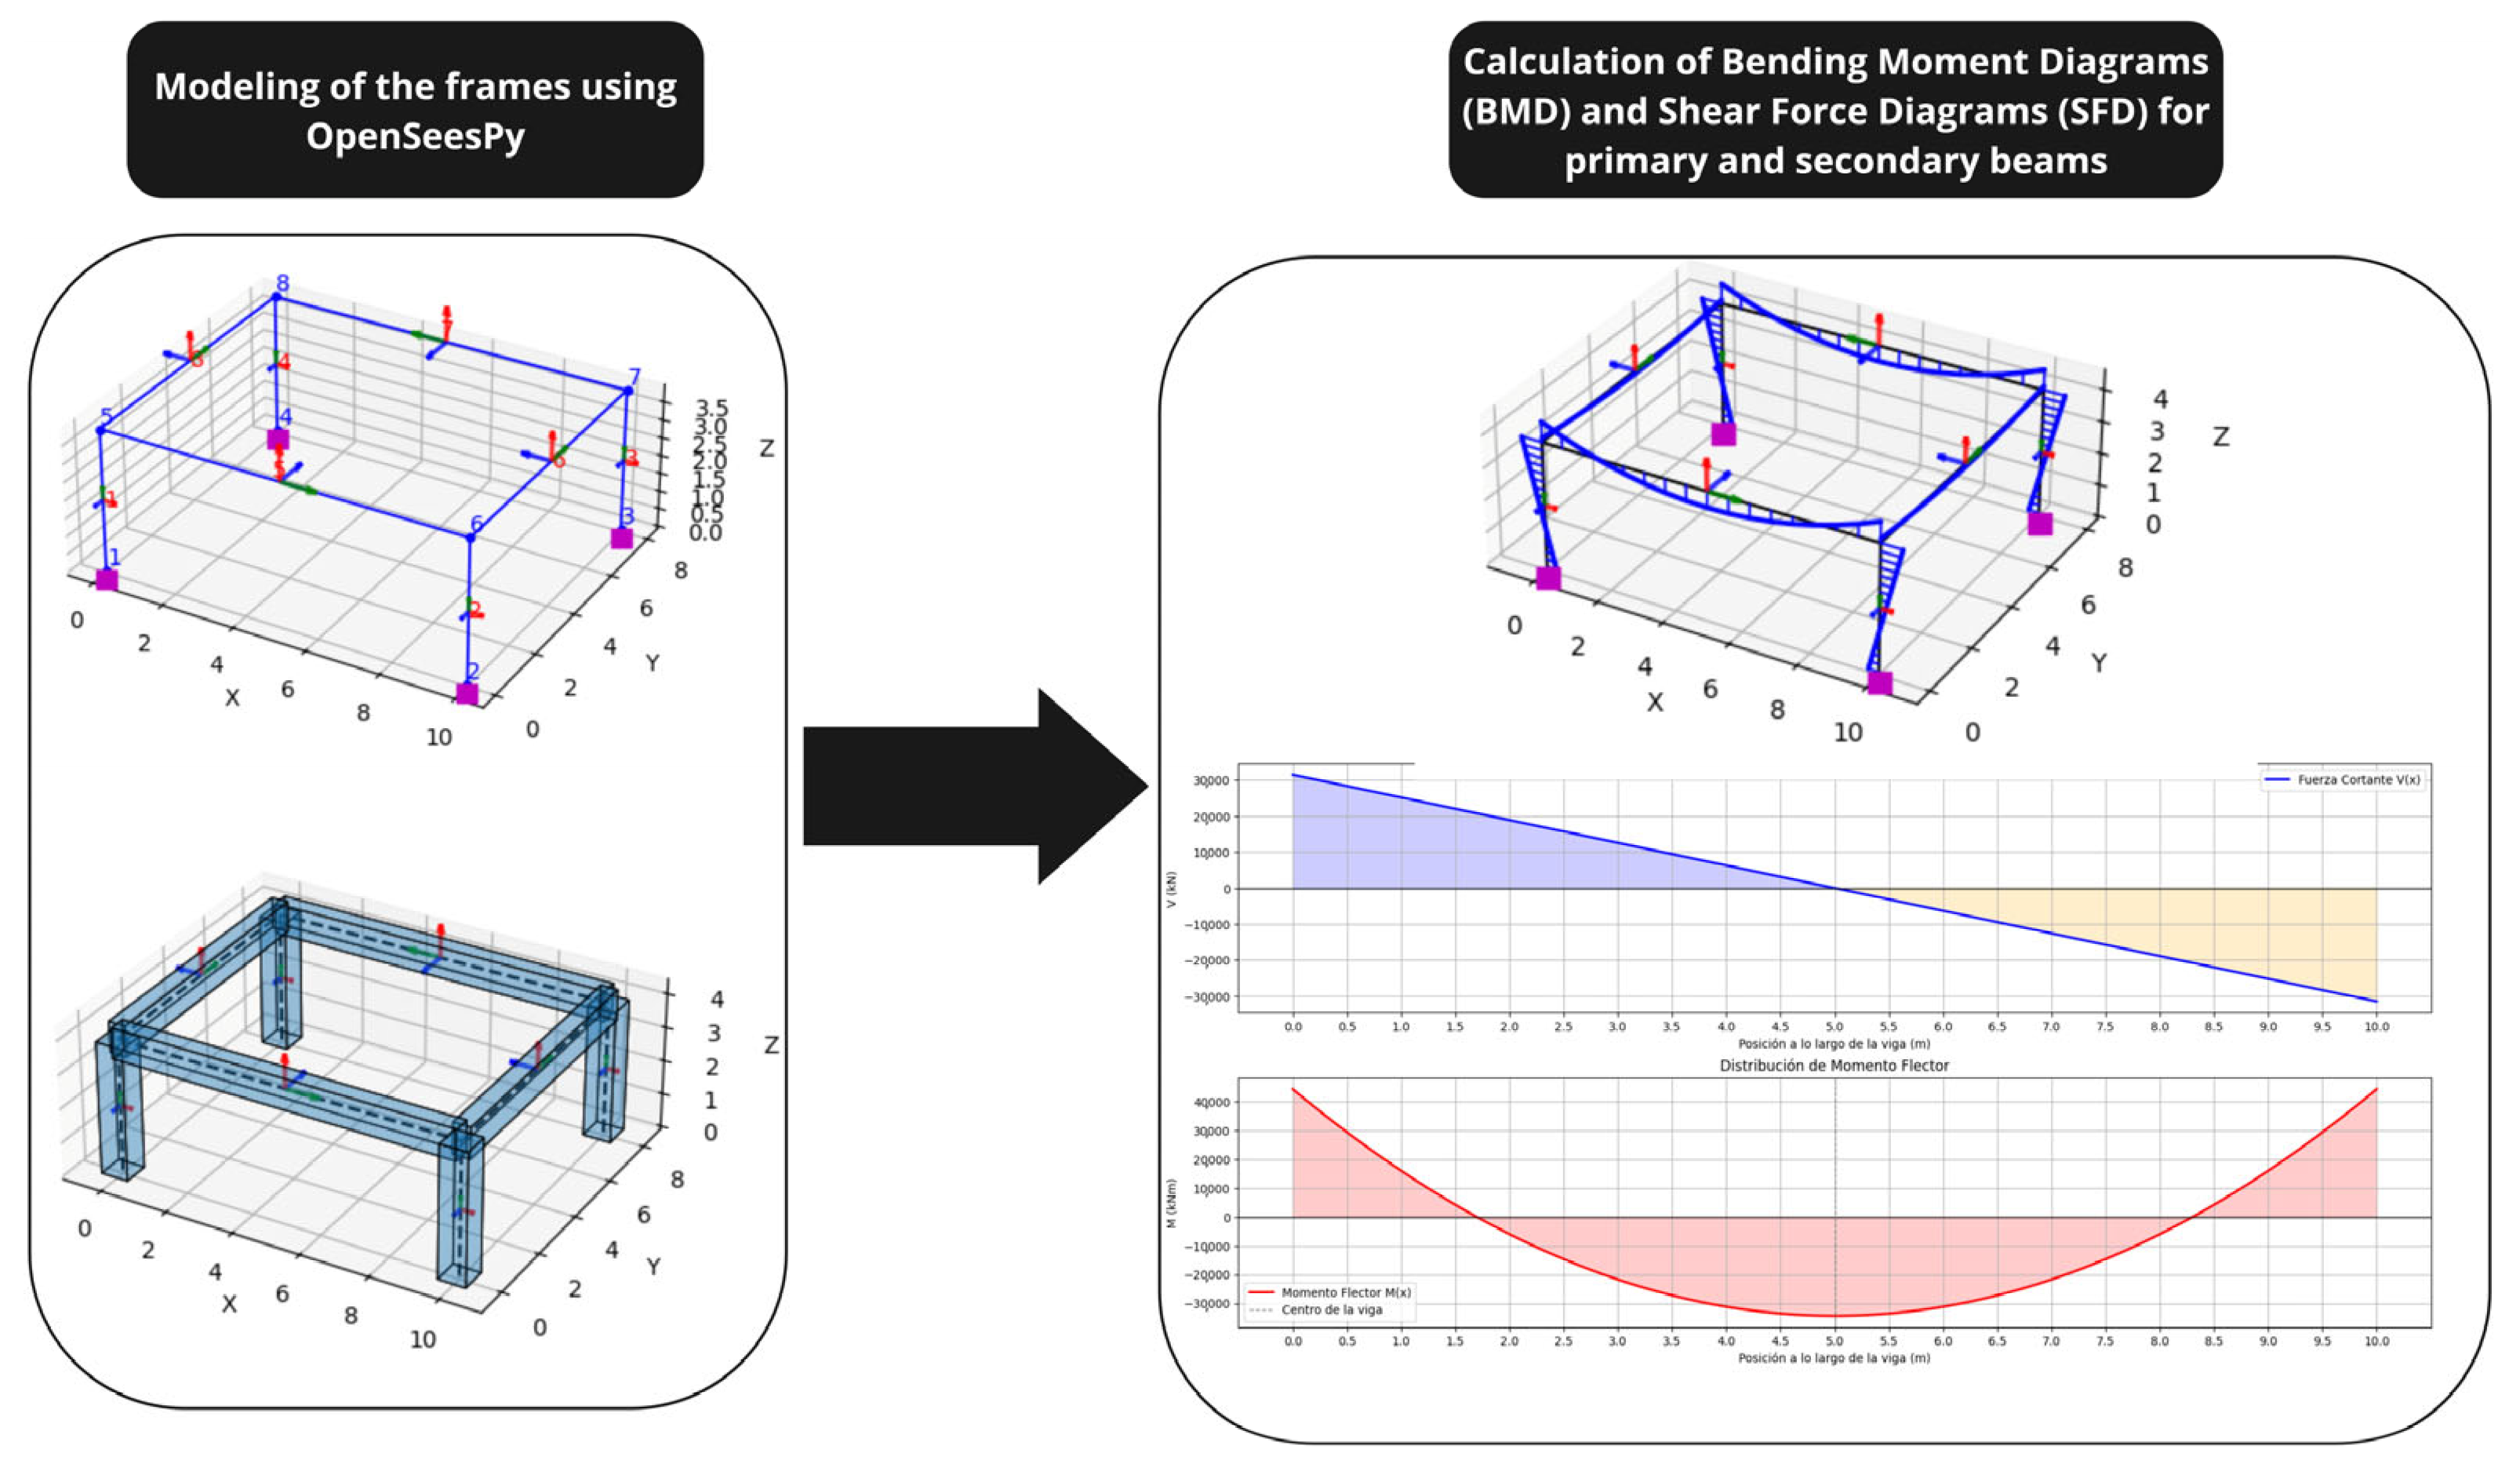
As shown in Figure 2, the structural model of the frames was developed using the OpenSeesPy library. Subsequently, the values of bending moments and diagrams were obtained. The modeling also considered:
  • Real projects executed in Lima.
  • Current Peruvian codes (E.060: Reinforced Concrete; E.020: Loads).
  • Best practices in regional structural design.

2.2. Identification of Random Variables

The probability distributions assigned to random variables must reflect both theoretical foundations and practical considerations to ensure reliable modeling. In the case of structural loads, this study adopts normal distributions, consistent with classical reliability approaches that characterize variability through mean and standard deviation. Kolo [17], in his study on the structural reliability of reinforced concrete beams using FORM, assumed normal distributions for all geometric and mechanical properties, noting that this type of distribution adequately models the unit weight of concrete and both dead and live loads. Similarly, Taj [18] applied Monte Carlo simulation to reinforced concrete beams under flexure, generating random variables for distributed loads based on normal distributions through the Box–Muller transformation, demonstrating their suitability for load modeling. Costa [19] also adopted normal components for sustained loads in his stochastic model of live loads, while extraordinary actions followed a Gamma distribution, showing that normality is a widely accepted approximation for permanent and variable actions. In addition, a recent review [1] highlights the relevance of the JCSS Probabilistic Model Code (PMC), which provides generic probabilistic models for loads and resistances, recommending the normal distribution for permanent and variable actions due to its symmetry, theoretical basis, and ease of integration into reliability methods. Taken together, these works justify the adoption of the normal distribution for load modeling in the present study. For geometric dimensions, the triangular distribution was selected. Unlike loads, field data on dimensional variability are scarce, and construction practices typically lead to bounded deviations around nominal values. Kaminski [20] analyzed uncertainty in truss member lengths using triangular, uniform, and Gaussian distributions, concluding that the triangular distribution provided the second-best reliability index and a realistic representation when values tend to concentrate around the mean. Tytarenko et al. [21], on the other hand, assigned a normal distribution to cross-sectional widths in a Monte Carlo reliability model of reinforced concrete beams, demonstrating that geometric variables can also be treated probabilistically, though requiring statistical records. In this study, due to the lack of detailed measurement data, nominal values were assumed as the most probable dimensions, while construction tolerances defined lower and upper bounds (±0.02 m for beam widths and column sides, and ±0.05 m for beam depths). Thus, the triangular distribution captures both the practical variability observed on site and the bounded nature of geometric imperfections, providing a robust yet realistic representation for reliability assessment. Table 2 summarizes the random variables considered in this study, together with their probability distributions and parameters. In the case of variables modeled with a normal distribution, the notation µ corresponds to the mean value and σ to the standard deviation.
It is important to note that the concrete compressive strength ( f c ) and reinforcement yield strength ( f y ) were not modeled as random variables in this stage of the study. Since the analysis focuses on the probabilistic evaluation of flexural demand (internal forces) under gravity loads, the inclusion of these material strengths does not influence the distribution of moments obtained through elastic analysis in OpenSeesPy. Their role is instead fundamental in capacity assessment, which lies outside the scope of the present demand-oriented study.

2.3. Monte Carlo Simulation

For the estimation of flexural demand, 10,000 simulations were performed using the Monte Carlo method. To verify the adequacy of this number of iterations, additional analyses were conducted for the positive bending moments in the primary beam of frame 6. As can be seen in Table 3, the relative differences with respect to the benchmark of 10,000 simulations were reduced to only 0.26% and 0.18% for the mean values, and to 0.13% and 0.09% for the 95th percentile, respectively, which are negligible. Since increasing the number of iterations implies higher computational cost without significant changes in results, 10,000 simulations were adopted.

2.4. Processing and Analysis of Results

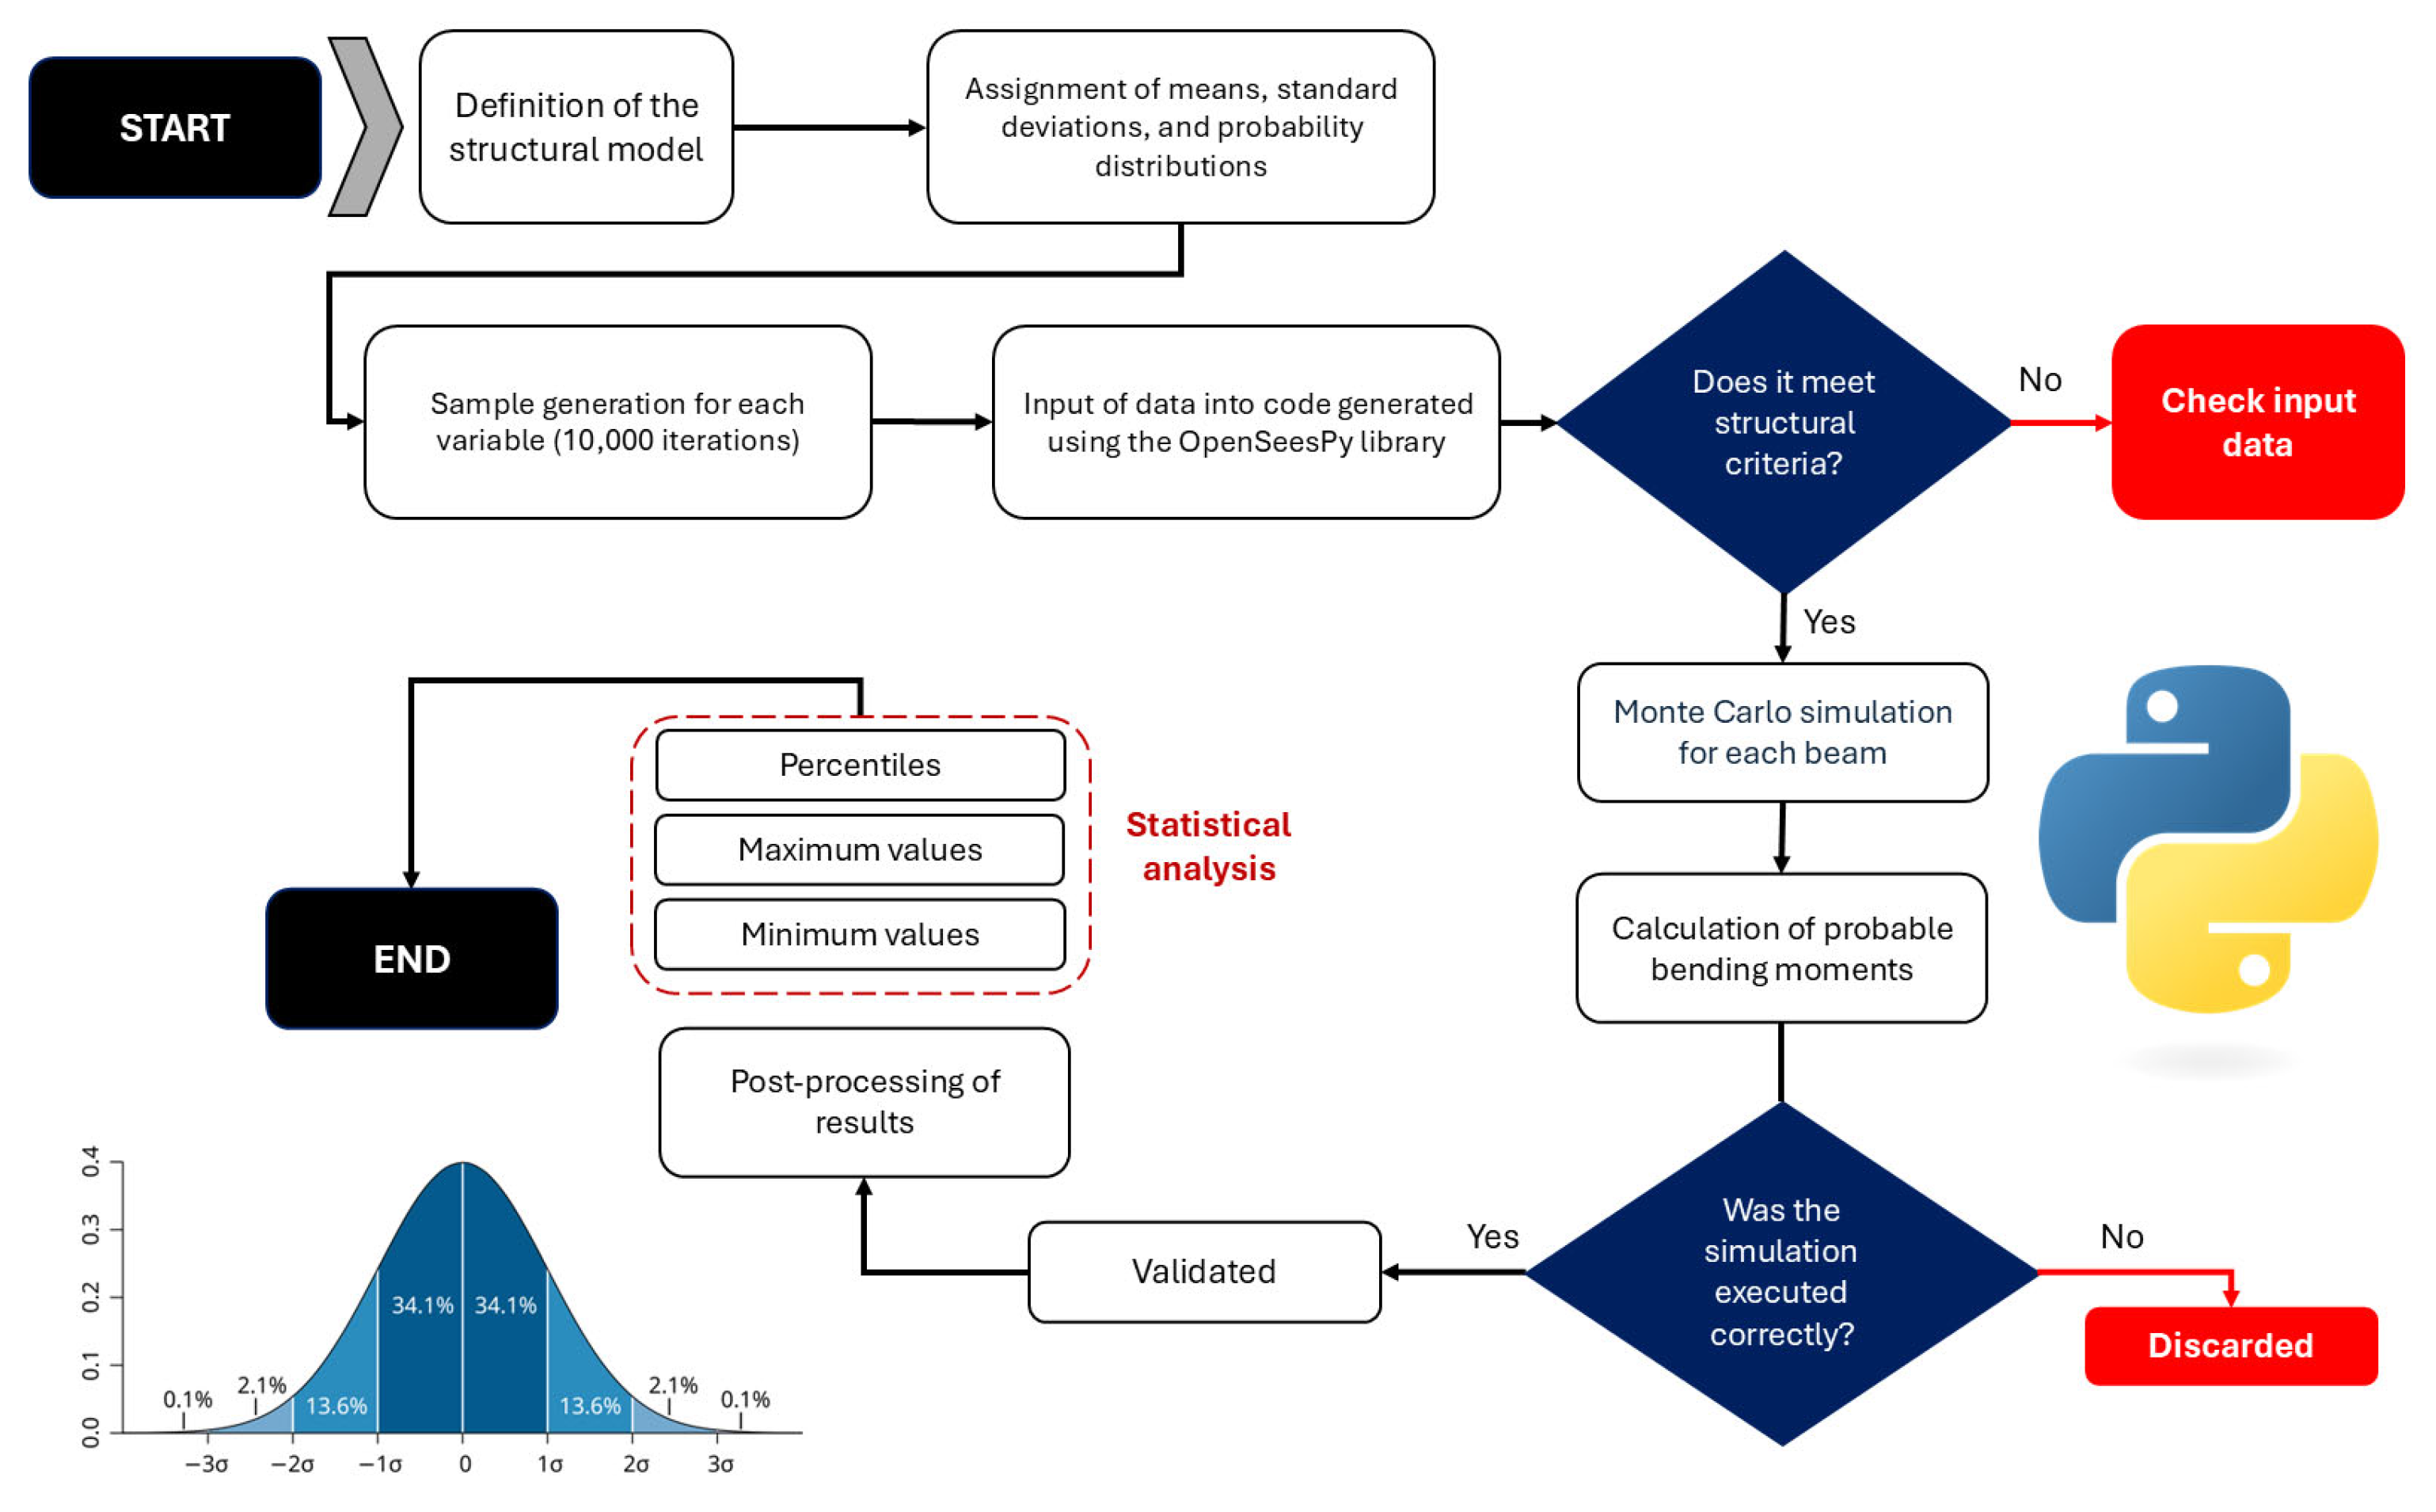
Based on the results from the Monte Carlo simulation, a statistical analysis is carried out for each generated sample. Percentiles are computed to assess the likelihood of different values for ultimate bending moments (P5, P50, P95). Subsequently, a sensitivity analysis is conducted to determine which variable most significantly influences the variability in bending moments of the beams. These results enable a more accurate evaluation of structural safety and provide insights for improving the design of reinforced concrete structural elements. Figure 3 illustrates the flowchart of the methodology used in this study to perform the probabilistic analysis of bending moments in beams.

3. Results

In this study, the deterministic bending moment values were obtained through elastic analyses in OpenSeesPy, using the nominal load intensities and geometric dimensions specified in the Peruvian standards [22,23]. These results represent the conventional design approach, in which parameters are considered fixed and free of variability. By contrast, the probabilistic analysis accounted for uncertainty by assigning triangular distributions to the geometric dimensions and normal distributions to the applied loads, with 10,000 Monte Carlo simulations performed for each frame configuration. From the resulting distributions, the 95th percentile was selected as a representative upper-bound demand level, indicating a bending moment that is exceeded in only 5% of the simulated cases. This percentile provides a probabilistic measure of extreme but plausible demand and should not be interpreted as a code-defined characteristic or design value.

3.1. Positive Bending Moments

It was observed that the mean values of the positive bending moments increase as the dimensions and applied loads increase. As shown in Table 4, these values range from 2596.7 kg·m to 34,396.31 kg·m for the main beams. In the case of secondary beams, mean values range from 316.73 kg·m to 4393.33 kg·m. This trend is consistent for the P95 values, indicating that under more extreme conditions, positive moments may reach up to 41,044.03 kg·m for Frame 10. Moreover, it is evident that main beams exhibit a greater increase in bending moments compared to secondary beams, which experience less variation.
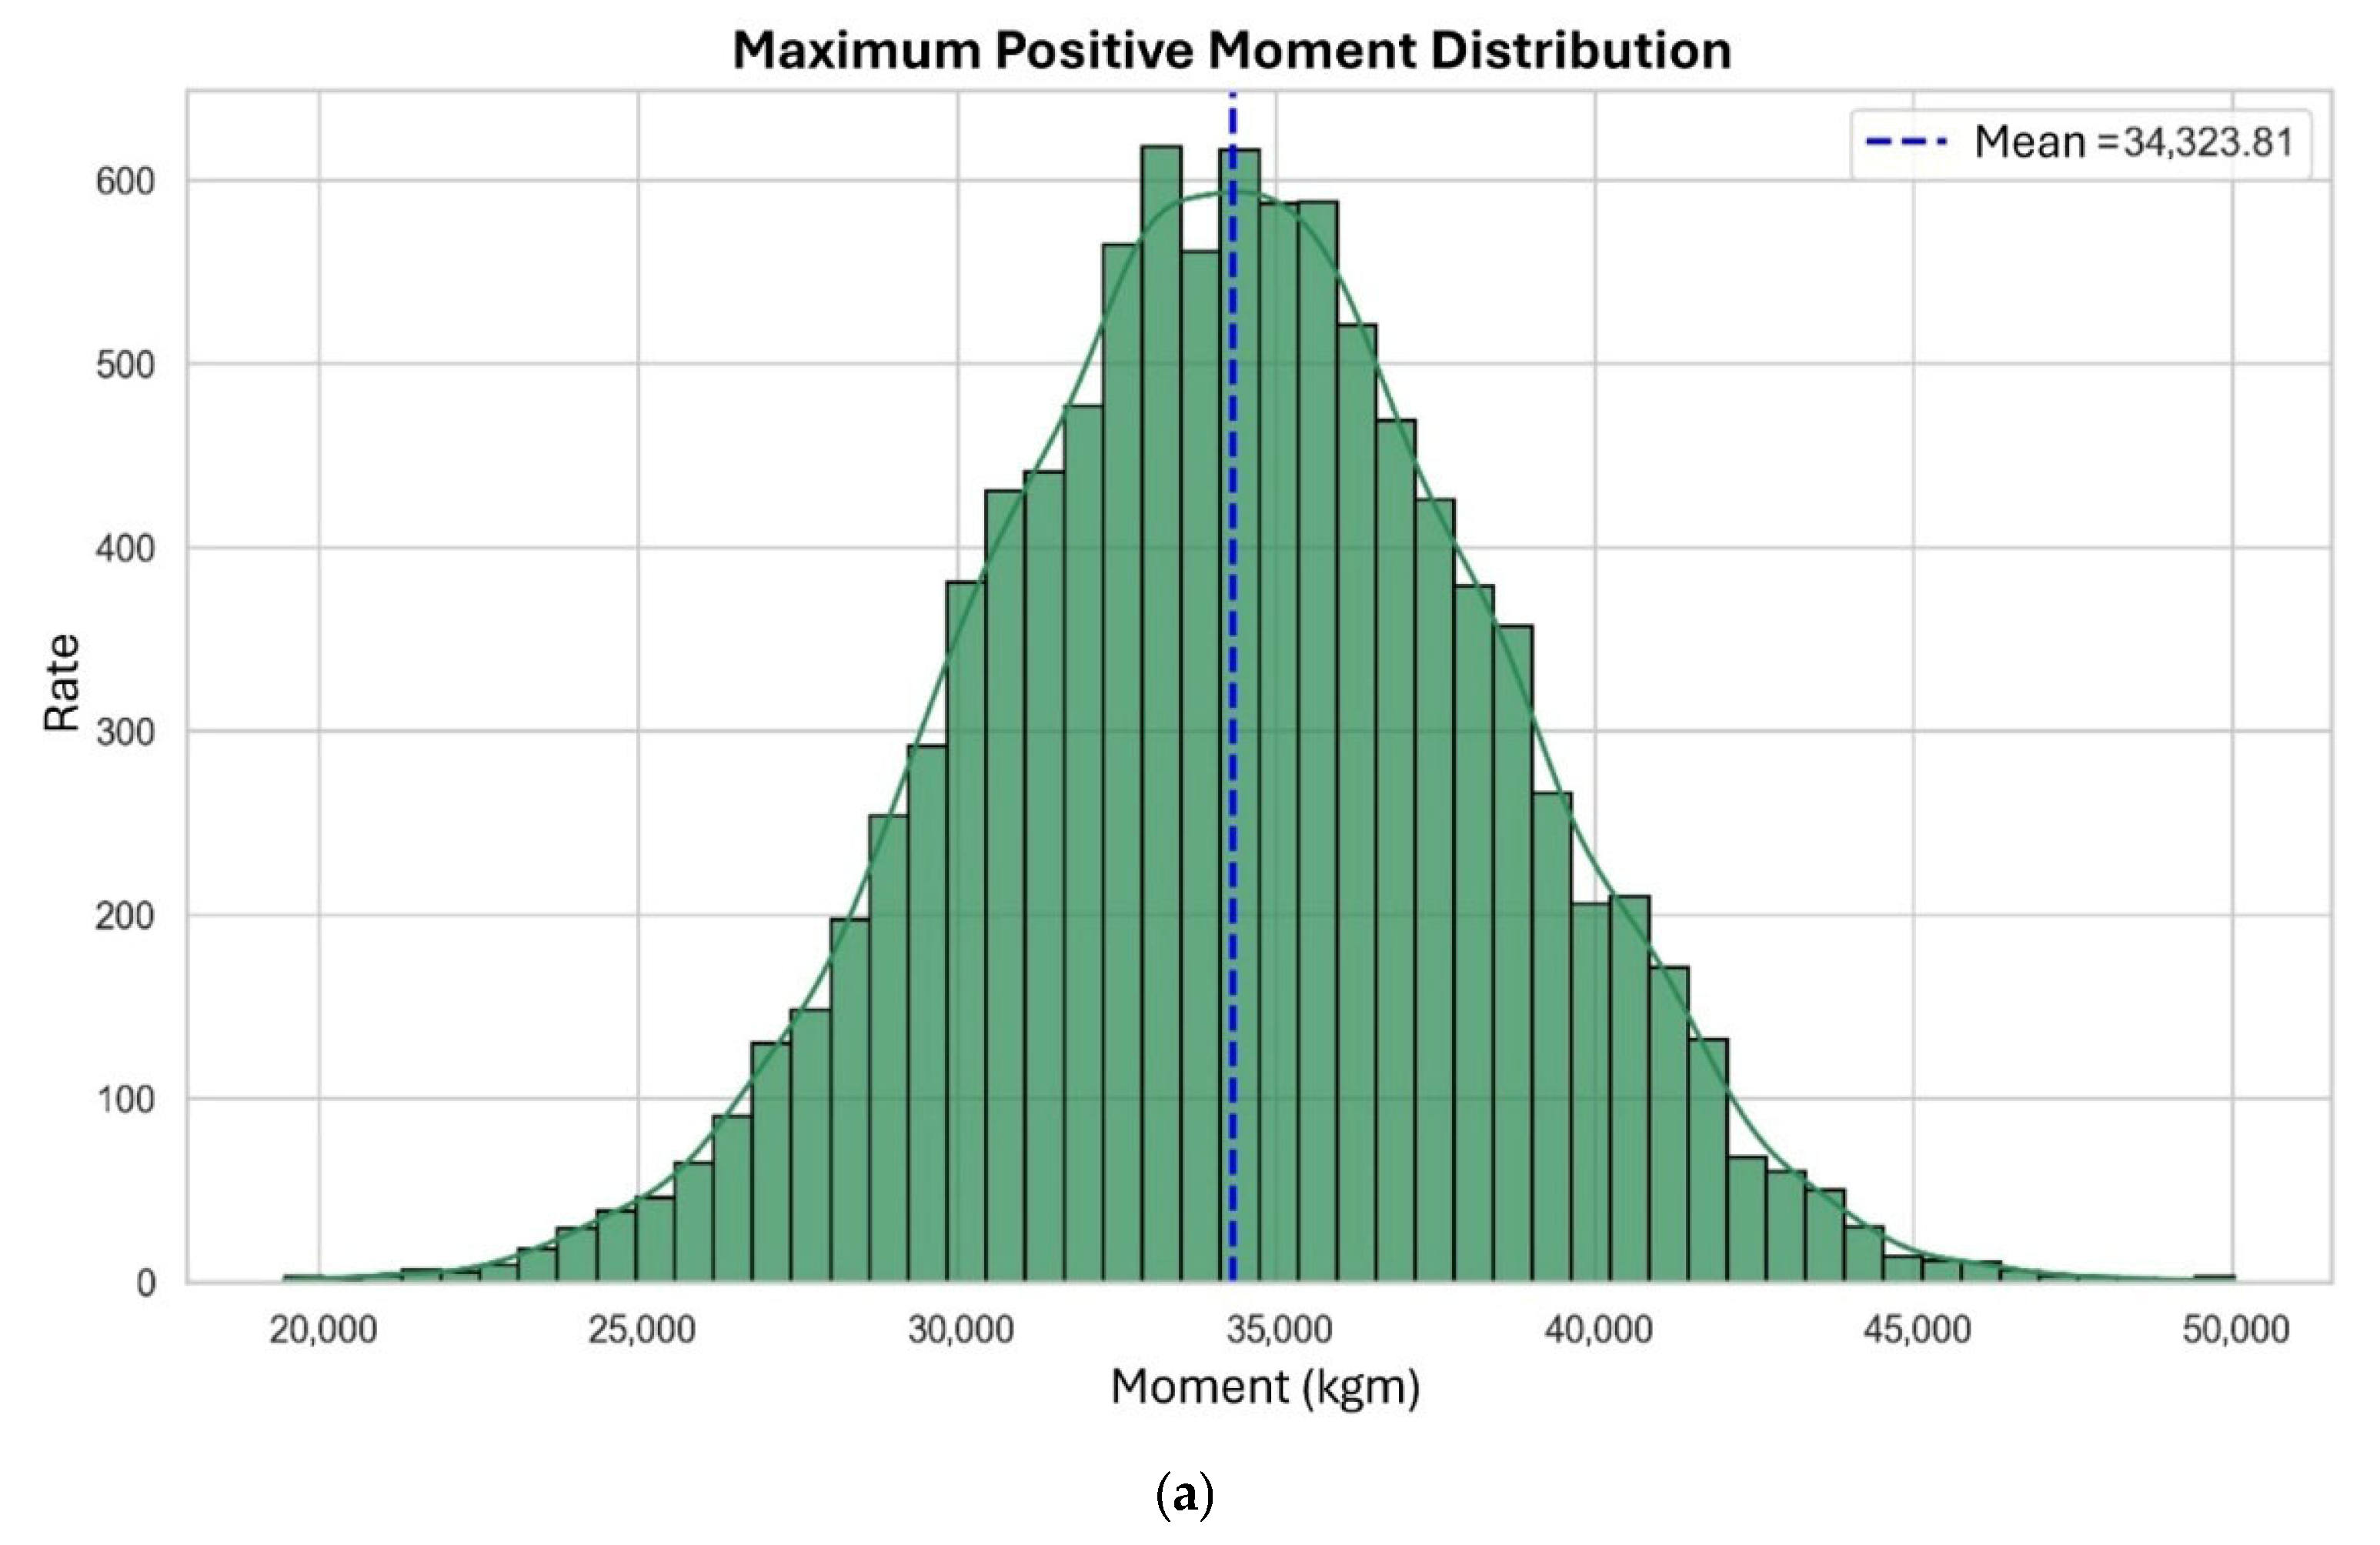
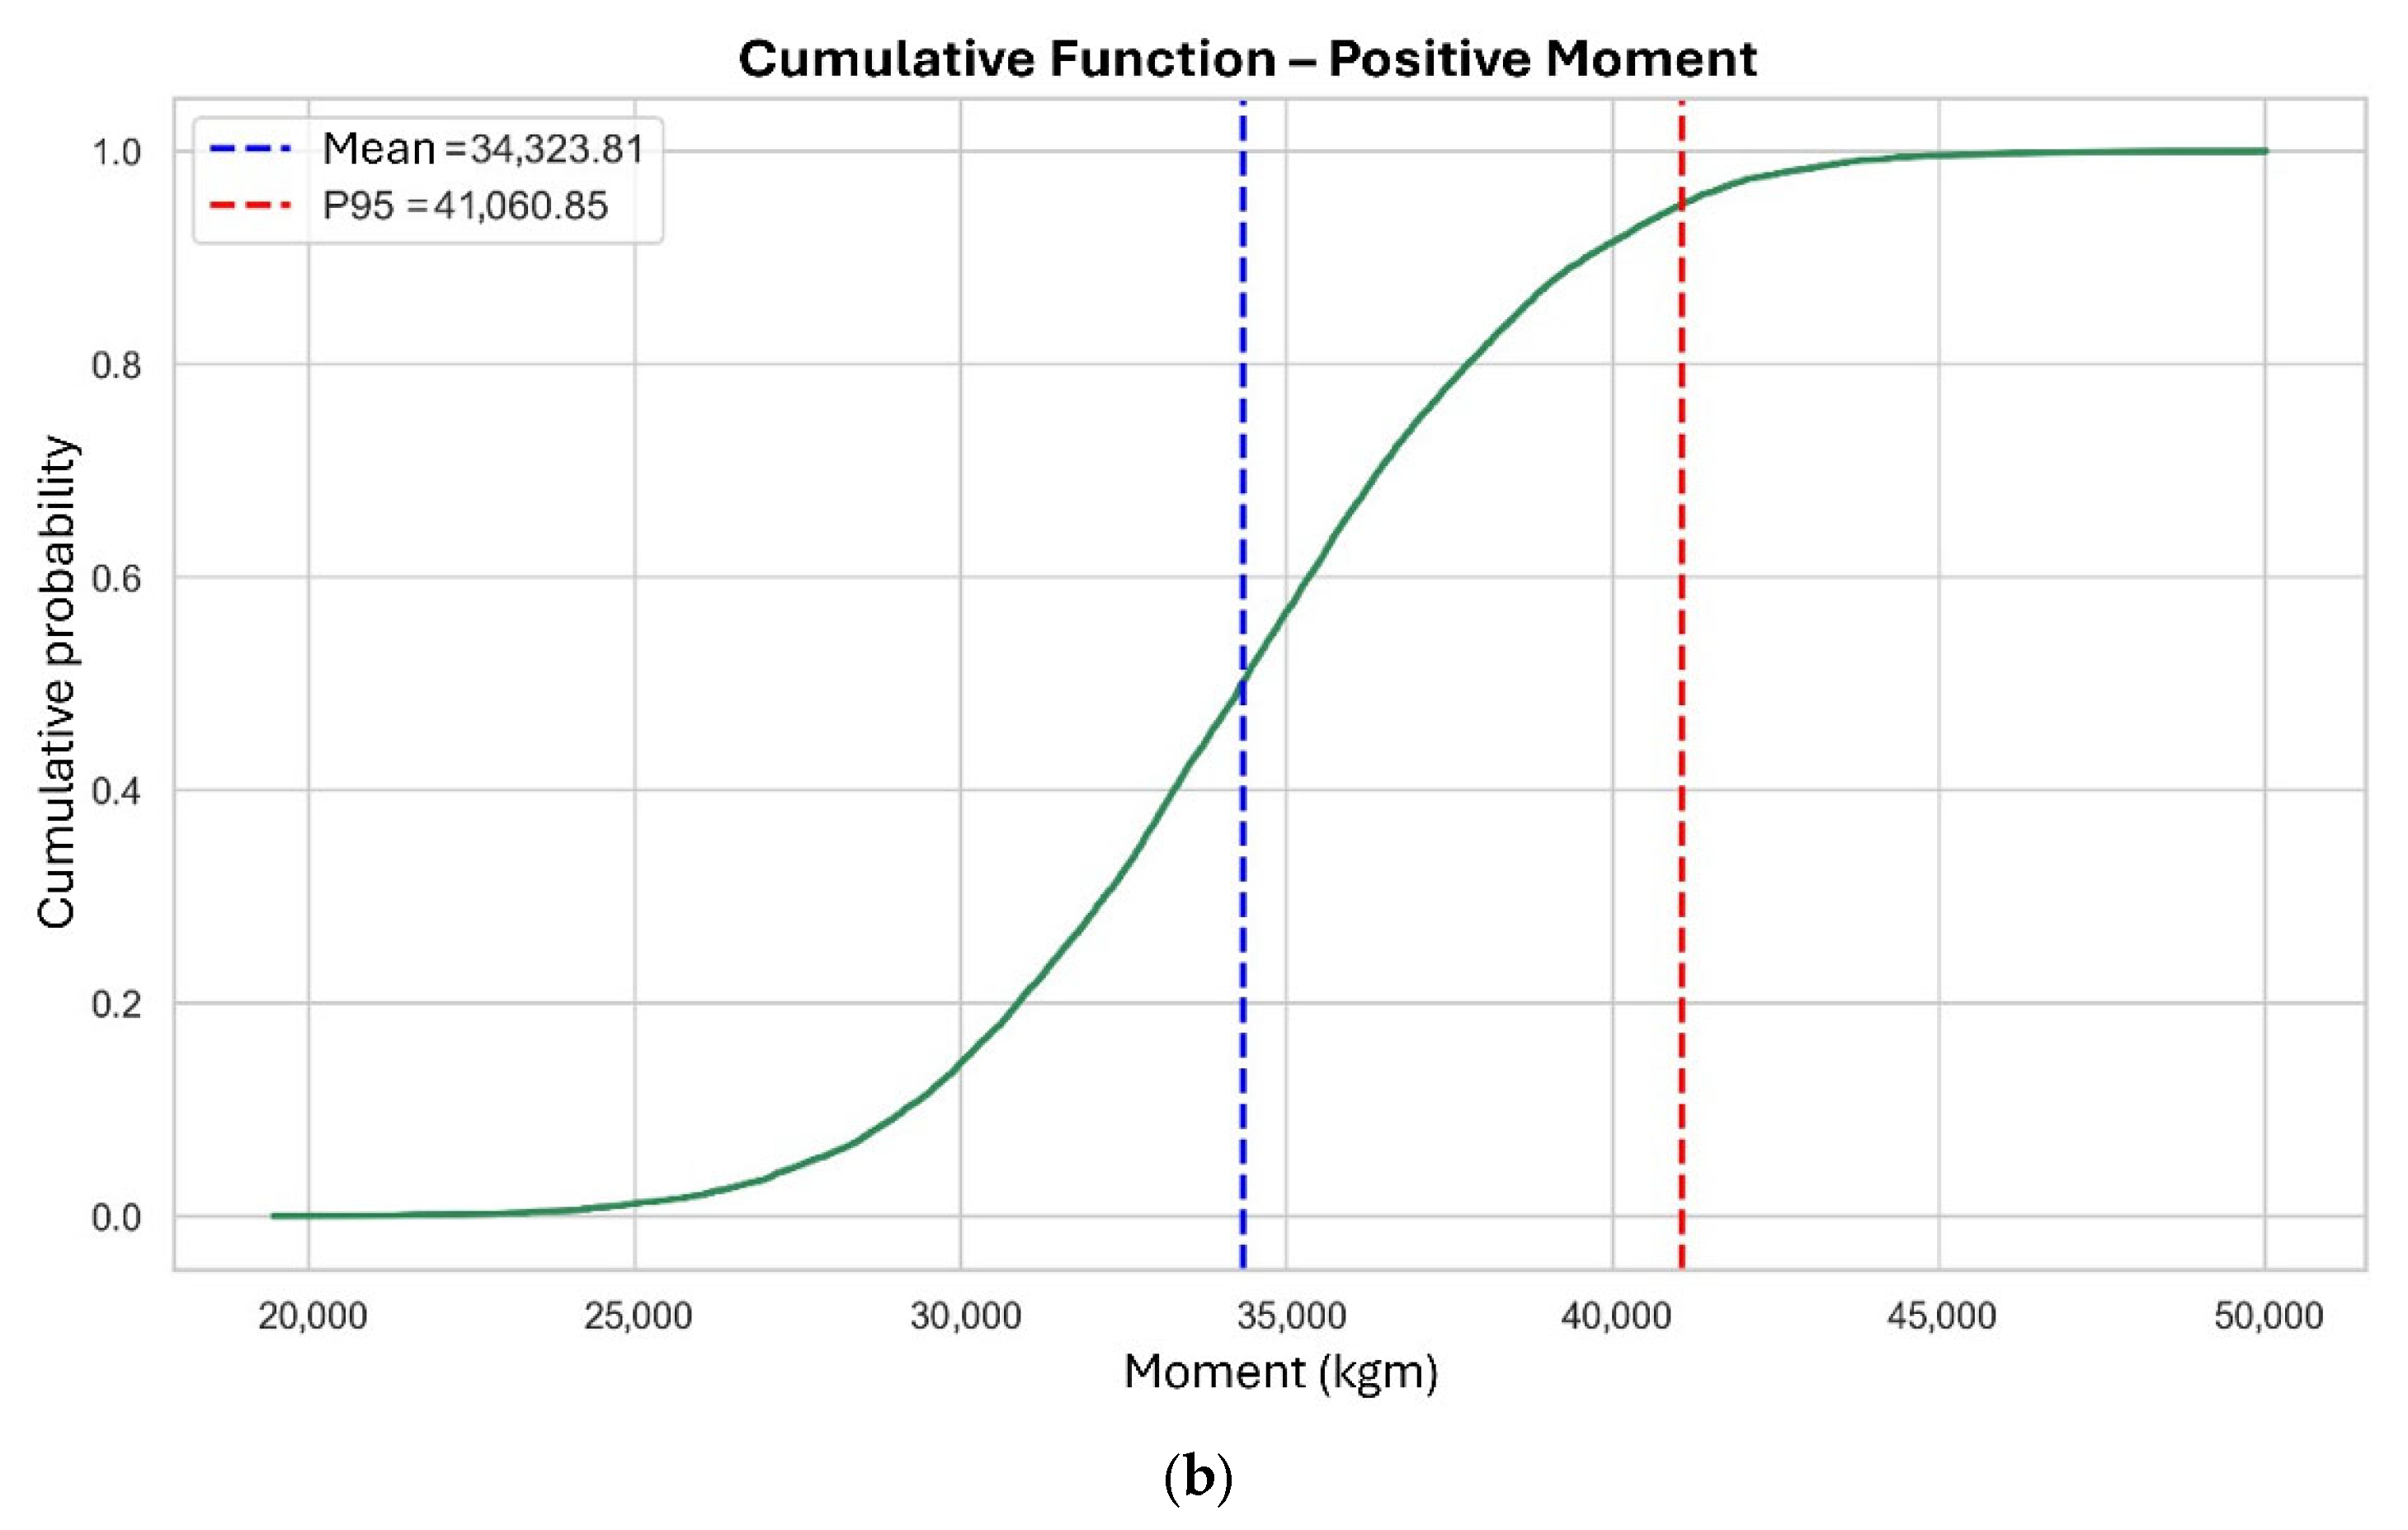
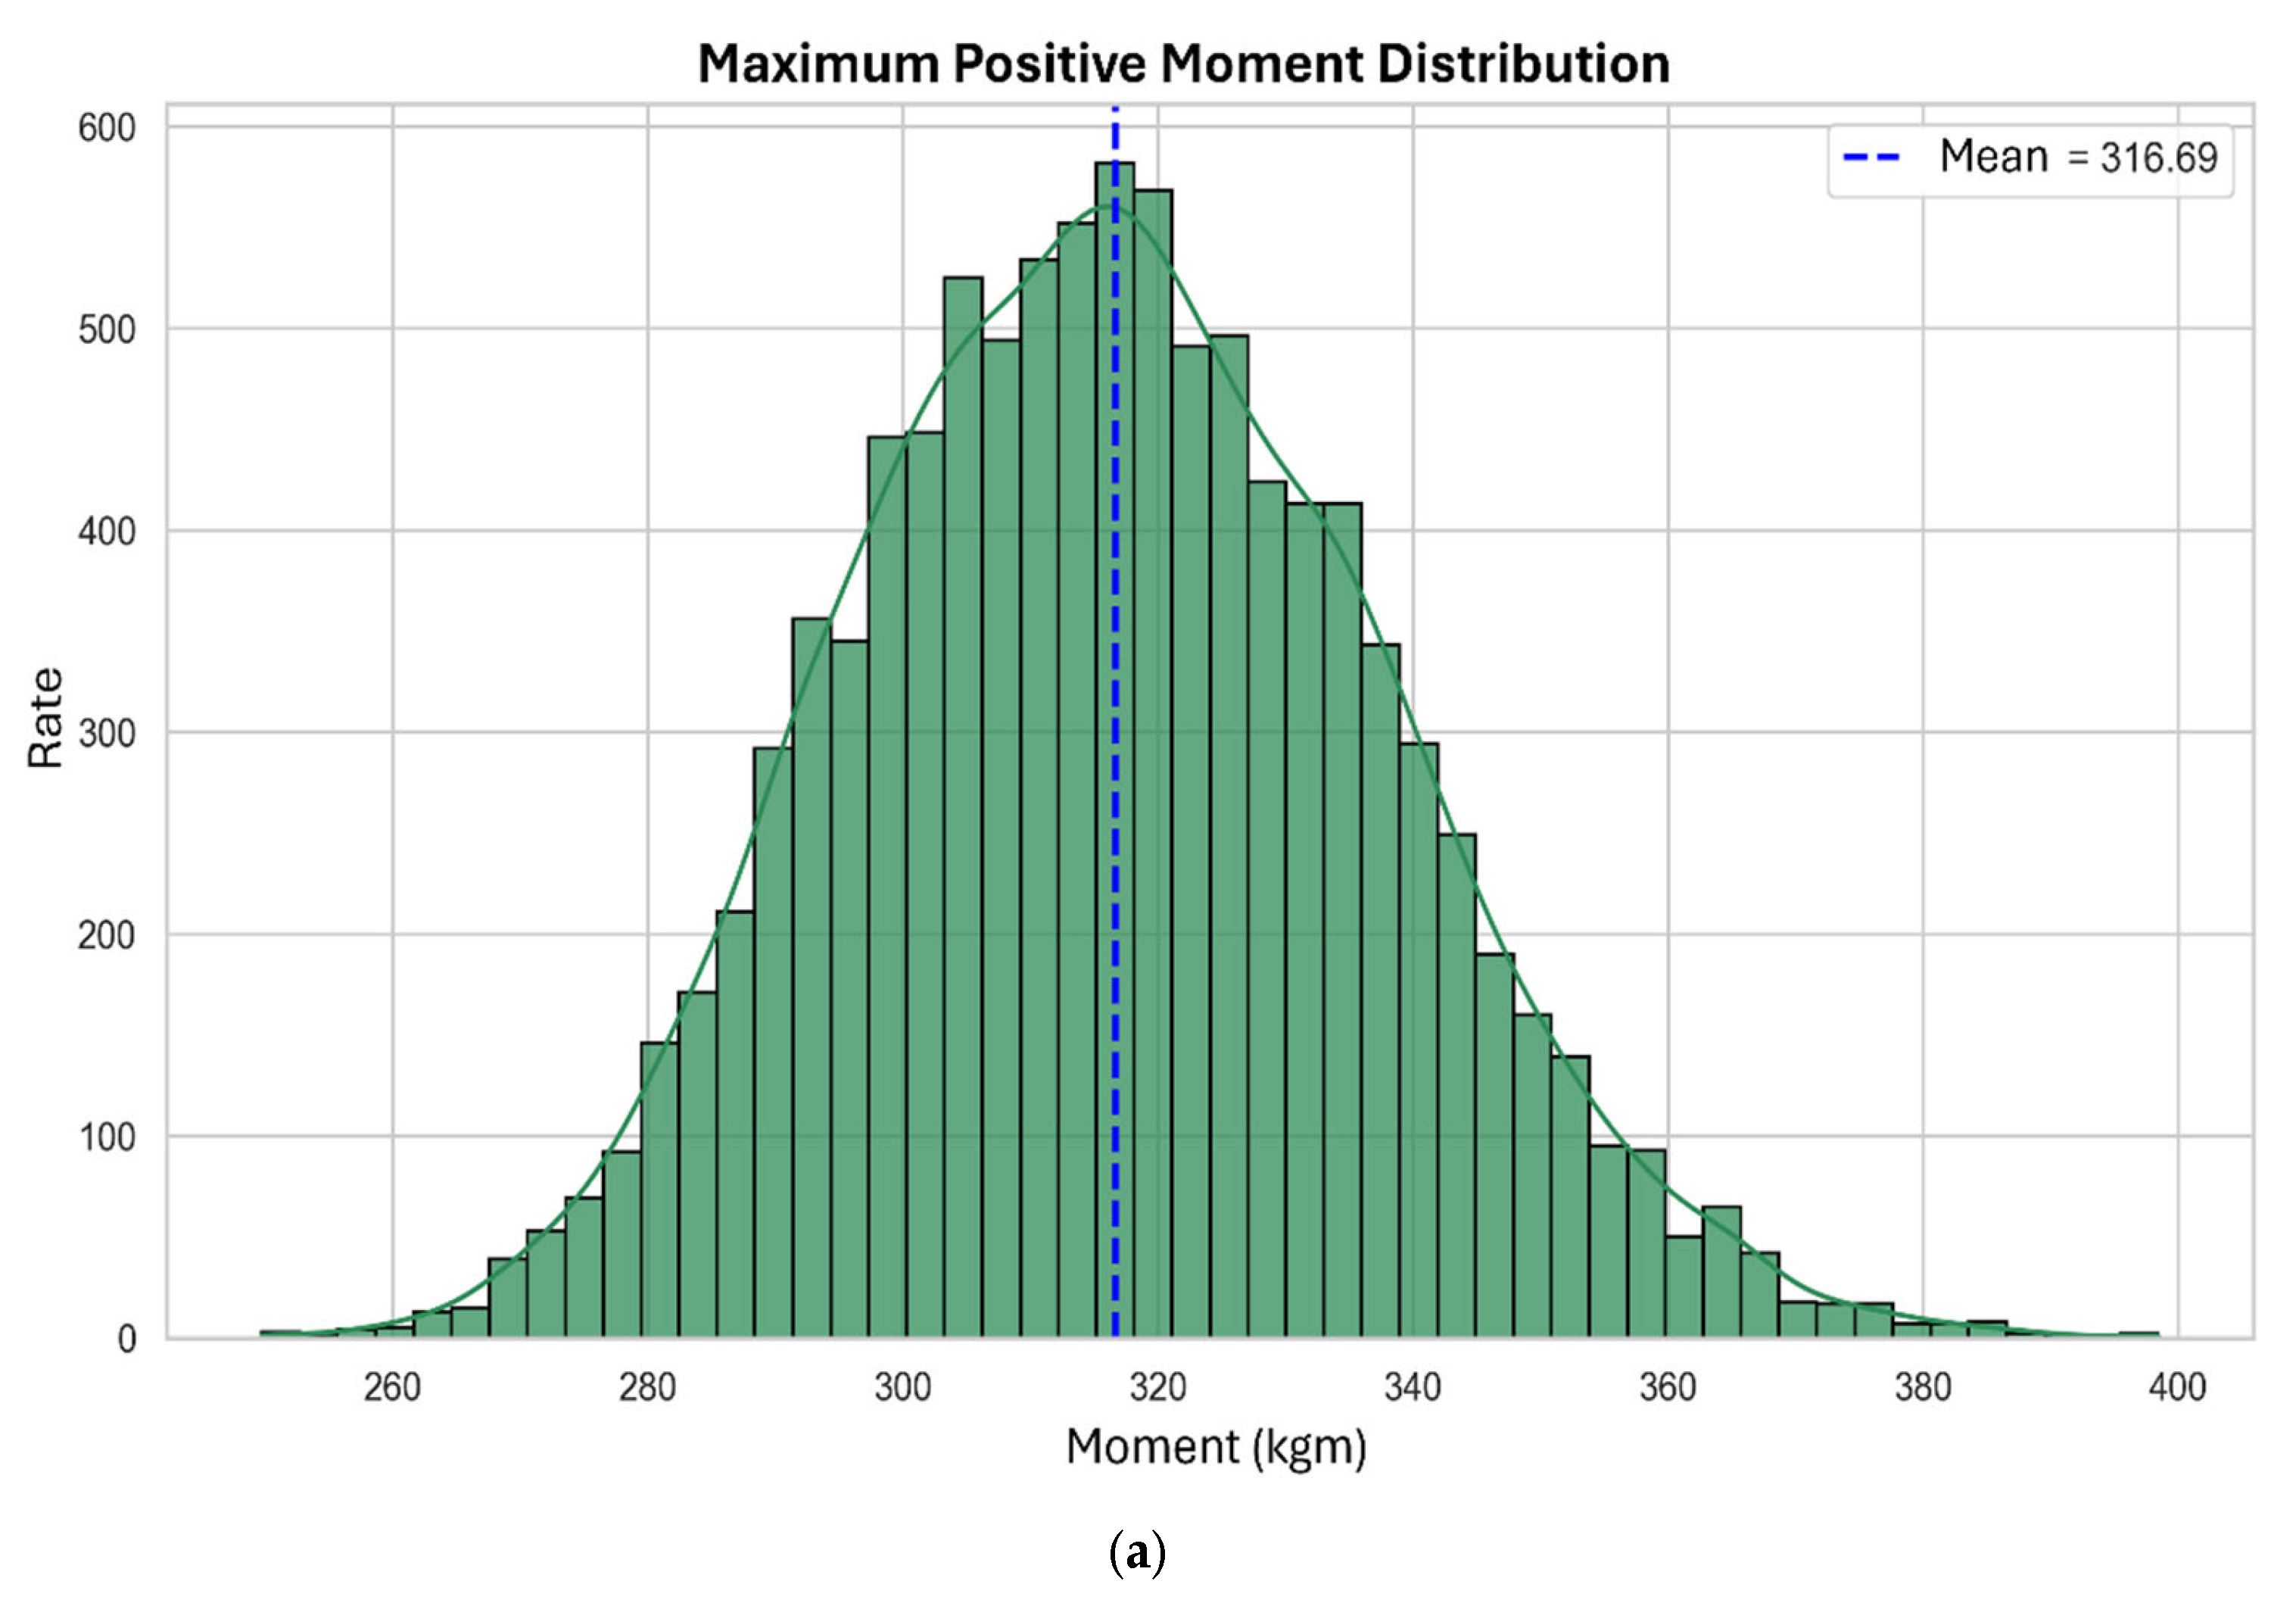
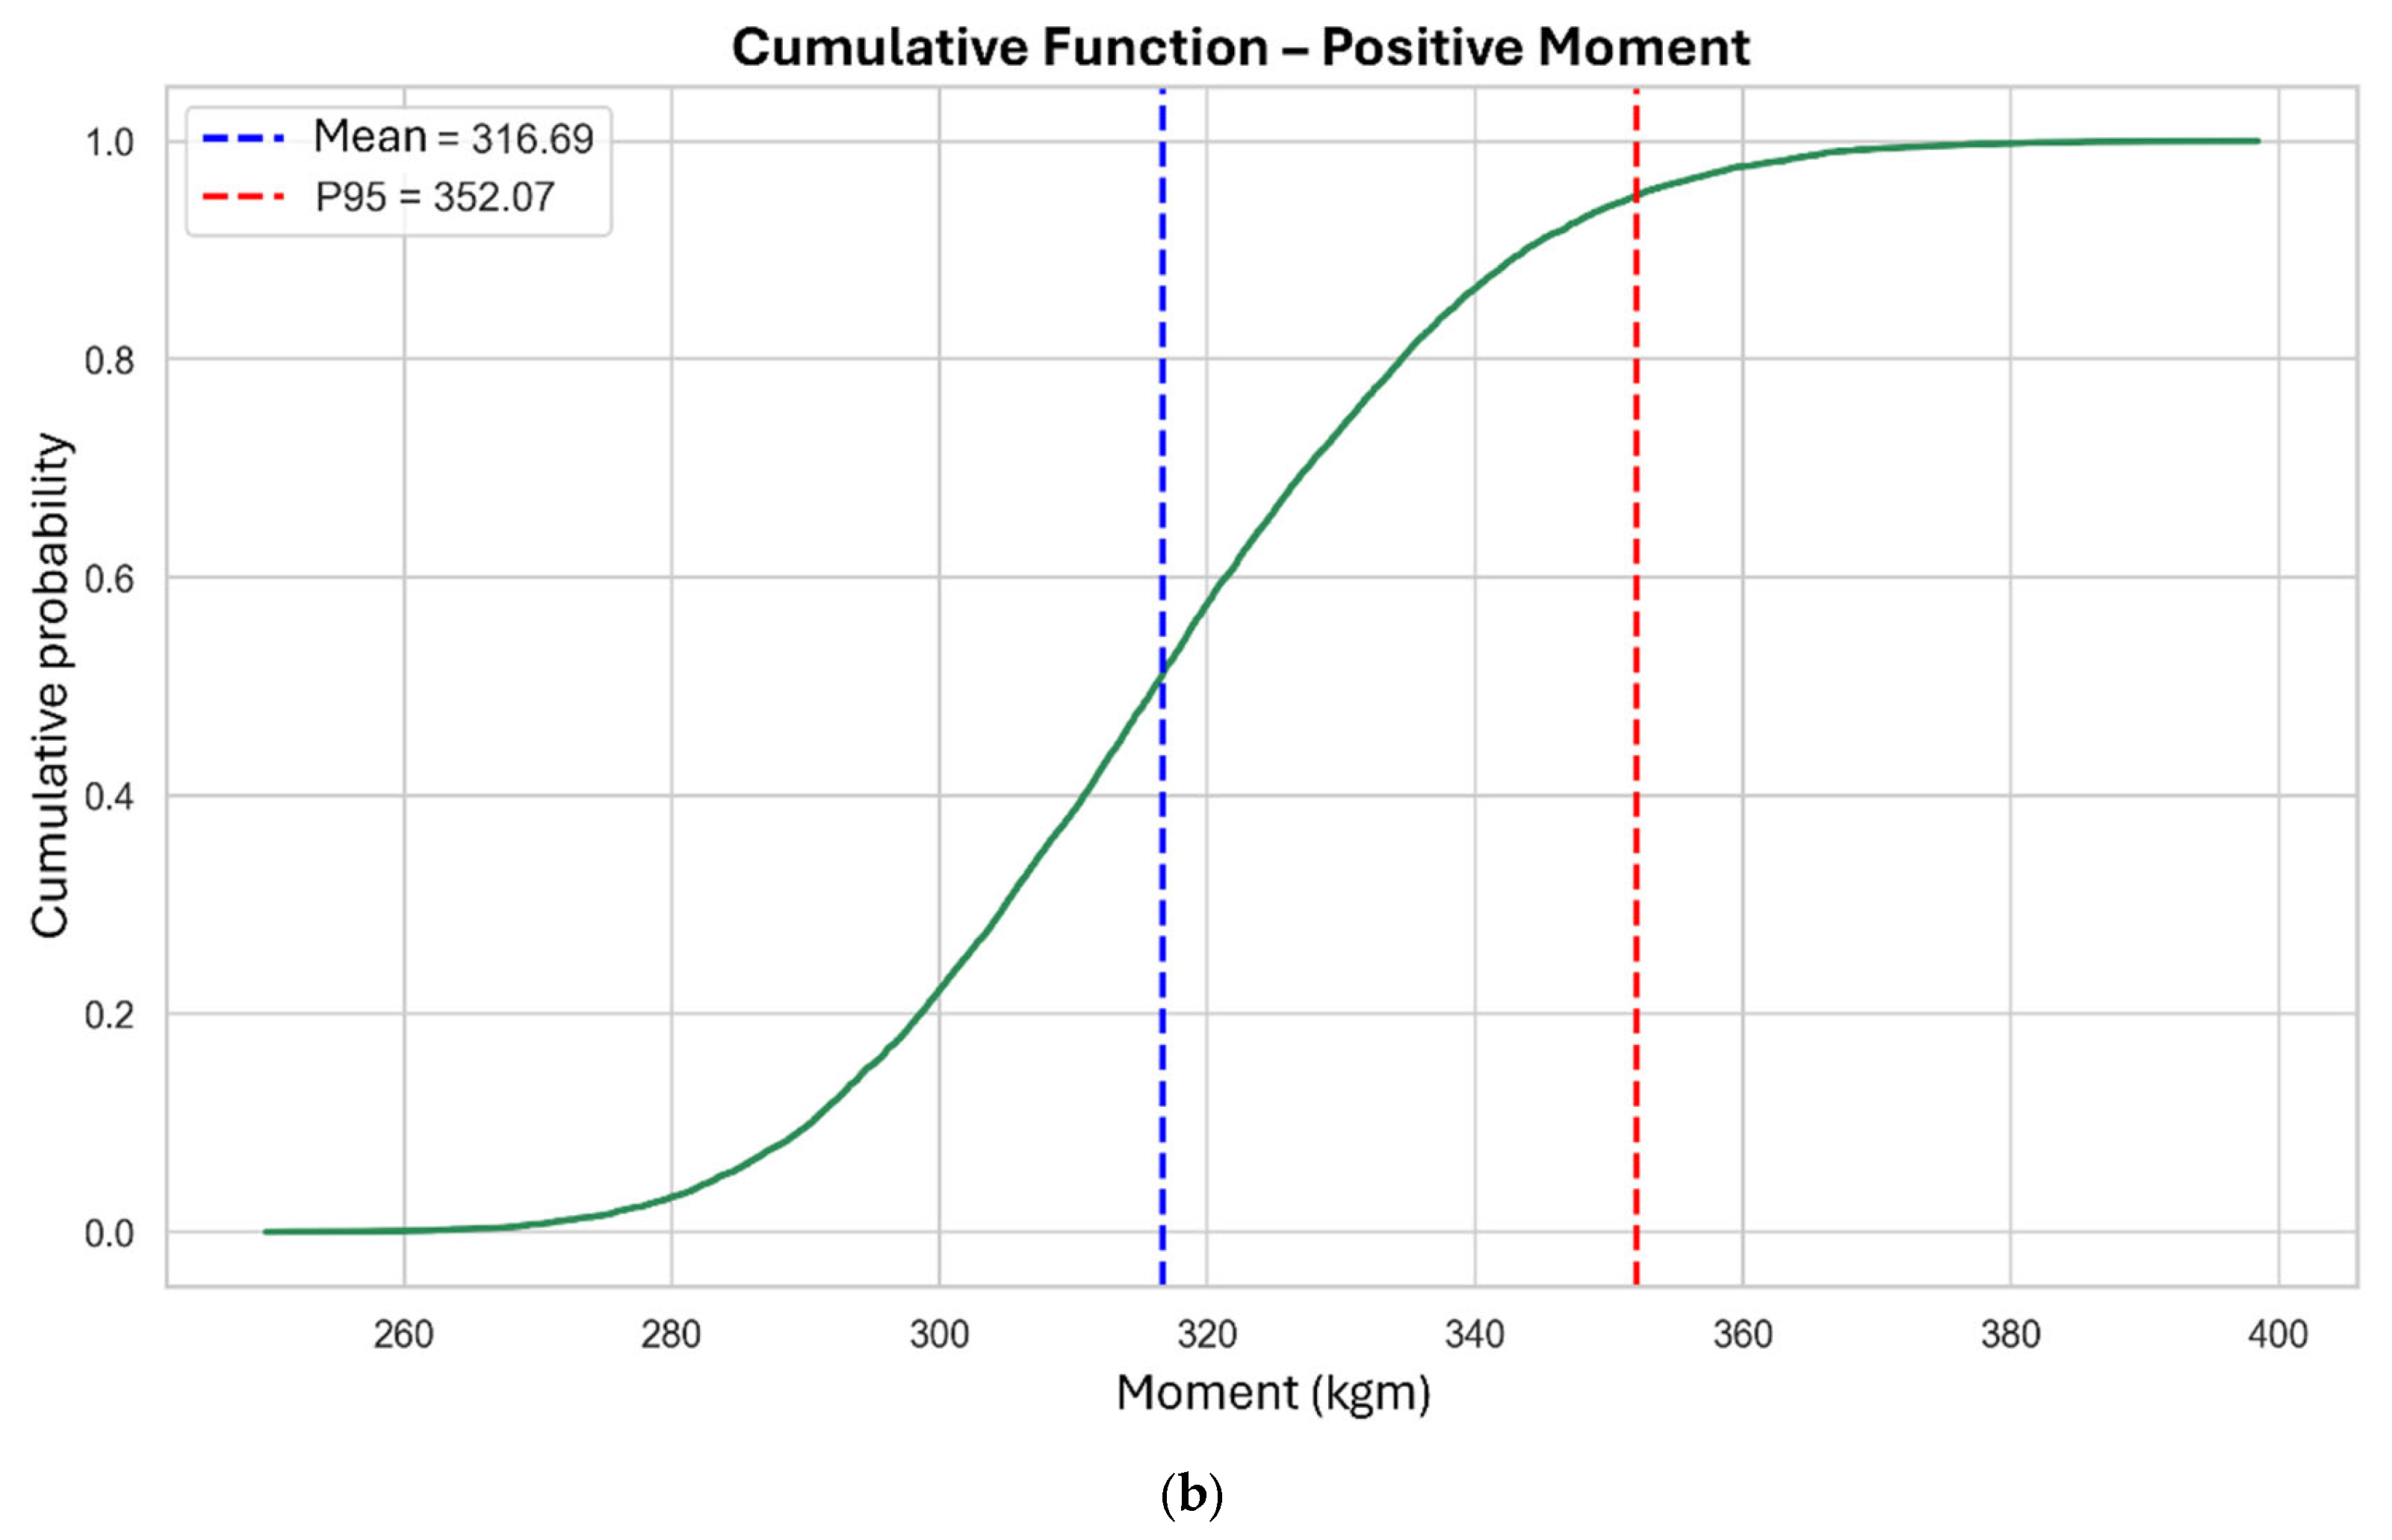
As shown in Figure 4, for Frame 10 and main beams, the P95 represents a 19.33% increase over the mean value. Similarly, as shown in Figure 5, the secondary beams exhibit an 8.67% increase.
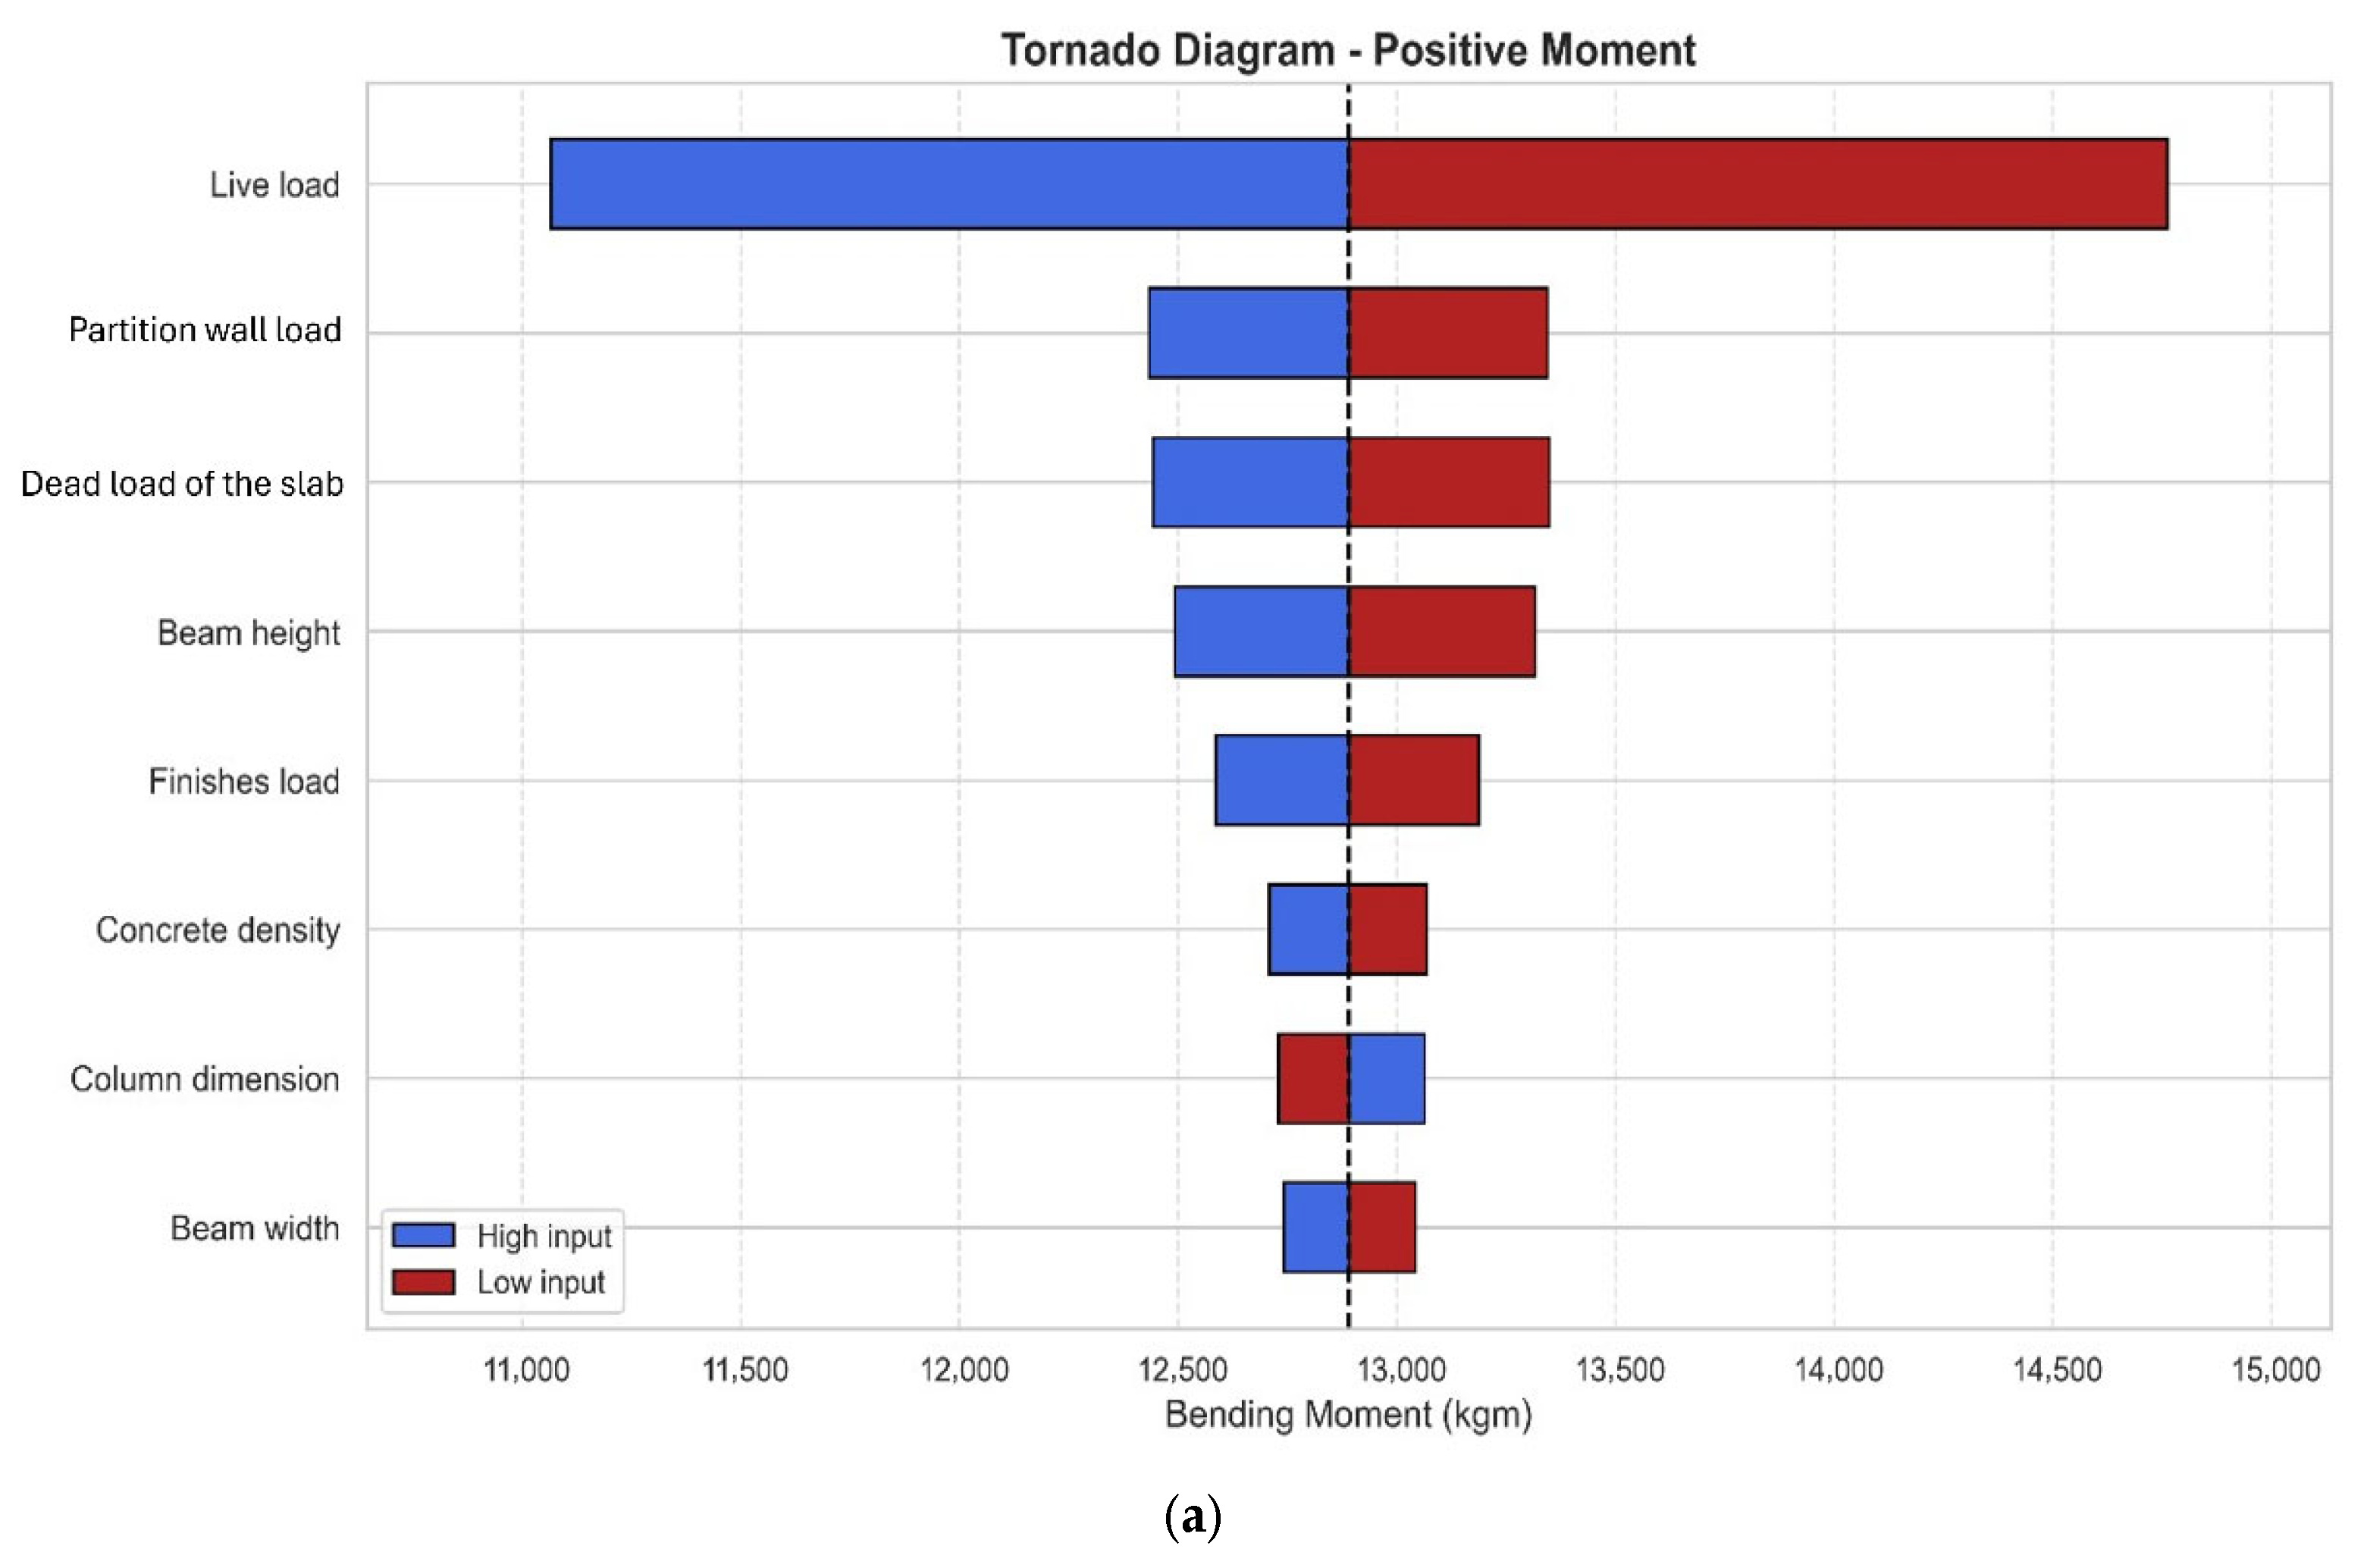
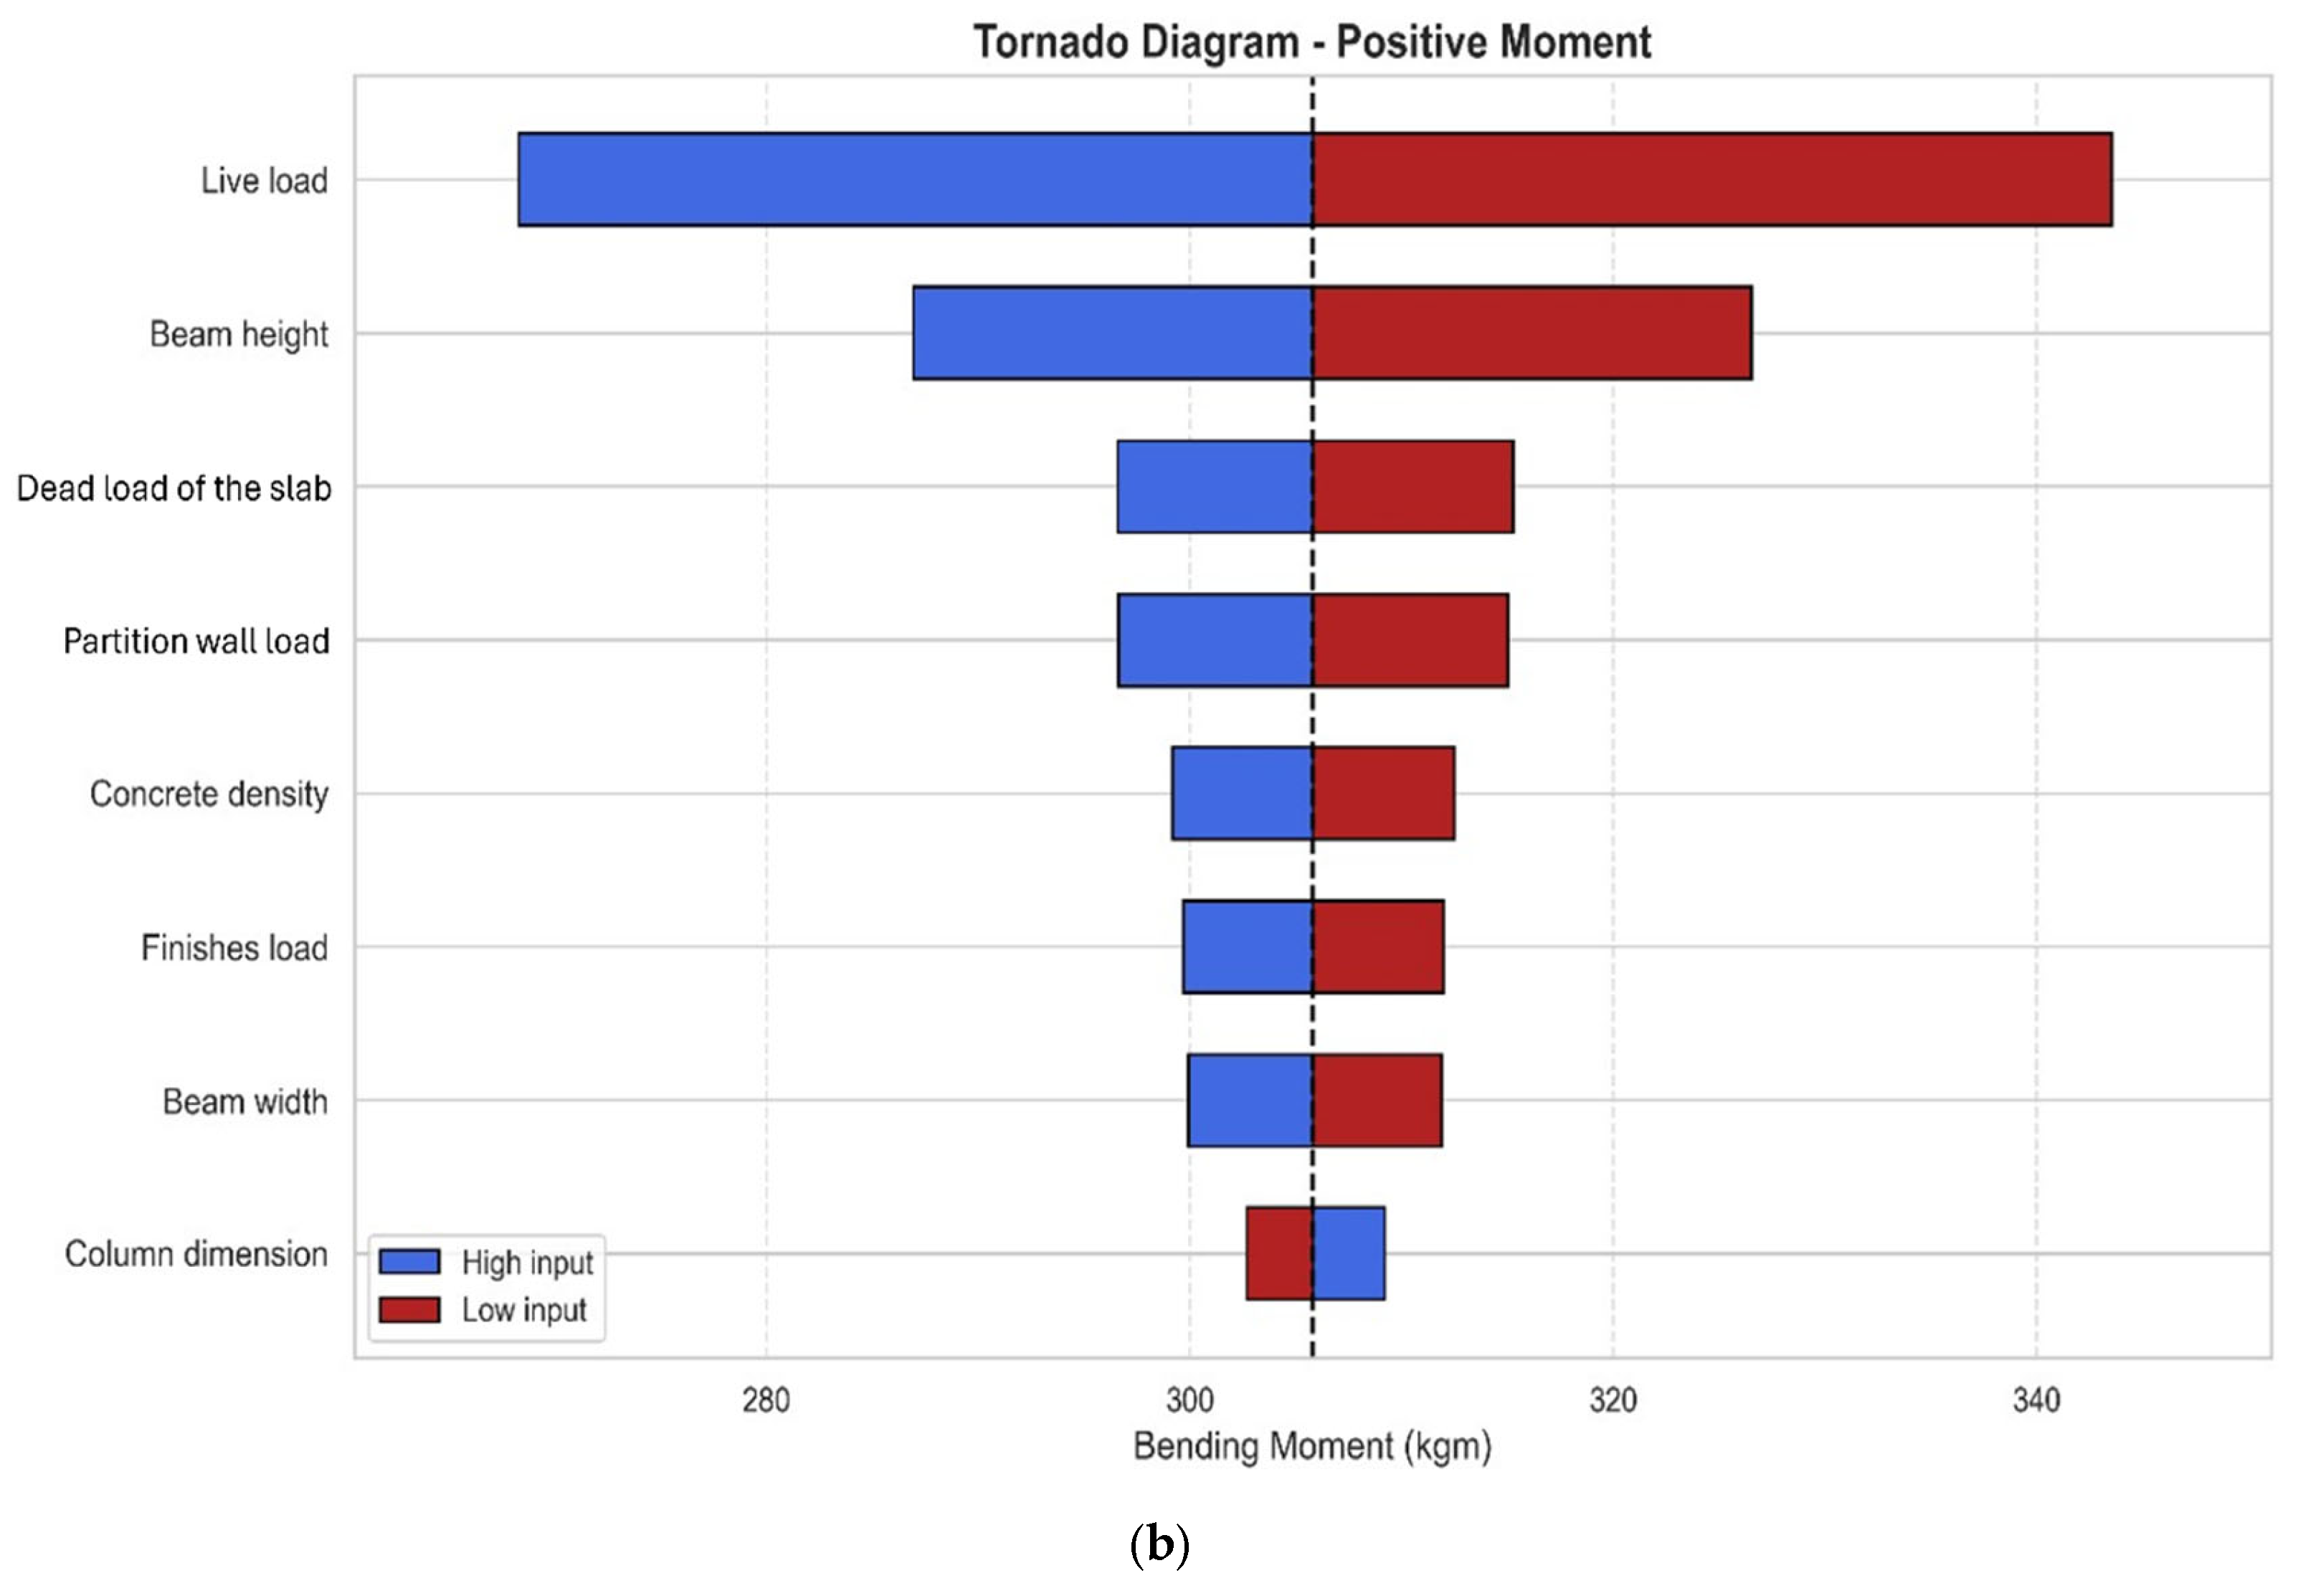
The sensitivity analysis for positive bending moments is shown in Figure 6. For main beams, the tornado diagram corresponds to Frame 6, while for secondary beams it corresponds to Frame 1. In both cases, the most influential variable is the live load, whereas the least influential is the beam width. In secondary beams, beam height also shows significant influence on moment variation.

3.2. Negative Bending Moments

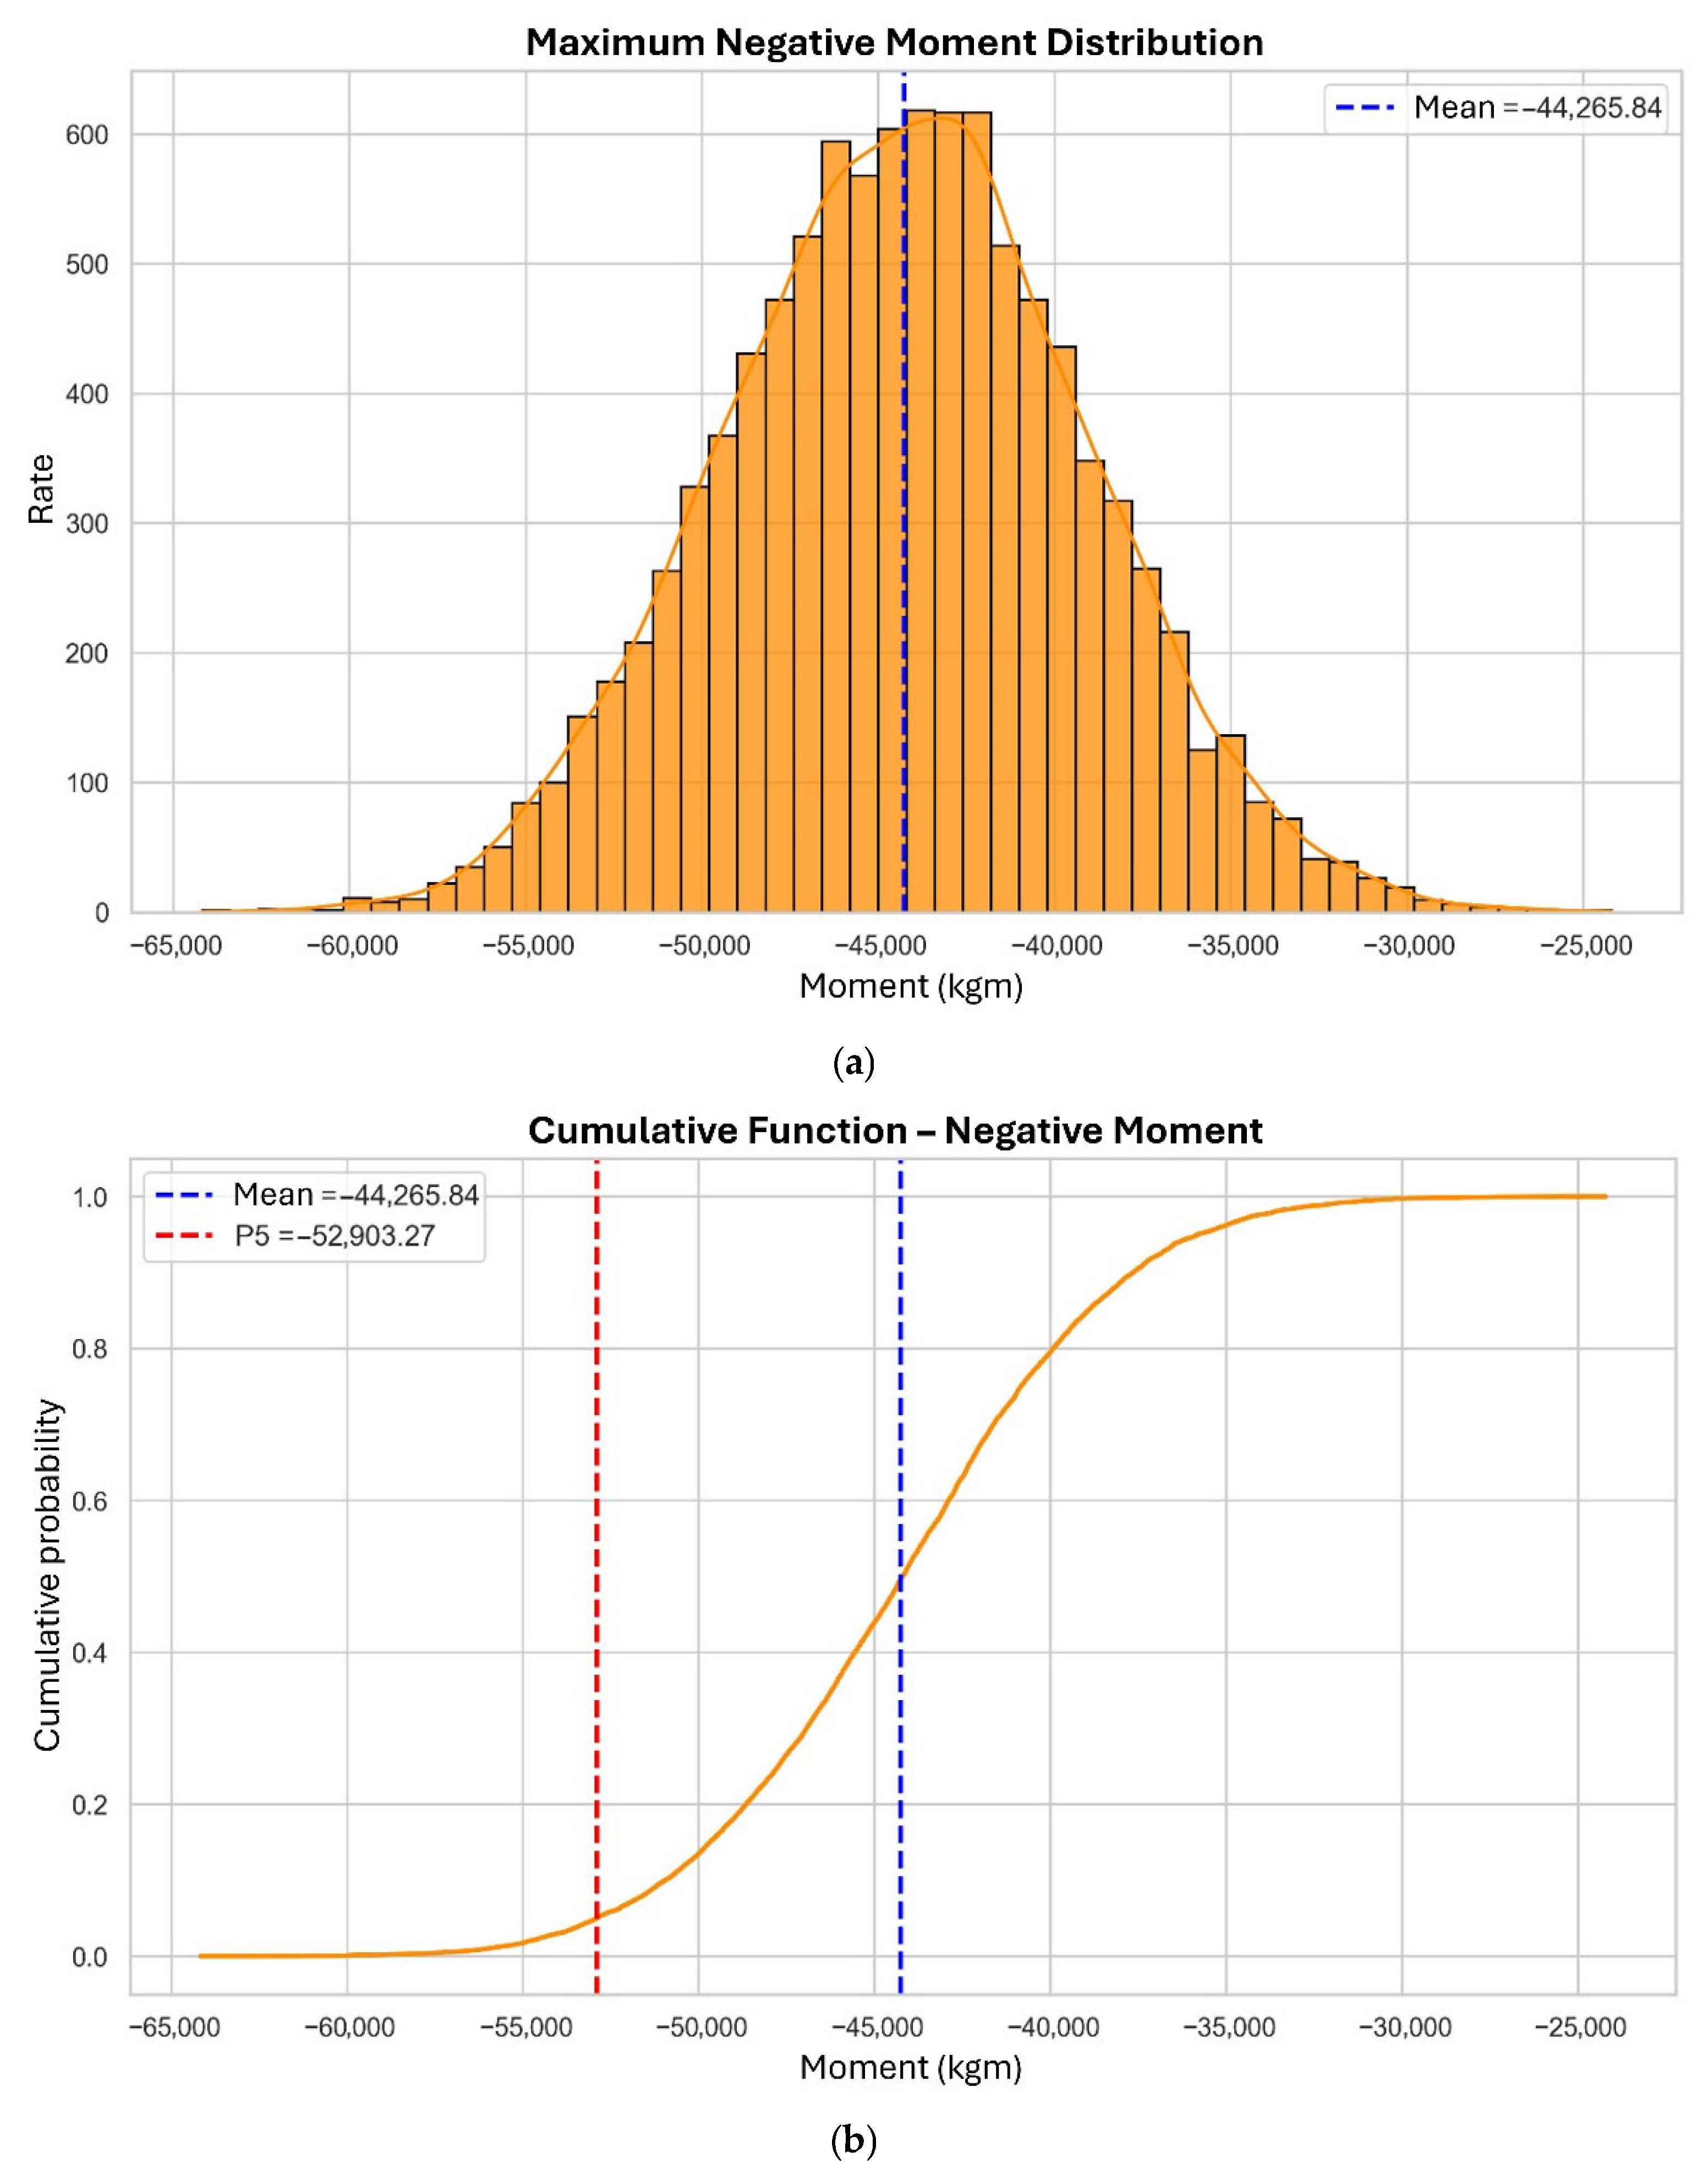
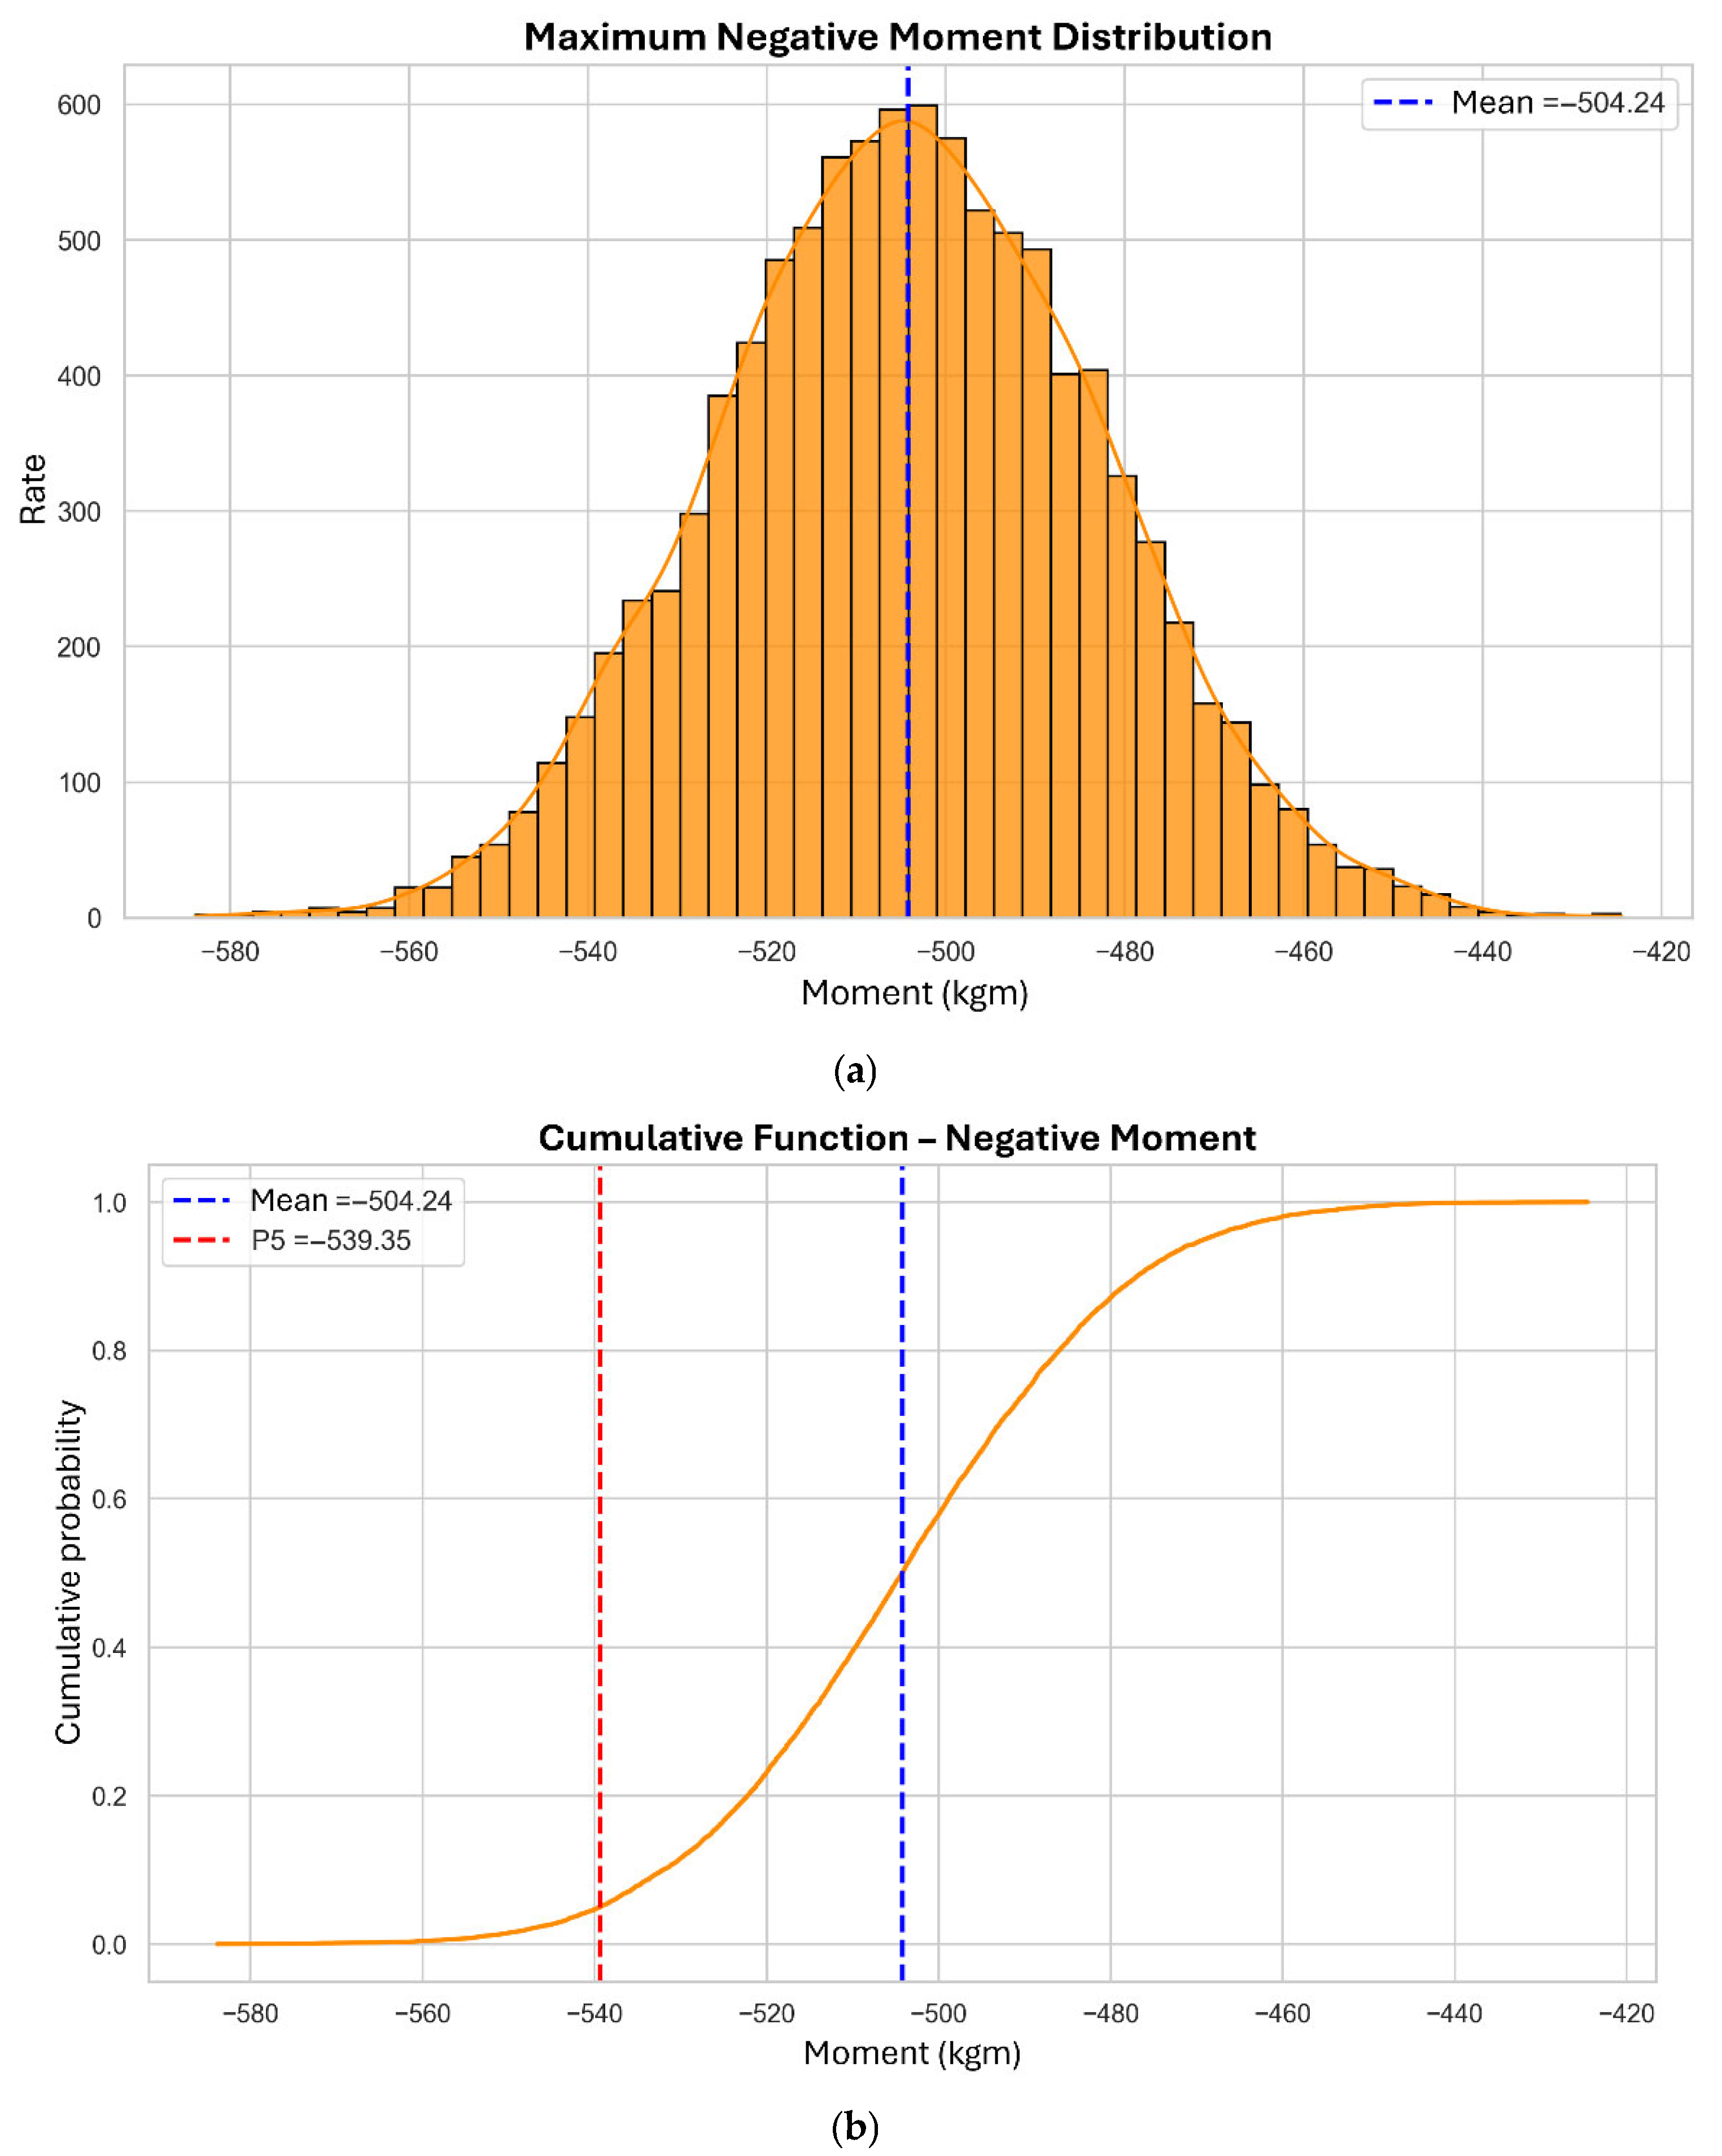
The trend for negative bending moments is similar to that of positive moments, increasing with greater dimensions and applied loads. As shown in Table 5, the mean values range from −3090.40 kg·m to −44,345.52 kg·m for main beams, and from −504.12 kg·m to −6954.30 kg·m for secondary beams. Moreover, the P5 values show that the most extreme cases can reach −52,686.07 kg·m, indicating that the variability of negative bending moments can be substantial under extreme scenarios.
As shown in Figure 7, for Frame 10 and main beams, the P95 represents an 18.81% increase over the mean value. Likewise, for secondary beams (Figure 8), the increase is 6.93%.
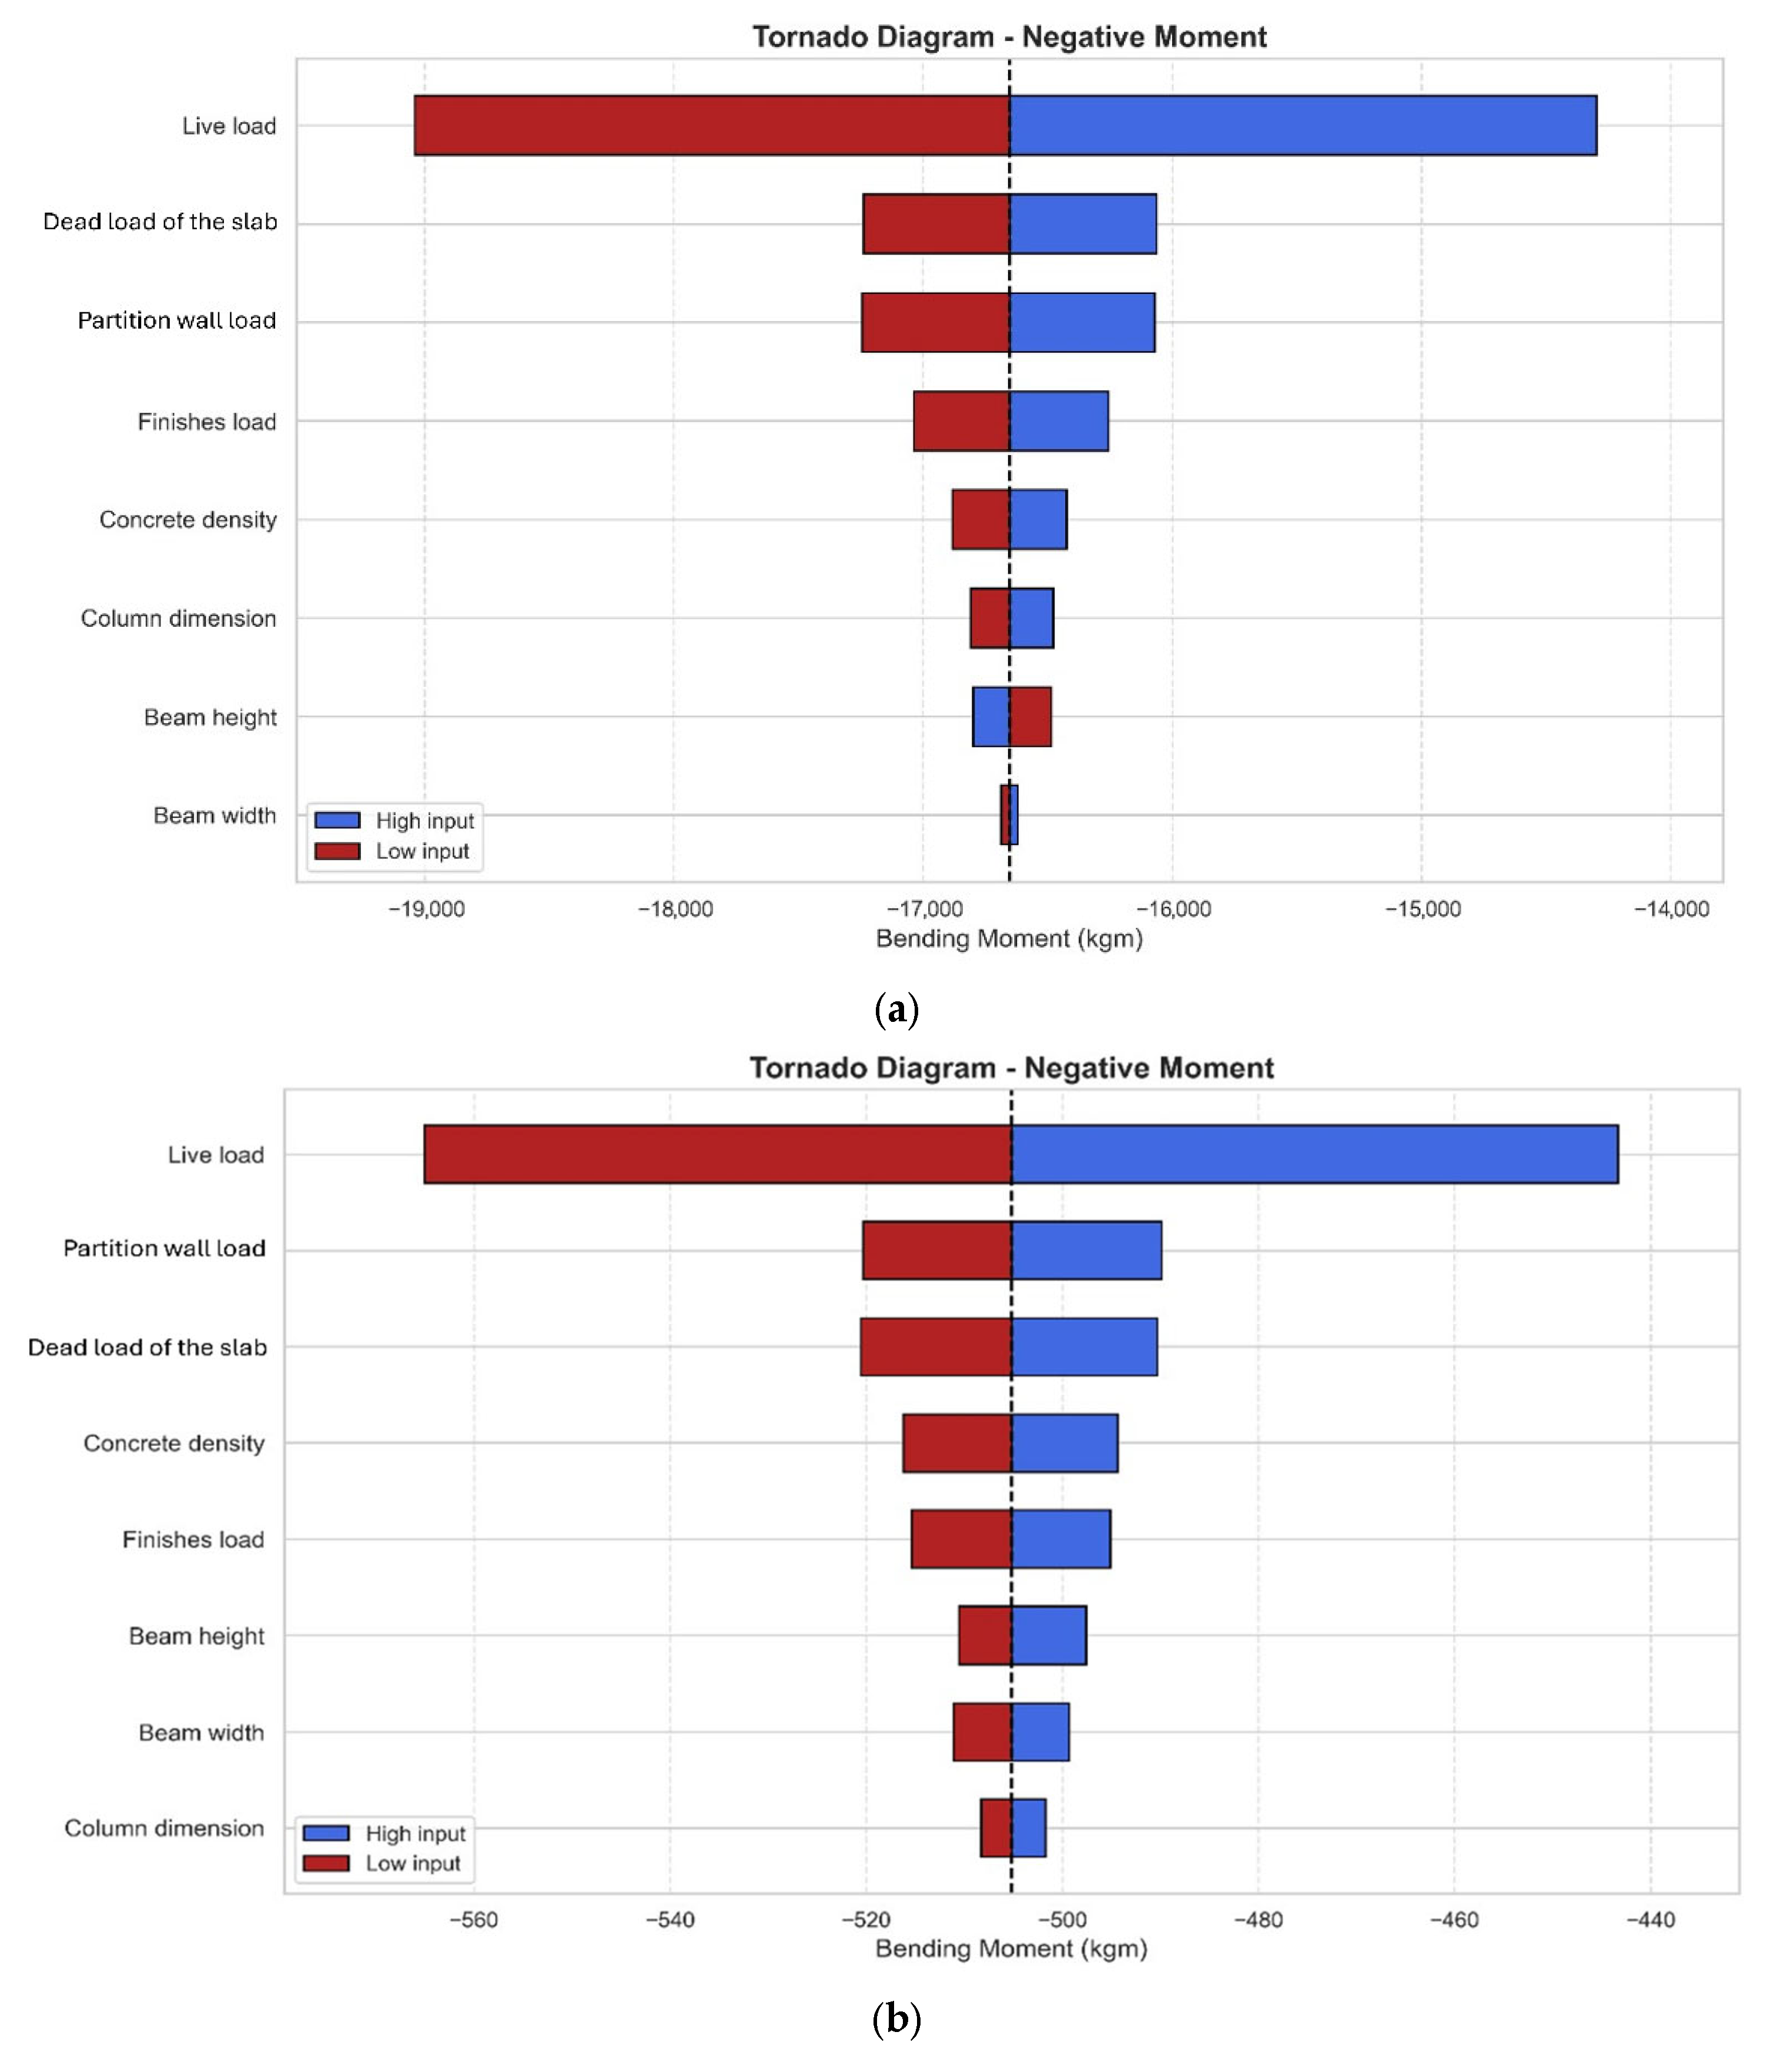
The sensitivity analysis for negative moments is presented in Figure 9. Similarly to the case of positive moments, live load is the most influential variable for both beam types. Variables related to applied loads are the most significant contributors to the variability of negative moments.

3.2.1. Comparison of Deterministic and Probabilistic Values

Deterministic values provide a single estimate of structural behavior, whereas probabilistic values capture variability due to the uncertainty of the parameters used to compute bending moments in beams. This comparison allows the evaluation not only of expected moments under average conditions but also of potential extreme scenarios. By considering parameter uncertainty, the deterministic value is compared against the probabilistic values exceeding the 95% probability threshold, representing the likely range of actual bending moments.

3.2.2. Primary Beams

As shown in Table 6, the highest variability in positive moments is observed in Frame 1, with a variation of 21.86%, while the lowest is found in Frame 9 with 19.20%. Regarding negative moments, Table 7 reveals that Frame 2 shows the highest variation at 20.64%, whereas Frame 9 presents the lowest at 18.66%.

3.2.3. Secondary Beams

As shown in Table 8, the highest variability in positive moments for secondary beams is found in Frame 1 (11.16%), whereas the lowest is in Frame 10 (8.71%). For negative moments (Table 9), the maximum variation is again in Frame 1 (6.92%), and the minimum is observed in Frame 9 (6.67%).

3.3. Comparative Reinforcement Demand Under Deterministic and Probabilistic Moments

The analysis focused on the negative bending moments of the main beams, since these regions govern the design of top reinforcement in continuous spans and are particularly sensitive to the adopted load model. The reinforcement requirements were calculated in accordance with the Peruvian Concrete Code E.060, assuming a concrete compressive strength of f c = 210 kg/cm2 and a steel yield strength of f y = 4200 kg/cm2. Table 10 summarizes the comparison between reinforcement areas obtained from deterministic and probabilistic ultimate moments for ten representative frames. Here, A s 1   corresponds to the steel area derived from deterministic moments, while A s 2 corresponds to the steel area associated with the probabilistic demand (P90). The percentage variation indicates the relative increase in reinforcement required when uncertainties are explicitly accounted for.
The results show that, across all frames, the required reinforcement area increases by approximately 19–21% when probabilistic effects are considered. For instance, in Frame 10 the reinforcement area grows from 14.55 cm2 to 17.45 cm2. This systematic increase highlights the practical implications of adopting a probabilistic framework: the inclusion of uncertainties in material and load parameters dire.

4. Discussion of Results

4.1. Research Gaps and Contributions

The calculation of ultimate moments using probabilistic methods, in contrast to deterministic approaches, allows the incorporation of uncertainty into structural analysis. The present study demonstrated that incorporating uncertainty in the analysis of primary beams results in an average increase of 20.49% in positive bending moments and 19.63% in negative bending moments. In secondary beams, the effect is lower, with increases of 9.41% and 6.78% for positive and negative moments, respectively. These findings suggest that 2 deterministic values commonly used in beam design may underestimate actual structural demands, particularly in primary beams where load transfer is concentrated. For engineering practice, this implies that reinforcement areas based on deterministic bending moments may be unconservative, potentially affecting safety margins and serviceability. Conversely, explicitly considering probabilistic variability provides a more robust basis for structural design and highlights the necessity of integrating uncertainty into routine calculations. It is important to emphasize that the reinforcement design was carried out in accordance with the Peruvian Standard E.060, ensuring consistency with national regulatory practice. However, the probabilistic methodology applied in this study is not currently implemented within Peru. This highlights its innovative character and potential to complement existing design approaches, offering a more comprehensive framework for structural assessment in the local context. By quantifying the magnitude of demand increases, the results contribute directly to assessing the adequacy of rebar sizing and design margins under realistic variability conditions.

4.2. Study Limitations

This study considered a sample of 10 independent frames and only gravity loads were taken into account. The exclusion of seismic and other lateral actions was intentional, aiming to isolate the contribution of gravity-induced demands. However, given their critical importance in reinforced concrete frames located in seismic regions, the present results should not be extrapolated to lateral performance. Instead, these effects are reserved for future, more specialized studies where their probabilistic variability can be rigorously modeled. Another limitation lies in the scope of the probabilistic analysis: the present work quantifies variability in bending moment demands but does not evaluate structural capacity or compare demand distributions against probabilistic resistance models. The results obtained allow for estimating reinforcement areas in accordance with Standard E.060, but reliability indices and failure probabilities are not provided. Therefore, the study should be interpreted as a contribution to the understanding of variability in structural demand, rather than as a direct safety or reliability assessment. In addition, key material properties such as concrete compressive strength ( f c ) and reinforcement yield strength (fy) were not modeled as random variables. This omission is justified because the bending moments calculated with OpenSeesPy through elastic analysis depend on geometry, stiffness, and applied loads, but not directly f c or f y . Nevertheless, these properties are fundamental for capacity evaluation, and their exclusion implies that the present study cannot provide complete reliability indices. Additionally, the analysis focuses on the initial condition of the structure. Long-term deterioration mechanisms such as corrosion-induced section loss, creep, and shrinkage were not included, restricting the applicability of the results to as-built or short-term conditions. The study also relies on a limited sample size of ten frames with specific span arrangements. While these reflect common local practice, the conclusions must be interpreted within this scope.

4.3. Future Research

This study can serve as a basis for application in a real building project, where the flexural moments affecting each existing beam are analyzed using the methodology proposed in this research, also considering seismic effects and their associated uncertainty. Future studies should incorporate demand-to-capacity comparisons by explicitly modeling key material properties, such as concrete compressive strength ( f c ) and steel yield strength ( f y ), as random variables within the Monte Carlo framework. The inclusion of deterioration mechanisms, such as chloride-induced corrosion, creep, and shrinkage, would also allow for extending the applicability of the method to life cycle and durability assessments. Furthermore, the Monte Carlo method could be extended to analyze other structural elements such as columns, slabs, or shear walls. Integrating different sources of uncertainty into probabilistic models would provide a more comprehensive framework for reliability assessment. Finally, experimental validation or field data calibration is recommended to enhance the robustness of the conclusions and support their adoption in engineering practice.

5. Conclusions

This research concludes that a probabilistic analysis for the calculation of the bending moment acting on beams, using Monte Carlo simulation, allows for modeling the variability that the moment may experience due to the uncertainty of parameters such as the specific weight of concrete, beam and column dimensions, and applied loads. Compared to the deterministic approach, the method used in this research shows that for primary beams, the positive moment may increase by an average of 20.49%, while negative moments may increase by up to 19.63%. Although the effect is smaller in secondary beams, an average variation of 9.41% for positive moments and 6.78% for negative moments is still observed. Additionally, the sensitivity analysis reveals a direct relationship between the live load factor and the moments, with this factor being the most influential, followed by permanent loads. This highlights the relevance of Standard E.020 for load assignment according to the use and function of the spaces. A change in use, such as converting a bedroom into a storage room, entails a significant increase in the live load applied on the slab and, consequently, in the structural demand of the beam. Therefore, it is essential to correctly define the intended use of the space, and for the standard to adequately address the live loads associated with each type of occupancy. The variability in bending moment calculation—ignored in conventional design—directly affects structural safety. This study focuses on the acting moment, in contrast to previous studies that concentrate on ultimate resistance. It is concluded that the applied methodology enables a more rigorous structural performance analysis by considering the effects generated by the variables. Its integration as a complement to resistance-based design allows for a more realistic and safer evaluation of the structure; thus, it is recommended that this methodology be applied in future real-world projects.

Author Contributions

Conceptualization, D.L.; methodology, D.L.; software, D.L.; validation, D.L. and J.H.; formal analysis, D.L., investigation, D.L.; resources, D.L., A.H. and J.H.; data curation, D.L.; writing—original draft preparation, D.L.; writing—review and editing, D.L., A.H., J.H. and V.A.F.; visualization, D.L. and A.H.; supervision, D.L. and V.A.F.; project administration, D.L. and V.A.F.; funding acquisition, V.A.F. All authors have read and agreed to the published version of the manuscript.

Funding

This research received no external funding. The APC was funded by Ariza Ingenieros Consulting Firm.

Data Availability Statement

The script developed for this study is openly available at [https://github.com/DarkDemasi/Monte-Carlo-Bending-Moments-in-Reinforced-Concrete-Beams] (accessed on 7 September 2025).

Conflicts of Interest

The authors declare no conflict of interest.

References

  1. Steenbergen, R.D.J.M.; Vrouwenvelder, A.C.W.M. The JCSS probabilistic model Code, future developments. Struct. Saf. 2024, 113, 102540. [Google Scholar] [CrossRef]
  2. Ribeiro, L.d.R.; Kroetz, H.M.; Parisi, F.; Beck, A.T. Optimal risk-based design of reinforced concrete beams against progressive collapse. Eng. Struct. 2024, 300, 117158. [Google Scholar] [CrossRef]
  3. American Concrete Institute. Building Code Requirements for Structural Concrete and Commentary (ACI 318-19); American Concrete Institute: Farmington Hills, MI, USA, 2019. [Google Scholar]
  4. Jahani, E.; Shayanfar, M.A.; Barkhordari, M.A. A new adaptive importance sampling Monte Carlo method for structural reliability. KSCE J. Civ. Eng. 2012, 17, 210–215. [Google Scholar] [CrossRef]
  5. Scherer, M.; Titello, E.P.; Morsch, I.B.; Real, M.d.V.; Filho, A.C. Comparison of two FORM methodologies for reinforced concrete beams under flexure. Lat. Am. J. Solids Struct. 2021, 18, e402. [Google Scholar] [CrossRef]
  6. Associação Brasileira de Normas Técnicas. NBR 6118:2014–Projeto de Estruturas de Concreto–Procedimento; ABNT: Rio de Janeiro, Brazil, 2014. [Google Scholar]
  7. Ramezanianpour, A.A.; Miyamoto, A. Concrete Carbonation Modelling and Monte Carlo Simulation Method for Uncertainty Analysis of Stochastic Front Depth. Yamaguchi Univ. Fac. Eng. Res. Rep. 2000, 50, 149–152. [Google Scholar]
  8. Ahsana, P.V.; Rao, K.B.; Anoop, M.B. Stochastic analysis of flexural strength of RC beams subjected to chloride induced corrosion. Mater. Res. 2015, 18, 1224–1241. [Google Scholar] [CrossRef]
  9. Zhou, S.; Zhang, J.; Zhang, Q.; Chen, W. Uncertainty theory-based structural reliability analysis and design optimization under epistemic uncertainty. Appl. Sci. 2022, 12, 2846. [Google Scholar] [CrossRef]
  10. Li, Z.; Liu, X.; Kou, D.; Hu, Y.; Zhang, Q.; Yuan, Q. Probabilistic models for the shear strength of RC deep beams. Appl. Sci. 2023, 13, 4853. [Google Scholar] [CrossRef]
  11. Nunes, J.H.C.; Junior, E.T.d.L.; de Lima, F.B. Reliability Analysis of Serviceability Limit States of Beams in a Benchmark Reinforced Concrete Building. XLV Ibero-Latin American Congress on. Comput. Methods Eng. 2024, 6, 10428. [Google Scholar]
  12. Félix, E.F.; Falcão, I.d.S.; dos Santos, L.G.; Carrazedo, R.; Possan, E. A Monte Carlo-based approach to assess the reinforcement depassivation probability of RC structures: Simulation and analysis. Buildings 2023, 13, 993. [Google Scholar] [CrossRef]
  13. Kim, S.H.; Boldoo, T.; Kim, D.Y.; Chu, I.; Woo, S.K. Probabilistic Moment Capacity Models of Reinforced Concrete Slab Members for Underground Box Culverts. Appl. Sci. 2021, 11, 8520. [Google Scholar] [CrossRef]
  14. Blagojevic’, P.; Blagojevic’, N.; Kukaras, D. Flexural Behavior of Steel Fiber Reinforced Concrete Beams: Probabilistic Numerical Modeling and Sensitivity Analysis. Appl. Sci. 2021, 11, 9591. [Google Scholar] [CrossRef]
  15. Zhang, Y.; Li, J.; Chen, H. Reliability Analysis of Flexural Capacity of Reinforced Concrete Beams Using Monte Carlo Simulation. Materials 2022, 15, 4155. [Google Scholar]
  16. Szép, J.; Habashneh, M.; Lógó, J.; Movahedi Rad, M. Reliability assessment of reinforced concrete beams under elevated temperatures: A probabilistic approach using finite element and physical models. Sustainability 2023, 15, 6077. [Google Scholar] [CrossRef]
  17. Kolo, D.N.; Aguwa, J.I.; Tsado, T.Y.; Abdullahi, M.; Yusuf, A.; Oritola, S.F. Reliability studies on reinforced concrete beam subjected to bending forces with natural stone as coarse aggregate. Asian J. Civ. Eng. 2021, 22, 485–491. [Google Scholar] [CrossRef]
  18. Taj, S.; Karthik, B.M.; Mamatha, N.R.; Rakesh, J. Prediction of reliability index and probability of failure for reinforced concrete beam subjected to flexure. Int. J. Adv. Res. Arts Sci. Eng. Manag. (IJARASEM) 2019, 6, 1–6. [Google Scholar]
  19. Costa, L.G.L.; Santiago, W.C.; Beck, A.T. Probabilistic models for live loads in buildings: Critical review, comparison to Brazilian design standards and calibration of partial safety factors. Rev. IBRACON Estrut. Mater. 2023, 16, e16204. [Google Scholar] [CrossRef]
  20. Kamin’ski, M.; Błon’ski, R. Analytical and numerical reliability analysis of certain Pratt steel truss. Appl. Sci. 2022, 12, 2901. [Google Scholar] [CrossRef]
  21. Tytarenko, R.; Khmil, R.; Blikharskyy, Y.; Katunský, D.; Popovych, V. Development of a Model for Assessing the Reliability of RC Beams Strengthened Under 50% of ULS Load Using Monte Carlo Simulation. Lect. Notes Civ. Eng. 2024, 604, 553–562. [Google Scholar]
  22. Ministerio de Vivienda, Construcción y Saneamiento. Reglamento Nacional de Edificaciones: Norma E.020 Cargas; Ministerio de Vivienda, Construcción y Saneamiento: Lima, Perú, 2006.
  23. Ministerio de Vivienda, Construcción y Saneamiento. Reglamento Nacional de Edificaciones: Norma E.060 Concreto Armado; Ministerio de Vivienda, Construcción y Saneamiento: Lima, Perú, 2020.
Figure 1. Research problem.
Constrmater 05 00072 g001
Figure 2. Procedure for obtaining bending moments.
Constrmater 05 00072 g002
Figure 3. Flowchart of the methodology.
Constrmater 05 00072 g003
Figure 4. (a) Probability distribution of positive bending moments for the main beam of Frame 10, (b) Cumulative distribution function for positive bending moments in the main beam of Frame 10.
Constrmater 05 00072 g004aConstrmater 05 00072 g004b
Figure 5. (a) Probability distribution of positive bending moments for the secondary beam of Frame 10, (b) Cumulative distribution function for positive bending moments in the secondary beam of Frame 10.
Constrmater 05 00072 g005aConstrmater 05 00072 g005b
Figure 6. (a) Tornado diagram for positive bending moments in main beams, (b) Tornado diagram for positive bending moments in secondary beams.
Constrmater 05 00072 g006aConstrmater 05 00072 g006b
Figure 7. (a) Probability distribution of negative bending moments for the main beam of Frame 10; (b) Cumulative distribution function for negative bending moments in the main beam of Frame 10.
Constrmater 05 00072 g007
Figure 8. (a) Probability distribution of negative bending moments for the secondary beam of Frame 10, (b) Cumulative distribution function for negative bending moments in the secondary beam of Frame 10.
Constrmater 05 00072 g008
Figure 9. (a) Tornado diagram for negative bending moments in main beams, (b) Tornado diagram for negative bending moments in secondary beams.
Constrmater 05 00072 g009
Table 1. Geometry of frames with primary and secondary beams.
FrameColumn Height (m)Column (cm)Secondary Beam (cm)Primary Beam (cm)Secondary Span (m)Primary Span (m)
13.0045 × 4525 × 3030 × 453.04.5
23.0050 × 5025 × 3530 × 503.55.0
33.3055 × 5525 × 3535 × 554.06.0
43.3055 × 5525 × 4035 × 604.56.5
53.5065 × 6530 × 4540 × 655.07.0
63.5065 × 6530 × 5040 × 705.57.5
73.7070 × 7035 × 5545 × 756.08.0
83.7070 × 7035 × 6045 × 806.58.5
93.9075 × 7540 × 6550 × 857.09.0
103.9080 × 8040 × 7050 × 908.010.0
Table 2. Summary of uncertain variables.
Variable (Unit)DistributionParameters
Beam width (m)Triangularmin = b − 0.02, max = b + 0.02
Beam height (m)Triangularmin = h − 0.05, max = h + 0.05
Column side (m)Triangularmin = a − 0.02, max = a + 0.02
Concrete density (kg/m3)Normalµ = 2400, σ = 120
Slab dead load (kg/m2)Normalµ = 300, σ = 30
Live load (kg/m2)Normalµ = 250, σ = 100
Finish load (kg/m2)Normalµ = 100, σ = 20
Partition wall load (kg/m2)Normalµ = 150, σ = 30
Table 3. Convergence analysis of Monte Carlo simulations for positive bending moments in the primary beam of frame 6, relative to 10,000 iterations.
Number of
Simulations
MeanRelative
Differences
with Respect to
10,000
95th Percentile
(P95)
Relative
Differences
with Respect to
10,000
100013,009.910.3415,651.800.13
500012,998.060.4315,615.160.37
10,00013,054.200.0015,672.410.00
50,00013,020.530.2615,652.020.13
100,00013,031.310.1815,658.250.09
Table 4. Summary of positive bending moments for main and secondary beams.
FrameMain BeamsSecondary Beams
P50 (kg·m)P95 (kg·m)P50 (kg·m)P95 (kg·m)
12596.753161.50316.73351.46
23560.234315.54449.89495.28
35949.057174.10564.39616.55
48109.729831.12772.85844.88
510,068.5912,081.641074.781171.74
613,054.2015,672.411402.081527.24
716,603.5219,920.731935.072107.61
820,824.0124,981.352446.752670.98
925,723.4530,675.433269.213560.50
1034,396.3141,044.934393.334774.12
Table 5. Summary of negative bending moments for main and secondary beams.
FrameMain BeamsSecondary Beams
P50 (kg·m)P95 (kg·m)P50 (kg·m)P95 (kg·m)
1−3090.40−3719.69−504.12−539.95
2−4569.24−5503.59−731.45−781.66
3−7711.45−9276.79−979.14−1046.49
4−9826.77−11,787.37−1285.72−1373.83
5−13,583.08−16,224.02−1835.83−1963.19
6−16,709.78−19,990.22−2311.35−2466.98
7−21,134.30−25,215.49−3127.09−3340.29
8−25,175.70−30,052.25−3807.73−4065.95
9−31,024.77−36,862.13−5005.26−5343.13
10−44,345.52−52,686.07−6954.30−7436.24
Table 6. Comparison between deterministic and probabilistic analysis of positive bending moments in primary beams.
FrameDeterministic
(kg·m)
Probabilistic P95 (kg·m)Variation (%)
12594.313161.5021.86
23547.264315.5421.66
35944.567174.1020.68
48095.369831.1221.44
510,057.9312,081.6420.12
613,021.9615,672.4120.35
716,606.4519,920.7319.96
820,806.7424,981.3520.06
925,734.6530,675.4319.20
1034,331.8541,044.9319.55
Table 7. Comparison between deterministic and probabilistic analysis of negative bending moments in primary beams.
FrameDeterministic
(kg·m)
Probabilistic P95 (kg·m)Variation (%)
1−3090.55−3719.6920.36
2−4562.07−5503.5920.64
3−7719.65−9276.7920.17
4−9829.22−11,787.3719.92
5−13,588.90−16,224.0219.39
6−16,696.45−19,990.2219.73
7−21,141.70−25,215.4919.27
8−25,187.88−30,052.2519.31
9−31,065.87−36,862.1318.66
10−44,310.12−52,686.0718.90
Table 8. Comparison between deterministic and probabilistic analysis of positive bending moments in secondary beams.
FrameDeterministic
(kg·m)
Probabilistic P95 (kg·m)Variation (%)
1316.17351.4611.16
2449.60495.2810.16
3563.90616.559.34
4772.65844.889.35
51074.161171.749.08
61400.591527.249.04
71933.302107.619.02
82442.652670.989.35
93268.743560.508.93
104391.414774.128.71
Table 9. Comparison between deterministic and probabilistic analysis of negative bending moments in secondary beams.
FrameDeterministic
(kg·m)
Probabilistic P95 (kg·m)Variation (%)
1−505.00−539.956.92
2−732.40−781.666.73
3−979.95−1046.496.79
4−1287.58−1373.836.70
5−1836.79−1963.196.88
6−2312.22−2466.986.69
7−3127.78−3340.296.79
8−3807.60−4065.956.79
9−5008.97−5343.136.67
10−6957.83−7436.246.88
Table 10. Comparison of reinforcement areas for negative bending in main beams.
FrameDeterministic (kg·cm)Probabilistic (kg·cm)As1 (cm2)As2 (cm2)Variation (%)
1−3090.55−3719.692.142.5921.03
2−4562.07−5503.592.813.4121.35
3−7719.65−9276.794.295.1820.75
4−9829.22−11,787.374.976.0020.72
5−13,588.90−16,224.026.297.5620.19
6−16,696.45−19,990.227.148.6120.59
7−21,141.70−25,215.498.3710.0520.07
8−25,187.88−30,052.259.3111.1719.98
9−31,065.87−36,862.1310.7512.8319.35
10−44,310.12−52,686.0714.5517.4519.93
Disclaimer/Publisher’s Note: The statements, opinions and data contained in all publications are solely those of the individual author(s) and contributor(s) and not of MDPI and/or the editor(s). MDPI and/or the editor(s) disclaim responsibility for any injury to people or property resulting from any ideas, methods, instructions or products referred to in the content.