Article

Innovative Composite Aggregates from Thermoplastic Waste for Circular Economy Mortars

by
Abdelhak Badache
1,2,
Noureddine Latroch
1,2,
Mostefa Hacini
1,2,*,
Ahmed Soufiane Benosman
1,3,*,
Mohamed Mouli
1,
Yassine Senhadji
1,4 and
Walid Maherzi
5,6,*
1
LABMAT Laboratory, Department of Civil Engineering, ENPO Maurice Audin, BP 1523, El Mnaouer, Oran 31000, Algeria
2
Innovative Materials Laboratory and Renewable Energies (LMIER), Department of Civil Engineering and Publics Works, University of Relizane, Bourmadia City, Relizane BP 48000, Algeria
3
Ecole Supérieure en Sciences Appliquées de Tlemcen, ESSAT, BP 165 RP, Bel Horizon, Tlemcen 13000, Algeria
4
Department of Civil Engineering, University of Mascara, BP 736 Route de Mamounia, Mascara 29000, Algeria
5
Centre for Materials and Process, IMT Nord Europe, Institut Mine-Télécom, F-59000 Lille, France
6
Laboratory of Civil Engineering and Geo-Environment (LGCgE), University of Lille, Research Unit ULR 4515, F-59000 Lille, France
*
Authors to whom correspondence should be addressed.
Constr. Mater. 2025, 5(3), 58; https://doi.org/10.3390/constrmater5030058
Submission received: 22 June 2025 / Revised: 1 August 2025 / Accepted: 8 August 2025 / Published: 20 August 2025

Abstract

This study investigates sustainable mortars using lightweight synthetic sand (LSS), made from dune sand and recycled PET bottles, to replace natural sand (0–100% by volume). This aligns with circular economy principles by valorizing plastic waste into a construction aggregate. LSS is produced via controlled thermal treatment (250 ± 5 °C, 50–60 rpm), crushing, and sieving (≤3.15 mm), leading to a significantly improved interfacial transition zone (ITZ) with the cement matrix. The evaluation included physico-mechanical tests (density, strength, UPV, dynamic modulus, ductility), thermal properties (conductivity, diffusivity, heat capacity), porosity, sorptivity, alkali–silica reaction (ASR), and SEM. The results show LSS incorporation reduces mortar density (4–23% for 25–100% LSS), lowering material and logistical costs. While compressive strength decreases (35–70%), these mortars remain suitable for low-stress applications. Specifically, at ≤25% LSS, composites retain 80% of their strength, making them ideal for structural uses. LSS also enhances ductility and reduces dynamic modulus (18–69%), providing beneficial flexibility. UPV decreases (8–39%), indicating improved acoustic insulation. Thermal performance improves (4–18% conductivity reduction), suggesting insulation applicability. A progressive decrease in sorptivity (up to 46%) enhances durability. Crucially, the lack of ASR susceptibility reinforces long-term durability. This research significantly contributes to the repurposing of plastic waste into sustainable cement-based materials, advancing sustainable material management in the construction sector.

1. Introduction

In line with sustainable development imperatives, the conservation of natural resources and the reduction of environmental pollution have become crucial. In this context, plastic waste has evolved from a mere nuisance to a valuable resource. To fully harness its potential in a circular economy, it is essential to implement effective waste management policies and innovative recycling methods [1,2]. In Algeria, Africa’s largest country, over 13.1 million tons of household waste were generated in 2019, 15.31% of which was plastic [3]. The main challenge lies in the disposal of this waste, which is often buried or incinerated. However, a recent trend is emerging: the use of recycled plastic waste as artificial aggregates to replace natural aggregates in cementitious materials [4].This innovative approach contributes to both waste management and the production of more environmentally friendly building materials.
It has been shown that the properties of the incorporated aggregates have a significant impact on the quality of concrete [5,6,7,8], which means that their selection and the proportions used are highly important. Lightweight aggregates (LWAs) are used in cementitious materials because they possess several advantages, such as their reduced density as well as their insulating and soundproofing properties [9].
The direct use of recycled plastics as aggregates or fibers in construction materials has shown promising results [10,11,12,13,14,15,16,17,18,19]. However, some research has focused on an indirect approach: the incorporation of plastic-based synthetic aggregates into concrete [20,21,22,23,24,25,26,27,28,29].
In this context, Kashi et al. [30] and Jansen et al. [31] created synthetic lightweight aggregates (SLAs) from a mixture of fly ash and plastics such as PS, LDPE, HDPE, or various plastic blends. These aggregates were intended for use in concrete and pavements.
Meanwhile, Binici et al. [32] developed cement-free concretes using 33.3% by weight of PET, which was mechanically ground into fibers. These fibers were mixed with different types of sand at temperatures between 200 and 210 °C. The resulting cement-free composites showed satisfactory results, including strengths that were 35% higher than those of control samples containing quartz and limestone.
Lightweight aggregates from plastic waste (WPLAs) have also been produced from PET using granulated blast furnace slag [33] or from PET mixed with river sand [34,35,36].
Bouaziz et al. [37] coated polypropylene beads with a layer of ceramic powder to create lightweight aggregates. This technique increased the concrete’s compressive strength by 8% compared with the direct addition of beads, thanks to better matrix homogenization. Other researchers have also contributed to this field:
  • Alqahtani et al. [38] manufactured recycled plastic aggregates (RPAs) by mixing linear low-density polyethylene (LLDPE) with red sand, fly ash, quarry fines, or silica fumes.
  • Liu et al. [39] demonstrated the feasibility of manufacturing lightweight aggregates by incorporating shredded automotive plastic waste into clay at 1200 °C.
  • Ennahal et al. [40] prepared lightweight aggregates from marine sediments and recycled thermoplastic waste (PP/PS and PP/PE) at mixing temperatures of 200 to 230 °C.
  • Del Rey Castillo et al. [21] developed a lightweight concrete using artificial aggregates made from plastic waste. Their mixture, with a 15% substitution rate, achieved a compressive strength of 20 MPa at 28 days and a density of 1800 kg/m3, demonstrating promising properties for this type of material.
  • Gorak et al. [41] produced lightweight composite aggregates from waste, primarily recycled PET. Their study tested two different production technologies, using various synthesis mechanisms and temperatures to optimize the manufacturing of these aggregates, proving the feasibility of this approach.
  • Erdogmus et al. [42] explored the use of expanded polystyrene (EPS) and waste rubber tire powder (WRTP) in fired clay bricks. They mixed different proportions of EPS and WRTP with clay and fired the mixtures at 1000 °C, aiming to create greener and cleaner constructions.
  • Alahmad et al. [25] showed that adding 3–10% industrial rubber waste to an unsaturated polyester resin-based mortar improved ductility and reduced density and thermal conductivity. While mechanical strength decreased, durability remained comparable to the reference material and met repair standards.
  • Owen et al. [43] reinforced PET matrices with epoxy-coated kenaf fibers (10% by weight). This approach improved the composite’s thermal stability to 409.4 °C and increased its melting peak to 252.8 °C, demonstrating the potential of these natural fibers for advanced applications.
  • Webo et al. [24] designed a sustainable composite from recycled HDPE and denim fibers (0–20%). With 20% fiber content, the strength reached 30 MPa. Despite a reduction in thermal stability, the improved adhesion from MAPP confirms the utility of these composites for rigid structural applications that do not undergo high thermal stress.
According to Sau et al. [44], smooth, flaky plastic aggregates can reduce the bond strength at the interface with cement paste, increasing porosity and permeability. To address this, it is recommended to use finer plastic fractions (granules, powder), treat aggregate surfaces to increase roughness, add pozzolanic admixtures, and create new lightweight aggregates through thermal treatment.
This study investigates the potential of a novel hybrid material—lightweight synthetic sand (LSS)—which combines silica sand and PET plastic waste as a sustainable alternative to natural aggregates in cementitious composites. The novelty of our method for synthesizing LSS aggregates compared with previous studies [34,41,45,46] lies in the following:
  • The LSS manufacturing process ensures precise control of parameters (sand/PET ratio of 35:65, heating temperature of 250 ± 5 °C, and rotation speed of 50–60 rpm), with rigorous thermal selection for optimal fluidization without PET degradation.
  • Controlled cooling at 0.5–1 °C/min allows for optimizing crystallization and minimizing stresses, resulting in a semi-crystalline PET matrix.
  • The LSS is then crushed and sieved to obtain a specific particle size (≤3.15 mm), corresponding to construction sand standards.
The incorporation of LSS demonstrates a significant improvement in the interfacial transition zone (ITZ) with the cement matrix, enhancing the overall bonding quality and potentially contributing to improved mechanical performance and durability. Addressing a critical research gap in plastic-based aggregate applications, we develop a thermal synthesis process to transform two abundant waste streams—discarded PET bottles and dune sand—into high-performance construction materials. Our approach uniquely targets the simultaneous achievement of three essential properties: structural integrity, thermal efficiency, and alkali–silica reaction resistance. Through systematic investigation of the microstructure–property relationships in these composites, this work advances new paradigms for sustainable construction materials that align with circular economy principles while meeting practical engineering requirements.

2. Materials and Methods

2.1. Materials

2.1.1. Cement

This research employs CEM II 42.5 N cement sourced from the LAFARGE Group’s LCO Cement Plant in OGGAZ, a small town in the Mascara Province of northwestern Algeria. The cement exhibits a fineness of 4500 cm2/g and an absolute density of 3.09 g/cm3. Testing revealed average compressive strengths of 22 MPa at 2 days and 48 MPa at 28 days. The chemical composition of the cement is detailed in Table 1, while the mineralogical composition of its clinker is provided in Table 2.

2.1.2. Lightweight Synthetic Sand (LSS)

In this work, the production of lightweight synthesized sand (LSS) from recycled PET bottles and dune sand involves a carefully engineered thermal–mechanical process designed to create sustainable construction materials (Figure 1). The process begins with the collection and sorting of PET bottles, which are cleaned and shredded into 5–15 mm flakes to increase surface area for improved bonding. These PET flakes are then mixed with dune sand (<1 mm) in a precisely controlled 35:65 mass ratio and heated to 250 ± 5 °C at 50–60 rpm rotation speed (Figure 1), a temperature regime carefully selected between PET’s glass transition (75 °C) and melting point (260 °C) to ensure complete polymer fluidization while preventing thermal degradation. During this phase, the dune sand acts as both a thermal stabilizer and structural framework, maintaining dimensional stability while enhancing the composite’s mechanical properties.
Following thermal processing, the molten composite undergoes controlled cooling at 0.5–1 °C/min under ambient conditions to optimize crystallization kinetics and minimize residual stresses, resulting in a material with a semi-crystalline PET matrix. The solidified composite is then crushed and sieved to produce LSS aggregates ≤ 3.15 mm, matching standard construction sand gradations (Figure 1). Characterization reveals that the LSS exhibits a lightweight structure with absolute and apparent densities of 1.68 g/cm3 and 1.02 g/cm3 respectively, representing 36% and 30% reductions compared with natural sand (2.63 g/cm3 and 1.46 g/cm3). The angular morphology of LSS particles promote mechanical interlocking in cementitious matrices, while the material’s low thermal conductivity (0.589 W/m·K) and minimal water absorption (0.04% versus 0.56% for natural sand) derive from PET’s intrinsic properties and the engineered porous microstructure.
Microstructural analysis shows the LSS contains internal porosity contributing to its reduced density and enhanced insulation capabilities. The coarser gradation (fineness modulus 2.93 versus 2.42 for natural sand) and broader particle size distribution (uniformity coefficient 5.83 versus 4.72) influence packing behavior in composite materials. These physical characteristics position LSS as a viable sustainable alternative to natural sand, particularly for applications prioritizing weight reduction and thermal insulation, while maintaining compatibility with conventional construction practices. The 35% PET content represents an optimal balance between mechanical performance and environmental benefits, though the material’s hydrophobic nature requires consideration in cementitious mix designs to ensure proper hydration.
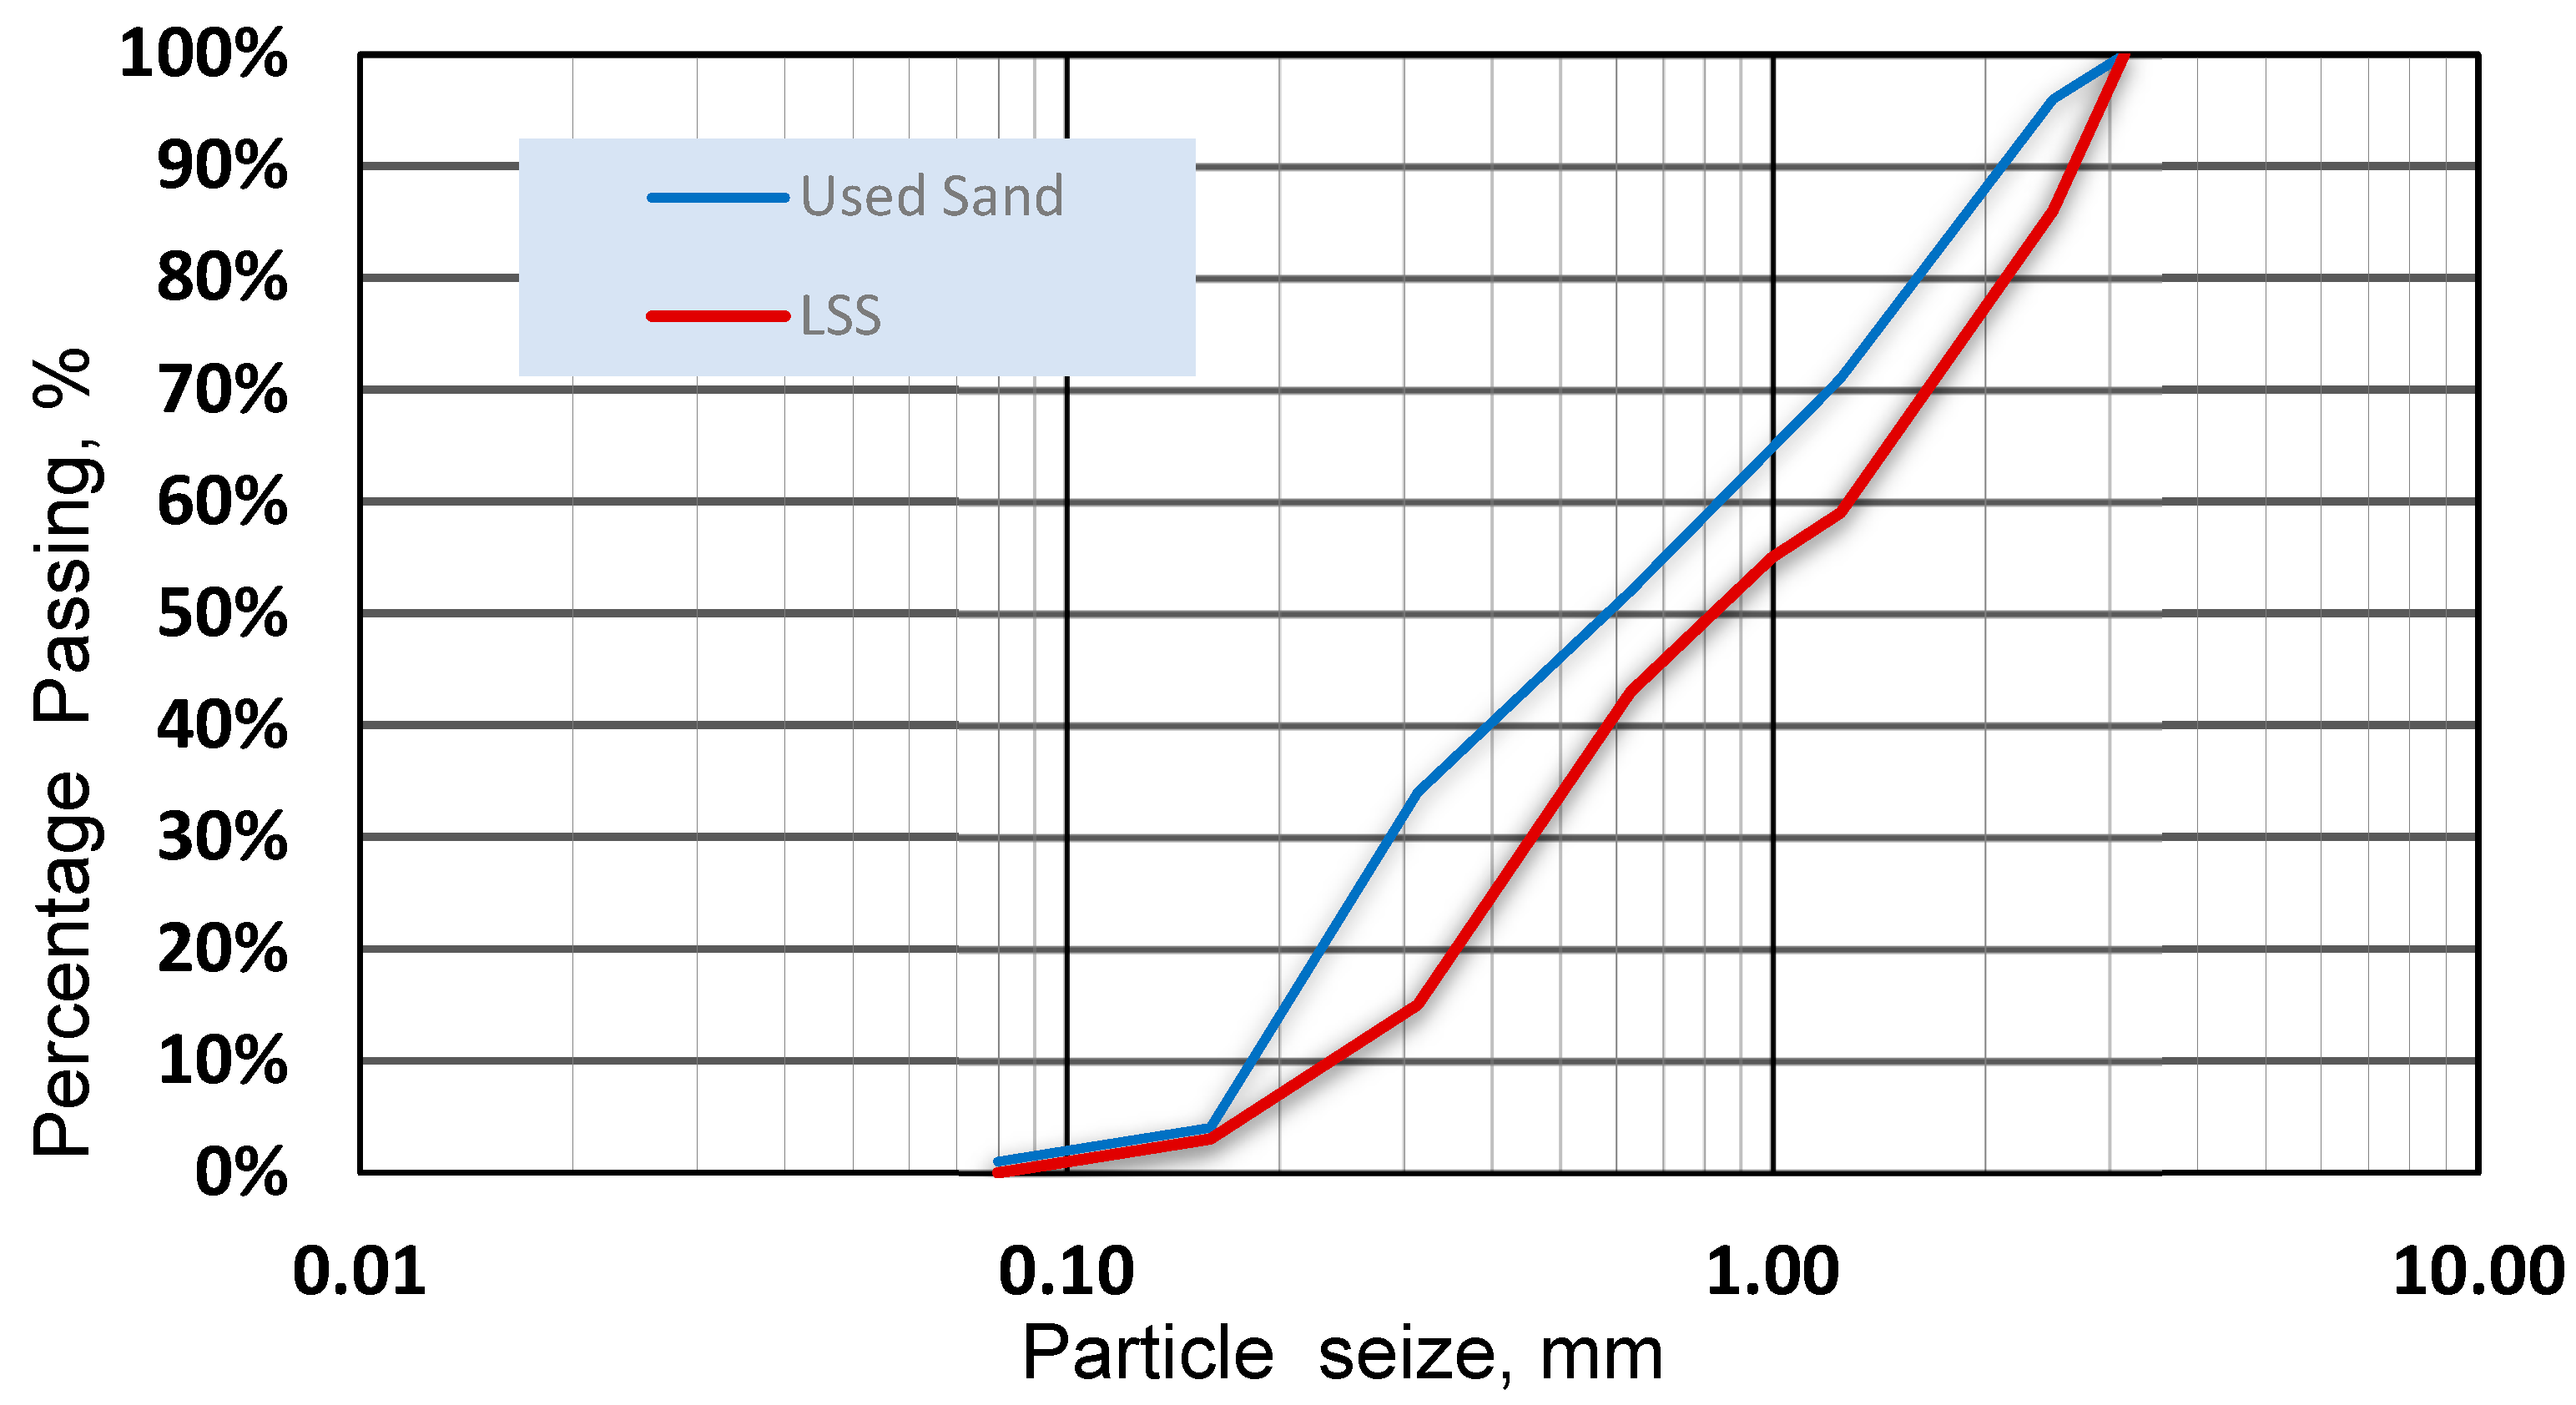
The chemical composition of the two sands, the particle size of LSS and that of the sand used, as well as their physical characteristics are summarized in Table 1, Figure 2, and Table 3, respectively. It is worth noting that the WPSS composite mortars were developed according to the standard EN 196-1 [47]. The sand used was then replaced by the synthesized LSS aggregates, with volume percentages equal to 25, 50, 75 and 100%, as shown in Table 4. For all formulations, the water-to-cement (W/b) ratio was set at 0.5. In addition, the superplasticizer SUPERIOR 9 WG, with a density of 1.10 and a dry extract of 33%, was added in order to achieve an almost homogeneous consistency.

2.2. Experimental Procedure

Prismatic molds of dimensions (4 × 4 × 16 cm3) were cast and then mechanically compacted using an electric shock table [47]. This step was intended to investigate the properties of the samples in the fresh state. The molds were then covered with a plastic film and stored in laboratory conditions. Afterwards, these samples were unmolded after 24 h and then kept in a lime-saturated water environment at temperature T = (20 ± 2) °C and relative humidity RH = 100%, until the moment of testing.

2.3. Testing Methods

2.3.1. Workability

The workability of lightweight mortar-based WPSS specimens was assessed following the EN 459-2 standard [48], utilizing a shaking table for measurement.

2.3.2. Fresh and Dry Densities

The fresh density was determined by measuring the weight and volume of the freshly mixed material. For the dry density (ρd), the specimens were oven-dried at 60 °C over a 15-day period until mass stabilization was achieved, in compliance with Standard NF EN 18-459 [49]. The dry density was then computed using the prescribed equations.
V = M a i r M s a t ρ w a t e r
ρ d = M d V
where Mair is the mass of air-saturated sample, Msat is the mass of water-saturated sample, Md is the mass in the dry state, ρwater is the density of water and V is the total volume.

2.3.3. Mechanical Strength

The mechanical strengths of mortars were determined at 7, 28 and 90 days, according to Standard NF EN 196-1 [47] using a controls brand universal hydraulic press. Three prismatic specimens measuring 4 × 4 × 16 cm3 were used for the flexural strength tests. After testing, the six resulting half-specimens were used to determine the compressive strength. It is worth mentioning that the loading rate was (50 ± 10) N/s for the flexural strength, and (2400 ± 200) N/s for the compressive strength.

2.3.4. Ultrasonic Pulse Velocity Test

The ultrasonic pulse velocity (UPV) technique serves as a non-destructive testing method to evaluate mortar specimens by measuring the transmission time of high-frequency sound waves. This approach provides valuable insights into material homogeneity, detection of internal flaws such as cracks or voids, monitoring of temporal property variations, and assessment of both physical and dynamic material characteristics. All experimental measurements were conducted at the LABMAT laboratory of the ENPO Maurice Audin school, in compliance with ASTM C597-02 [50]. We used a Punditlab ultrasonic testing apparatus manufactured by Proceq (Schwerzenbach, Switzerland), with an accuracy of 0.1 µs (micro second). The measurements were performed on three samples for each mortar formulation to ensure result reliability.

2.3.5. Dynamic Elasticity Modulus (Ed)

The dynamic elastic modulus is calculated by analyzing the velocity of ultrasonic wave propagation through composite materials. It can be determined using the following expression, as reported in previous studies [14,51]:
E d = ( V 2 · ρ / g ) · 10 2
where
Ed = dynamic elastic modulus (GPa)
V = ultrasonic pulse velocity (km/s)
ρ = material density (kg/m3)
g = gravitational acceleration (9.81 m/s2)
The uncertainties of the Ed values are calculated directly from the UPV measurements and their uncertainties.

2.3.6. Thermal Proprieties

The thermal conductivity (λ), thermal diffusivity (a), and calorific capacity (Cp) were directly measured using a calibrated Quick-line ISOMET QTM 30 analyzer, manufactured by Applied Precision (Bratislava, Slovakia), equipped with a 50 mm transient surface probe, in accordance with ASTM D5334-00 [52]. This transient plane source method enables the simultaneous determination of all three parameters by analyzing the response to a controlled heat pulse. Measurements were carried out on three replicate prismatic specimens per mix formulation to ensure statistical reliability. The thermal conductivity measurements were obtained with an accuracy of up to ±5% of the reading, with an additional absolute error of 0.001 W/m·K for low-conductivity materials, and up to ±10% for higher conductivity values.

2.3.7. Scanning Electron Microscopy

Microstructural analysis of the prepared mortar specimens was conducted using a FEI Quanta 250 field emission scanning electron microscope (SEM), manufactured by FEI (Hillsboro, Oregon, USA). This high-resolution imaging technique enabled detailed examination of the cementitious matrix morphology and interfacial transition zones at micron-scale resolution.

2.3.8. Alkali–Silica Reaction

The evaluation of alkali–silica reaction (ASR) was carried out using the accelerated mortar bar test in accordance with ASTM C1260 [53]. The mortar samples measured 20 mm × 20 mm × 160 mm. After 24 h of storage in the molds at 95–100% relative humidity and at room temperature, the specimens were demolded and immersed in water at 80 °C for an additional 24 h of curing. The bars were then submerged in a 1N sodium hydroxide (NaOH) solution, maintained at a constant temperature of 80 °C, for a total duration of 14 days. Although the main evaluation criterion is set at 14 days, measurements were continued up to 66 days for an in-depth analysis of the long-term behavior.
The length changes of the mortar bars were measured at regular intervals. The percentage of length change (ΔL) at a given age (X days) was calculated using (Equation (4)), as follows:
L % = L x L i G × 100
where Lx represents the comparator reading of the test prism at X days minus the comparator reading of the reference bar, Li represents the initial comparator reading at zero day minus the comparator reading of the reference bar, and G represents the nominal gauge length (10 inches).
According to the criteria of the ASTM C1260 [53] standard, a mix is considered acceptable if the expansion of the specimens after 14 days is less than 0.10%. An expansion greater than 0.20% is deemed potentially deleterious. In this study, five mortar mixes, including a reference mix and mixes with varying percentages of WPSS aggregates, were tested. Each mix was prepared with at least three replicate specimens to ensure the accuracy of the results. Length measurements (precision: 0.001 mm) were taken initially and after 1, 3, 7, 14, 21, 28, 36, 43, 60, and 66 days to monitor expansion.

2.3.9. Porosity Accessible to Water

The water-accessible porosity was measured in accordance with ASTM C642 [54] using three cubic specimens of 50 mm dimensions. The samples were first oven-dried at 60 °C until a constant mass was achieved, verified by a weight change of less than 0.1% over successive 2 h intervals. They were then water-saturated by immersion until they achieved successive 24 h mass measurements varying by ≤0.5% (minimum 48 h immersion). Specimen volume was determined through both direct caliper measurement (50 ± 0.2 mm edges) and hydrostatic weighing of saturated samples in distilled water at 23 ± 2 °C, with surface moisture carefully blotted to maintain a saturated-surface-dry condition before final weighing. The porosity (Pa) was calculated as follows:
P a = M a i r M e V
where Mair is the saturated mass, Me the oven-dry mass, and V the geometric volume, with any specimens showing nonlinear saturation kinetics (>5% mass change after 72 h) or hydrostatic measurement variability > 0.3% excluded from analysis. Measurements at 28 and 90 days captured both stabilized hydration porosity and potential late-age microstructural changes, though the lower 60 °C drying temperature (versus standard 105 °C) was specifically employed to prevent degradation of polymeric components in the modified mortar system.

2.3.10. Water Absorption

The sorptivity test, conducted in accordance with ASTM C1585-13 [55], characterizes the kinetics of water absorption in porous materials, where higher sorptivity values indicate greater susceptibility to rapid fluid penetration. This parameter reflects the intrinsic pore structure characteristics that influence durability, specifically the interconnected pore network facilitating capillary water transport under zero hydraulic pressure. Three cubic specimens (50 × 50 × 50 mm3) were preconditioned at 55 °C until constant mass was achieved, followed by placement on supports in a water reservoir with controlled 5 mm immersion depth. All lateral surfaces were sealed with aluminum foil to ensure unidirectional water uptake. Mass gain was recorded at standardized intervals (1, 4, 9, 16, 25, 36, 49, and 64 min) to quantify capillary absorption rates. The sorptivity coefficient (S) was calculated as follows:
Q A = S t
Q = cumulative water absorption (cm3), A = cross-sectional area exposed to water (cm2), t = elapsed time (seconds), S = sorptivity coefficient (cm/√s).

3. Results and Discussion

3.1. Density in the Fresh and Hardened State

Figure 3 and Figure 4 show the effects of synthesized lightweight aggregates (LSA) on the fresh and hardened densities of composite mortars, respectively. It is clear that the fresh density decreased proportionally to the rate of aggregate addition. This decrease was 22% for WPSS100 compared with that of natural witness mortar (NWM).
The above results are consistent with those reported by Alqahtani et al. [38] who found a very small difference, not more than 3%, between the fresh density of LAC (1935 kg/m3) and that of RP2F1C100 (1987 kg/m3). This difference in density helps to reduce the proper weight of the structure during the construction period.
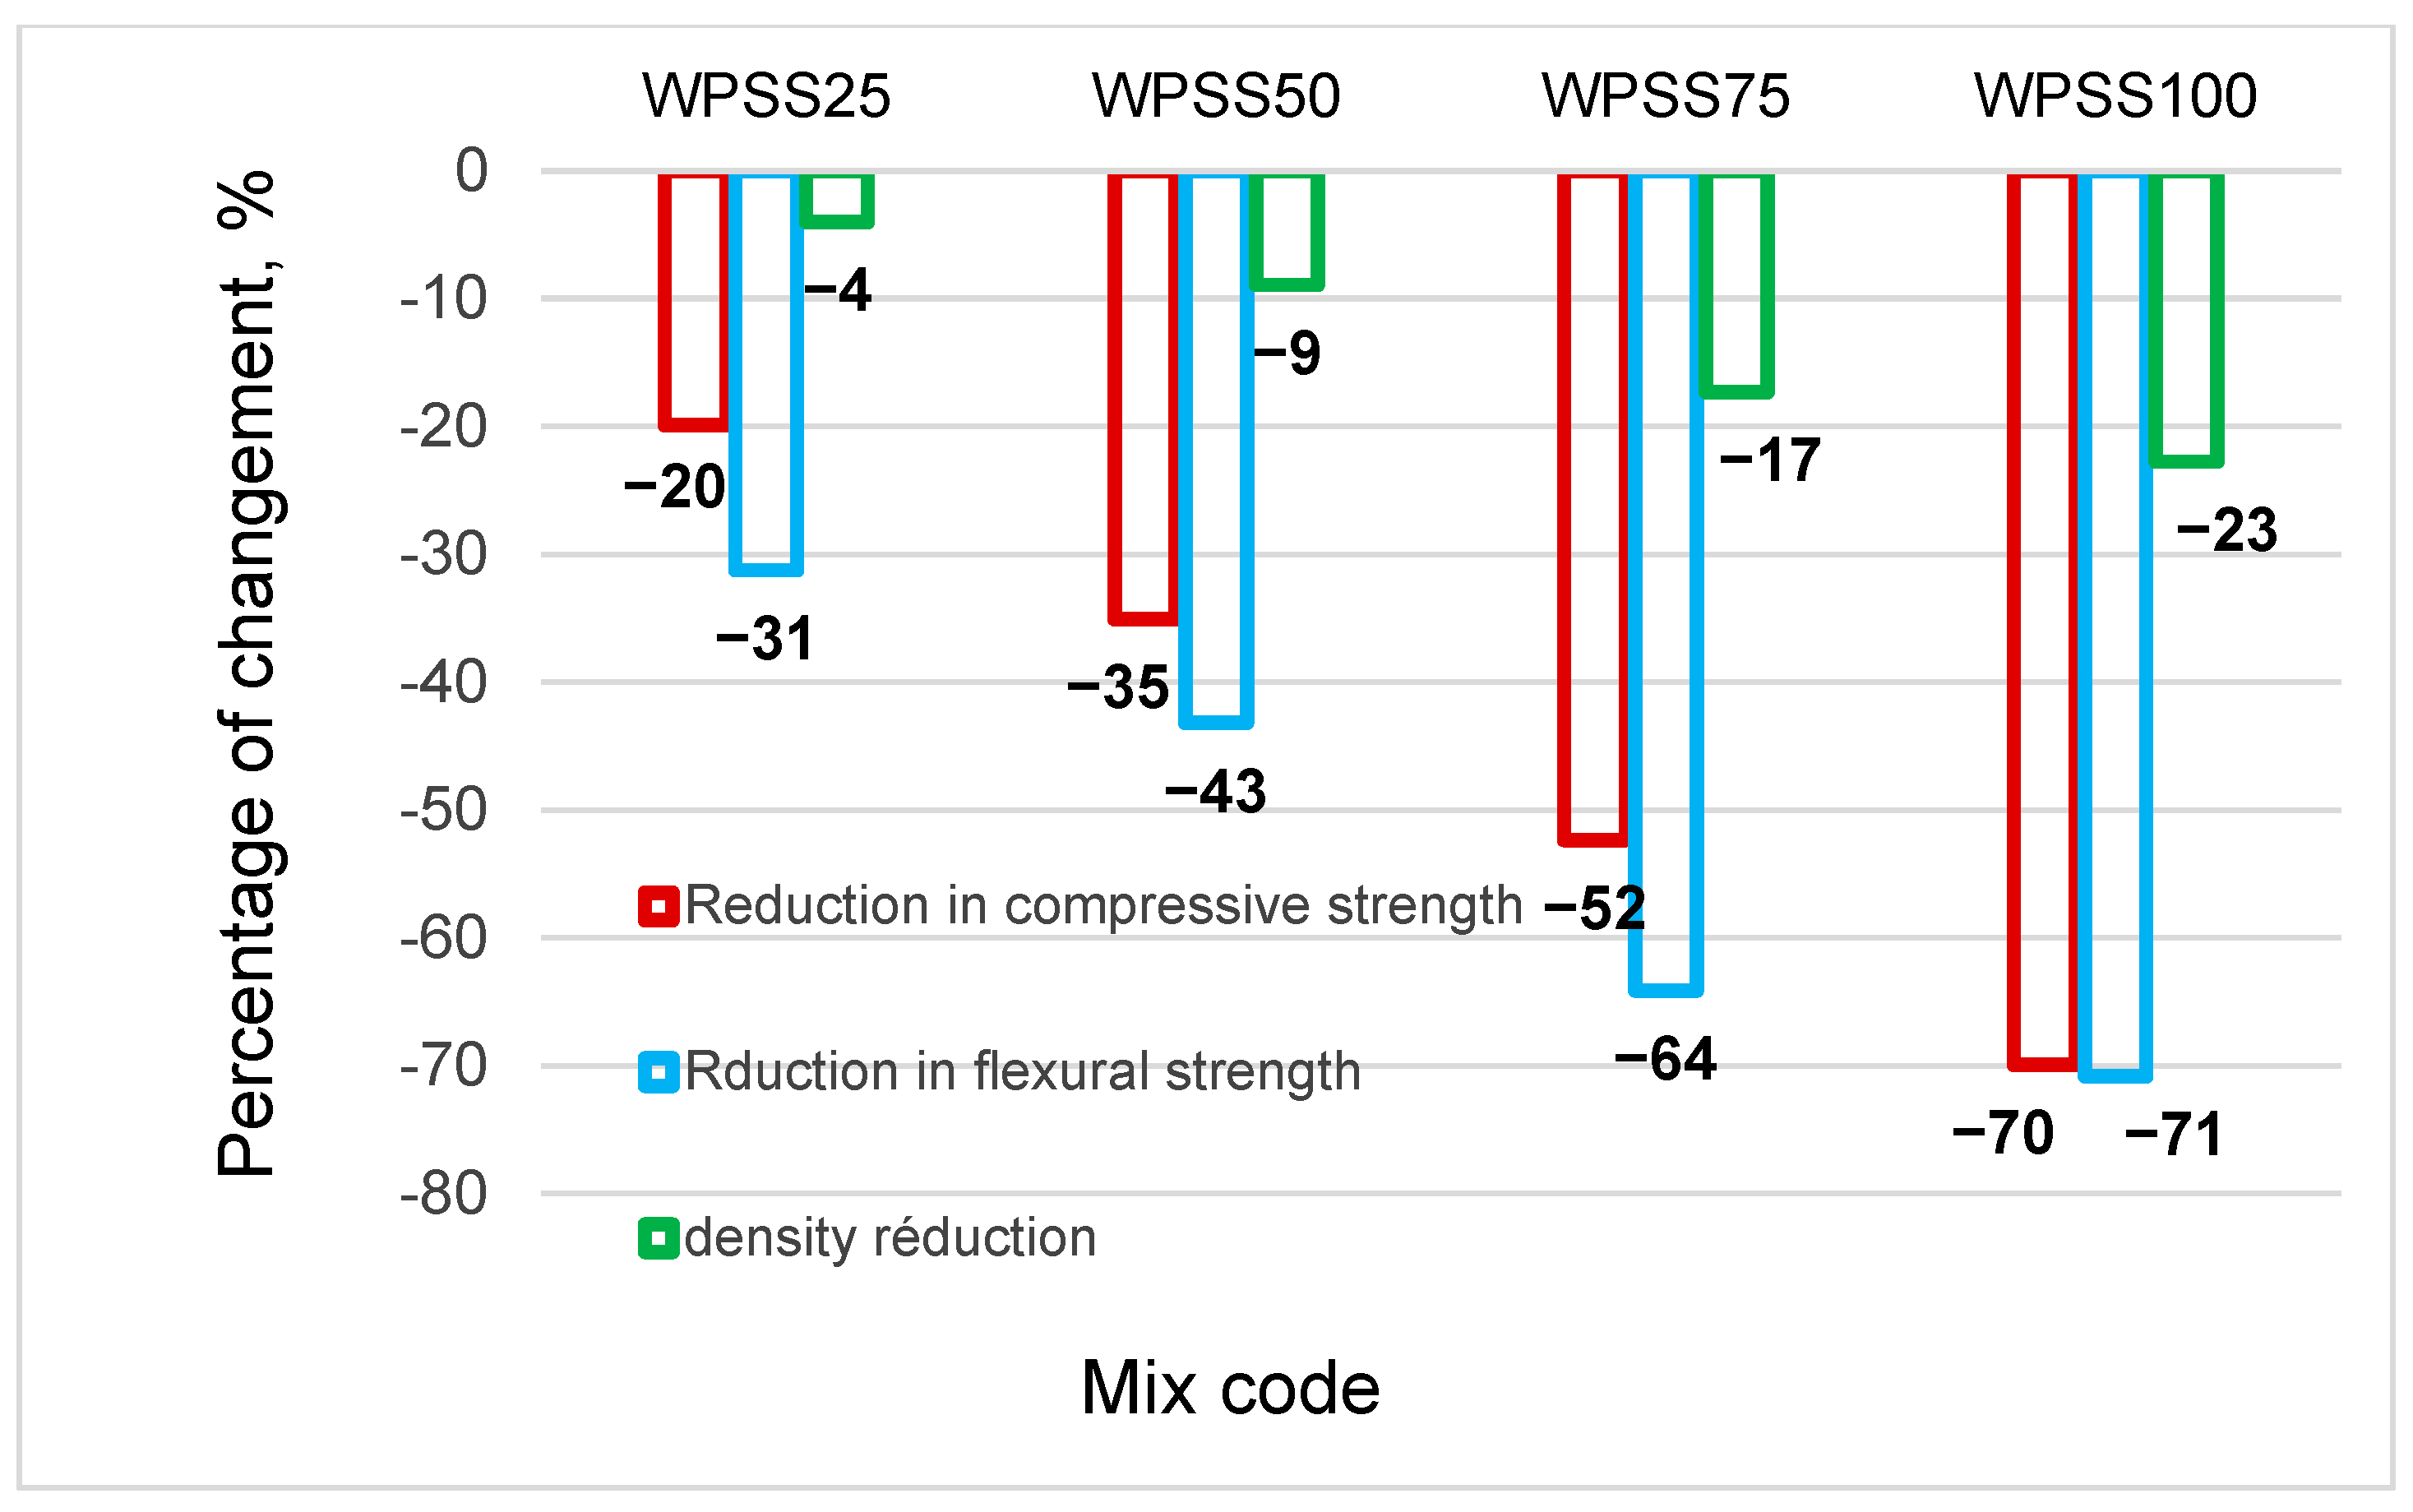
Likewise, a gradual reduction in the hardened density of WPSS composites was also noticed. Indeed, Figure 3 clearly shows that, at 28 days, drops of 4, 9, 17 and 23% were recorded, respectively, for WPSS25, WPSS50, WPSS75 and WPSS100, in comparison with NWM. It should be noted that, in this study, the density of WPSS100 is 1592 kg/m3 because of the low density of LSS (1.68 g/cm3) compared with that of natural sand (2.630 g/cm3). It was also found that the densities of the composites with the replacement percentages 75 and 100% meet well the classification criteria of lightweight aggregate concrete as required by the ACI 213R guide [9]. These results are consistent with those found by [45,56].
Furthermore, Gouasmi et al. [46] found that the densities of composite mortars tend to decrease as the WPLA replacement rate increases, which means that the resulting modified mortar is lighter. The density ranges from 2090 to 2420 kg/m3, which corresponds to a reduction of between 3% and 16% when compared with that of the control mortar. In this regard, Alqahtani et al. [45] have suggested that lightweight composite concrete can be produced with a replacement level of up to 100%, as this can help to reduce the size of the elements used in building and consequently diminish their manufacturing costs.
Moreover, Figure 3 shows the existence of a good correlation between the addition rate and density, with a coefficient of determination R2 = 0.9756 for the fresh mortar density, and R2 = 0.9844 for the hardened mortar density.

3.2. Compressive Strength

Figure 4 and Figure 5 depict the compressive strength values of composite mortars at different time points. It is observed that the compressive strength of all of the mixtures increases with age (7, 28, and 90 days). The low densities of the different composite mortars (Figure 3) indicate that these mortars have different compressive strengths.
It was also revealed that the addition of synthesized aggregates leads to a decrease in strength. In addition, the strength differences between the prepared composite mortars and the control mortar indicate that these different mortars exhibit different performances. These performance differences were found at around 20, 35, 52 and 70% for composites WPSS25, WPSS50, WPSS75 and WPSS100, respectively. These findings are consistent with those reported in other studies that were conducted on other types of composite aggregates, such as those by Gouasmi et al. [46], Alqahtani et al. [45], Ennahal et al. [40], Bouaziz et al. [37] and Binici et al. [32].
Indeed, Gouasmi et al. [46] found that the compressive strength values, at 28 days, evolved negatively for all WPLA composite mortars compared with the unmodified mortar.
Similarly, Alqahtani et al. [45] suggested that the smallest compressive strength reduction was observed for RP2F3A concrete, which was 40% less than that of conventional concrete containing lightweight aggregates (LWAs). In contrast, the maximum compressive strength reduction of 53% was observed for RP1F2A concrete as compared with that of conventional concrete. The authors then confirmed that the RP1F3C0.5 and RP2F3C0.5 formulations met well the strength requirements of Standard ASTM C330 (greater than 17 MPa).
Ennahal et al. [40] compared the compressive strength of the control mortar with those of the MSPE1-30% mortars. They then found that the compressive strength of the MSPE1-30% was 59.77% lower than that of the control mortar, while the strength of the MSPE2-30% was 52.97% lower. These results show that the MSPE2-30% mortar is more resistant than the MSPE1-30% mortar by 14.46%. The authors then concluded that the compressive strength difference between the MSPE1-30% and MSPE2-30% mortars was due to the differences in the cement and aggregates proportions used.
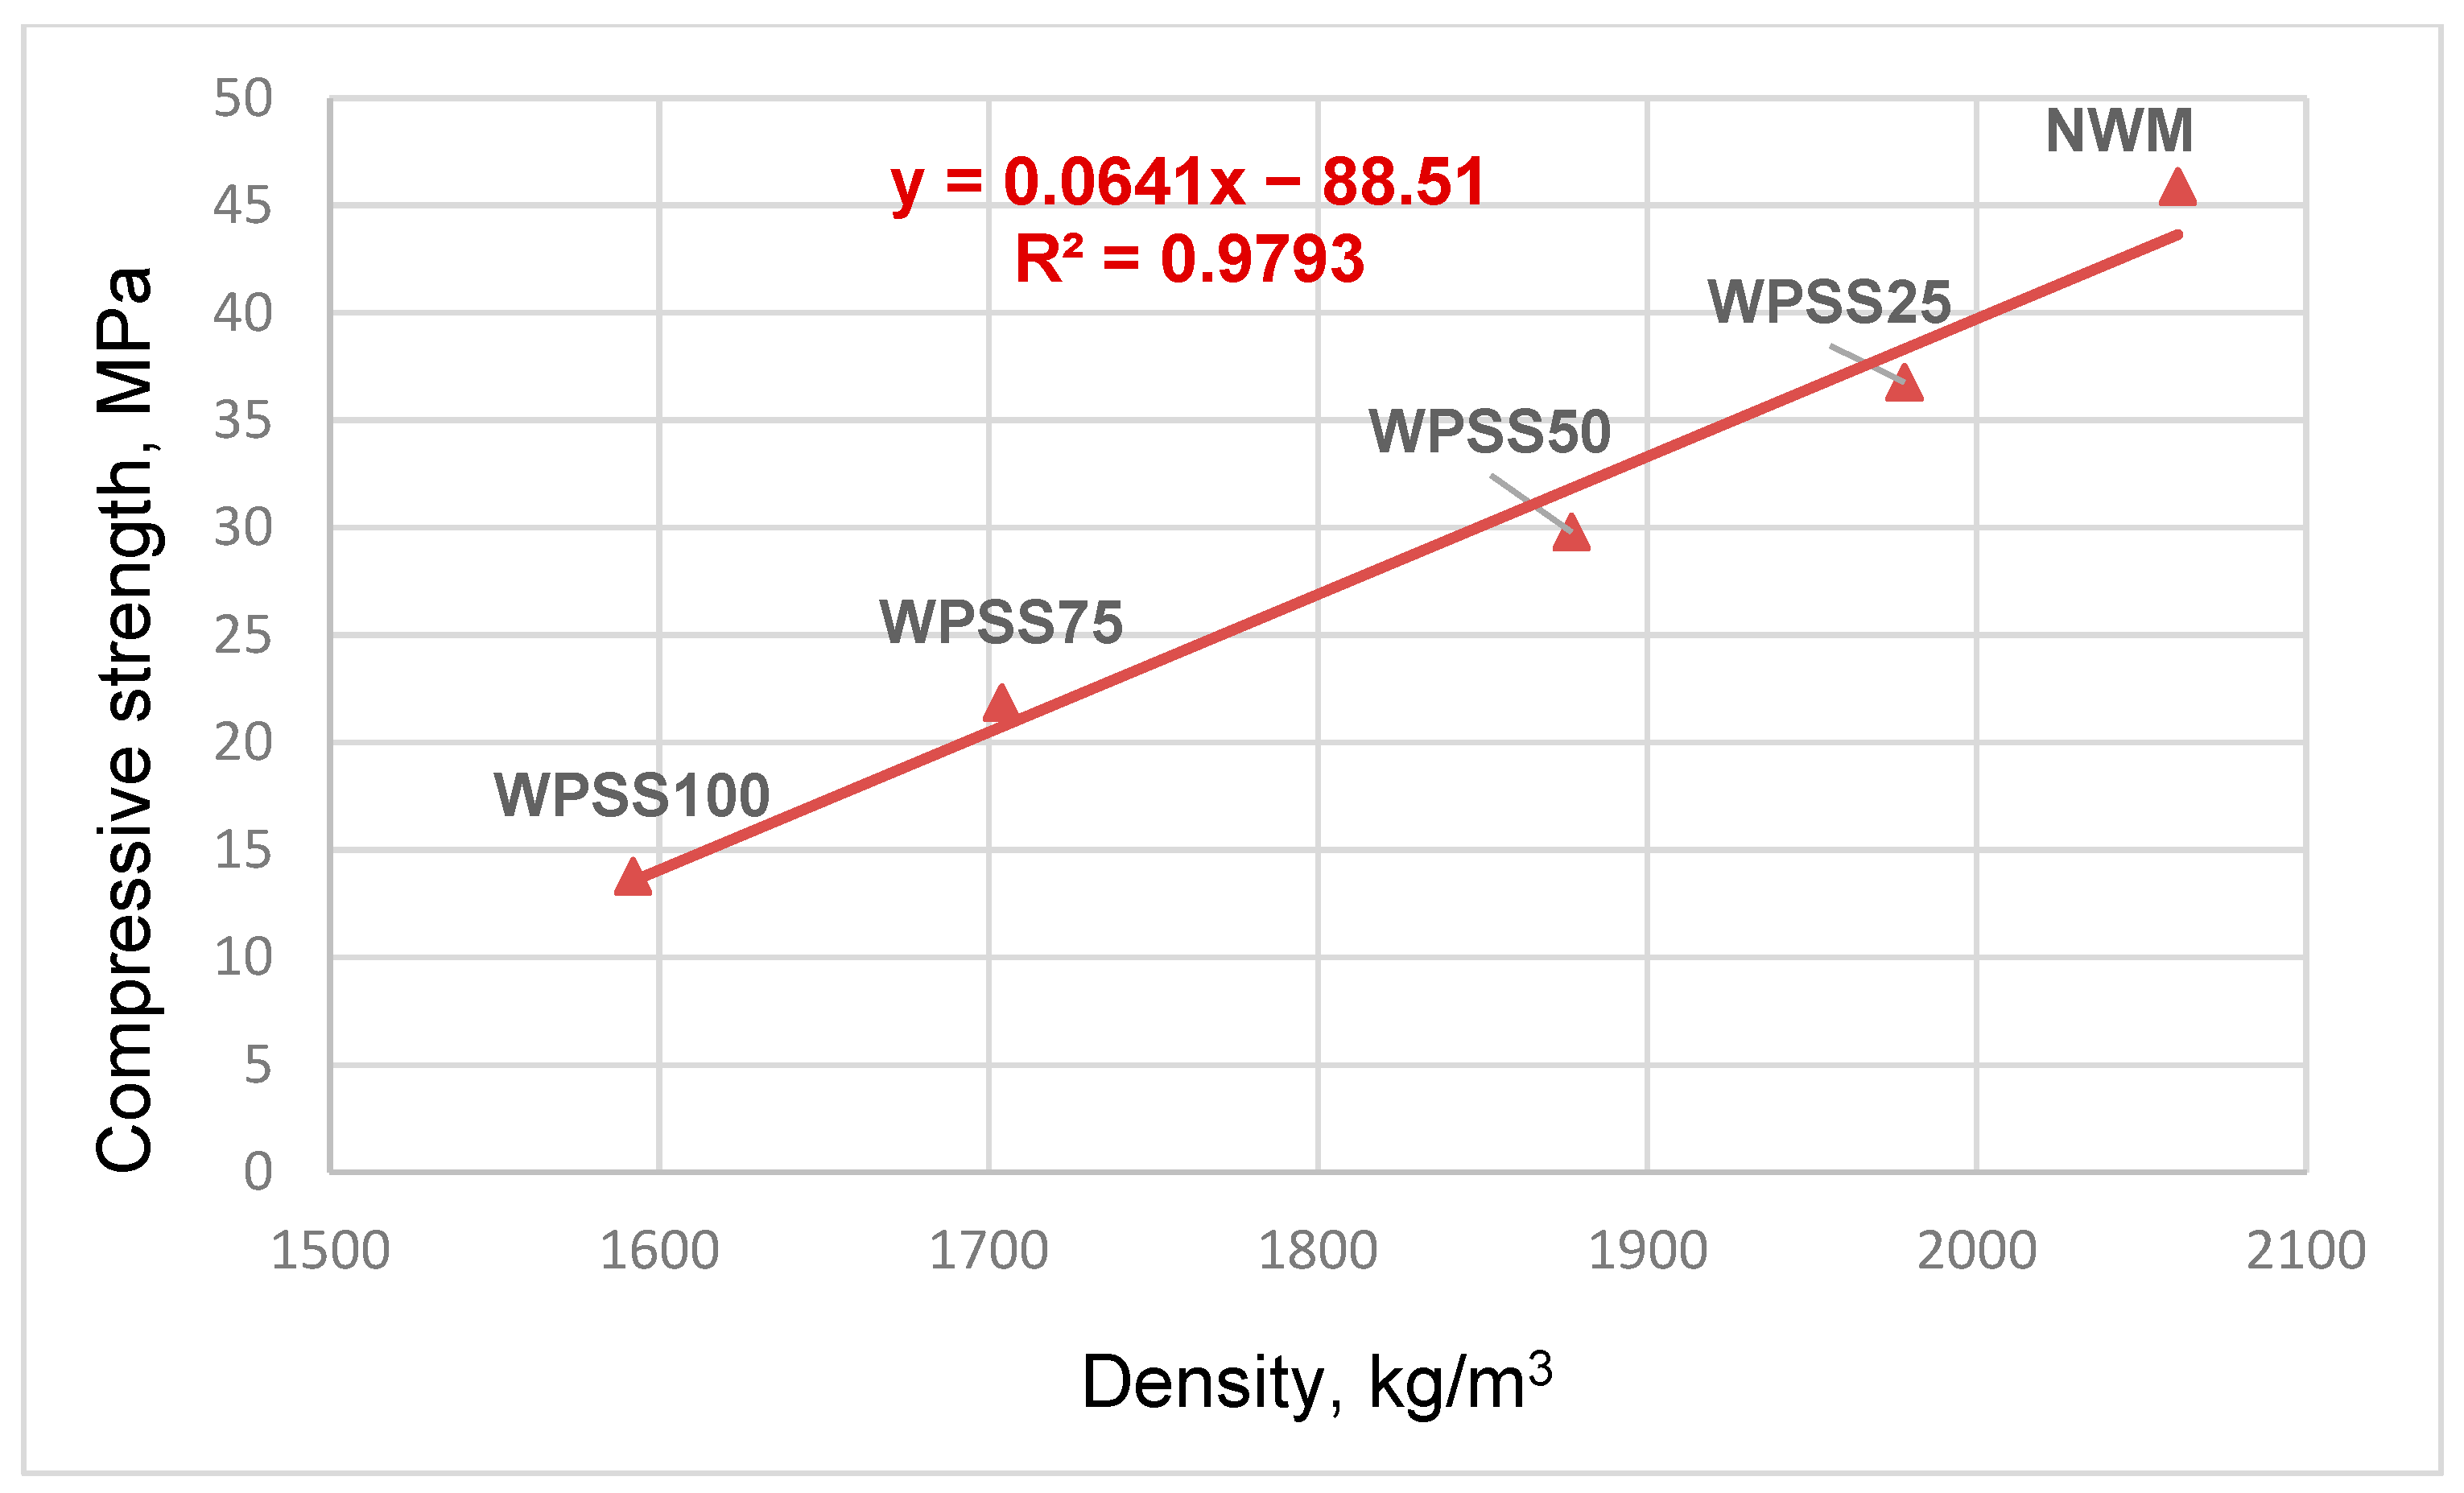
Figure 6 shows a good correlation between the hardened concrete density and the compressive strength at 28 days, with a coefficient of determination R2 = 0.9793.

3.3. Flexural Strength

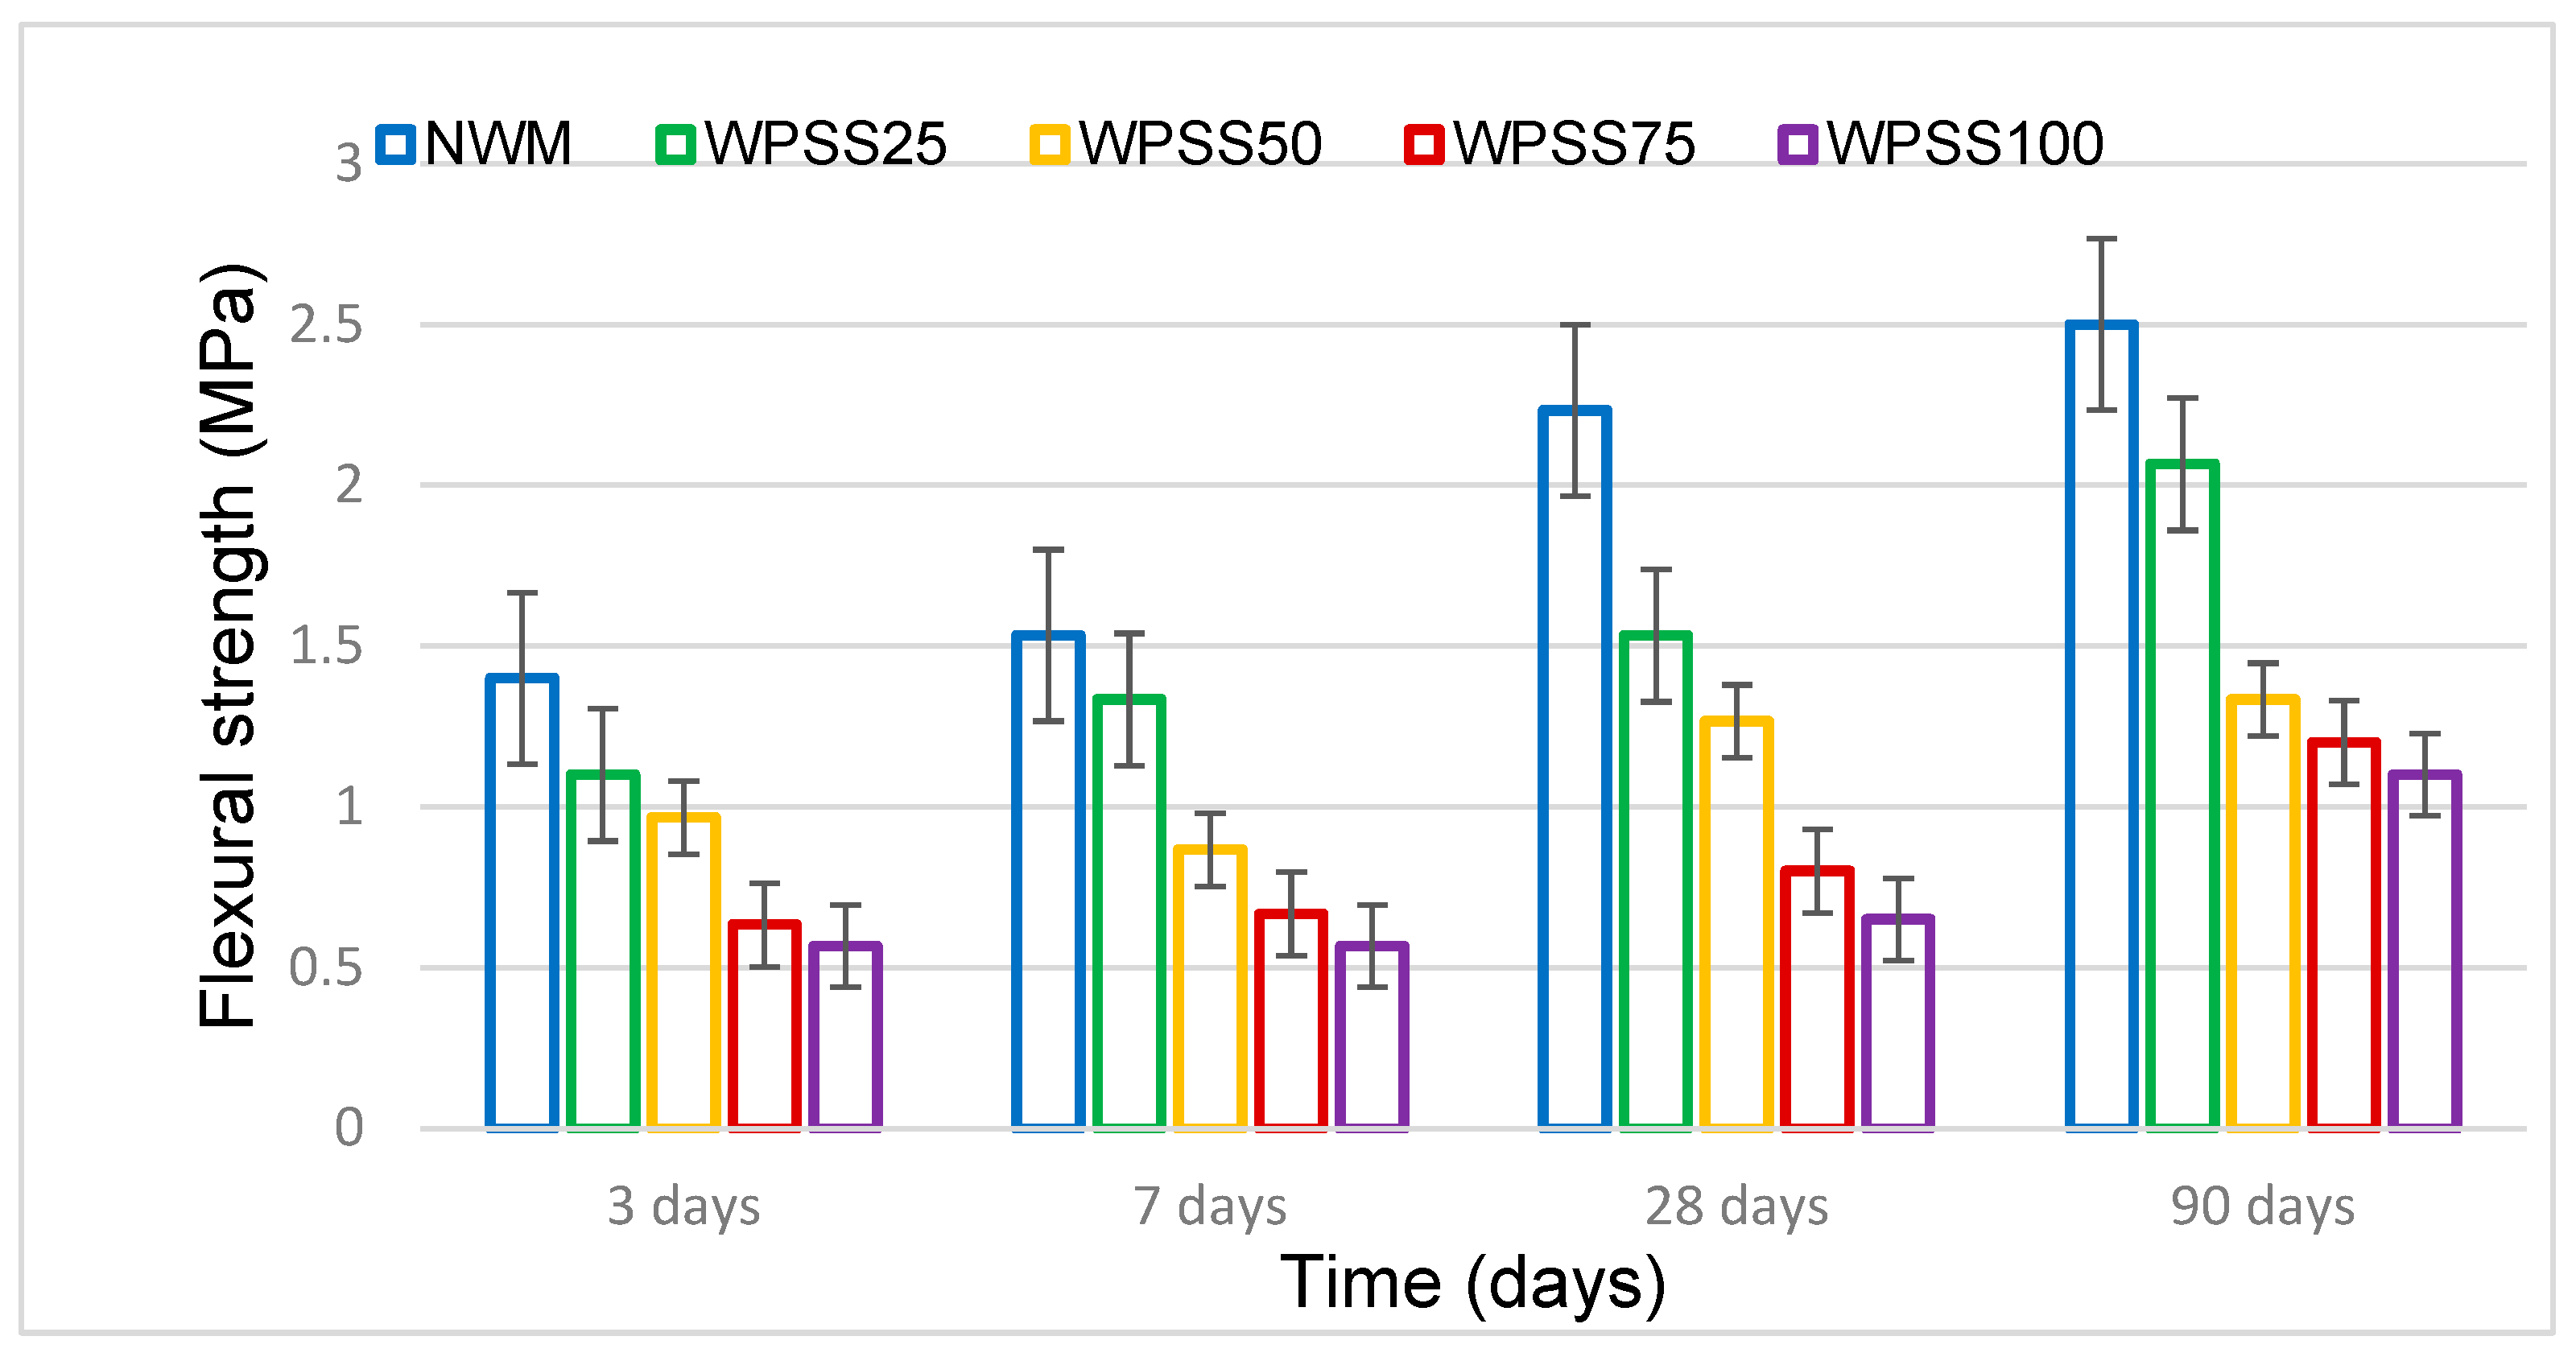
Figure 4 and Figure 7 present the data relative to the flexural strength measurements. They indicate a systematic flexural strength reduction as the synthesized PET–silica sand aggregate percentage increases. It was found that this reduction, at 28 days, was 31, 43, 64 and 71% for composites WPSS25, WPSS50, WPSS75 and WPSS100, respectively, with respect to that of NWM.
In this context, Gouasmi et al. [46] noticed that, among all of the composite mortars developed, WPLA25 presented the highest strength that was equal to 5.23 MPa. However, the flexural strength of WPLA0 was 4.81 MPa, which represents an 8% gain in flexural strength. They then justified this by the elastic nature and non-brittle characteristic of PET plastic aggregates under loading.
On the other hand, Alqahtani et al. [45] found out that the flexural strength decreases when plastic-based composite aggregates are added. In addition, Ennahal et al. [40] revealed that the flexural strength of MSPE2-30% mortar (mortar containing 30% polypropylene and polystyrene) was about 42.13% lower than that of the reference mortar due to the addition of aggregates in the composite mortars.

3.4. Scanning Electron Microscopy (SEM) Analysis

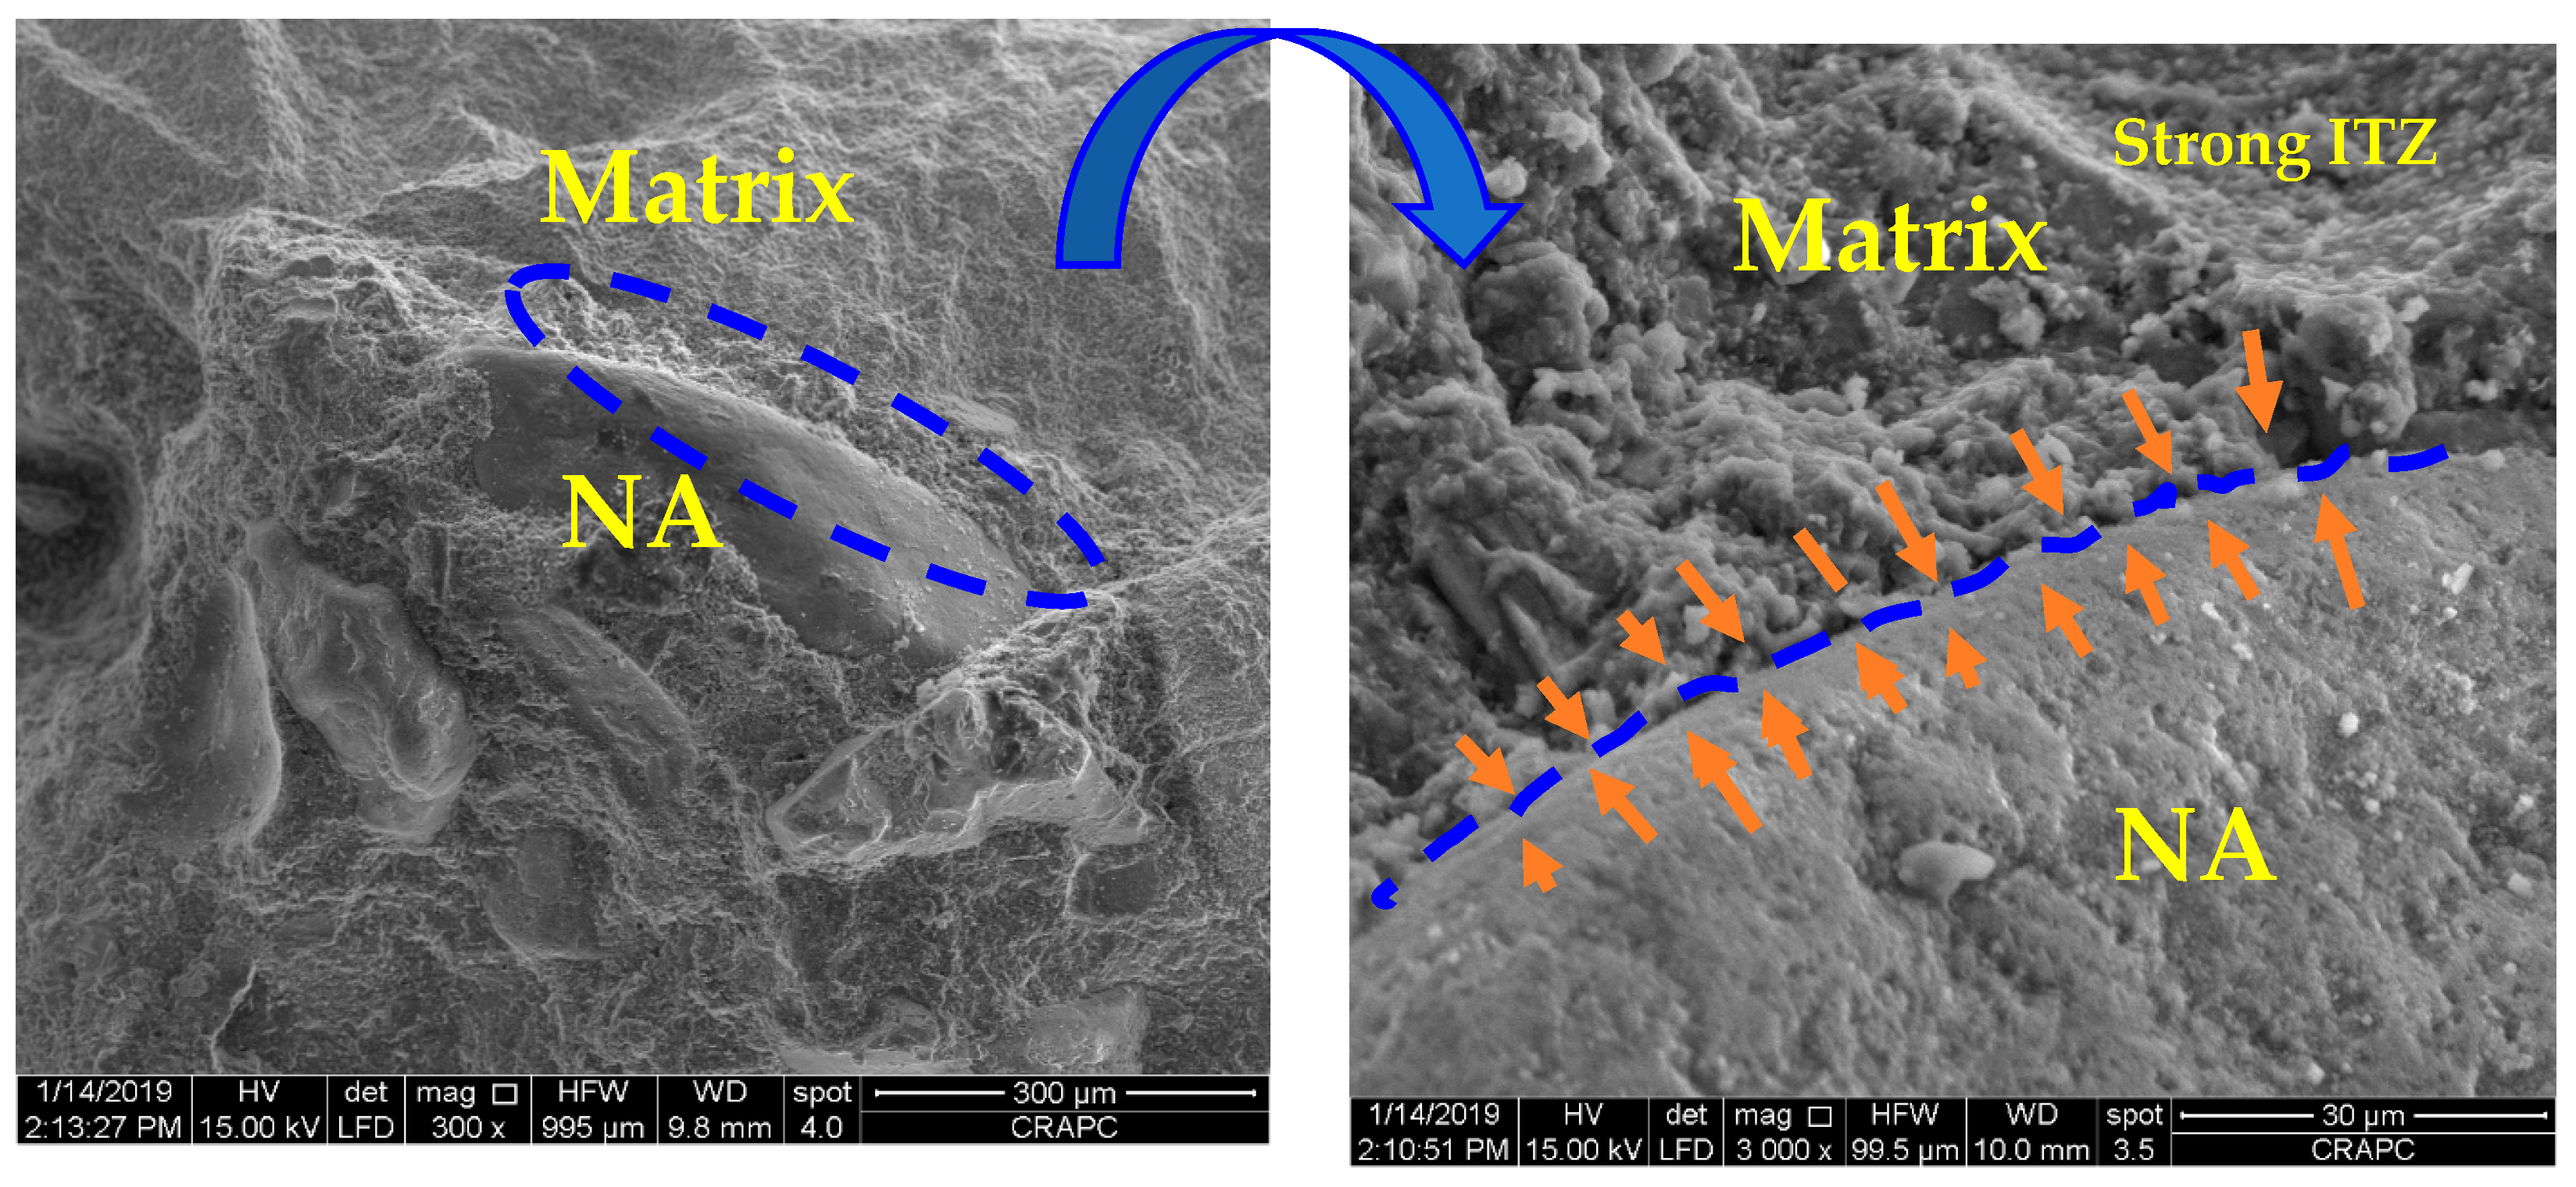
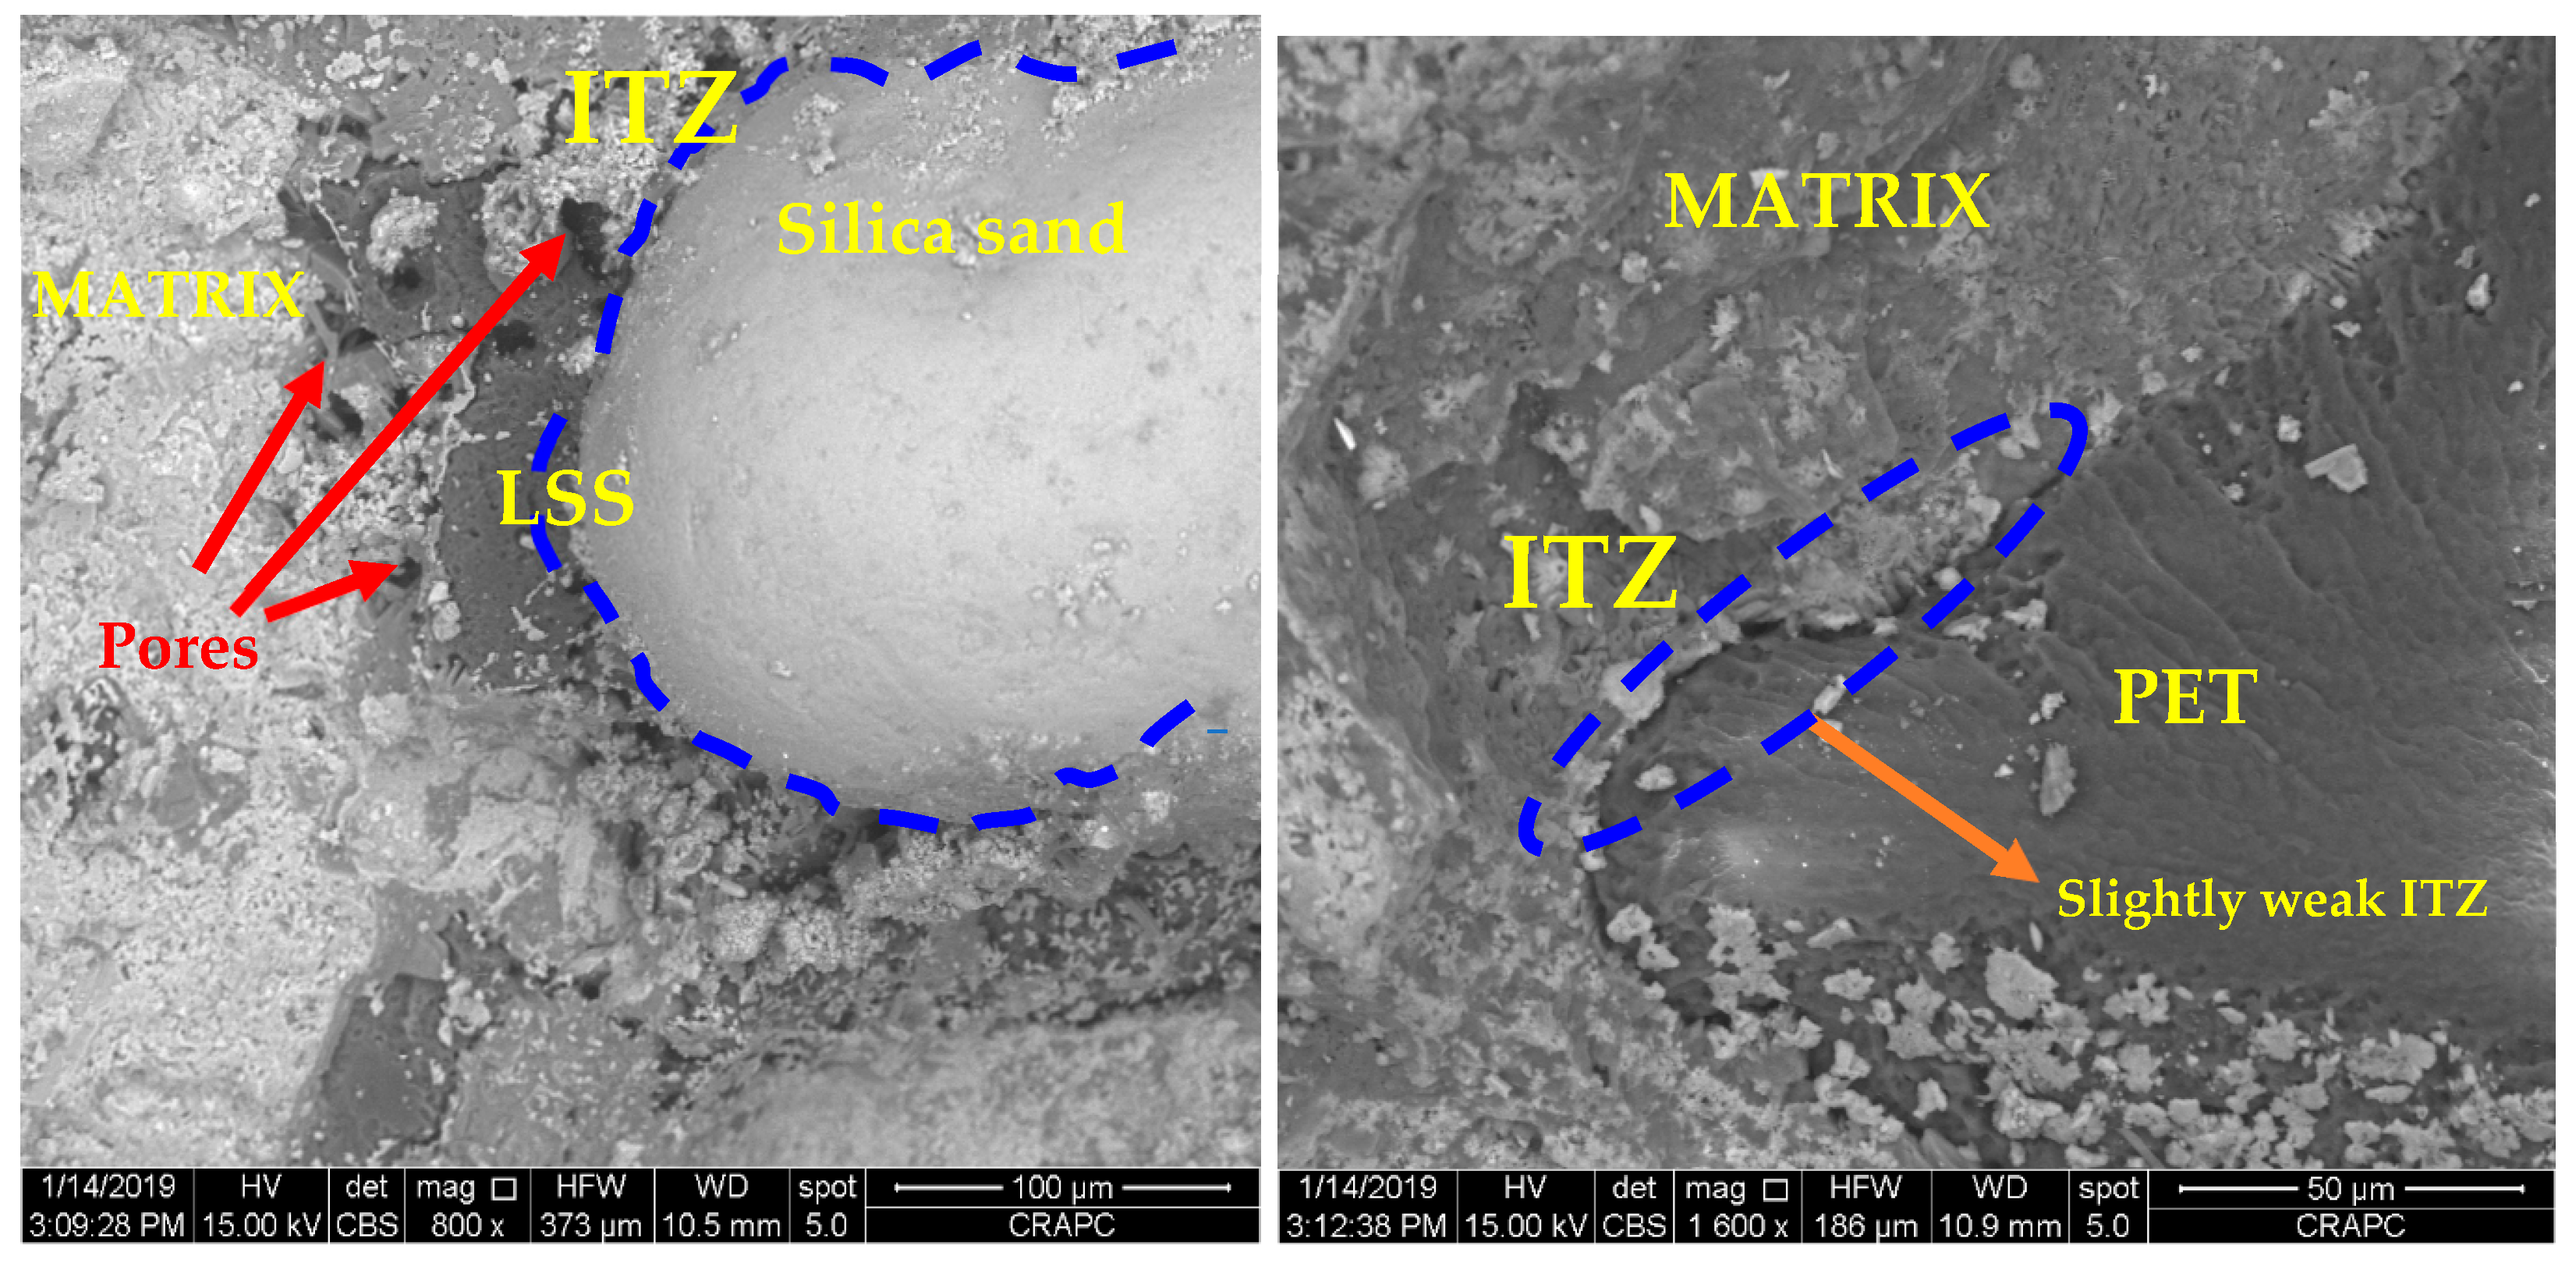
The SEM images presented in Figure 8 and Figure 9 clearly reveal the interfacial transition zone (ITZ) between the cement matrix and aggregates. The analysis shows good adhesion between the matrix and both natural aggregates and LSS aggregates, although the bond with LSS aggregates appears slightly weaker. These findings align consistently with results reported in previous studies [33,36,37,57].
This study demonstrates superior interfacial transition zone (ITZ) bonding between lightweight composite aggregates (LSS) and cement paste when compared with conventional plastic aggregates. The enhanced adhesion results from three synergistic factors: (1) angular particle morphology that improves mechanical interlocking, (2) roughened surface texture that increases effective contact area, and (3) thermally induced modifications that promote stronger bonding with the cement matrix. SEM imaging further verifies the denser, more continuous interface structure achieved through these modifications.
Furthermore, Ge et al. [57] indicated that the PET and sand particles were well bonded, and that the ITZ was dense. In addition, no microcracks or voids were detected. As for Gouasmi et al. [58], they have asserted that a perfect microstructural arrangement existed between PET aggregates and silica sand grains, which explains the strong adhesion between the composite aggregate and cement paste. Likewise, Ennahal et al. [40] have reported that sediment particles were well distributed in the thermoplastic matrix for both types of synthesized aggregates. There was a good interaction between the matrix and these particles.
In contrast, Choi et al. [33] revealed that the interfacial transition zone (ITZ) surrounding waste plastic lightweight aggregates (WPLAs) exhibited greater thickness compared with natural aggregates. This phenomenon primarily stems from the spherical morphology and smooth surface characteristics of WPLAs, which reduce mechanical interlocking and chemical bonding potential with the cement matrix.
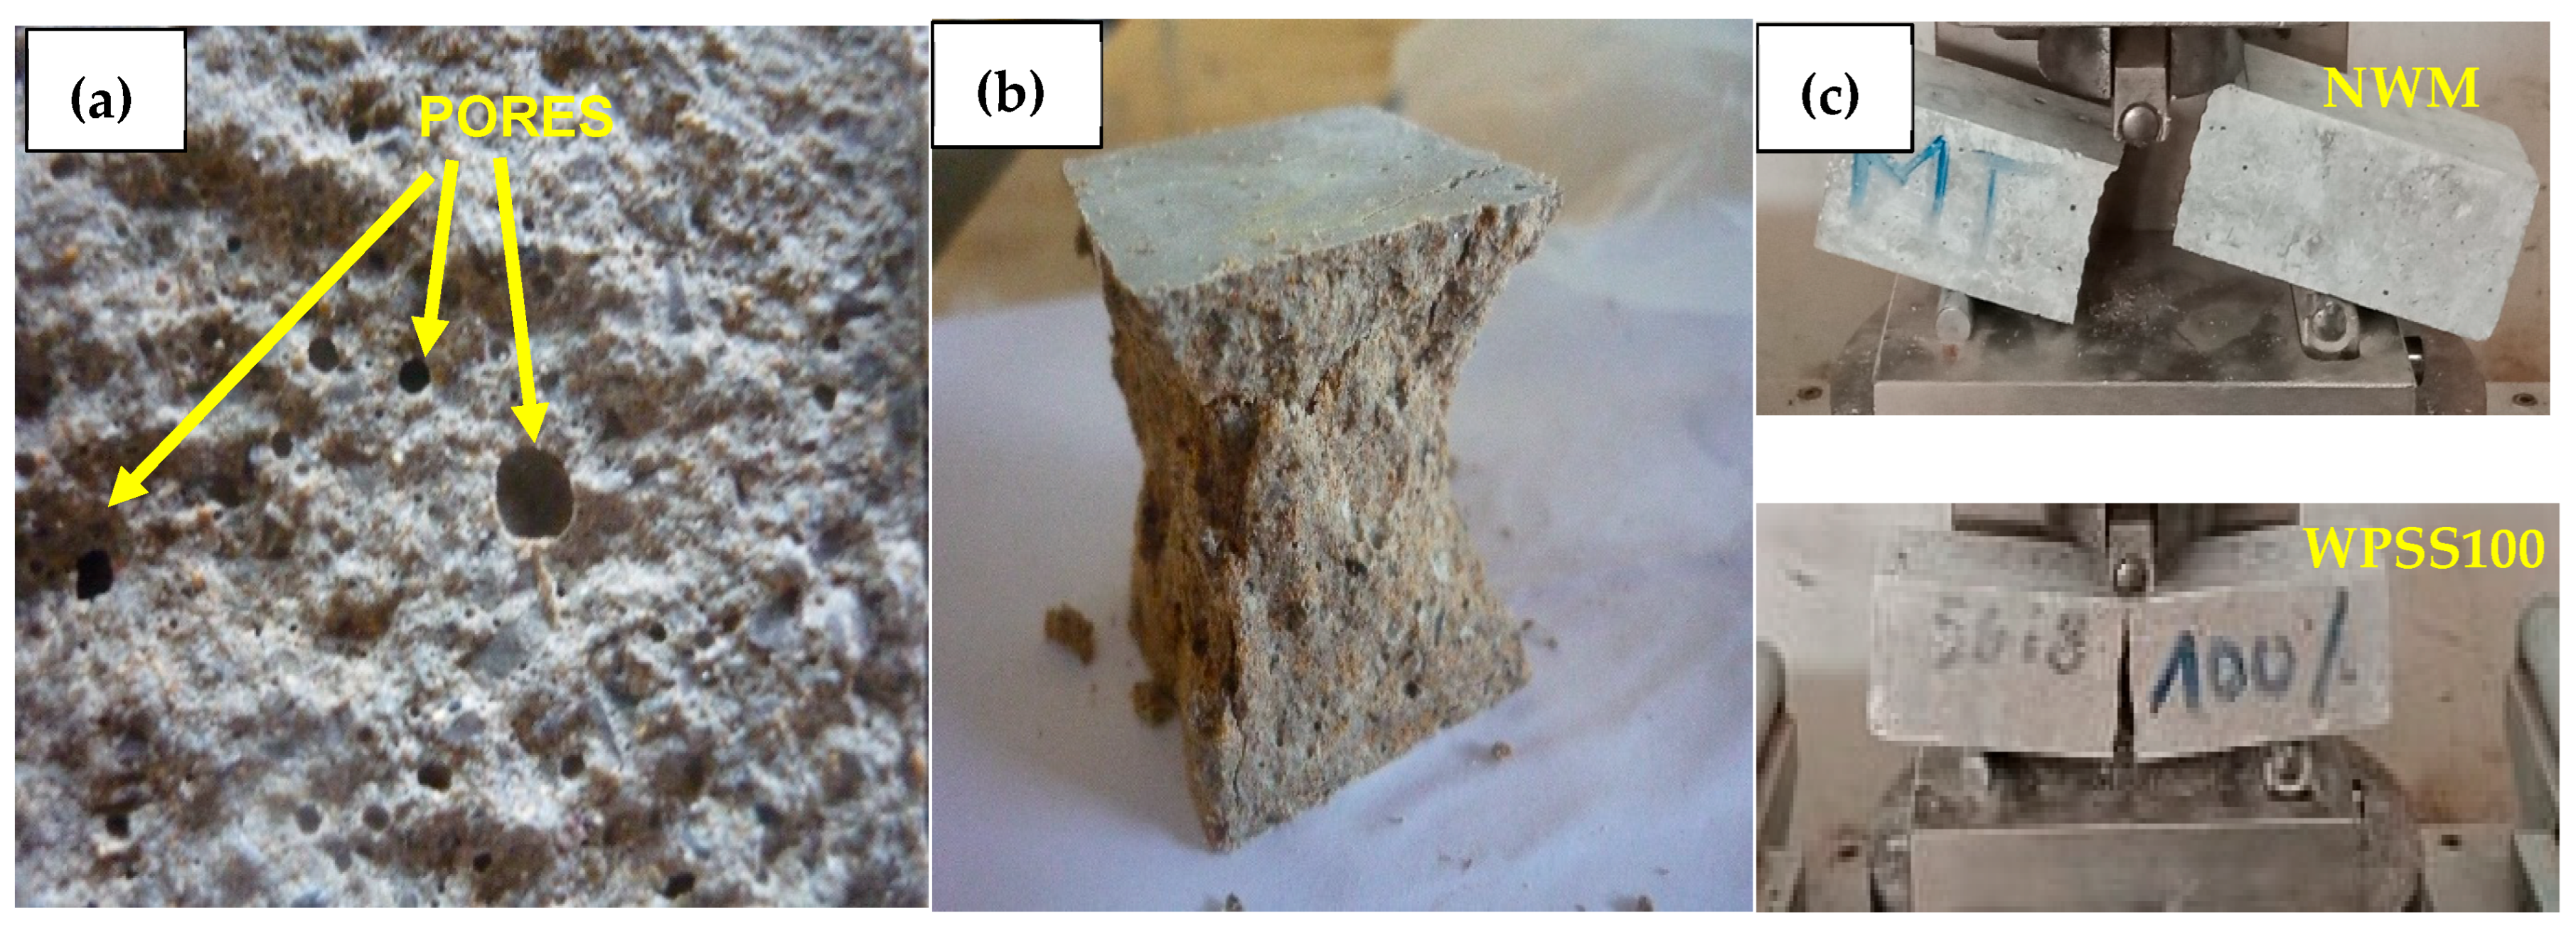
Figure 10 shows the condition of the samples after the compression and bending tests. After the tests, WPSS100 composite mortars exhibited slightly higher ductility than NWM, meaning that the mortar becomes slightly more elastic and less rigid.
The above findings agree well with those reported by Saikia and Brito [59], Marzouk et al. [60] and Alqahtani et al. [45] who found that the crack propagation range was extended due to the presence of recycled plastic particles. However, despite this, it can be said that the waste that has not undergone any heat treatment has a better ductility than that of the synthesized aggregates. This is certainly due to the fibrous aspect of the untreated plastics.
Likewise, Jayasinghe et al. [61] used the scanning electron microscopy technique to show that the PET plastic mixture presents a homogeneous crystallization when mixed with quarry dust, which is not the case for mixtures incorporating HDPE and PP.
As for Badache et al. [62], they obtained better results, finding that this was due to the shape and rigidity of the HDPE aggregates, which do not have the same characteristics as natural aggregates, particularly those with a fiber shape. This allows one to assert, therefore, that the wastes that have not undergone heat treatment possess a better ductility compared with that of synthesized aggregates.

3.5. Ultrasonic Pulse Velocity (UPV) Test

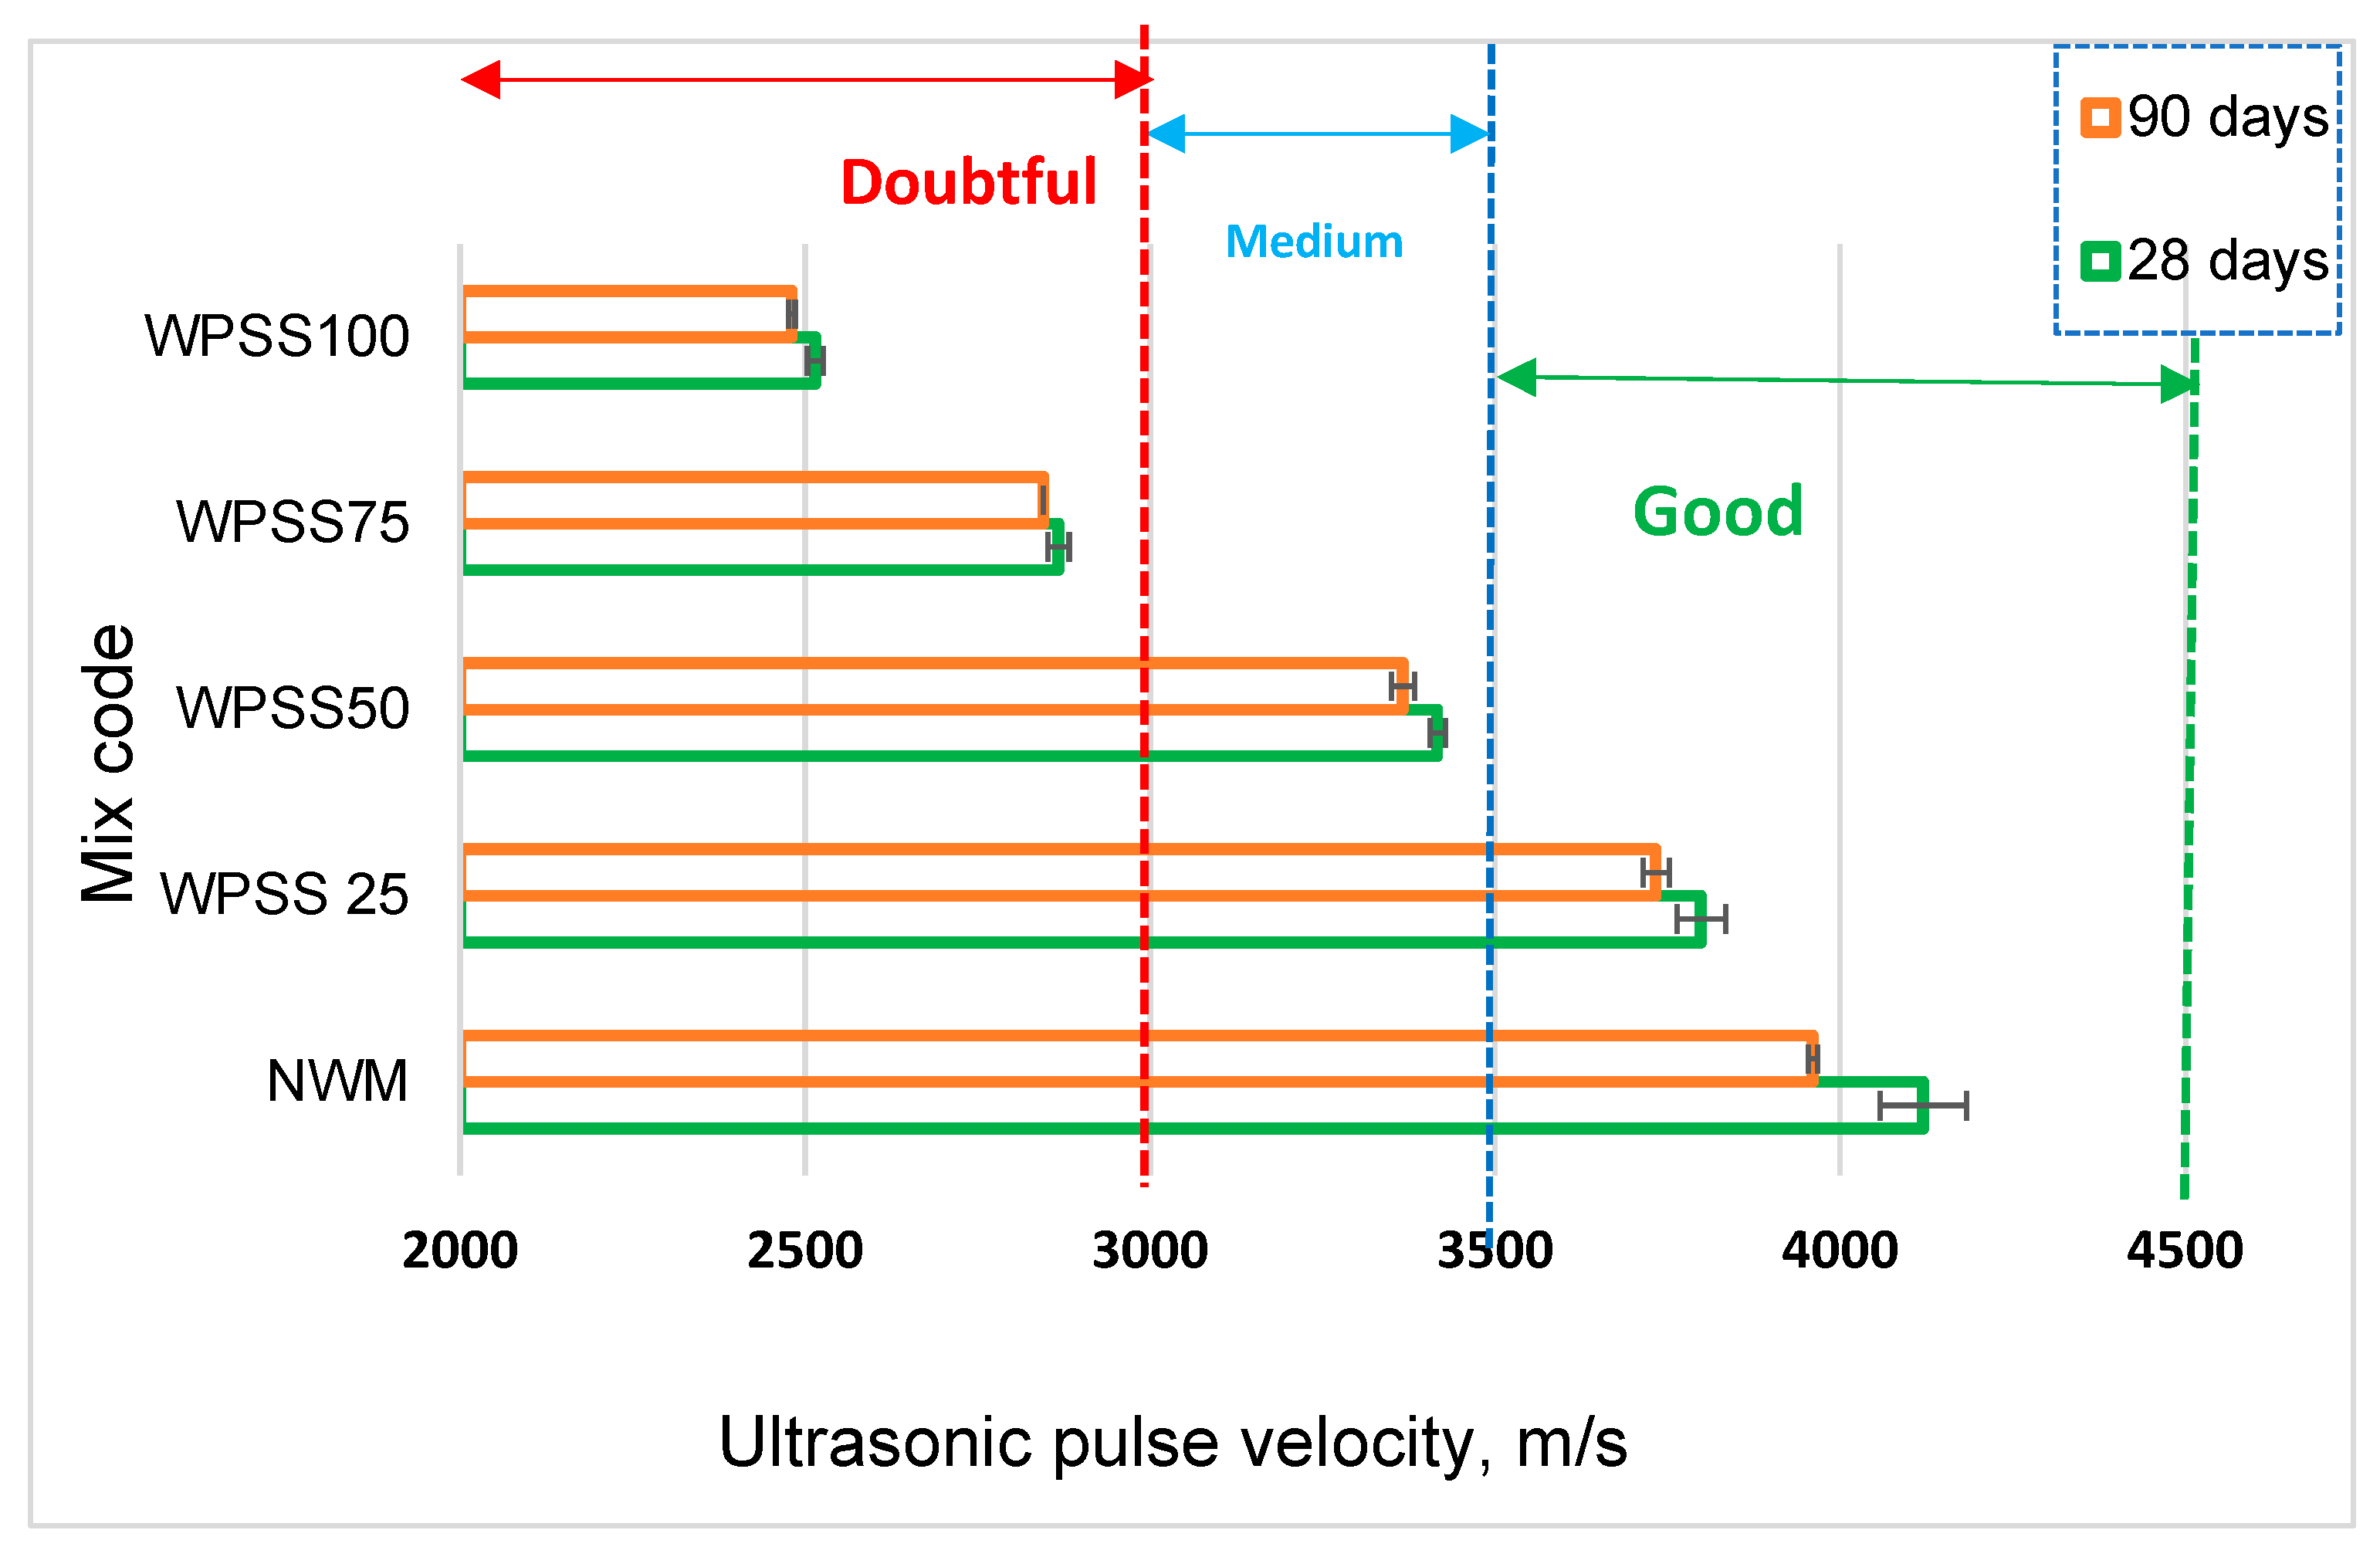
The UPV test results of the composites under study, at 28 days and 90 days, are presented in Figure 11.
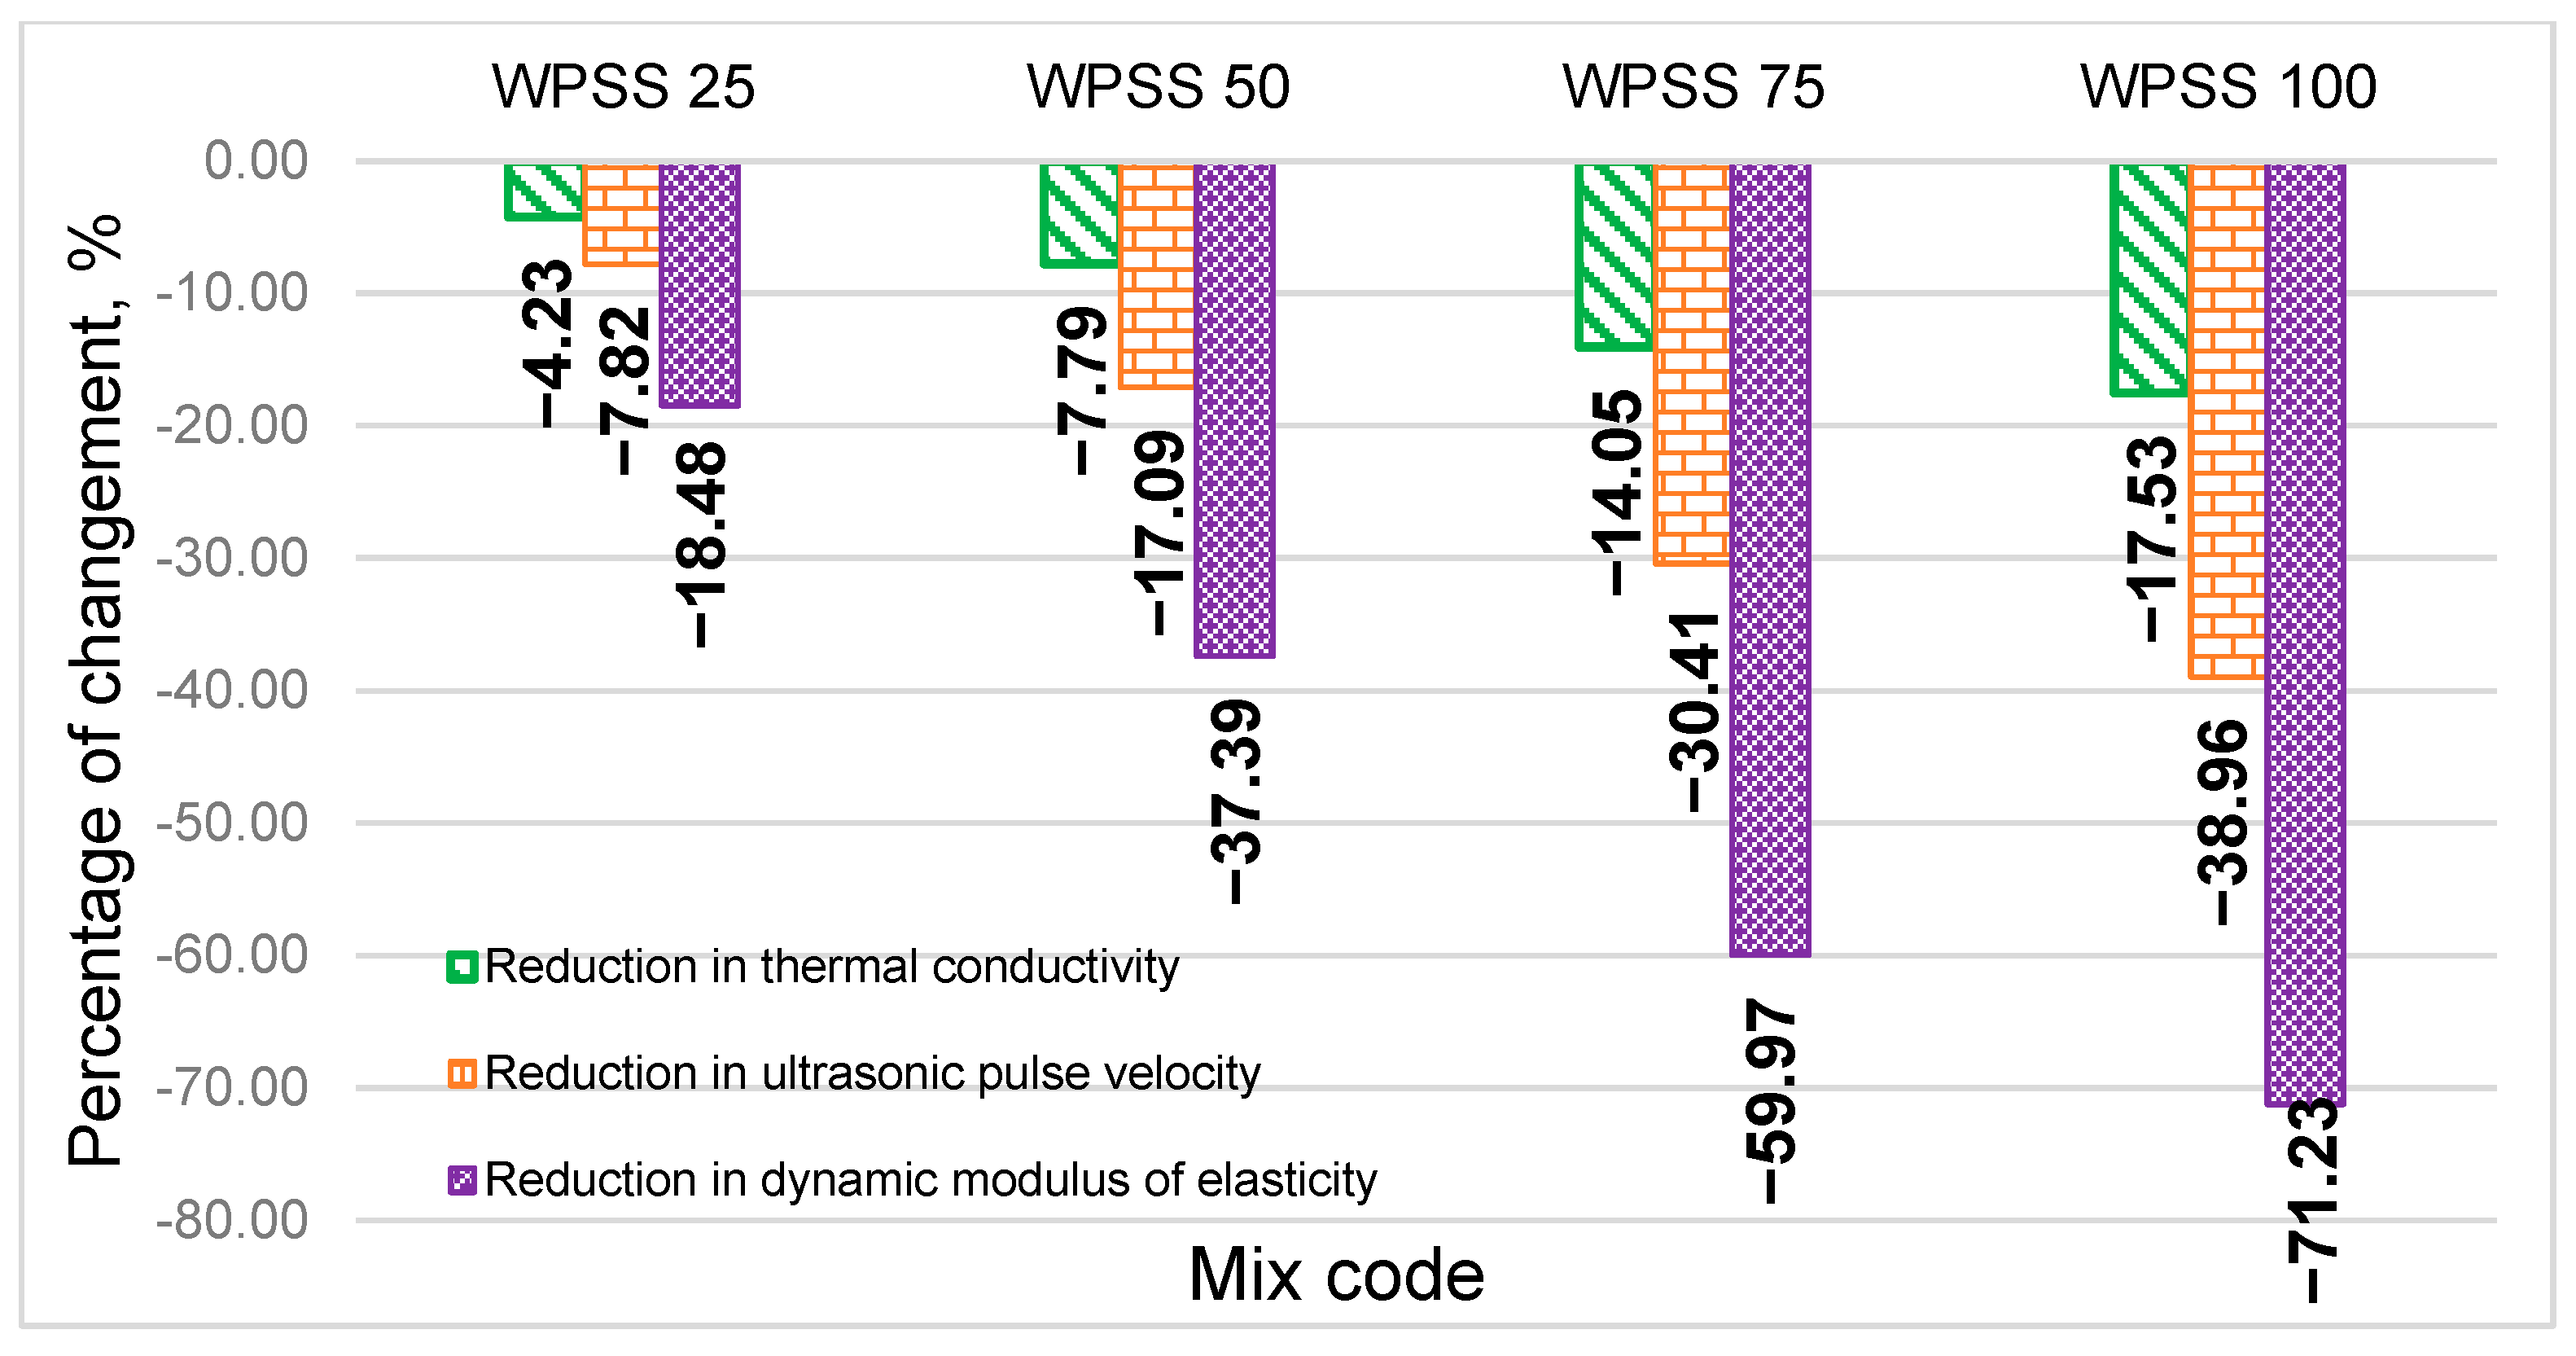
It has been shown that the ultrasonic pulse velocity in a material depends on its density, moisture content, and elastic properties [63]. It has also been observed that, at 28 days, the UPV decreases by 8, 17, 30, and 39% for composites WPSS25, WPSS50, WPSS75, and WPSS100, respectively, compared with that of NWM.
Gouasmi et al. [58] found that the UPV value decreases as the WPLA content in the composite increases. Indeed, the authors indicated that the UPV decreases by 3.5%, 9%, 14%, and 23% for composites WPLA25, WPLA50, WPLA75, and WPLA100, respectively, as compared with that of WPLA0 (control mortar). They then concluded that this was due to the discontinuous presence of air voids within the cement matrix, as the ultrasonic wave should bypass these voids in order to propagate.
Similar results were obtained for composites based on recycled lightweight aggregates by Azhdarpour et al. [64], Senhadji et al. [65] and Akçaözoğlu et al. [66].
Further, Azhdarpour et al. [64] and Senhadji et al. [65] have reported that, when a sound pulse passes through various materials, i.e., plastic aggregates, cement matrix, and pores, it is only partially transmitted, implying that the pulse velocity decreases. It was also revealed that the UPV depends on the volumetric concentration of the different constituents of the material. When plastic aggregates replace natural aggregates, plastic particles with a sheet-like structure act as a refraction barrier for ultrasonic pulses. It is important to highlight that Standard IS 13311-1-92 [67] classifies the quality of composite mortars according to their UPV values. Figure 11 shows that the compressive strength values of the reference sample (NWM) and composite WPSS25 may be considered as acceptable. On the other hand, the quality of WPSS50 and WPSS75 specimens is considered to be fair and quite poor, respectively.

3.6. Dynamic Modulus of Elasticity

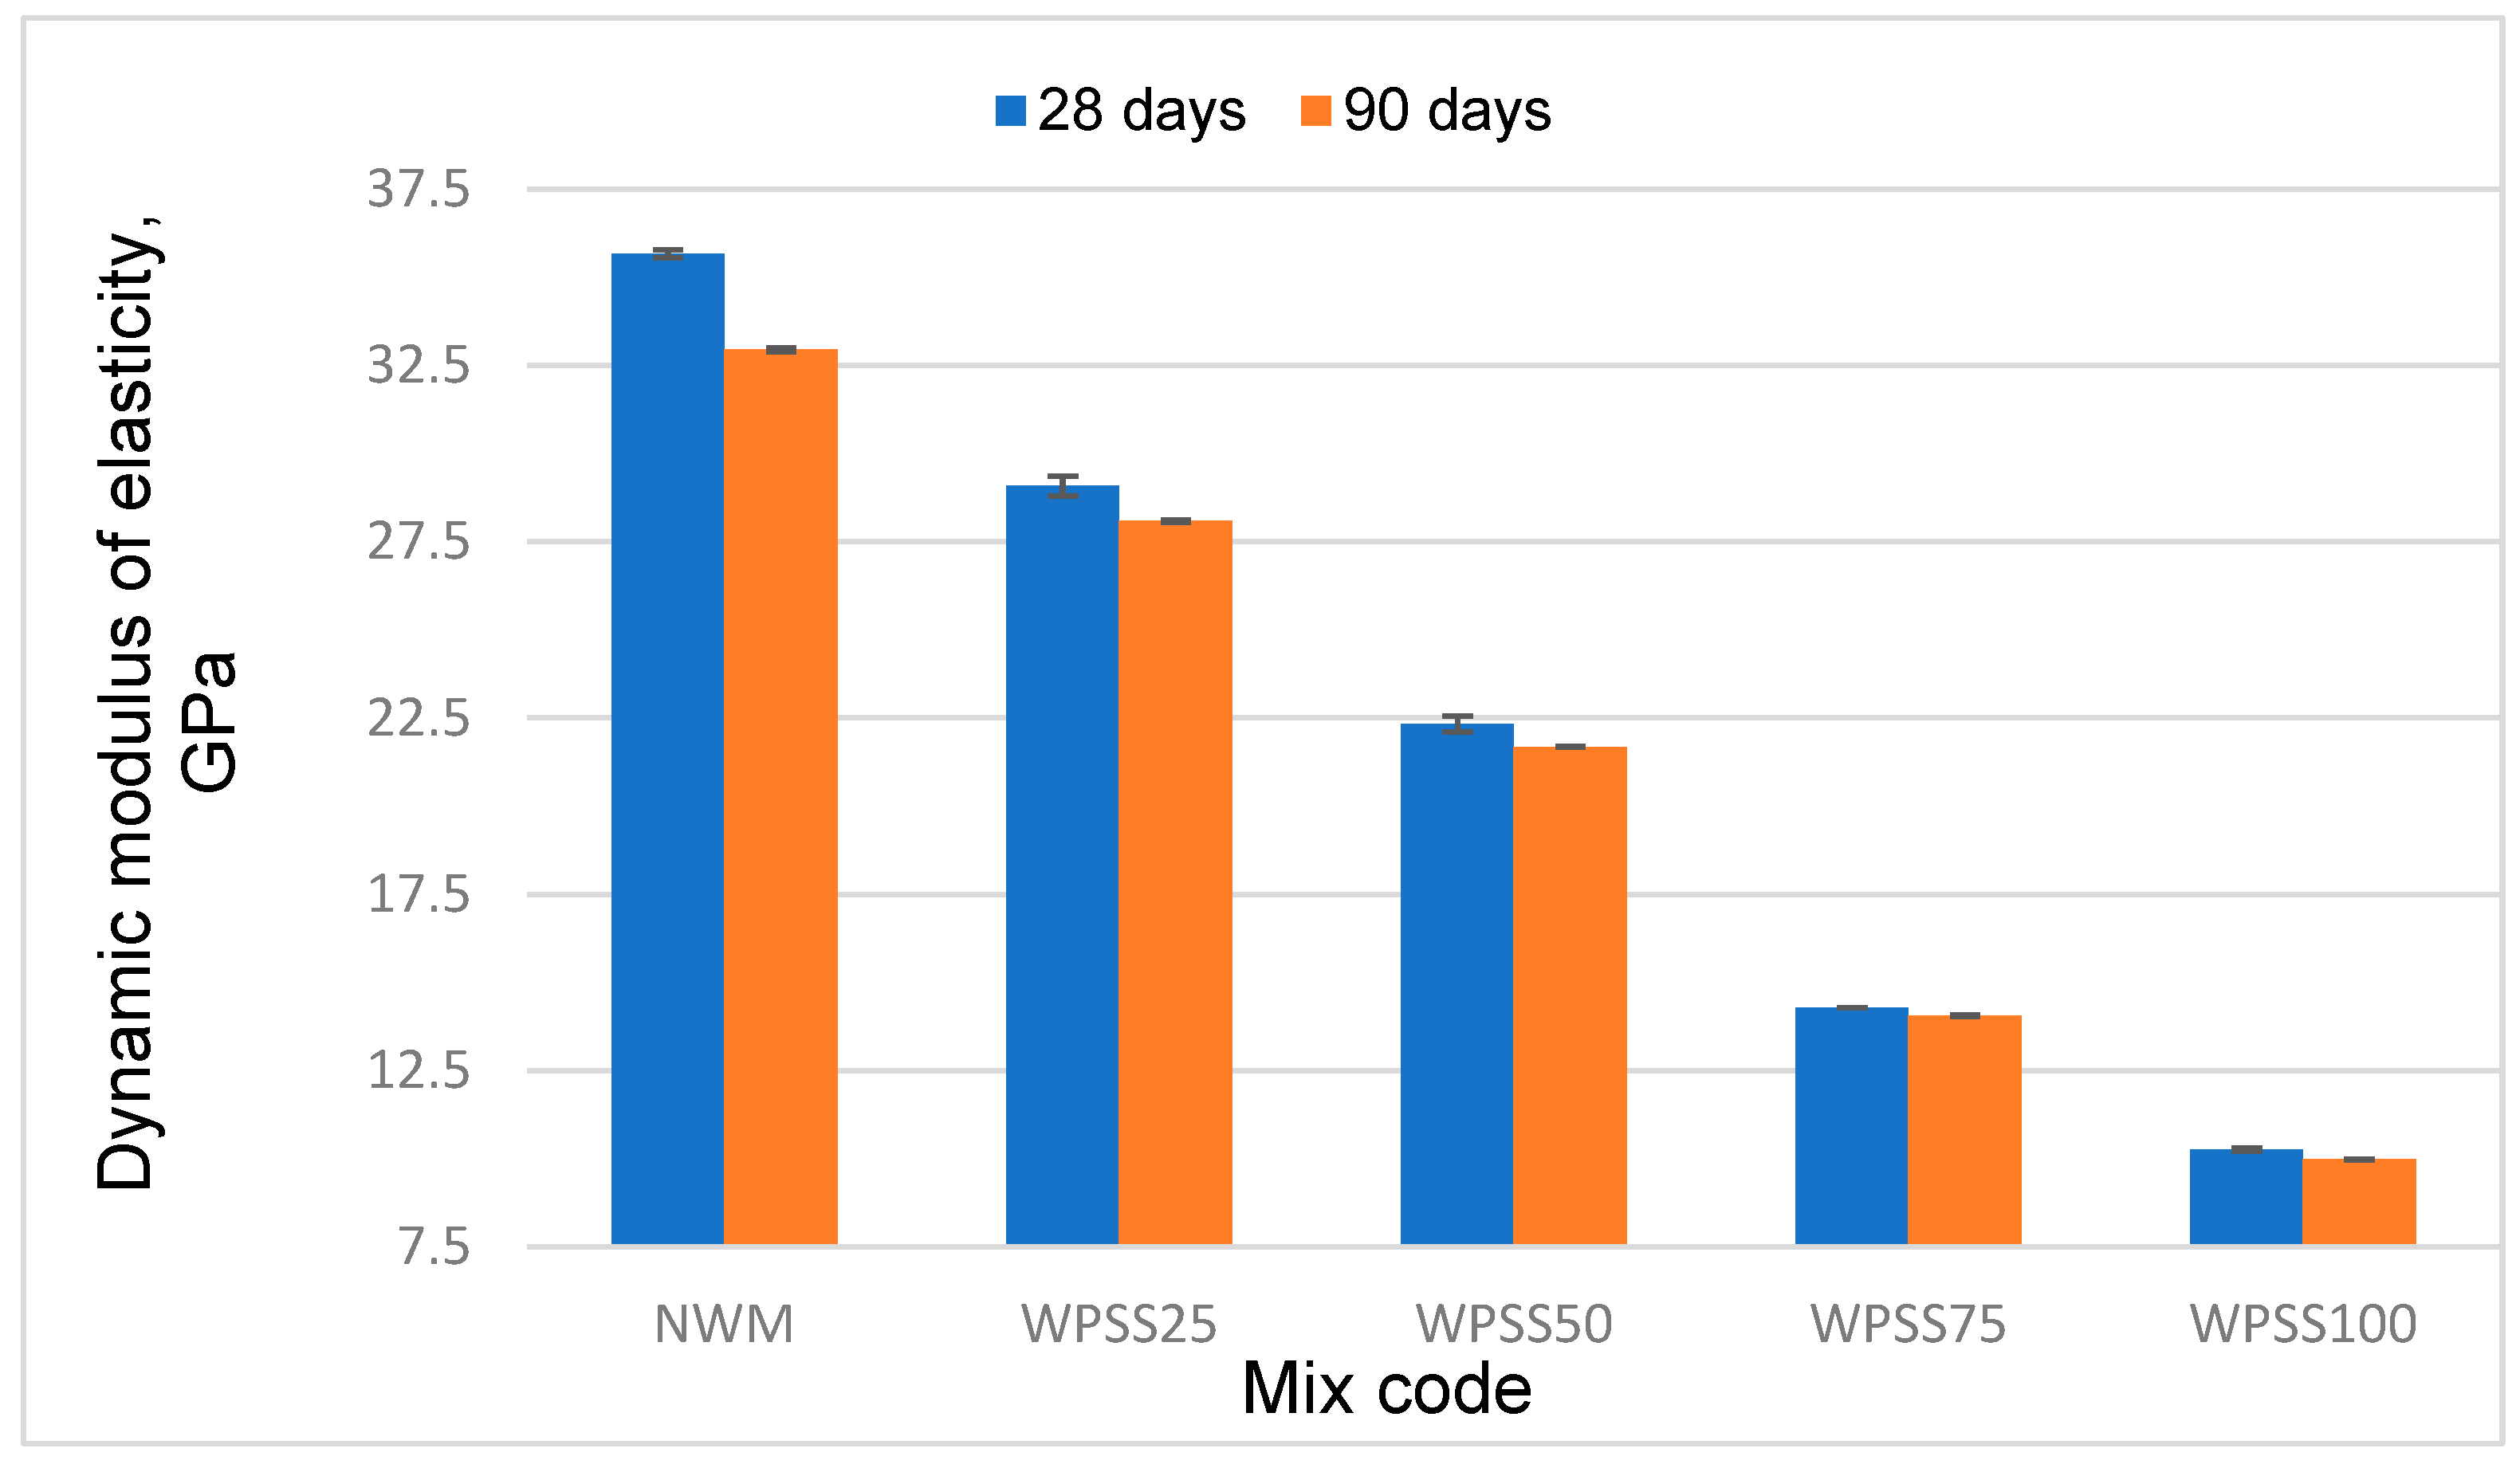
Figure 12 depicts the dynamic modulus of elasticity (Ed) values, which decrease as the LSS aggregate content rises. At 28 days, Ed drops by 18%, 36%, 58% and 69% for the mixtures containing 25%, 50%, 75% and 100% of LSS, respectively. This can be attributed, firstly, to the weak bonding between the cement matrix and plastic particles of the different composites [68,69,70] and, secondly, to the low elastic modulus values of PET (EPET = 2.7 GPa) [58,71].
In addition, Figure 13 shows that the correlation between the compressive strength and Ed is quite good. Indeed, it was observed that the coefficients of determination for the correlations, at 28 days and 90 days, were R2 = 0.9897 and R2 = 0.9724, respectively.

3.7. Thermal Properties

Thermal properties were measured using a Quick-line ISOMET QTM 30 analyzer equipped with a 50 mm surface probe, which simultaneously and independently determines thermal conductivity (λ), calorific capacity (Cp), and thermal diffusivity (a) through a transient measurement protocol.

3.7.1. Thermal Conductivity of WPSS Composite Mortars

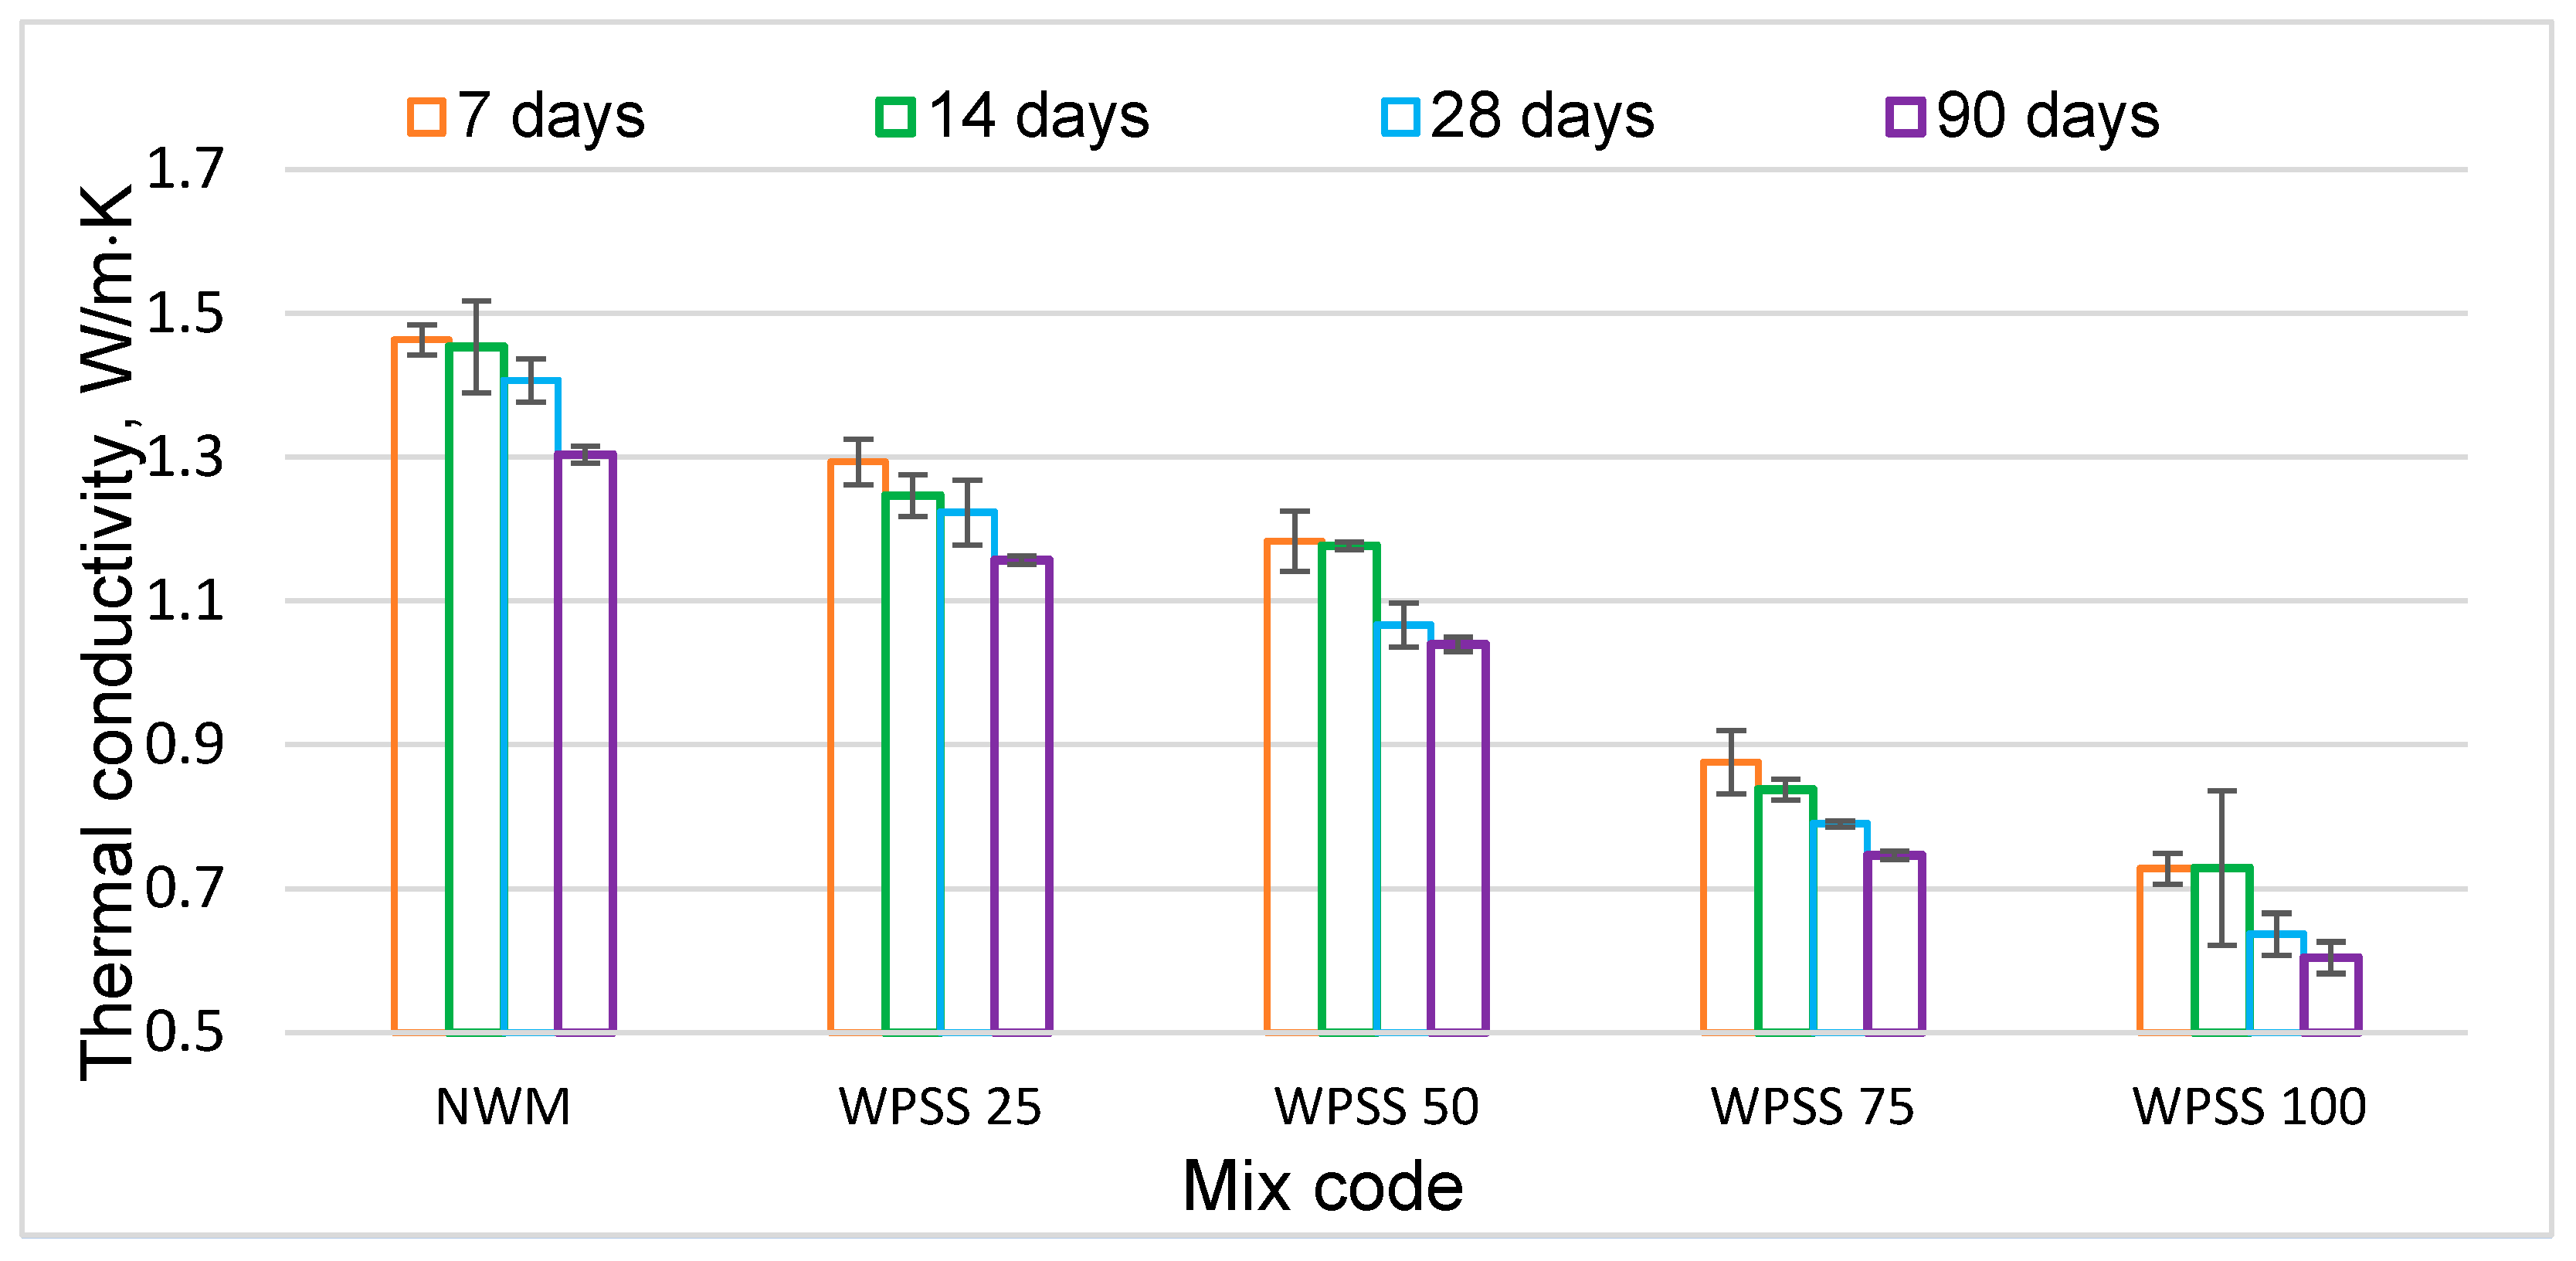
The thermal conductivity λ of the samples, measured at different time points, is depicted in Figure 14. At 90 days, the value of λ for control mortar (NWM) is 1.30 W/m·K, while for WPSS100, it is smaller, around 0.60 W/m·K. Moreover, the incorporation of LSS aggregates into the composites resulted in a decrease in the thermal conductivity of the different samples.
When a higher proportion of lightweight synthetic sand (LSS)—which has a thermal conductivity (λ) of 0.589 W/m·K and is made from PET (with its own very low λ of 0.15 W/m·K)—is incorporated, replacing natural sand (which has a significantly higher λ, with siliceous aggregates at 3.59 W/m·K [72] and natural aggregates at 2.0 W/m·K (Hannawi et al. [73]), this directly leads to a reduction in the overall thermal conductivity of the composite mortars. This phenomenon is explained by the fact that the highly insulating LSS lightweight composite aggregates replace the more conductive natural sand, thus improving the thermal resistance of the WPSS composite mortars. The porosity of the different samples is another crucial factor influencing their thermal properties. It should be noted that high porosity leads to a decrease in these properties, which is clearly demonstrated by the WPSS composite mortars (See Section 3.8 and Table 5).
The above findings have been confirmed by Erdogmus et al. [42], Akçaözoğlu et al. [66], Hannawi et al. [73], Boudenne [74] and Gouasmi et al. [75].
Likewise, Alqahtani et al. [76] have reported that the thermal conductivity decrease in their composites was essentially due to the porous structure of the synthesized aggregates and also to the air trapped in voids. Moreover, Erdogmus et al. [42] have suggested that, for inhomogeneous mixtures containing pores of different sizes, the distribution of these pores as well as the microcracks formed after the addition of plastic waste do have an impact on the thermal conductivity and porosity of the composites.
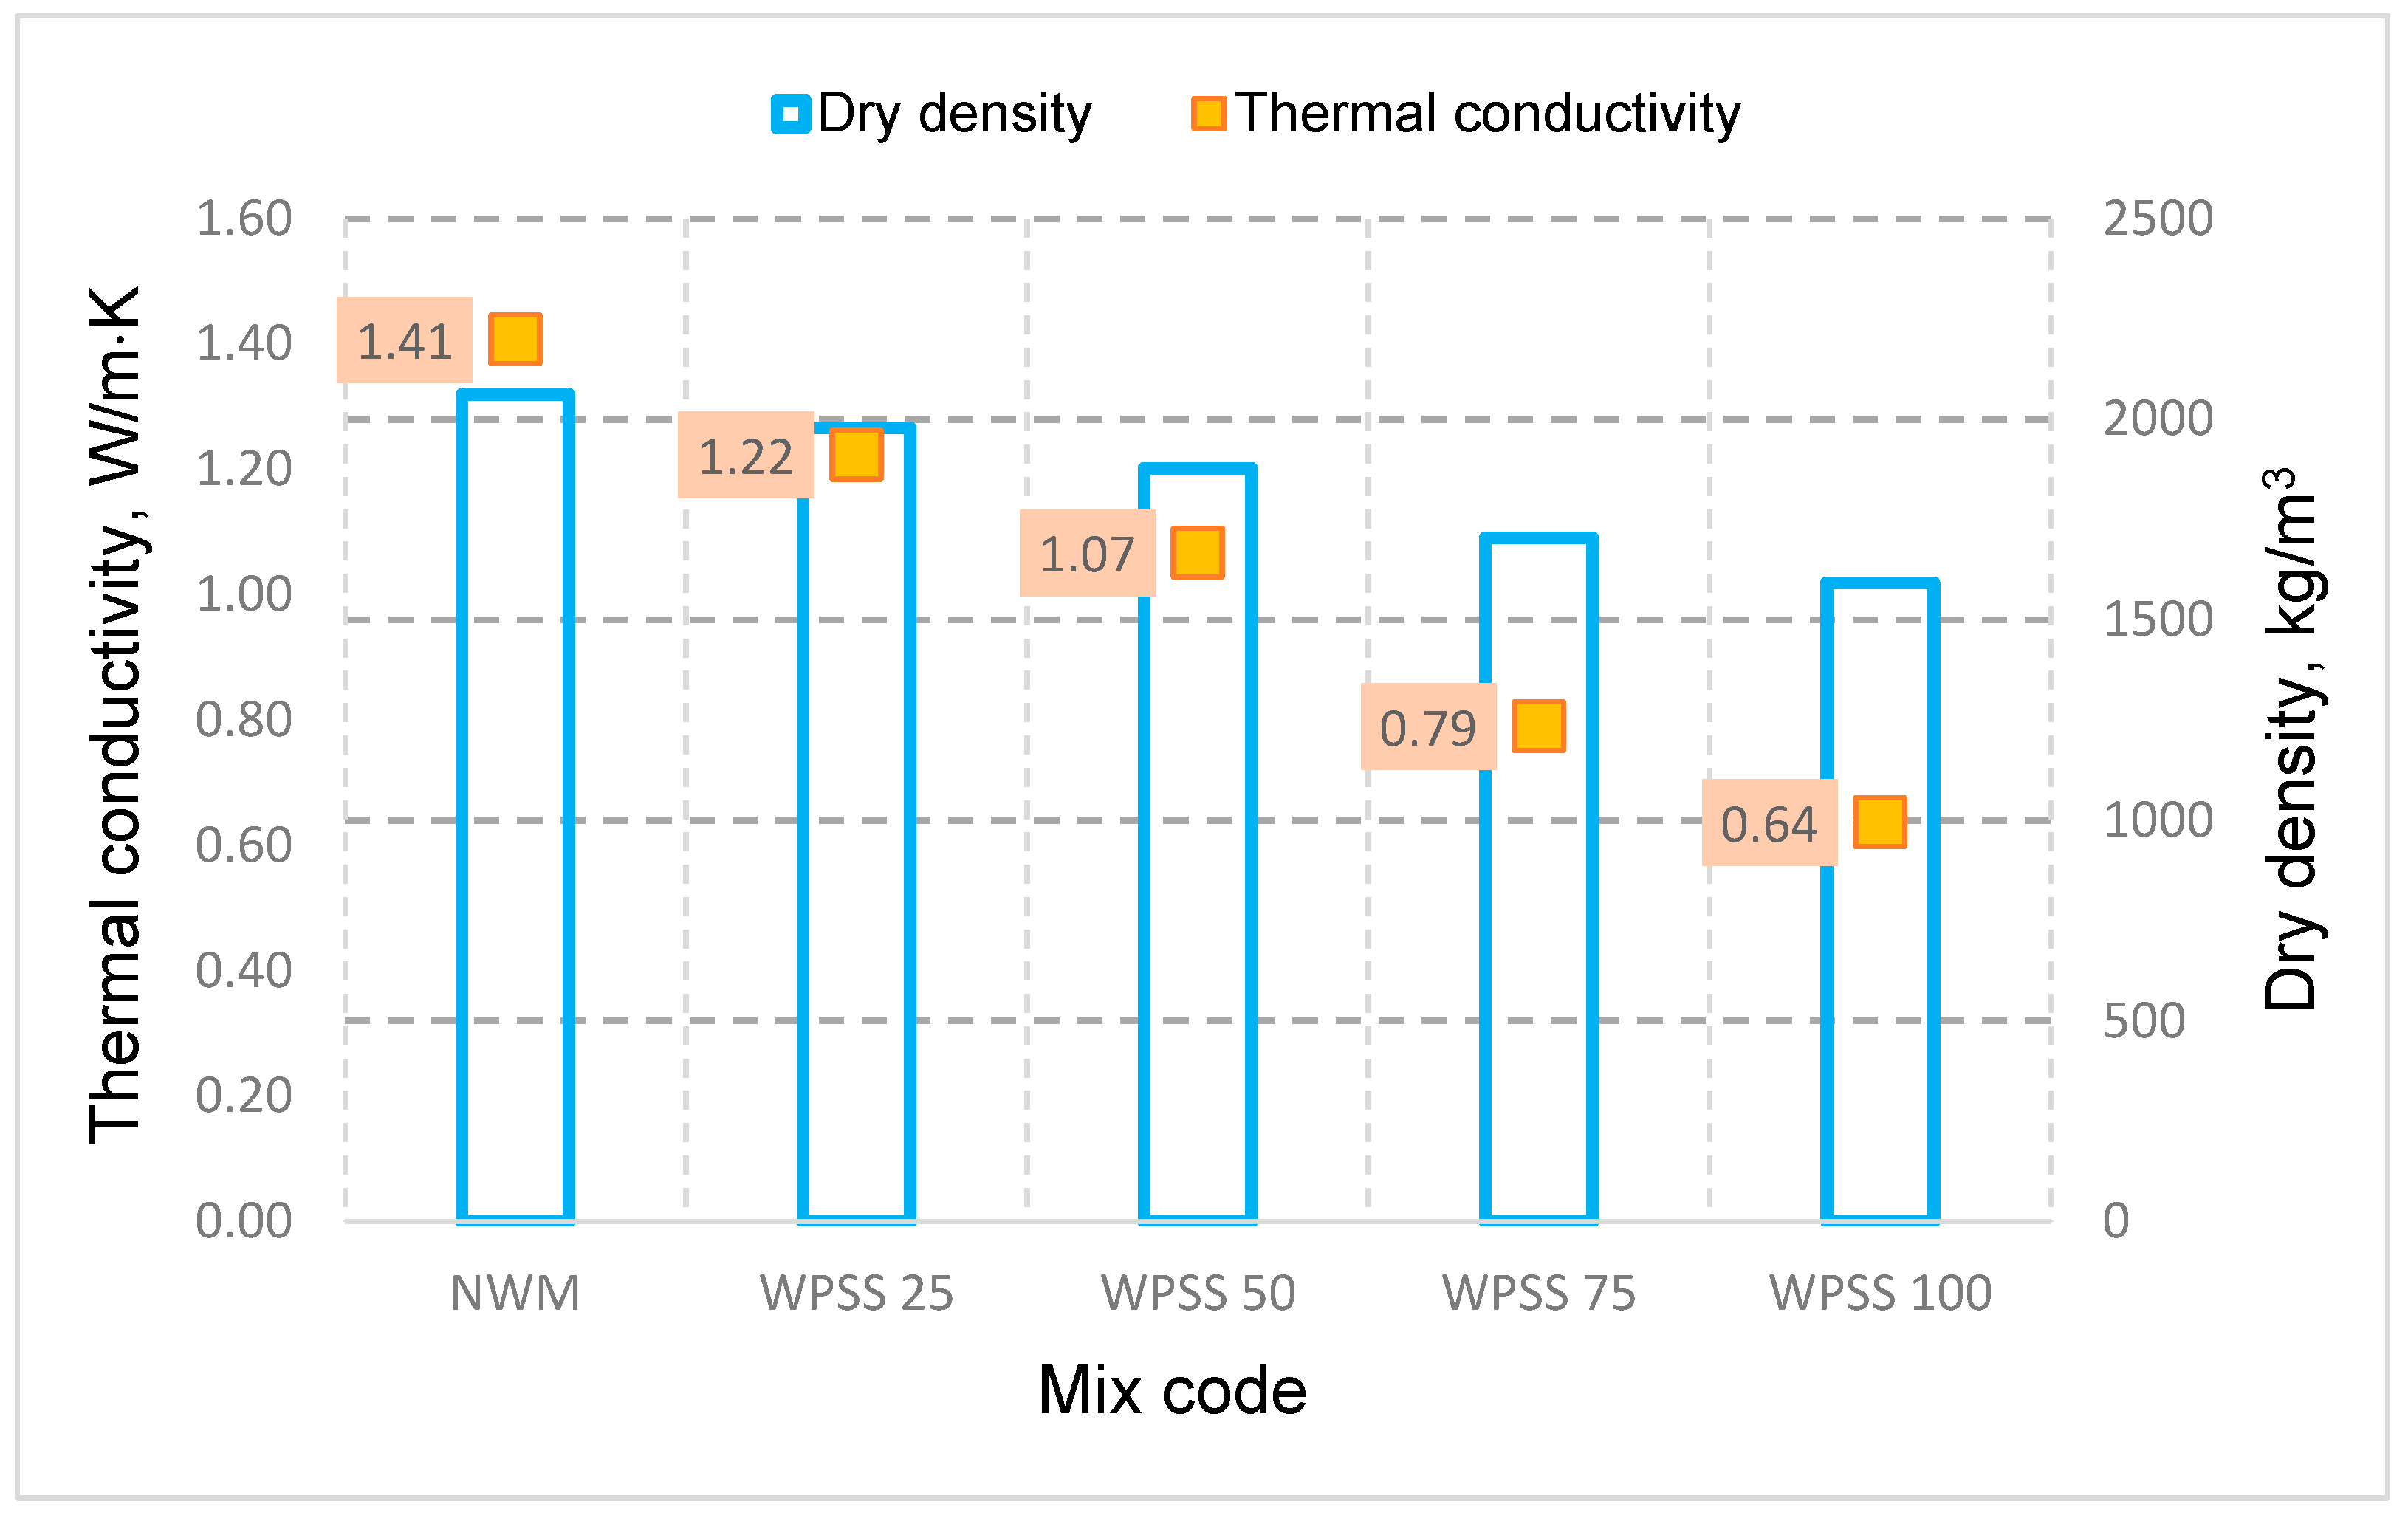
As the thermal conductivity results of our WPSS75 and WPSS100 composites are lower than 0.75 W/m·K., as depicted in Figure 15, it may be said that their compressive strengths are greater than 3.5 MPa (Rc > 3.5 MPa). It is therefore possible to deduce that these composite mortars can be used as insulating materials, according to the functional classification of lightweight concretes by Rilem (1978) [77].

3.7.2. Thermal Conductivity–Density Relationship

The conductive heat transfer properties of materials are governed by three fundamental thermophysical parameters: density ( ρ , kg/m3), calorific capacity (C, J/m3·K), and thermal diffusivity (a, m2/s).
These parameters interrelate through the thermal conductivity equation, as follows:
λ = a × ρ × C
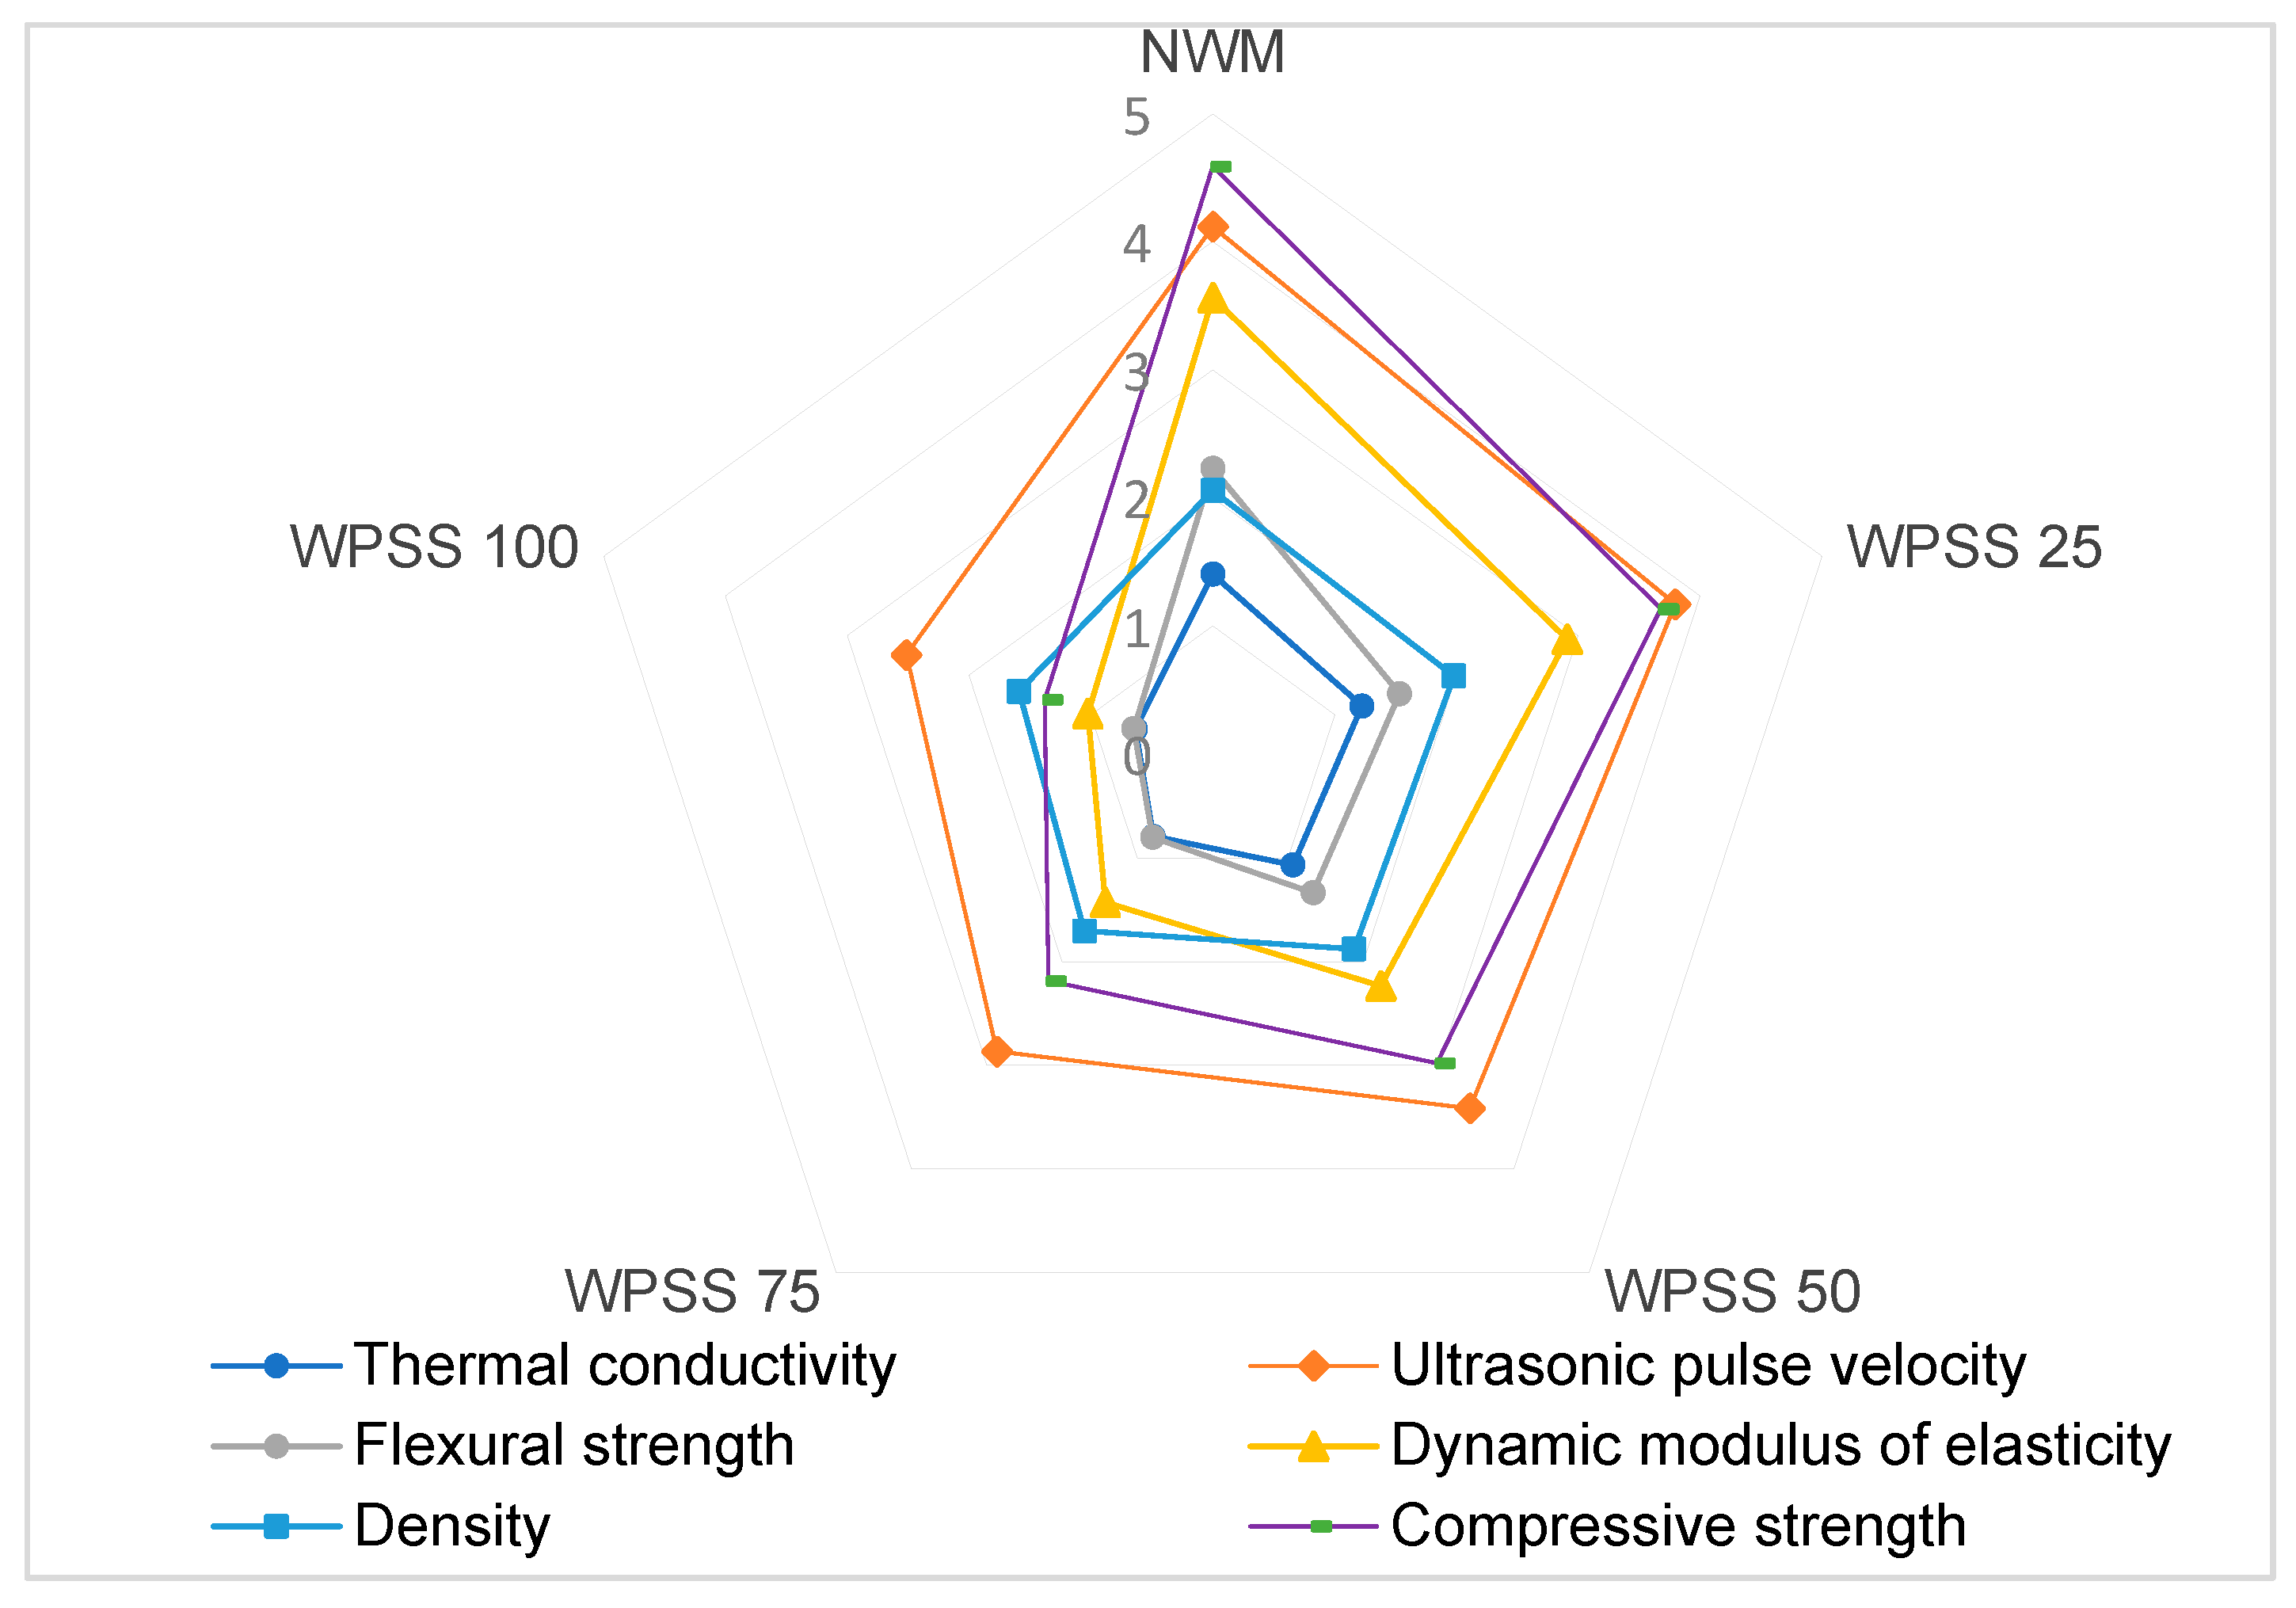
Figure 15 indicates that the thermal conductivity decrease is directly related to the reduction in density. Figure 16 presents the different correlation coefficients (R2 ≥ 99%), showing that, in fact, a good correlation exists between the thermal conductivity values and UPV values for all WPSS composites. Similarly, Figure 17 clearly shows the effect of LSS aggregates on the outcomes of the different non-destructive tests carried out on WPSS composites.
The observed behaviors for the dynamic modulus (Figure 12), the strength–UPV correlation (Figure 13), and the thermal conductivity–UPV correlation (Figure 16) between 28 and 90 days deviate from the usual trends of cementitious materials. These divergences are attributed to the composite aggregates (LSS), which are based on PET and silica sand. These aggregates have the particularity of limiting water transport, which restricts the late hydration of the cement and dominates the material’s long-term transport properties.
It is also plausible that, due to the specific composition of our mixture (LSS-based composite cementitious matrix), most of the hydration process and microstructure development, which directly influence these properties, is largely completed by 28 days. Consequently, any evolution observed after 90 days would be very marginal.
However, Figure 4, Figure 11, Figure 12 and Figure 14 demonstrate a logical and consistent evolution of the parameters studied (compressive strength (Rc), UPV, dynamic modulus of elasticity (Ed), and thermal conductivity). This trend follows the typical behavior of cementitious materials between 28 and 90 days. For the same period, the correlations between these parameters show a similar evolution, which is logical. The correlation coefficient R2 confirms this relationship, attesting to the consistency of the interactions among these properties.

3.7.3. Calorific Capacity

Figure 18 depicts the evolution of the calorific capacity Cp as a function of time, at room temperature. It is clear that, as the LSS addition rate increases, the heat capacity decreases. Furthermore, it is also found that, over time, Cp varies slightly. Indeed, it is clearly indicated that, at 180 days, the rate of Cp decrease went from 4% to 14%. It should also be mentioned that the heat capacity of NWM reached an average value of 1.96·106 J/m3 K, which is higher than that of mortar WPSS100 (1.69 × 10⁶ J/m3 K), which can be explained by the fact that the thermal properties of PET and conventional aggregates are different. In this context, Mounanga et al. [78] have indicated that the effect of polyurethane (PUR) foam on the heat capacity of mortars is quite low, which is certainly due to the small value of Cp of foam (0.04 × 10⁶ J/m3 K). This is compensated with the very high heat capacity of water (Cp water = 4.18 × 10⁶ J/m3 K), which contributes to saturating the porosity of mortars. However, this value is compensated by the very high heat capacity of water. In addition, Gouasmi et al. [74] have revealed that the heat capacity of WPLA0 can reach an average value of 1.76 × 10⁶ J/m3 K, which is significantly higher than that of the other composite mortars. This finding is in agreement with that reported by Badache et al. [62], Attache et al. [79] and Latroch et al. [80].

3.7.4. Thermal Diffusivity

Thermal diffusivity (a, m2/s) characterizes the rate of thermal energy propagation through a material, defined by the following relationship:
a = λ / ( ρ · C )
where a is the thermal diffusivity in m2/s, λ is the thermal conductivity in W/m⋅K, ρ is density of material in kg/m3, and C is the mass heat in J/kg K−1.
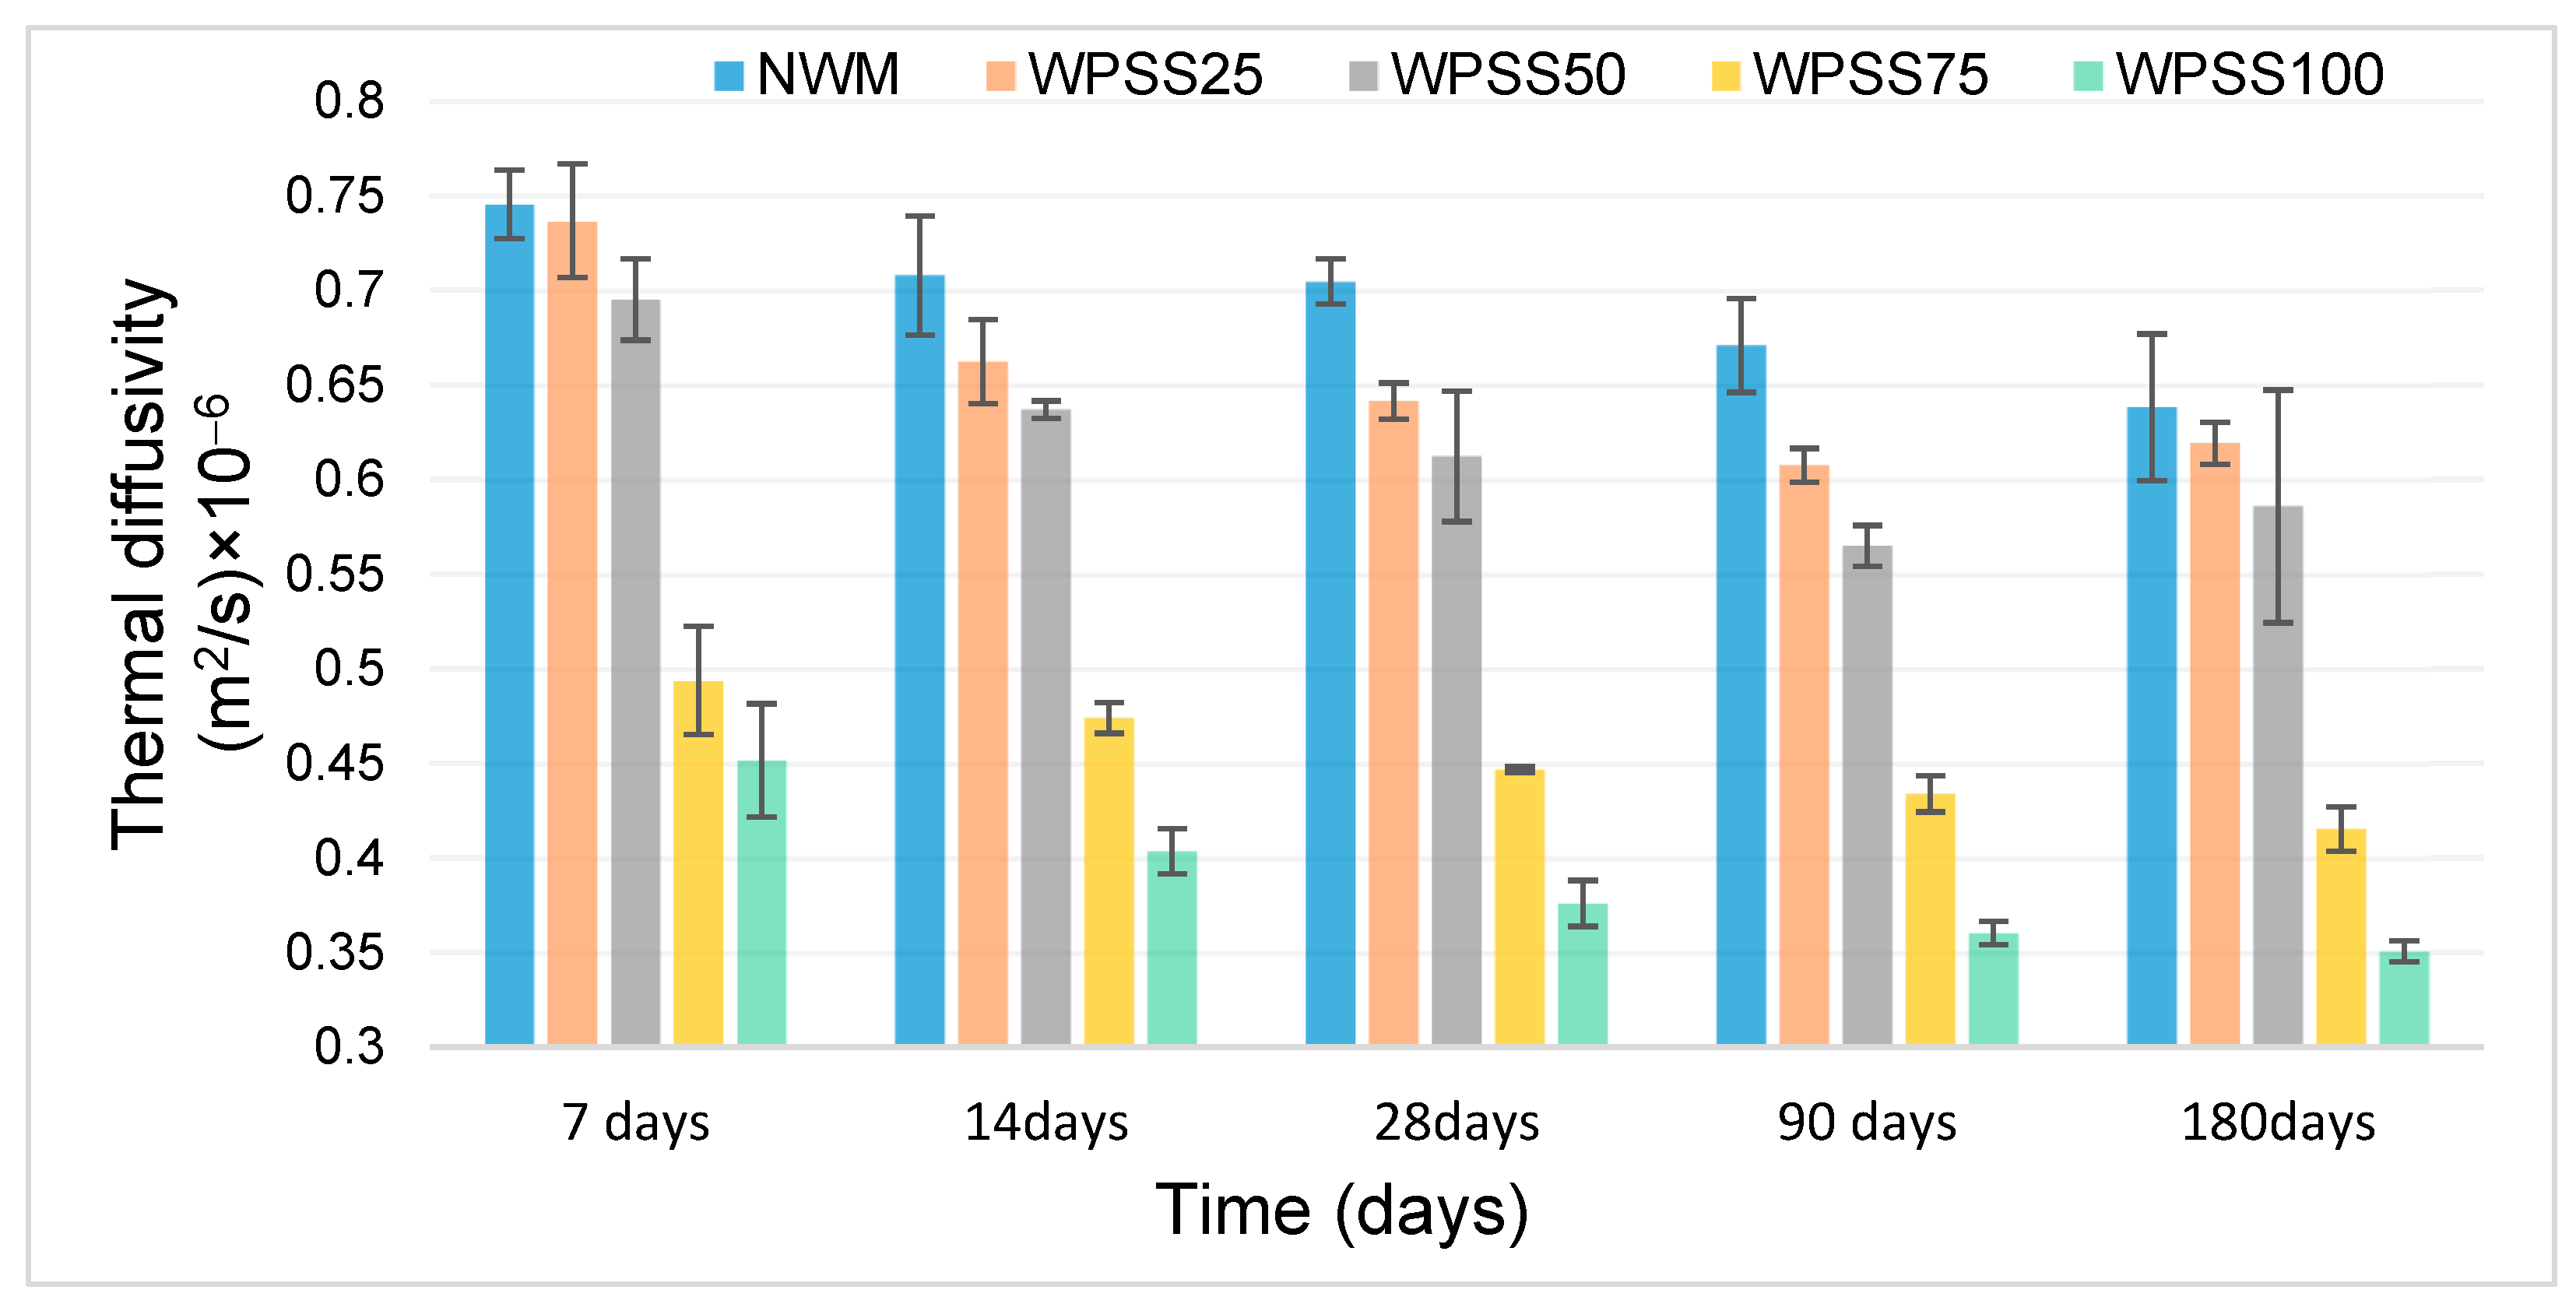
Figure 19 illustrates the variation of thermal diffusivity (a) as a function of time, at room temperature. At 7 days, WPSS25 exhibited a 1% thermal diffusivity decrease, while WPSS100 showed a decrease of 39% with respect to that of control mortar. Likewise, at 180 days, WPSS25 presented a decrease of 3%, while WPSS100 exhibited a decrease of 45% compared with that of the control mortar. It was also observed that the addition of synthesized aggregates leads to a reduction in the thermal diffusivity of WPSS (a = 0.398 × 10⁻⁶ m2/s), which is certainly due to the high LSS content. As a = λ/( ρ ·C), the increase in specific heat capacity and reduction in density due to LSS porosity also contribute to the observed trend. This would also cause a reduction in heat transfer within the composite mortars. It can therefore be said that the lower the diffusivity value, the longer the heat front will take to cross the thickness of the material. These results are similar to those reported by Gouasmi et al. [74] and Attache et al. [79]. It should be noted that this can be highly advantageous when these types of composite mortars are used in sustainable buildings with high energy performance.
The introduction of synthetic aggregates in cementitious composites creates distinct thermal property trade-offs. These lightweight materials significantly reduce density, lowering thermal conductivity through increased air void content and disrupted heat transfer networks. However, their typically low specific heat capacity diminishes the composite’s ability to store thermal energy, while their insulating properties also reduce thermal diffusivity—slowing heat propagation through the material matrix. The presence of PET in the LSS composite aggregate leads to particularly pronounced effects due to its ultra-low thermal mass and hydrophobic nature. These characteristics further decouple the density–conductivity relationship typically observed with mineral aggregates.
Optimal performance requires balancing these interrelated properties, as excessive replacement ratios may preserve insulation but compromise thermal stability under dynamic temperature conditions. The observed behavior underscores the importance of aggregate selection and proportioning to achieve target thermal performance in specialized applications.

3.8. Open Porosity

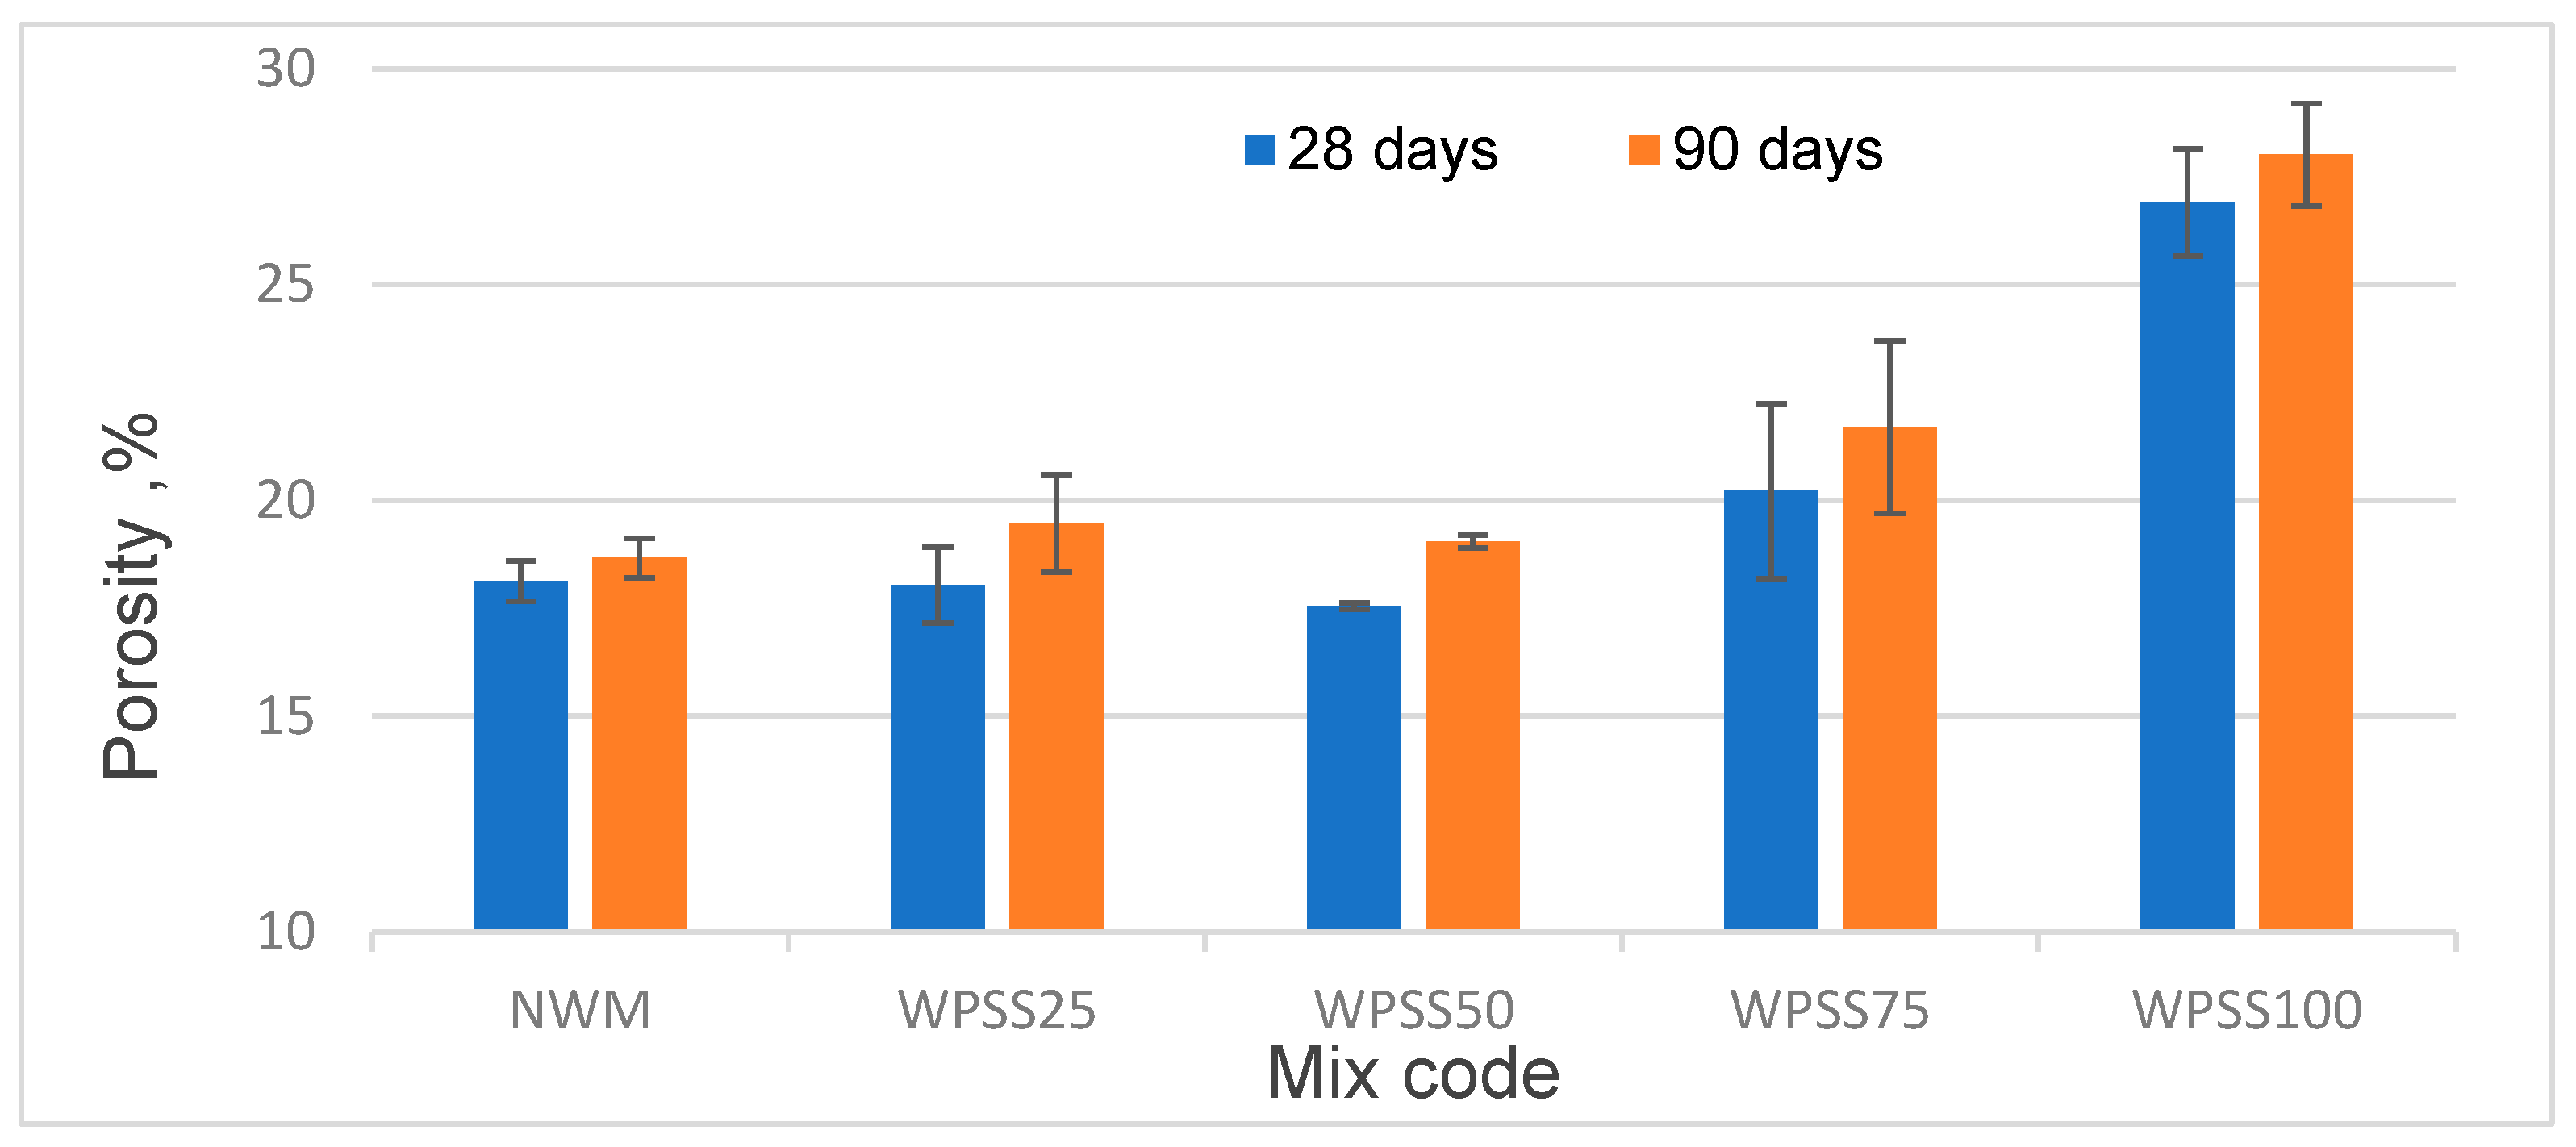
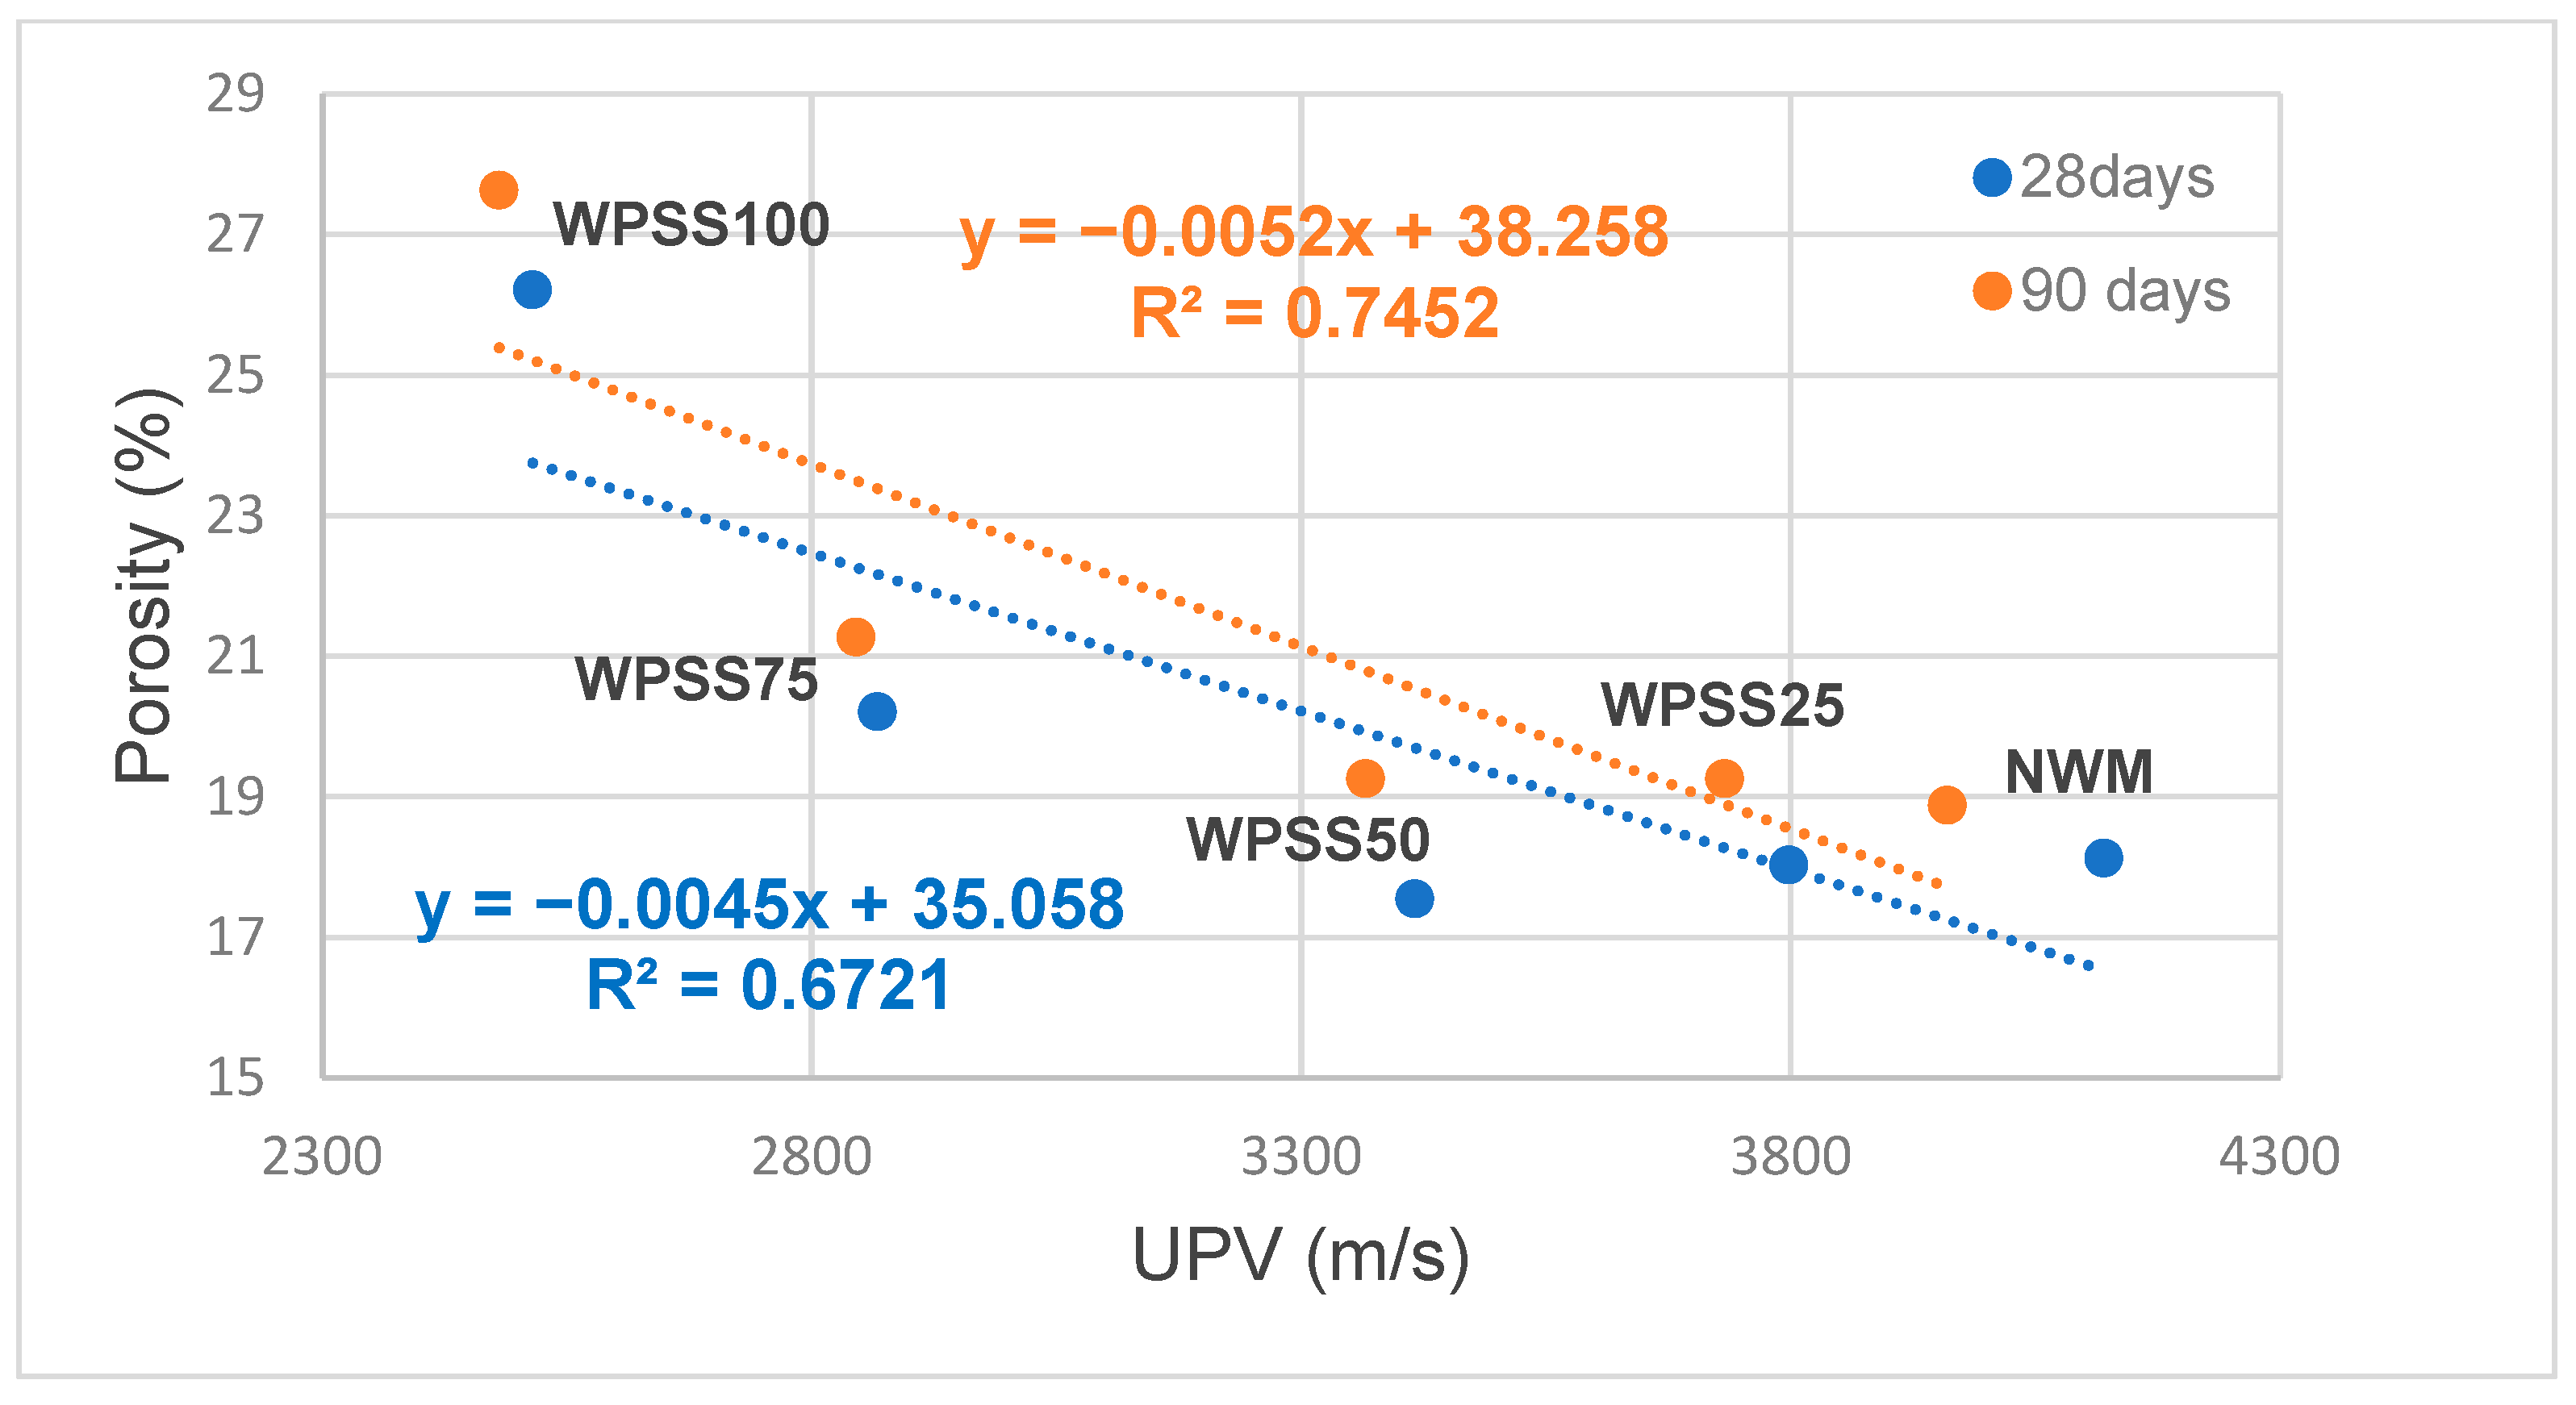
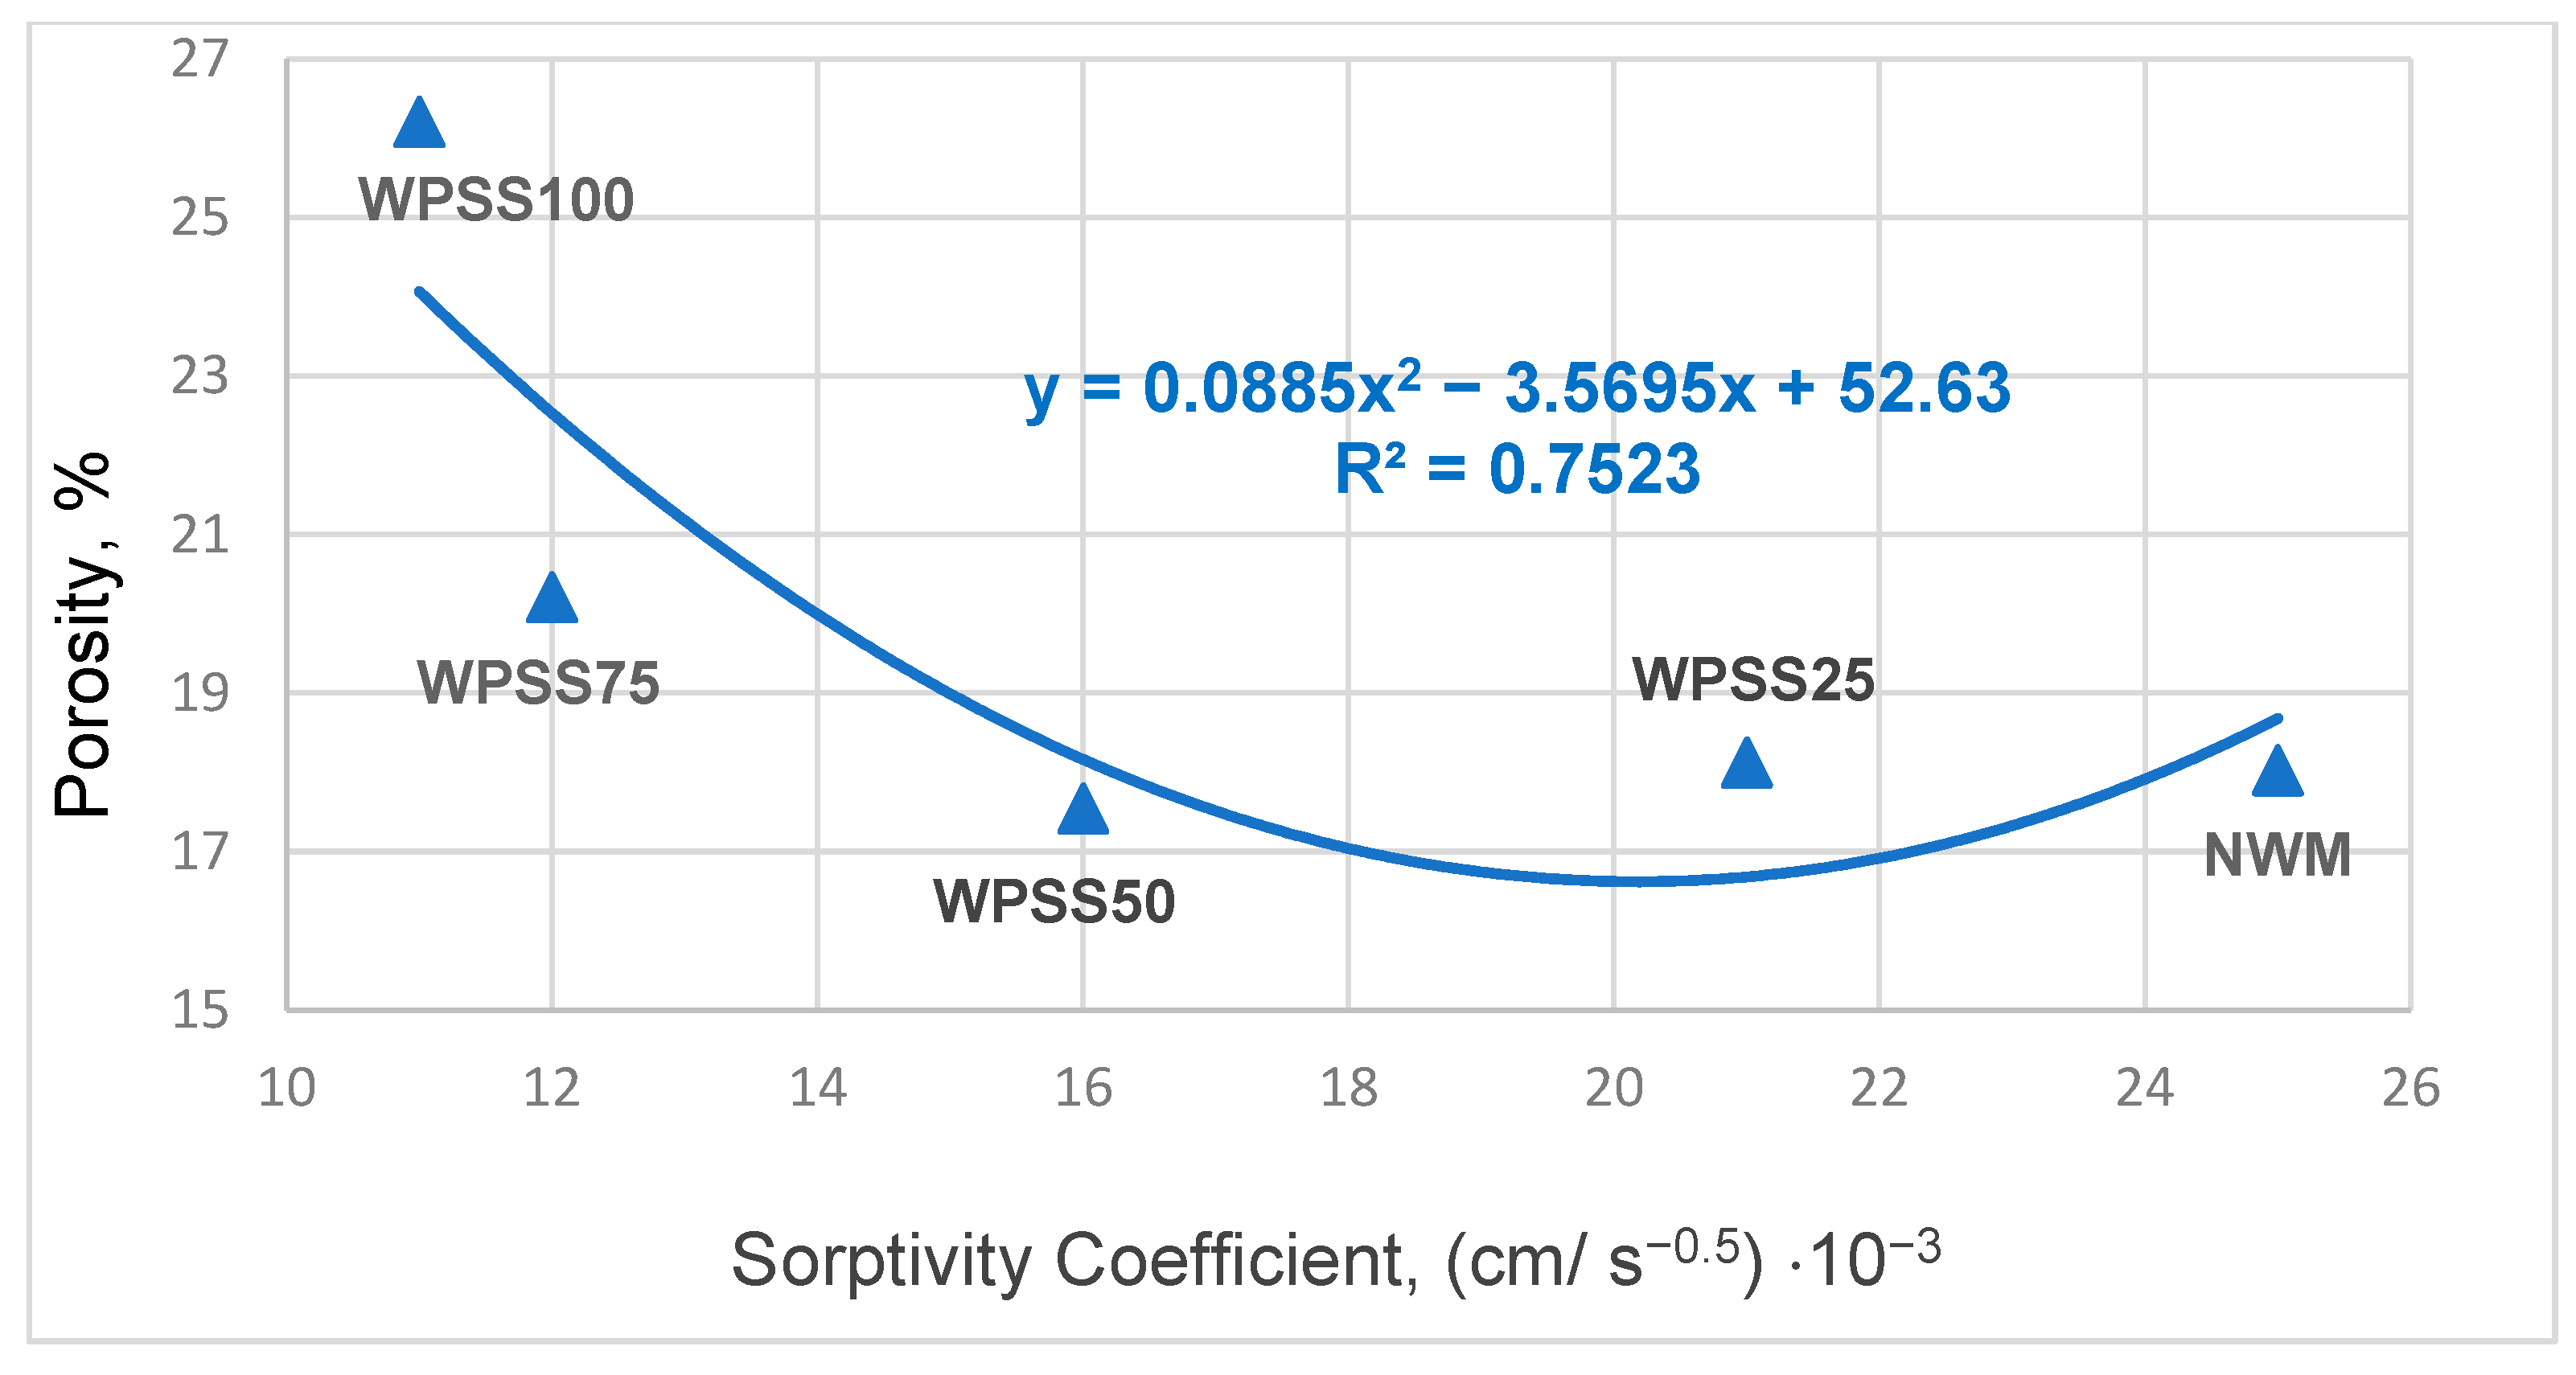
Figure 20 illustrates the open porosity as a function of the synthesized LSS aggregate addition rate. The water-accessible porosity values for NWM, WPSS25, WPSS50, WPSS75, and WPSS100 mortars are 18%, 19%, 19%, 21%, and 27%, respectively. Notably, the porosity of NWM, WPSS25, and WPSS50 mortars remains almost constant, with a significant increase observed only beyond 50% LSS aggregate addition. Furthermore, Erdogmus et al. [42] have noticed that, when the EPS and WRTP dosages increase, the apparent porosities of the brick specimens also increase. They then explain this by pointing to the fact that, following the addition of plastic waste, there was formation of a non-homogeneous mixture which affected the porosity of the brick specimens. The authors then justified this result by pointing to the fact that porosity can be disturbed by two factors, namely the compactness of the mixture and the intrinsic characteristics of LSS. Figure 21 shows the correlation between the porosity values and UPV values, with R2 = 0.74 at 90 days.

3.9. Sorptivity

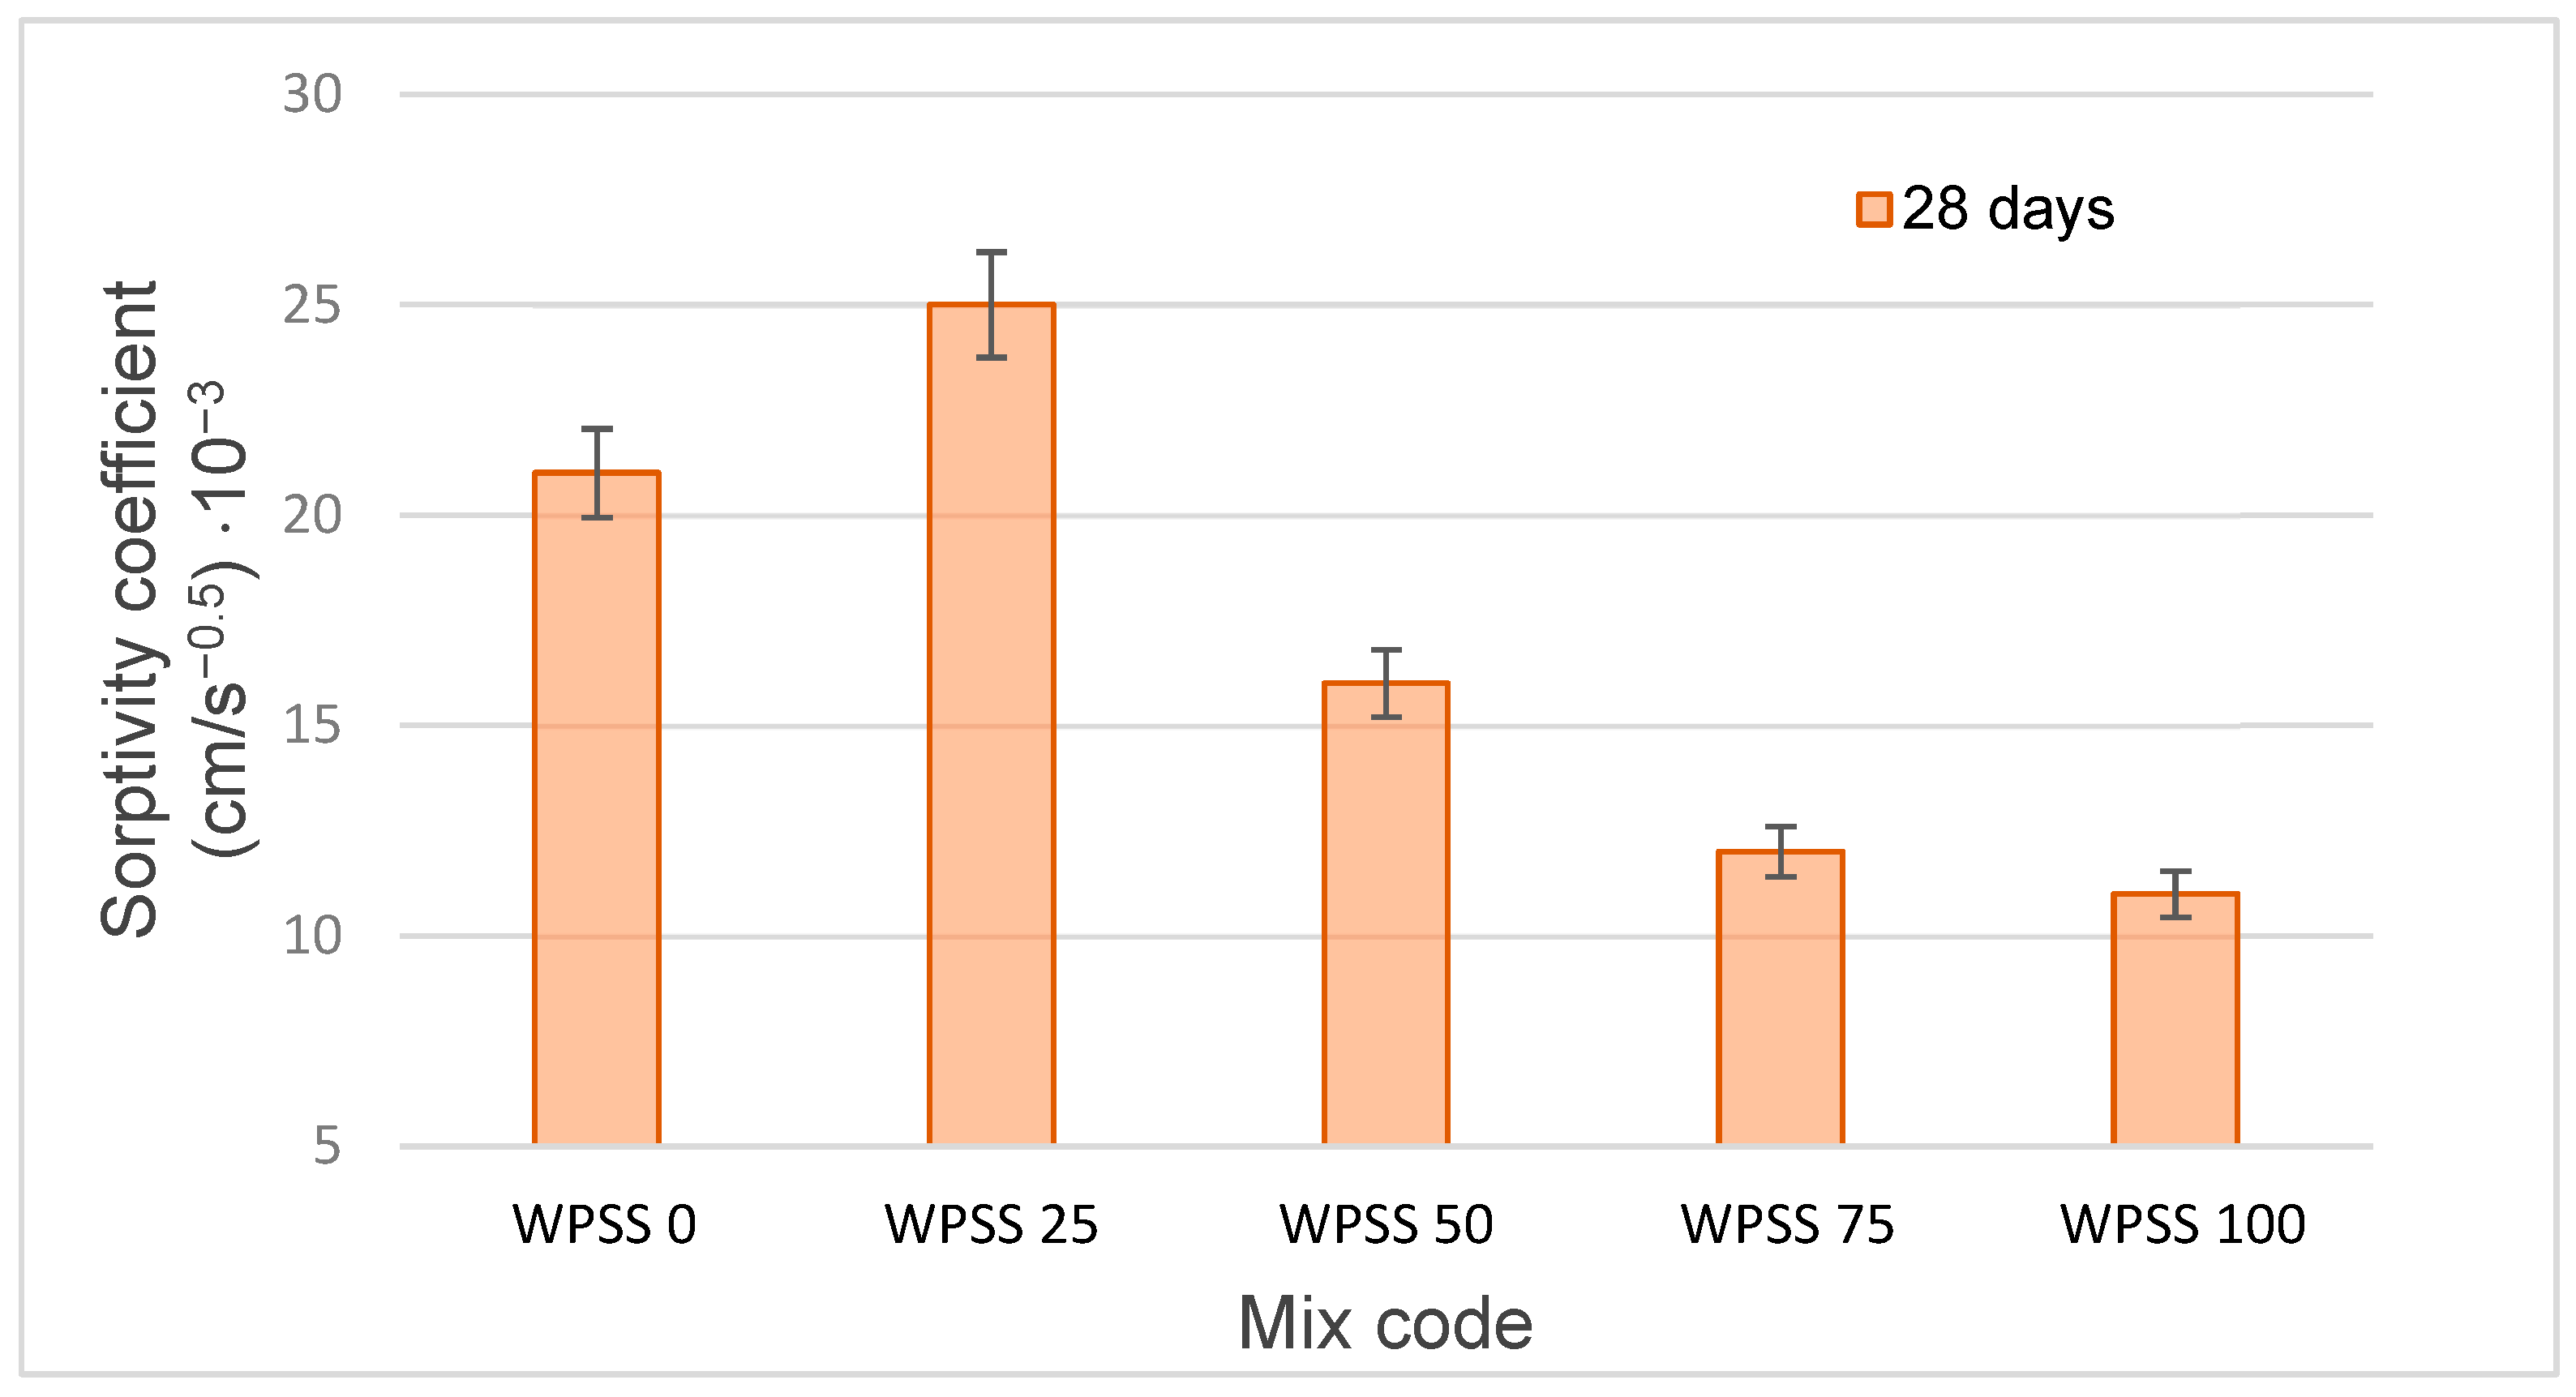
Figure 22 shows that the incorporation of LSS aggregates in mortar significantly improves capillary water absorption resistance at higher substitution levels. While a low plastic content (25%) initially increases sorptivity, mixes containing ≥50% plastic aggregate exhibit progressively enhanced performance. Specifically, the 100% replacement mix (WPSS 100) shows only an 8% decrease in sorptivity when compared with the 19% increase observed for WPSS 25. This positive trend stems from two key mechanisms: (1) the creation of effective moisture barriers via dominant hydrophobic nature of PET plastics, present in LSS aggregates at higher dosages; and (2) the refining of the pore structure via the disruption of interconnected capillary channels that is achieved with LSS aggregates. The most pronounced improvement occurs between 50–75% replacement, where sorptivity decreases substantially, ranging from 25% to 36% below control values, and indicates a critical threshold for optimal pore network modification. These results confirm that sufficient plastic aggregate incorporation (>50%) can effectively enhance the material’s resistance to water penetration, offering valuable durability benefits for construction applications where moisture sensitivity is a concern, while maintaining the ecological advantage of waste plastic utilization in building materials. Figure 23 shows the correlation between the porosity values and the sorptivity values, with R2 = 0.75 at 28 days.

3.10. The Alkali–Silica Reaction

The alkali–silica reaction (ASR) in concrete causes expansion and structural deterioration due to swelling pressures that produce microcracks and make them propagate as a result of the chemical interaction between alkalis and reactive components of the aggregates [81].
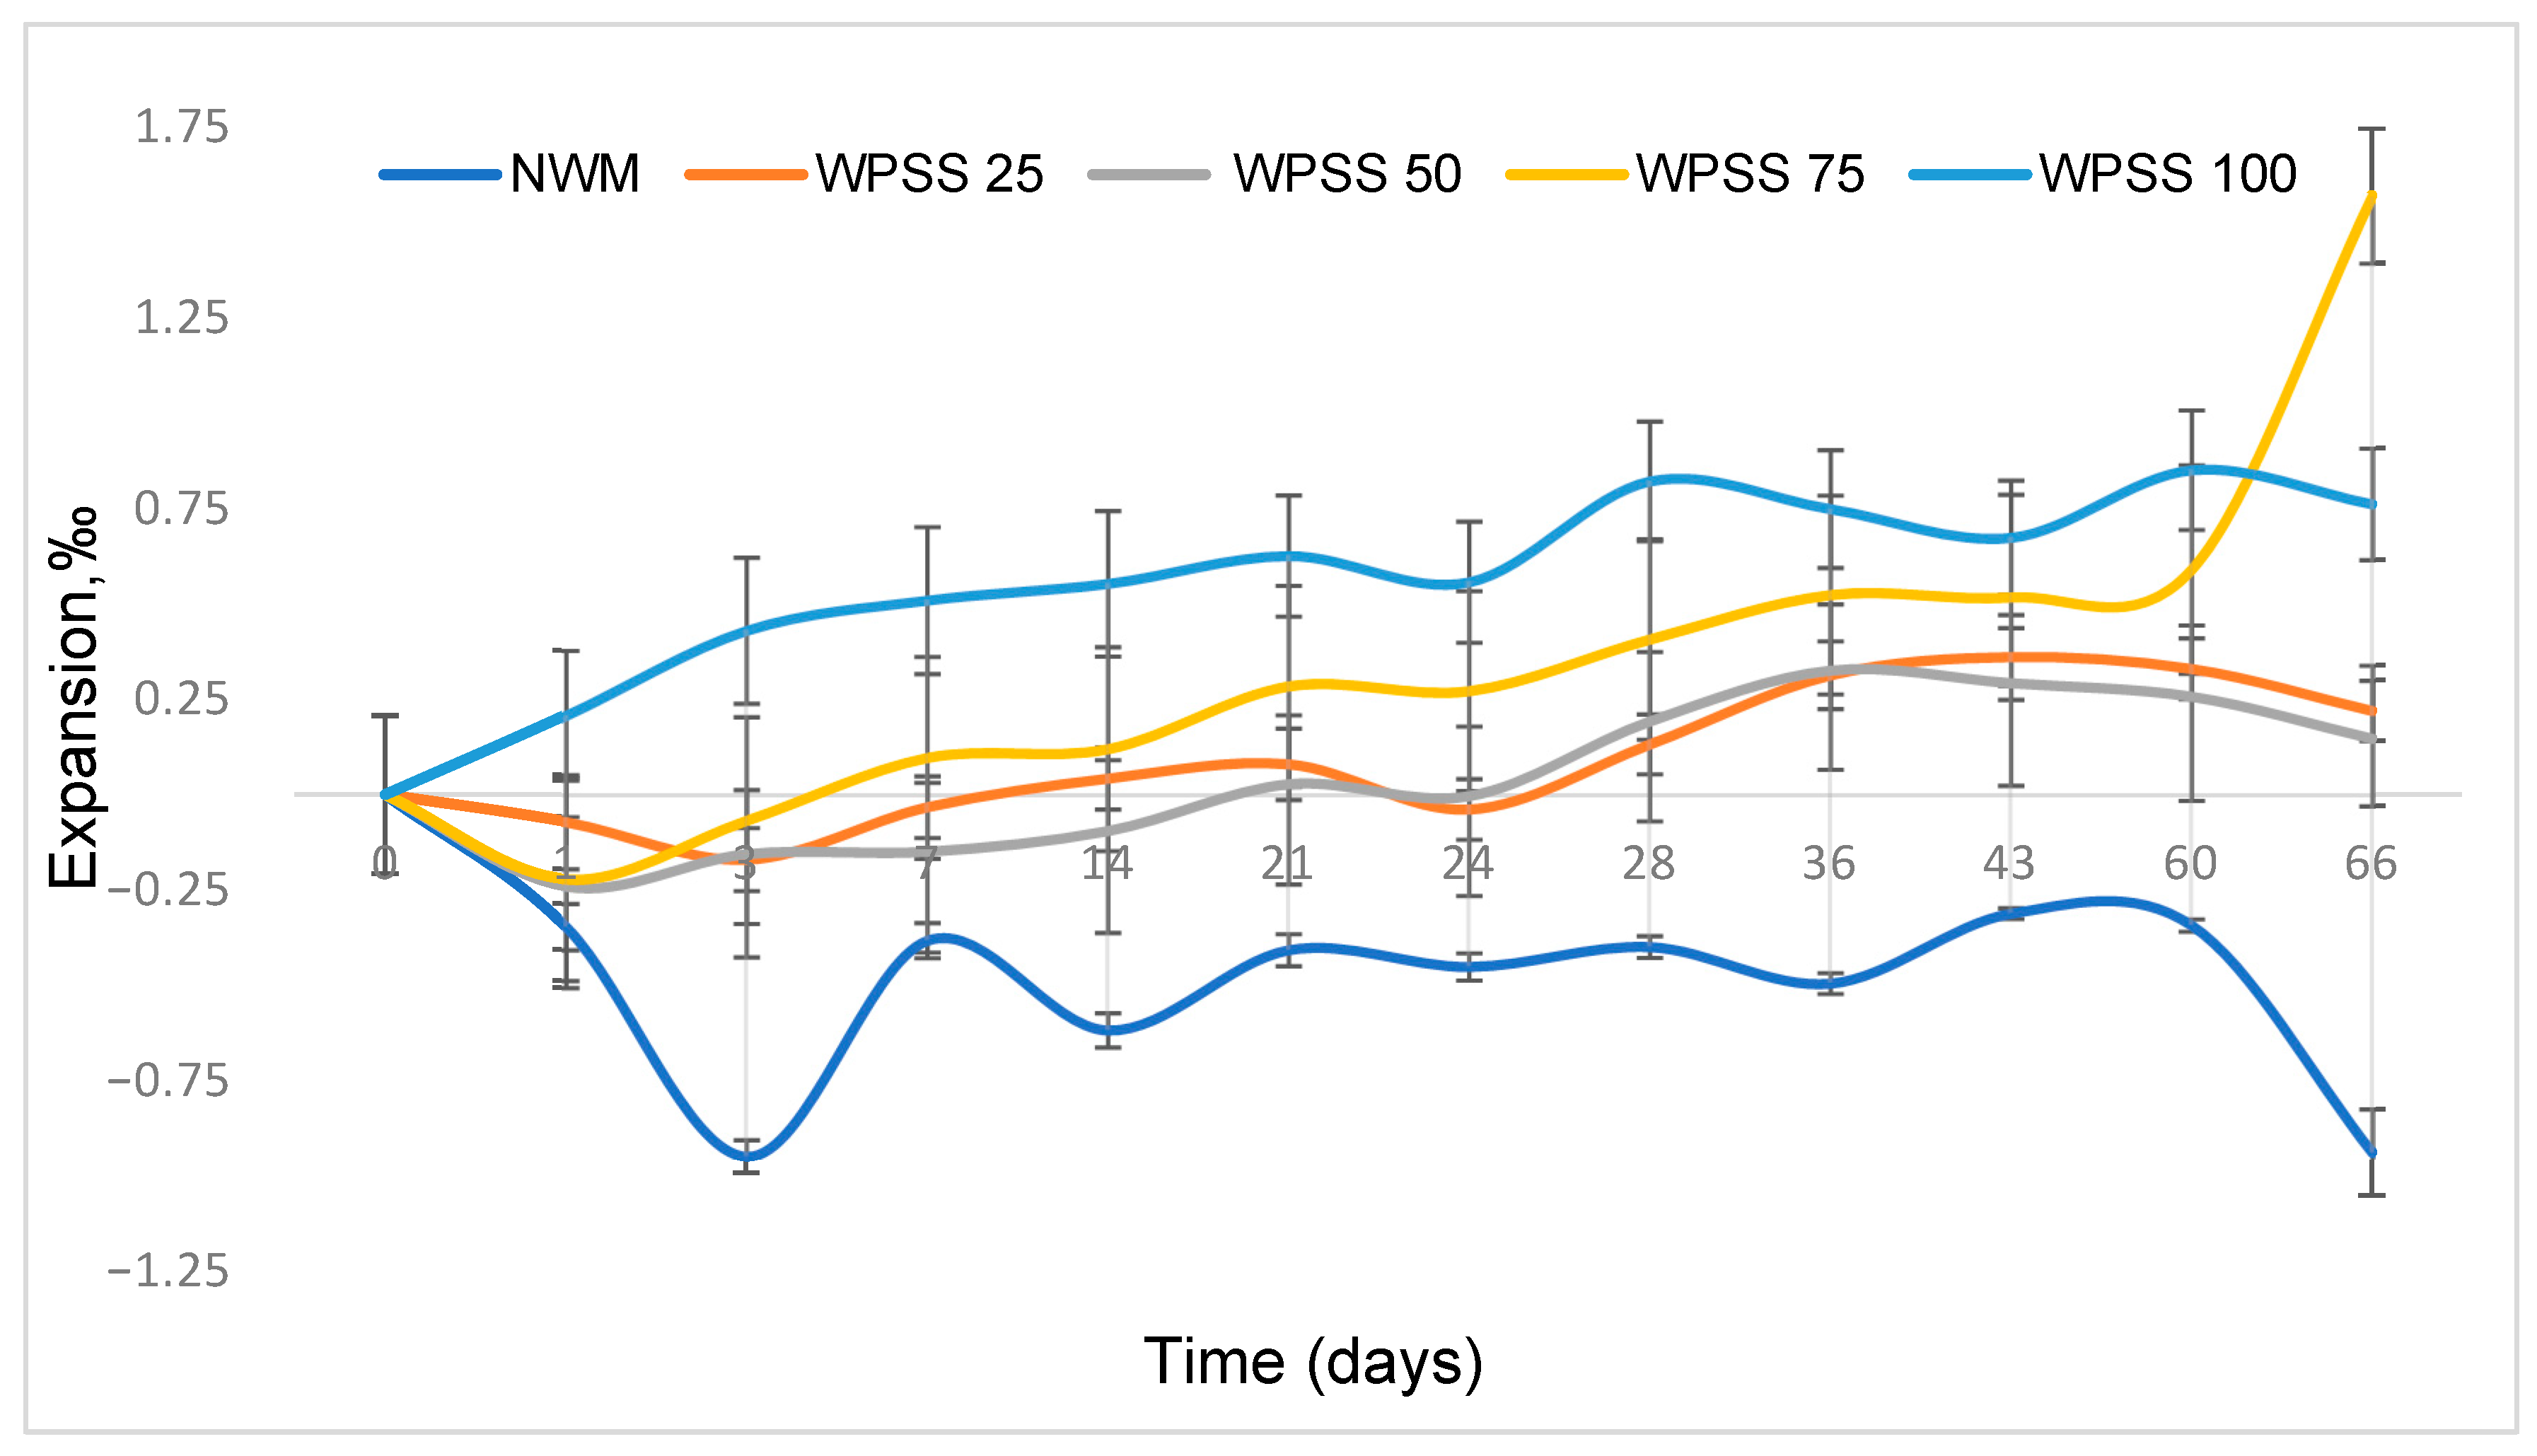
Figure 24 presents the results of the expansion of the mortar samples. According to standard interpretation criteria ASTM C1260 [53], specimens exhibiting an expansion of less than 0.10% are considered non-reactive and thus present no significant risk of deleterious expansion. When the expansion exceeds 0.10%, the specimen is classified as potentially reactive, indicating a moderate risk. Finally, an expansion greater than 0.20% signifies a high risk of deleterious expansion, suggesting that the mixture is highly susceptible to alkali–silica reaction (ASR).
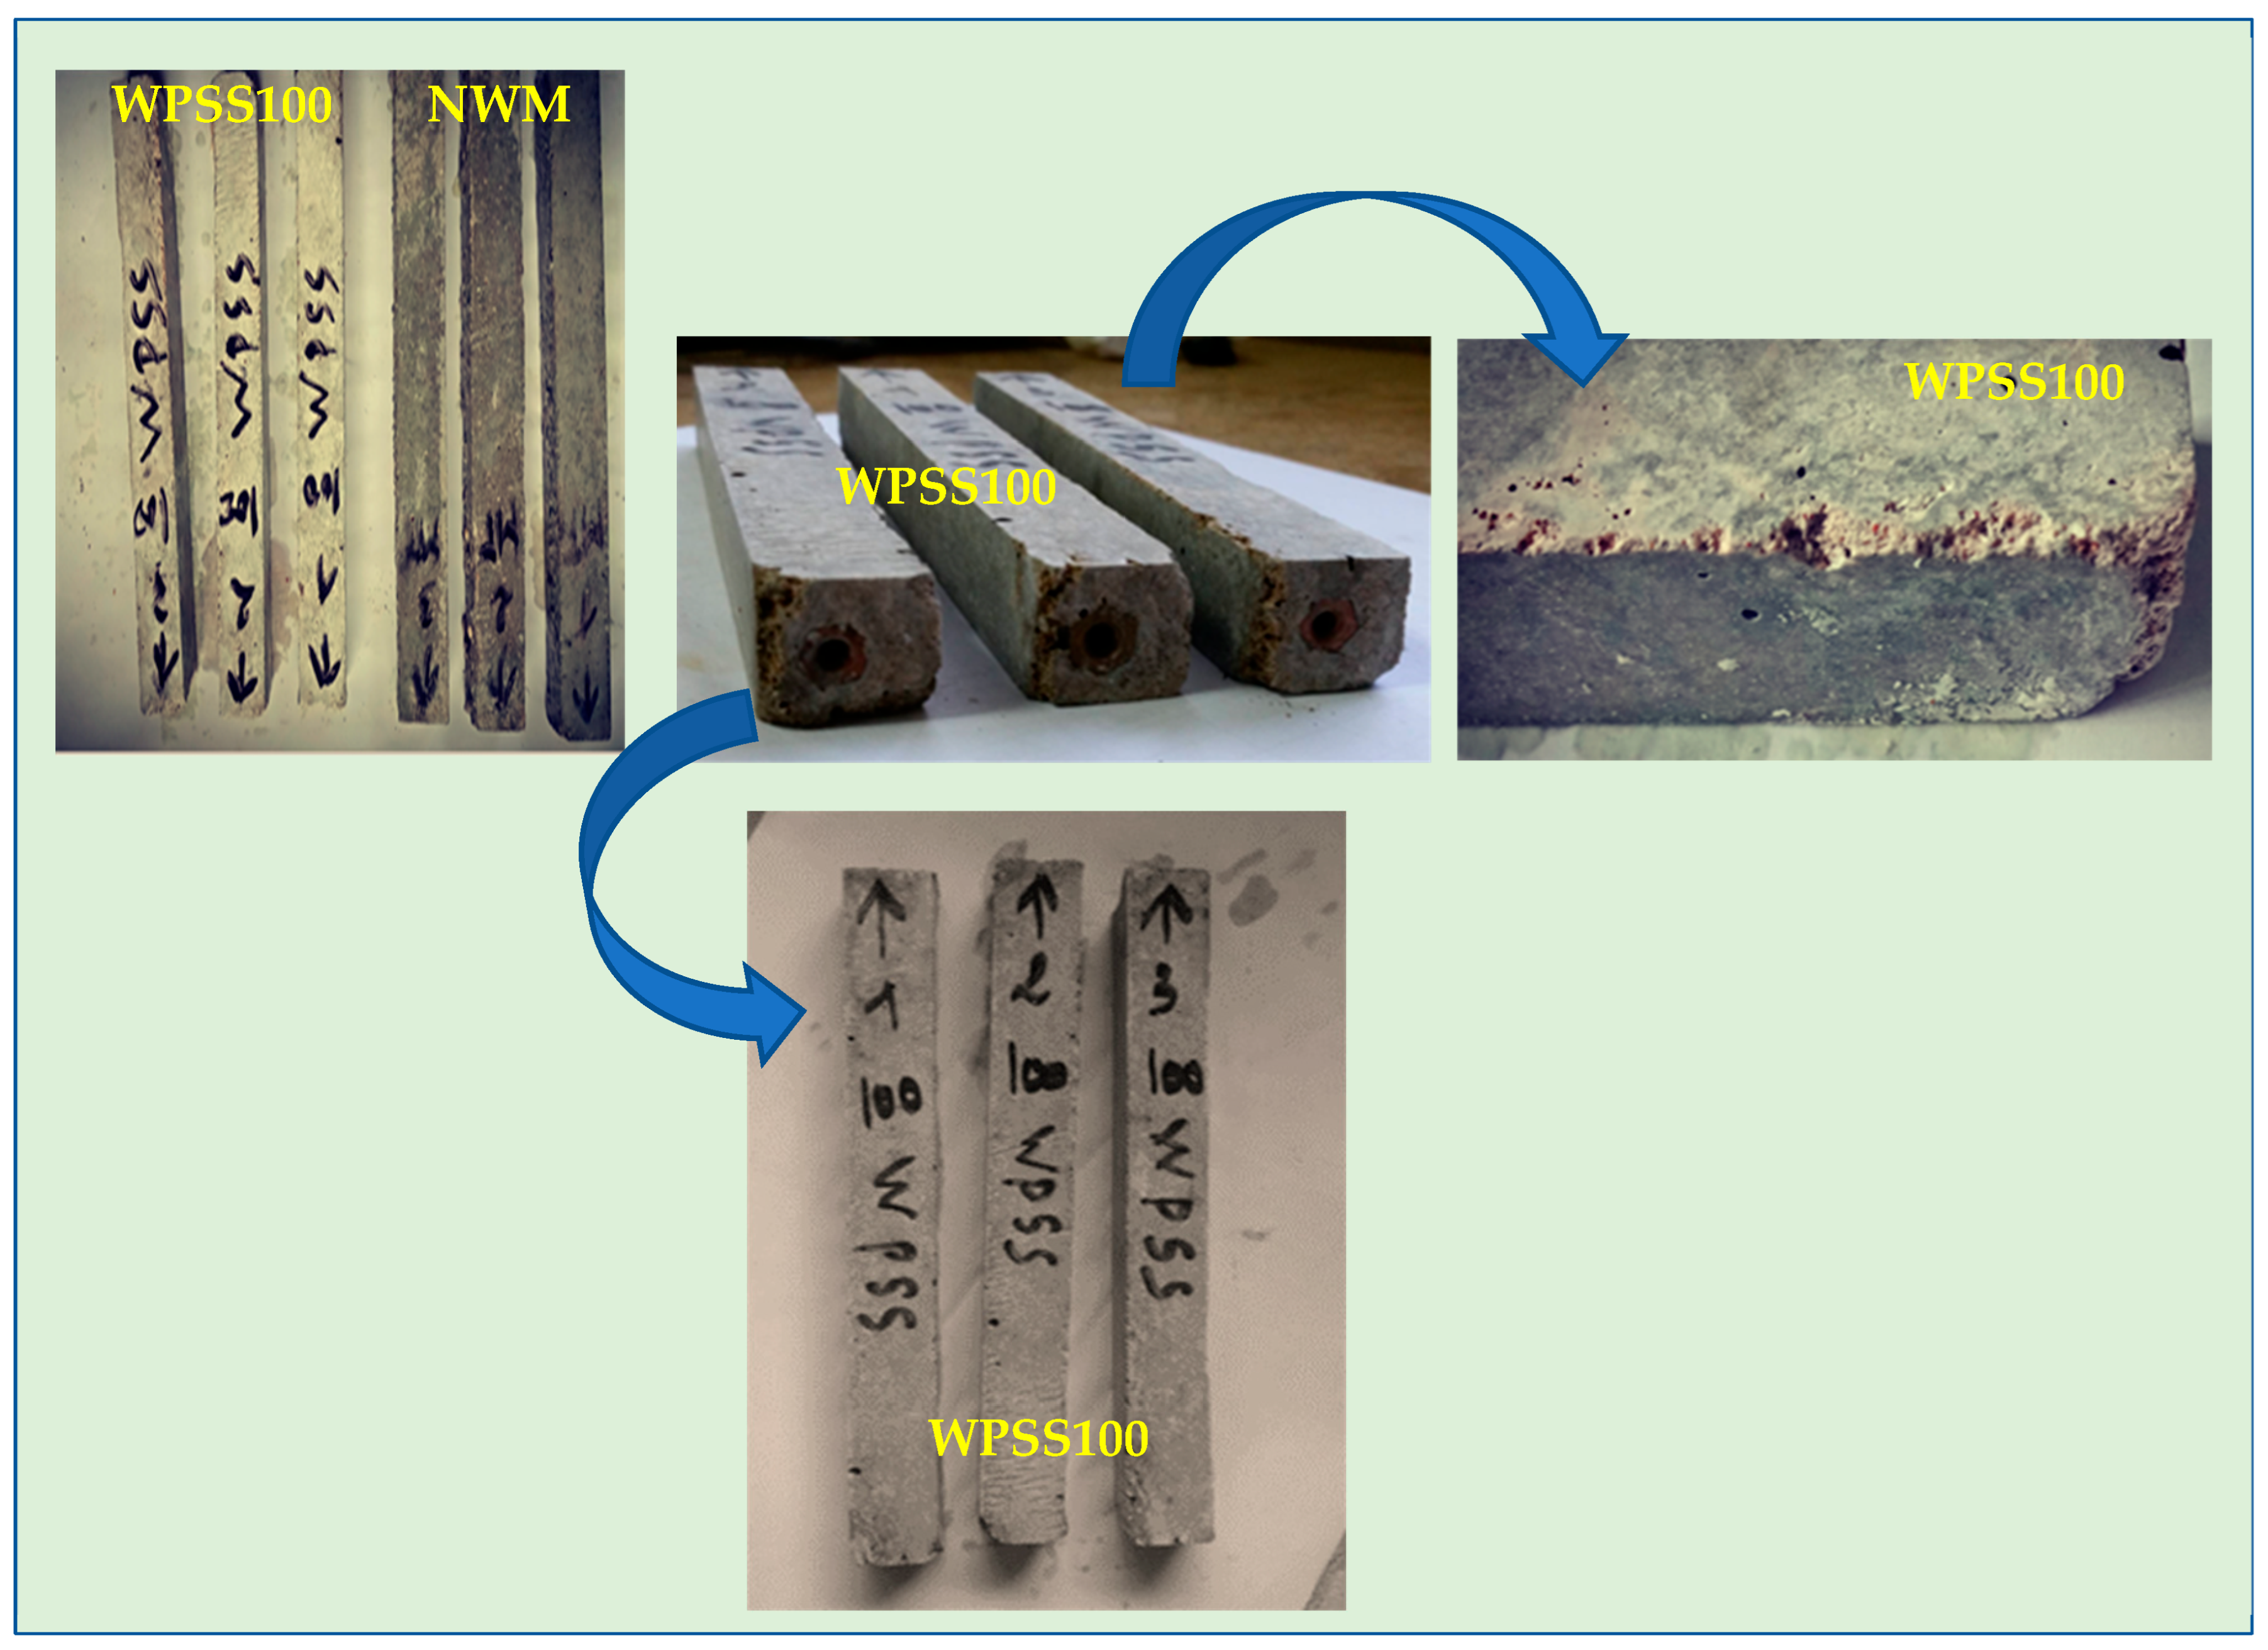
At 14 days, no measurable expansion was observed in any of the composite mortars (WPSS25, WPSS50, WPSS75, and WPSS100). The maximum recorded expansion throughout the test period was limited to 1.57‰ at 66 days, observed in the WPSS75 mixture. This value remains well below the threshold associated with deleterious alkali–silica reaction (ASR), thus confirming the absence of ASR-related expansion in all WPSS mortars. Throughout the monitoring period, specimens were regularly examined for surface cracking and color variations, and no such manifestations were detected (Figure 25).
In this same figure, a slight degradation of the edges of the WPSS100 samples was noted. The NWM sample shows an initial negative expansion and a sharp drop after 65 days. Several factors might explain these observations, as follows: the initial contraction could be due to early-age autogenous shrinkage counteracting alkali–silica reaction (ASR) expansion, while the subsequent late drop might indicate delayed pozzolanic reactions consuming alkalis from impurities within the sand. It is also important to note the scarcity of existing research on ASR tests involving plastic aggregates or lightweight synthesized aggregates (LSS), thereby lending a novel context to these findings. Regarding WPSS mortars, the higher expansion of WPSS75 compared with WPSS100 is likely attributed to microstructural variability: WPSS75 contains 25% natural sand, which provides an additional silica fraction, while WPSS100 uses a fully synthetic LSS aggregate.
In the work of Hacini et al. [14], an increased substitution rate of SPETSB plastic aggregates reduces the probability of an alkali reaction. This limits the short- and medium-term expansion of the mortar, making these aggregates an effective solution for mitigating expansion issues.

3.11. Benefits of LSS Aggregate Incorporation in Mortar

Table 5 demonstrates that incorporating lightweight synthetic aggregates (LSS) significantly enhances mortar performance through several key mechanisms.
The strong correlations (R2 ≥ 0.95) between key properties demonstrate that LSS-modified mortar achieves predictable, well-balanced performance. The near-perfect UPV–density relationship (R2 = 0.9978) confirms that LSS maintains material homogeneity despite reduced density, enabling reliable non-destructive quality control. Notably, thermal conductivity (λ) shows exceptional correlation with both UPV (R2 = 0.9984) and density (R2 = 0.9953), proving that LSS effectively enhances insulation while remaining structurally sound. The quadratic strength–porosity relationship (R2 = 0.9697) reveals that LSS content below 50% optimizes the compromise between strength retention and porosity reduction. Critically, the dynamic modulus (Ed)–compressive strength (Cs) correlation (R2 = 0.9897) validates the idea that LSS preserves elastic performance proportional to strength, ensuring mechanical coherence.
These systematic relationships demonstrate three key benefits of LSS: (1) enhanced thermal efficiency (18% λ reduction at 100% LSS), (2) controllable porosity–sorptivity management (capillary absorption reducible by 48%), and (3) predictable property trade-offs, enabling precision engineering of mortar for specific applications. The data based on Table 5 particularly support the use of 25 to 50% LSS for structural–insulation hybrid applications, where UPV > 3.5 km/s indicates compliance with both thermal and mechanical requirements.

3.12. WPSS Performance Based on Radar Chart Analysis

The radar chart analysis (Figure 26) provides valuable insights into how different WPSS replacement levels affect mortar performance. The comprehensive evaluation of waste plastic–sand substrate (WPSS)-modified mortars reveals distinct performance characteristics across different replacement levels, demonstrating their versatility for tailored construction applications.
At lower replacement levels (≤25% WPSS), the composite maintains approximately 80% of reference mechanical strength while achieving modest thermal improvements, making it particularly suitable for structural applications where load-bearing capacity remains critical. The 50% replacement level emerges as a significant transition point, where thermal conductivity reduction reaches 8% while maintaining sufficient mechanical properties and material homogeneity, as evidenced by preserved ultrasonic pulse velocity values above 3.5 km/s—this balanced performance profile suggests optimal suitability for structural–insulation hybrid applications.
Higher replacement formulations (75–100% WPSS) prioritize thermal performance with reductions up to 18%, following established trends for lightweight composites and indicating their potential for dedicated insulation systems in non-load-bearing applications.
Crucially, all formulations maintain consistent relationships between ultrasonic pulse velocity, density, and strength properties, enabling reliable quality control through non-destructive testing methods. These findings collectively demonstrate that WPSS content can be precisely calibrated to achieve targeted performance characteristics, offering engineers and material specialists the flexibility to develop solutions ranging from high-strength structural components to energy-efficient building envelopes, all while maintaining predictable composite behavior and enabling practical quality assurance through established testing protocols.
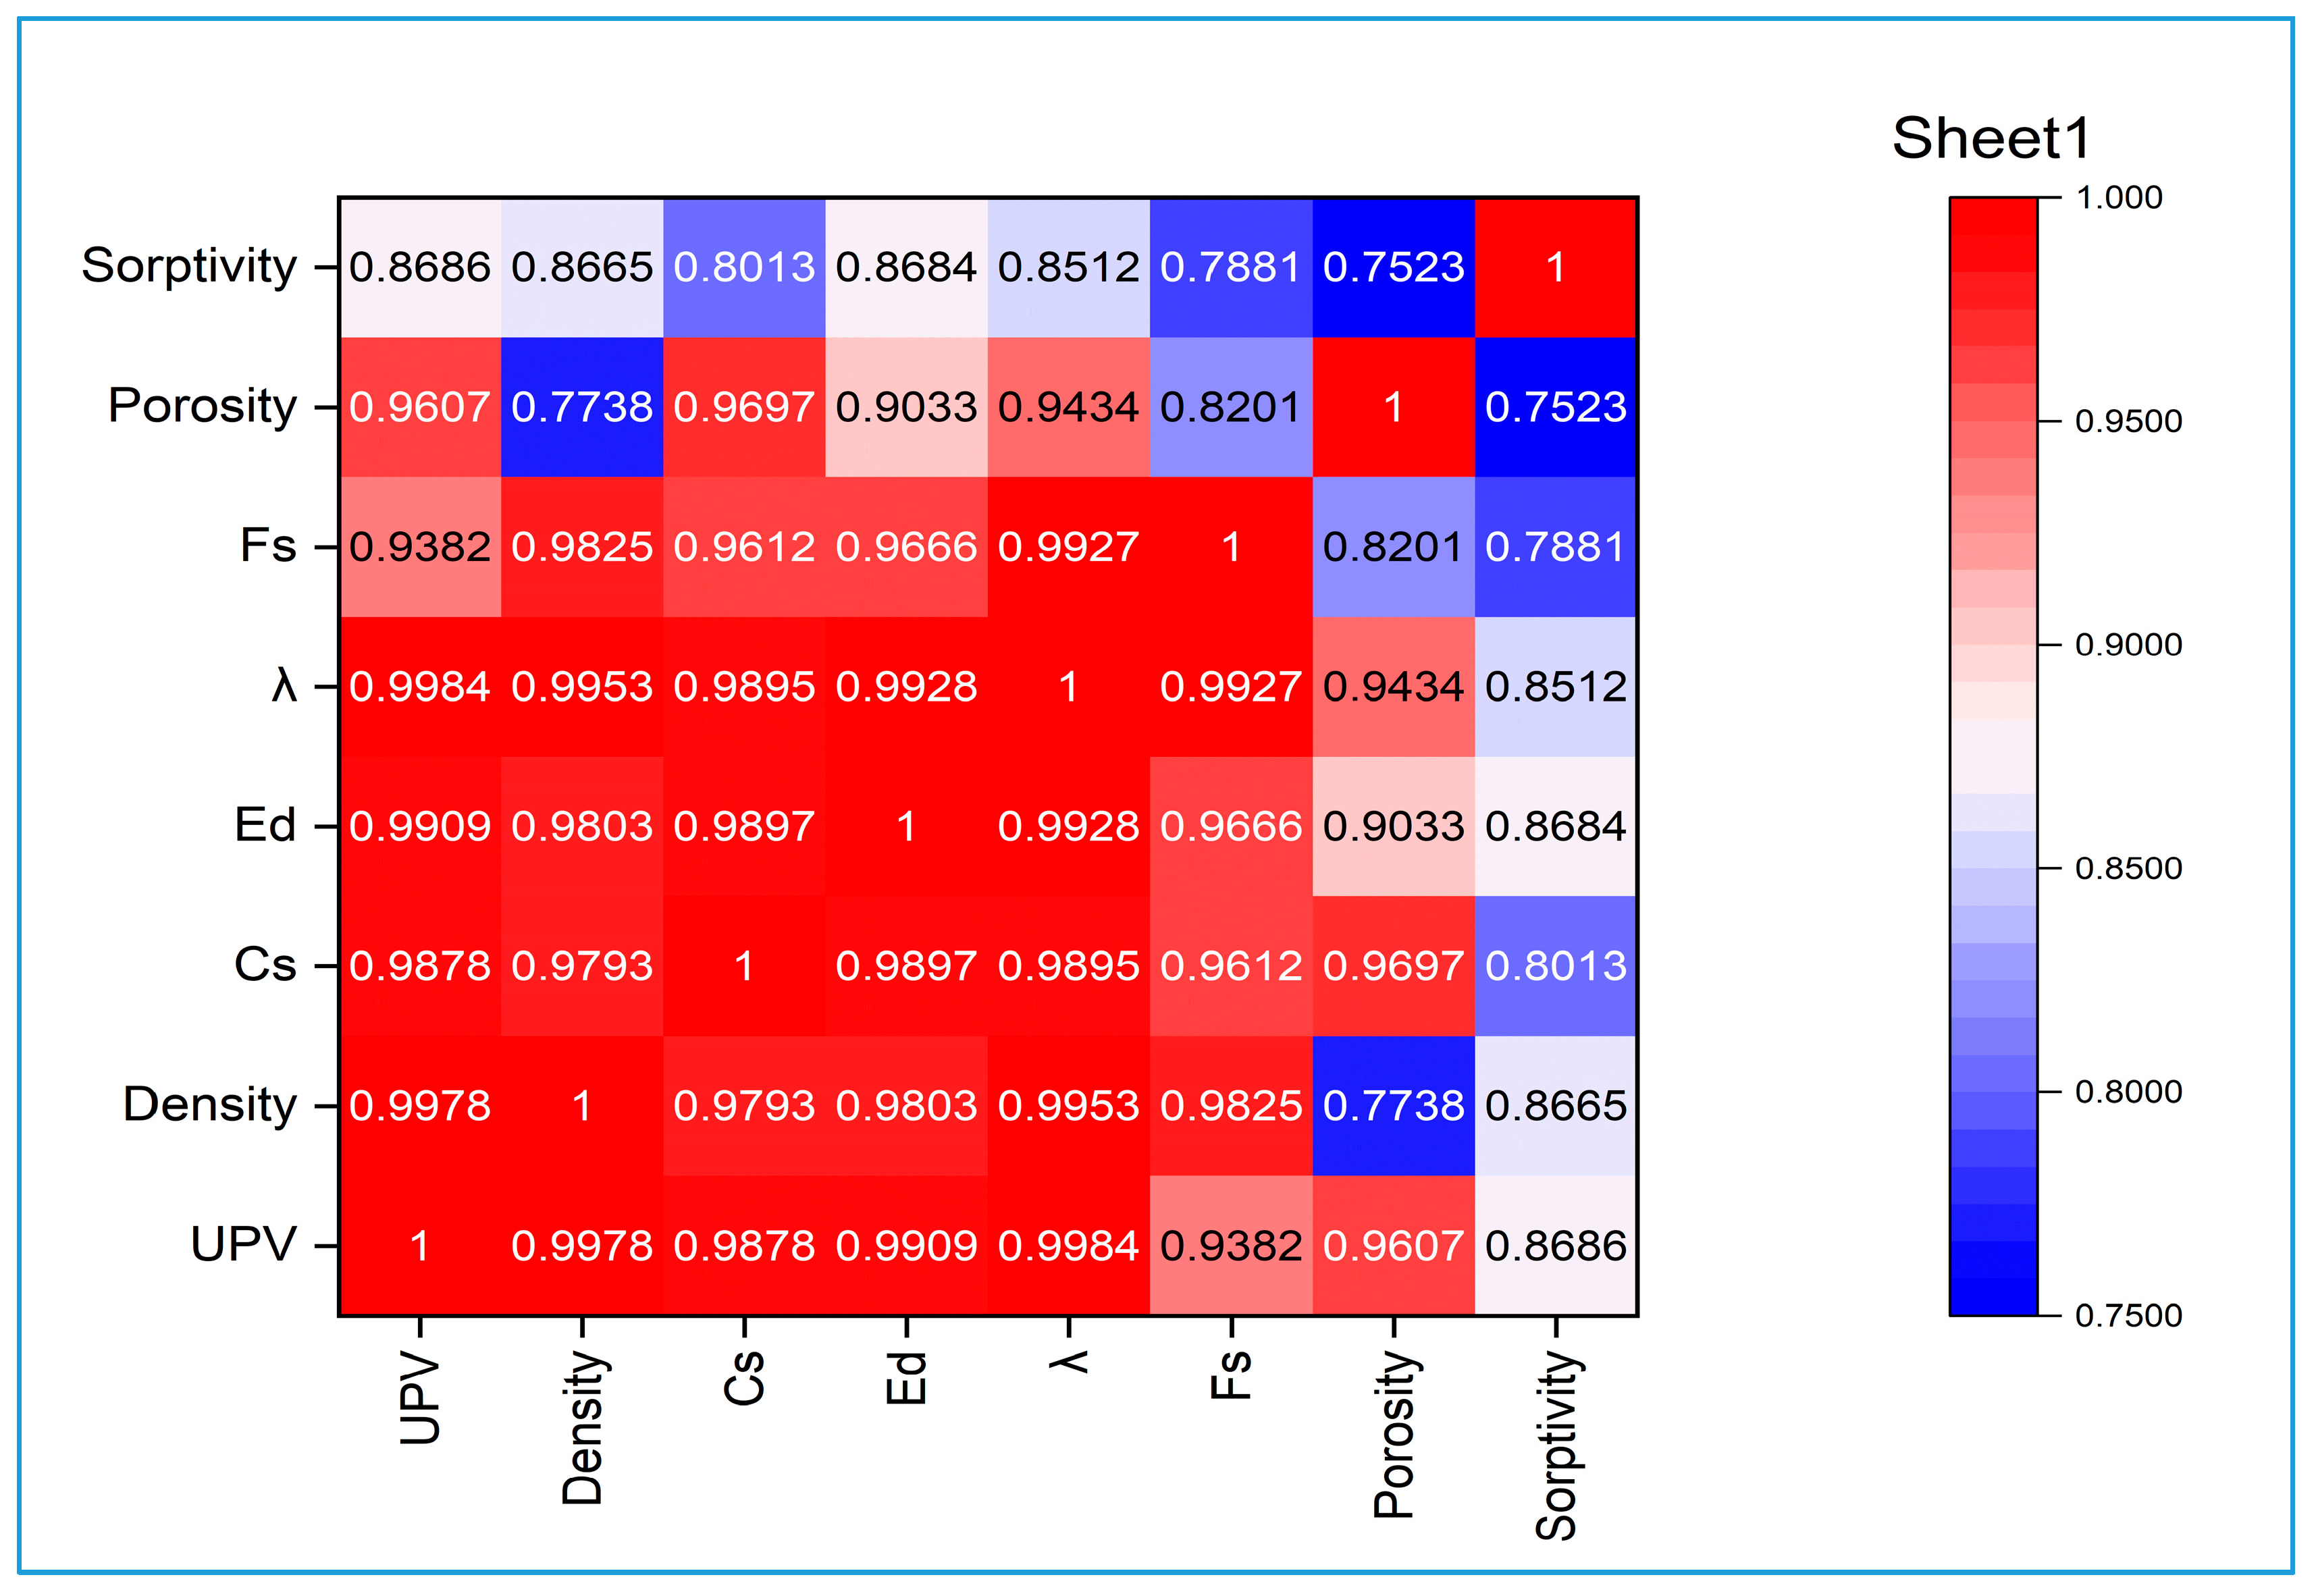
The intricate interrelationships among various material properties were precisely quantified using an R2 correlation heatmap (Figure 27). This analysis revealed exceptionally strong predictive capabilities (R2 > 0.99) between ultrasonic pulse velocity (UPV), density, and Lambda (λ), demonstrating a profound mechanical correlation that extends to fundamental mechanical properties like flexural strength (Fs), compressive strength (Cs), and dynamic modulus (Ed). This comprehensive network of strong correlations positions UPV, density, and Lambda as highly effective, non-destructive proxies for assessing material integrity and stiffness. Furthermore, these parameters exhibited robust predictive power over sorptivity (R2 > 0.95), highlighting their significance in understanding fluid absorption and its implications for durability. While porosity showed moderate correlations (R2 ≈ 0.75), its predictive capacity was less pronounced when compared with the other established relationships. This rigorous assessment provides a critical framework for advanced material design, performance prediction, and the development of predictive models, significantly enhancing the understanding of material science and its mechanical behavior.

4. Conclusions

This paper presents the results of a systematic study that was conducted on the effect of incorporating lightweight synthesized sand (LSS) aggregates on the properties of composite eco-materials, contributing to a circular economy. The results obtained allowed us to draw the following conclusions:
  • The innovative LSS manufacturing process is distinguished by precise parameter control (sand/PET ratio of 35:65, heating temperature of 250 ± 5 °C, and rotation speed of 50–60 rpm), rigorous thermal selection, controlled cooling at 0.5–1 °C/min to optimize crystallization and the semi-crystalline PET matrix, and targeted crushing/sieving to obtain a specific particle size (≤3.15 mm) conforming to standards.
  • Through our research, we have developed a novel thermal treatment protocol that significantly enhances the interfacial transition zone (ITZ) between plastic aggregates and cement matrix, achieving a notable improvement in bonding strength compared with untreated alternatives.
  • The incorporation of LSS into composite mortars reduces the density by 4, 9, 17 and 23% for WPSS25, WPSS50, WPSS75 and WPSS100 mortars, respectively, as compared with that of the control mortar (NWM). Therefore, lightweight eco-composites reduce the size of construction elements, thereby lowering material, logistics, and overall building costs.
  • The incorporation of 25, 50, 75 and 100% of LSS reduced the compressive strength of WPSS25, WPSS50, WPSS75 and WPSS100 mortars by 20, 35, 52 and 70%, respectively, compared with that of the NWM control mortar. This could be useful when these eco-composites are used in applications requiring low strengths, such as paving stones or sidewalk borders.
  • At lower replacement levels (≤25% WPSS), the composite maintains approximately 80% of reference mechanical strength while achieving modest thermal improvements, making it particularly suitable for structural applications where load-bearing capacity remains critical.
  • Adding LSS significantly decreases UPV, with reductions from 8% to 39% as its content increases from 25% to 100%. Notably, the WPSS25 composite mortar meets the UPV criteria for structural applications.
  • LSS aggregates incorporated into WPSS100 composite mortars slightly increased the ductility but reduced the dynamic modulus of elasticity (Ed) by 18%, 36%, 58% and 69% for the mixtures containing 25%, 50%, 75% and 100% LSS, respectively, compared with that of NWM. These mortars can therefore be used to produce more flexible and more resistant eco-cementitious materials.
  • The thermal performance of WPSS composites was improved. Indeed, the thermal conductivity of WPSS25, WPSS50, WPSS75, and WPSS100 mixtures was improved by 4%, 8%, 14%, and 18%, respectively, compared with that of NWM. This result encourages us to apply this type of synthesized aggregate LSS in thermal insulation materials due to its energy performance.
  • The measured sorptivity coefficient decreased progressively with increasing WPSS content. Compared with NWM, the sorptivity was reduced by approximately 22%, 38%, 43%, and 46% for WPSS 50, WPSS 75, and WPSS 100, respectively. Therefore, the incorporation of LSS can be considered more durable, with enhanced resistance to water penetration, making it suitable for use in eco-efficient cement-based materials.
  • The eco-friendly composite mortars are not susceptible to alkali–silica reaction, which confirms their potential to improve the durability of structures. This feature offers a promising solution to prevent problems related to the reactivity of aggregates.
  • This study represents an important contribution to the field of recycling plastic waste as aggregates to be used in mortar and concrete. It has provided valuable information on various potential applications of the composite aggregates in clean green buildings.
From a circular economy perspective, this work provides both a technological pathway and scientific basis for valorizing plastic waste in construction. Future research directions should prioritize (1) full life-cycle assessment LCA to quantify net environmental benefits, (2) industrial-scale production trials, and (3) the development of standardized testing protocols for plastic-modified construction materials. These steps will facilitate the translation of our laboratory findings into practical, sustainable building solutions that address both plastic pollution and energy efficiency challenges in the construction sector.

Author Contributions

Conceptualization, A.S.B., M.H. and A.B.; methodology, A.B., A.S.B., M.H., Y.S. and N.L.; writing—original draft preparation, A.S.B. and M.H.; writing—review and editing, A.S.B., M.H., W.M. and A.B.; visualization, A.S.B. and M.H.; supervision, M.H., A.S.B. and W.M.; resources W.M. and M.M. All authors have read and agreed to the published version of the manuscript.

Funding

This research received no external funding.

Data Availability Statement

The original contributions presented in this study are included in the article. Further inquiries can be directed to the corresponding authors.

Acknowledgments

This work was completed as a result of financial aid from the Ministry of Higher Education and Scientific Research in Algeria, within the framework of the PRFU project A01L02EP130220220001 and the DGRSDT.

Conflicts of Interest

The authors declare no conflicts of interest.

References

  1. Hees, T.; Zhong, F.; Stürzel, M.; Mülhaupt, R. Tailoring hydrocarbon polymers and all-hydrocarbon composites for circular economy. Macromol. Rapid Commun. 2019, 40, 1800608. [Google Scholar] [CrossRef] [PubMed]
  2. Hachemi, H.; Seladji, C.; Negadi, L.; Bhandari, R.; Aryal, S.; Sacko, B.D.D. Improving municipal solid waste management in Algeria and exploring energy recovery options. Renew. Energy 2024, 230, 120861. [Google Scholar] [CrossRef]
  3. A.N.D. Available online: https://and.dz/caracterisation-des-dechets-menagers-et-assimiles-campagne-nationale-2018-2019/ (accessed on 1 June 2025).
  4. Pacheco-Torgal, F.; Khatib, J.; Colangelo, F.; Tuladhar, R. Use of Recycled Plastics in Eco-Efficient Concrete; Woodhead Publishing: Sawston, UK, 2019. [Google Scholar]
  5. Gu, L.; Ozbakkaloglu, T. Use of recycled plastics in concrete: A critical review. Waste Manag. 2016, 51, 19–42. [Google Scholar] [CrossRef] [PubMed]
  6. Almeshal, I.; Tayeh, B.A.; Alyousef, R.; Alabduljabbar, H.; Mohamed, A.M.; Alaskar, A. Use of recycled plastic as fine aggregate in cementitious composites: A review. Constr. Build. Mater. 2020, 253, 119146. [Google Scholar] [CrossRef]
  7. Abeysinghe, S.; Gunasekara, C.; Bandara, C.; Nguyen, K.; Dissanayake, R.; Mendis, P. Engineering performance of concrete incorporated with recycled high-density polyethylene (HDPE)—A systematic review. Polymers 2021, 13, 1885. [Google Scholar] [CrossRef]
  8. Babafemi, A.J.; Šavija, B.; Paul, S.C.; Anggraini, V. Engineering properties of concrete with waste recycled plastic: A review. Sustainability 2018, 10, 3875. [Google Scholar] [CrossRef]
  9. ACI 213R, Guide for Structural Lightweight Aggregate Concrete; American Concrete Institute Committee 213R: Farmington Hills, MI, USA, 2014.
  10. Abduallah, R.; Burris, L.; Castro, J.; Sezen, H. Utilization of Different Types of Plastics in Concrete Mixtures. Constr. Mater. 2025, 5, 39. [Google Scholar] [CrossRef]
  11. Alkhrissat, T. Impact of adding waste polyethylene (PE) and silica fume (SF) on the engineering properties of cement mortar. Case Stud. Chem. Environ. Eng. 2024, 9, 100731. [Google Scholar] [CrossRef]
  12. Benosman, A.S.; Taibi, H.; Mouli, M.; Senhadji, Y.; Belbachir, M.; Bahlouli, I.; Houivet, D. Effect of addition of PET on the mechanical performance of PET-Mortar Composite materials. J. Mater. Environ. Sci. 2015, 6, 559–571. [Google Scholar]
  13. Caniato, M.; Cozzarini, L.; Schmid, C.; Gasparella, A. Acoustic and thermal characterization of a novel sustainable material incorporating recycled microplastic waste. Sustain. Mater. Technol. 2021, 28, e00274. [Google Scholar] [CrossRef]
  14. Hacini, M.; Benosman, A.S.; Tani, N.K.; Mouli, M.; Senhadji, Y.; Badache, A.; Latroch, N. Utilization and assessment of recycled polyethylene terephthalate strapping bands as lightweight aggregates in Eco-efficient composite mortars. Constr. Build. Mater. 2021, 270, 121427. [Google Scholar] [CrossRef]
  15. Kaur, G.; Pavia, S. Physical properties and microstructure of plastic aggregate mortars made with acrylonitrile-butadiene-styrene (ABS), polycarbonate (PC), polyoxymethylene (POM) and ABS/PC blend waste. J. Build. Eng. 2020, 31, 101341. [Google Scholar] [CrossRef]
  16. Latroch, N.; Benosman, A.S.; Bouhamou, N.; Senhadji, Y.; Mouli, M.; Badache, A. Effect of High Temperature on Composite Mortars Containing Hazardous Expanded Polyvinyl Chloride Waste. J. Hazard. Toxic Radioact. Waste 2021, 25, 04021011. [Google Scholar] [CrossRef]
  17. Thorneycroft, J.; Orr, J.; Savoikar, P.; Ball, R.J. Performance of structural concrete with recycled plastic waste as a partial replacement for sand. Constr. Build. Mater. 2018, 161, 63–69. [Google Scholar] [CrossRef]
  18. Mouzoun, K.; Bouyahyaoui, A.; Abdelali, H.M.; Cherradi, T.; Baba, K.; Masrour, I.; Zemed, N. Comparative assessment of PVC waste and natural sand in concrete and mortar: Structural, environmental, and economic implications. Eur. J. Environ. Civ. Eng. 2025, 1–29. [Google Scholar] [CrossRef]
  19. Al-Noaimat, Y.A.; Sambucci, M.; Chougan, M.; El-Seidy, E.; Biblioteca, I.; Valente, M.; Tirillò, J.; Al-Kheetan, M.J.; Ghaffar, S.H. Sustainable repurposing of polyvinyl chloride waste as aggregates in limestone-calcined clay cement. J. Clean. Prod. 2025, 491, 144862. [Google Scholar] [CrossRef]
  20. Limami, H.; Manssouri, I.; Cherkaoui, K.; Khaldoun, A. Study of the suitability of unfired clay bricks with polymeric HDPE & PET wastes additives as a construction material. J. Build. Eng. 2020, 27, 100956. [Google Scholar] [CrossRef]
  21. Del Rey Castillo, E.; Almesfer, N.; Saggi, O.; Ingham, J.M. Light-weight concrete with artificial aggregate manufactured from plastic waste. Constr. Build. Mater. 2020, 265, 120199. [Google Scholar] [CrossRef]
  22. Ikechukwu, A.F.; Shabangu, C. Strength and durability performance of masonry bricks produced with crushed glass and melted PET plastics. Case Stud. Constr. Mater. 2021, 14, e00542. [Google Scholar] [CrossRef]
  23. Aneke, F.I.; Shabangu, C. Green-efficient masonry bricks produced from scrap plastic waste and foundry sand. Case Stud. Constr. Mater. 2021, 14, e00515. [Google Scholar] [CrossRef]
  24. Webo, W.; Khoathane, M.C.; Mhike, W.; Mohlamonyane, R.S. Enhancing sustainability: Composite materials from recycled HDPE and denim fillers. Polym. Eng. Sci. 2025, 65, 2395–2404. [Google Scholar] [CrossRef]
  25. Alahmad, F.; Al Abdallah, H.; El Maaddawy, T.; Abu-Jdayil, B. Development of Unsaturated Polyester Mortar Made with Dune Sand as a Sustainable Alternative in Construction. Results Eng. 2025, 25, 104335. [Google Scholar] [CrossRef]
  26. Babatunde, Y.; Mwero, J.; Mutuku, R.; Jimoh, Y.; Oguntayo, D. Influence of material composition on the morphology and engineering properties of waste plastic binder composite for construction purposes. Heliyon 2022, 8, e11207. [Google Scholar] [CrossRef] [PubMed]
  27. Nuruzzaman, M.; Shathi, A.S.; Yousuf, A.; Islam, J.; Rana, S.; Alam, S.; Biswas, P.K.; Rahman, A.; Mondal, I.H. Composite materials from waste plastics: A sustainable approach for waste management and resource utilization. Polym. Polym. Compos. 2025, 33, 09673911251318542. [Google Scholar] [CrossRef]
  28. Vinod Kumar, R.; Kumar, D.R. Innovative Utilization of HDPE-Plastic Aggregates in Concrete: Fresh and Mechanical Properties. In Proceedings of the ICCESP, Trivandrum, India, 6–8 December 2024; pp. 13–22. [Google Scholar] [CrossRef]
  29. Vinod Kumar, R.; Kumar, D.R. Durability Properties of Concrete with HDPE-Plastic Aggregate. In Proceedings of the ICCESP, Trivandrum, India, 6–8 December 2024; pp. 1–12. [Google Scholar] [CrossRef]
  30. Kashi, M.; Swan, C.W.; Holmstrom, O.; Malloy, R.A. Innovative lightweight synthetic aggregates developed from coal Flyash. In Proceedings of the 13th International Symposium on Use and Management of Coal Combustion Products (CCPs), Orlando, FL, USA, 11–15 January 1999. [Google Scholar]
  31. Jansen, D.C.; Kiggins, M.L.; Swan, C.W.; Malloy, R.A.; Kashi, M.G.; Chan, R.A.; Javdekar, C.; Siegal, C.; Weingram, J. Lightweight fly ash-plastic aggregates in concrete. Transp. Res. Rec. 2001, 1775, 44–52. [Google Scholar] [CrossRef]
  32. Binici, H.; Gemci, R.; Kaplan, H. Physical and mechanical properties of mortars without cement. Constr. Build. Mater. 2012, 28, 357–361. [Google Scholar] [CrossRef]
  33. Choi, Y.-W.; Moon, D.J.; Chung, J.S.; Cho, S.K. Effects of waste PET bottles aggregate on the properties of concrete. Cem. Concr. Res. 2005, 35, 776–781. [Google Scholar] [CrossRef]
  34. Choi, Y.W.; Moon, D.J.; Kim, Y.J.; Lachemi, M. Characteristics of mortar and concrete containing fine aggregate manufactured from recycled waste polyethylene terephthalate bottles. Constr. Build. Mater. 2009, 23, 2829–2835. [Google Scholar] [CrossRef]
  35. Mohandesi, J.A.; Refahi, A.; Sadeghi Meresht, E.; Berenji, S. Effect of temperature and particle weight fraction on mechanical and micromechanical properties of sand-polyethylene terephthalate composites: A laboratory and discrete element method study. Compos. Part B Eng. 2011, 42, 1461–1467. [Google Scholar] [CrossRef]
  36. Gouasmi, M.T.; Benosman, A.S.; Hamed, T. Development of materials based on PET-siliceous sand composite aggregates. J. Build. Mater. Struct. 2018, 4, 58–67. [Google Scholar] [CrossRef]
  37. Bouaziz, S.; Tahar, K.A. Behavior of the Composite Lightweight Concrete. Appl. Mech. Mater. 2012, 146, 39–50. [Google Scholar] [CrossRef]
  38. Alqahtani, F.K.; Ghataora, G.; Khan, M.I.; Dirar, S. Novel lightweight concrete containing manufactured plastic aggregate. Constr. Build. Mater. 2017, 148, 386–397. [Google Scholar] [CrossRef]
  39. Liu, P.; Farzana, R.; Rajarao, R.; Sahajwalla, V. Lightweight expanded aggregates from the mixture of waste automotive plastics and clay. Constr. Build. Mater. 2017, 145, 283–291. [Google Scholar] [CrossRef]
  40. Ennahal, I.; Maherzi, W.; Benzerzour, M.; Mamindy, Y.; Abriak, N.-E. Performance of Lightweight Aggregates Comprised of Sediments and Thermoplastic Waste. Waste Biomass Valorization 2021, 12, 515–530. [Google Scholar] [CrossRef]
  41. Górak, P.; Postawa, P.; Trusilewicz, L.N.; Łagosz, A. Lightweight PET based composite aggregates in Portland cement materials-Microstructure and physicochemical performance. J. Build. Eng. 2021, 34, 101882. [Google Scholar] [CrossRef]
  42. Erdogmus, E.; Sutcu, M.; Gencel, O.; Kazmi, S.M.S.; Munir, M.J.; Velasco, P.M.; Ozbakkaloglu, T. Enhancing thermal efficiency and durability of sintered clay bricks through incorporation of polymeric waste materials. J. Clean. Prod. 2023, 420, 138456. [Google Scholar] [CrossRef]
  43. Owen, M.M.; Wong, L.S.; Achukwu, E.O.; Saharudin, M.S.; Akil, H.M. Enhanced mechanical, thermal, and morphological properties of waste PET plastics reinforced with coated biodegradable kenaf fibers for infrastructure applications. Constr. Build. Mater. 2024, 442, 137659. [Google Scholar] [CrossRef]
  44. Sau, D.; Shiuly, A.; Hazra, T. Utilization of plastic waste as replacement of natural aggregates in sustainable concrete: Effects on mechanical and durability properties. Int. J. Environ. Sci. Technol. 2024, 21, 2085–2120. [Google Scholar] [CrossRef]
  45. Alqahtani, F.K.; Khan, M.I.; Ghataora, G.; Dirar, S. Production of recycled plastic aggregates and its utilization in concrete. J. Mater. Civ. Eng. 2017, 29, 04016248. [Google Scholar] [CrossRef]
  46. Gouasmi, M.; Benosman, A.; Taïbi, H. Improving the properties of waste plastic lightweight aggregates-based composite mortars in an experimental saline environment. Asian J. Civ. Eng. 2019, 20, 71–85. [Google Scholar] [CrossRef]
  47. EN 196-1:2005; Methods of Testing Cement—Part 1: Determination of Strength. European Committee for Standardization: Brussels, Belgium, 2005.
  48. EN 459-2; Building Lime–Part 2: Test Methods. European Committee for Standardization: Brussels, Belgium, 2002.
  49. NF P18-459; Béton–Essai Pour Béton Durci–Essai De Porosité Et De Masse Volumique. Association Française de Normalisation: Paris, France, 2010.
  50. ASTM C597-09; Standard Test Method for Pulse Velocity Through Concrete. ASTM International: West Conshohocken, PA, USA, 2009.
  51. Gupta, T.; Chaudhary, S.; Sharma, R.K. Mechanical and durability properties of waste rubber fiber concrete with and without silica fume. J. Clean. Prod. 2016, 112, 702–711. [Google Scholar] [CrossRef]
  52. ASTM D5334; Standard Test Method for Determination of Thermal Conductivity of Soil and Soft Rock by Thermal Needle Probe Procedure. ASTM International: West Conshohocken, PA, USA, 2000.
  53. ASTM C1260; Standard Test Method for Potential Alkali Reactivity of Aggregates (Mortar-Bar Method), ASTM Standards in Building Codes. ASTM International: West Conshohocken, PA, USA, 2001.
  54. ASTM C642-13; Standard Test Method for Density, Absorption, and Voids in Hardened Concrete. ASTM International: West Conshohocken, PA, USA, 2013.
  55. C1585-13, A; Standard Test Method for Measurement of Rate of Absorption of Water by Hydraulic—Cement Concretes. ASTM International: West Conshohocken, PA, USA, 2013.
  56. Senthil Kumar, K.; Baskar, K. Development of ecofriendly concrete incorporating recycled high-impact polystyrene from hazardous electronic waste. J. Hazard. Toxic Radioact. Waste 2015, 19, 04014042. [Google Scholar] [CrossRef]
  57. Ge, Z.; Huang, D.; Sun, R.; Gao, Z. Properties of plastic mortar made with recycled polyethylene terephthalate. Constr. Build. Mater. 2014, 73, 682–687. [Google Scholar] [CrossRef]
  58. Gouasmi, M.; Benosman, A.S.; Taïbi, H.; Kazi Tani, N.; Belbachir, M. Destructive and Non-destructive testing of an industrial screed mortar made with lightweight composite aggregates WPLA. Int. J. Eng. Res. Afr. 2017, 33, 140–158. [Google Scholar] [CrossRef]
  59. Saikia, N.; de Brito, J. Mechanical properties and abrasion behaviour of concrete containing shredded PET bottle waste as a partial substitution of natural aggregate. Constr. Build. Mater. 2014, 52, 236–244. [Google Scholar] [CrossRef]
  60. Marzouk, O.Y.; Dheilly, R.; Queneudec, M. Valorization of post-consumer waste plastic in cementitious concrete composites. Waste Manag. 2007, 27, 310–318. [Google Scholar] [CrossRef]
  61. Jayasinghe, R.R.; Herath, G.P.; Abeyrathna, W.P.; Hendawitharana, M.P.; Liyanage, C.; Williams, K.; Halwatura, R.U. Strength Properties of Recycled Waste Plastic and Quarry Dust as Substitute to Coarse Aggregates: An Experimental Methodology. Mater. Circ. Econ. 2023, 5, 5. [Google Scholar] [CrossRef]
  62. Badache, A.; Benosman, A.S.; Senhadji, Y.; Mouli, M. Thermo-physical and mechanical characteristics of sand-based lightweight composite mortars with recycled high-density polyethylene (HDPE). Constr. Build. Mater. 2018, 163, 40–52. [Google Scholar] [CrossRef]
  63. Shariq, M.; Prasad, J.; Masood, A. Studies in ultrasonic pulse velocity of concrete containing GGBFS. Constr. Build. Mater. 2013, 40, 944–950. [Google Scholar] [CrossRef]
  64. Azhdarpour, A.M.; Nikoudel, M.R.; Taheri, M. The effect of using polyethylene terephthalate particles on physical and strength-related properties of concrete; a laboratory evaluation. Constr. Build. Mater. 2016, 109, 55–62. [Google Scholar] [CrossRef]
  65. Senhadji, Y.; Escadeillas, G.; Benosman, A.S.; Mouli, M.; Khelafi, H.; Ould Kaci, S. Effect of incorporating PVC waste as aggregate on the physical, mechanical, and chloride ion penetration behavior of concrete. J. Adhes. Sci. Technol. 2015, 29, 625–640. [Google Scholar] [CrossRef]
  66. Akçaözoğlu, S.; Akçaözoğlu, K.; Atiş, C.D. Thermal conductivity, compressive strength and ultrasonic wave velocity of cementitious composite containing waste PET lightweight aggregate (WPLA). Compos. Part B Eng. 2013, 45, 721–726. [Google Scholar] [CrossRef]
  67. IS 13311-1; Indian Standard, Method of Non-Destructive Testing of Concrete–Methods of Test, Part 1: Ultrasonic Pulse Velocity [CED 2: Cement and Concrete]. Bureau of Indian Standards: New Delhi, India, 1992.
  68. Guo, Y.-C.; Li, X.-M.; Zhang, J.; Lin, J.-X. A review on the influence of recycled plastic aggregate on the engineering properties of concrete. J. Build. Eng. 2023, 79, 107787. [Google Scholar] [CrossRef]
  69. Wang, R.; Meyer, C. Performance of cement mortar made with recycled high impact polystyrene. Cem. Concr. Compos. 2012, 34, 975–981. [Google Scholar] [CrossRef]
  70. Rahmani, E.; Dehestani, M.; Beygi, M.; Allahyari, H.; Nikbin, I. On the mechanical properties of concrete containing waste PET particles. Constr. Build. Mater. 2013, 47, 1302–1308. [Google Scholar] [CrossRef]
  71. Benosman, A.S.; Taïbi, H.; Senhadji, Y.; Mouli, M.; Belbachir, M.; Bahlouli, M. Plastic waste particles in mortar composites: Sulfate resistance and thermal coefficients. Prog. Rubber Plast. Recycl. Technol. 2017, 33, 171–202. [Google Scholar] [CrossRef]
  72. Ahrens, J.T. Rock Physics & Phase Relation: A Handbook of Physical Constant; American Geophysical Union: Washington, DC, USA, 1995; p. 240. [Google Scholar]
  73. Hannawi, K.; Prince, W.; Kamali-Bernard, S. Effect of thermoplastic aggregates incorporation on physical, mechanical and transfer behaviour of cementitious materials. Waste Biomass Valorization 2010, 1, 251–259. [Google Scholar] [CrossRef]
  74. Boudenne, A. Etude Expérimentale et Théorique des Propriétés Thermophysiques de Matériaux Composites à Matrice Polymère. Ph.D. Thesis, Université de Paris 12, Paris, France, 2003. [Google Scholar]
  75. Gouasmi, M.; Benosman, A.; Taïbi, H.; Belbachir, M.; Senhadji, Y. Les Propriétés physico-thermiques des mortiers à base des agrégats composites «PET-sable siliceux». J. Mater. Environ. Sci. 2016, 7, 409–415. [Google Scholar]
  76. Alqahtani, F.K.; Zafar, I. Characterization of processed lightweight aggregate and its effect on physical properties of concrete. Constr. Build. Mater. 2020, 230, 116992. [Google Scholar] [CrossRef]
  77. Rilem, L. Functional classification of lightweight concrete. Mater. Struct. 1978, 11, e283. [Google Scholar]
  78. Mounanga, P.; Turcry, P.; Poullain, P. Effets thermique et mécanique de l’incorporation de déchets de mousse de polyuréthane dans un mortier. In Proceedings of the XXIVèmes Rencontres Universitaires de Génie Civil, Construire, Un Nouveau Défi, La Grande Motte, France, 1–2 June 2006. [Google Scholar]
  79. Aattache, A.; Mahi, A.; Soltani, R.; Mouli, M.; Benosman, A.S. Experimental study on thermo-mechanical properties of Polymer Modified Mortar. Mater. Des. 2013, 52, 459–469. [Google Scholar] [CrossRef]
  80. Latroch, N.; Benosman, A.S.; Bouhamou, N.-E.; Senhadji, Y.; Mouli, M. Physico-mechanical and thermal properties of composite mortars containing lightweight aggregates of expanded polyvinyl chloride. Constr. Build. Mater. 2018, 175, 77–87. [Google Scholar] [CrossRef]
  81. Swamy, R.N. The Alkali-Silica Reaction in Concrete; CRC Press: Boca Raton, FL, USA, 1991. [Google Scholar]
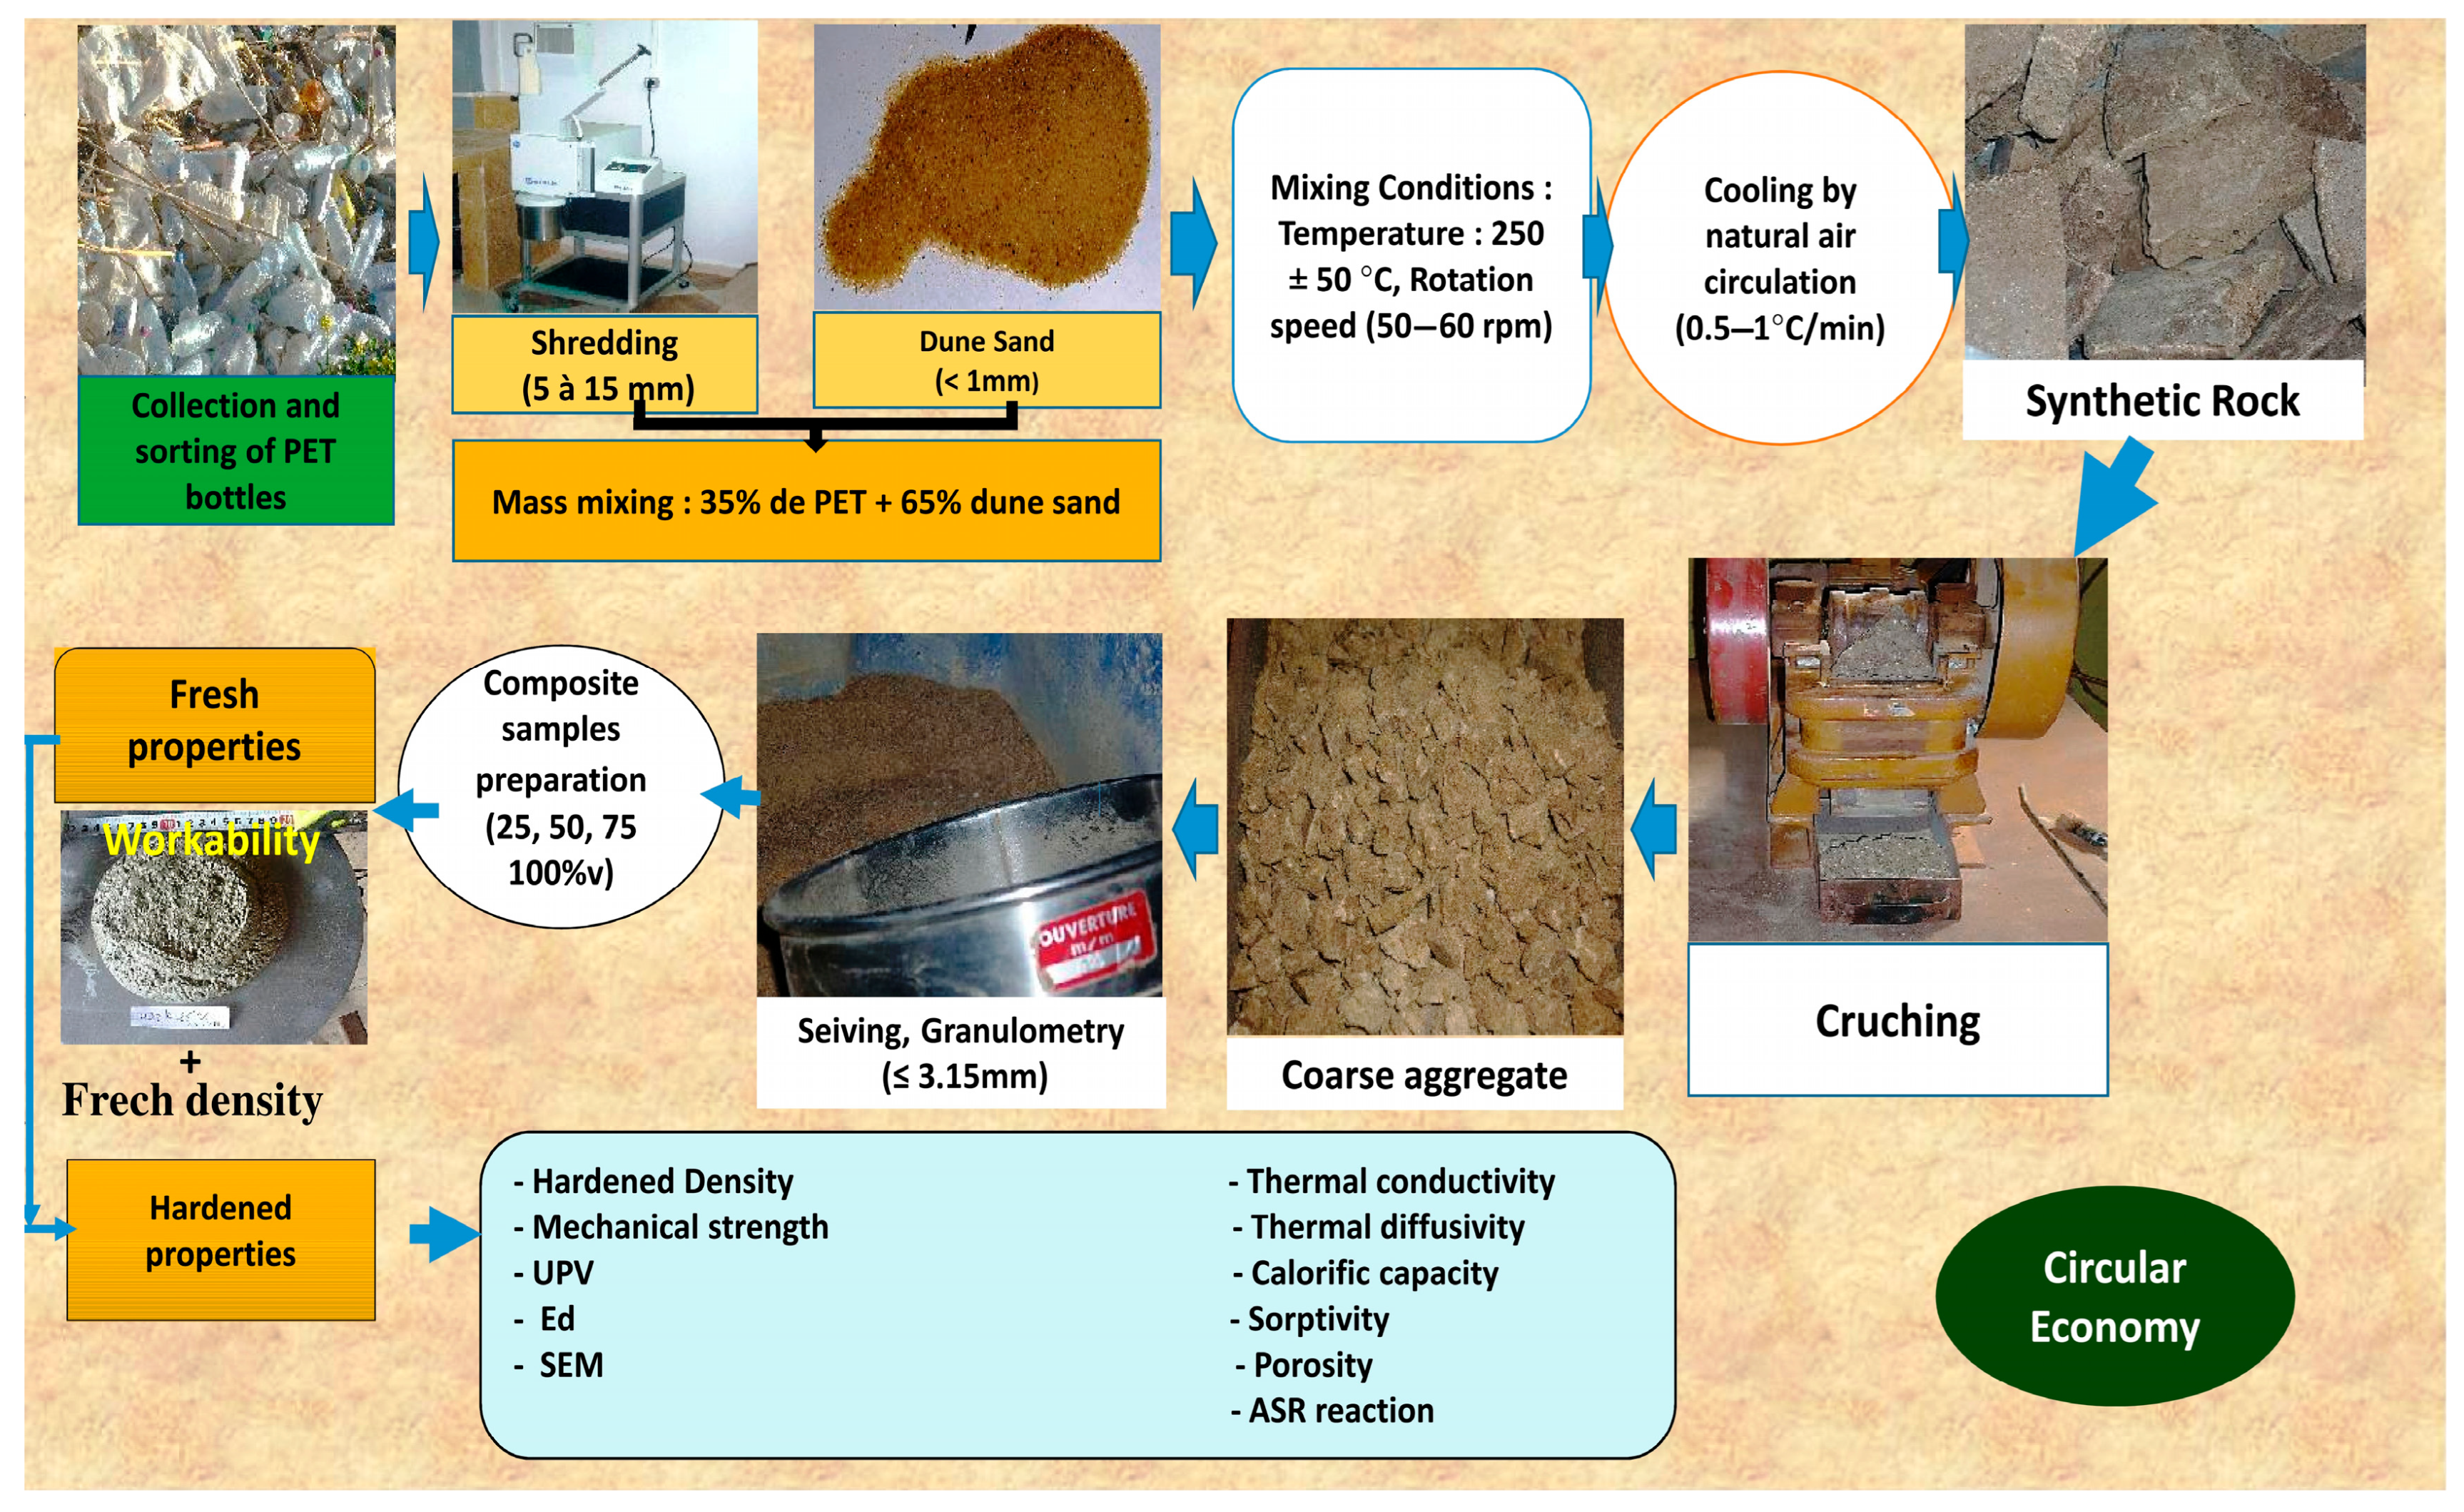
Figure 1. Flowchart summarizing the production of WPSS composite mortars.
Constrmater 05 00058 g001
Figure 2. Particle size distribution of used sand and lightweight synthesized sand (LSS) aggregates.
Constrmater 05 00058 g002
Figure 3. Effect of substituting natural sand with synthesized sand on the density in the fresh and hardened state (28 days) of composite mortars.
Constrmater 05 00058 g003
Figure 4. Percentage of change in densities and strengths as compared with control mortar.
Constrmater 05 00058 g004
Figure 5. Variation of compressive strength of WPSS composite mortars.
Constrmater 05 00058 g005
Figure 6. Correlation between the compressive strength and dry composite mortars density at 28 days.
Constrmater 05 00058 g006
Figure 7. Variation in flexural strength of WPSS mortar composites.
Constrmater 05 00058 g007
Figure 8. Scanning electron microscopy examination of NWM. NA: Natural aggregate.
Constrmater 05 00058 g008
Figure 9. Scanning electron microscopy examination of WPSS100.
Constrmater 05 00058 g009
Figure 10. (a) Surface of the composite mortar WPSS100 after the bending test, (b) state of the WPSS100 composite after compression, and (c) state of the NWM and WPSS100 mortars after the bending test, at 28 days.
Constrmater 05 00058 g010
Figure 11. UPV evolution in WPSS composite mortars at 28 and 90 days.
Constrmater 05 00058 g011
Figure 12. Evolution of dynamic modulus of elasticity (Ed) in WPSS composite mortars.
Constrmater 05 00058 g012
Figure 13. Correlation between dynamic modulus of elasticity (Ed) and compressive strength of LSS-incorporated mortars.
Constrmater 05 00058 g013
Figure 14. Variation of thermal conductivity of WPSS composite mortars over time.
Constrmater 05 00058 g014
Figure 15. Effect of the density on thermal conductivity.
Constrmater 05 00058 g015
Figure 16. Correlation between thermal conductivity and UPV.
Constrmater 05 00058 g016
Figure 17. Evolution of non-destructive test results with respect to those of the control mortar, at 28 days.
Constrmater 05 00058 g017
Figure 18. Change in calorific capacity of WPSS composite mortars over time.
Constrmater 05 00058 g018
Figure 19. Variation of thermal diffusivity of WPSS composite mortars over time.
Constrmater 05 00058 g019
Figure 20. Effect of synthesized aggregates on the water accessible porosity.
Constrmater 05 00058 g020
Figure 21. Correlation between the UPV values and porosity values.
Constrmater 05 00058 g021
Figure 22. Effect of synthesized aggregate incorporation on sorptivity.
Constrmater 05 00058 g022
Figure 23. Correlation between sorptivity and porosity values.
Constrmater 05 00058 g023
Figure 24. Expansion of WPSS composites as a function of exposure time to a 1N NaOH solution at 80 °C.
Constrmater 05 00058 g024
Figure 25. NWM mortar and WPSS100 composite mortar exposed to a 1 N NaOH solution at 80 °C for 66 days.
Constrmater 05 00058 g025
Figure 26. Relationship between physical, mechanical, and thermal properties of the composites under consideration in this study.
Constrmater 05 00058 g026
Figure 27. Correlation heatmap illustrating the R2 values (coefficient of determination) between various pairs of parameters. The color intensity ranges from red to blue, with red indicating higher R2 values (closer to 1.0) and blue indicating lower R2 values (closer to 0.75). A value of 1.0 represents a perfect fit, meaning that the variation in one parameter can be fully explained by the variation in the other.
Constrmater 05 00058 g027
Table 1. Chemical composition of CPJ CEM II/B 42.5 N cement, silica sand, and calcareous.
ElementsSiO2Al2O3Fe2O3CaOMgOK2OSO3Na2OPAFClCaCO3CO2
Cement17.404.122.9761.151.160.662.460.138.850.017--
Ss83.290.210.457.034.20----- 1.00
Sc11.76-0.9144.35------59.0926.00
Table 2. Mineralogical composition of clinker (%).
C3SC2SC3AC4AF
64.0015.008.0012.16
Table 3. Physical parameters of sands used.
Physical PropertiesNatural Sand LSS
ShapeAngularAngular
Absolute density (g/cm3)2.6301.68
Apparent density (g/cm3)1.4601.020
Equivalent of sand «%»77.00-
Fineness modulus «FM»2.422.93
Absorption coefficient (%)0.560.04
Coefficient of curvature «Cc»0.550.60
Coefficient of uniformity «Cu»4.725.83
Thermal conductivity «k» (W/m·K)-0.589
Table 4. Composition of waste plastic synthetic sand (WPSS) lightweight composite mortars.
CompositesLSS/S
(%) *
Sand Mix(g)Admixture
(% Binder) **
Cement
(g)
Waterw/b
***
Spreading
(%)
LSS
(g)
Sand
(g)
Total
Aggregate
(g)
NWM00.01350.01350.00.904502250.570
WPSS2525235.81012.51248.30.504502250.574
WPSS5050471.6675.01146.60.404502250.573
WPSS7575707.4337.51044.90.354502250.580
WPSS100100943.20.0943.20.304502250.569
* Volume substitution of sand by LSS. ** Percentage of admixture with respect to cement weight. *** w/b = water/binder mass ratio.
Table 5. Correlations between different properties of WPSS composite mortars.
PropertiesCorrelation EquationCorrelation Coeff.
Cs (MPa)–UPV (m/s)Y = 0.0522x + 1.7967R2 = 0.9878
UPV (m/s)–density (g/cm3)Y = 0.2935x + 0.8611R2 = 0.9978
Ed (GPa)–Cs (MPa)Y = 11.954x + 2.9406R2 = 0.9897
λ (W/m·K)–density (g/cm3)Y = 0.6153 + 1.2119R2 = 0.9953
λ (W/m·K)–UPV (m/s)Y = 2.0971 + 1.1941R2 = 0.9984
Fs (MPa)–Cs (MPa)Y = 19.408 + 4.2017R2 = 0.9612
Cs (MPa)–density (g/cm3)Y = 0.0153 + 1.3899R2 = 0.9793
λ (W/m·K)–porosity (%)Y = 29.056x2 − 68.331x + 57.257R2 = 0.9434
Cs (MPa)–porosity (%)Y = 0.167x2 − 1.2285x + 39.65R2 = 0.9697
Porosity (%)–sorptivity (cm/s−0.5)Y = 0.0885x−3.5695x + 52.63 R2 = 0.7523
Density (g/cm3)–porosity%Y = 7.6061x2−379.97 + 6322.2R2 = 0.7738
Sorptivity (cm/s−0.5)–density (g/cm3)Y = 1 × 10−9X3.0826R2 = 0.8868
Disclaimer/Publisher’s Note: The statements, opinions and data contained in all publications are solely those of the individual author(s) and contributor(s) and not of MDPI and/or the editor(s). MDPI and/or the editor(s) disclaim responsibility for any injury to people or property resulting from any ideas, methods, instructions or products referred to in the content.