Article

Utilization of Different Types of Plastics in Concrete Mixtures

Department of Civil, Environmental and Geodetic Engineering, The Ohio State University, Columbus, OH 43210, USA
*
Author to whom correspondence should be addressed.
Constr. Mater. 2025, 5(2), 39; https://doi.org/10.3390/constrmater5020039
Submission received: 18 April 2025 / Revised: 27 May 2025 / Accepted: 30 May 2025 / Published: 6 June 2025

Abstract

Incorporation of plastic waste into concrete mitigates harm to the environment through encapsulation of plastics in concrete. This study presents a comprehensive investigation of the effects of using six commonly used plastic materials (i.e., polyethylene terephthalate (PET), high-density polyethylene (HDPE), polyvinyl chloride (PVC), low-density polyethylene (LDPE), polypropylene (PP), and polystyrene (PS)) in cement paste and mortar mixtures. The heat of hydration investigations revealed that plastic powders did not significantly affect rates or extents of hydration. Among the different types of plastic-aggregate mortars, PET performed the worst, while PS was the best. Fractures in the samples generally occurred due to debonding between the plastic particles and the cement matrix. Plastic particle shape influences the microstructure of the interfacial transition zone and consequently affects the overall strength of the mortar.

1. Introduction

Consumption of plastics used around the world surges yearly. In 2018, in the USA alone, the amount of post-consumer plastic waste was about 35 million tons, representing 20% of the total municipal solid waste. Of this, nearly 76% was landfilled [1]. Landfilling and incinerating materials is a major source of air, water, and soil pollution. One approach to minimize landfilled plastic waste is through the incorporation of plastic wastes into concrete, partially substituting plastics for cement and natural aggregates.
Many previous studies have investigated the idea of incorporating plastic waste in cementitious composites. The majority investigated polyethylene terephthalate (PET), with limited research performed on other types of plastics such as high-density polyethylene (HDPE), polyvinyl chloride (PVC), low-density polyethylene (LDPE), polypropylene (PP), and polystyrene (PS) [2,3,4,5,6,7,8]. Most previous research treated plastic as an inert material, and therefore its impact on cement hydration was generally overlooked. However, a few studies adopted the idea of replacing cement with plastic powders and generally reported minimal impacts on microstructure and decreases in the strength of mortar and concrete incorporating plastic powders as replacements for cement [9,10,11]. More work is needed in this area to understand the effect of small-particle-size plastic powders on hydration and property development.
Many more studies have explored the idea of replacing natural aggregate (i.e., fine or coarse) with plastic aggregates [12,13,14,15,16,17]. Most work has reported reductions in the densities of mixtures incorporating plastic aggregates, with this effect primarily attributed to replacement of higher-density sand or coarse aggregate particles with lower-density plastic materials [14,18]. Conclusions regarding the impact of plastics on workability have been varied, with some studies showing increases in flowability, while others saw significant decreases, with the decreases sometimes suggested to be a result of high water absorption [12,13,16,19,20]. Improvements in concrete properties were shown in several studies from the partial replacement of natural aggregate by plastic aggregate at low replacement ratios (RRs), typically less than 5%, due to redistribution of stresses by the flexible plastic component, converting shear stress to tensile stresses, which the plastic can accommodate up to a certain level [20,21,22]. However, higher RRs, typically more than 5%, resulted in decreases in the strength of concrete or mortar. Other studies concluded that at all RRs, substituting the natural aggregate with plastic waste decreased the strength and durability properties of concrete as a result of two major mechanisms:
(1)
The plastic is weaker than the natural aggregate, i.e., plastic’s compressive strength and modulus of elasticity are smaller [16,23,24,25].
(2)
Plastic’s hydrophobicity and particle morphology, especially plastics in flaky form and smooth surfaces, can result in the accumulation of water around particles, forming relatively large void contents and a weak interfacial transition zone (ITZ), reducing bond quality [16,17,26,27,28,29].
At higher RRs, improvements in performance gained through redistribution of stresses are negated by the increasing influence of the plastic’s low strength, stiffness, and weakened bond with the cementitious matrix. However, discrepancies regarding the impact of plastic on mortar and concrete properties were observed even when the same type and proportion of plastic products were used [30,31]. This inconsistency could be attributed to several factors including, but not limited to, the contamination, degradation, moisture content, and particle morphology of the plastic aggregates, as well as differences in the mixing, curing, and testing conditions of the samples.
Thus, a comprehensive study to investigate the effect of using different types of plastic in cementitious composites at consistent conditions is needed in order to understand the true impact of use of plastics in concrete and differentiate effects from the most common types of plastic. This study systematically investigates the effect of plastic products on the strength development of paste and mortar samples. In particular, at consistent laboratory, mixing, curing, and testing conditions, this study investigates:
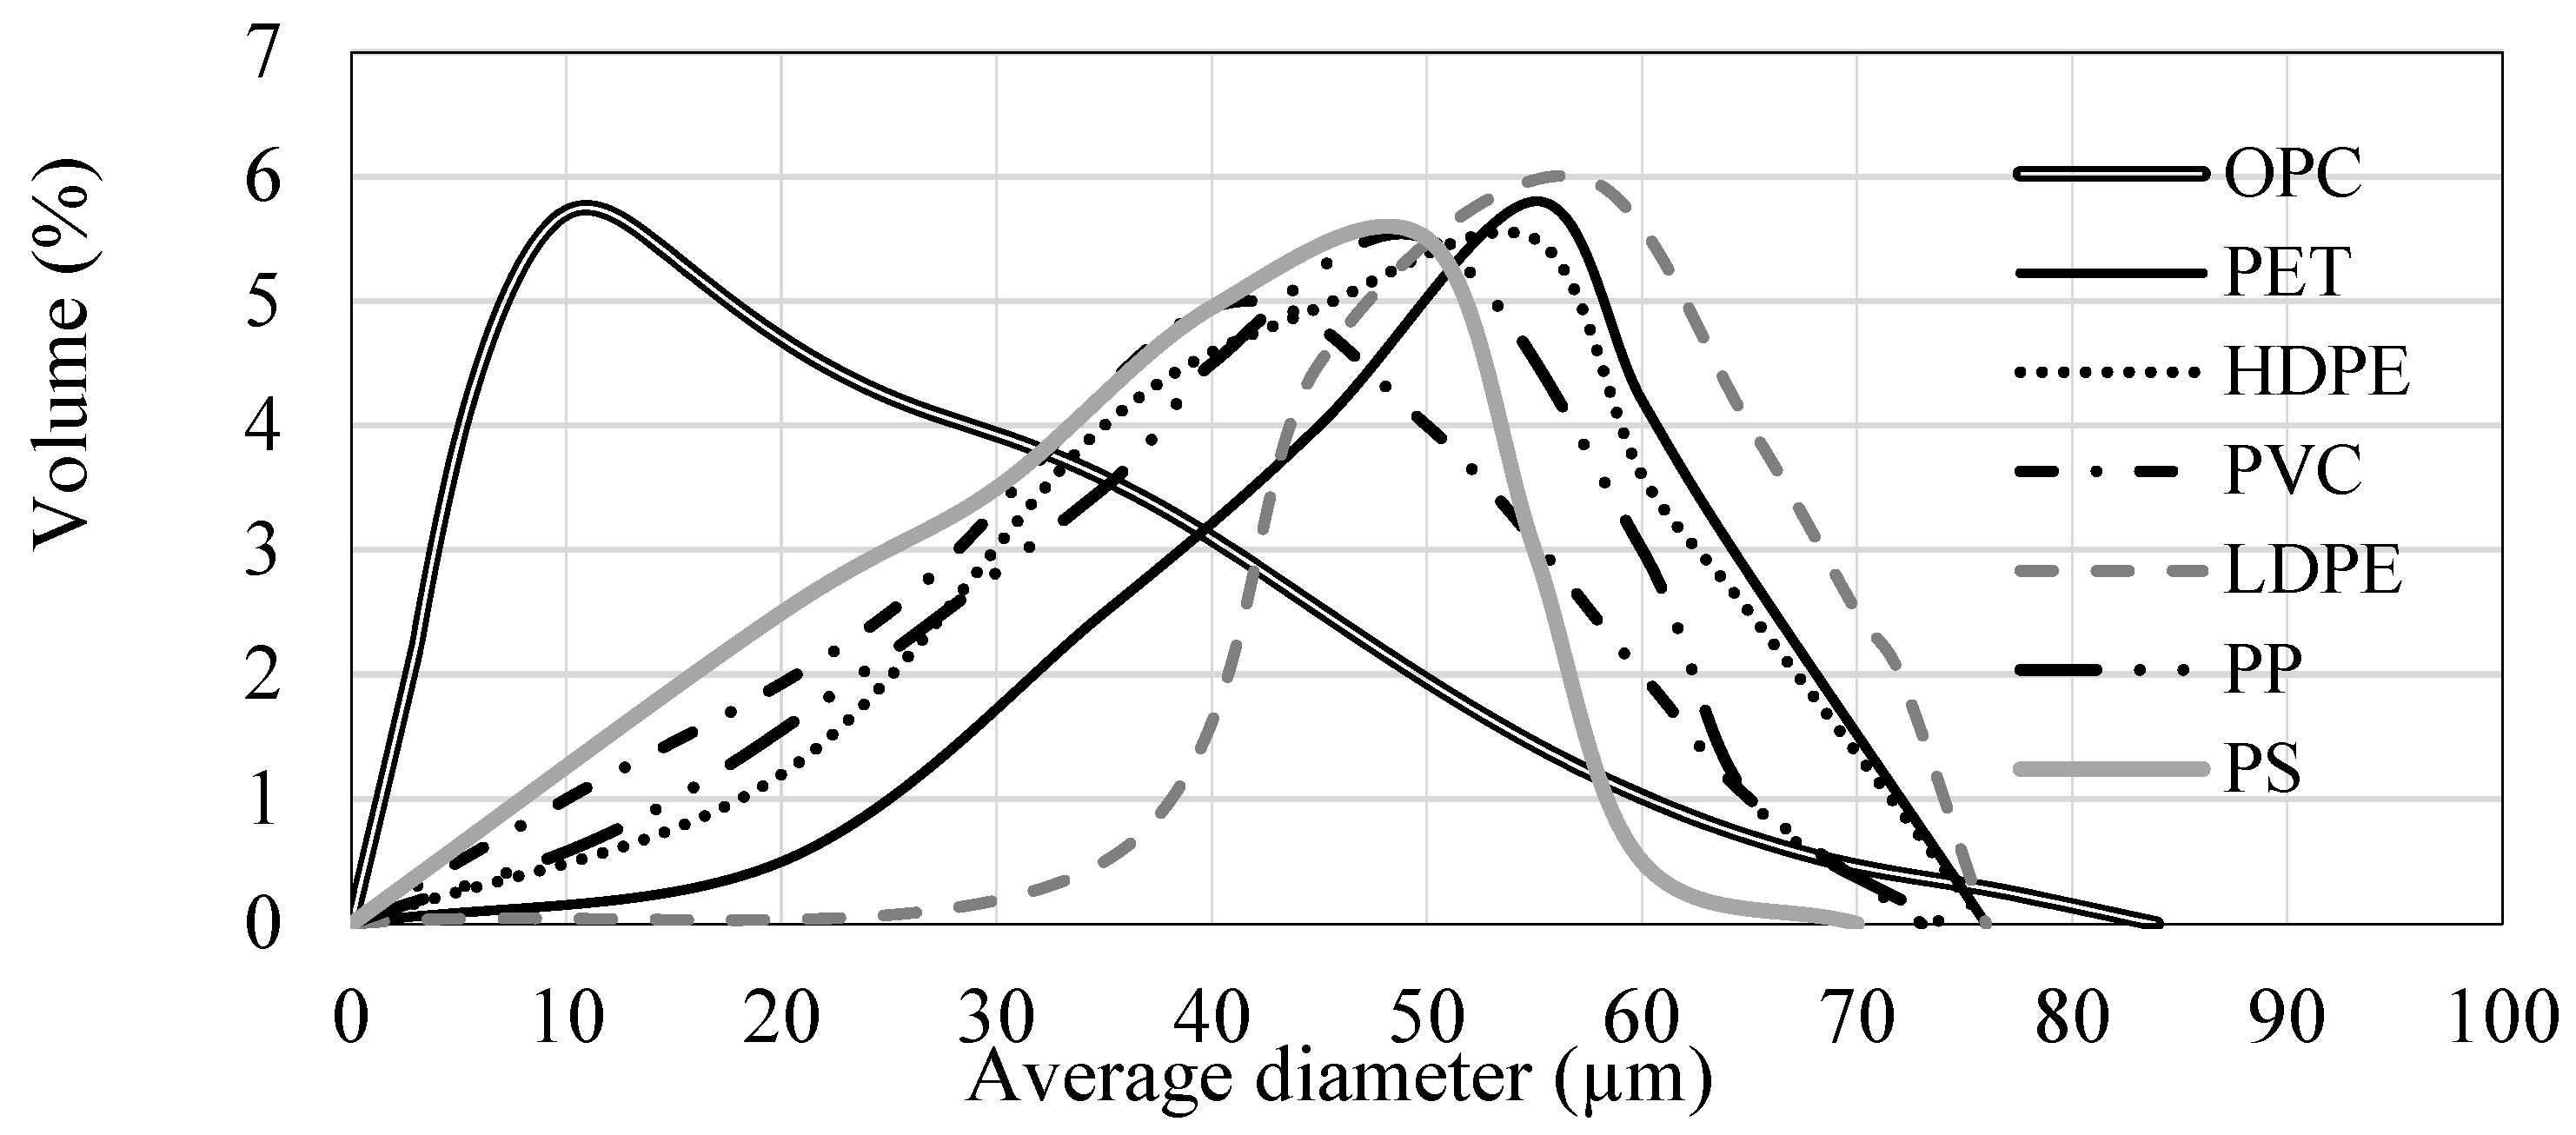
  • The influence of different plastic powder types on cement hydration, where all powders have similar particle size and size distribution.
  • The influence of plastic aggregates on mortar density and compressive and flexural strength, where plastic particles have the same fineness modulus, moisture content, no contamination, and the same degradation level (single-use plastic).
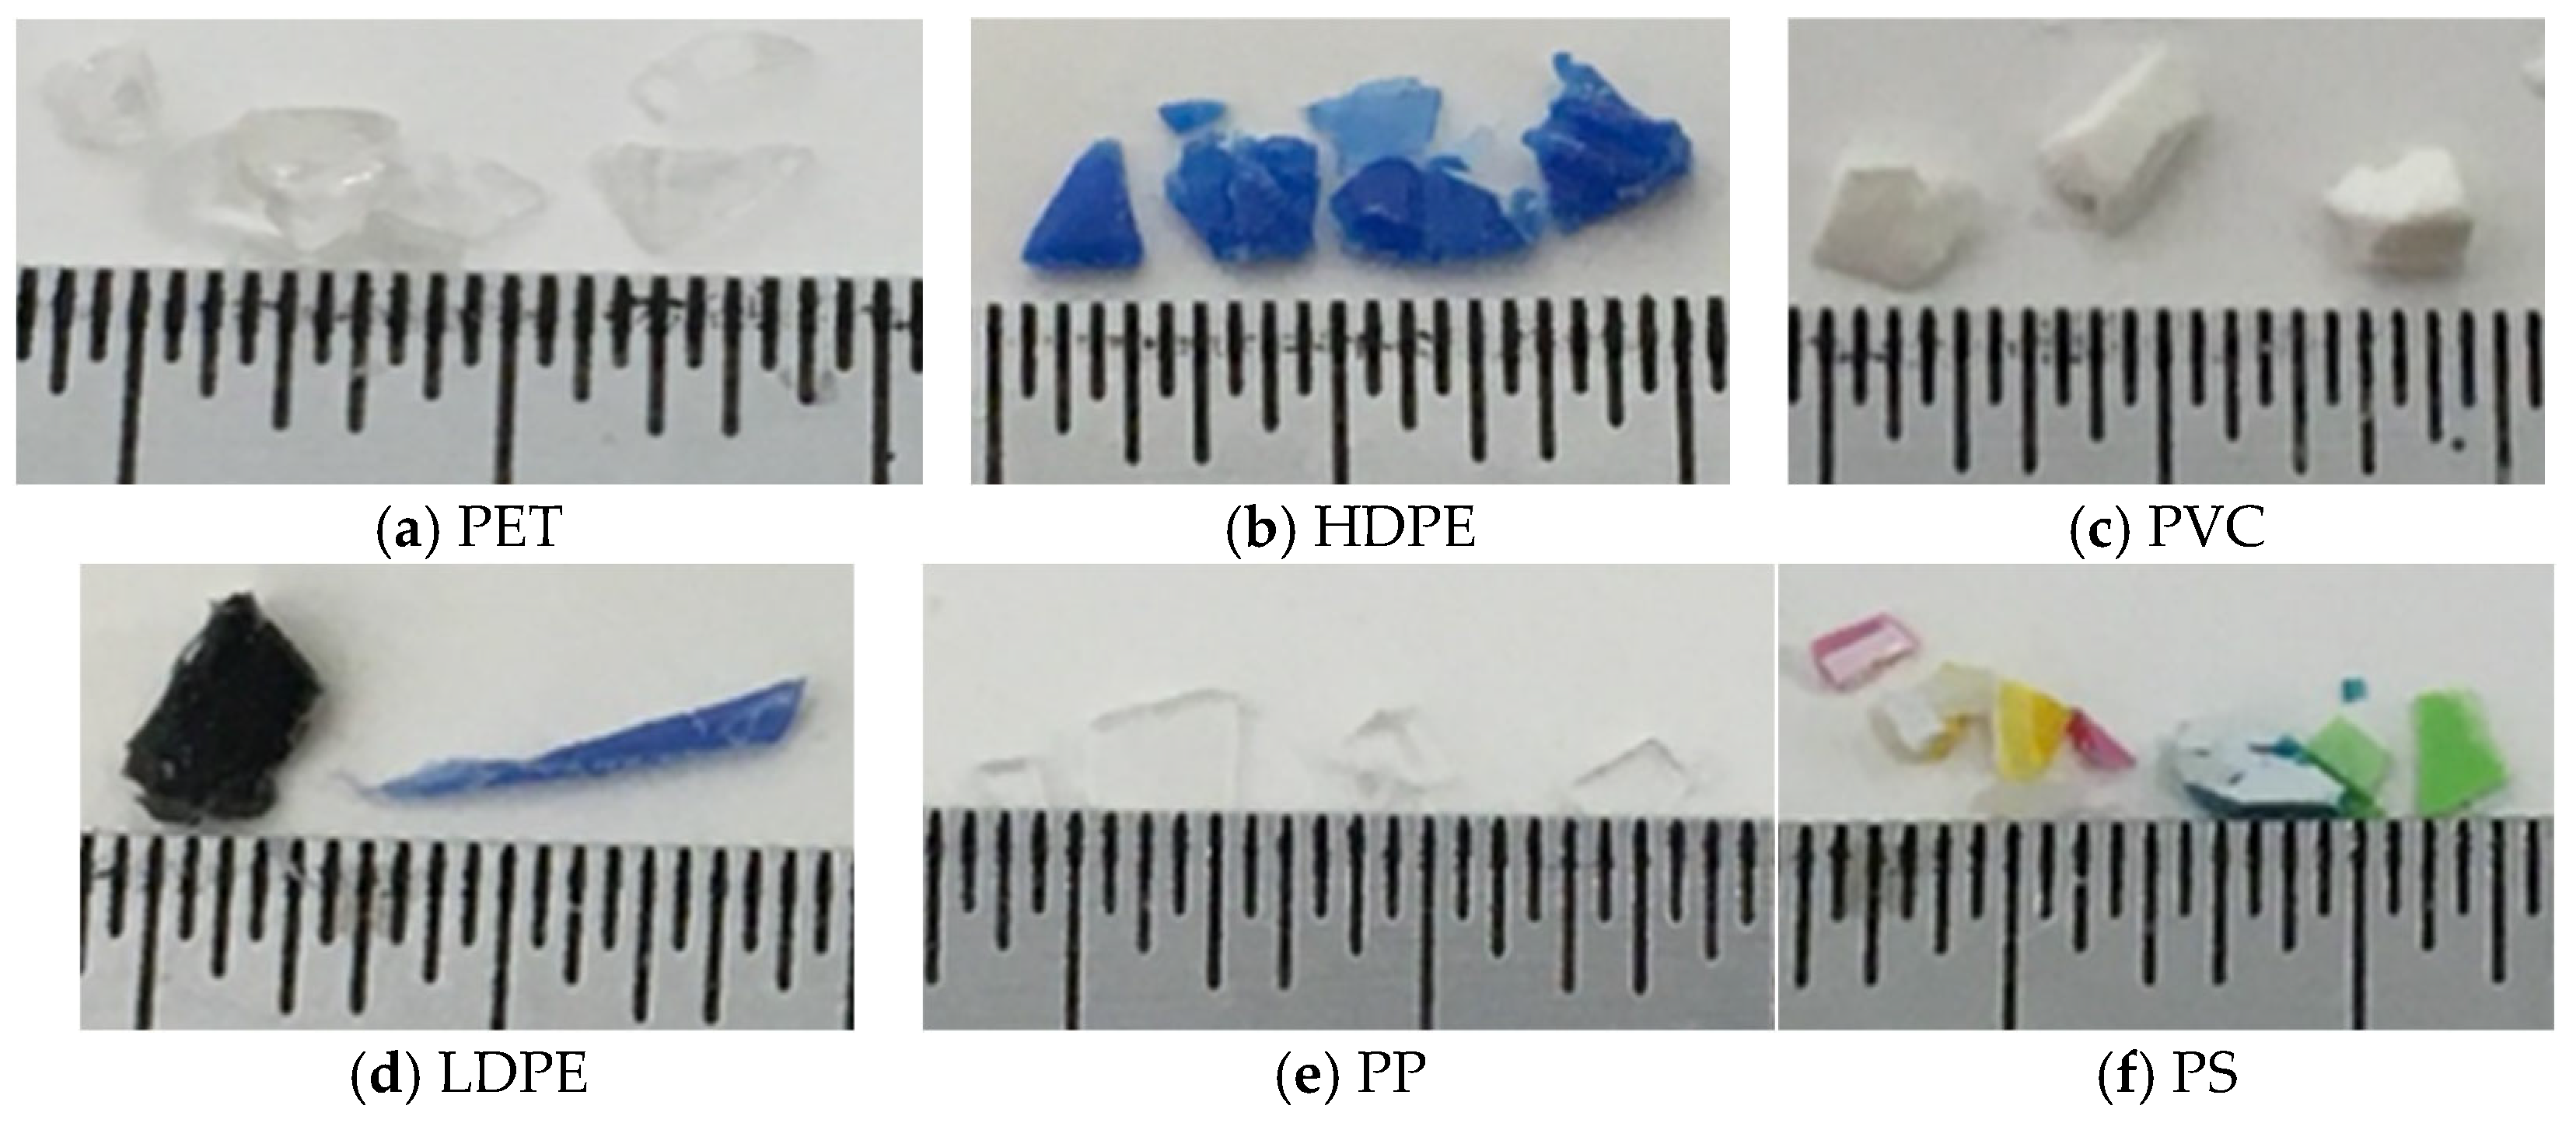
2. Materials

Ordinary Portland cement (OPC) (Type I, QUIKRETE, which was made in Atlanta, GA, USA) was used for all the experimental work. The natural fine aggregate (NFA) was an ASTM 20-30 graded natural silica sand (manufactured by HUMBOLDT, Ottawa, IL, USA). Six types of single-use plastic were selected for testing. The plastic was decontaminated, washed, pulverized, and sieved. All plastics were oven-dried at 105 °C for 24 h, ensuring moisture contents of zero. Plastic particles passing sieve #200 (75 µm) were used as powders to replace cement in isothermal calorimetry testing. Particles larger than 75 µm were used as a sand replacement in all other tests used in this study. The specific gravity (SG) and water absorption of the plastic particles were determined following ASTM C128 [32]. Sieve analysis in accordance with ASTM C136 [33] was used to optimize plastic aggregate particle size distributions to achieve a constant fineness modulus (FM) of 3.2. Sources of the plastic and physical properties of the natural fine aggregate (NFA) and plastic fine aggregate (PFA) are provided in Table 1. Based on the data provided in [34,35], ranges of compressive and tensile strength and modulus of elasticity of the six types of plastics are summarized in Figure 1 and Figure 2. The same type of plastic can have a wide range of properties, based on plastic properties such as monomer chain lengths and structures [36]. Therefore, the minimum and maximum values of each mechanical strength property are provided in these plots.
Table 1 and Figure 3 show the particle properties of each plastic used in this study. The size of all plastic fine aggregates ranged from 75 µm to 4.75 mm. PET particles had a flaky shape (0.10 mm thick) with sharp edges and a smooth surface. PP particles were similar to PET, but thicker (0.30 mm) and had fewer sharp edges. HDPE and PVC particles were granular and have lower aspect ratios than PET and PP. HDPE particles had a rougher surface and higher angularity than the PVC. LDPE particles were either granular or long (fiber-like). Visual evaluation of the LDPE particles indicated that less than 20% of its particles were not spherical. PS had irregular shape particles with sharp edges and a rough surface that mostly formed due to the shrinkage from exposure to the drying heat in the oven.
Laser diffraction particle size analysis was performed on samples of each plastic powder type and a representative OPC (Figure 4). The mean particle size of the plastic powders ranged from 41 to 57 µm, which was higher than the OPC mean size (15 µm). The plastic powder sizes achieved in this task were smaller than what was used in previous research [9,37,38]. In the current study, natural aggregate fine aggregate size ranges from 0.15 to 4.75 mm.

3. Methods

An LS 13 320 particle size analyzer manufactured by Beckman Coulter, Indianapolis, IN, USA was utilized to determine the plastic particle size distribution. A dry plastic powder sample (10 g) of each plastic type was evaluated using laser diffraction particle size analysis (LDPSA) methodology. It should be noted that LDPSA considers all particles spherical even though they are not. Therefore, there is a possibility that some long particles (fiber-like) were considered spherical by the LDPSA. Plastic aggregate particles are shown in Figure 3.
Isothermal calorimetry was performed at 25 °C using a TAM AIR isothermal calorimeter to evaluate the effect of plastic powders on cement hydration using seven cement paste mixtures: pure OPC paste or control (C) and six pastes made with 5% replacement of cement mass with six different plastic powders. The water-to-binder ratio (w/b) of 0.5 was kept constant for all pastes. The plastic powder was mixed thoroughly with the OPC in a dry condition. Water was added and all constituents were mixed manually for two minutes. Approximately 10 g of each paste was sealed in a glass calorimeter vial and placed in the calorimeter.
The effects of plastic materials on the properties of the fresh and hardened mortars were evaluated using plastic fine aggregate (PFA) to replace natural fine aggregate (NFA) in three volumetric replacement ratios (RRs): 5, 10, and 15%. A replacement rate of 5% was used to verify the improved effects of PFA previously seen with PET with other plastic types [20,21,22]. Higher (10% and 15%) RR were used to evaluate effects of RR on concrete performance in hopes of allowing for consumption of greater proportions of plastic in concrete. Mortar mixes were cast for a control mix and 18 different mixes (i.e., six types of PFA with three RRs). Control mortar specimens were named C. The other mortar specimens were named by having the plastic name prefixed by the RR. The cement-to-sand ratio for the mortars was maintained at 1:2.75 and the water-to-cement ratio (w/c) was 0.485. Tests were conducted in triplicate at 3, 7, and 28 days. The proportions of each mortar mixture are provided in Table 2. The flowability of each mix was determined using a flow table following ASTM C1437 [39]. Flowability results were normalized by considering that the control mix had 100% flowability. Therefore, the normalized flowability (NF) of each mix was determined according to Equation (1).
N F = 100 C F ( F )
where NF is normalized flowability, CF is the flowability control mix, and F is the mix flowability.
Mortar cubes (50 mm) were cast for compressive strength testing following ASTM C109 [40]. The dry density of the surface dry condition mortar cubes was determined based on their dimensions in accordance with ASTM C39 [41]. Mortar beams (40 mm × 40 mm × 160 mm) were cast for flexure testing following ASTM C348 [42]. All mortar samples were demolded after 24 h and moved to the curing room (100% relative humidity, 23 ± 2 °C temperature) until the time of testing.
For flexure testing, mortar beams with a clear span of 120 mm were subjected to one concentrated load at mid-span until failure. The three-point flexural strength (ft) is a measure of the tensile strength of concrete elements exposed to bending stress as shown in Equation (2).
f t = M c I
where M is the bending moment, c is the distance from the beam section centroid to the tensile surface (mm), i.e., half of beam height, and I is the moment of inertia of the beam section (mm4). In this case, Equation (2) becomes ft = 0.0028P, where P is the concentric failure load (N).
Ultrasonic pulse velocity (UPV) test was utilized to assess the plastic-aggregate mortar quality compared to the control mix. Higher pulse velocity readings indicate increased composite quality and durability [43]. UPV measurements were conducted on 28-day-old specimens following ASTM C597 [44]. UPV of type P, 50 kHz low voltage waves was measured on 40 mm × 40 mm × 160 mm mortar beams using a V-Meter Mk IV (James Instruments, Chicago, IL, USA) voltage with 500-amplifier gain.
A more detailed description of all of the experiments and data included in this manuscript are provided in Abduallah [45].

4. Results and Discussion

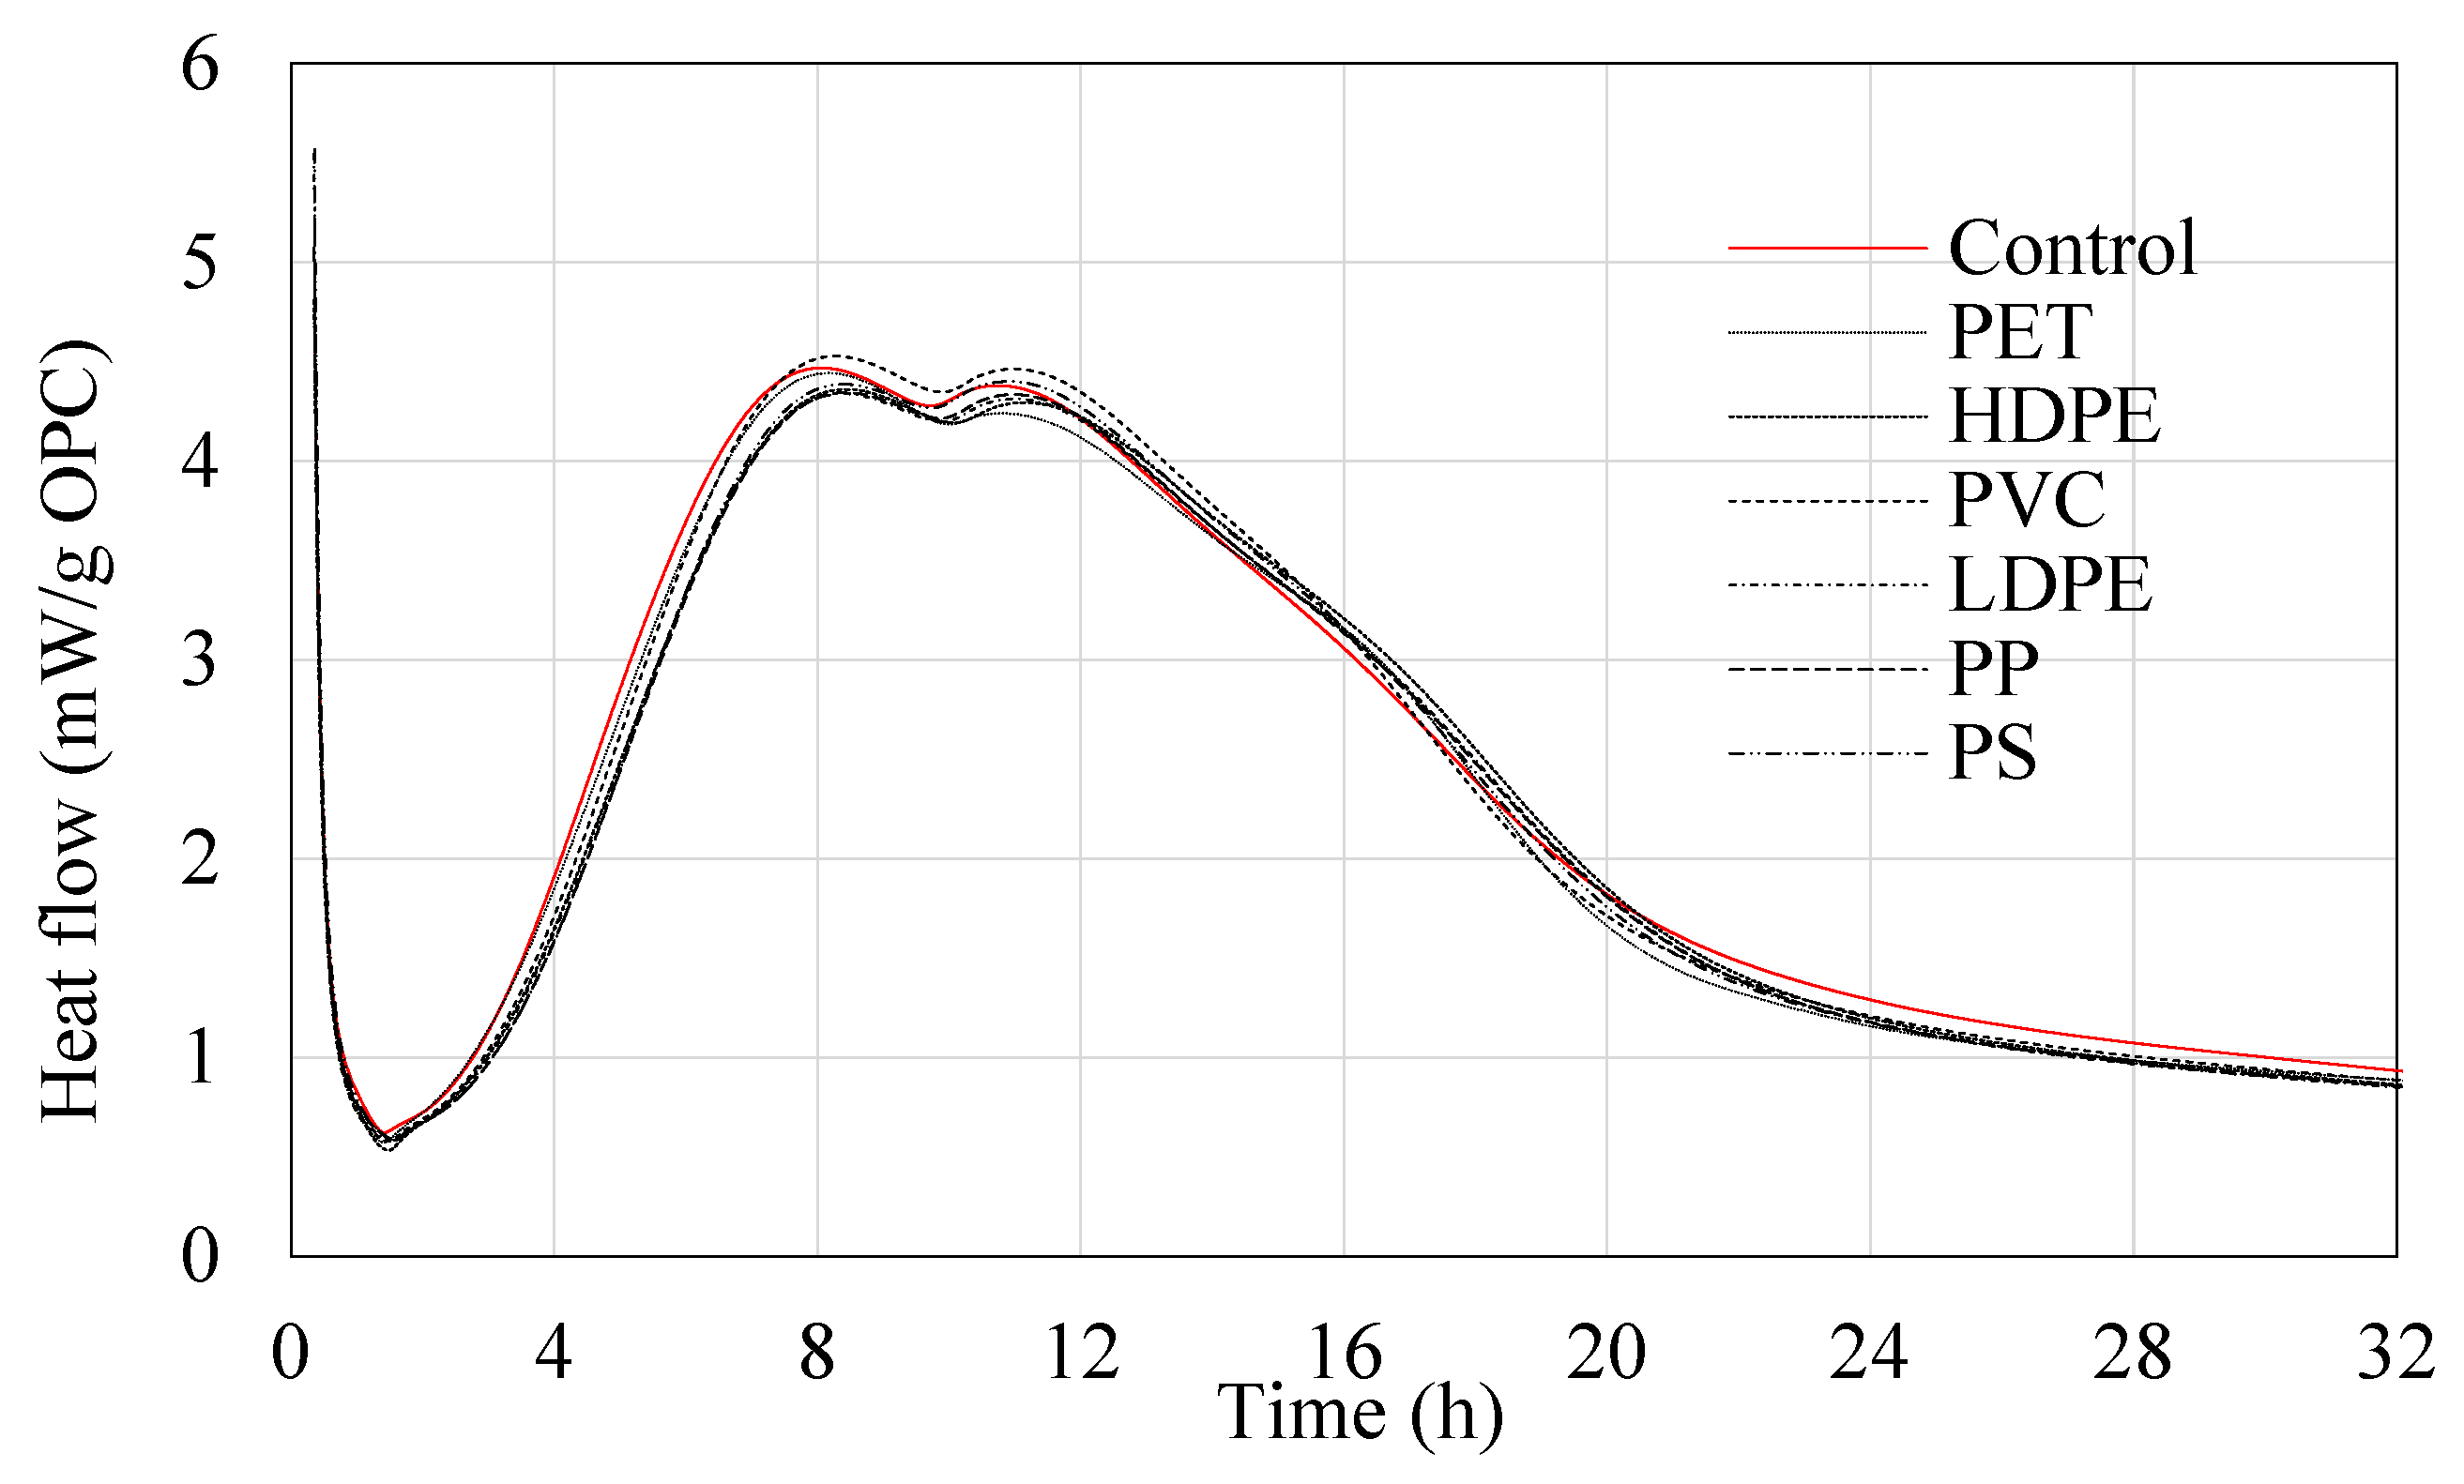
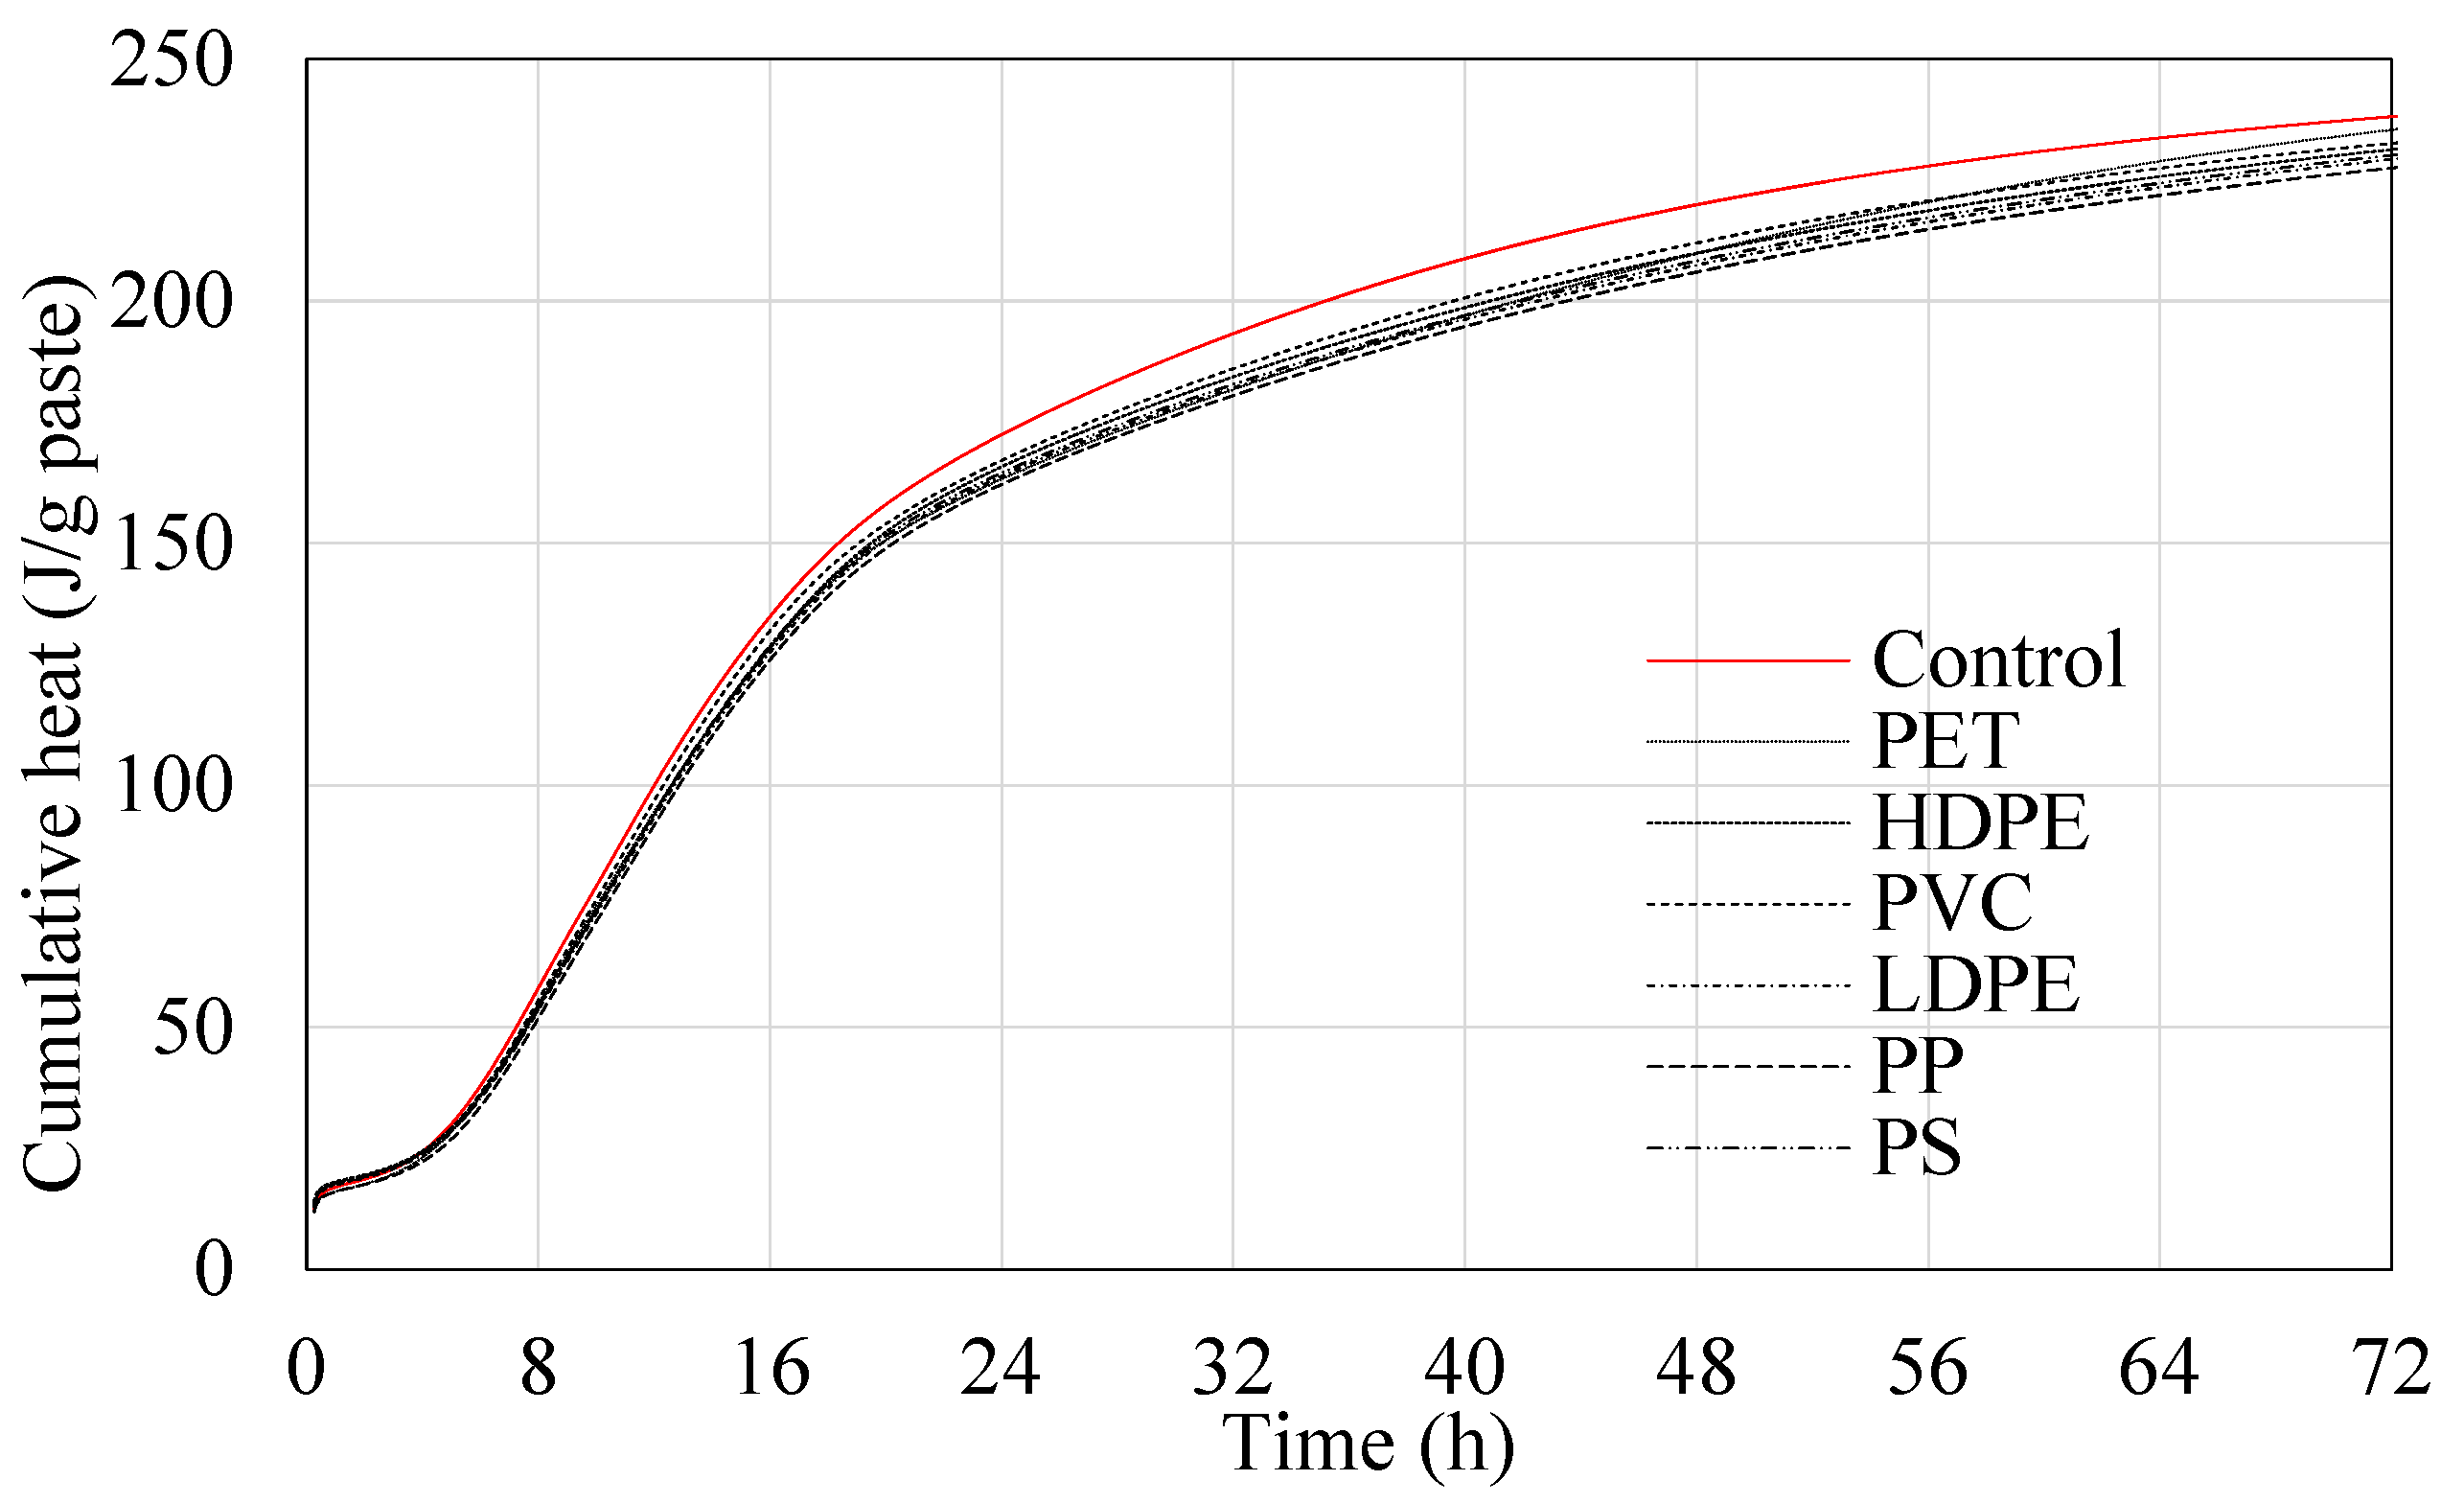
4.1. Effect of Plastic Powder on Cement Hydration

The heat evolution normalized by sample cement weight (mW/g OPC), and the cumulative heat normalized by paste weight (J/g paste) of the OPC and PFA pastes used are shown in Figure 5 and Figure 6. Normalization of the results by cement weight allows for evaluation of impacts of added materials on cement hydration. Incorporation of PFA slightly delayed hydration, with the control paste (C) reaching its maximum rate of heat release at 8.07 h with the plastic–cement mixtures following within 1 h. Peak heat evolution rates of plastic–cement pastes were slightly decreased in comparison with the control sample with the exception of the PVC sample which produced similar max heat evolution as the control mixture. When 5% of OPC was replaced with plastic powders, the exothermic peaks were reduced by less than 5%. Thus, it can be concluded that no significant inhibition of cement hydration occurred due to the replacement of OPC with plastic powders. The slopes of the acceleration periods of all mixtures were also similar, ranging from 0.84 to 0.91 (mW/g OPC/h), suggesting that the presence of plastic particles does not change the rate of acceleration of hydration reactions.
Figure 5 shows the cumulative heat evolved over a 72 h period for the OPC and PFA mixtures. Bentz et al. [46], Ge et al. [47], and Zhiping et al. [48] indicated that there is a strong relationship between the heat of hydration and the strength development of cement composites (e.g., mortar and concrete) with higher heat evolution correlating with higher compressive strengths. Thus, in this research, comparing the cumulative heat at 72 h (Figure 5) of the control paste to other plastic-modified pastes suggests that replacing a small amount (e.g., 5% by mass) of OPC with plastic powders will result in a small reduction in the mechanical strength development of mortar or concrete. Otherwise, no significant changes in hydration are expected with the use of plastics in cementitious mixtures.

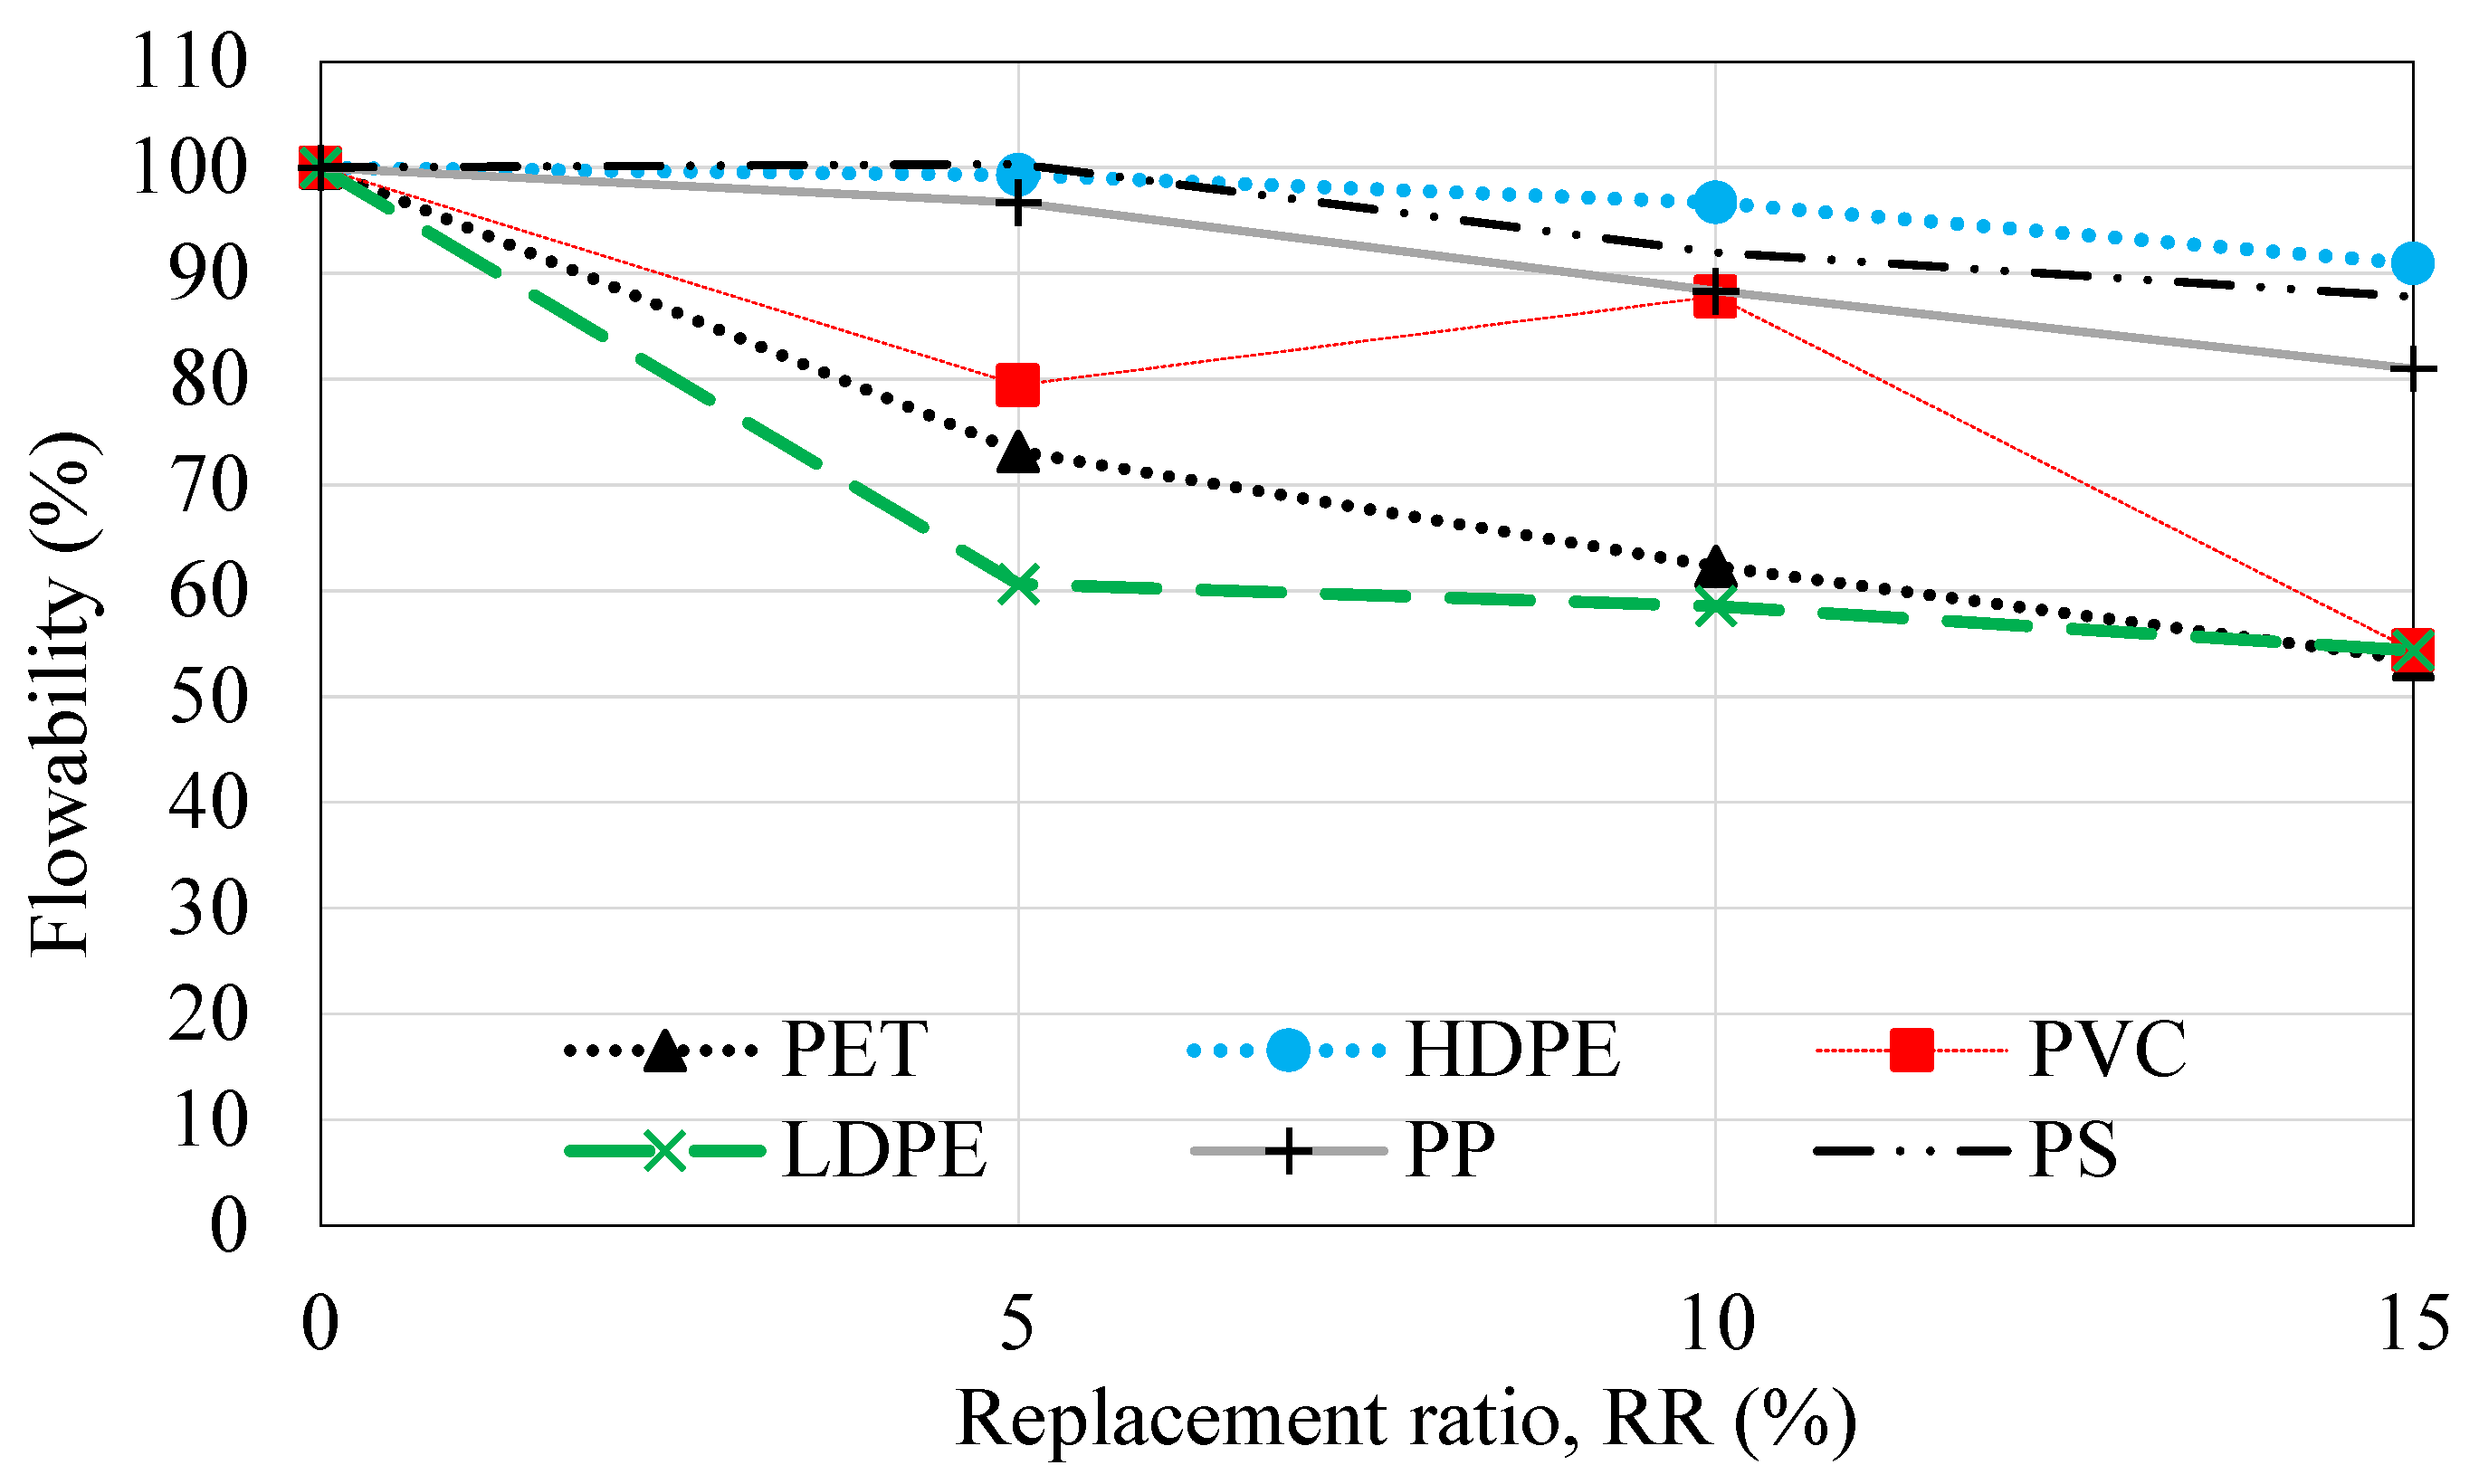
4.2. Effect of Plastic Fine Aggregate on Mortar Flowability

In general, both incorporations of plastic and increases in RRs resulted in reduced flowability relative to the control mix flow (Figure 7). Although plastic fine aggregate samples had a consistent fineness modulus, mortars had different flowability based on the plastic type. Substitution of LDPE, PET, and PVC for NFA resulted in significant reductions in mortar flow. Relative to the control mixture, LDPE mortar reduced the flowability by 39–46%, PET reduced the flowability by 27–46%, and PVC resulted in 12–46% reductions in flowability for the 5–15% RRs. These results align with the findings of previous research, which indicated that the use of these plastics would result in dramatic reductions in mortar workability [49,50,51].
Many previous studies indicated that reductions in flowability or workability of mortars and concretes containing plastics were a result of absorption of mixture water by the plastic aggregates. However, our absorption testing (Table 1) indicated that all plastics used in this study had low to no absorption (0.00–0.81%). Thus, absorption likely did not contribute to reduced flowability. Instead, the dramatic declines in mortar workability are likely related to particle shape. The largest flowability reductions occurred in the LDPE samples, which had a large amount of long, fiber-like particles. Similarly, the sharp edges and corners of the PVC particles and elongated, sharp structure of the PET likely caused higher friction between particles, hindering the flowability. However, workability was less negatively influenced by the granular particles associated with the PVC than the flaky and long particles of the PET and LDPE particles [8]. Previous research concluded that variation in flowability of mortars made with plastic aggregates is attributable to the amount of the plastic and its particle shape, in agreement with the results shown in Figure 6. The degree of irregularity of plastic particles (e.g., flakey versus granular, edge sharpness degree, rough surface versus smooth, long versus short, and surface texture) causes non-uniformity in the mixture aggregate gradation and high susceptibility to segregation and friction [4,31,52,53].

4.3. Effect of Plastic Fine Aggregate on Mortar Dry Density

Figure 8 shows the dry bulk density of 28-day mortars containing different types of plastics with three volumetric sand replacement ratios: 5, 10, and 15%. Mortar density decreased as the plastic content increased since the PFAs have lower specific gravity than the NFA (Table 1). However, mortar density does not only depend on the unit weight of the raw ingredients and the RR but also on the compaction level that is affected by the flowability [54]. Qualitatively, the trend of the dry density plot (Figure 7) is similar to the flowability plot (Figure 6) indicating that the dry density was influenced by flowability and likely compaction. The control mix had the highest density of 2220 kg/m3. LDPE mortars had the lowest densities: 2127 kg/m3, 2076 kg/m3, and 2051 kg/m3 for the RRs of 5, 10, and 15%, respectively.
The theoretical fresh density of mortars containing different RRs of PFAs was determined using established soil mechanics relationships [55] as per Equations (3)–(6). The density (ρM) equals the ratio of the total weight (WT) to the total volume (VT) of the mortar components. The total weight (WT) of the mortar is the sum of the weight of the solids (WS), which are cement and sand (i.e., NFA and PFA), and water (WW). The total volume (VT) of the mortar is the sum of the volume of the solids (VS), which are cement and fine aggregates (i.e., NFA and PFA), the volume of water (VW), and the volume of air (VA), and were determined based on the densities of the individual mixture components. The weight proportions of each mortar mix provided in Table 1 were used for determining the theoretical density of each mix. The volume of each constituent was calculated according to Equation (5), where W and SG refer to the weight and the specific gravity of the constituent (Table 1) and ρW refers to the water density (1000 kg/m3). VA was assumed 4% of VT.
ρ M = W T V T
W T = W S + W W
V T = V S + V w + V a
V = W ( S G × ρ W )
The difference between the actual (experimental) densities and the calculated densities was within ±2% for most mortars (Table 3). If the experimental density is less than the theoretical density, that indicates an increase in air content relative to the original assumption of 4% air. PET plastic had the second-highest density after PVC plastic (Table 1) but its mortar had a lower density than almost all other mortars except LDPE (i.e., 2160 kg/m3, 2121 kg/m3, and 2061 kg/m3 for 5, 10, and 15% RRs). Even though PVC has the highest unit weight, its mortar did not show the highest density. This indicates that parameters other than plastic density influenced the actual density of mortars. For example, the low flowability of the mix (e.g., LDPE mortar) likely resulted in poor compactibility, and increased air content. Table 3 shows the air contents, determined from volumetric calculations, required to achieve the experimentally obtained densities. The PET, PVC, and LDPE air contents were up to 2.25% higher than the air contents of the control, while HDPE, PP, and PS mixtures achieved lower air contents than the control mix. Higher air contents likely resulted from increased compaction difficulty.

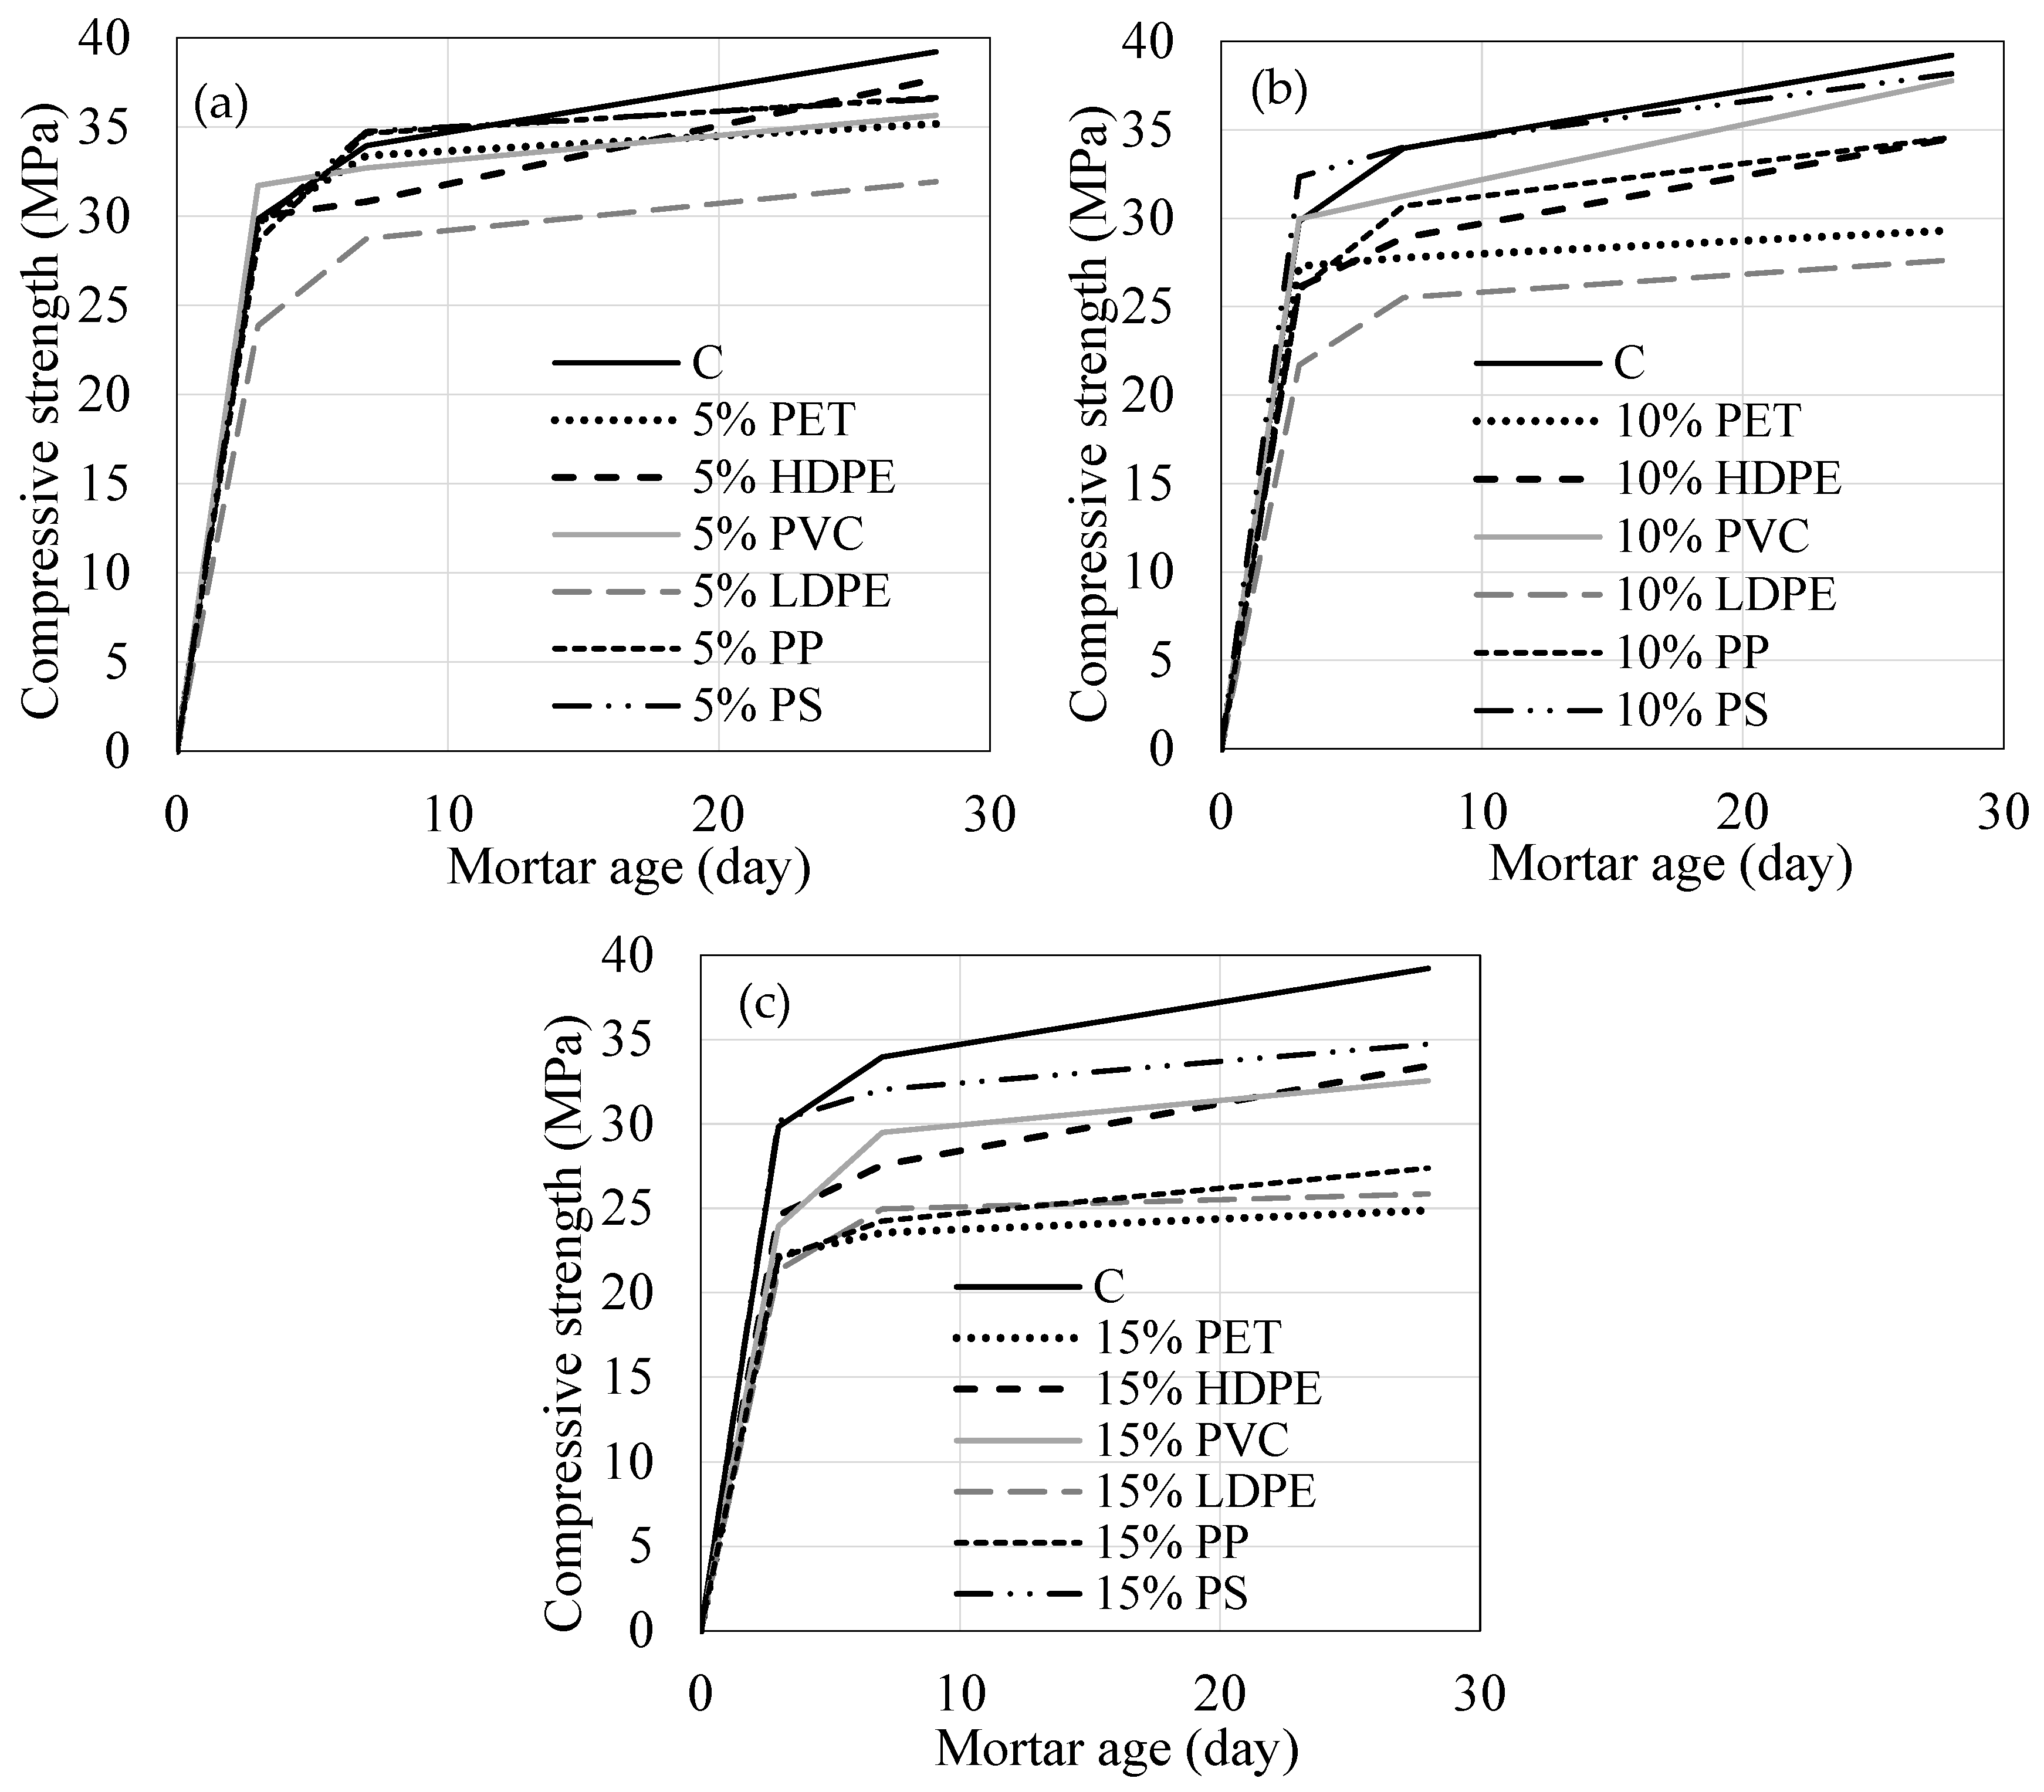
4.4. Effect of Plastic Fine Aggregate on Mortar Compressive Strength

The 3-, 7-, and 28-day compressive strength and standard deviation of the strengths from three samples of mortars containing PFA with three volumetric RRs of 5, 10, and 15% are shown in Figure 9 and Table 4. All mortars with 5% RR, excluding the LDPE mortar, showed limited or no difference in compressive strength, with the resulting strengths being less, but within the error range in comparison with the control specimen (Figure 9a). The 5% RR LDPE mortar showed a 19% reduction in compressive strength.
With a 10% RR PET, HDPE, LDPE, and PP mortars exhibited decreases in compressive strength ranging from 9 to 27% at three days. The PVC mortar’s compressive strength showed no change in strength relative to the control and the PS mortar exhibited an 8% increase in compressive strength (Figure 9b). However, by seven days, the PVC, PP, and PS compressive strengths were within the error range of the control mixture. At the same age, PET, HDPE, and LDPE exhibited compressive strength reductions of 18, 15, and 25%, respectively, compared to the control mortar. At 28 days, PET and LDPE mortar compressive strength reductions were 25 and 30%, respectively, in comparison with the control specimen. Other mortars, HDPE, PVC, PP, and PS, showed changes that were within the error range of the control (Table 4).
Replacing 15% of NFA with PFA resulted in a high drop in compressive strength for most mortars containing plastic particles. At 3, 7, and 28 days of curing, PS mortar showed no change in strength relative to the control specimen. However, other plastic mortars exhibited decreases of more than 17% (Figure 9c) at 7 days. The 28-day strengths continued to show significant reductions in compressive strengths for most of the PFA mortars. At 28 days, PET and LDPE mortars had the lowest strength with 37% and 34% reductions, respectively. Other 15% RR mortars, HDPE, PVC, and PP, showed compressive strength reductions of 15%, 17%, and 30%, respectively, compared to the control specimen.

4.5. Effect of Plastic Fine Aggregate on Mortar Flexural Strength

The flexural strength of mortars made by replacing 5, 10, and 15% of NFA with plastic aggregates is provided in Figure 10. Table 4 presents the changes in the flexural strength of polymer-aggregate mortars in comparison with the control specimen at 28 days. Flexural strength differed based on the plastic type and RR and decreased more than compressive strength for the majority of the plastic-aggregate mortars. Overall, at all RRs, PET and PS mortars showed the lowest and highest flexural strength, respectively. The ratio of flexural to compressive strength ranged from 8 to 13%.
At low plastic content (5%), PVC, LDPE, and PS mortars exhibited flexural strengths that were not significantly different from the control specimen. At the same RR (5%) and age of 28 days, the flexural strength of other plastic-aggregate mortar types showed drops ranging from 10 to 21% as presented in Figure 10. At 10% RR and 28 days (Figure 10b), PVC and PS exhibited flexural strength reductions of 9 and 12%, respectively, compared to the control specimen. Other 28-day mortars, including 10% PET, HDPE, LDPE, and PP, showed flexural strength reductions ranging from 22 to 34% (Figure 10b). At the highest RR (15%) and age of 28 days (Figure 10c), flexural strength decreases in the PET, HDPE, PVC, LDPE, PP, and PS mortars were within the range of 23 to 58%.

4.6. Parameters Affecting Strength of Mortars Containing Plastic Particles

The compressive and flexural strength of mortars differed based on the plastic type. Replacing 15% of NFA with LDPE resulted in a reduction of 34% in compressive strength, whereas with the same RR, the compressive strength reduction in PS mortar was 11% (Table 4). The compressive strength of mortars containing plastic aggregates did not show a correlation with the compressive strength, nor the modulus of elasticity, of the plastics (Figure 1 and Figure 2). For example, PET plastic has approximately 300% higher average compressive strength and approximately double (200%) higher average modulus of elasticity compared to HDPE plastic. However, PET-containing mortar generated compressive strengths 25% lower than that of the HDPE mortar (Figure 9 and Figure 10). Similarly, the compressive and tensile properties of LDPE plastic are similar to those of HDPE plastic, yet LDPE mortar strength was ~25% less than that of the HDPE mortar. Thus, the relationship between the mechanical strength of plastics and that of the corresponding mortars is not direct and is significantly affected by factors other than plastic strength, including RR, flowability, mortar density, particle morphology, and bonding. The interfacial transition zone (ITZ) has been shown to be influenced by the size, shape, texture, and surface condition of the plastic particles, and the quality of the ITZ occurring at the cement and plastic interface likely contributes to the changes observed for PFA mortar specimens. ITZ quality was not directly assessed by this study for all plastic types, but has been shown to occur in previous research [28].
Improved flowability combined with a particle morphology that promotes a good bond with cement (e.g., granular particles with a rough surface) and contributed to the higher strengths measured in HDPE, PP, and PS samples. HDPE plastic itself has relatively low compressive strength (Figure 1 and Figure 2) compared to other plastics. However, the high degree of surface roughness and angularity of its particles could have produced good adhesion with the cement paste, and lessened compressive strength reductions, resulting in only a 4% reduction at 5% RR and 28 days. In comparison with other plastic-aggregate mortars, both flowability and compressive strengths were reduced least in the PS mortar at all RRs. At a RR of 10%, an 8% reduction in flowability compared to the control occurred while the reduction in compressive strengths was 3% at 28 days. In comparison, PET reduced flowability by 38% and demonstrated a 37% compressive strength reduction compared to the control. The reduction in loss of both flowability and strength can be attributed to the angular shape and rough surface of the PS particles, resulting in a better bond with the cement paste. PET particles are flaky with a smooth, lower overall surface area and thus, reduced bond area at the microscale, resulting in reduced compressive strength at the macroscale. PET particles were also thinner, contributing to higher bubble formation during mixing processes (evidenced by greater reductions in density compared to the theoretical reductions resulting from density changes alone than for other plastics), resulting in weaker microstructure as was indicated by Hannawi et al. [29].

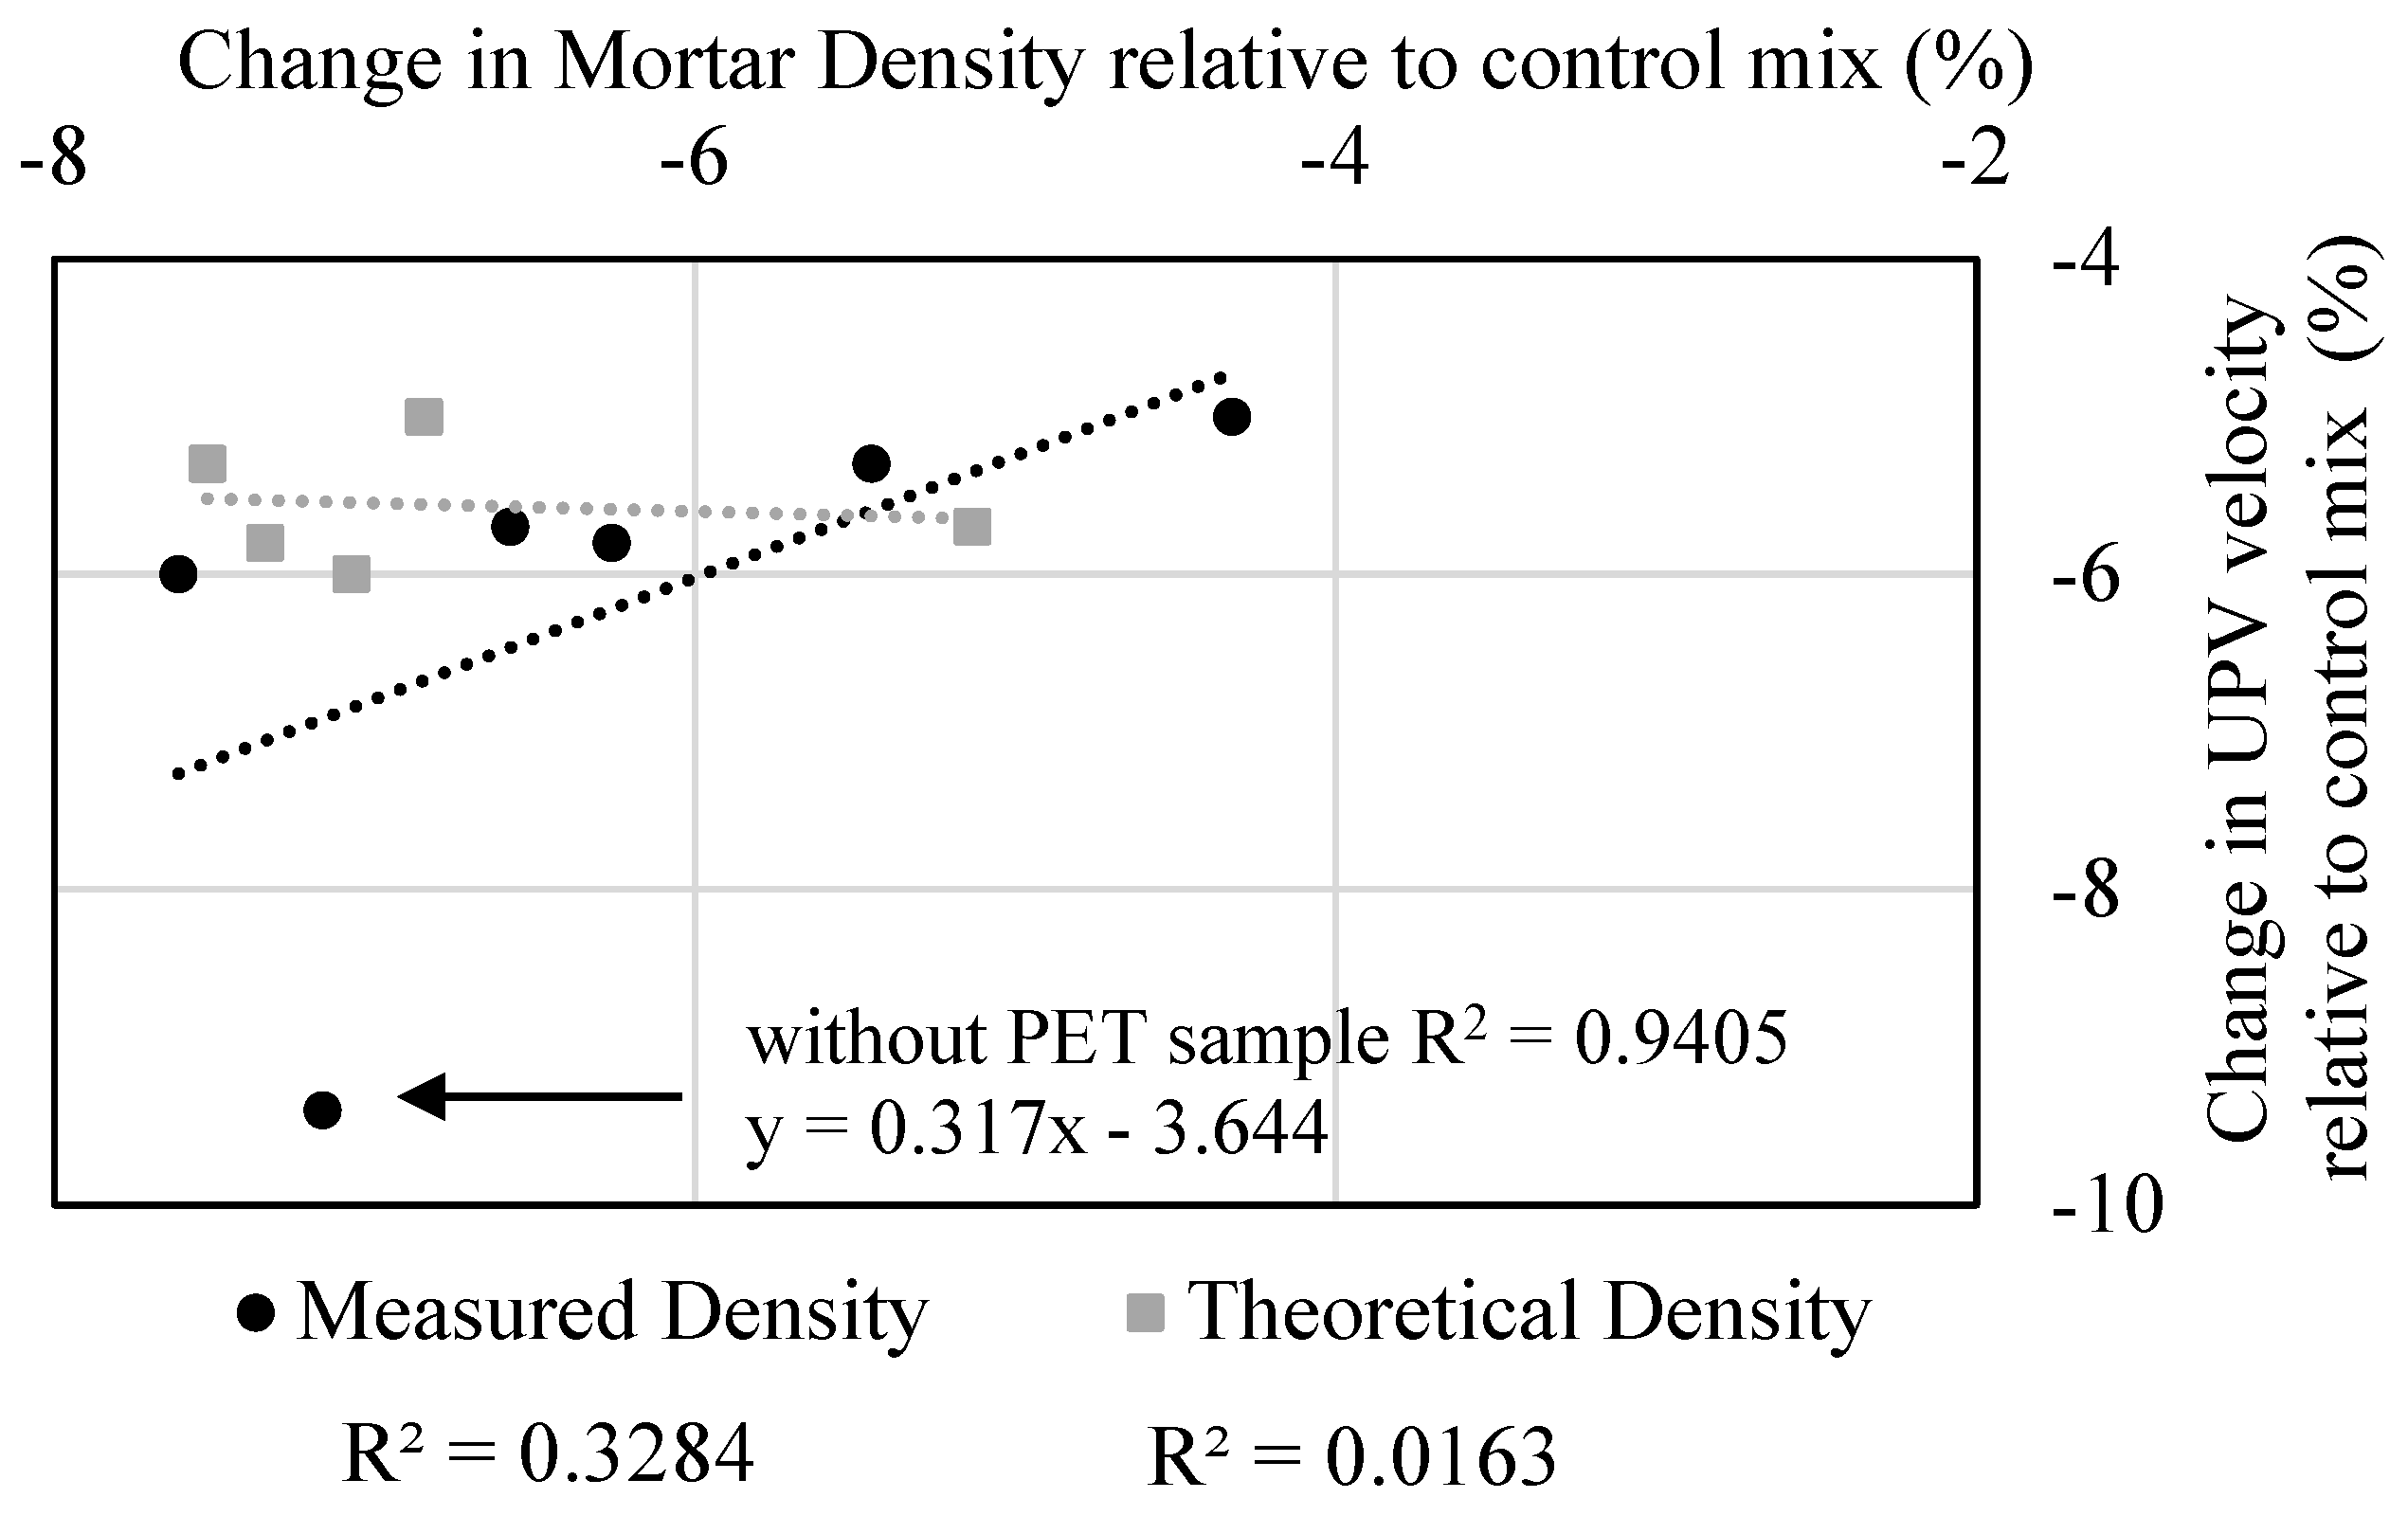
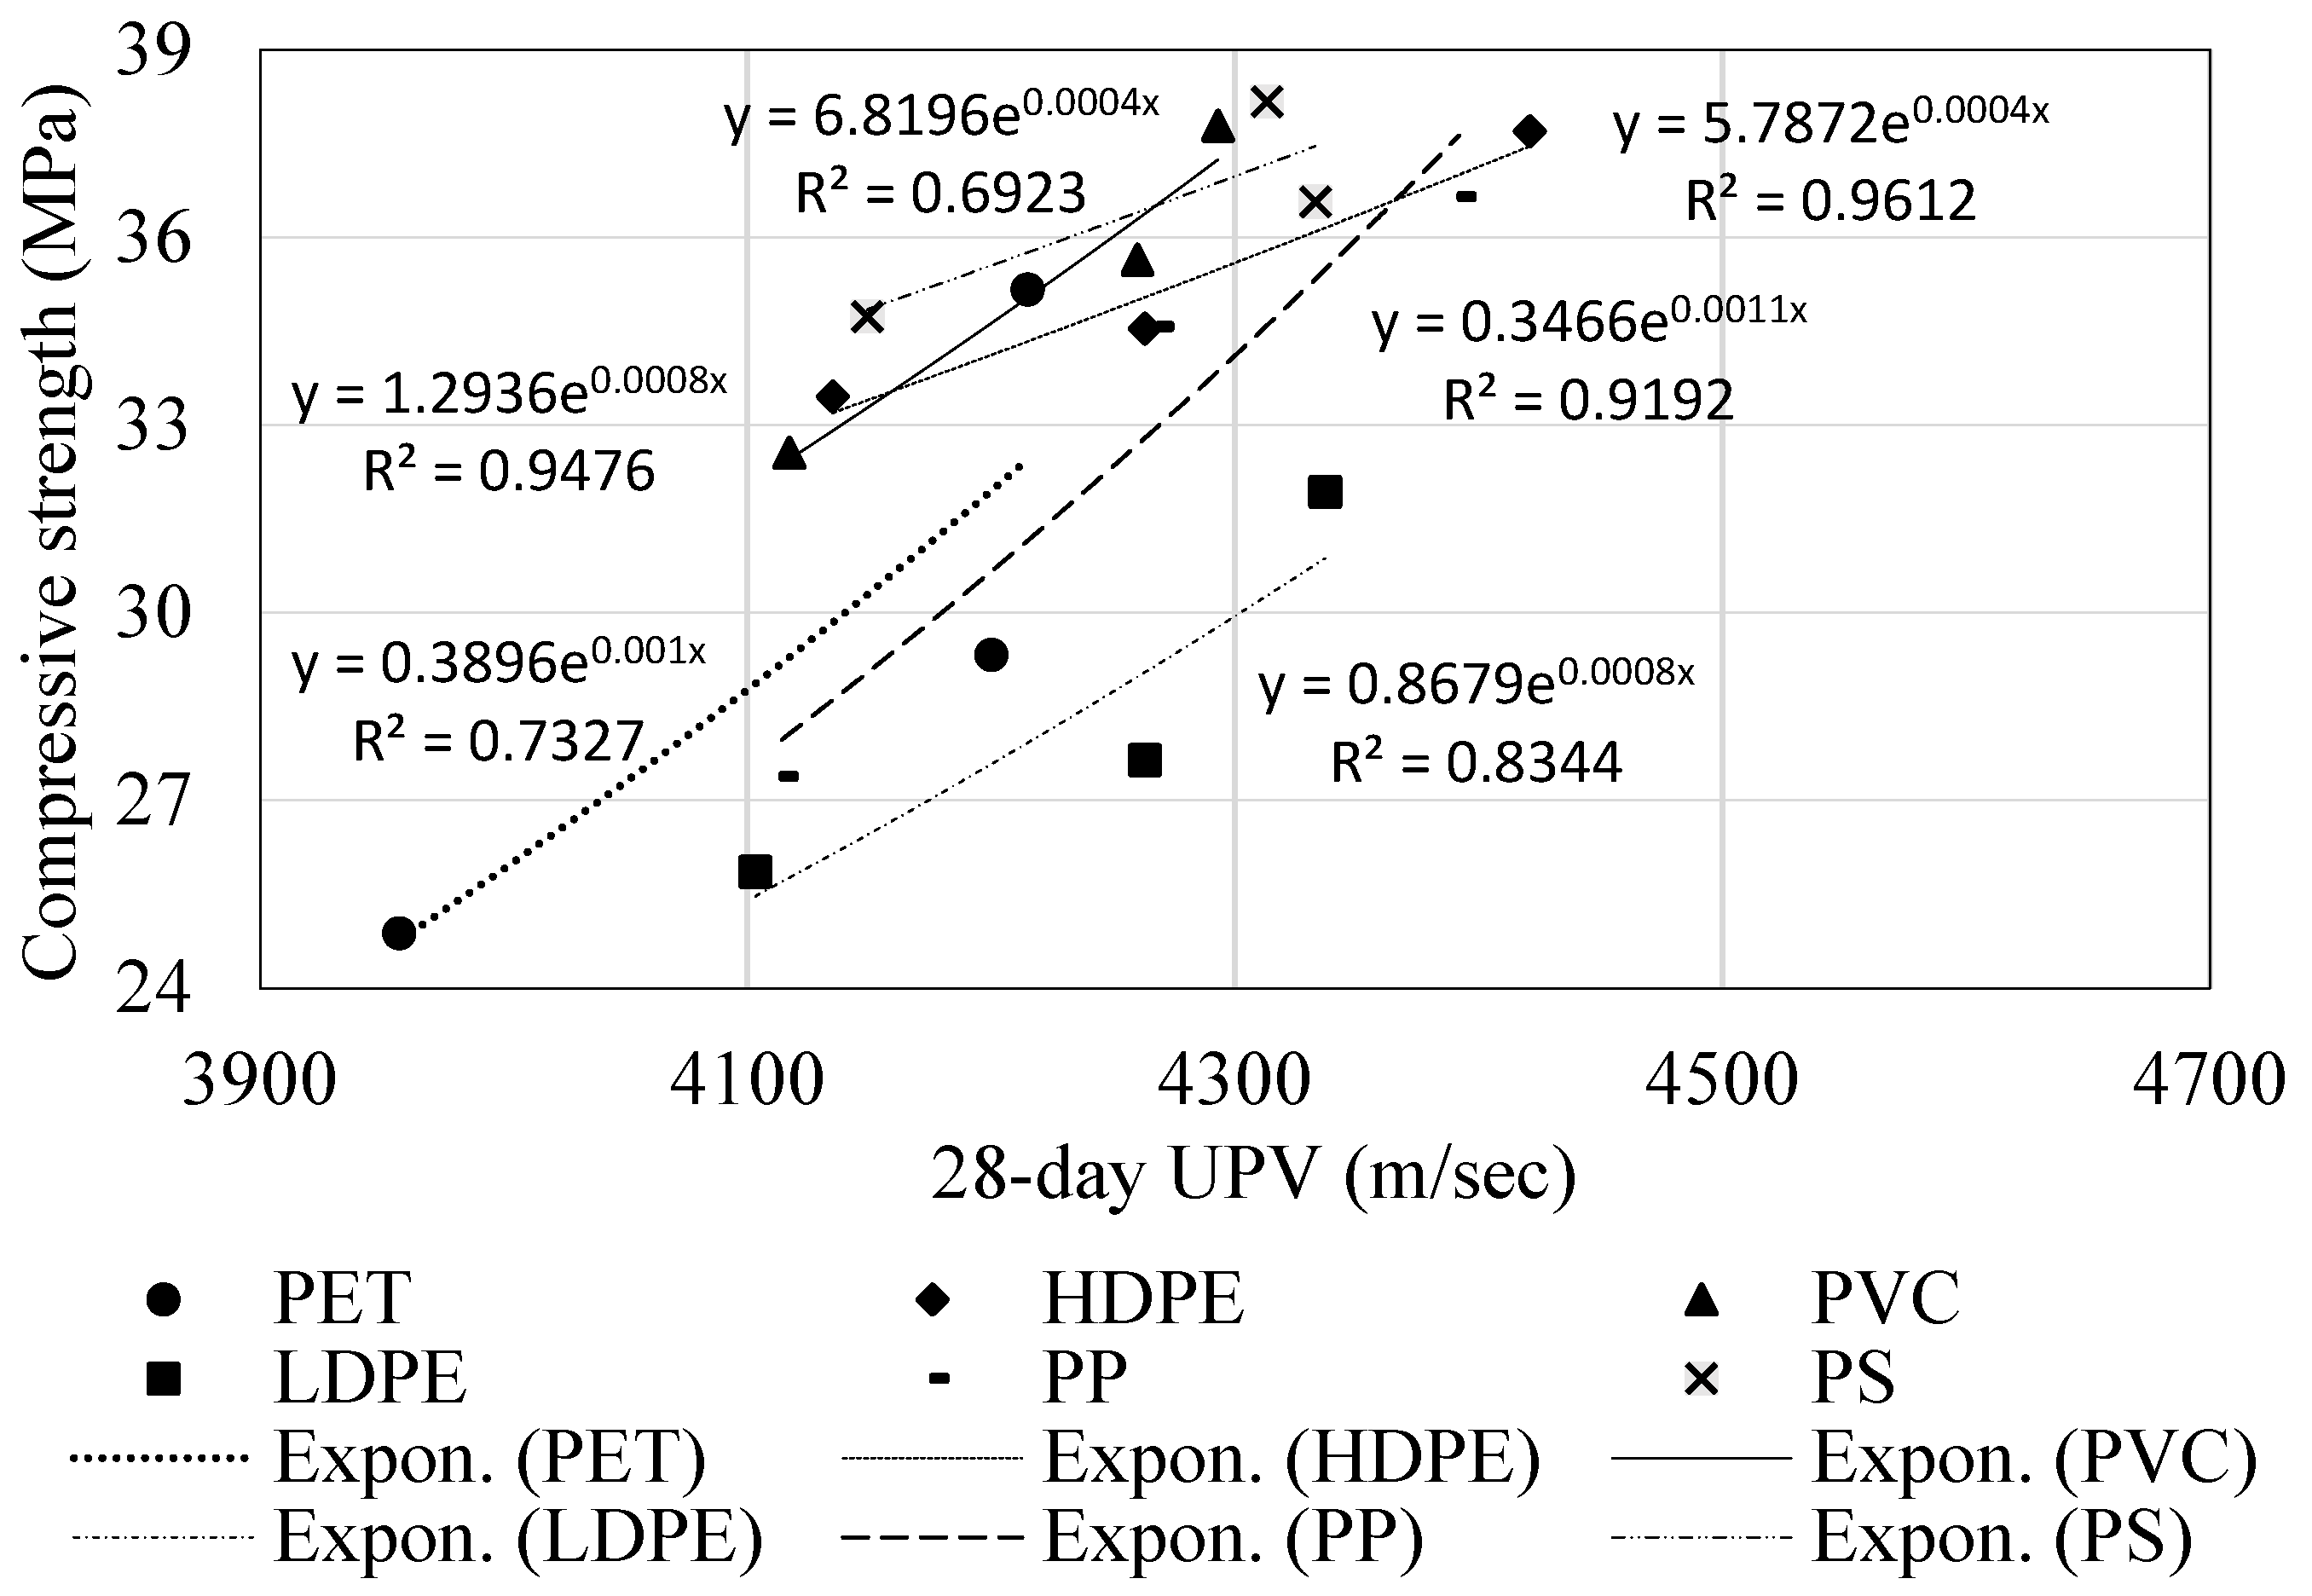
4.7. Effect of Plastic Fine Aggregate on Ultrasonic Pulse Velocity

The ultrasonic pulse velocity (UPV) as a function of plastic type and content at age of 28 days is presented in Figure 11. The change in UPV of the different mortars versus the control mortar is summarized in Table 5. UPV was utilized to investigate microstructural effects in the plastic-modified mortars. UPV has been shown to be dependent on the elastic properties of a material, and can therefore indicate changes or differences in density, porosity, and pore size of cementitious materials [56,57,58]. UPV signal is also affected by differences in aggregate content and water content (e.g., w/c) of cementitious mixtures, but as these factors were held constant across the set of mortars evaluated in this study, UPV signal differences between mixtures will be independent of aggregate and w/c effects.
In general, the use of PFA as a substitution for NFA resulted in reductions in pulse velocities compared to the control mortar, except for HDPE and PP mortars, which had slight increases in UPV. The impact of replacing NFA with PFA differed depending on the plastic type and RR; however, differences were generally small. Increasing the plastic content increases the porosity and decreases the density and overall strength [59,60]. Mortars with the lowest densities (i.e., PET and LDPE) as presented in Figure 8 showed the lowest UPV (Figure 11). Changes in UPV were found to correlate with changes in mortar density (Table 3).
Figure 12 shows the relationships between theoretical and measured densities. The trendline and correlation coefficient are shown with all of the samples included in this study. However, with removal of the PET sample, a noticeable outlier of the sample set, the correlation coefficient for the relationship between measured mortar densities and UPV increases to 0.94. This indicates a strong correlation between mortar density and UPV values, with decreasing UPV indicating decreasing mortar density. If reductions in UPV were primarily a result of reduced mortar density as a result of incorporation of lower-density plastic particles, we should see a relationship between UPV and the theoretical density, which was determined based on changes in mortar component densities. However, this relationship, also shown in Figure 12, is very weak (R2 = 0.016), even with the PET sample removed from the sample set. This lack of relationship suggests that the mortar density and porosity of the mortar mixture governs changes in UPV signal. These results disprove assertions by several authors suggesting that reductions in UPV and mortar density were primarily related to the use of lower-density materials in the mixtures, or reflections of UPV signal by plastics [14,16,17,60,61]. Although several other authors [19,62] have suggested increases in porosity cause the UPV reductions, this study is the first to provide experimental evidence supporting this conclusion.
A exponential correlation between compressive strength and UPV for each of the plastic types is provided in Figure 13. Relationships are similar to those developed for mortar UPV–compressive strength relationships in previous studies [56,61,62]. Compressive strength increased as the UPV increased for all mortars made with different contents and types of PFA. HDPE, PVC, and PP mortars showed especially strong correlations (R2 = 0.96, 0.94, and 0.92, respectively) between strength and pulse velocity values. Based on the UPV results and compressive strength results, it can be concluded that the quality of mortars made with plastic particles declined, and porosity increased, as the RR increased. The quality of the PET and LDPE mortars was lowest and the PS mortar quality highest. Previous research utilizing UPV and PFA also showed decreases in the UPV as the plastic aggregate content increased and indicated that this decline was due to the higher porosity of cementitious composites containing plastic particles [10,40].

5. Conclusions

This study investigated recycling plastic as a fine aggregate to replace natural fine aggregate. Six types of plastics (i.e., PET, HDPE, PVC, LDPE, PP, and PS) were used, and the impact of plastic type, particle fineness, and replacement ratio on the hydration kinetics of cement paste, and flowability, density, and mechanical strengths of mortars was assessed. The following conclusions were found:
  • Plastic powders with a maximum particle size of 75 µm had little effect on early-age hydration reactions and hydration kinetics.
  • Mortars with different plastic fine aggregates and RRs showed a wide range of flowability, with PET and LDPE mortars having the lowest flowability. Particle shape strongly affected flowability, and flowability directly influenced hardened mortar properties (density and compressive and flexural strength) due to resulting compaction quality.
  • Mortar compressive and flexural strengths declined with increasing content of the plastic fine aggregate.
  • After 28 days of curing, with the exception of the LDPE sample, which had slightly reduced strength, replacement ratios of 5% of NFA with PFA had almost no effect on compressive strengths. Only PET and LDPE had compressive strengths significantly lower than that of the control when using a 10% RR.
  • Among the different types of plastic-aggregate mortars, incorporating PS fine aggregate resulted in the highest mechanical strength. Meanwhile, the lowest strengths resulted in PET and LDPE mortars.
  • The ratio of flexural to compressive strength ranged from 8 to 13%.
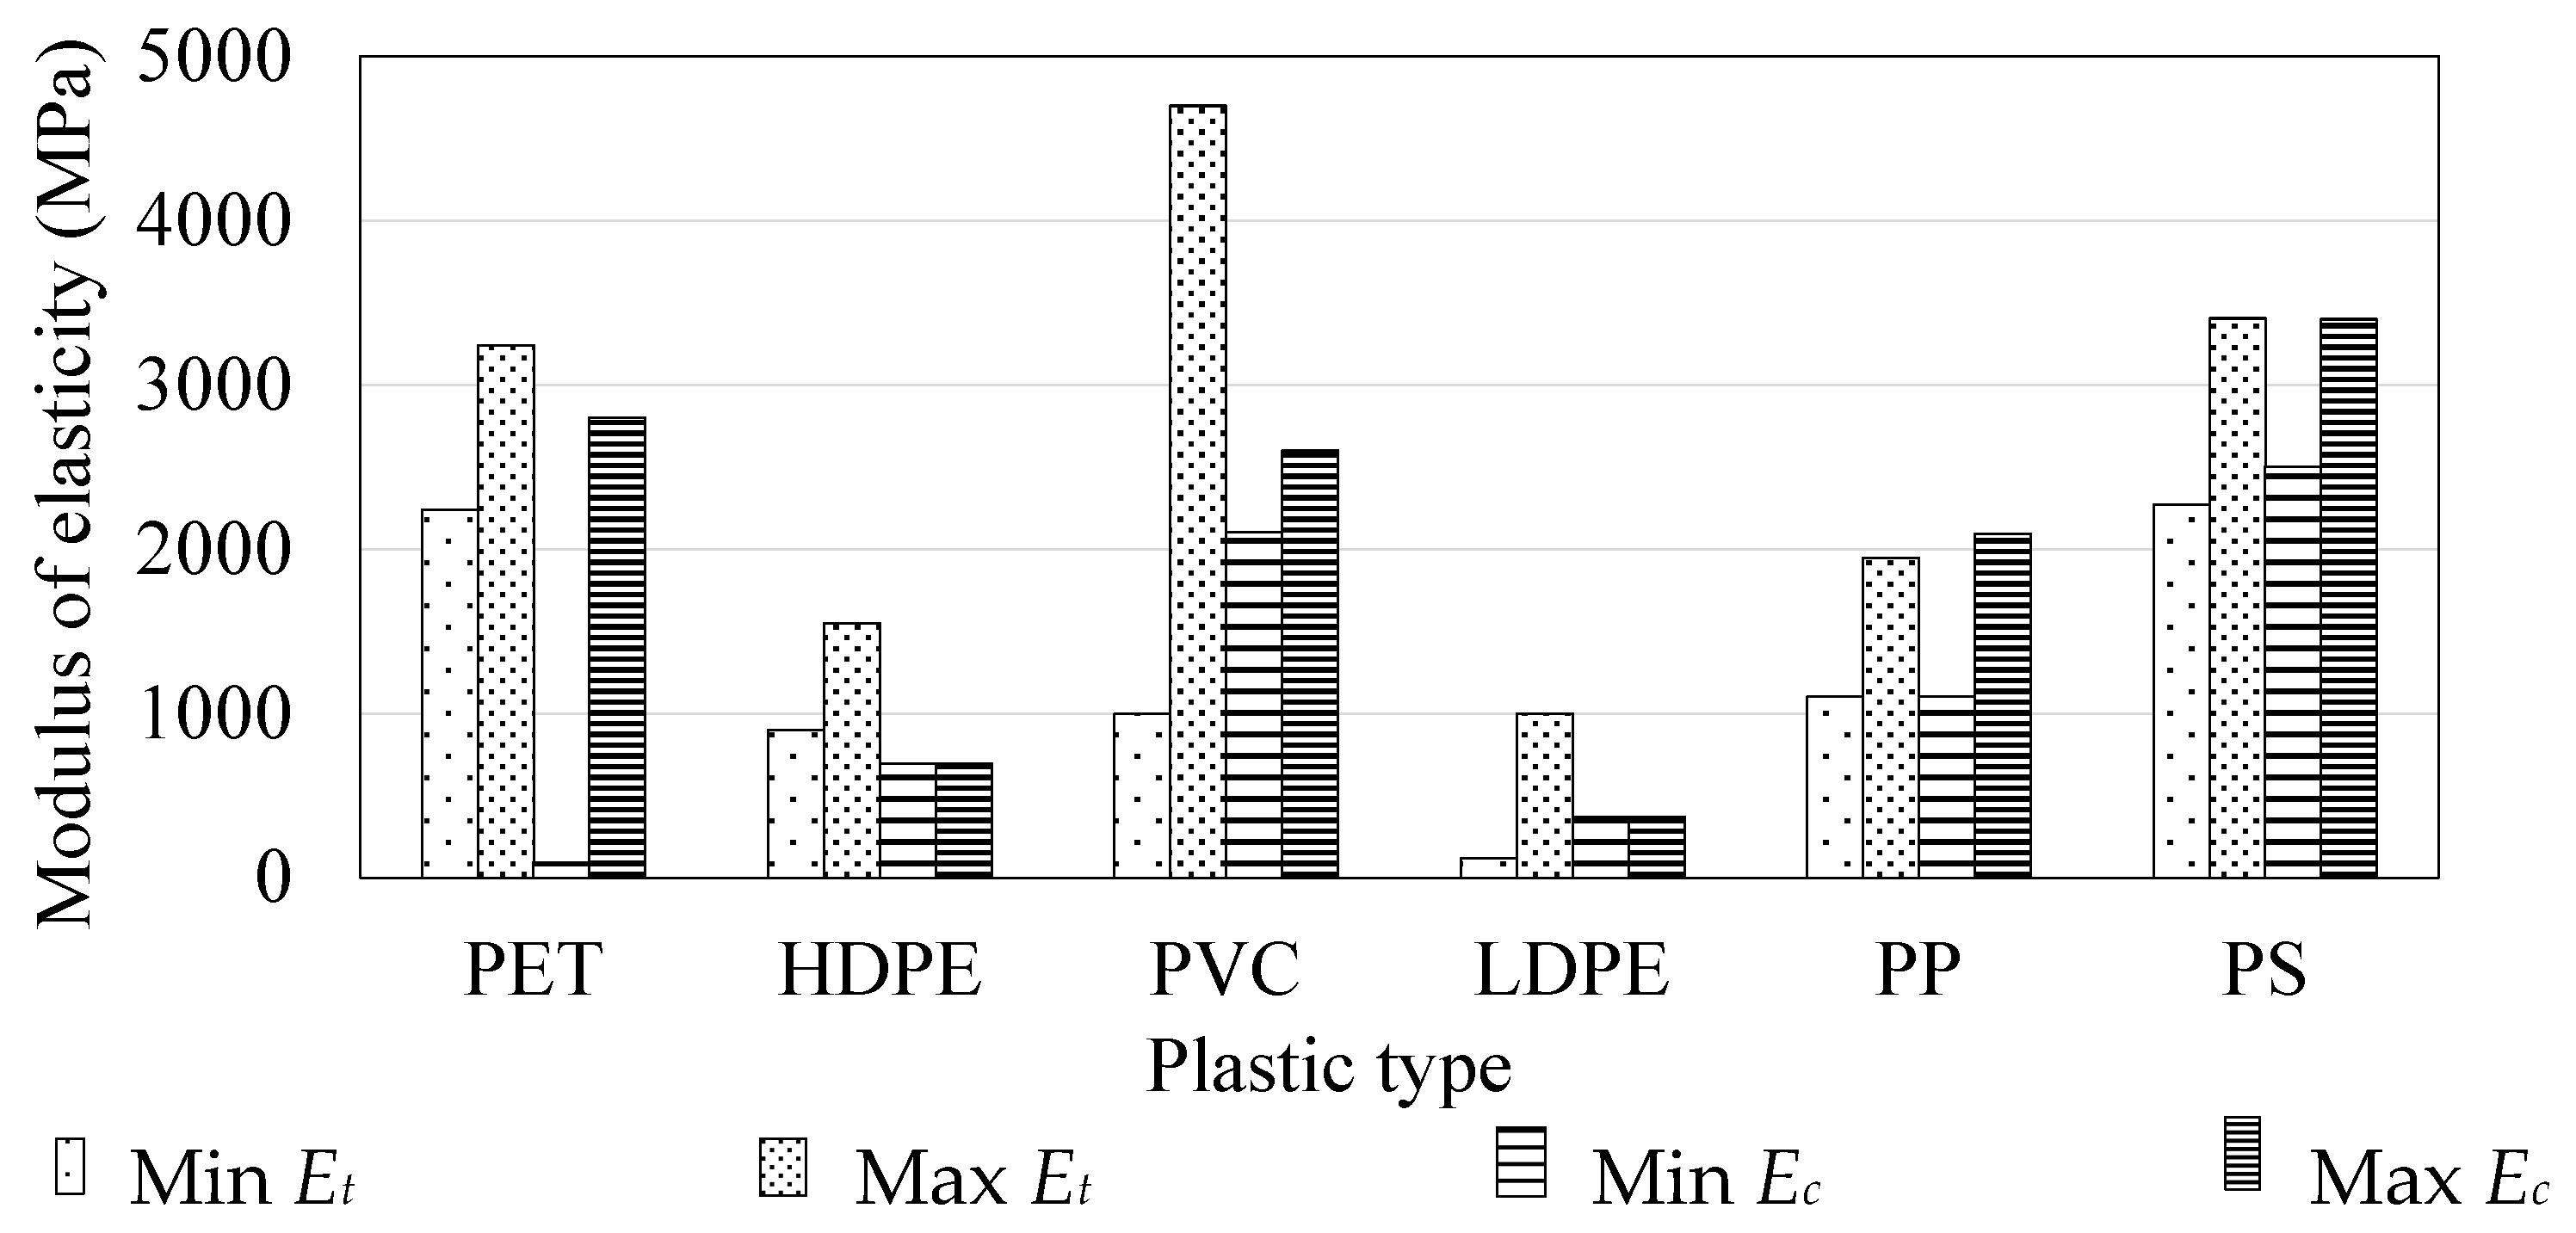
  • The mechanical strength of the polymer-modified mortar was not directly impacted by the mechanical strength of the polymer type used as a fine aggregate.
  • UPV was shown to reflect changes in the porosity of the mortars, rather than changes in mortar density resulting simply from the substitution of sand with low-density plastics.
  • UPV measurements revealed that as the amount of PFA increased, the compressive strength of the mortar decreased and porosity increased.

Author Contributions

Conceptualization, R.A. and H.S.; methodology, R.A., L.B. and H.S.; validation, J.C. and H.S.; formal analysis, R.A.; investigation, R.A.; data curation, R.A. and L.B.; writing—original draft preparation, R.A.; writing—review and editing, H.S. and L.B.; visualization, R.A.; supervision, J.C. and H.S.; project administration, H.S. All authors have read and agreed to the published version of the manuscript.

Funding

This research received no external funding.

Data Availability Statement

The raw data supporting the conclusions of this article will be made available by the authors on request.

Acknowledgments

The authors have reviewed and edited the output and take full responsibility for the content of this publication.

Conflicts of Interest

The authors declare no conflicts of interest.

References

  1. U.S. Environmental Protection Agency. Greenhouse Gases Equivalencies Calculator: Calculations and References; Environmental Protection Agency: Washington, DC, USA, 2022. [Google Scholar]
  2. Naik, T.; Singh, S.; Huber, C.; Brodersen, B. Use of post-consumer waste plastics in cement-based composites. Cem. Concr. Res. 1996, 26, 1489–1492. [Google Scholar] [CrossRef]
  3. Tasong, W.; Lynsdale, C.; Cripps, J. Aggregate-cement paste interface. Part I. Influence of aggregate geochemistry. Cem. Concr. Res. 1999, 29, 1019–1025. [Google Scholar] [CrossRef]
  4. Choi, Y.; Moon, D.; Kim, Y.; Lachemi, M. Characteristics of mortar and concrete containing fine aggregate manufactured from recycled waste polyethylene terephthalate bottles. Constr. Build. Mater. 2009, 23, 2829–2835. [Google Scholar] [CrossRef]
  5. Correia, J.; Lima, J.; Brito, J. Post-fire mechanical performance of concrete made with selected plastic waste aggregates. Cem. Concr. Compos. 2014, 53, 187–199. [Google Scholar] [CrossRef]
  6. Guendouz, M.; Debieb, F.; Boukendakdji, O.; Kadri, E.; Bentchikou, M.; Soualhi, H. Use of plastic in sand concrete. J. Mater. Environ. Sci. 2016, 7, 382–389. [Google Scholar]
  7. Ceran, O.; Simsek, B.; Uygunoglu, T.; Sara, O. PVC concrete composites: Comparative study with other polymer concrete in terms of mechanical, thermal, and electrical properties. J. Mater. Cycles Waste Manag. 2019, 21, 818–828. [Google Scholar] [CrossRef]
  8. Zulkernain, N.; Gani, P.; Chuan, N.; Uvarajan, T. Utilisation of plastic waste as aggregate in construction materials: A review. Constr. Build. Mater. 2021, 296, 123669. [Google Scholar] [CrossRef]
  9. Schaefer, C.; Patil, K.; Ortega, M.; Soriano, C.; Buyukozturk, O.; White, A.; Short, M. Irradiated recycled plastic as a concrete additive for improved chemo-mechanical properties and lower carbon footprint. Waste Manag. 2018, 71, 426–439. [Google Scholar] [CrossRef]
  10. Liu, T.; Nafees, A.; Javed, M.F.; Aslam, F.; Alabduljabbar, H.; Xiong, J.J.; Malik, M.Y. Comparative study of mechanical properties between irradiated and regular plastic waste as a replacement of cement and fine aggregate for manufacturing of green concrete. Ain Shams Eng. J. 2022, 13, 101563. [Google Scholar] [CrossRef]
  11. Grigoriadis, K.; Bañuls-Ciscar, J.; Caverzan, A.; Negro, P.; Senaldi, C.; Ceccone, G. Use of irradiated PET plastic waste for partially replacing cement in concrete. Waste Manag. 2023, 170, 193–203. [Google Scholar] [CrossRef]
  12. Bahij, S.; Omary, S.; Feugeas, F.; Faqiri, A. Fresh and hardened properties of concrete containing different forms of plastic waste: A review. Waste Manag. 2020, 113, 157–175. [Google Scholar] [CrossRef] [PubMed]
  13. Ibrahim, A.A.; Najla’a, H.; Jaber, M.H.; Hassan, R.F.; Hussein, H.H.; Al-Salim, N.H. Experimental investigation of flexural and shear behaviors of reinforced concrete beam containing fine plastic waste aggregates. Structures 2022, 43, 834–846. [Google Scholar] [CrossRef]
  14. Hamada, H.M.; Al-Attar, A.; Abed, F.; Beddu, S.; Humada, A.M.; Majdi, A.; Thomas, B.S. Enhancing sustainability in concrete construction: A comprehensive review of plastic waste as an aggregate material. Sustain. Mater. Technol. 2024, 40, 00877. [Google Scholar] [CrossRef]
  15. Guo, Y.C.; Li, X.M.; Zhang, J.; Lin, J.X. A review on the influence of recycled plastic aggregate on the engineering properties of concrete. J. Build. Eng. 2023, 79, 107787. [Google Scholar] [CrossRef]
  16. Safi, B.; Saidi, M.; Aboutaleb, D.; Maallem, M. The use of plastic waste as fine aggregate in the self-compacting mortars: Effect on physical and mechanical properties. Constr. Build. Mater. 2013, 43, 436–442. [Google Scholar] [CrossRef]
  17. Frigione, M. Recycling of PET bottles as fine aggregate in concrete. Waste Manag. 2010, 30, 1101–1106. [Google Scholar] [CrossRef]
  18. Senhadji, Y.; Siad, H.; Escadeillas, G.; Benosman, A.S.; Chihaoui, R.; Mouli, M.; Lachemi, M. Physical, mechanical and thermal properties of lightweight composite mortars containing recycled polyvinyl chloride. Constr. Build. Mater. 2019, 195, 198–207. [Google Scholar] [CrossRef]
  19. Harihanandh, M.; Karthik, P. Feasibility study of recycled plastic waste as fine aggregates in concrete. Mater. Today Proc. 2022, 52, 1807–1811. [Google Scholar] [CrossRef]
  20. Rahmani, E.; Dehestani, M.; Beygi, M.; Allahyari, H.; Nikbin, I. On the mechanical properties of concrete containing waste PET particles. Constr. Build. Mater. 2013, 47, 1302–1308. [Google Scholar] [CrossRef]
  21. Cordoba, L.; Barrera, G.; Diaz, C.; Nunez, F.; Yanez, A. Effects on mechanical properties of recycled PET in cement-based composite. Int. J. Polym. Sci. 2013, 2013, 763–776. [Google Scholar]
  22. Azhdarpour, A.; Nikoudel, M.; Taheri, M. The effect of using polyethylene terephthalate particles on physical and strength-related properties of concrete: A laboratory evaluation. Constr. Build. Mater. 2016, 109, 55–62. [Google Scholar] [CrossRef]
  23. Vaillancourt, C.; Sorelli, L. Characterization of concrete composites with recycled plastic aggregates from post-consumer material streams. Constr. Build. Mater. 2018, 182, 561–572. [Google Scholar] [CrossRef]
  24. Ferreira, L.; Brito, J.; Saikia, N. Influence of curing conditions on the mechanical performance of concrete containing recycled plastic aggregate. Constr. Build. Mater. 2012, 36, 196–204. [Google Scholar] [CrossRef]
  25. Islam, M.; Meherier, M.; Islam, A. Effects of waste pet as coarse aggregate on the fresh and hardened properties of concrete. Constr. Build. Mater. 2016, 125, 946–951. [Google Scholar] [CrossRef]
  26. Tang, W.; Lo, Y.; Nadeem, A. Mechanical and drying shrinkage properties of structural-graded polystyrene aggregate concrete. Cem. Concr. Compos. 2008, 30, 403–409. [Google Scholar] [CrossRef]
  27. Chen, C.; Jaffe, N.; Koppitz, M.; Weimer, W.; Polocoser, A. Concrete mixture with plastic as fine aggregate replacement. Int. J. Adv. Mech. Civ. Eng. 2015, 2, 49–53. [Google Scholar]
  28. Sáez del Bosque, I.; Zhu, W.; Howind, T.; Matías, A.; Sánchez De Rojas, M.; Medina, C. Properties of interfacial transition zones (ITZS) in concrete containing recycled mixed aggregate. Cem. Concr. Compos. 2017, 81, 25–34. [Google Scholar] [CrossRef]
  29. Hannawi, K.; Prince, W.; Bernard, S. Effect of thermoplastic aggregates incorporation on physical, mechanical and transfer behavior of cementitious materials. Waste Biomass Valor. 2010, 1, 251–259. [Google Scholar] [CrossRef]
  30. Quiroga, P.; Fowler, D. The Effects of Aggregates Characteristics on the Performance of Portland Cement Concrete; Research Report ICAR 104-1F; Aggregates Foundation for Technology, Research, and Education National Sand, Stone, and Gravel Association: Alexandria, VA, USA, 2003. [Google Scholar]
  31. Li, X.; Ling, T.; Mo, K. Functions and Impacts of Plastic/Rubber Wastes as Eco-Friendly Aggregate in Concrete—A Review. Constr. Build. Mater. 2020, 240, 117869. [Google Scholar] [CrossRef]
  32. ASTM-C128-17; Standard Test Method for Relative Density (Specific Gravity) and Absorption of Fine Aggregate. ASTM International: West Conshohocken, PA, USA, 2021.
  33. ASTM-C136-17; Standard Test Method for Sieve Analysis of Fine and Coarse Aggregates. ASTM International: West Conshohocken, PA, USA, 2021.
  34. Akay, M. Introduction to Polymer Science and Technology, 1st ed.; Ventus Publishing: Eire, CO, USA, 2015; ISBN 978-87-403-0087-1. [Google Scholar]
  35. Guerra, E.; Lima, E. Handbook of Polymer Synthesis, Characterization, and Processing, 1st ed.; John Wiley & Sons, Ltd.: Hoboken, NJ, USA, 2013; ISBN 978-04-706-3032-7. [Google Scholar]
  36. van Krevelen, D.W.; te Nijenhuis, K. Properties of Polymers, 4th ed.; Linacre House: Oxford, UK, 2009; ISBN 978-0-08-054819-7. [Google Scholar]
  37. Gesoglu, M.; Guneyisi, E.; Nansu, O.; Etli, S.; Alhassan, M. Mechanical and fracture characteristics of self-compacting concretes containing different percentages of plastic waste powder. Constr. Build. Mater. 2017, 140, 562–569. [Google Scholar] [CrossRef]
  38. Khan, M.; Huat, H.; Dun, M.; Sutanto, M.; Jarghouyeh, E.; Zoorob, S. Effect of irradiated and non-irradiated waste PET based cementitious grouts on flexural strength of semi-flexible pavement. Materials 2019, 12, 4133. [Google Scholar] [CrossRef] [PubMed]
  39. ASTM-C1437-17; Standard Test Method for Flow of Hydraulic Cement Mortar. ASTM International: West Conshohocken, PA, USA, 2021.
  40. ASTM-C109-17; Standard Test Method for Compressive Strength of Hydraulic Cement Mortars (Using 2-in. or [50-mm] Cube Specimens. ASTM International: West Conshohocken, PA, USA, 2021.
  41. ASTM-C39-17; Standard Test Method for Compressive Strength of Cylindrical Concrete Specimens. ASTM International: West Conshohocken, PA, USA, 2021.
  42. ASTM-C348-17; Standard Test Method for Flexural Strength of Hydraulic-Cement Mortars. ASTM International: West Conshohocken, PA, USA, 2021.
  43. Pierre, F.; Philibert, A.; Giroux, B.; Rivard, P. Concrete quality designation based on ultrasonic pulse velocity. Constr. Build. Mater. 2016, 125, 1022–1027. [Google Scholar] [CrossRef]
  44. ASTM-597-17; Standard Test Method for Pulse Velocity Through Concrete. ASTM International: West Conshohocken, PA, USA, 2017.
  45. Abduallah, R.M.A. Recycling Plastic Materials in Concrete Infrastructure. Ph.D. Thesis, Ohio State University, Columbus, OH, USA, 2021. [Google Scholar]
  46. Bentz, D.; Barrett, T.; Igor De la Varga, W.; Weiss, J. Relating compressive strength to heat release in mortars. Adv. Civ. Eng. Mater. 2012, 1, 20120002. [Google Scholar] [CrossRef]
  47. Ge, Z.; Wang, K.; Sandberg, P.; Ruiz, J. Characterization and performance prediction of cement-based materials using a simple isothermal calorimeter. J. Adv. Concr. Technol. 2009, 7, 355–366. [Google Scholar] [CrossRef]
  48. Zhiping, L.; Dagang, L.; Xiaojian, G. Analysis of correlation between hydration heat release and compressive strength for blended cement pastes. Constr. Build. Mater. 2020, 260, 120436. [Google Scholar]
  49. Sule, J.; Emmanuel, S.; Joseph, I.; Ibhadobe, O.; Buba, Y. Use of waste plastics in cement-based composite for lightweight concrete production. Int. J. Res. Eng. Technol. 2017, 2, 44–54. [Google Scholar]
  50. Dawood, A.; Al-khazrahi, H.; Falih, R. Physical and mechanical properties of concrete containing pet wastes as a partial replacement for fine aggregates. Case Stud. Constr. Mater. 2021, 14, e00482. [Google Scholar] [CrossRef]
  51. Vakkar, V.; Gupta, R.; Kumar, N. Study on partial replacement of pulverized plastic as fine aggregate in rigid pavements. Int. Res. J. Eng. Technol. 2019, 6, 56–72. [Google Scholar]
  52. Albano, C.; Camacho, N.; Hernandez, M.; Matheus, A.; Gutierrez, A. Influence of content and particle size of waste PET bottles on concrete behavior at different w/c ratios. Waste Manag. 2009, 29, 2707–2716. [Google Scholar] [CrossRef]
  53. Ozbakkaloglu, T.; Gu, L.; Gholampour, A. Short-term mechanical properties of concrete containing recycled polypropylene coarse aggregates under ambient and elevated temperature. J. Mater. Civ. Eng. 2017, 29, 04017191. [Google Scholar] [CrossRef]
  54. Zvonaric, M.; Barisic, I.; Galic, M.; Minazek, K. Influence of laboratory compaction method on compaction and strength characteristics of unbound and cement-bound mixtures. Appl. Sci. 2021, 11, 4750. [Google Scholar] [CrossRef]
  55. Budhu, M. Soil Mechanics Fundamental, 1st ed.; John Wiley & Sons, Ltd.: Hoboken, NJ, USA, 2015; ISBN 978-0-470-57795-0. [Google Scholar]
  56. Tesinova, P. Advances in Composite Materials: Analysis of Natural and Man-Made Materials; Intechopen: London, UK, 2011; ISBN 978-9-533-07449-8. [Google Scholar]
  57. Vergara, L.; Miralles, R.; Gosálbez, J.; Juanes, F.J.; Ullate, L.G.; Anaya, J.J.; Izquierdo, M.A.G. NDE ultrasonic methods to characterise the porosity of mortar. NDT E Int. 2001, 34, 557–562. [Google Scholar] [CrossRef]
  58. Lafhaj, Z.; Goueygou, M.; Djerbi, A.; Kaczmarek, M. Correlation between porosity, permeability and ultrasonic parameters of mortar with variable water/cement ratio and water content. Cem. Concr. Res. 2006, 36, 625–633. [Google Scholar] [CrossRef]
  59. Tayeh, B.A.; Almeshal, I.; Magbool, H.M.; Alabduljabbar, H.; Alyousef, R. Performance of sustainable concrete containing different types of recycled plastic. J. Clean. Prod. 2021, 328, 129517. [Google Scholar] [CrossRef]
  60. Mohammed, A.A. Compressive strength-ultrasonic pulse velocity relationship of concrete containing plastic waste. In Proceedings of the 3rd International Conference on Recent Innovations in Engineering (ICRIE 2020), Duhok, Iraq, 9–10 September 2020; p. 012010. [Google Scholar]
  61. Alfahdawi, I.H.; Osman, S.A.; Hamid, R.; Al-Hadithi, A.I. Modulus of elasticity and ultrasonic pulse velocity of concrete containing polyethylene terephthalate (PET) waste heated to high temperature. J. Eng. Sci. Technol. 2018, 13, 3577–3592. [Google Scholar]
  62. Demirboga, R.; Türkmen, İ.; Karakoc, M.B. Relationship between ultrasonic velocity and compressive strength for high-volume mineral-admixtured concrete. Cem. Concr. Res. 2004, 34, 2329–2336. [Google Scholar] [CrossRef]
Figure 1. Minimum (Min) and maximum (Max) tensile (T) and compressive (C) strength of plastics.
Constrmater 05 00039 g001
Figure 2. Minimum (Min) and maximum (Max) tensile (Et) and compressive (Ec) modulus of elasticity of plastics.
Constrmater 05 00039 g002
Figure 3. Morphology of plastic particles used as PFA (ruler shows ½ mm segments).
Constrmater 05 00039 g003
Figure 4. Size distribution of different plastic powders.
Constrmater 05 00039 g004
Figure 5. Heat flow of cement paste containing 5% plastic powder as cement replacement.
Constrmater 05 00039 g005
Figure 6. Cumulative heat flow of cement paste containing 5% plastic powder as cement replacement.
Constrmater 05 00039 g006
Figure 7. Flowability of mortars containing different RRs of PFAs shown relative to the control mix.
Constrmater 05 00039 g007
Figure 8. Experimental dry density of mortars containing different RRs of PFAs.
Constrmater 05 00039 g008
Figure 9. Compressive strength of mortars containing different RRs of plastic aggregates versus control specimen: (a) 5% RR, (b) 10% RR, and (c) 15% RR.
Constrmater 05 00039 g009
Figure 10. Flexural strength of mortars containing different RRs of plastic aggregates versus control specimen: (a) 5% RR, (b) 10% RR, and (c) 15% RR.
Constrmater 05 00039 g010
Figure 11. UPV of mortars containing different RRs of different PFAs.
Constrmater 05 00039 g011
Figure 12. Relationships between measured and theoretical densities of mortars containing different RRs of different PFAs.
Constrmater 05 00039 g012
Figure 13. Relationship between the compressive strength and the UPV of mortars containing different types of PFAs.
Constrmater 05 00039 g013
Table 1. Physical properties of natural and plastic particles.
MaterialSpecific Gravity (SG)Fineness Modulus (FM)Water Absorption (%)
Sand2.65-0.81
PET1.303.200.10
HDPE0.723.200.00
PVC1.373.200.03
LDPE0.803.200.01
PP0.763.200.00
PS0.903.200.02
Table 2. Mortar mix proportions.
Mixw/cWater
(kg/m3)
Volume Replacement Ratio, RRCement
(kg/m3)
Aggregates
(kg/m3)
SandPlastic
C0.4852540%52514420
PET0.4852545%525137035
10%525129871
15%5251226106
HDPE0.4852545%525137020
10%525129839
15%525122659
PVC0.4852545%525137037
10%525129875
15%5251226112
LDPE0.4852545%525137022
10%525129843
15%525122664
PP0.4852545%525137021
10%525129842
15%525122662
PS0.4852545%525137024
10%525129849
15%525122673
Table 3. Comparison between theoretical and experimental dry density values.
Mortar Density (kg/m3)
RRCementPETHDPEPVCLDPEPPPS
0%Theoretical221022102210221022102210
Experimental222022202220222022202220
Difference0.5%0.5%0.5%0.5%0.5%0.5%
Air Content3.5%3.5%3.5%3.5%3.5%3.5%
5%Theoretical217421582176216021582163
Experimental216021682160212721882203
Difference−0.6%0.5%−0.7%−1.6%1.4%1.8%
Air Content4.6%3.5%4.7%5.5%2.6%2.2%
10%Theoretical213721062141211021082116
Experimental212121492139207621292138
Difference−0.8%2.0%−0.1%−1.6%1.0%1.1%
Air Content4.7%2.0%4.0%5.5%3.0%3.0%
15%Theoretical210020532106206320572068
Experimental206120992074205120812124
Difference−1.9%2.2%−1.6%−0.6%1.1%2.7%
Air Content5.75%1.8%5.5%4.5%2.8%1.4%
Table 4. Compressive and flexural strength values and changes in mortars containing different RRs of plastic aggregates compared to the control specimen at 28 days.
MixRRCompressive StrengthFlexural StrengthK
Value (MPa)Change %Value (MPa)Change %
C0%39.2 ± 1.84.41 ± 0.1111%
PET5%35.1 ± 1.2−103.46 ± 0.42−2110%
10%29.3 ± 0.6−252.91 ± 0.08−3410%
15%24.9 ± 1.6−371.85 ± 0.01−588%
HDPE5%37.7 ± 1.0−43.50 ± 0.14−209%
10%34.5 ± 2.4−123.30 ± 0.05−2510%
15%33.5 ± 0.8−153.32 ± 0.05−2610%
PVC5%35.7 ± 0.8−94.54 ± 0.31313%
10%37.8 ± 1.7−44.01 ± 0.12−911%
15%32.6 ± 2.1−173.26 ± 0.13−2610%
LDPE5%31.9 ± 1.3−194.03 ± 0.54−1113%
10%27.6 ± 0.1−303.29 ± 0.24−2512%
15%25.9 ± 0.9−342.75 ± 0.07−3711%
PP5%36.7 ± 2.6−73.96 ± 0.12−1011%
10%34.6 ± 2.2−123.33 ± 0.47−2210%
15%27.4 ± 0.8−302.95 ± 0.02−3311%
PS5%36.6 ± 1.0−74.43 ± 0.08012%
10%38.2 ± 1.8−33.87 ± 0.08−1210%
15%34.7 ± 1.4−113.41 ± 0.21−2310%
(−) indicates a reduction, RR is the replacement ratio, and K is the flexural strength to compressive strength ratio.
Table 5. UPV change of 28-day mortars containing different RRs of different PFAs compared to the control mortar.
RRUPV Change by Mortar Type (%)
PETHDPEPVCLDPEPPPS
5%−3.51.2−2.5−0.70.6−0.8
10%−3.8−1.8−1.7−2.4−2.3−1.2
15%−9.4−5.3−5.7−6.0−5.8−5.0
The negative sign (−) indicates a reduction and RR is the replacement ratio.
Disclaimer/Publisher’s Note: The statements, opinions and data contained in all publications are solely those of the individual author(s) and contributor(s) and not of MDPI and/or the editor(s). MDPI and/or the editor(s) disclaim responsibility for any injury to people or property resulting from any ideas, methods, instructions or products referred to in the content.

