Article

Models for the Analysis of the Structural Capacity of Railway Bridges in Peru in Accordance with the American Railway Engineering and Maintenance-of-Way Association Standard

Universidad Nacional Federico Villarreal, Escuela Universitaria de Postgrado EUPG, Lima 15001, Peru
*
Author to whom correspondence should be addressed.
Constr. Mater. 2025, 5(2), 38; https://doi.org/10.3390/constrmater5020038
Submission received: 3 March 2025 / Revised: 7 April 2025 / Accepted: 14 April 2025 / Published: 3 June 2025

Abstract

This scientific research presents the most significant aspects of the structural analysis and verification of the main steel railway bridges in Peru in accordance with the American standard. To this end, linear and finite element analyses (FEMs) were performed using calculation notes in MATHCAD and structural validation software (SAP2000, CSI Bridge, IDEA STATICA and GE05), among others, based on on-site inspections, which allowed results to be obtained to analyze, evaluate and determine the structural performance factors (RF) of the main railway bridges in Peru. For this, data obtained from several railway corridors in Peru were taken into consideration, such as the lines of the Southern Railway Train, Central Andean Railway, Huancayo–Huancavelica Railway Train and the Tacna–Arica Train; in addition to the feasibility studies on the Interoceanic Train project: Iquitos–Yurimaguas; projects administered through Public–Private Partnership PPP as well as by the Regionals Government and MTC-Peru. These data were used in order to be able to warn of certain technical aspects that would influence the recommendations for a locomotive replacement project in which new units had different load distributions between the axles, which would make it necessary to review the tracks and bridges of the same in order to determine if they would be able to withstand the new forces safely, as well as to reinforce structural elements according to the material and the structural condition, and finally, to assess the variation in the increase in train speed in some road corridors to achieve a better FRA (Federal Railway Administration) classification of Class 3, where the presence of structures dating back to the last century has been verified as well (1851–1856–1908). Likewise, the seismic criteria and geotechnical conditions of the most representative areas of the country (acceleration 0.30 g) were included in order to also be able to make technical recommendations that would allow us to ensure the useful life of the structure in service, operation and maintenance conditions.

1. Introduction

The structural analysis and verification of railway bridges in the country are processes which are as complex or even more complex than the structural design processes themselves, to which more complexity is added due to the fact that these structures were constructed in the 19th century, and some even date back to 1851–1856, so we usually find ourselves in a scenario where we do not always have the necessary information to predict the behavior of these structures in the different railway projects carried out in Peru [1]. In addition, it is necessary to indicate that many of these structures have steel (iron) characteristics that are no longer used today, so for these cases, we consider it important to use a criterion that the American standard AREMA, edition (2023) [2] defines, which will be very useful when using these steels with yield values close to 250 Mpa (30 Ksi) in the absence of yield strength efforts for old steels, as per AREMA, edition (2023), 7.3.3.3 [2]. This allows us to evaluate and approximate the current structural conditions of both the materials, loads and the structural behavior to which they are currently being subjected [2]. See Figure 1 and Figure 2.
Adopting AREMA facilitates interoperability with foreign companies in private and public investment railway projects, in addition to attracting investors who rely on internationally recognized regulations. The American standard AREMA has been used in feasibility studies and in the execution of railway projects in Peru under Public–Private Partnership (PPP) schemes and in studies by the Ministry of Transport and Communications (MTC). Its implementation ensures quality and durability standards in new works and in the rehabilitation of existing structures. The adoption of the AREMA standard in Peru contributes to the safety, efficiency and sustainability of the railway system, aligning it with international standards and facilitating the development of key infrastructure for the country’s growth.
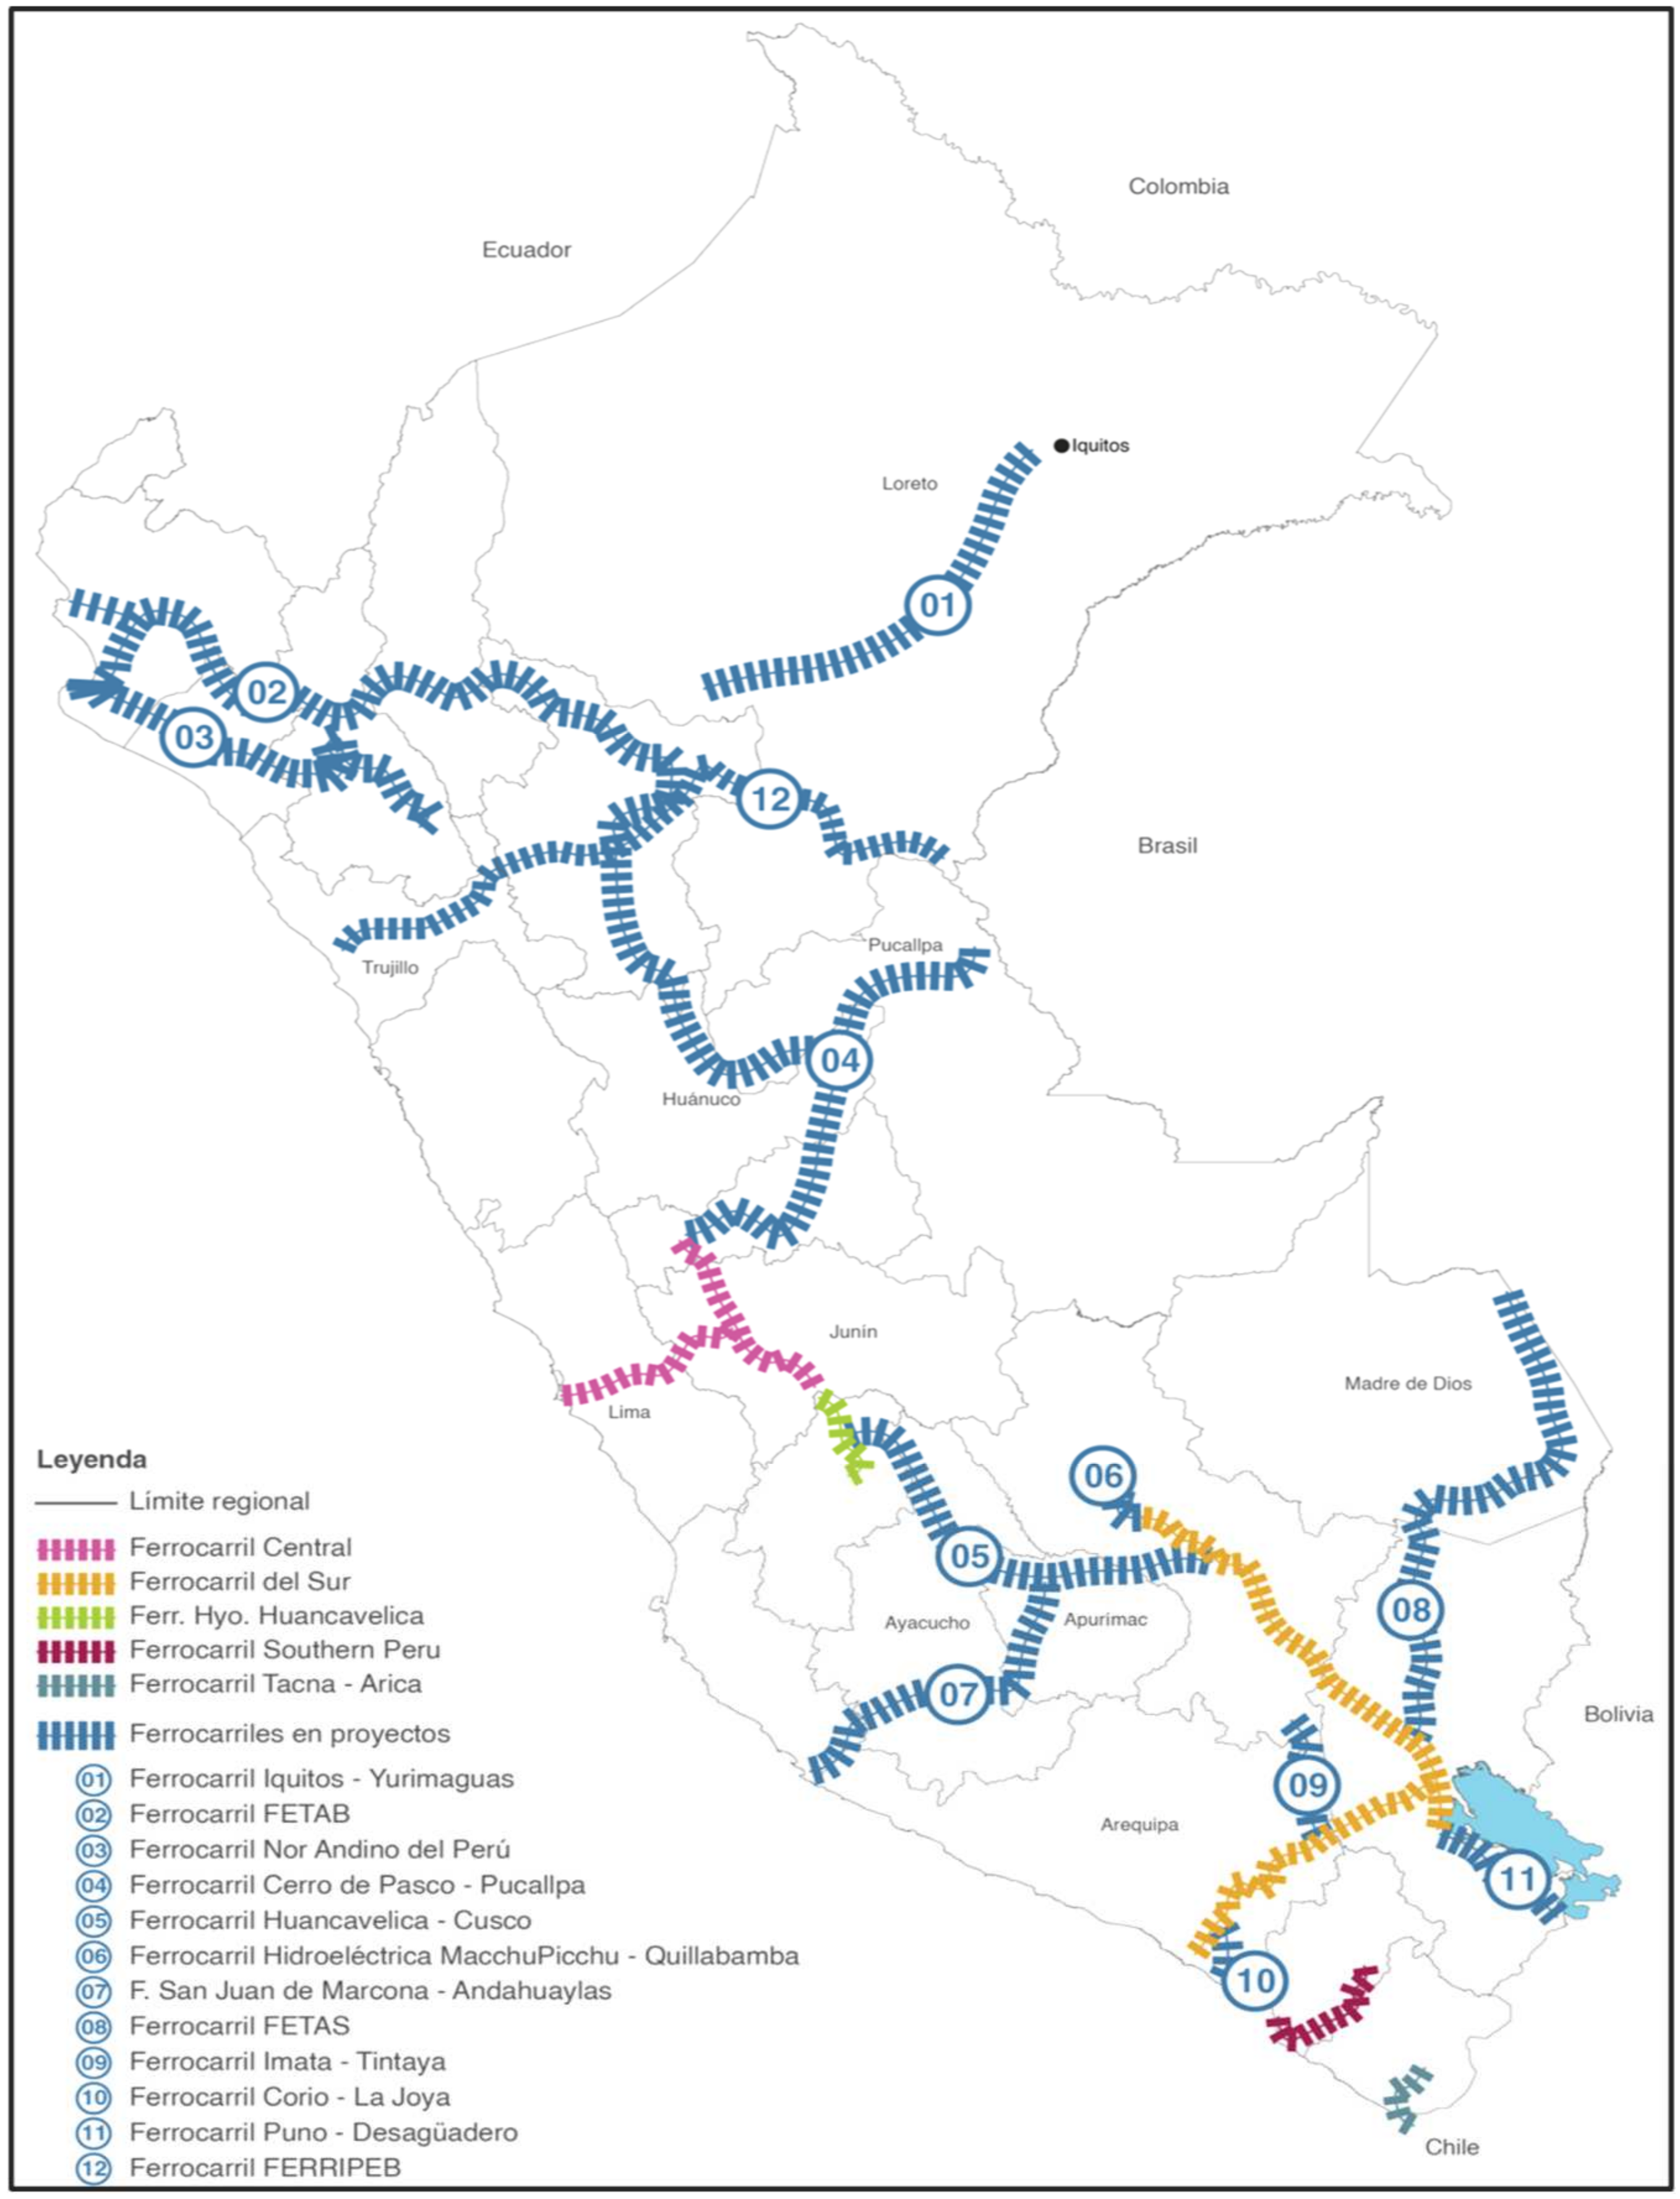
The expansion of the country’s current railway network includes the Lima–La Oroya–Cerro de Pasco railway corridors, the Huancayo Huancavelica Train, the Southern Railway Train and the Tacna–Arica International Train. Additionally, a definitive feasibility study focuses on the investment level of the Interoceanic Corridor: Iquitos–Yurimaguas has been considered and which forms part of the Loreto Regional Government in addition to the Lima Metro and the commuter trains to the south and north of the country’s capital as national project as well, as seen in Figure 3.
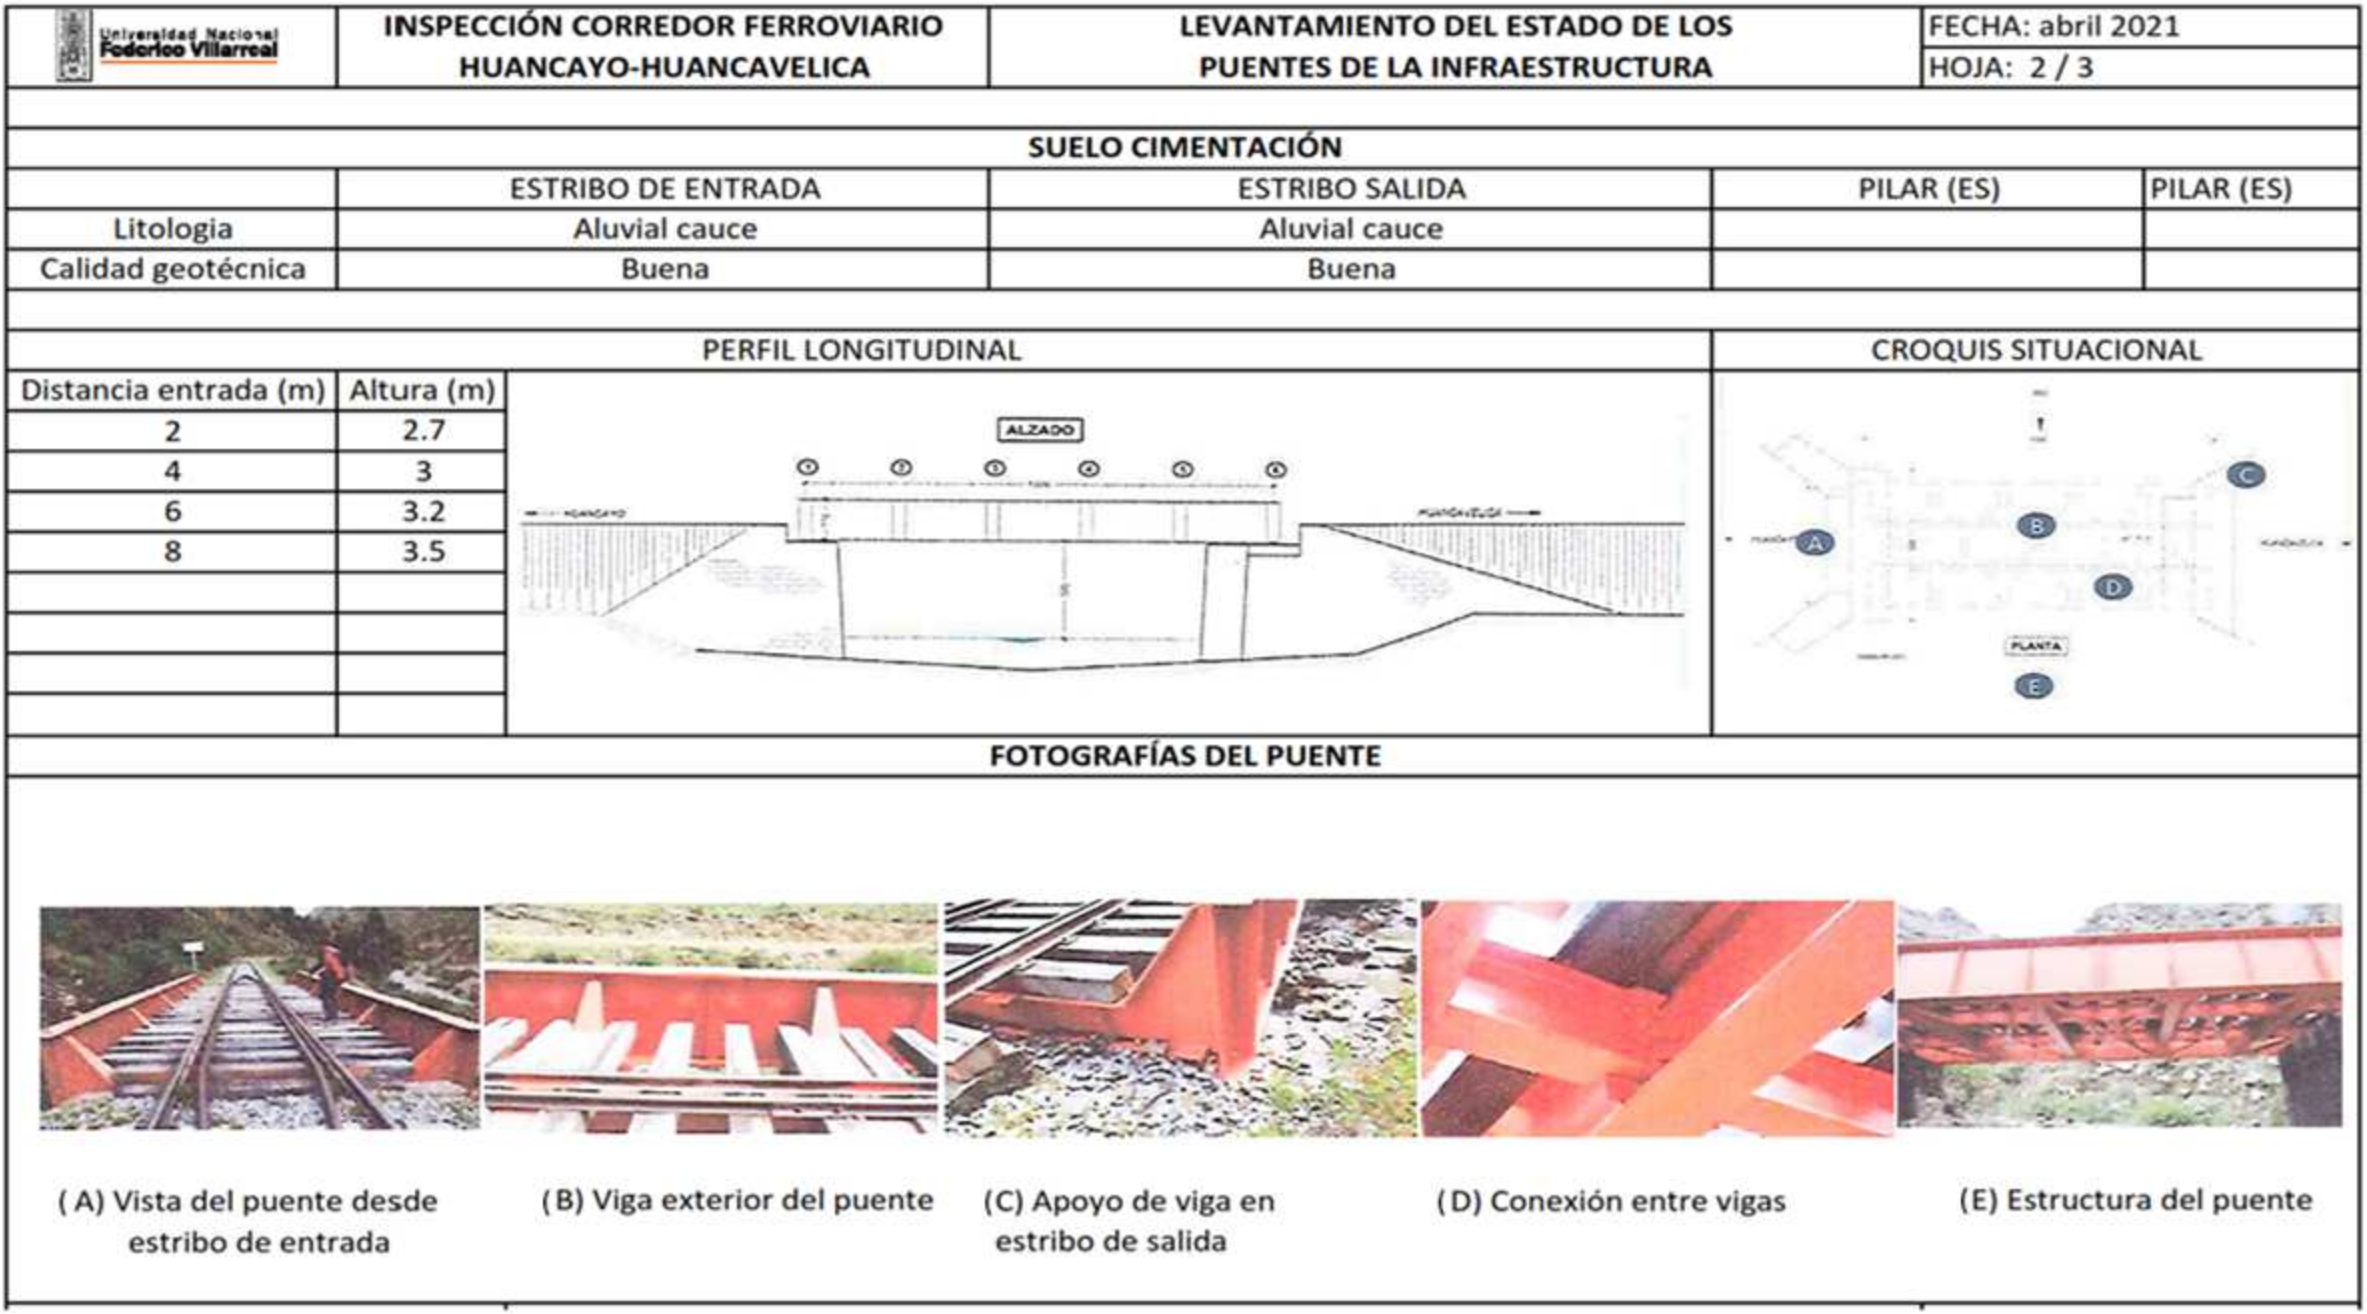
In this regard, we consider it quite important to obtain, before the structural verification of the most important structures, relevant data regarding the geometric characteristics, mechanical characteristics of the structural materials and situational status through on-site visits and the subsequent collection of relevant information, complemented by a survey of their current state as well as an inspection of the details of the reinforcements made according to the modifications in some of them over the last few years of the main railway structure of Perú [3].
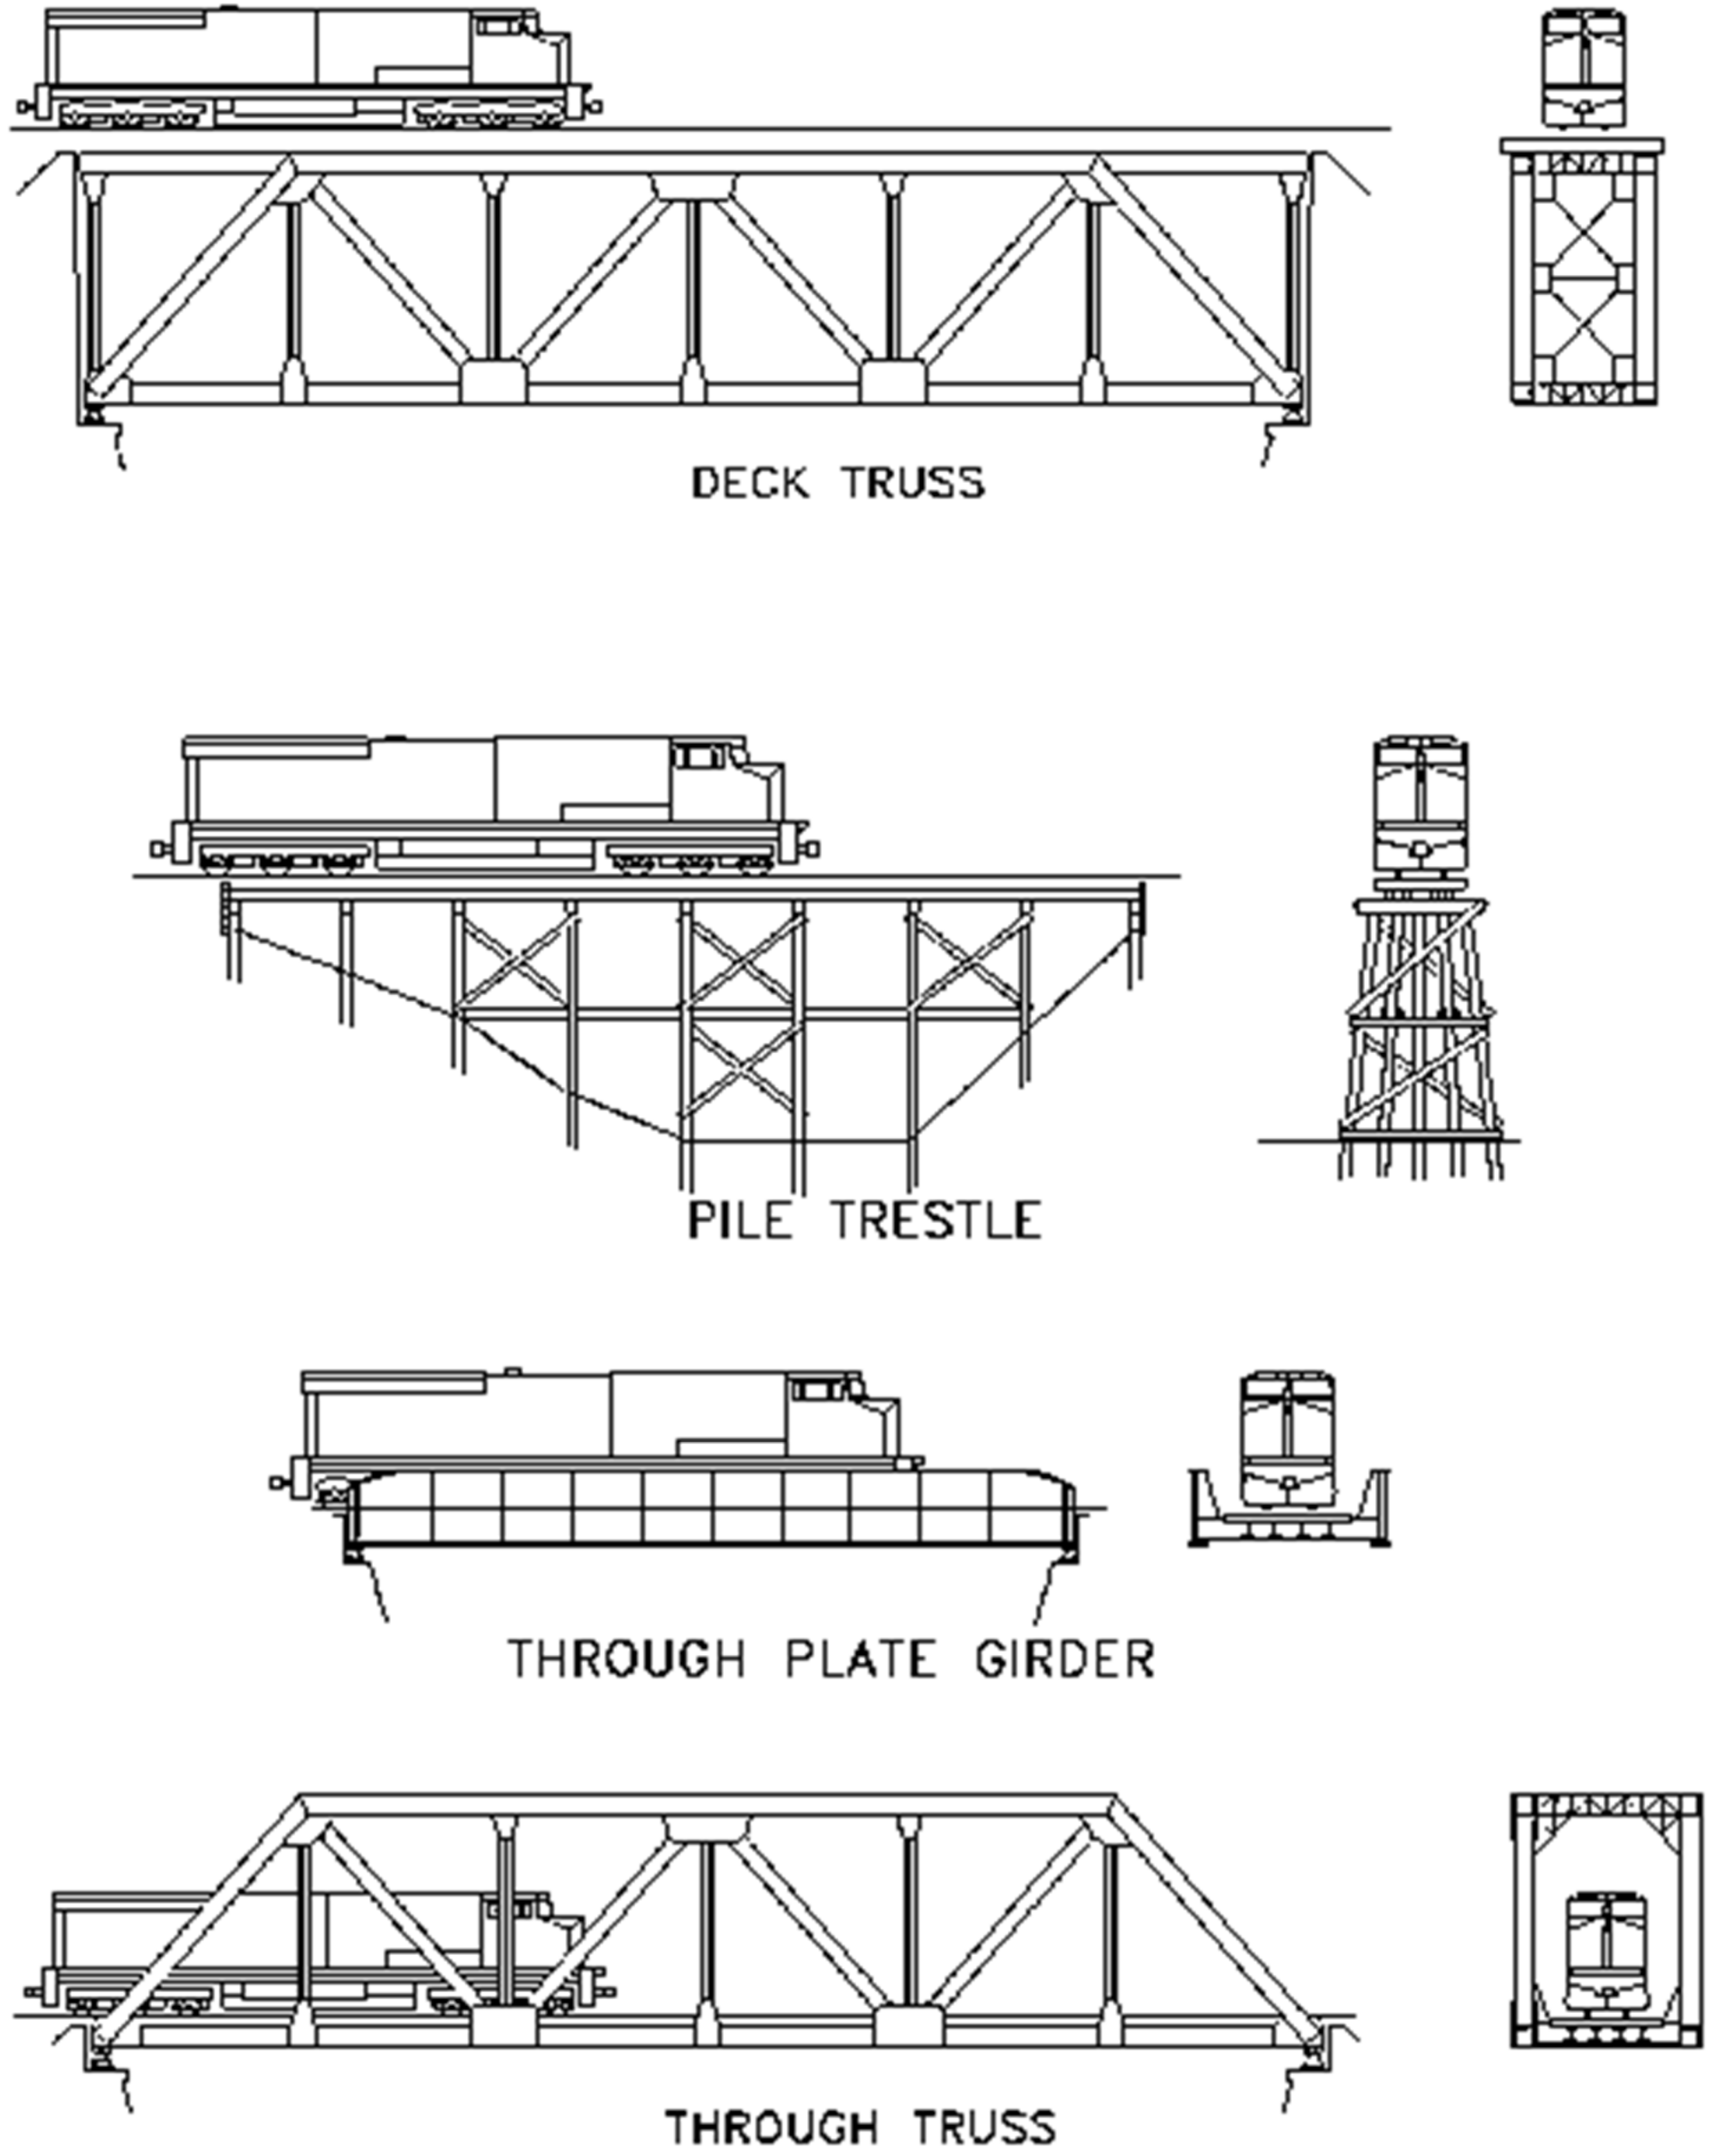
During the inspection of the steel railway bridges, in order to determine their bearing capacity before the static and dynamic analysis, it is possible to identify that most of the typical cross sections along the different railway corridors in Peru correspond to the following types of sections: TPG (through plate girder), DPG (deck plate girder), TTG (through truss girder) and DTG (deck truss girder) [4]. See Figure 4.
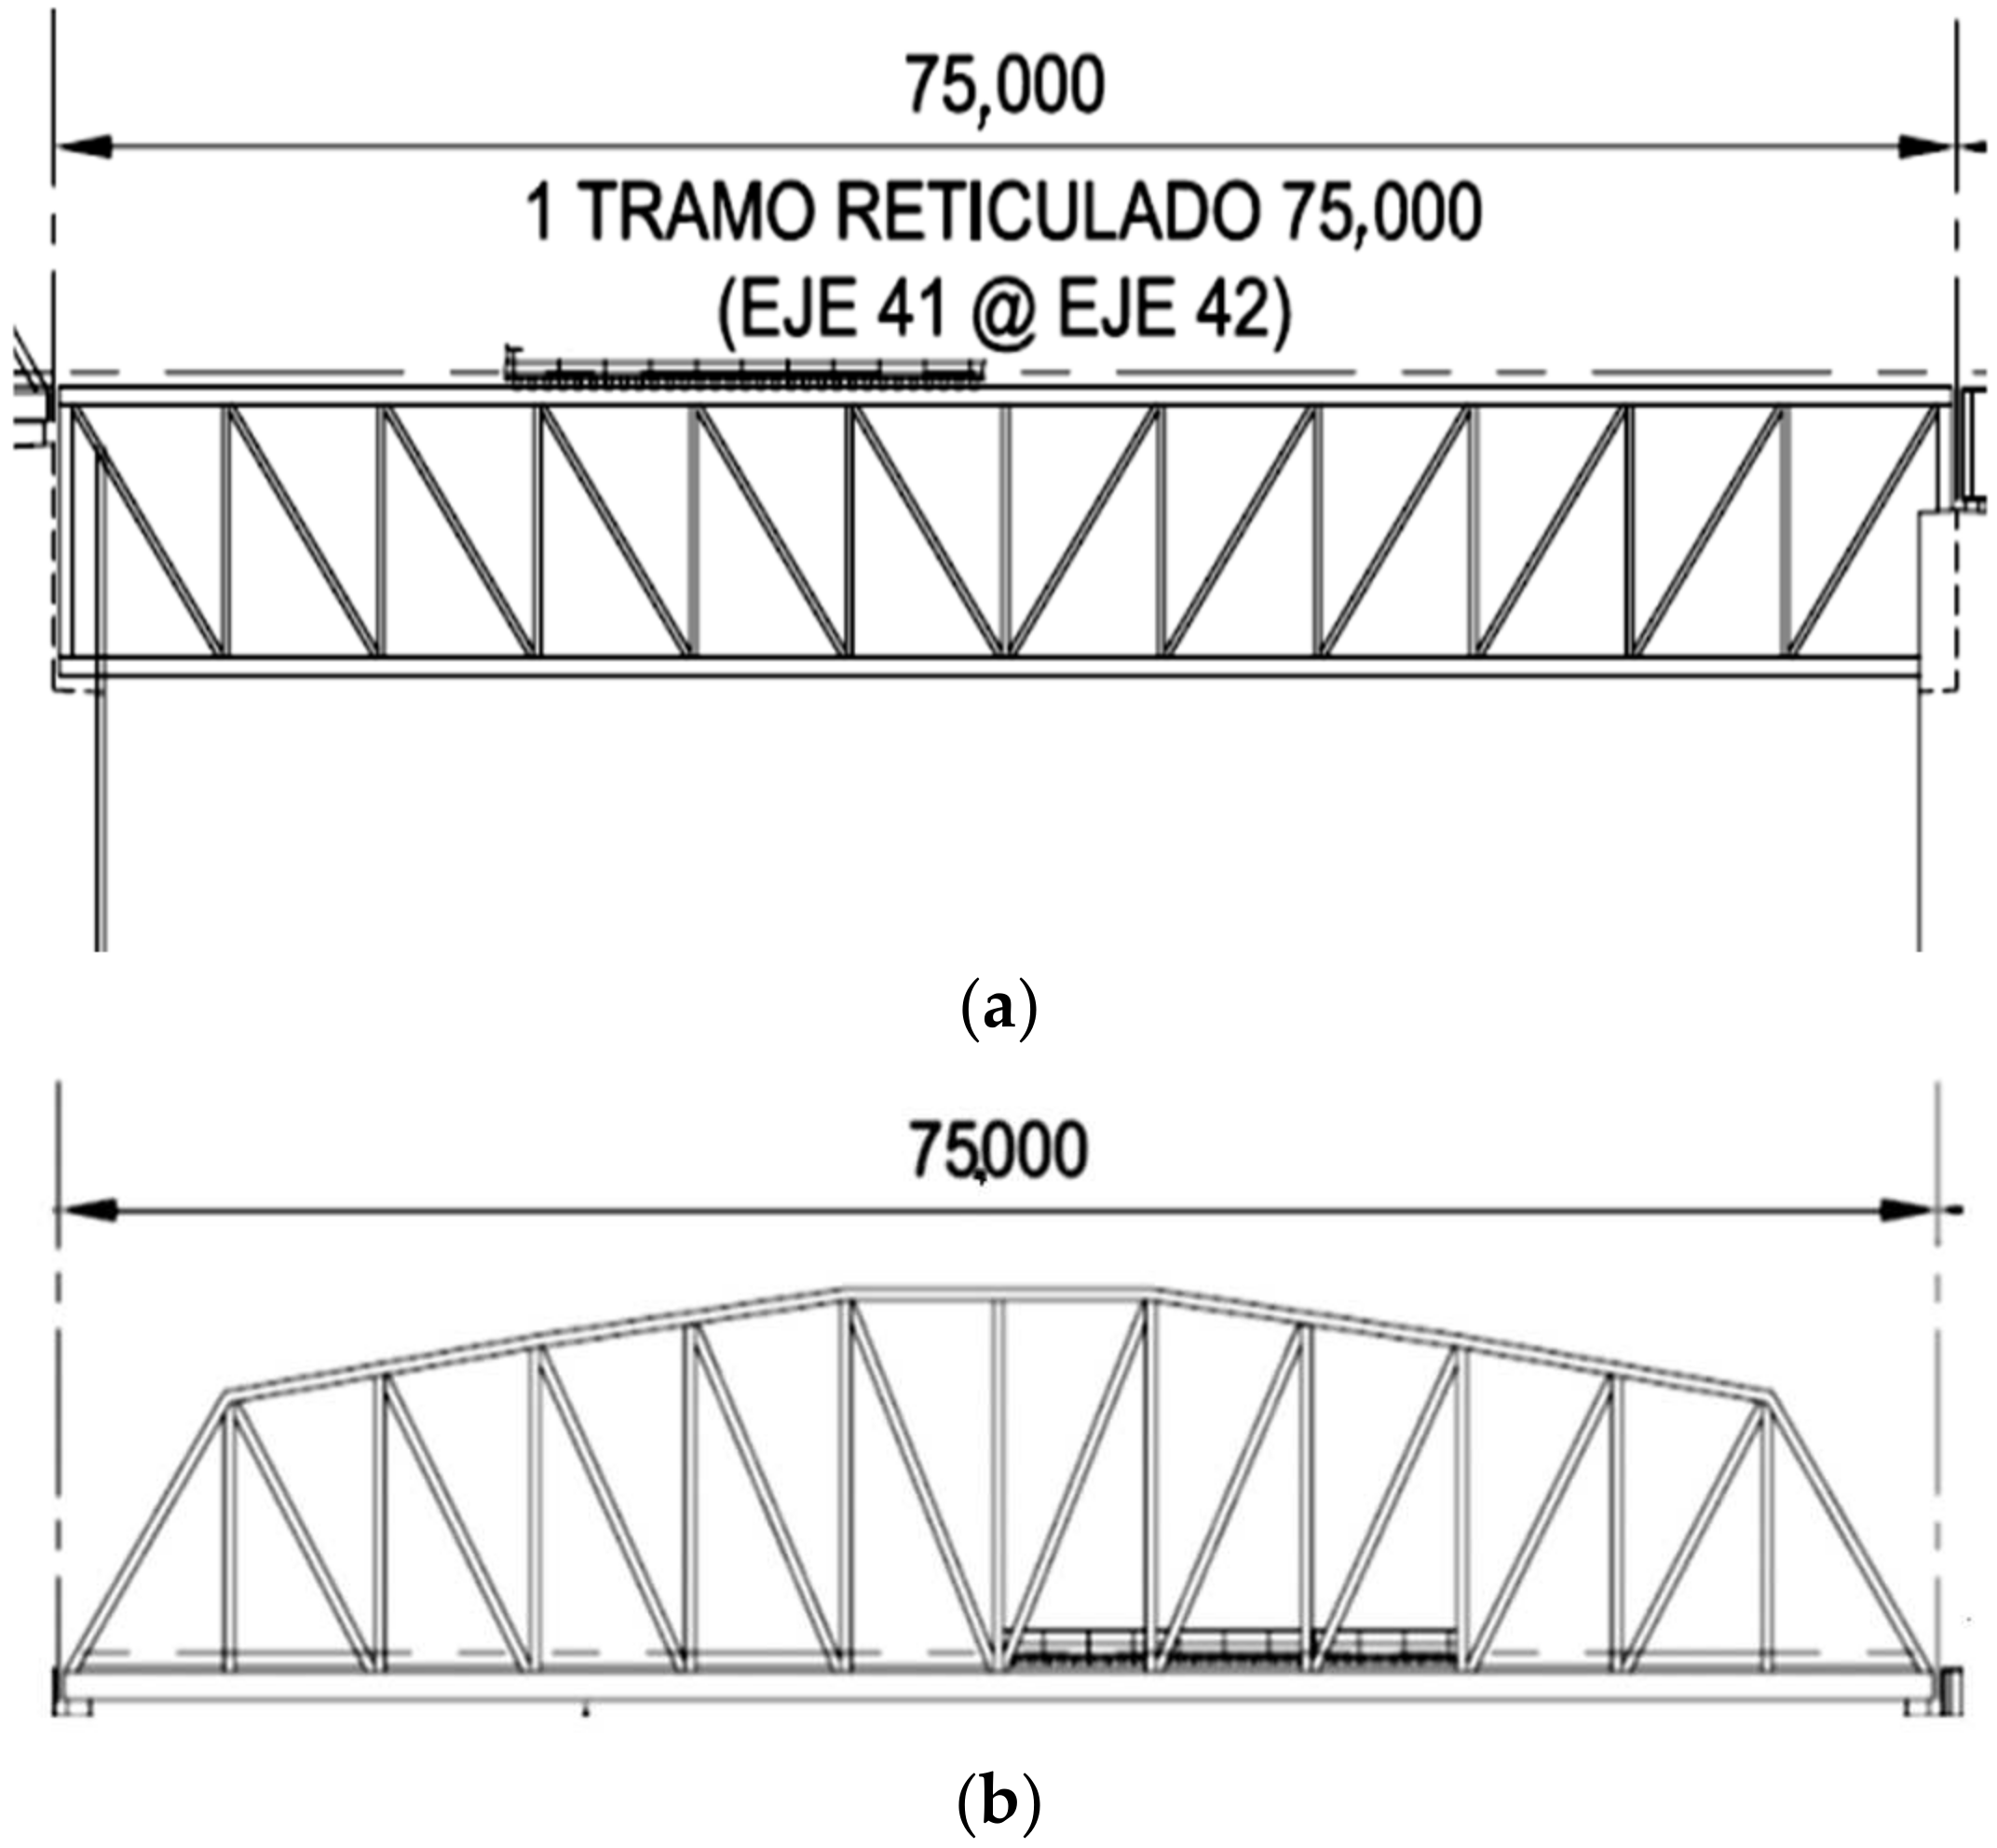
Continuing with the cross sections, the cross sections of the TPG, DPG, TTG and DTG types considered in the feasibility study of the Iquitos–Yurimaguas Interoceanic train that was evaluated by the GORE Loreto have also been considered [5]; such sections are indicated below: see Figure 5a,b.
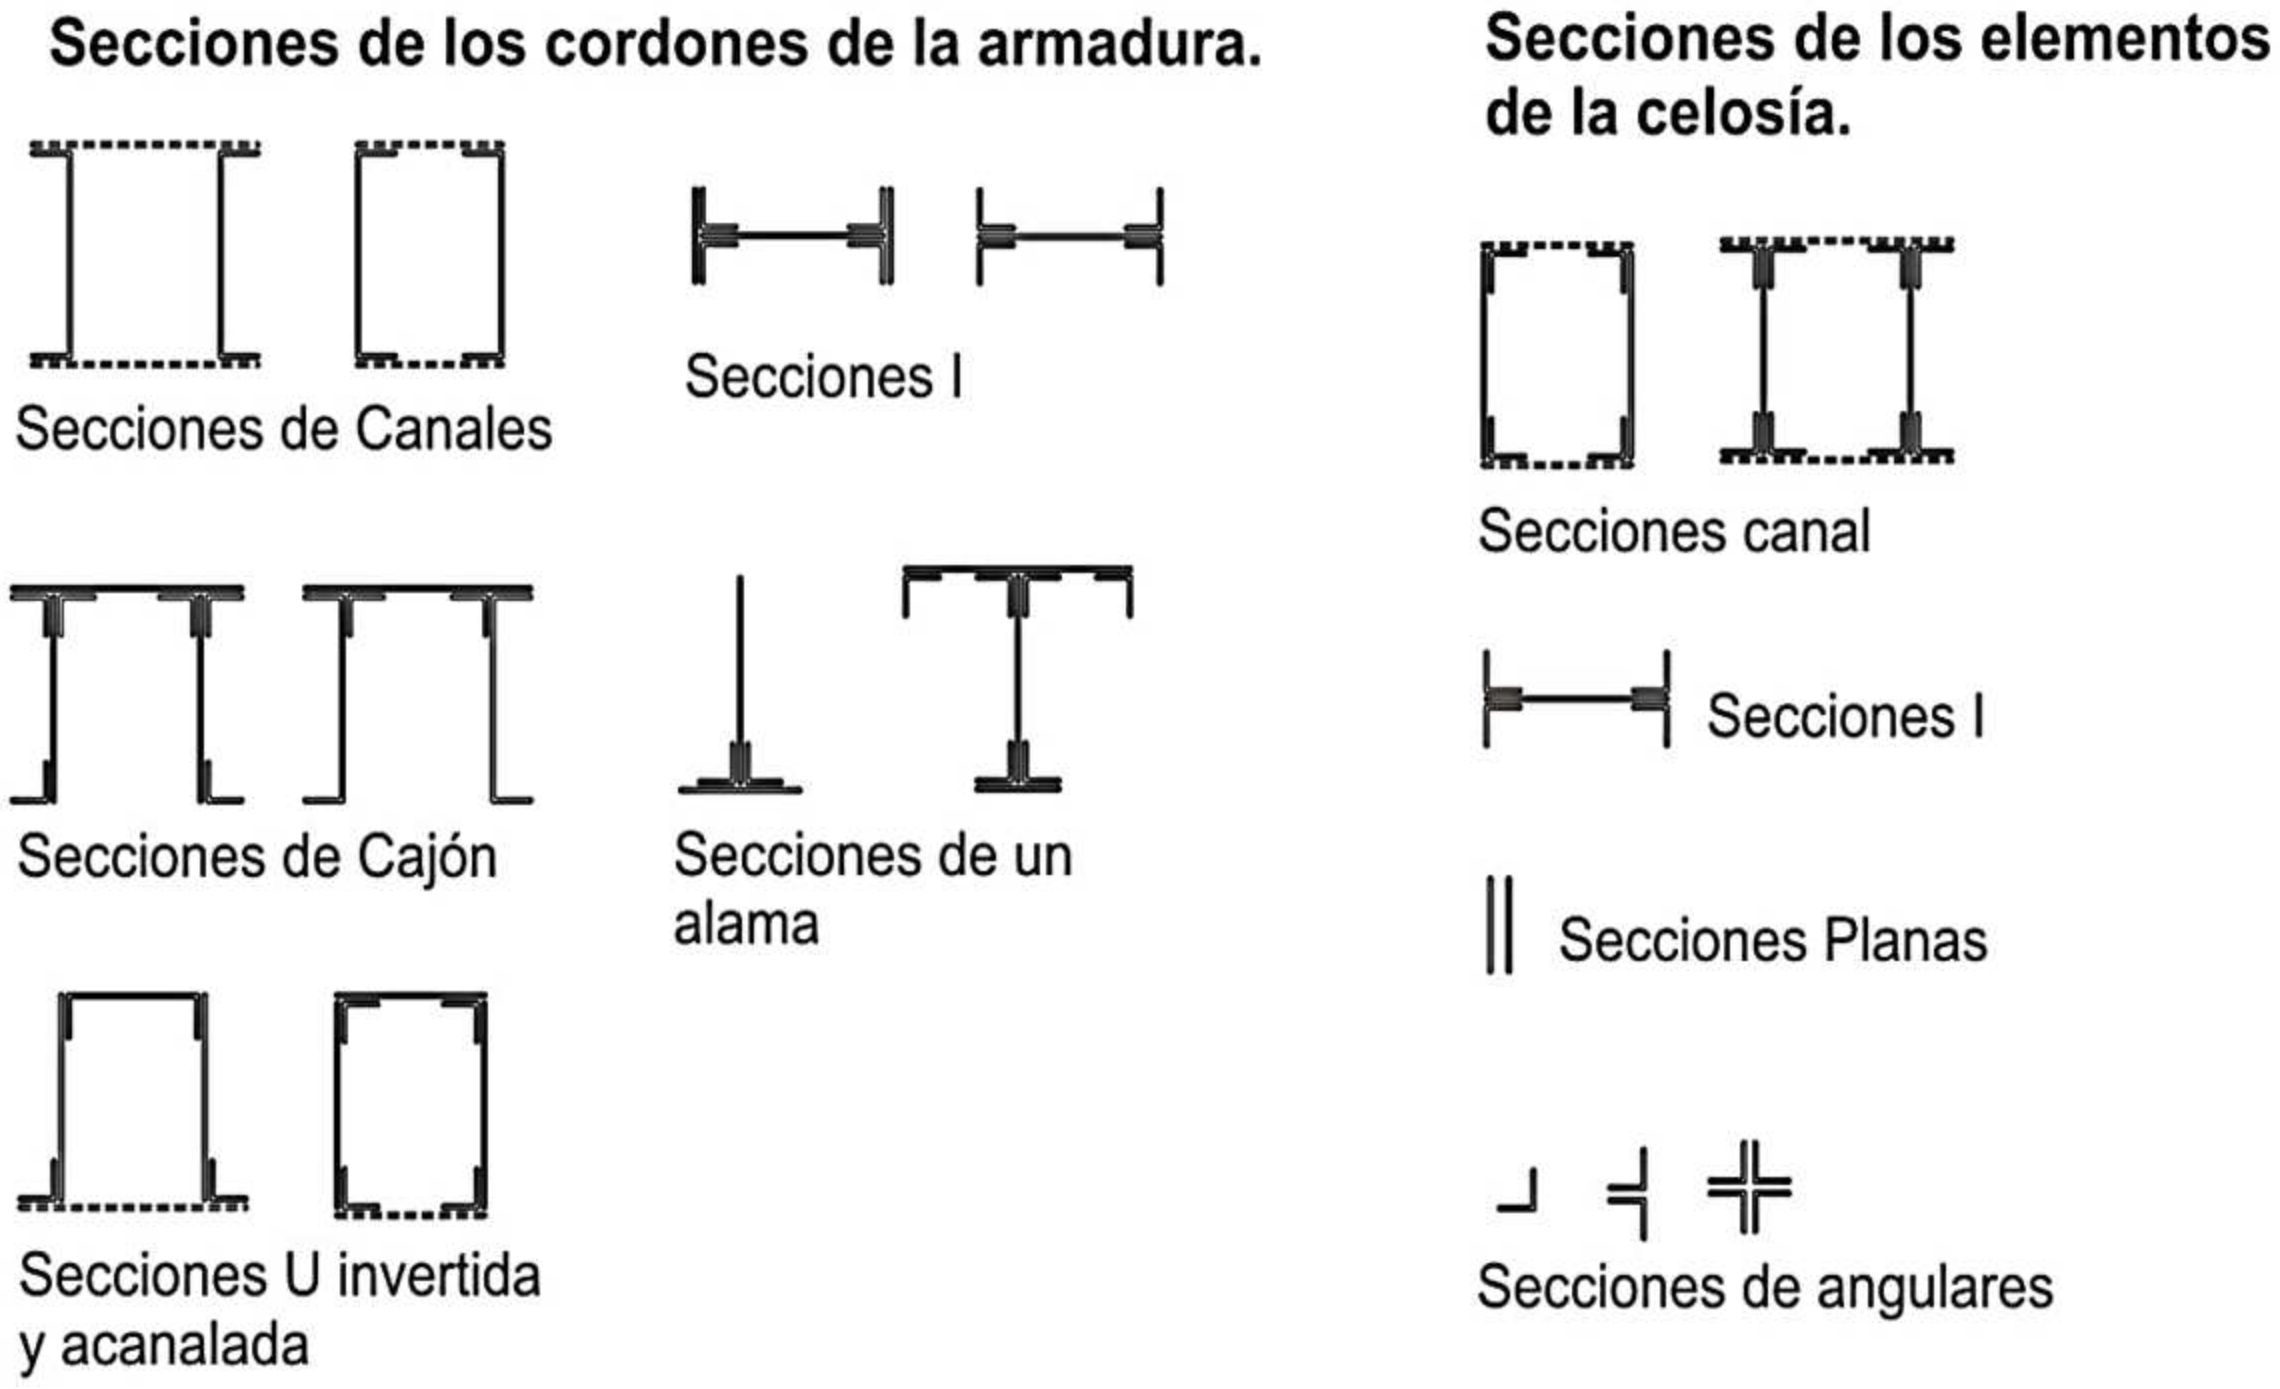
The two types of truss sections are illustrated in Figure 6a,b, as follows:
The design criteria according to AREMA (American Railway Engineering and Maintenance-of-Way Association), Chapter 15 [2], prescribes dimensioning based on an Allowable Limits Calculation (allowable stress design) for the elements of a steel structure, while for the elements of reinforced or prestressed concrete, the allowable stress calculation method or the Limit States Calculation method (Load and Strength Design—LRFD) could be used. Consequently, for railway structures, it has been proposed that the elements of steel structures should mainly be designed according to an allowable stress calculation, as prescribed by the AREMA standard, and mainly considering the type of cross section and the structures in these corridors, and that some concrete elements should be designed based on the Limit States Calculation method. This last method will allow the concrete works to have a better uniformity with the American AREMA standard [6,7]. See Figure 7.
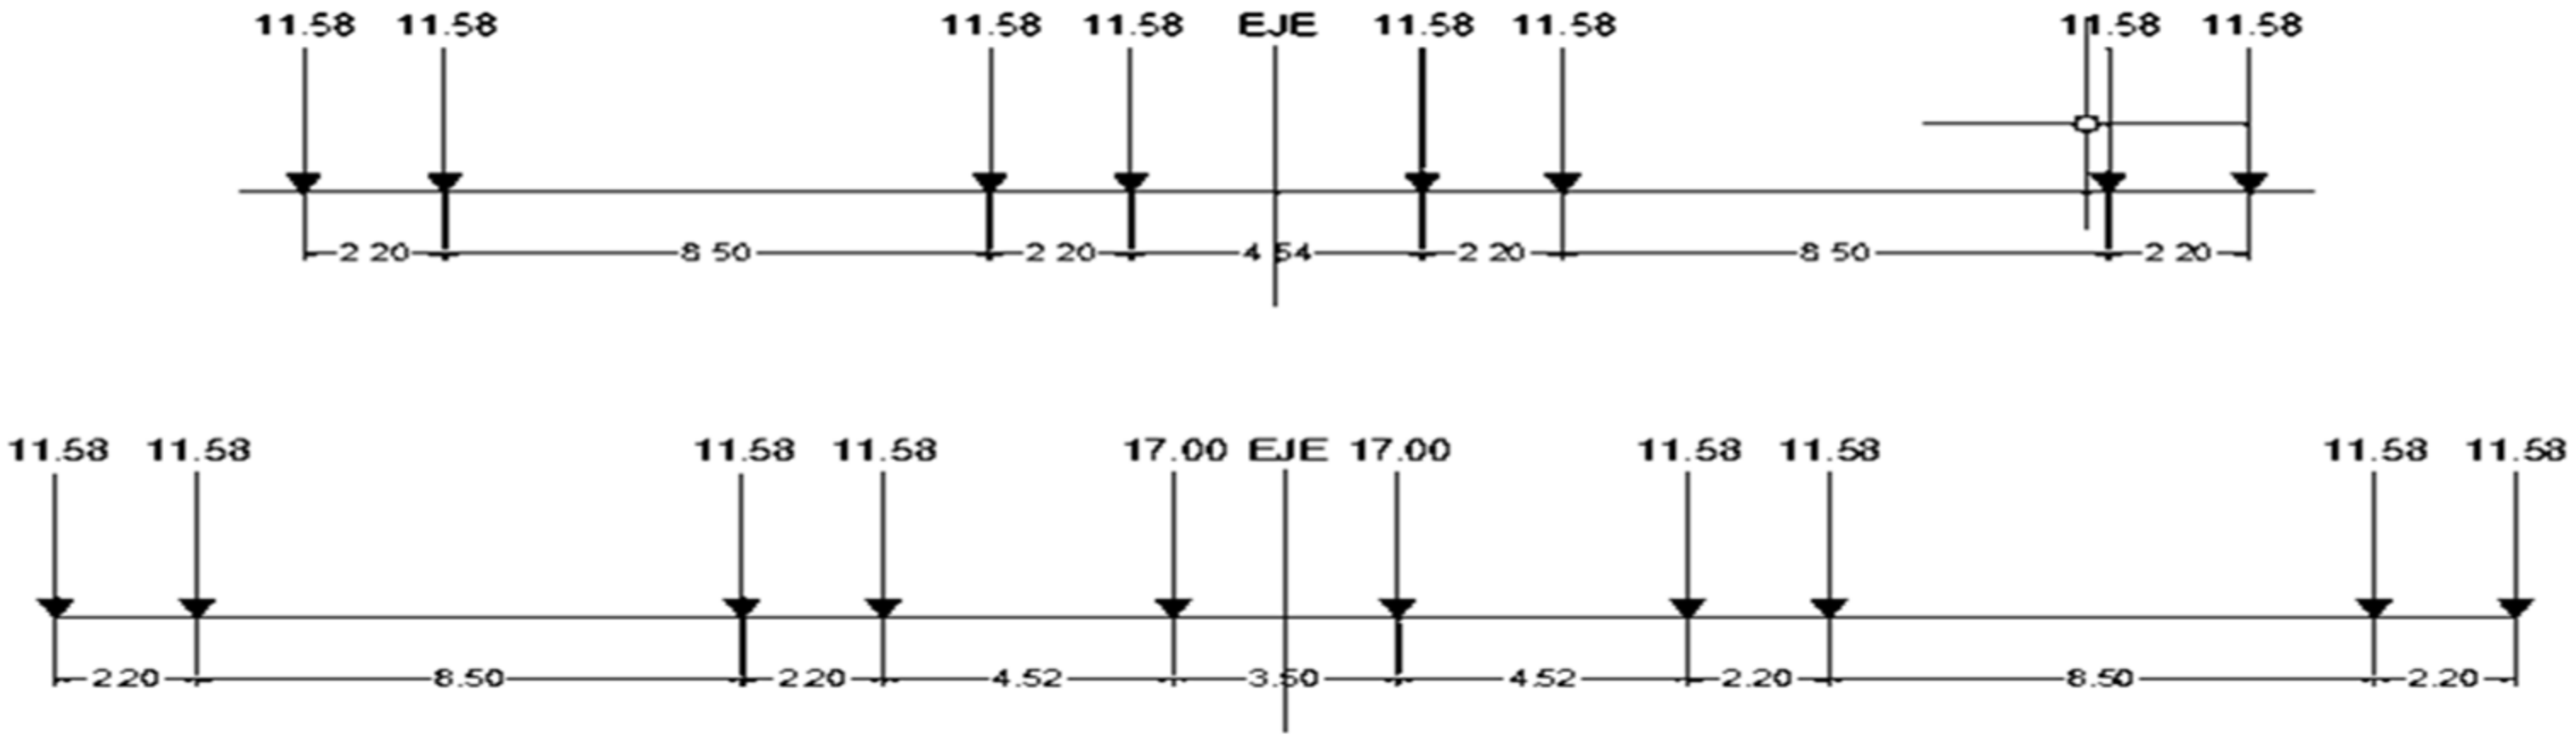
The American standard E-Cooper loads used for this analysis are E-40, E60, and E80, considering the distances and axle loads. See Figure 8.
As we can see, the challenges they present are their higher initial conditions, as well as their inspection and maintenance criteria, which are more complex due to the large number of details. See Table 1.
The reference to Chapters 8, 9, and 15 of AREMA [2] indicates the use of specific guidelines for the design of fundamental railway bridges to ensure compatibility with operational and safety standards in railway infrastructure. The holistic design approach, which includes standards for deflection, fatigue, and materials, shows an integral design philosophy aimed at balancing the strength, durability, and functionality of the structure [7].
Regarding safety factors, safety margins are incorporated in the design criteria to address uncertainties in loads, material properties, and environmental effects. See Table 2 and Table 3.
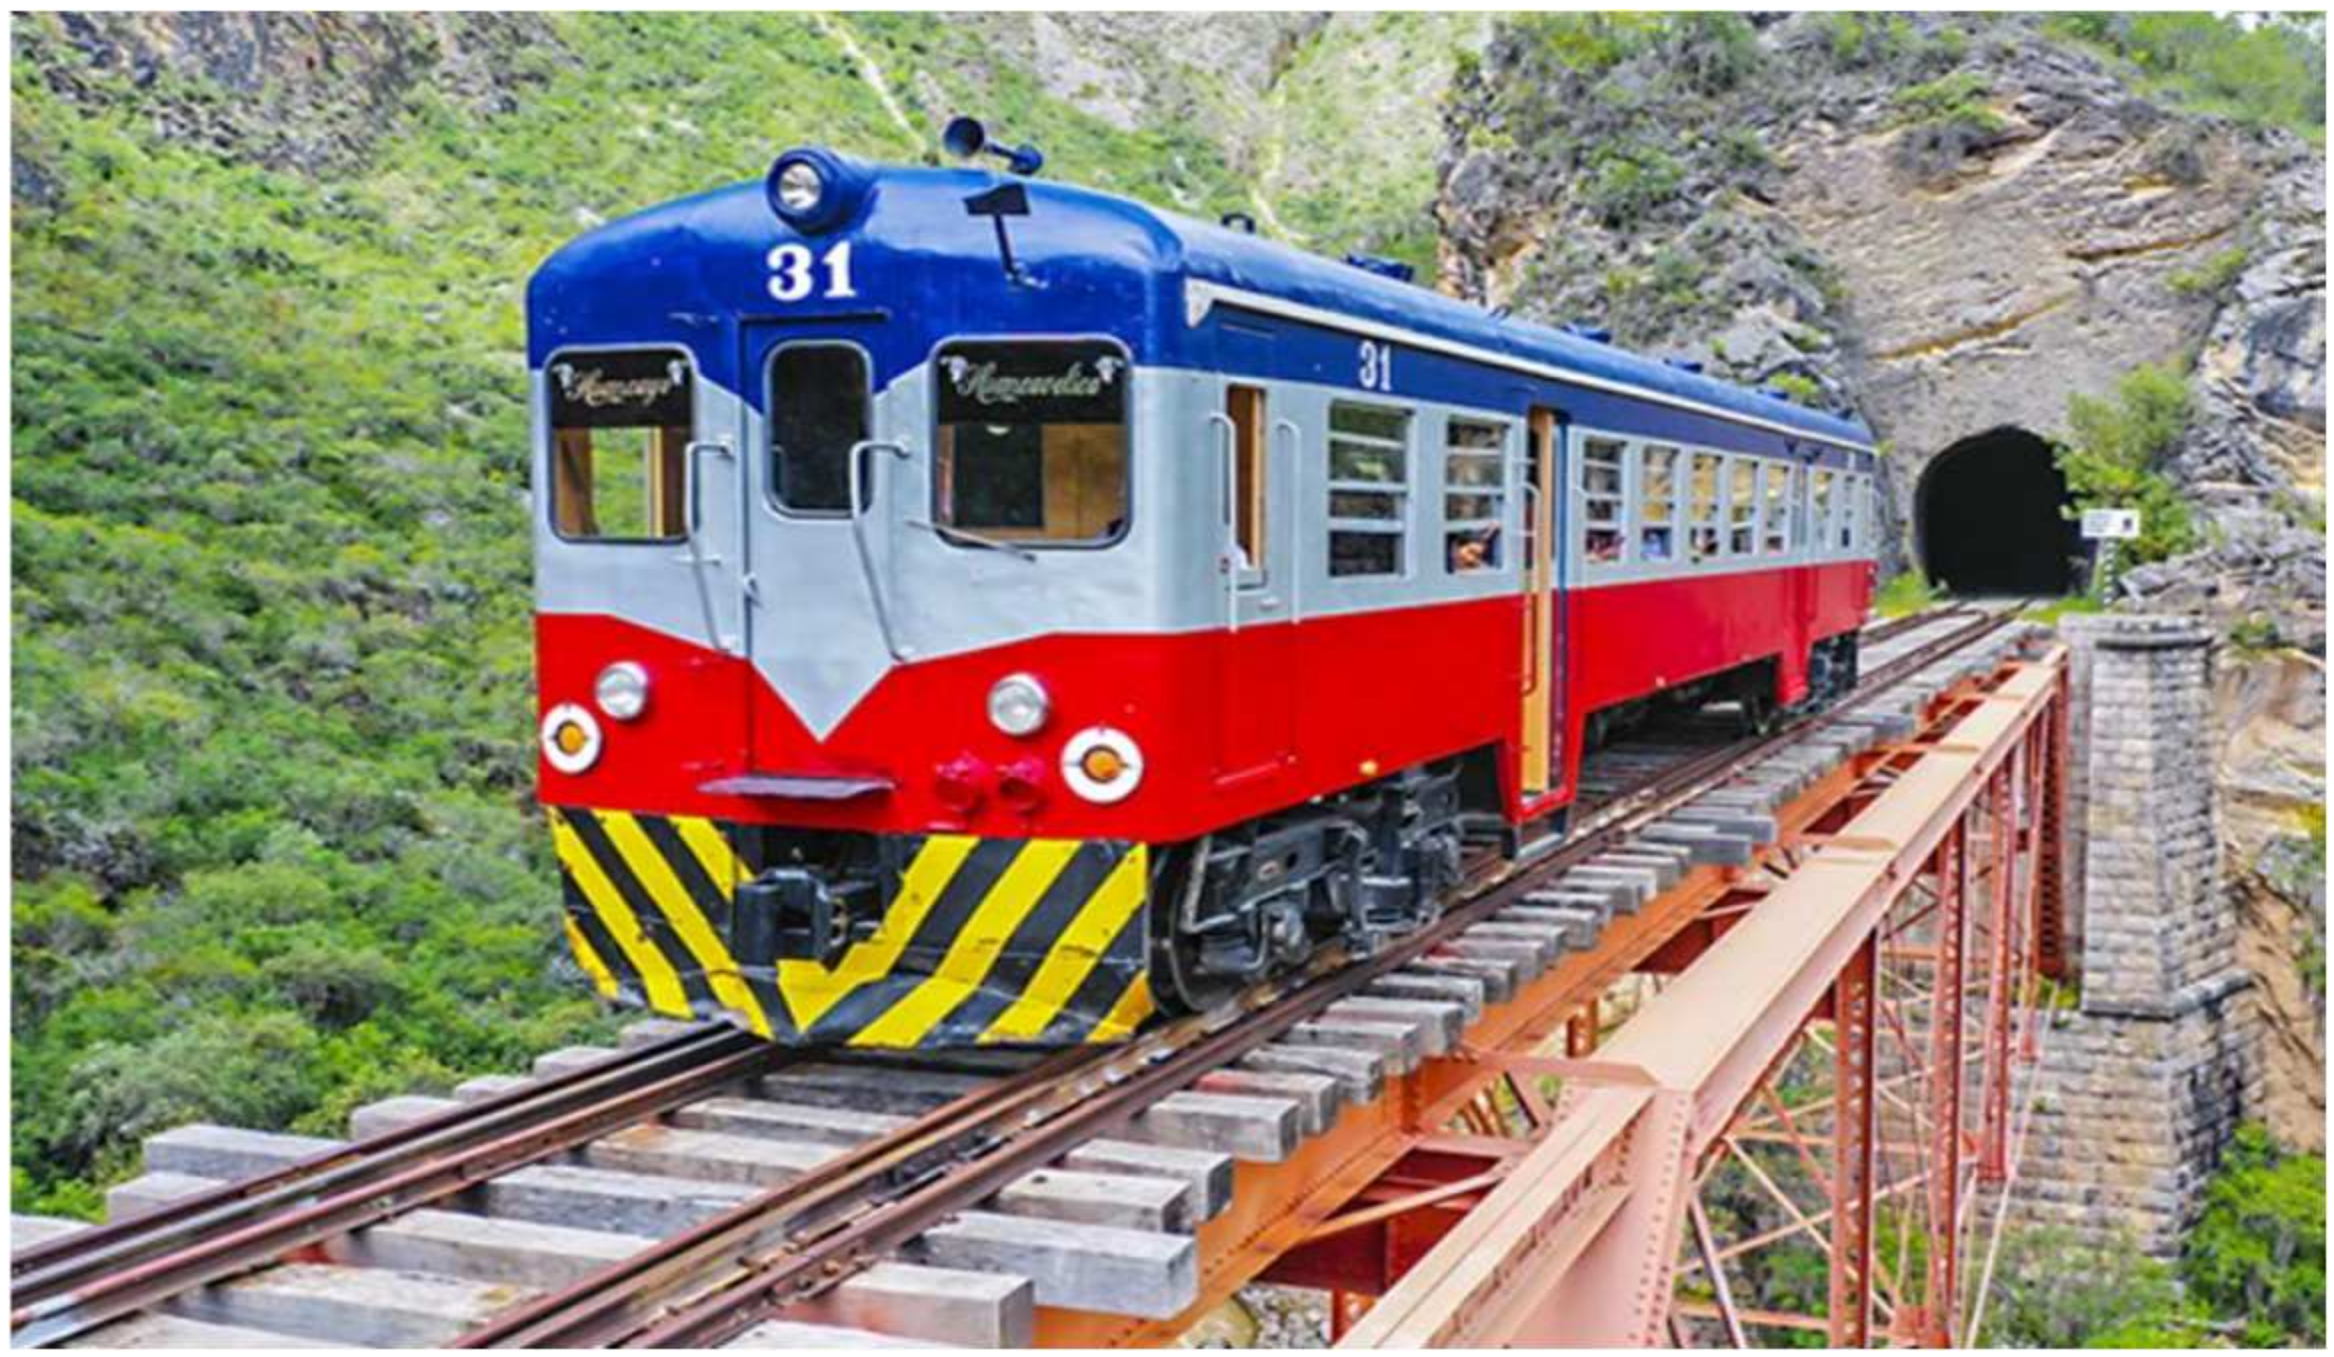
The locomotives used, as well as the year of manufacture, and, in some cases, the year of a major overhaul, are incorporated into the study to assess their impact. These locomotives are designed to operate in the Andes Mountain range of the “Ferrocarril Central Andino—FCCA”, facing extreme gradients and high altitudes (up to 4800 m above sea level). Their robust design and ability to be refurbished ensure their optimal performance on one of the most difficult railway routes in the world [8].
Also considered are the locomotives and wagons used for the AREMA, especially the 268 K and 286 K wagons, as well as the C39-8 and GT42 locomotive loads from copper concentrate container wagon loads on the FCCA and Peru Southern Railways [9]. See Figure 9.
The purpose of the load classifications and considerations in this investigation are to evaluate the structural live load capacity at a critical location of these bridges based on the E-Cooper load parameters, which are based on the AREMA (2023), chapter 17 [2] standards following the allowable stress method (ASD) through three types of design loads: E-40, E60 and E-80, namely, from the E-Cooper load train, generating a load classification equivalent to the E-Cooper as well as to the 268 k and 286 k cars, the GT42 locomotive load or specific equipment, according to Chapter 15, Section 7.3.2.2 of AREMA [2] for load classification analysis. See Figure 10.
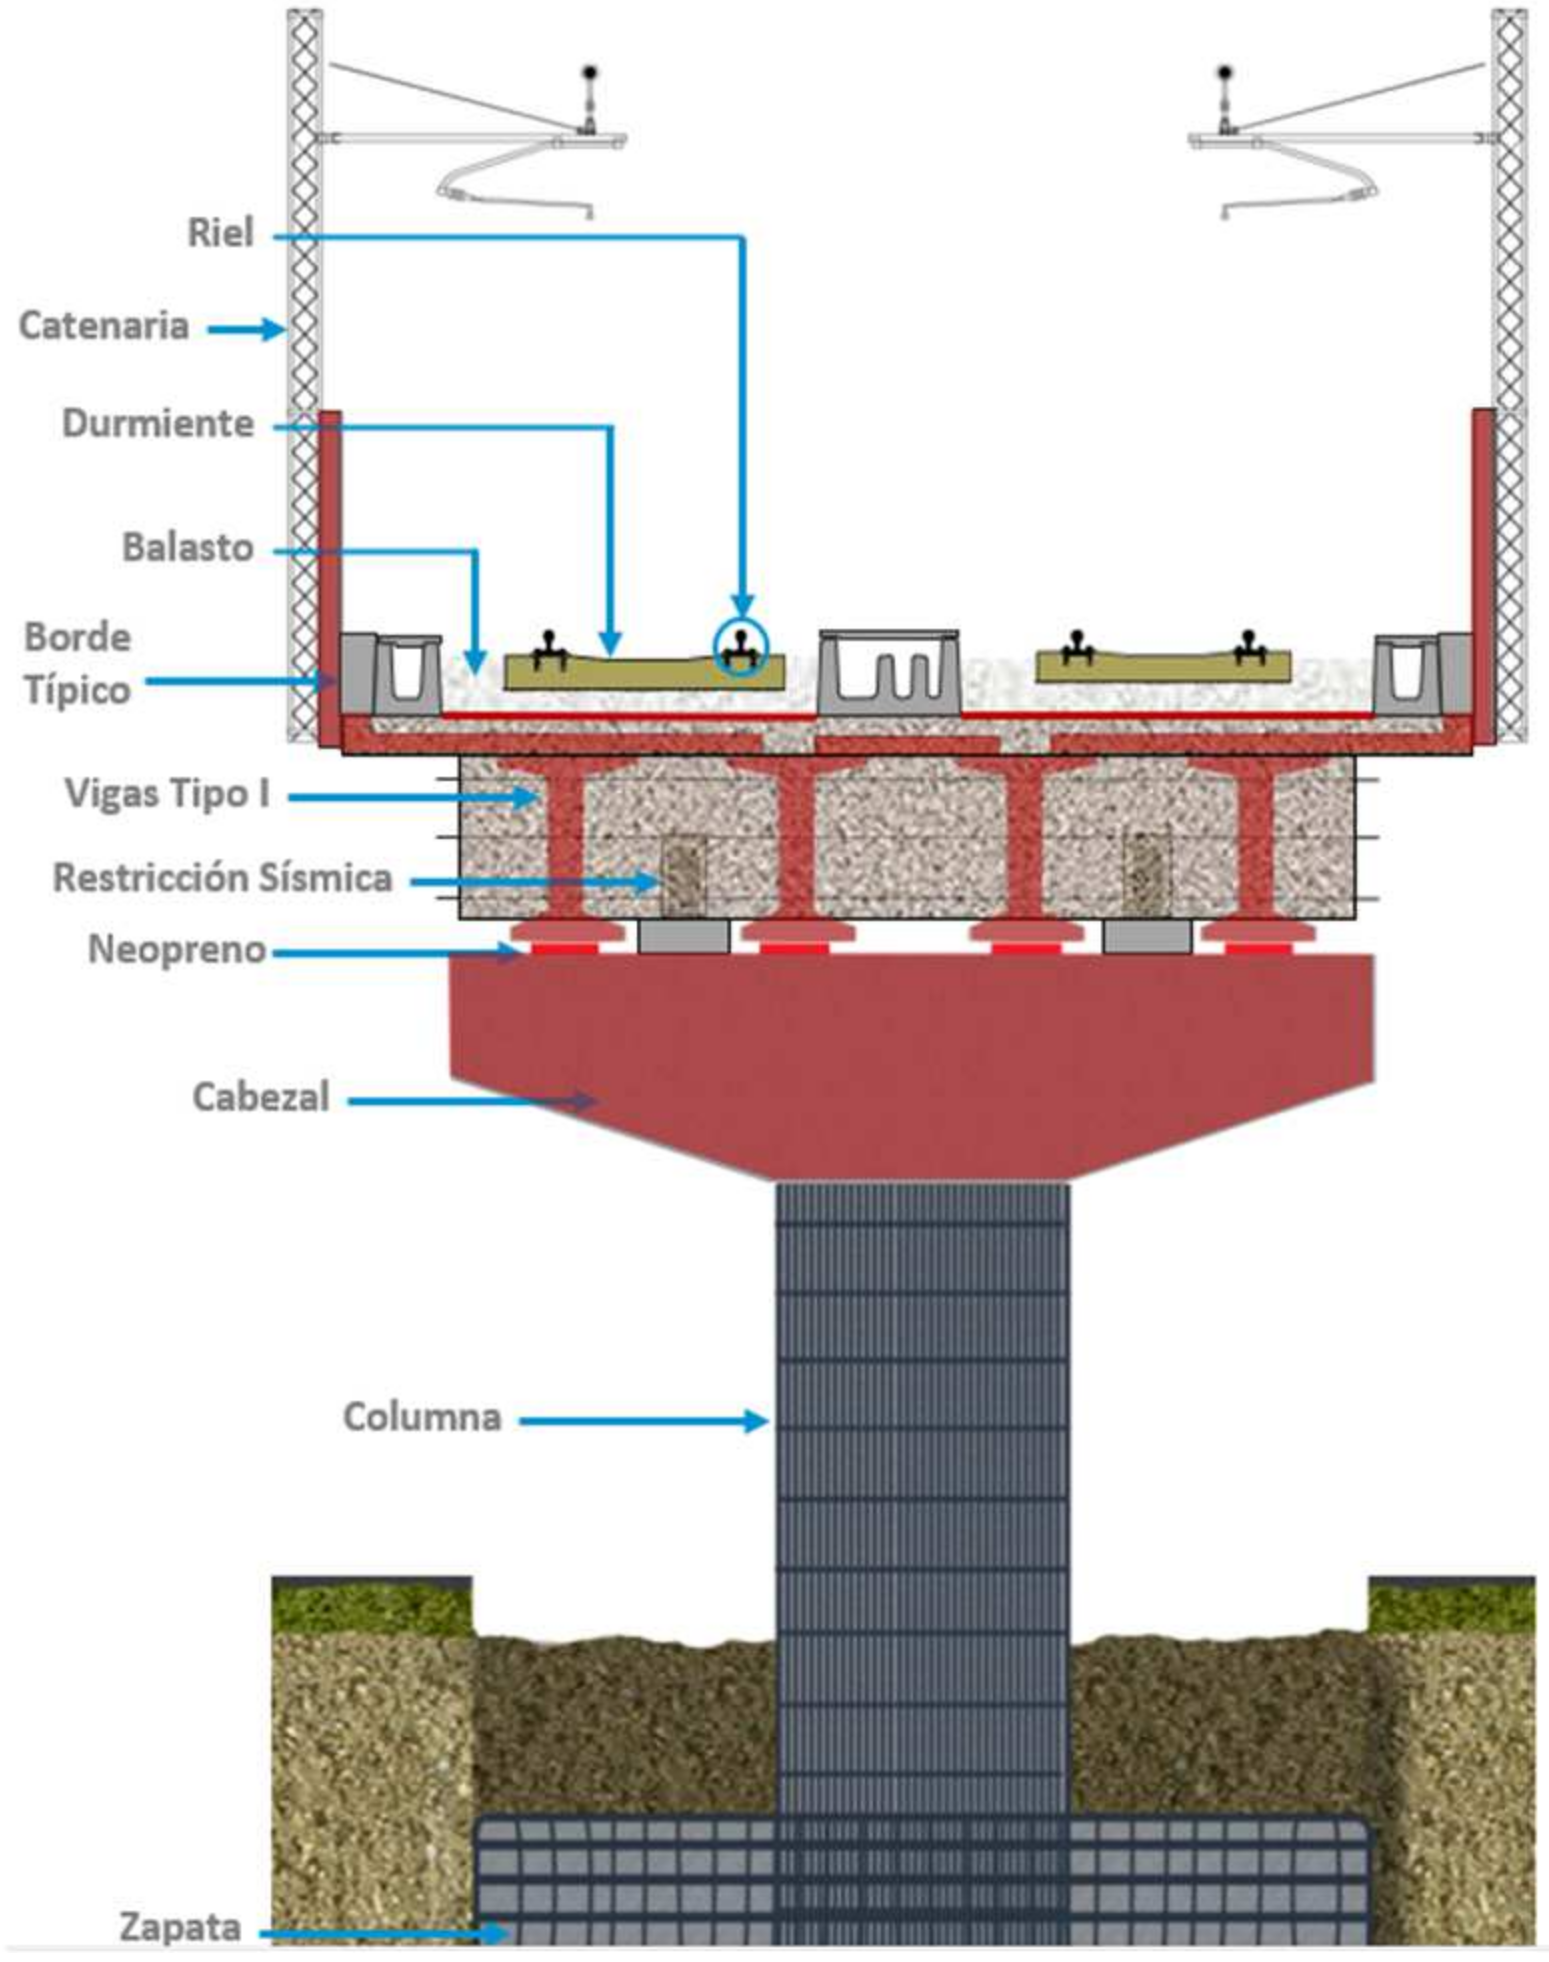
For the Lima Metro, in addition to the Cooper E-80 loads, two types of live train loads (Load A and B) are used [10,11], which are the same as the ones used for lines 1 and 2 of the Lima Metro. Additionally, this diagram represents a cross-sectional view of an elevated railway viaduct, showing the superstructure and substructure elements of the bridge, designed to carry railway loads, including those from electrified rail systems (catenary). The rail system supports the trains and transfers loads through the sleepers and ballast into the I-girders that transmit these loads to the pier cap, and subsequently to the column and foundation. See Figure 11 and Figure 12.
The following is a reference to the categories of the railway track, which are based on design and maintenance standards according to the Federal Railway Administration FRA [12]. It is observed that the higher classes allow higher speeds in terms of the maximum speed limits for freight and passenger trains in Kph and Mph. It should be noted that, in the case of passenger trains, these generally have higher limits due to their lighter design and lower impact on the track. See Table 4.
Eventually, considering trains that increase in speed, one option could be to upgrade to E-60 or E-80 freight trains, which are more suitable due to their greater capacity to handle the dynamic forces generated by trains [13,14]. In addition, the traffic projection has been evaluated, between 2.5 M tones and 3.0 M tones as the maximum; if heavy train traffic is expected to increase, E-60 and E-80 loads offer a greater margin for future load increases without compromising the safety or functionality of the bridge after evaluating and renewing the locomotives. See Figure 13.
Finally, for normal and maximum rating, AREMA Chapter 15, Section 7.3 [2] provides guidance for deriving normal and maximum ratings, where the normal rating is the appropriate capacity for the day-to-day use of a structure and the maximum rating is the appropriate capacity for occasional use. For both ratings, several factors like specified speed for impact and allowable stresses and exerted loads are considered. For the normal rating, allowable stresses are based on AREMA Chapter 15, Part 1-Design, Table 15-1-11, [2], whereas, for the maximum rating, allowable stresses are allowed to be increased as per AREMA Chapter 15, Table 15-7-1 [2]. Finally, the values for allowable stress are showed for flexure and shear under the normal rating. See Table 5.

2. Materials and Structural Analysis

The materials and structural analysis of railway bridges in Peru must be approached with a region-specific understanding of geography, seismicity, and environmental conditions. While advances in materials and modeling techniques offer significant potential, the absence of a unified national design code and the logistical challenges of the Andean landscape continue to pose significant hurdles. Investment in research, national standards, and training of Peruvian engineers in railway bridge design is essential for the sustainable development of the country’s railway infrastructure.

2.1. Materials for Structural Calculation

For most railway bridges, the deck consists of two steel prefabricated (A-36 and A709 50 ksi) isostatic girders of a 25–40 m span, except at river crossings, where for example, a single bridge of 3 spans with a 75 m maximum span is designed. In this section, the same type of steel girder has been used, connected longitudinally by bracing sections. The isostatic spans are fixed longitudinally on one of the support axes to transmit the horizontal actions of each span to one of the supporting pillars or to the bridge abutments. On the contrary, in a transverse sense, the transverse actions are transmitted under the span where the structure is located.
The image shows a classification of the structural sections used in the truss chords and the truss elements [15]. The main types are described below. See Figure 14.

2.2. Structural Analysis and Behavior

2.2.1. Load Calculations

The AREMA standard determines the different acting loads that must be considered when designing a railway metal structure. Below, each of them are presented.

2.2.2. Dead Load (LD)

Dead load is the sum of the loads imposed on the bridge by the elements that it must permanently support. See Table 6:

2.2.3. Live Load (LL)

Live load is the load imposed on the bridge by the train when it passes over it. In this case, the actual load generated by the train will be used, considering GE Transportation Systems C39-8 diesel–electric locomotives (six axles of 35 tons each) and wagons with four axles of 25 tons each. The freight train configuration is shown in Annex 1 of this calculation report.

2.2.4. Impact Load (I)

The impact load is the sum of the following: (1) the swaying or rocking effect of the locomotive and wagons and (2) the vertical load effects generated as a consequence of the train moving over the rails. According to AREMA Chapter 15, Part 1 “Design”, Section 1.3 “Loads, Forces, and Stresses”, Article 1.3.5 “Impact Load”: Impact loads are reduced considering a maximum locomotive speed of 60 km/h, in accordance with the AREMA chapter on Existing Bridges, Section 7.3.3.3a [2].

2.2.5. Wind Load (WC)

Wind load is produced by wind acting laterally on the structural elements that make up the bridge and the train. According to AREMA Chapter 15, Part 1 “Design”, Section 1.3 “Loads, Forces, and Stresses”, Article 1.3.7 “Wind Force on Loaded Bridge”: On the train, wind load is applied 2.6 m above the bridge [2]. On the bridge, stress = 100 kg/m2 is applied over 1.5 times the bridge height. Bridge height = 2.00 m.

2.2.6. Lateral Force Due to Equipment (S)

The lateral force due to equipment is the lateral load produced by the railway equipment with the heaviest axles (wagon or locomotive) moving on the railway track. According to AREMA Chapter 15, Part 1 “Design”, Section 1.3 “Loads, Forces, and Stresses”, Article 1.3.9a “Lateral Forces Due to Equipment”: the heaviest axle weight is 35 Tons [2].

2.2.7. Longitudinal Forces (FL)

The longitudinal force is the force that acts along the rails due to friction between the train wheels and the railway track which occurs during braking or constant speed translation (traction). According to AREMA Chapter 15, Part 1 “Design”, Section 1.3 “Loads, Forces, and Stresses”, Article 1.3.12 “Longitudinal Forces” [2].
In the next stage of the structural verification, we validate the thermal gradient analyses according to the information corresponding to the maximum and minimum temperatures present in the three characteristic regions of Peru. The coastal regions present moderate temperature gradients ΔT due to experiencing smaller temperature fluctuations due to the moderating effect of the ocean [16,17]. Regarding corrosion, we observe that high humidity requires important measures to be taken against corrosion, and therefore, the thermal fatigue stresses obtained have an average value of (ft = 50.4 MPa), so it will be necessary to focus on anticorrosive measures rather than on thermal effects. See Table 7.
On the contrary, for the mountain areas, the thermal stress is higher (ft = 88.2 MPa), so adequate expansion joints and careful design of the connections and supports must be considered [18]. The extreme daily temperature variations (day–night cycles) require the careful design of some joints and supports to accommodate the thermal expansion and contraction. It is observed that low temperatures affect the toughness of the steel and increase the fragility of the material.
In the Rainforest region of the country, the thermal stress is observed to be lower (ft = 45.4 MPa), so it will be important to prioritize good durability against humidity, heat and against these thermal effects, since high temperatures combined with high humidity can accelerate the degradation of materials, especially in the case of unprotected steel. Below are the temperature values for the coastal area, the mountain region and the rainforest region of Peru, which will be considered to evaluate their impact on the design of bridges: see Figure 15.
Likewise, the most important bridges are finally modeled using visual inspections to verify the behavior of these structures. The modeling is limited to the most representative areas or those that present an important pathology, as seen in Figure 16.
This type of analysis may be interesting in the detailed analysis of bending and shear stresses in the upper deck of bridges; in the study of the distribution of point forces in the deck (reactions, moments, forces, stresses, etc.); in the calculation of the effective stiffness of sections, in the distribution of longitudinal stresses, etc. Bellow it shows the structure modeling under Cooper E40, E60, and E80 live load types, including the 236 K wagon load. Additionally, this figure shows a structural finite element model (FEM) of a steel truss bridge girder modeled in software like SAP2000, version 2024 or CSI Bridge, commonly used for civil and structural engineering analysis and represents a through or deck-type truss, commonly used in railway bridges where high load capacity and long spans are required. See Figure 17.
According to the analyses, it is observed that the lattice structure is highly efficient in load distribution, resulting in a higher stiffness compared to TPGs and DPGs, so the reduced dynamic amplification due to the higher natural frequency reduces the risk of fatigue-related damage. The triangular and square symbols represent boundary conditions like pinned and roller supports at either end to allow expansion and contraction and this could also show us bearing pads or fixed supports in the model. See Figure 18.
Designing some prefabricated elements can result in a very competitive solution thanks to the cost optimization which results from the construction method, especially for long railway bridges. In addition, the analysis of the interaction effects between the railway track and the structure is carried out using spatial bar models, where the rail has been linked to the deck using spatial structure-type elements with bilinear behavior, limiting the maximum force from a limit displacement.
The seismic standards consider a 50-year exposure time for the structure, for a probability of exceedance of 2%, 5% and 10%, which is equivalent to a return period of 475 years for non-main bridges. For bridges and viaducts on main railways, a 100-year exposure time for the structure is considered as per AREMA, for a probability of exceedance of 10%, which is equivalent to a return period of 950 years. The exception is the CALTRANS code, which considers, for a deterministic analysis, the maximum credible earthquake, and for a probabilistic analysis, it evaluates a 1000- to 2000-year return period. See Figure 19 and Figure 20.
The dynamic behavior against overload allows us to check that the speeds are below the admissible values. In other standards, for train speeds below 90 km/h, it is generally sufficient to check that the first frequency of the bending of the deck is within a range established based on an equivalent span.
The structural calculation methods of railway bridges are usually used in the analysis of bridges, specifically considering the matrix analysis of 3D bar models in elastic and linear regimes. Due to the enormous importance and significance of these structures, it has been found that the effect of real overloads, including their dynamic effect, is lower than the effect generated by the overload models specified by the AREMA standard. The maximum accelerations that have been obtained and the calculations of the same bridges have varied between 0.41 and 1.39 m/s2.
An overview of the calculations and considerations that have been necessary for the design and evaluation of railway bridges under heavy transport load conditions (E-Cooper) is given below. By ensuring compliance with these standards, the bridge can effectively withstand static and dynamic loads, long-term fatigue cycles under high-frequency rail traffic and environmental challenges such as corrosion and the effects of temperature and earthquakes [19,20]. The following section presents the bridge models developed in SAP2000, version 24, as well as the corresponding Rating Factors for each of the structural elements. See Figure 21, Figure 22, Figure 23, Figure 24, Figure 25 and Figure 26.

3. Results

Below are some of the significant aspects involved in the structural analysis of railway bridges, with the results of various railway projects carried out and for this article the process of analysis and the verification of the structural capacity of railway bridges and to warn about certain aspects that may influence the verification of the structural capacity of railway bridges as well as routine maintenance programs.
The results for various types of bridges with different spans and a slenderness ratio of L/640, obtained using different criteria for maximum tensile and compressive stress under dead loads, live loads, wind loads, temperature loads, lateral forces, braking loads and longitudinal forces for E80, E60 and E40, as well as AREMA’s railcars in the characteristic combination at the most stressed section, indicate a good-to-medium load-bearing capacity for some of these bridges. This suggests the need for a periodic strategic plan for these railway bridges.
Also, the thermal stresses are presented according to the different temperature gradients that summarize the typical ranges for the coastal zone, the mountainous region and the Rainforest region in Peru. These values consider the annual variations, the extremes and the average differences that impact the design of bridges. See Table 8.
This table summarizes the temperature-related factors in different regions of Peru and their impact on bridge design. See Table 9.
The natural frequency of the bridges ranges between 2.08 and 3.06 Hz, with which they can interact with the frequencies of the dynamic loads of trains reaching a speed of up to 60 km/h, and so resonance with a main excitation frequency is unlikely, but the dynamic effects due to transient vibrations must still necessarily be evaluated by a much more detailed dynamic analysis, which could be conducted in another article.
Also, a summary of the frequencies for a typical case of a 35–55 m bridge for charges E-Cooper is shown below, where the values of mass, stiffness and the natural frequency of a TPG, DPG and truss bridge are well below the values obtained with the typical excitation frequencies of trains. So, a higher frequency will reduce the probability of resonance with the structure. See Table 10.
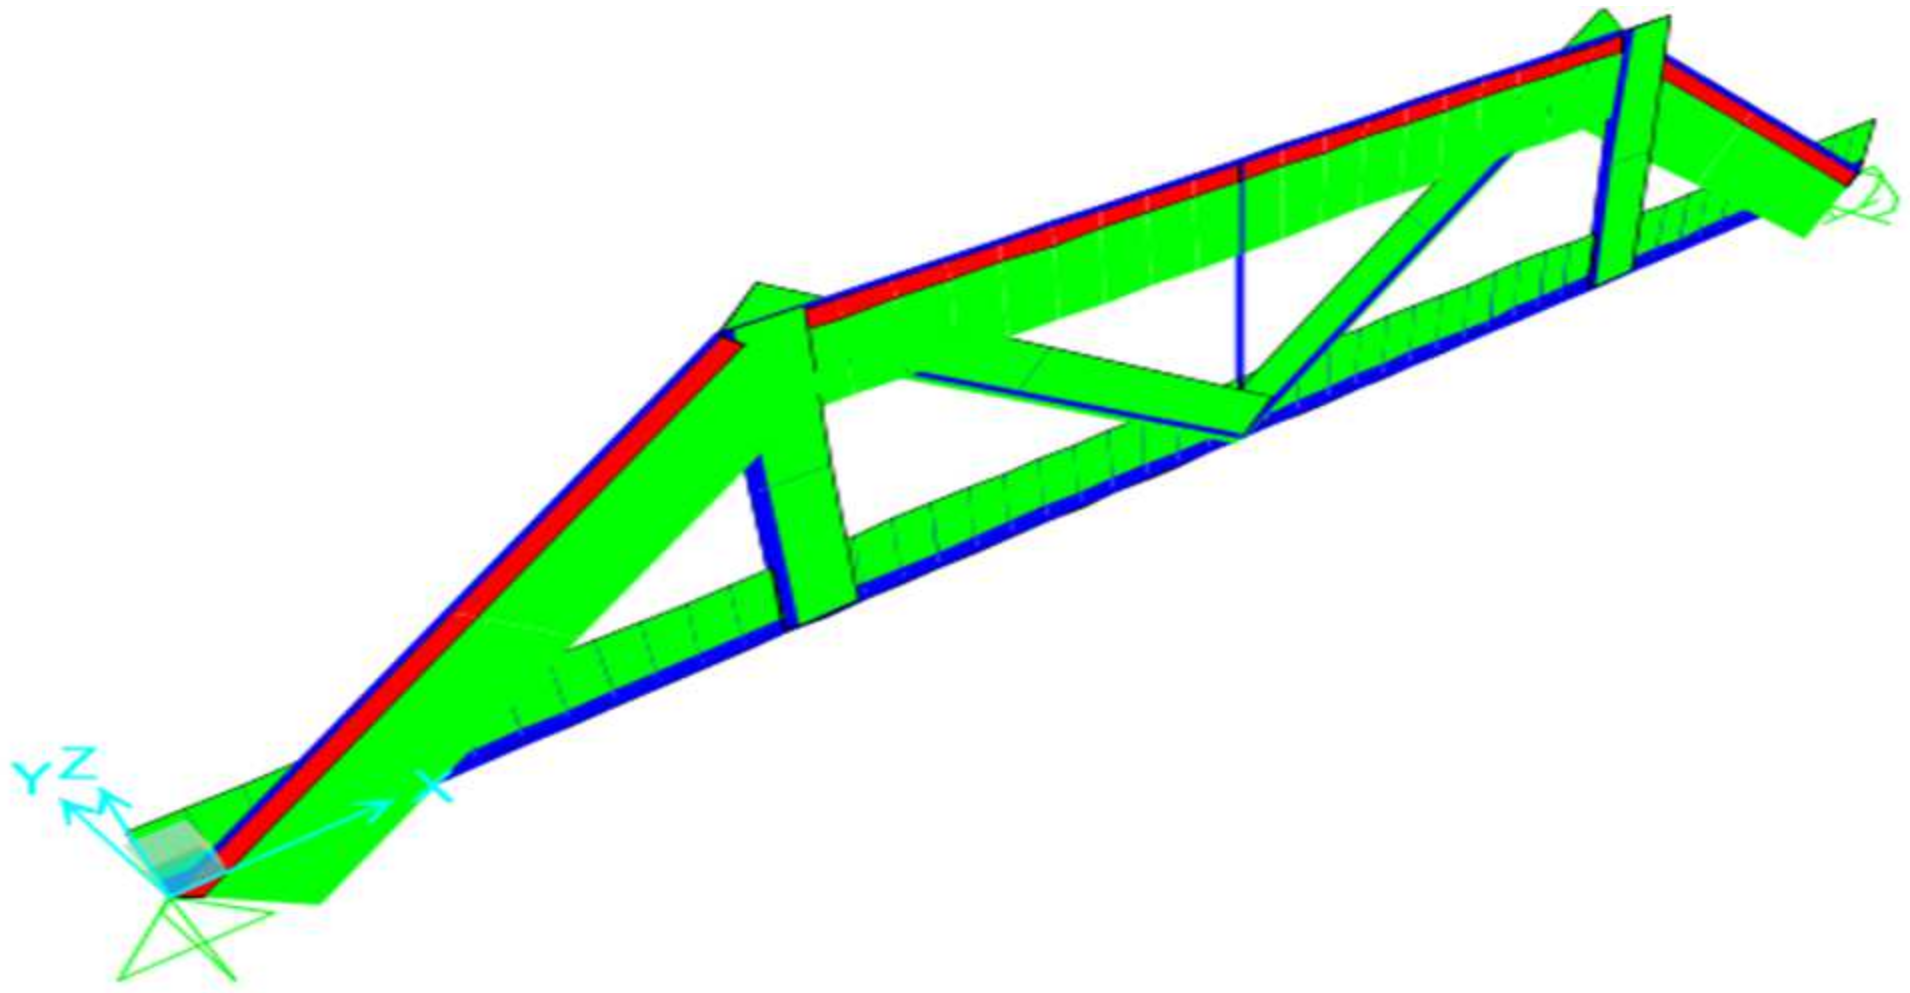
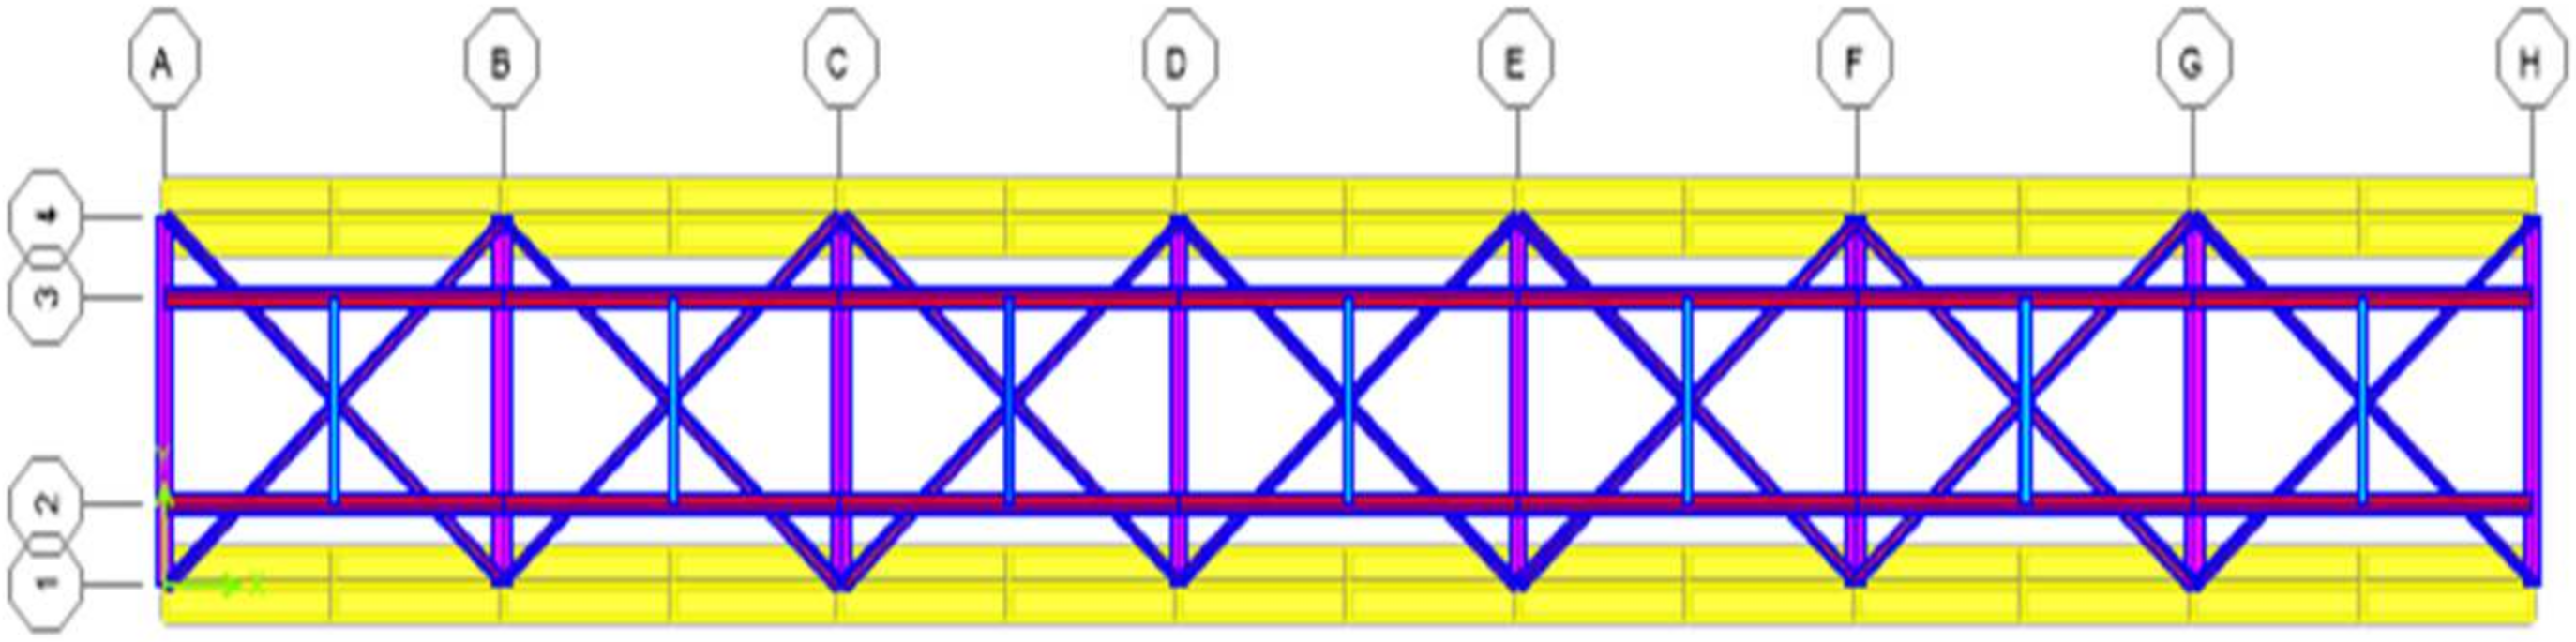
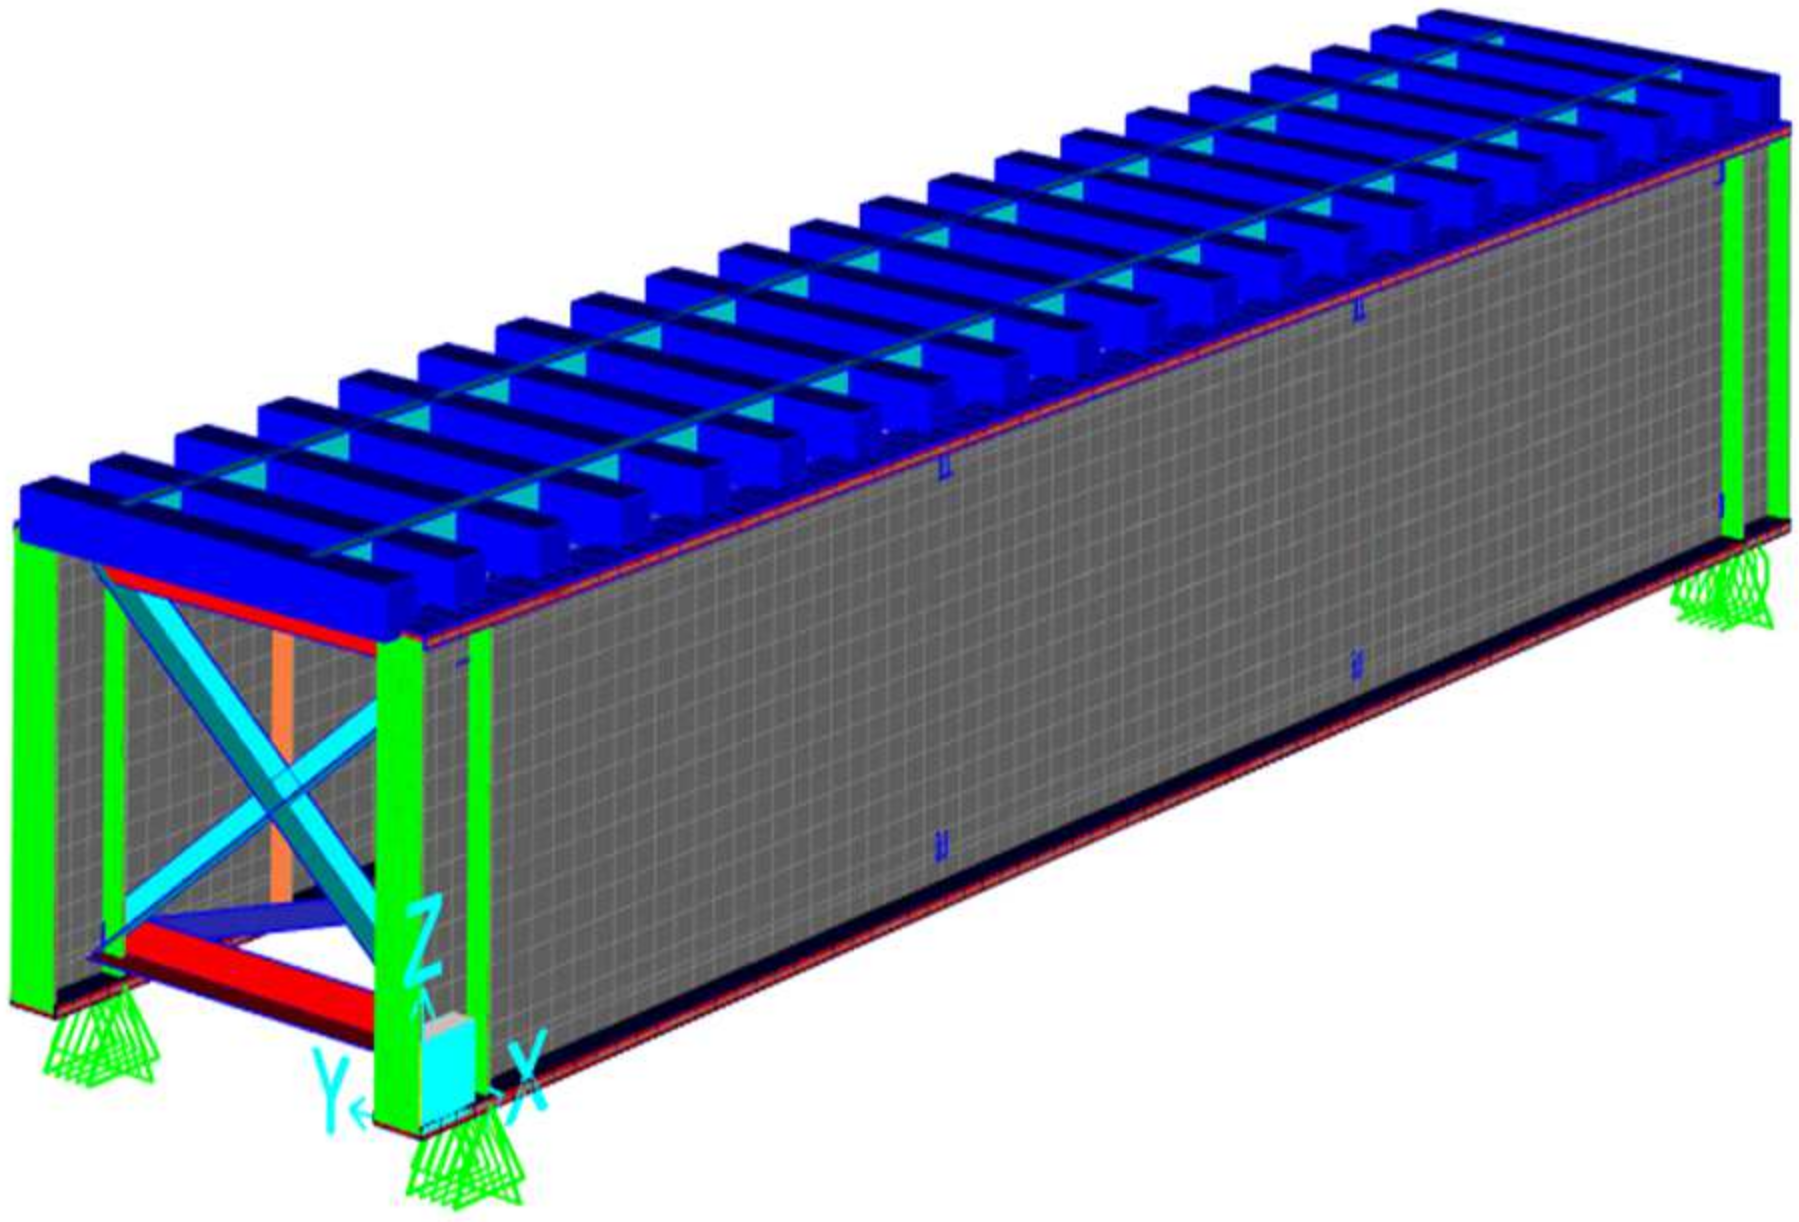
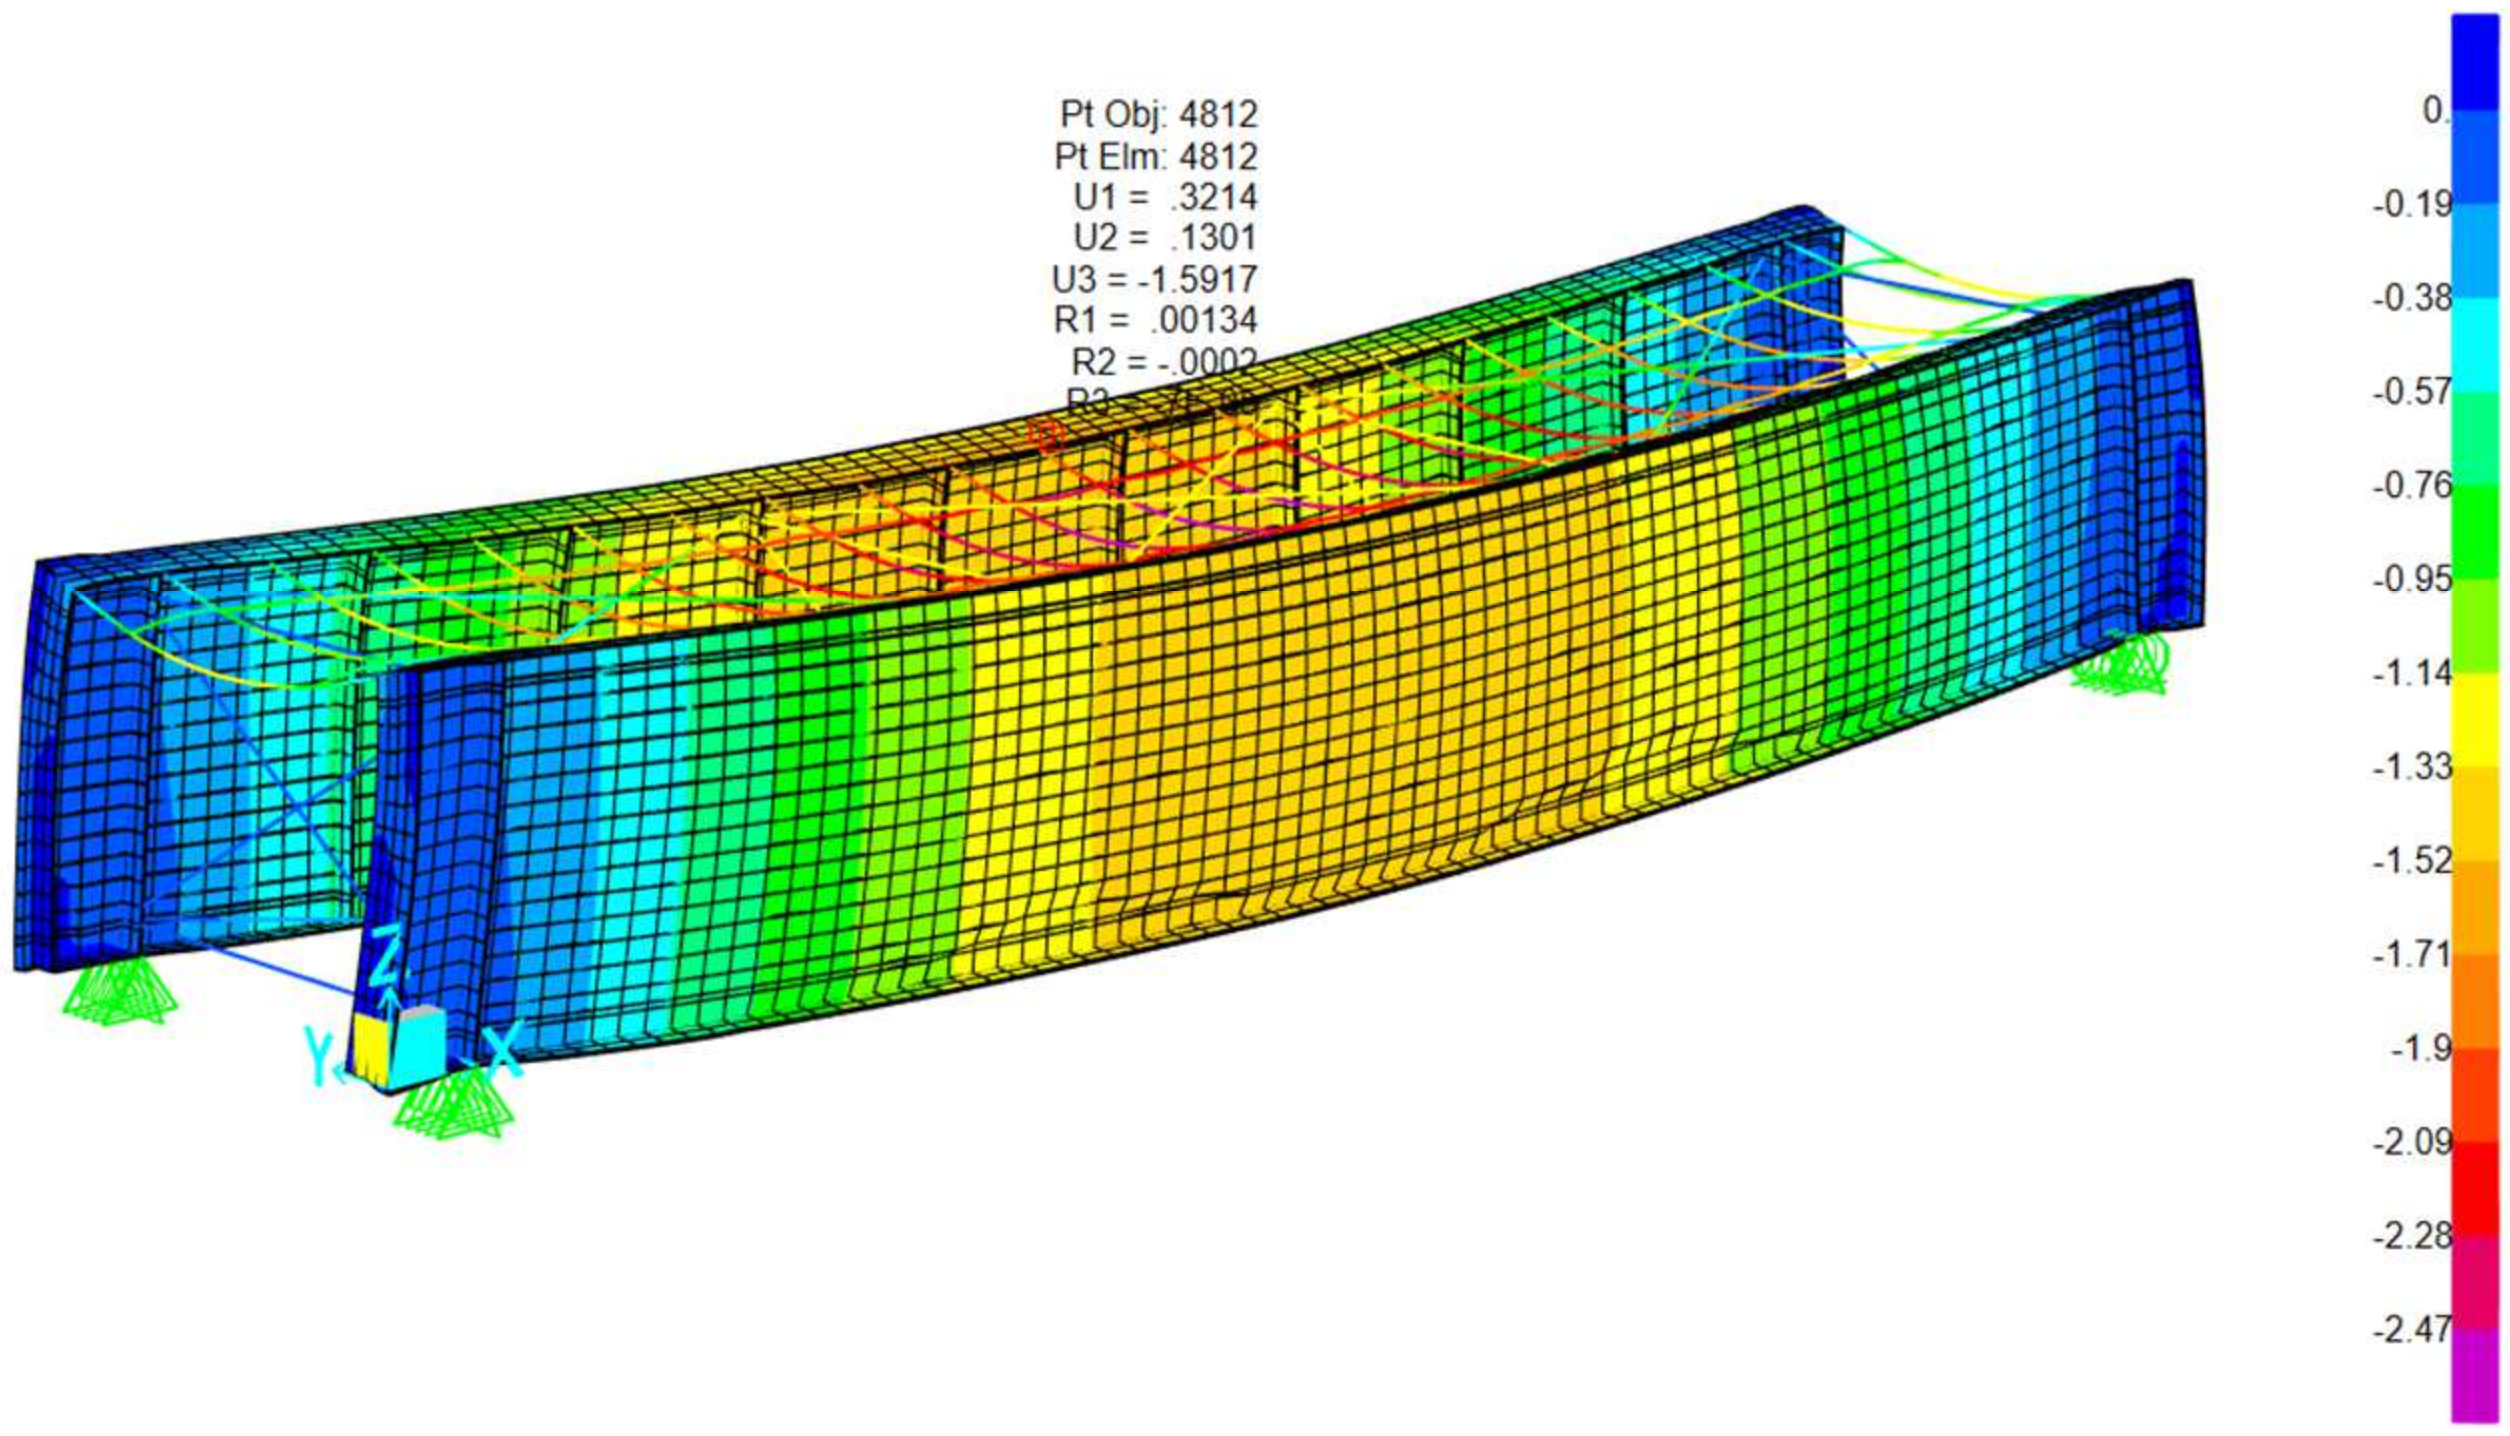
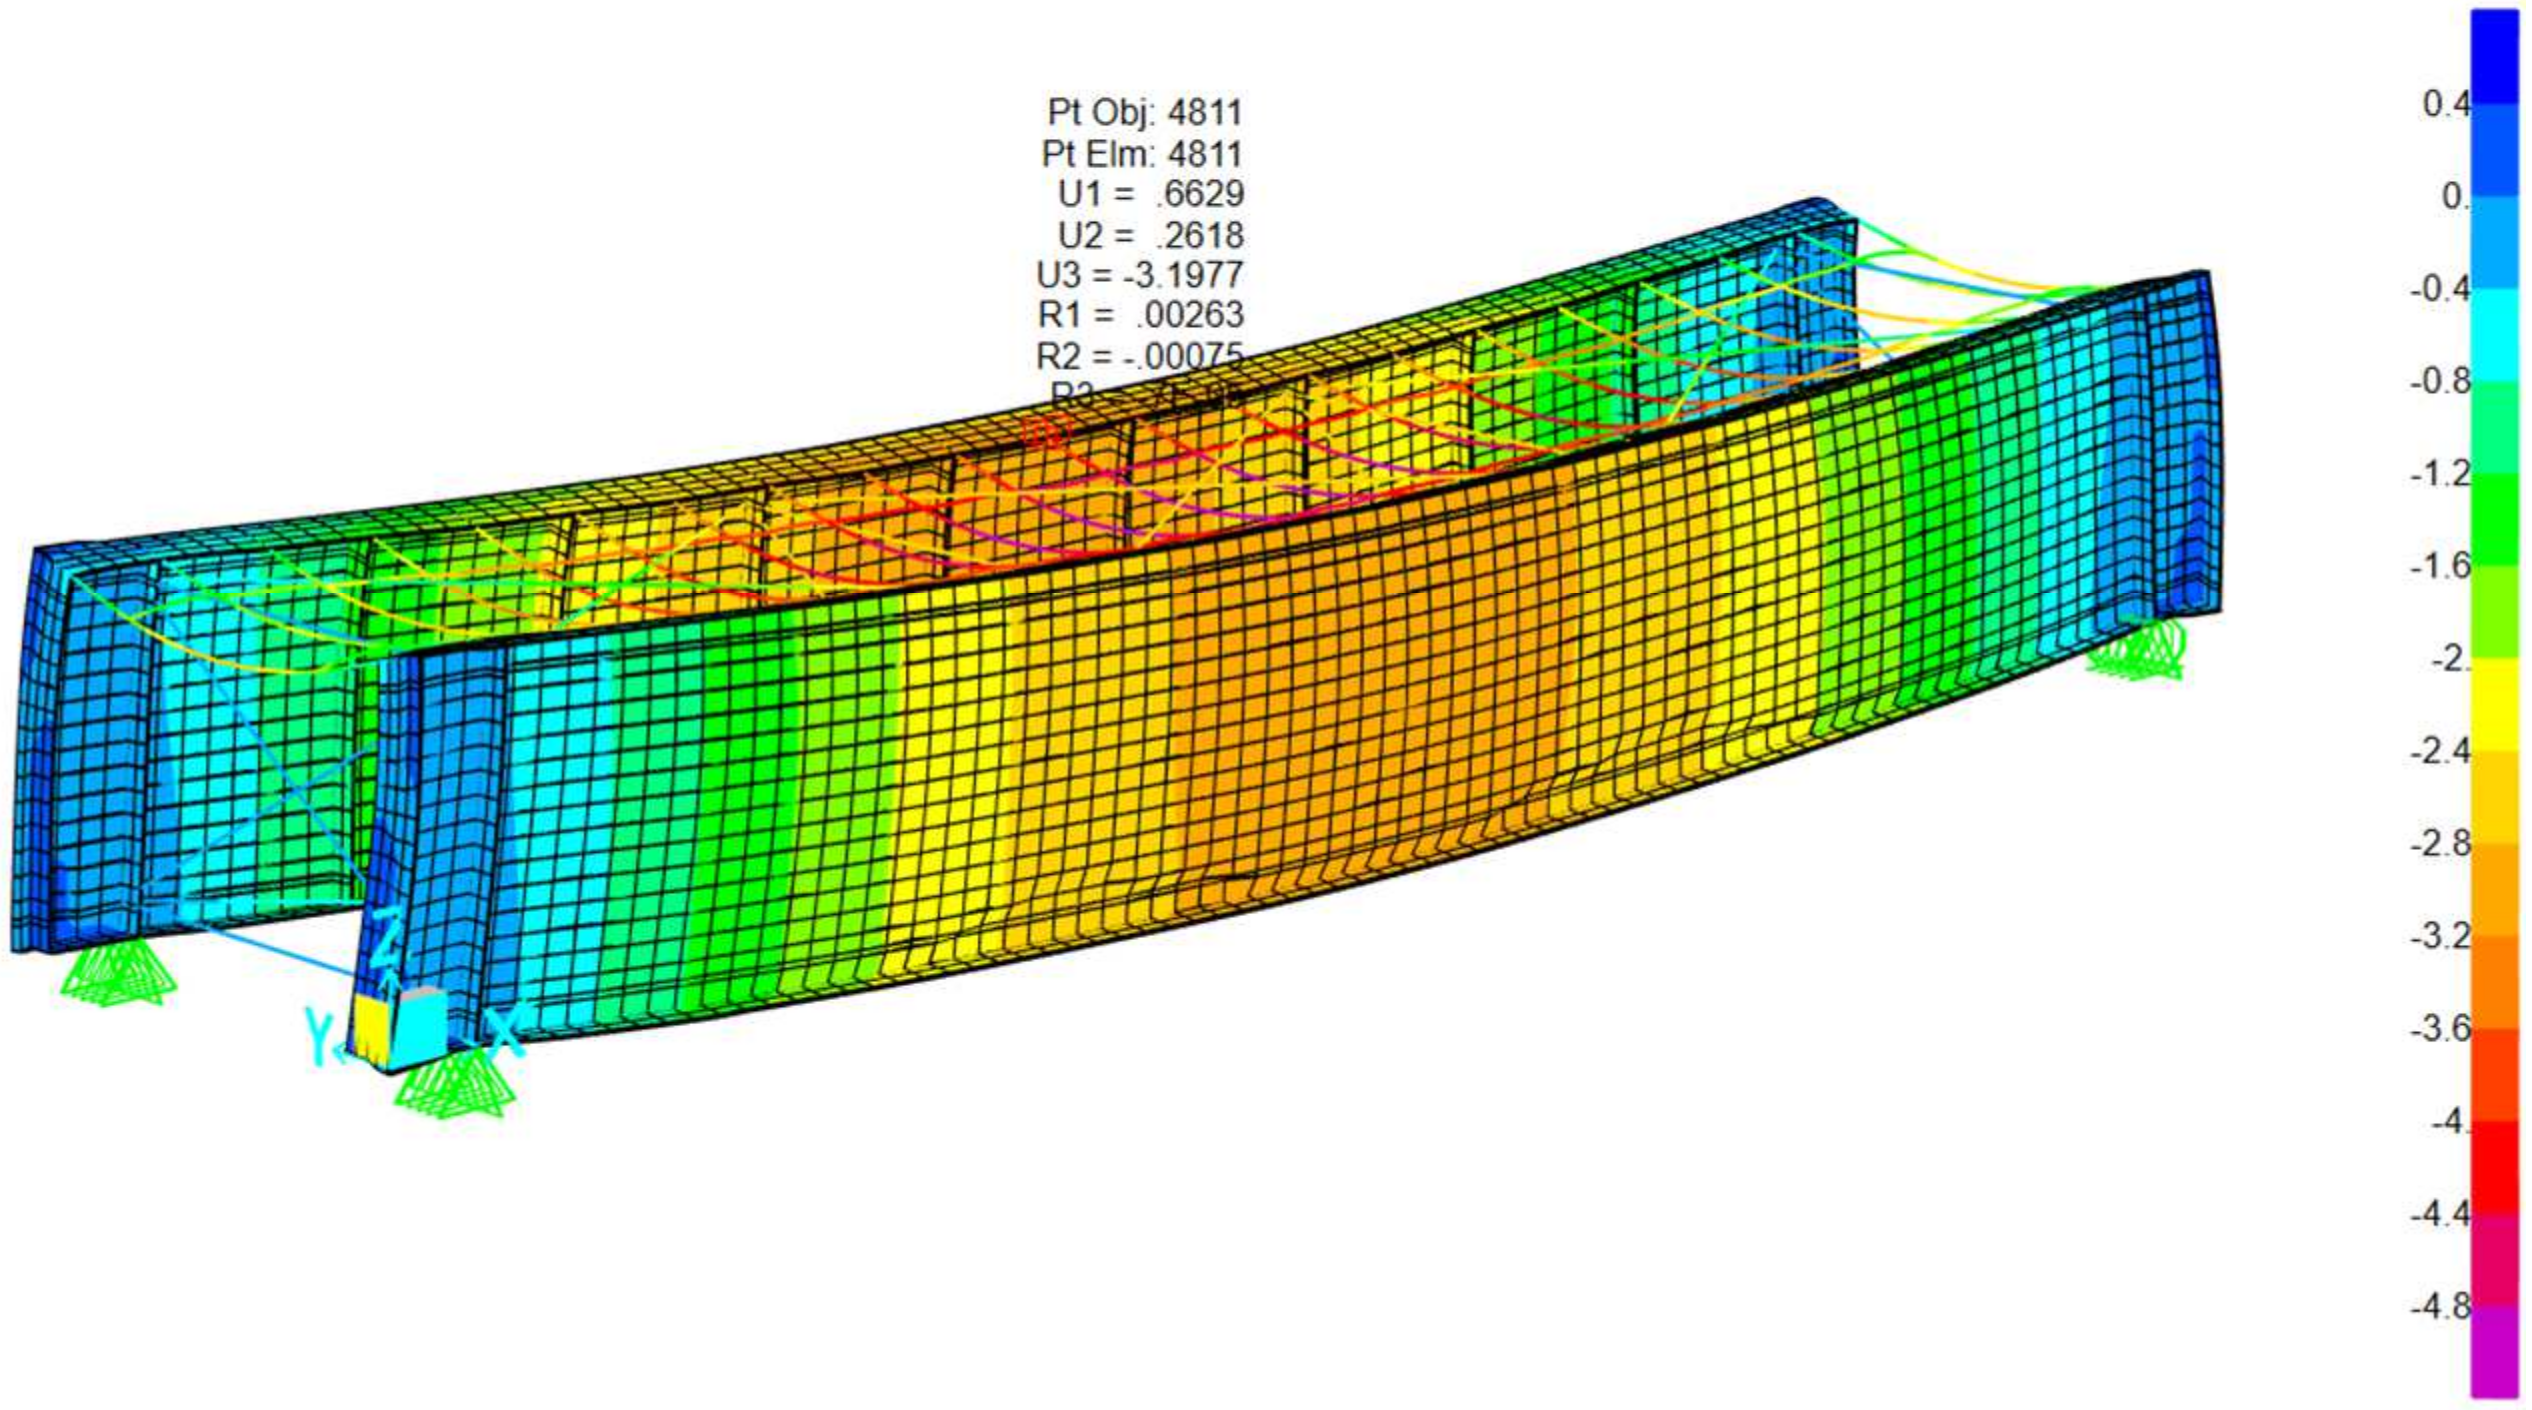
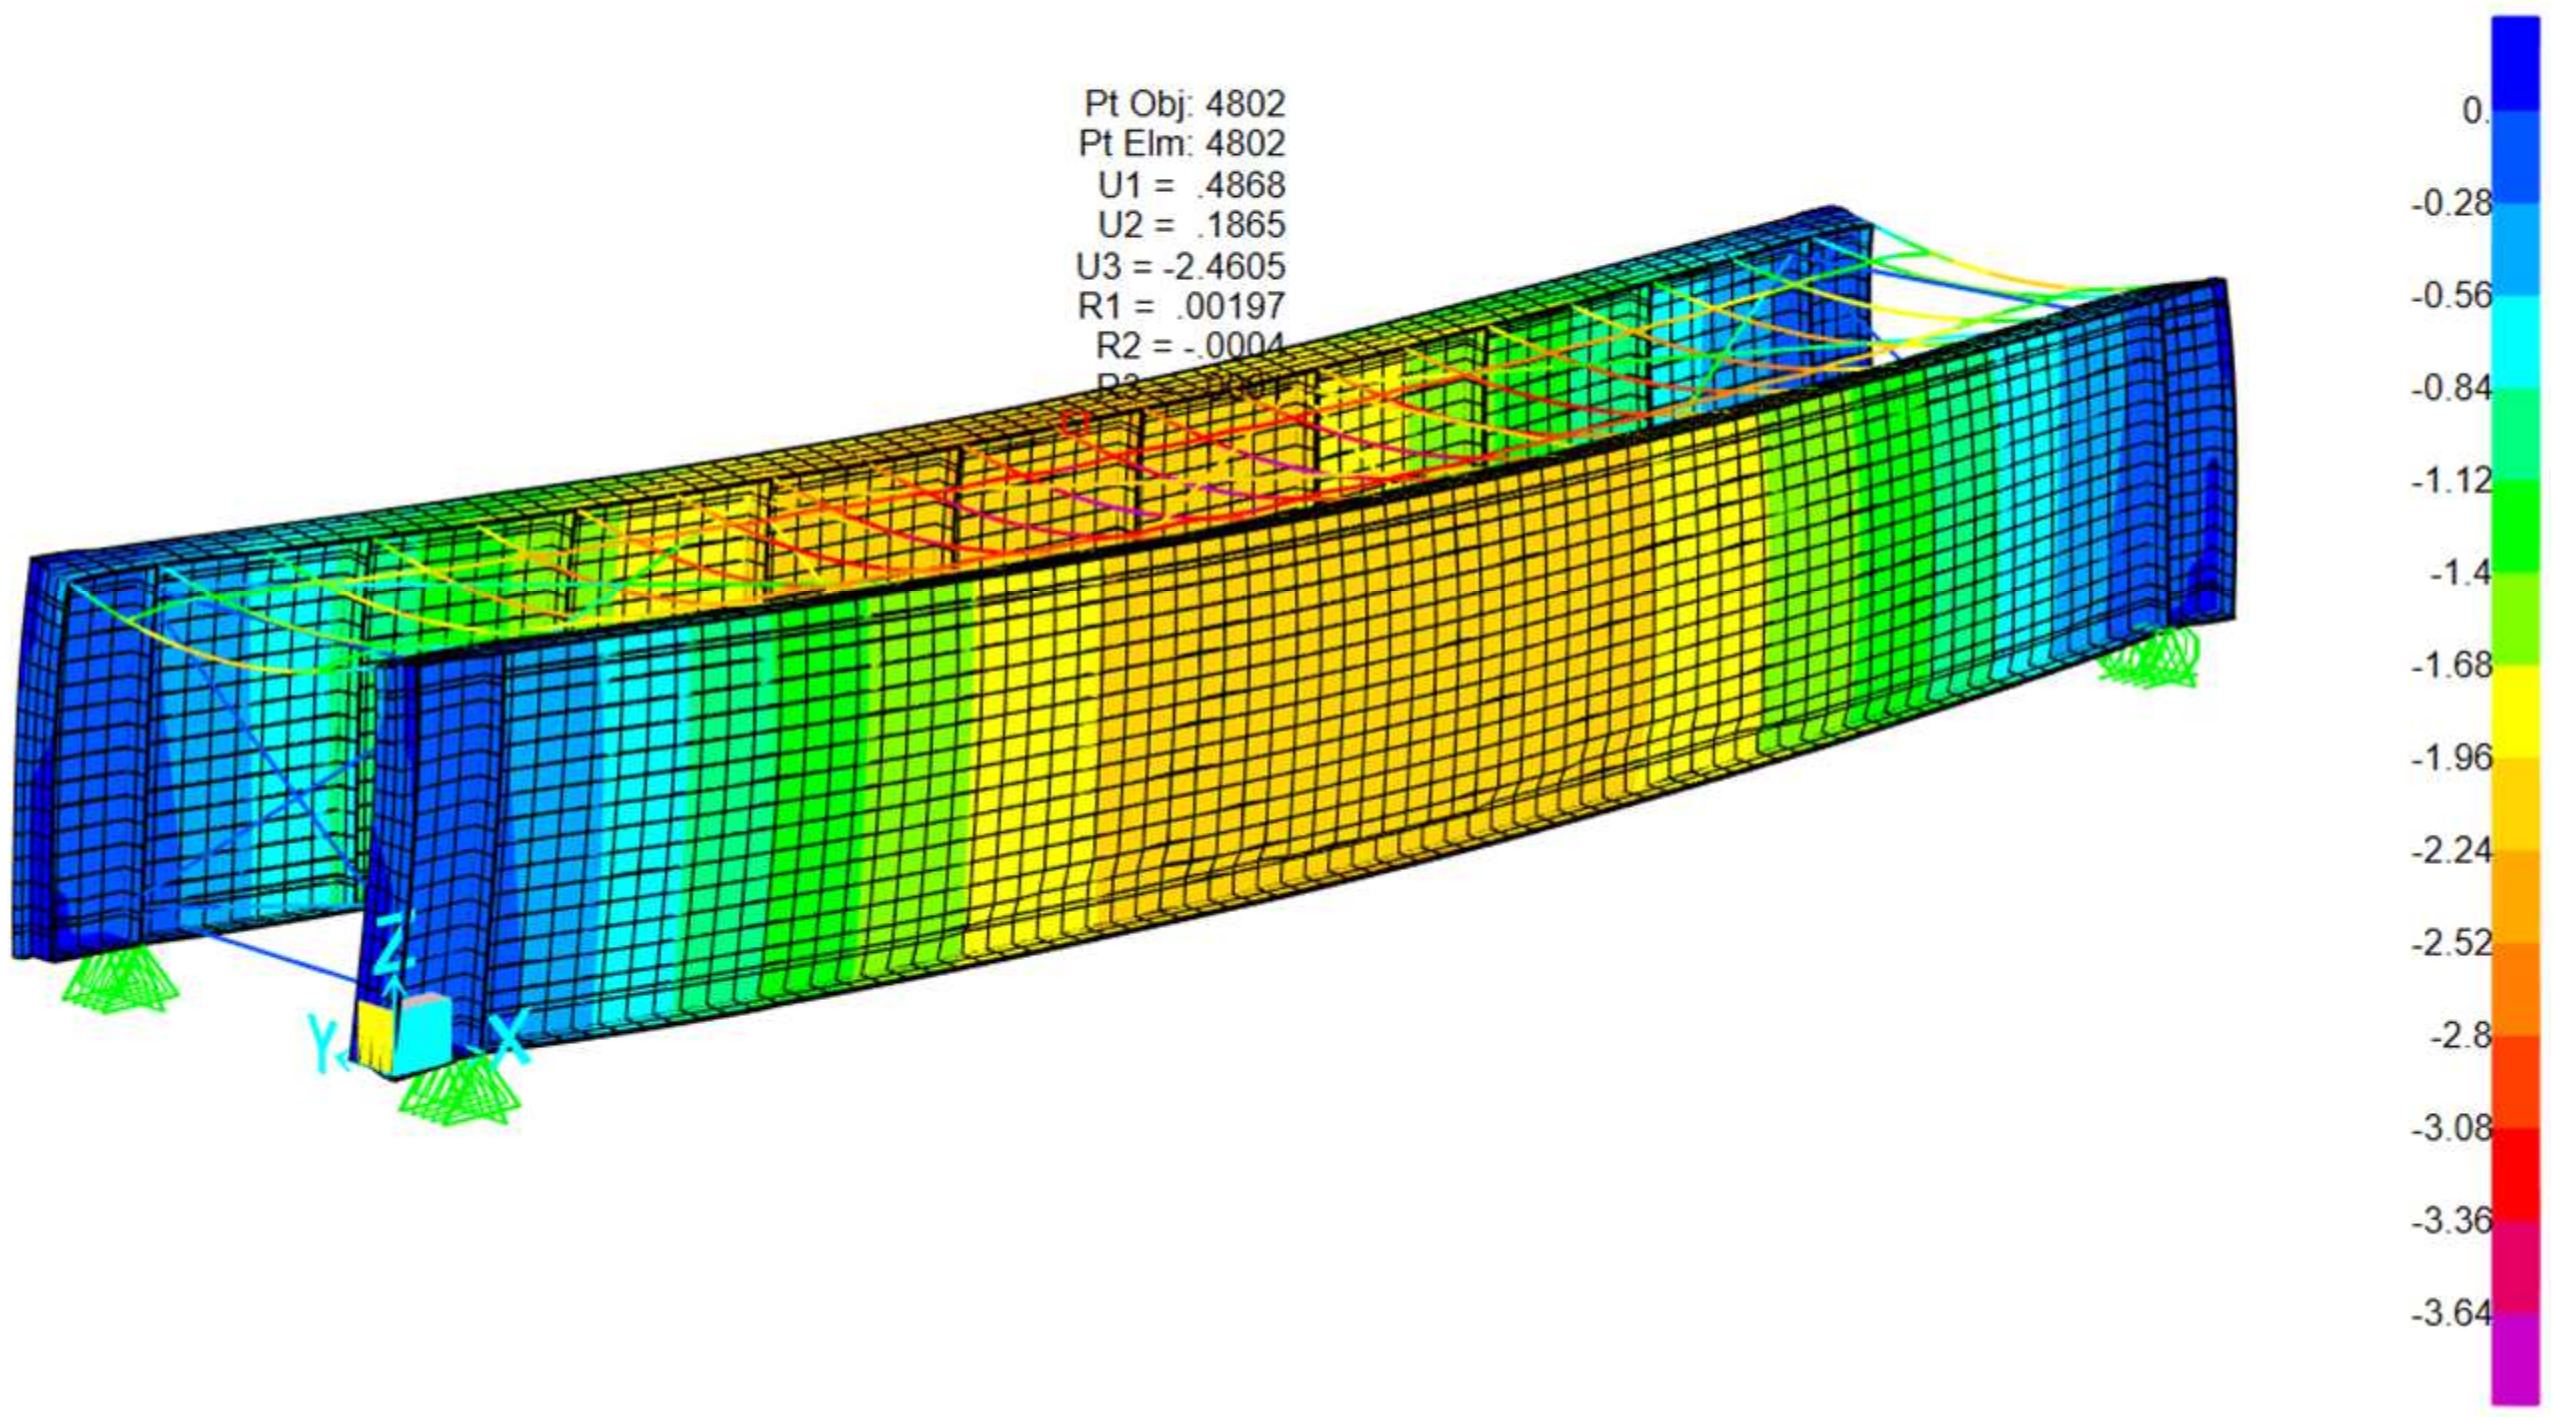
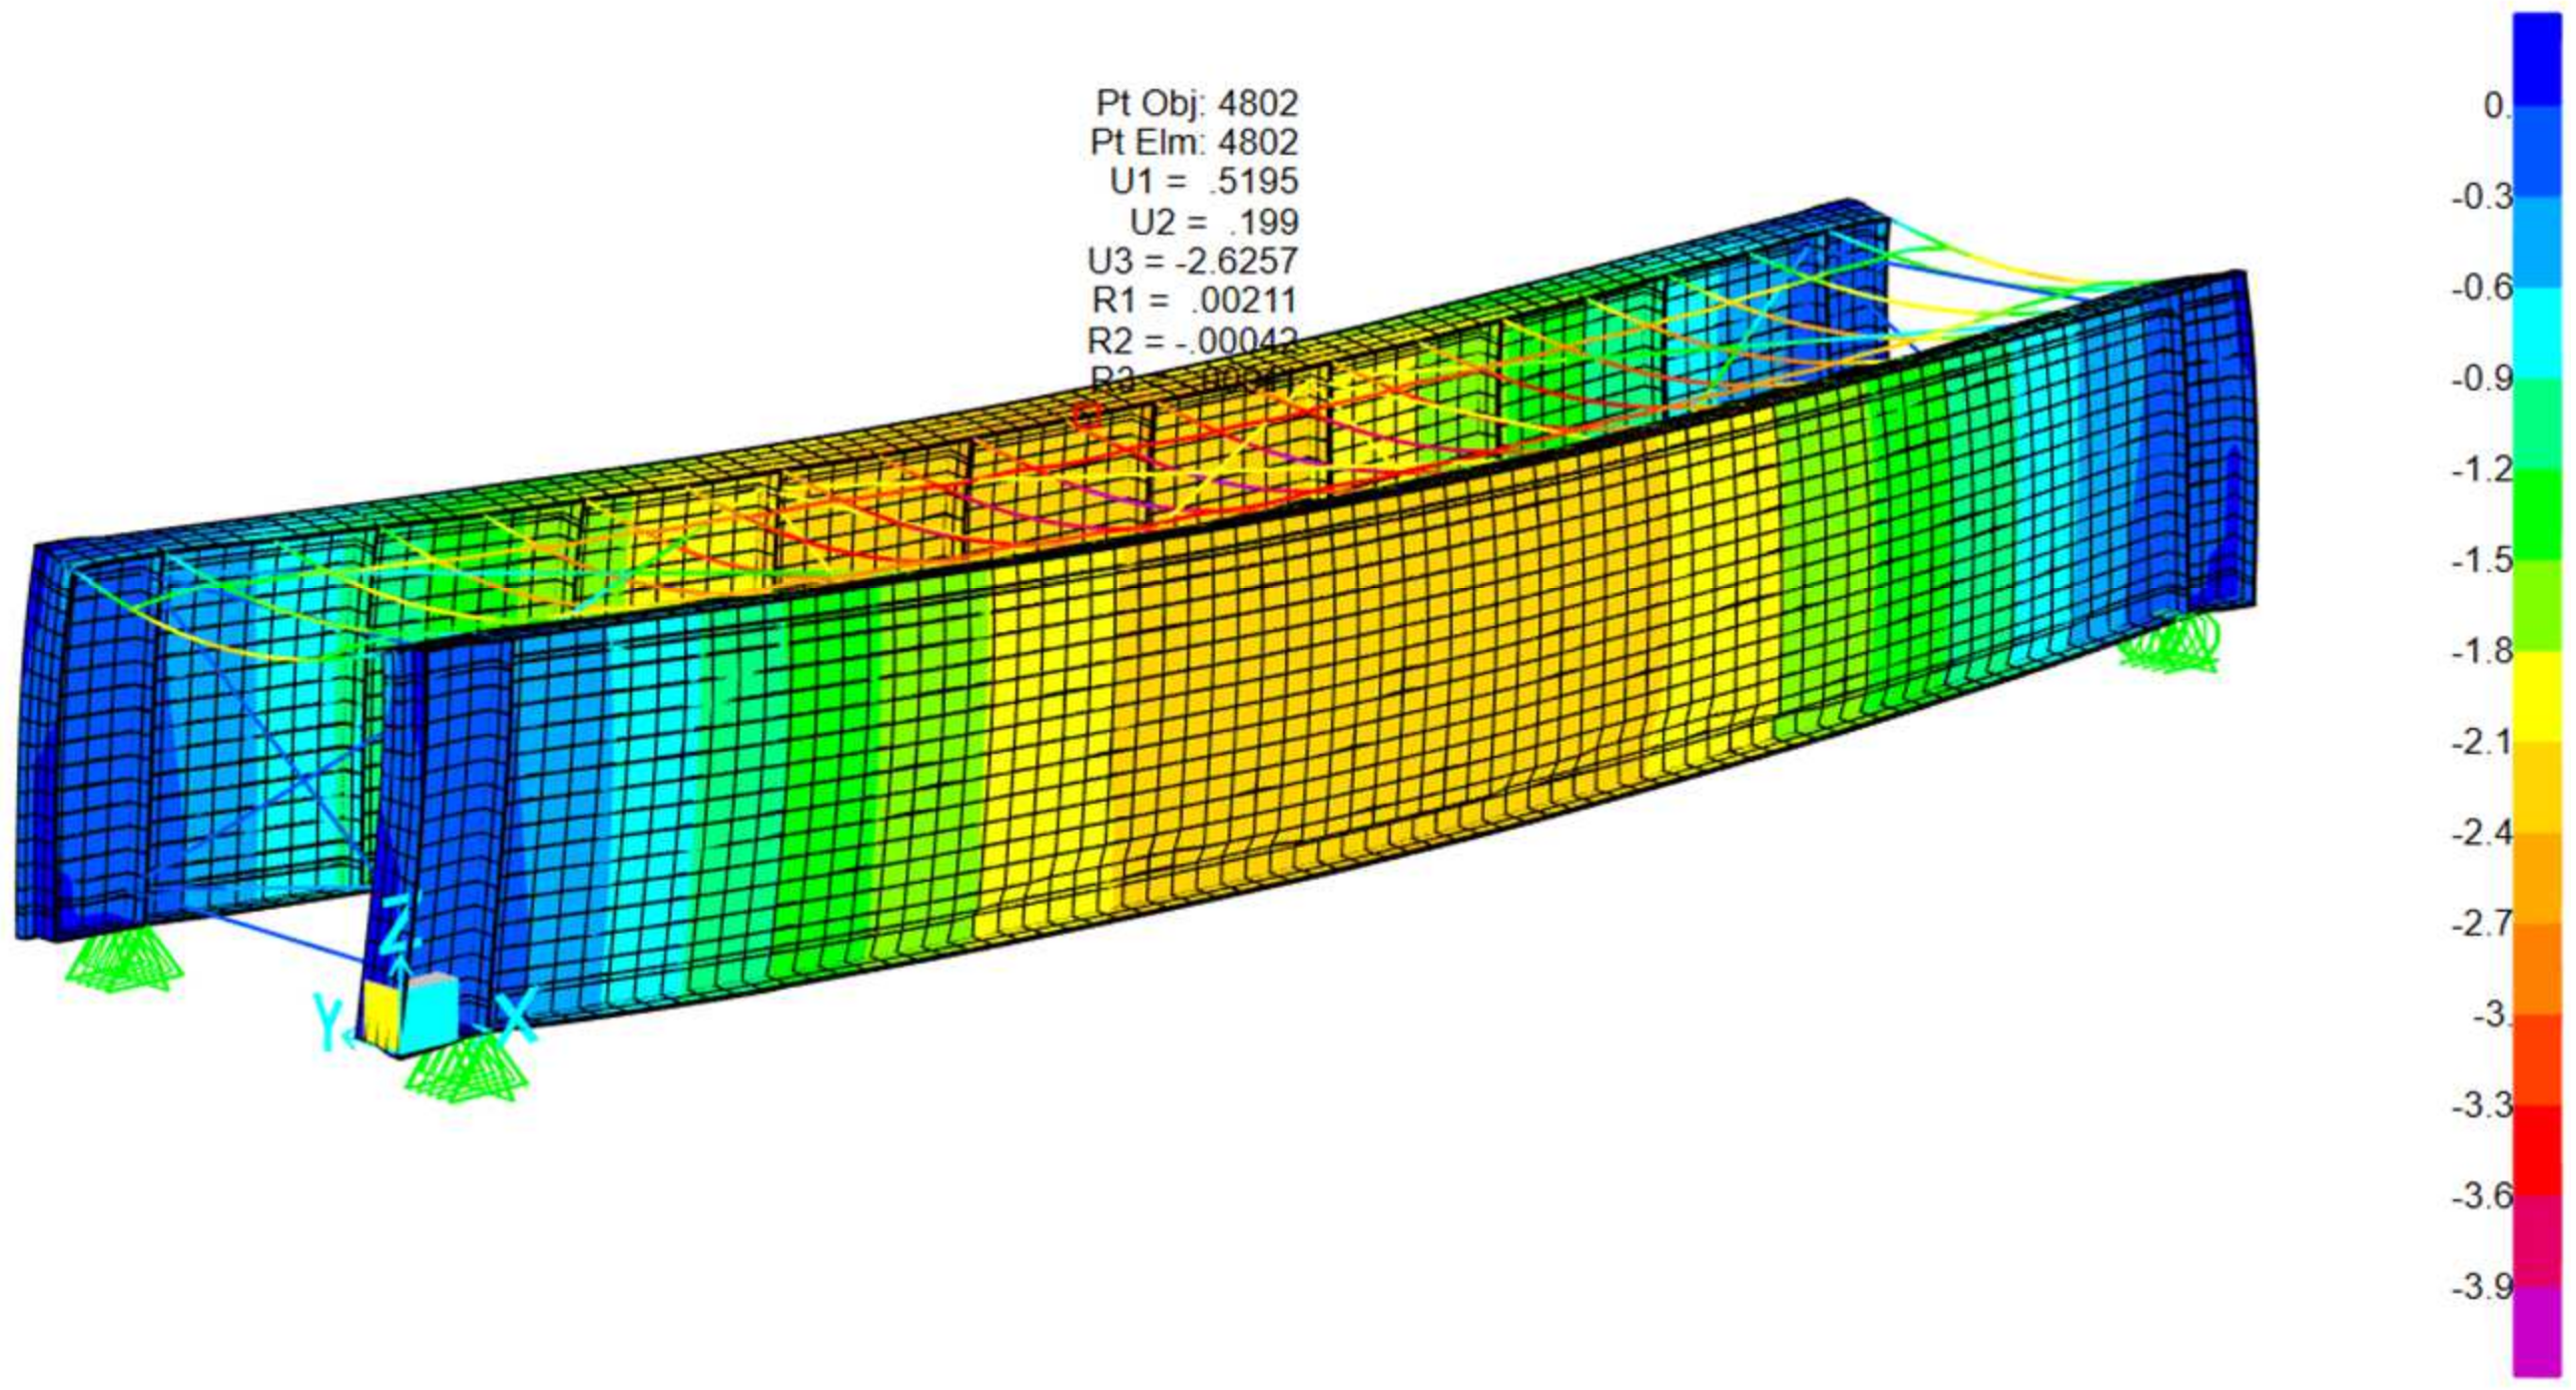
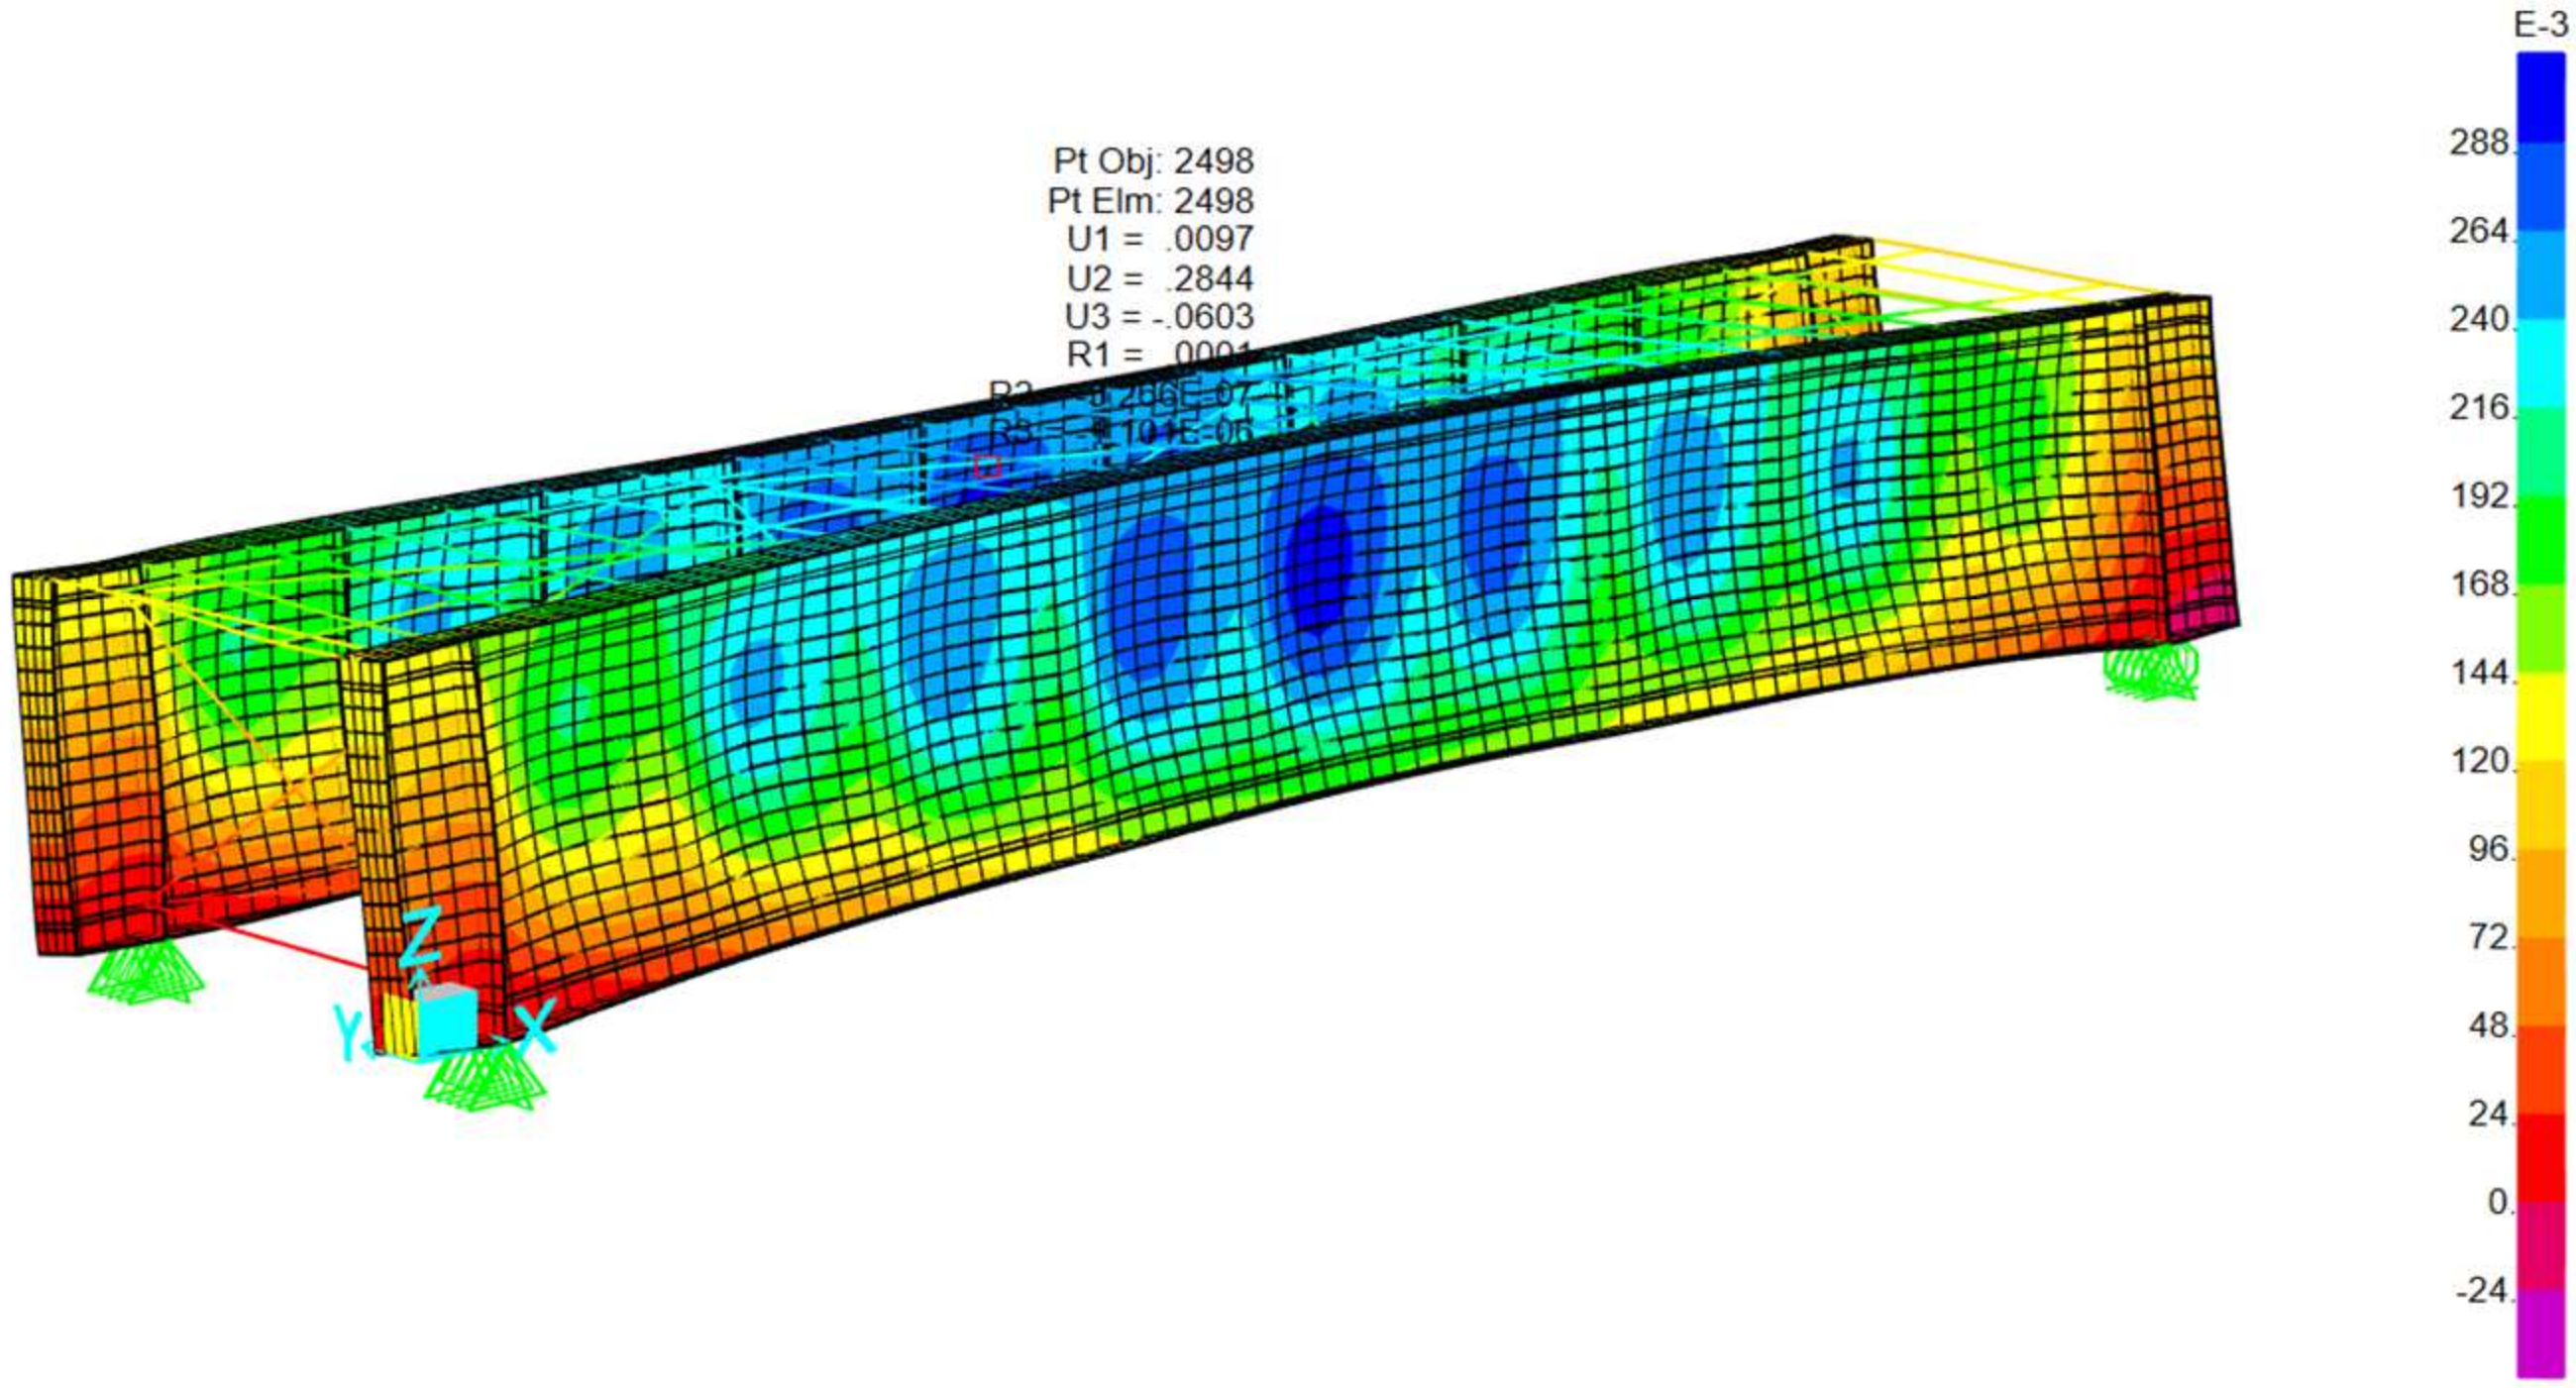
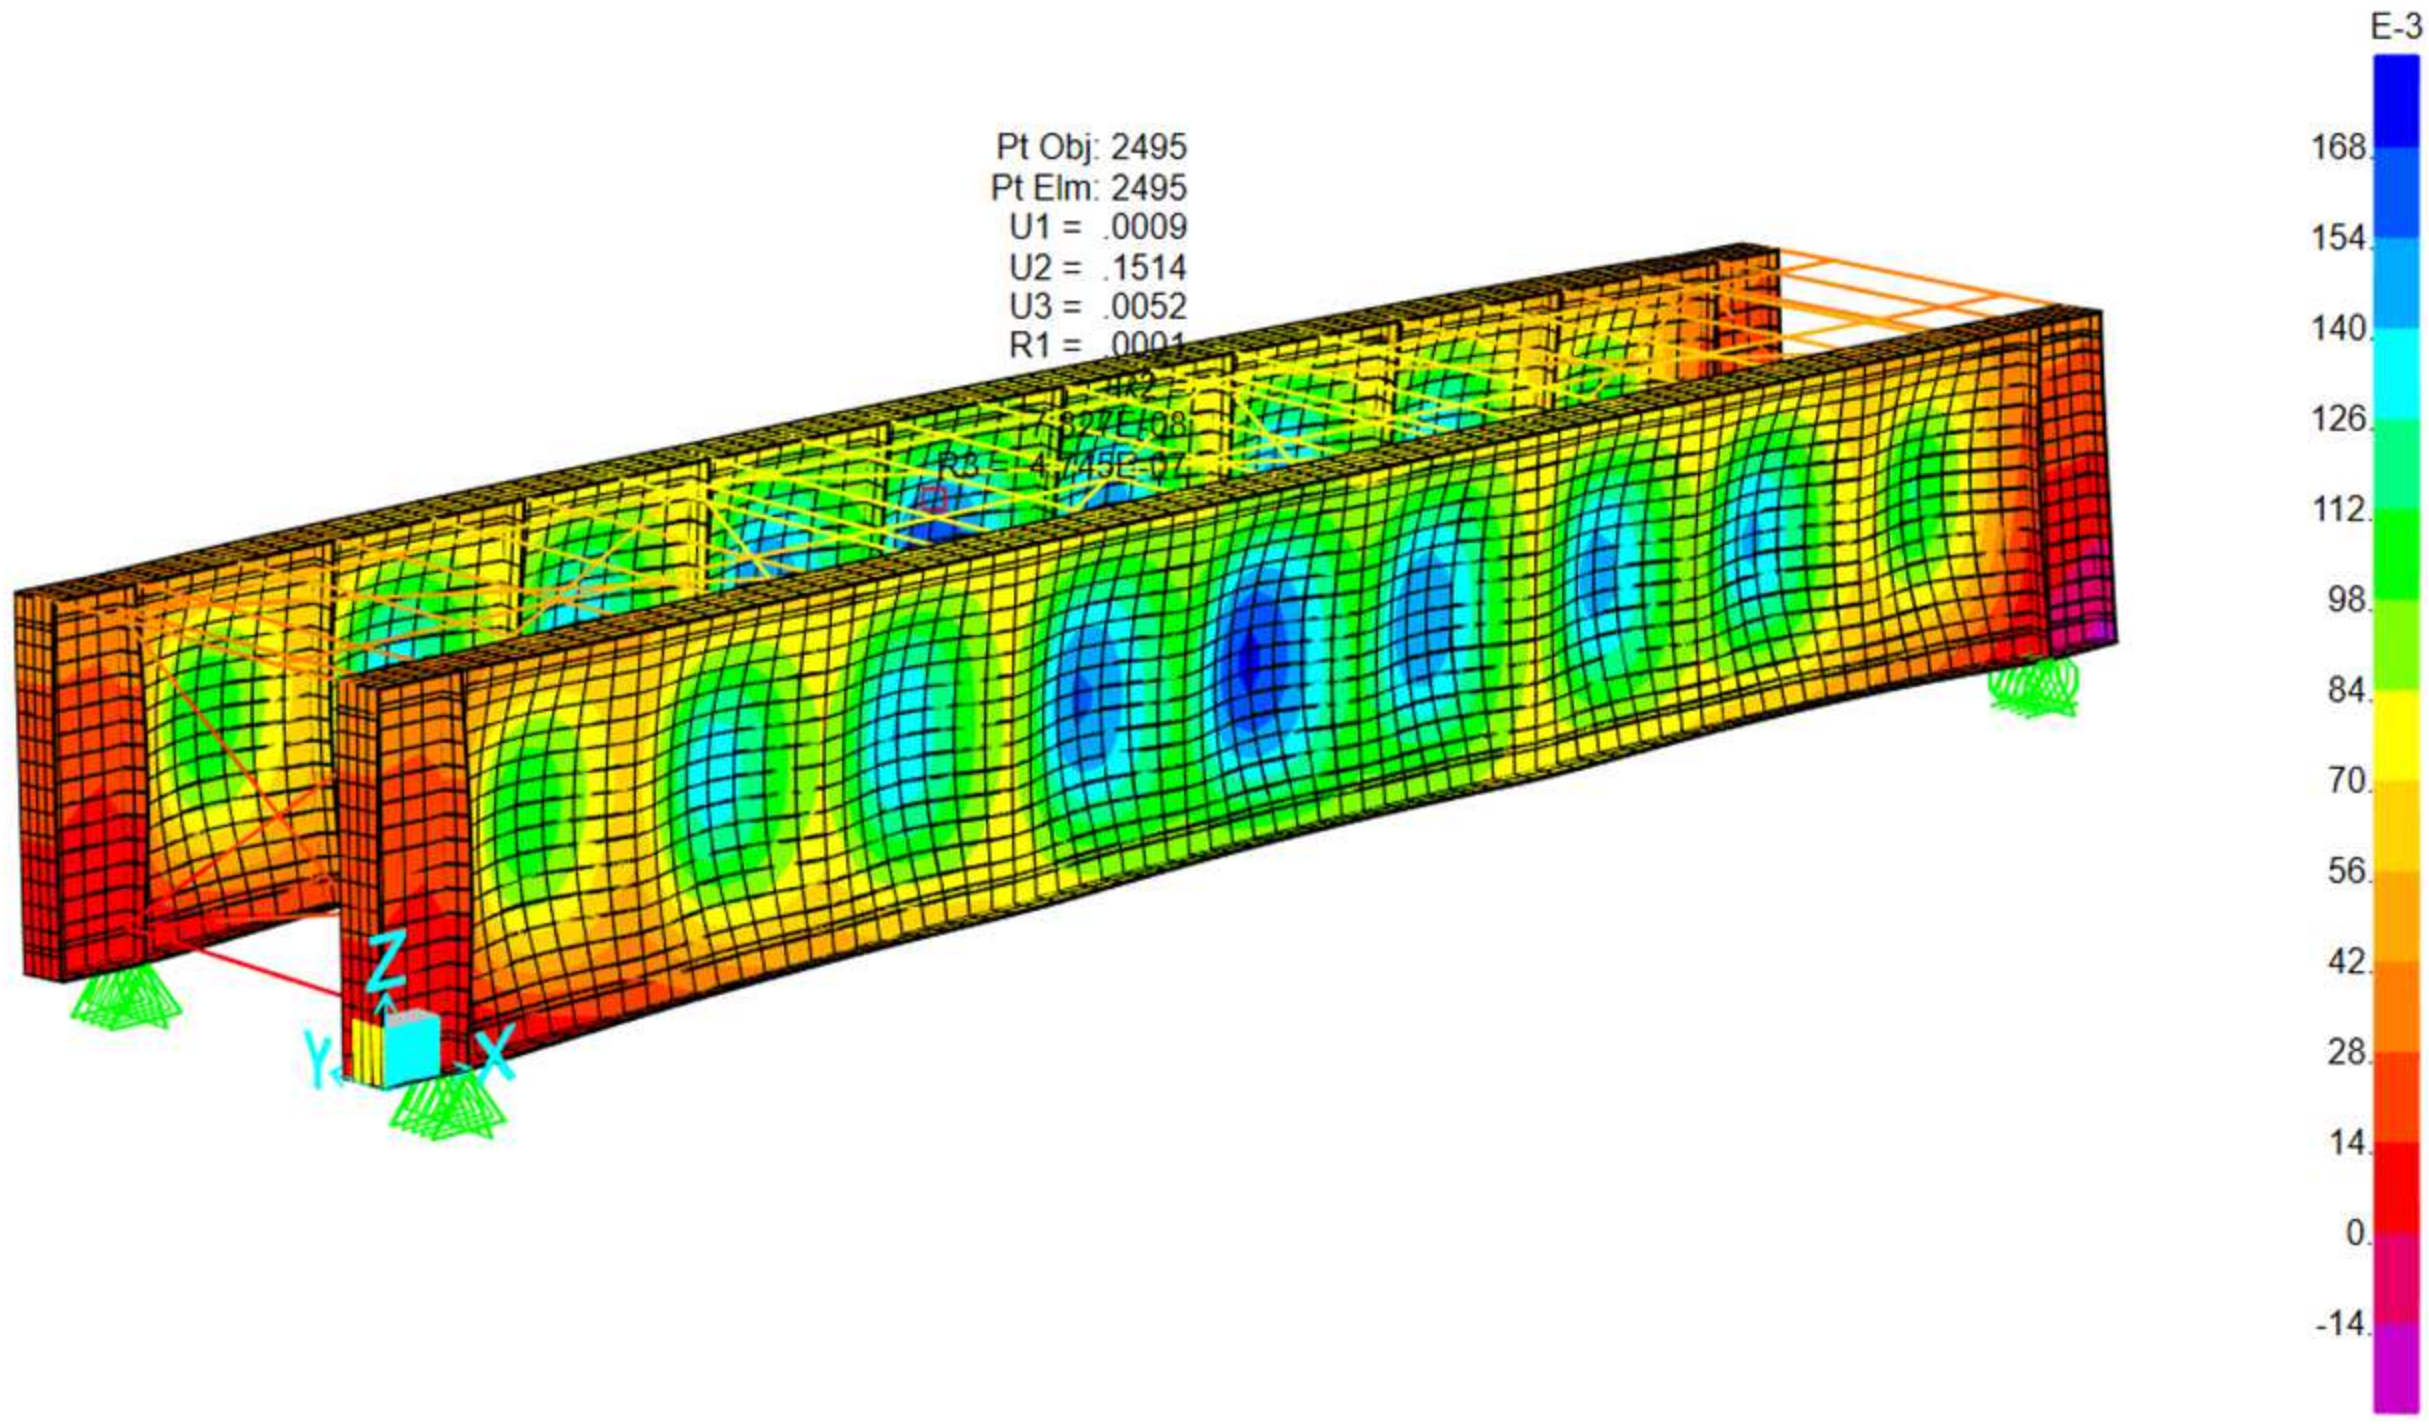
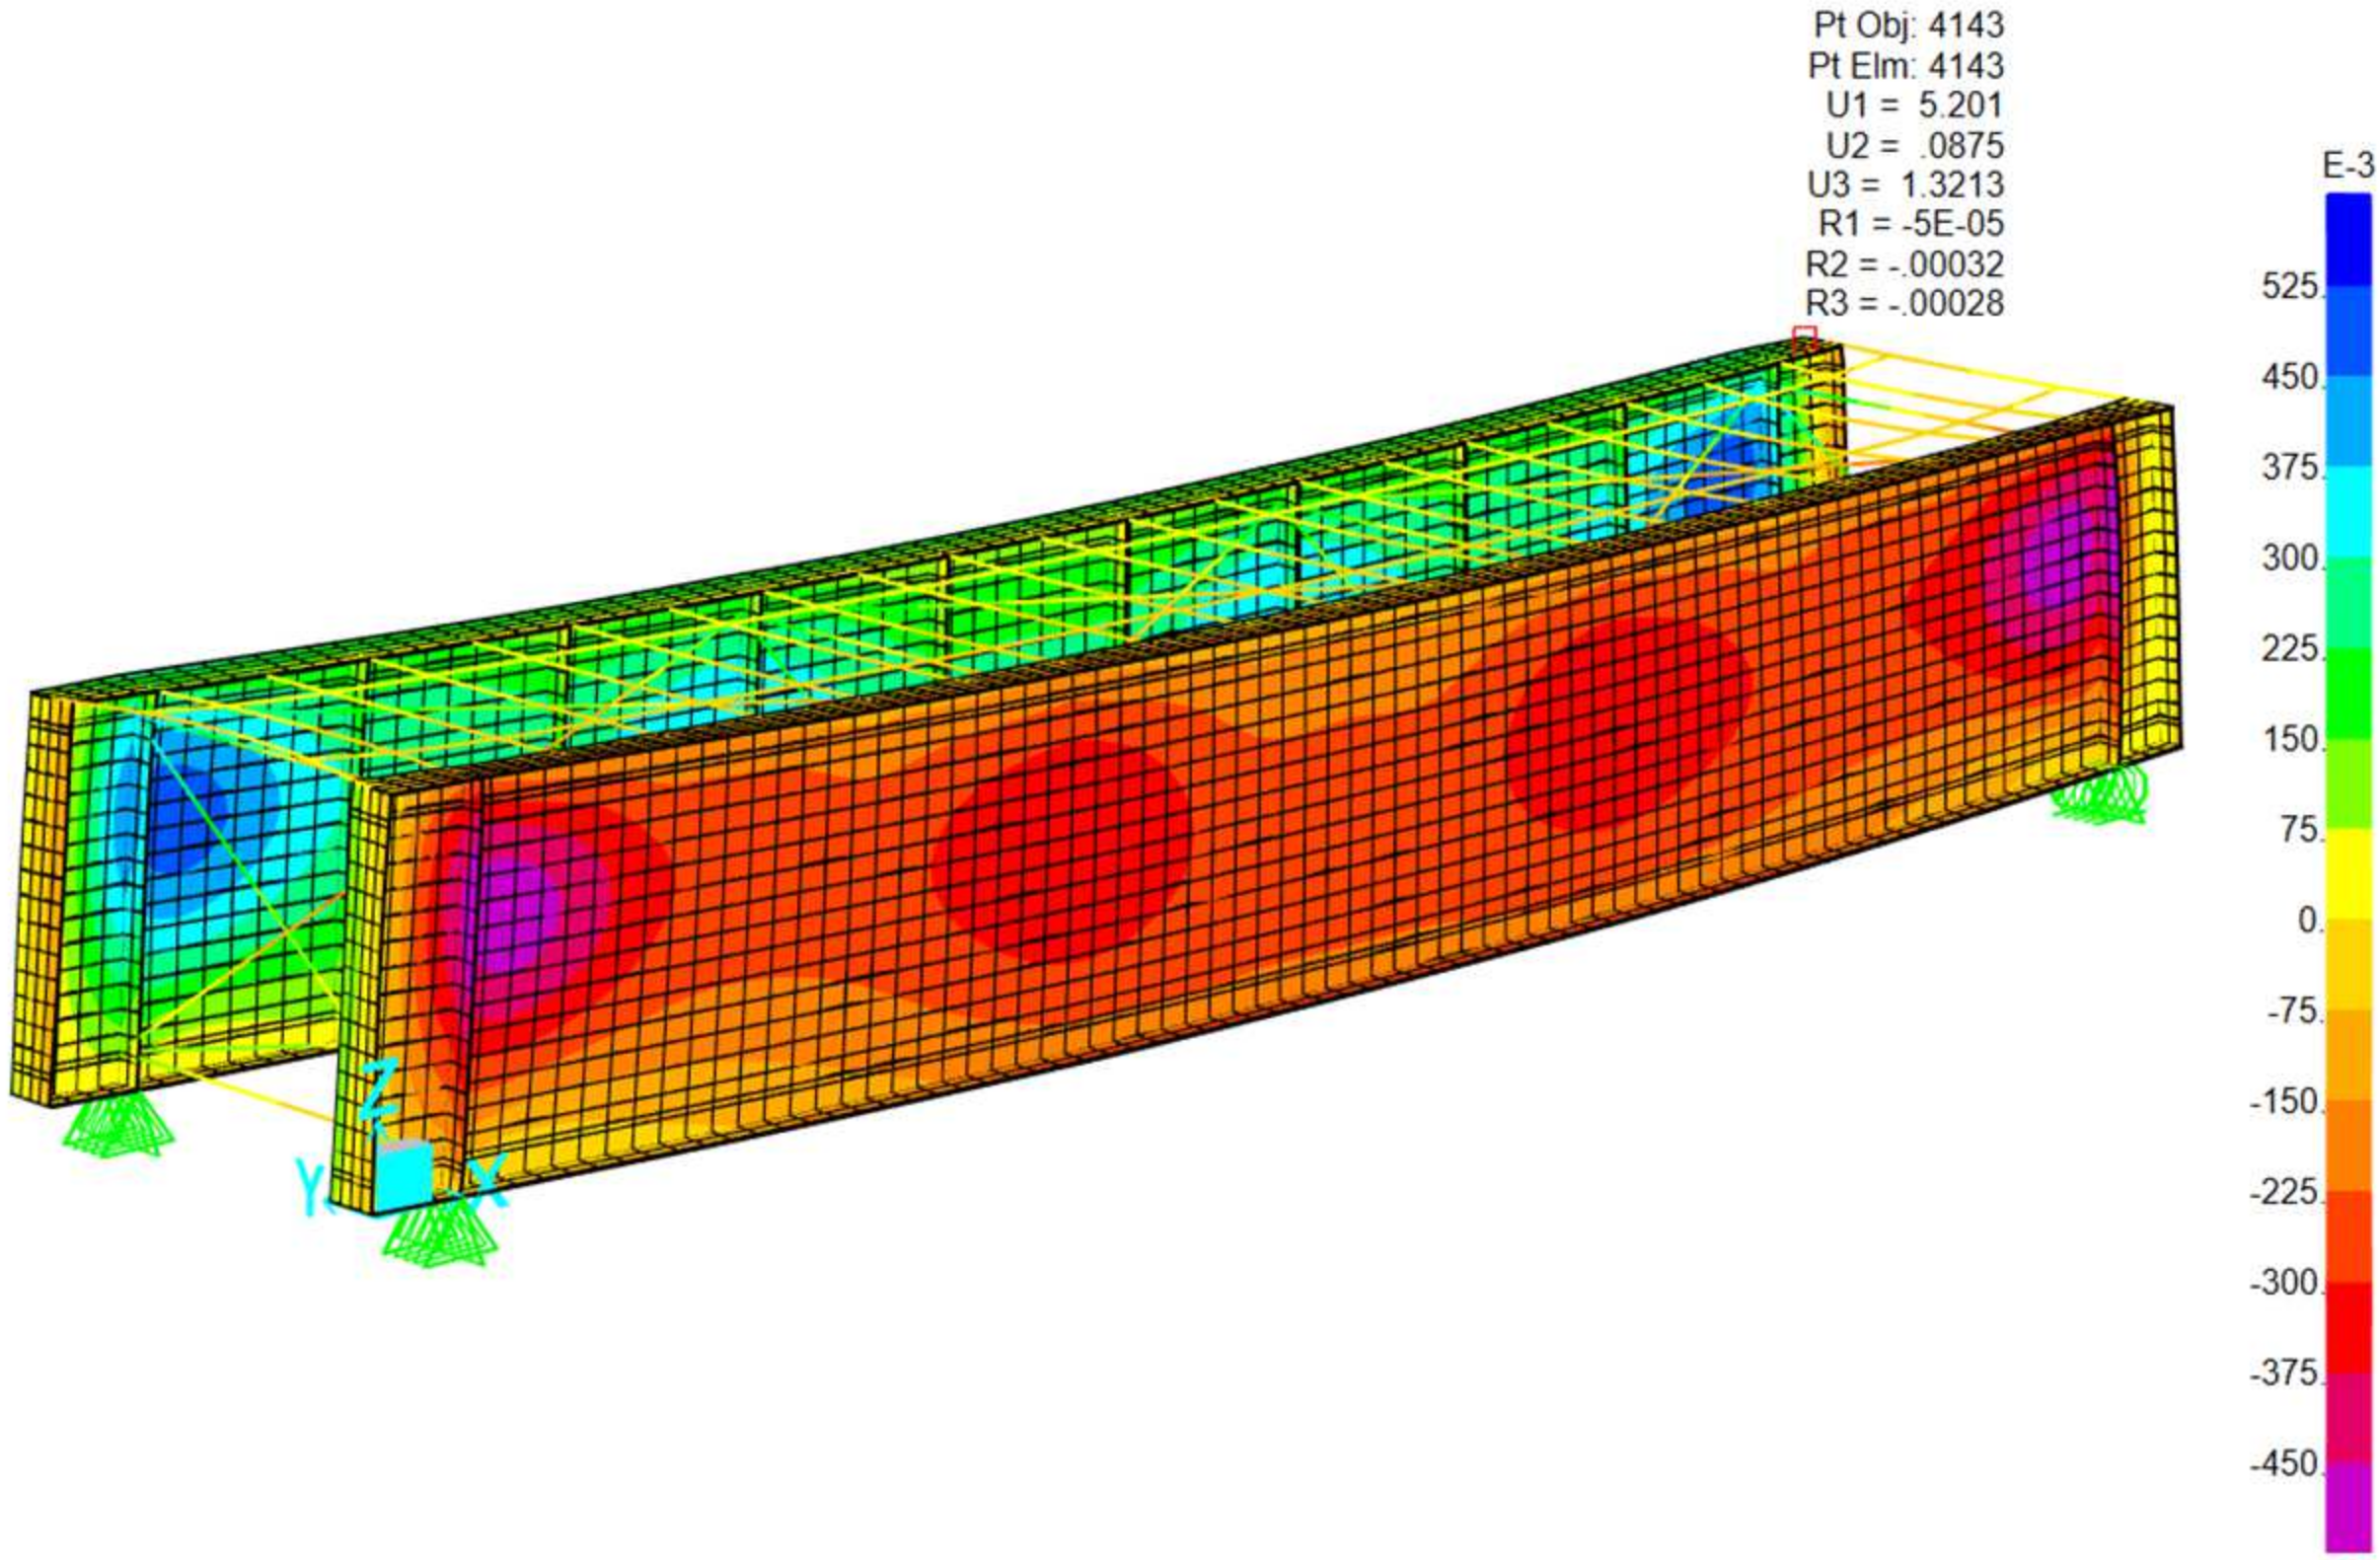
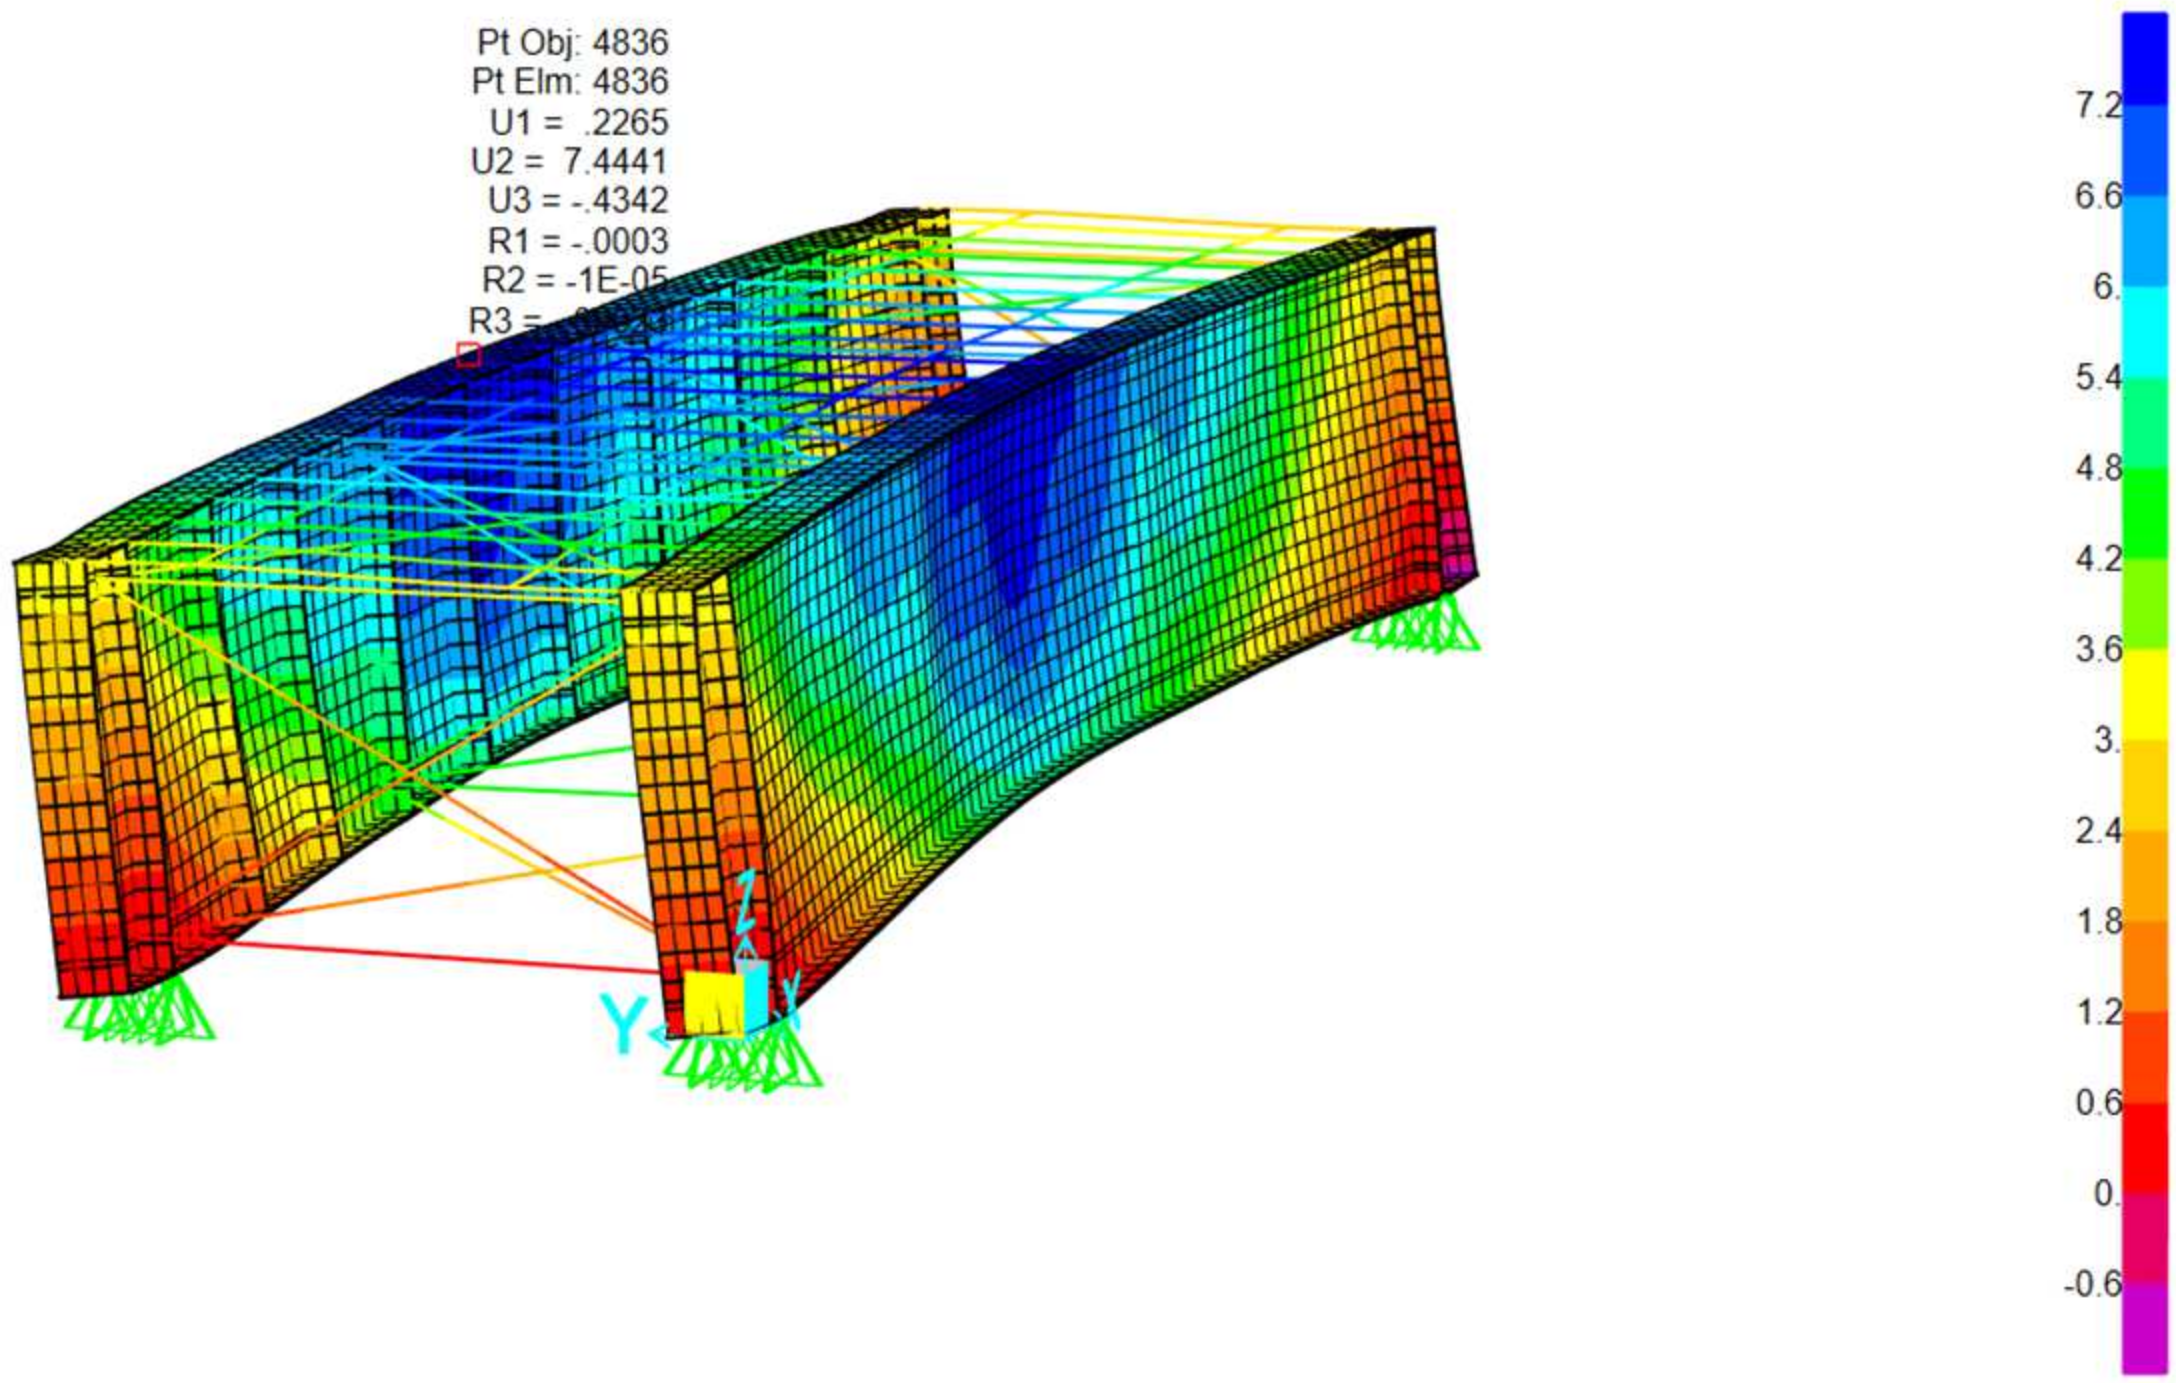
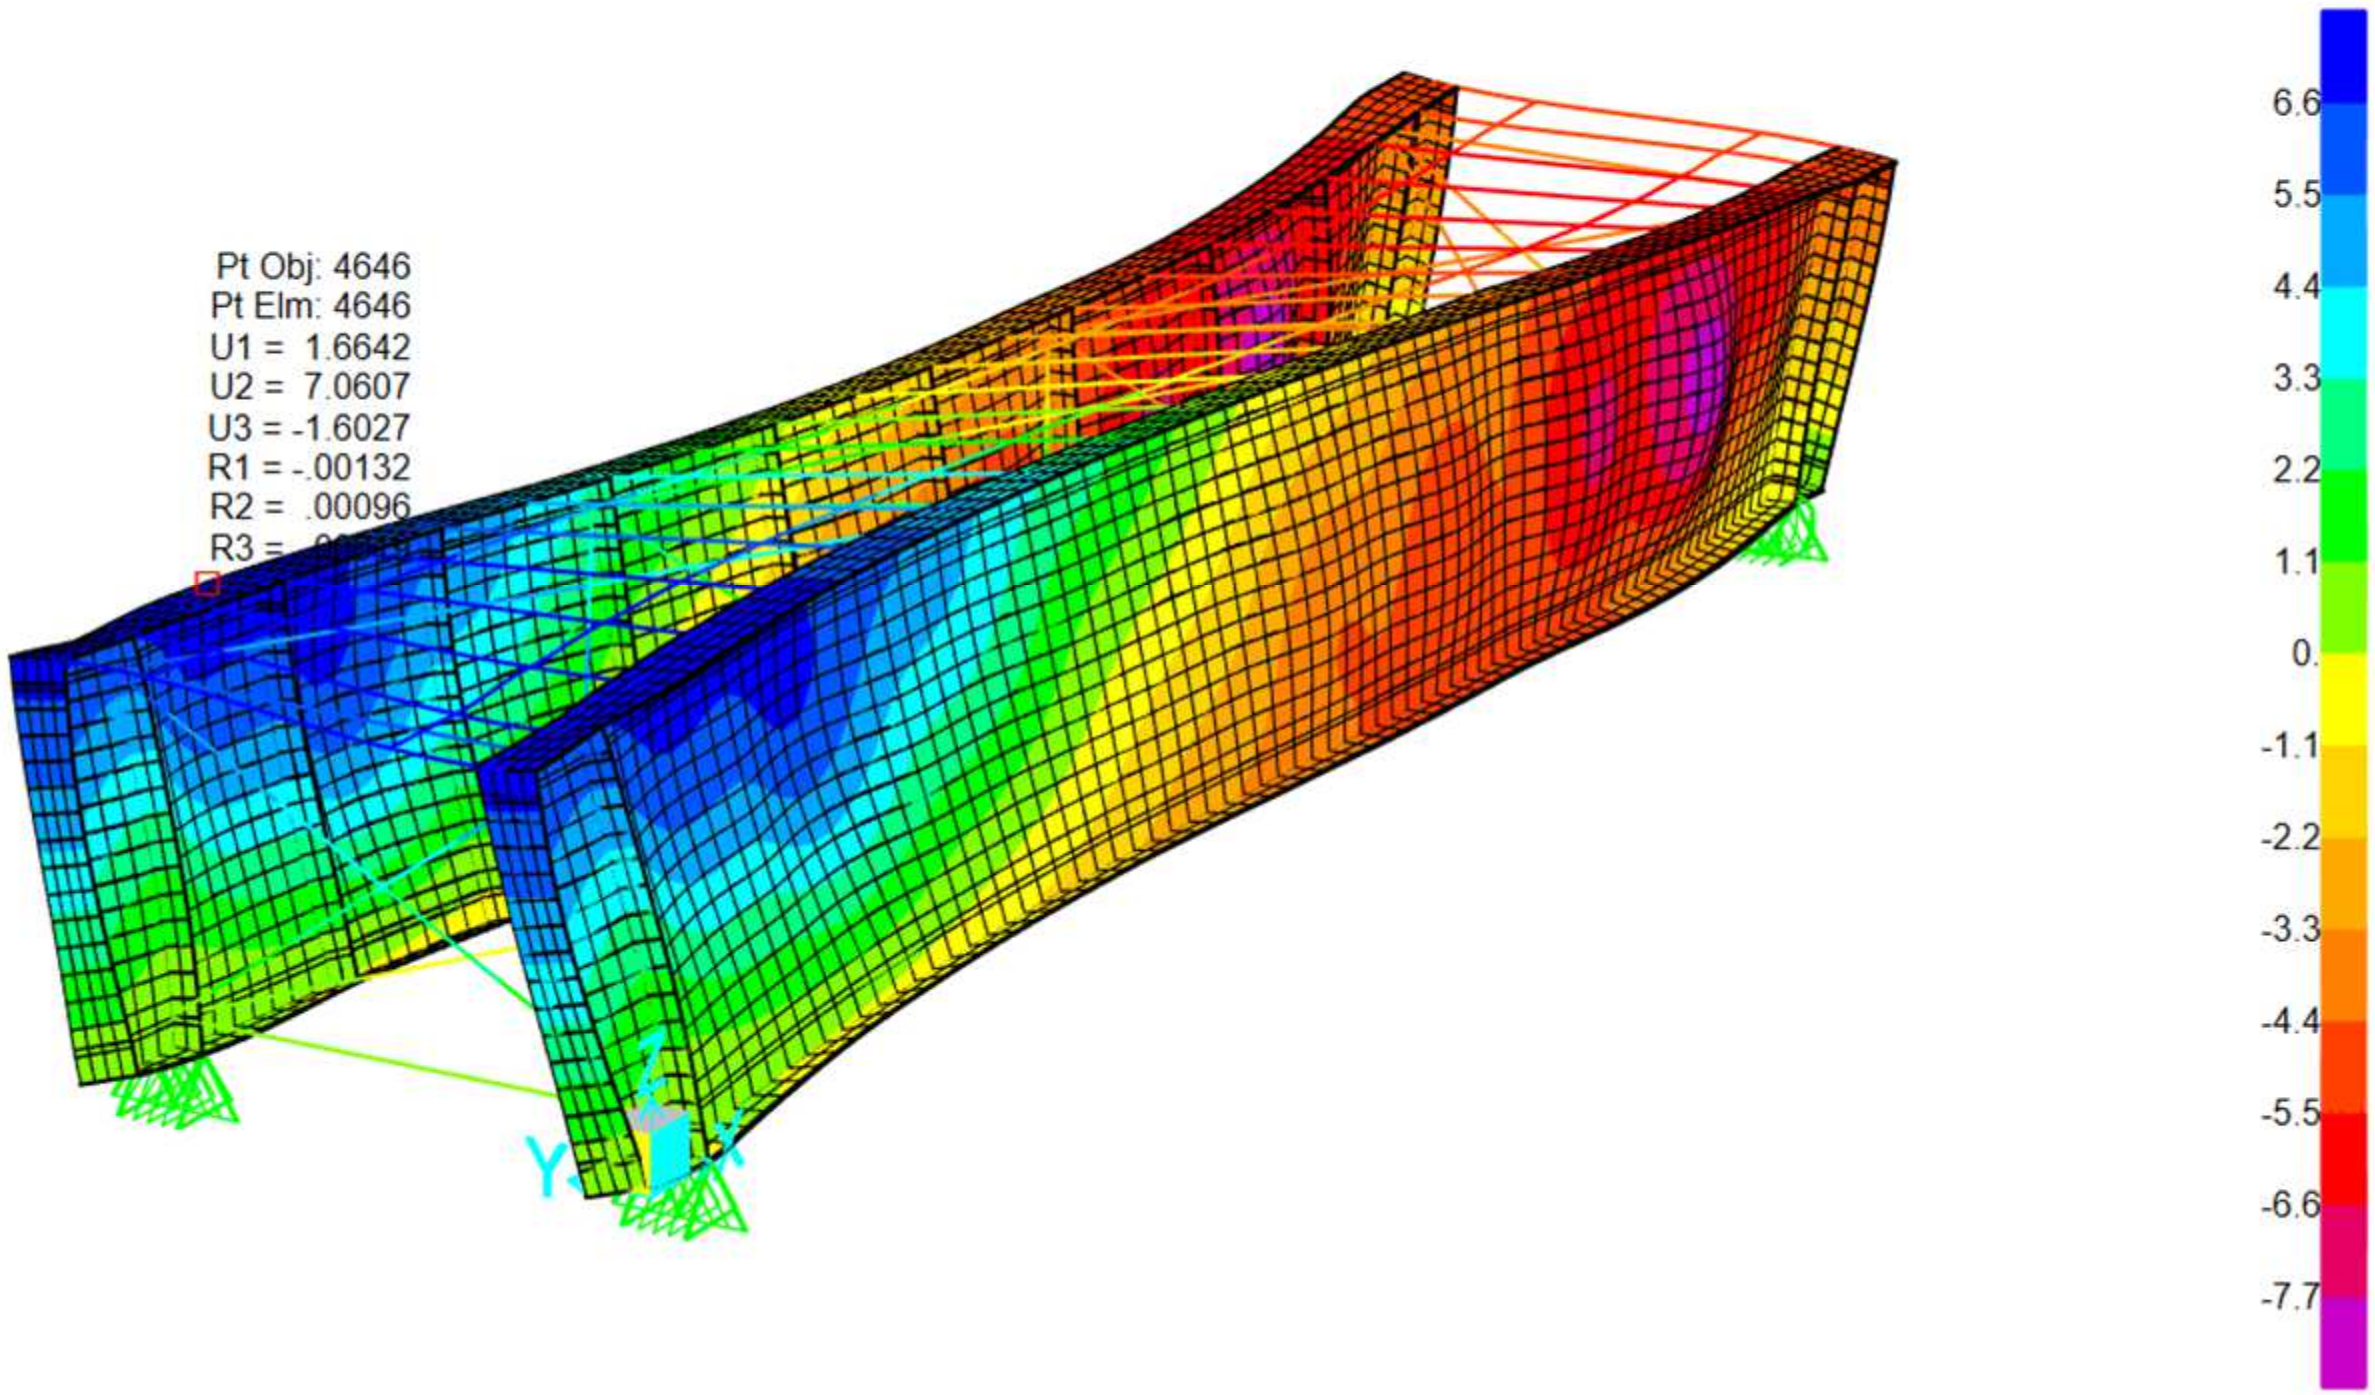
The image presents a 3D finite element model of a rectangular steel-framed structure representative of a railway bridge deck with a through plate girder system. Below is a breakdown of the key structural components: Vertical elements: main structural steel girders. Top horizontal members: timber beams. Diagonal braces: represent lateral bracing systems designed to resist shear forces and lateral loads such as wind and seismic effects. Mesh surfaces represent diaphragms contributing to overall stiffness. Regarding boundary conditions, the support symbols at the base indicate pinned supports, simulating the restrained conditions typically found at girder bearings. The following sections illustrate the various loading conditions applied to this type of railway bridge cross section, including: self-weight and permanent load, load live, E40, 60,80 Cooper—live load, 286 K live load (Hopper), loaded and unloaded transverse wind, load Temperature load and seismic loads. Refer to Figure 27, Figure 28, Figure 29, Figure 30, Figure 31, Figure 32, Figure 33, Figure 34, Figure 35, Figure 36, Figure 37, Figure 38 and Figure 39 for detailed visualization of these loading conditions:
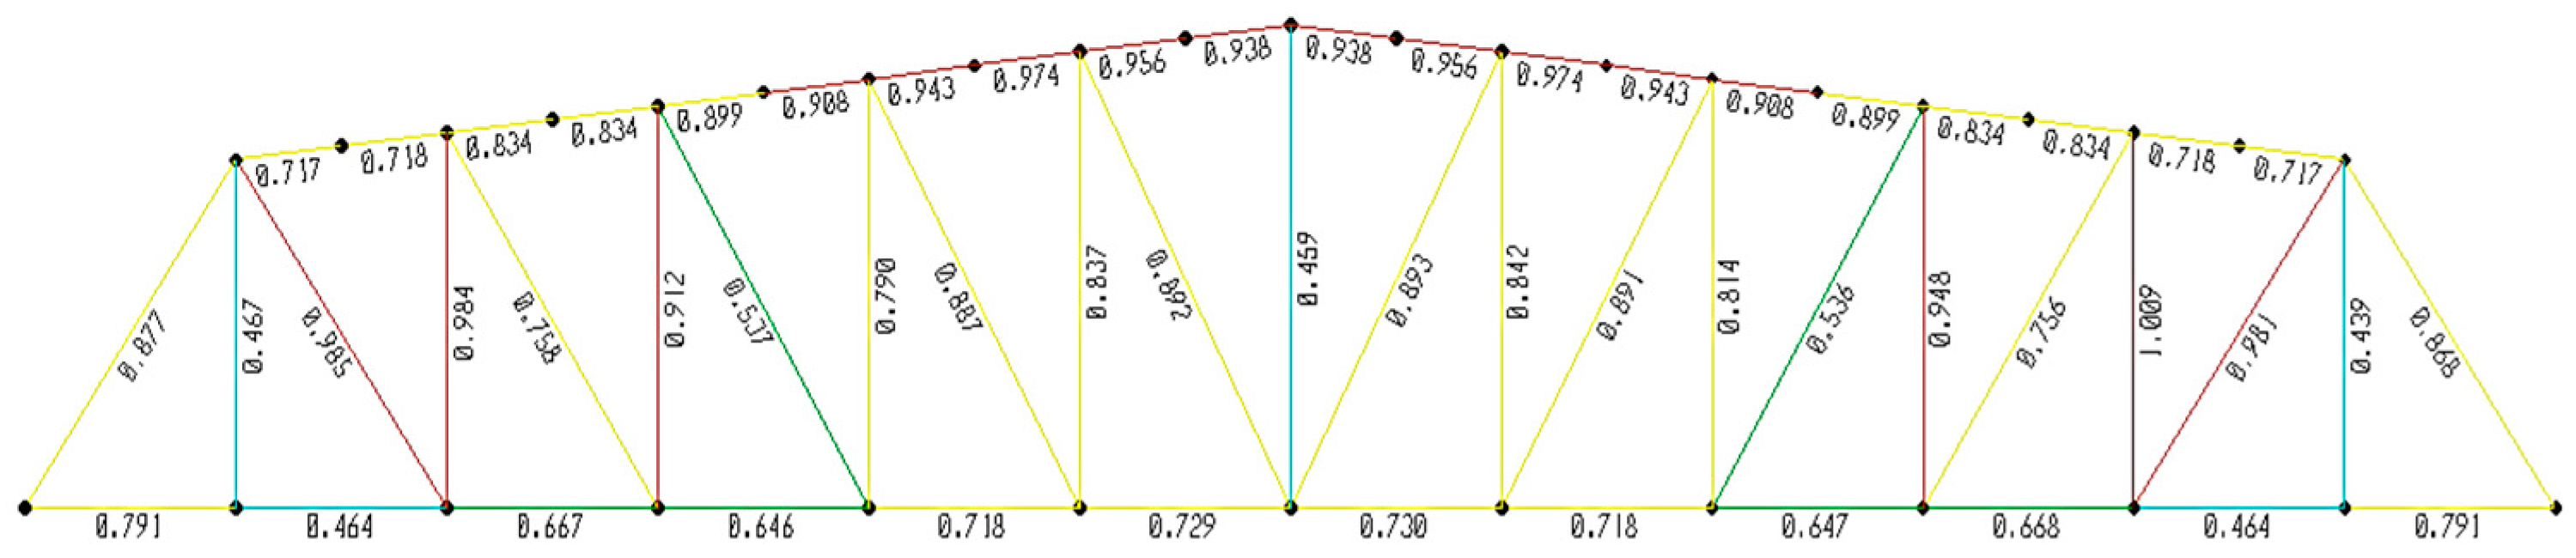
The truss bridge has the highest natural frequency (3.06 Hz), which makes it less prone to resonance with the typical frequencies of the forces generated by trains. This structure is highly efficient in load distribution, which results in greater rigidity compared to the TPG and DPG configurations, as seen in Figure 27, Figure 28, Figure 29, Figure 30, Figure 31, Figure 32, Figure 33, Figure 34, Figure 35, Figure 36, Figure 37, Figure 38 and Figure 39.
The allowable stresses used in normal ratings are determined as per AREMA Chapter 15, Section 7.3.1.1 [2]. Allowable stresses are calculated using the procedure described in Section 1. Introduction, which is based on AREMA Chapter 15, Table 15-1-11 [2]. The allowable stresses calculated for a normal rating are summarized as follows in Table 11:
The allowable stresses used in the maximum rating are as per AREMA Chapter 15, Section 7.3.1.2. AREMA Chapter 15, Section 7.3.3.3 and Table 15-7-1 [2] provide the allowable stresses for the maximum rating. The allowable stresses calculated for the maximum rating are summarized as follows: see Table 12.
In order to assess the structural stresses, to determine whether the different elements of the bridge (beams, transverse, longitudinal) can withstand each type of equipment load and to identify the most affected elements according to the types of loads, inspections, maintenance and rehabilitation can be prioritized: see Table 13.
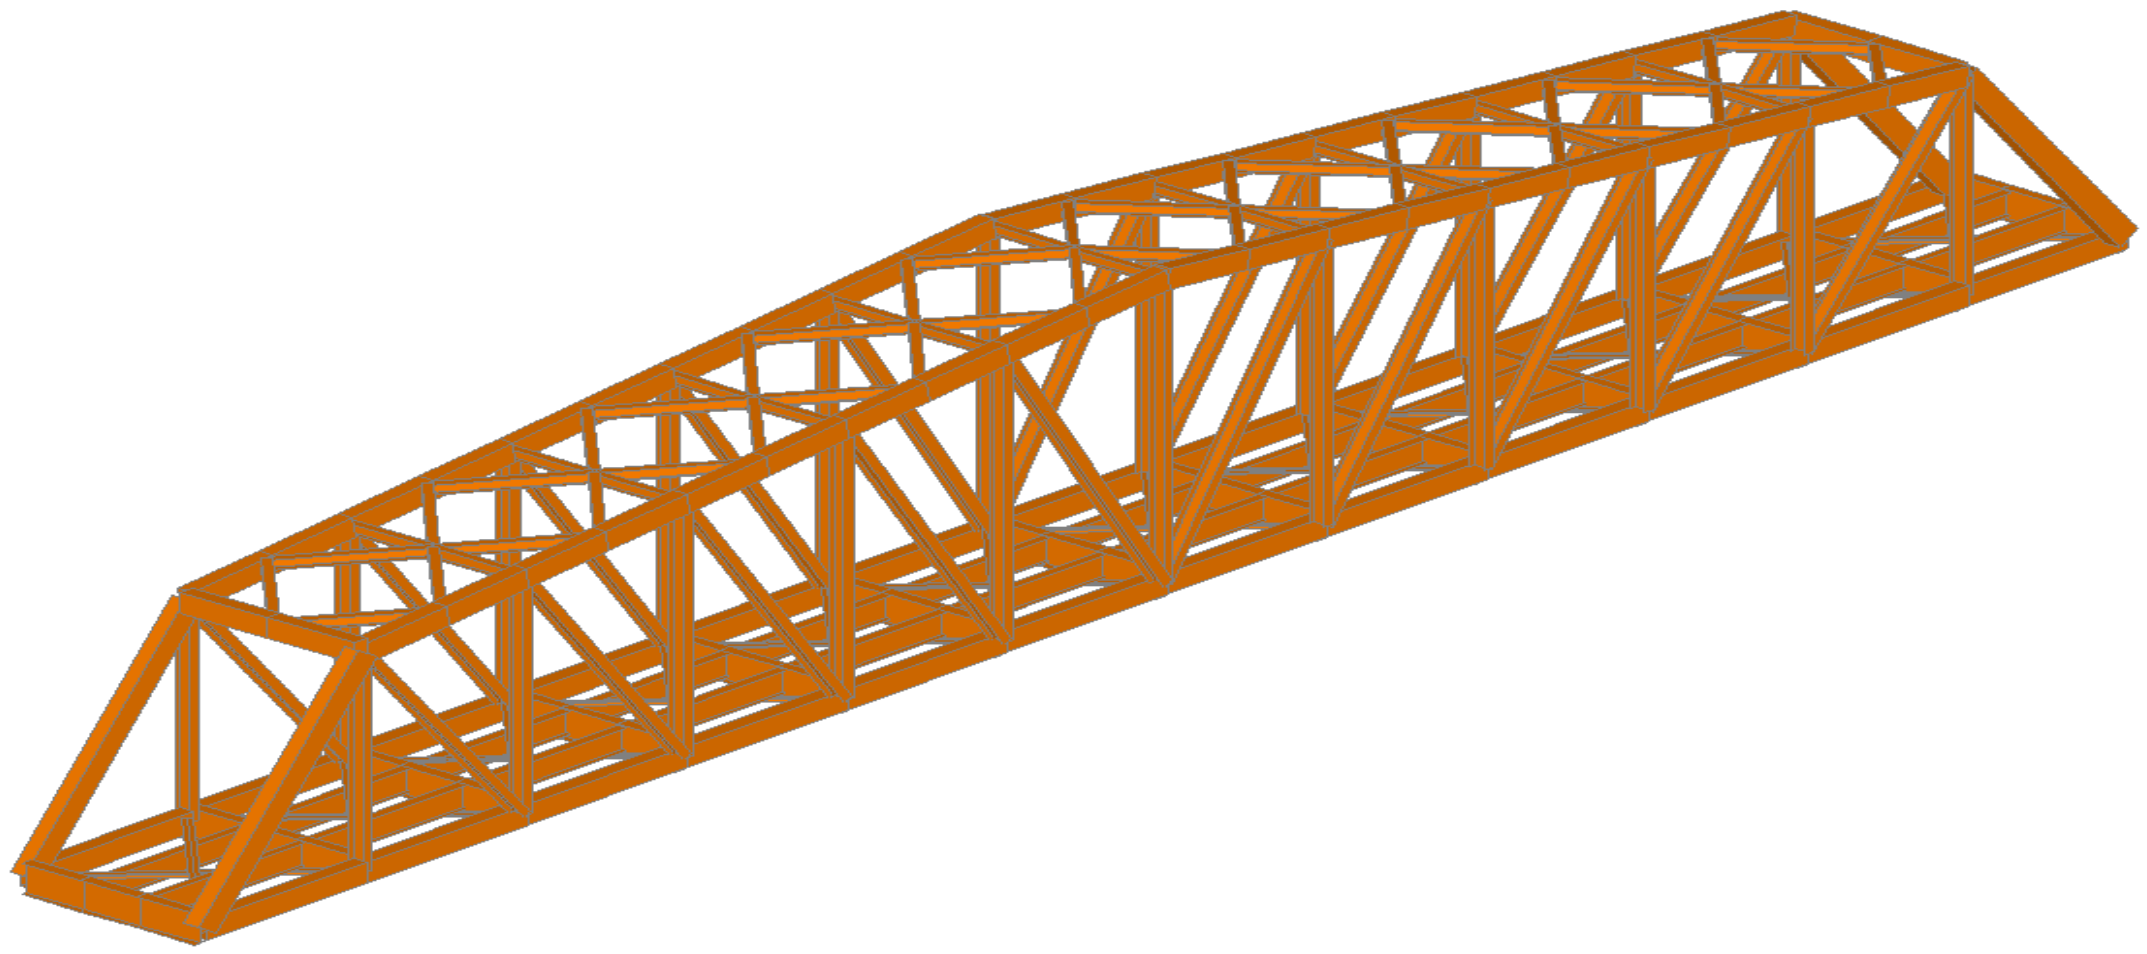
The three-dimensional modeling of the structure “Infiernillo Bridge” has been carried out considering the truss section with an upper deck and another section of the DPG beam. This structure has been subjected to the E-Cooper E-40, E-60 and E-80 loads in addition to the locomotives and wagons used for the FCCA and Southern Railway, such as the C38-9 and GT42 locomotives, and the 268 K and 286 k wagon loads. See Figure 40.
The detailed results for the rating of bridge members and equipment is presented for DPG bridges that have the capacity to support the 268 K, 286 K, GT42 and C38-9 railcars and locomotives at 60 kph under normal and maximum rating criteria from AREMA. Fatigue stress is not a concern, as the amount of traffic is less than the AREMA determine threshold for these lines railroad in Peru. The minimum normal rating for bending is E 67.7 for the floor beam, while the maximum equipment load for bending is E 60.3 for the 286-k car. The above rating analyses are based on inspections and calculations. See Table 14.

4. Discussion

The steel structures comprised variable sections of longitudinal and transverse girders and main plate girders with important depths and truss elements. Transverse girders connected to longitudinal beams with sections varying between 450 cm in width and 0.9 to 1.2 m in depth. The longitudinal beams were supported at each span by rectilinear elements placed on steel piers, which could rise up to 15 m in height.
Special attention was given to the dynamic behavior of these bridges, particularly due to their large spans and the challenging rheological conditions in Peru. Spatial analysis models were used to simulate train passages at speeds up to 60 km/h, and the maximum acceleration under moving loads was calculated to be 1.958 m/s2, well below Peruvian standards recommendations in RNE-E.030 [21] limit of 0.3 g. This outcome supports the notion that optimized construction methods and materials can lead to significant cost savings without compromising the safety or performance of these bridges.
Regarding the bending capacity, the minimum normal rating for the floor beam was found to be E 67.7, indicating that the beam can safely handle typical loads without exceeding the design limits. In contrast, the maximum equipment loads for bending, which corresponded to the 286 K railcar, resulted in a rating of E 60.3, indicating that while the bridge can support these heavier loads, there is a smaller margin when compared to normal loading scenarios. This highlights the importance of closely monitoring the bridge’s load conditions and considering periodic maintenance or reinforcements if future traffic levels or loads increase.
The evaluation of the DPG bridges revealed that they were structurally capable of supporting the designated railcars, including the 268 K, 286 K, GT42 and C38-9, operating at 60 km/h. This capacity was ensured under both normal and maximum rating criteria, making the bridges sufficiently robust for the current operational conditions. The analysis demonstrates that the current traffic volume is significantly below the AREMA threshold, which is why fatigue does not pose an immediate concern for the bridge structures.
The evaluation of various bridge types revealed that through plate girders (TPGs) required larger girders to manage the concentrated E-Cooper load, resulting in significant bending and shear forces. Their dynamic amplification factor (DAF) was high due to limited lateral stiffness, and fatigue was a concern at the welded connections. These bridges were more prone to fatigue failure unless extensively reinforced, and their ability to handle cyclic loads and vibrations was limited. In contrast, deck plate girders (DPGs) provided better load distribution, reduced dynamic amplification and improved lateral stiffness, lowering the likelihood of fatigue. They required less reinforcement than TPGs, and although the material costs were higher due to the larger deck area, they offered easier maintenance. Truss bridges (TTGs and DTGs) efficiently distributed axial forces, resisted dynamic amplification and had excellent fatigue performance due to their high rigidity. They were ideal for heavy traffic and high-speed trains, though their initial cost and maintenance complexity were higher. Overall, while these bridge types each had distinct advantages and challenges, their performance was more influenced by their design and material choices than by their construction era.
This analysis is based on a series of thorough inspections, which ensure that the structural integrity and load-bearing capacity of the bridges are well understood. However, continued monitoring and maintenance are essential to ensure long-term safety and operational efficiency, particularly if traffic patterns or the weight of railcars change over time. This approach allows for proactive decision-making regarding potential upgrades or reinforcements to maintain bridge reliability.
Given that the speed of trains and the potential evolution of traffic were crucial factors in determining the durability and safety of railway bridges, selecting the E-60 Cooper load during the initial phase is a prudent decision. The E-60 load offers a significant safety margin against higher dynamic loads, especially if future projections indicate an increase in heavy or high-speed train traffic. While the E-60 load is sufficient for current traffic conditions, choosing it ensures that bridges are prepared to withstand not only the existing loads but also additional stresses from increased speeds (up to 60 km/h) and traffic volume. This proactive approach can help extend the infrastructure’s service life and reduce the need for early rehabilitation.

5. Conclusions

Railway engineering in the country is important due to the proposals for the expansion of the national rail network, but still presents some important deficiencies such as a lack of regulation, standards and professional specialization in the railway industry. Therefore, this research seeks to establish a knowledge base and a technical guide for analysis procedures and for verification of the bearing capacity of existing railway structures and their suitability for subsequent technical studies.
Analyzing these types of problems allows us, for example, to consider four (4) railway structural cross section typologies (DPG, TPG, DTG and TTG) that present a certain level of complexity in optimizing materials and present complex solutions in the different railway corridors in the Peru. As a counterpart to this, achieving results with greater precision is becoming increasingly necessary, and these results have been obtained using the finite element method (FEM) criteria through SAP2000 software, edition 2024 by incorporating the deficiencies identified in the visual inspection reports.
The strategy must emphasize the integration of cutting-edge tools such as finite element modeling (FEM) and advanced materials for rehabilitation. Continuous professional development for maintenance personnel ensures the application of the latest diagnostic tools and practices. Significant results were obtained which allowed for the verification of the load-bearing capacity of these structures in compliance with the E-cooper loads from the AREMA standard 2023 [2], such as E-Cooper E-40, E-60 and E-80 loads. This includes considerations for 268 K and 286 K as well as the copper concentrate container wagon loads on the Central and Southern Railways, such as the GT42 and C39-8 FFCA locomotives.
The railway bridge maintenance strategy for Peru must be focused on ensuring safety and optimal performance by combining preventive, predictive and corrective maintenance. Regular inspections are critical, with comprehensive assessments performed annually and more frequent inspections in high-stress or extreme environments. Advanced technologies, such as real-time monitoring systems, drones and vibration sensors, could be employed to detect early signs of wear, predict potential failures and enable sustainable maintenance. Many of the railway bridges in service are deteriorating due to physical and chemical aging, as well as excessive deformations caused by the increase in live loads, the greater frequency of loads, and problems related to the deterioration of some elements in different structures. However, many of these structures still maintain good structural behavior.
Regarding resistance and deflection, the bridges comply with the criteria of resistance and deflection under the E-60 load. DPG, TPG and truss bridges are suitable for a maximum span of 40 m under E-60 loading and of 75 m for truss bridges, provided that appropriate inspection and maintenance plans are implemented. The maximum operational speed should be limited to 60 km/h, and some structural elements may need replacement. Additionally, reinforcement using cover plates and corrosion protection measures should be considered to extend the lifespan and improve the structural integrity of the bridges.
In summary, if train speed is an important factor and if heavier or faster traffic is anticipated, E-60 loading would be the best option to ensure the long-term durability and safety of these bridges. For the greater implementation of this load, a program of reinforcing the superstructure and infrastructure will be necessary in many of these structures.

Author Contributions

Conceptualization, J.Z.; methodology, D.E.; software, J.Z.; validation, D.E. and J.Z.; formal analysis, J.Z.; investigation, J.Z.; resources, J.Z.; data curation, J.Z.; writing—original draft preparation, J.Z.; writing—review and editing, D.E.; visualization, J.Z.; supervision, D.E. All authors have read and agreed to the published version of the manuscript.

Funding

This research received no external funding.

Data Availability Statement

Data are contained within the article.

Conflicts of Interest

The authors declare no conflict of interest.

References

  1. Ministerio de Transportes y Comunicaciones (MTC). Plan Intermodal de Transporte 2004–2023. Lima, Perú. 2004. Available online: https://portal.mtc.gob.pe/estadisticas/files/estudios/Informe%20Final.pdf (accessed on 17 February 2023).
  2. American Railway Engineering and Maintenance-of-Way Association AREMA. Manual for Railway Engineering. AREMA: Lutherville, MD, USA. 2023. Available online: https://publications.arema.org/Publication/PublicationDetail/MRE23DN_4V (accessed on 25 February 2023).
  3. Ministerio de Transportes y Comunicaciones (MTC). Strategic Institutional Plan 2012–2016. 2012. Available online: https://www.mtc.gob.pe/cnsv/documentos/PEMsv%202017%20-%202021%20Fase%20Prospectiva%20final%20richter.pdf (accessed on 10 March 2023).
  4. Metrolinx. General Guidelines for Design of Railway Bridges. 2020. Available online: https://www.metrolinx.com/en/docs/pdf/board_agenda/2020-railway-bridges-guidelines.pdf (accessed on 26 May 2025).
  5. Gobierno Regional de Loreto. Estudio Definitivo del Ferrocarril Transoceánico Iquitos–Yurimaguas. 2015. Available online: https://www.regionloreto.gob.pe/ferrocarril-iquitos-yurimaguas.pdf (accessed on 26 May 2025).
  6. AREMA; NSBA. Guidelines for the Design of Steel Railroad Bridges for Constructability and Fabrication; AREMA/NSBA: Washington, DC, USA, 2024. [Google Scholar]
  7. AREMA. Practical Guide to Railway Engineering; Railway Structures; Hay, W.W., Ed.; AREMA: Lutherville, MD, USA, 2023; Railway Curves and Earthwork by C. Frank Allen. [Google Scholar]
  8. Unsworth, J. Design and Construction of Modern Steel Railway Bridges, 2nd ed.; CRC Press: Boca Raton, FL, USA, 2020. [Google Scholar]
  9. Mosleh, A.; Correia, J.; Ribeiro, D.; Rakoczy, A.M. Advanced railway infrastructures engineering. Appl. Sci. 2022, 12, 2303. [Google Scholar] [CrossRef]
  10. Ministerio de Transportes y Comunicaciones (MTC). Estudio Técnico del Proyecto Tren Eléctrico de Lima, Secciones 1 y 2. 2012. Available online: https://www.mtc.gob.pe/transportes/ferroviario/proyecto-tren-lima.html (accessed on 13 May 2025).
  11. Shan, Z.; Liang, Y.; Yu, Z.; Chen, H. Research on the correlation of safety risk of railway bridge construction based on meta-analysis. Appl. Sci. 2024, 14, 3155. [Google Scholar] [CrossRef]
  12. Federal Railroad Administration USA. 2021. Available online: https://railroads.dot.gov/ (accessed on 24 May 2022).
  13. Gordan, M.; Sabbagh-Yazdi, S.-R.; Ismail, Z.; Ghaedi, K.; Carroll, P.; McCrum, D.; Samali, B. Managing railway bridges crossing waterways through a machine learning-based maintenance policy. J. Bridge Eng. 2022, 30, 04022003. [Google Scholar] [CrossRef]
  14. Shajihan, A.; Mechitov, K.; Chowdhary, G.; Spencer, B.F., Jr. Physics-informed neural network-based damage identification for truss railroad bridges. arXiv 2025, arXiv:2502.0019. [Google Scholar]
  15. Cheng, Y.S.; Au, F.T.K.; Cheung, Y.K. Vibration of railway bridges under a moving train by using bridge-track-vehicle element. Eng. Struct. 2020, 23, 15971606. [Google Scholar] [CrossRef]
  16. Data of Temperature Histogram Data from the Peruvian Institute of Statistics. 2023. Available online: https://www.gob.pe/inei/ (accessed on 18 October 2024).
  17. Kaewunruen, S.; AbdelHadi, M.; Kongpuang, M.; Pansuk, W.; Remennikov, A.M. Digital twins for managing railway bridge maintenance, resilience, and climate change adaptation. Sensors 2023, 23, 252. [Google Scholar] [CrossRef] [PubMed]
  18. Kostianaia, E.A.; Kostianoy, A.G. Railway transport adaptation strategies to climate change at high latitudes: A review of experience from Canada, Sweden, and China. Transp. Telecommun. J. 2023, 24, 145–159. [Google Scholar] [CrossRef]
  19. Moreu, F.; Rakoczy, A.M. Lateral loads and displacements of railroad bridges from field investigations. J. Bridge Eng. 2023, 28, 04023074. [Google Scholar] [CrossRef]
  20. Razzaghi Kalajahi, A.; Esmaeili, M.; Zakeri, J.A. Assessment of running safety of developed train–bridge–wave model under one-direction and two bidirectional high-speed train passing subjected to rail irregularities. Transp. Res. Rec. 2023, 2677, 437–452. [Google Scholar] [CrossRef]
  21. Ministry of Housing, Construction and Sanitation (MVCS). Technical Standard E.030: Seismic Design. 2018. Available online: https://www.construccionyvivienda.com/normas/ (accessed on 19 April 2023).
Figure 1. Details of the Bolognesi bridge with rivets 55ft.
Constrmater 05 00038 g001
Figure 2. Cross section of old steel bridges 55 ft.
Constrmater 05 00038 g002
Figure 3. Map of the Peruvian railway network (DGC-MTC).
Constrmater 05 00038 g003
Figure 4. Types of structures and cross sections (DPG, TPG, and truss).
Constrmater 05 00038 g004
Figure 5. (a) Cross sections which are less than 40 m DPG. 5 (b) Cross section TPG.
Constrmater 05 00038 g005
Figure 6. (a) Cross sections that are less than 40 m (DTG truss). (b) Steel mesh with bottom board (TTG “Parker” type).
Constrmater 05 00038 g006
Figure 7. Flowchart for the bearing capacity of railway bridges.
Constrmater 05 00038 g007
Figure 8. E-Cooper E-40, E-60, and E-80 freight train based on the AREMA Manual for Railway Engineering (2023) [2].
Constrmater 05 00038 g008
Figure 9. Central Andean Railway FCCA C39-8 locomotives.
Constrmater 05 00038 g009
Figure 10. The 286 K live load axle train.
Constrmater 05 00038 g010
Figure 11. Live load of Lima Metro trains—two types of loads (ATTE).
Constrmater 05 00038 g011
Figure 12. Cross section of the Lima Metro (AATE).
Constrmater 05 00038 g012
Figure 13. Railway locomotive on Huancayo–Huancavelica railway corridor.
Constrmater 05 00038 g013
Figure 14. Steel profiles, angles and cross sections types for railway bridges.
Constrmater 05 00038 g014
Figure 15. Cooper E60 live load modeling.
Constrmater 05 00038 g015
Figure 16. Pathology visual inspection report (Condorsenjas bridge).
Constrmater 05 00038 g016
Figure 17. Modeling of the Sap2000 Copello bridge.
Constrmater 05 00038 g017
Figure 18. Plan view of a steel truss bridge model.
Constrmater 05 00038 g018
Figure 19. RSA response spectrum acceleration for most common sections of bridge.
Constrmater 05 00038 g019
Figure 20. Response time—Pisco earthquake 15 August 2007 Callao Station.
Constrmater 05 00038 g020aConstrmater 05 00038 g020b
Figure 21. Isometric typical section: L = 75 m—network arch bridge.
Constrmater 05 00038 g021
Figure 22. Factor Rating—network arch bridge.
Constrmater 05 00038 g022
Figure 23. Isometric typical section: L = 75 m—Pratt Truss bridge.
Constrmater 05 00038 g023
Figure 24. Factor Rating—truss railway bridge: L = 75 m.
Constrmater 05 00038 g024
Figure 25. Modeling of a Howe Truss modified railway bridge: L = 75 m.
Constrmater 05 00038 g025
Figure 26. Factor Rating of a truss railway bridge: L = 75 m.
Constrmater 05 00038 g026
Figure 27. Extruded 3D model of a TPG bridge.
Constrmater 05 00038 g027
Figure 28. Dead load (self-weight + permanent load).
Constrmater 05 00038 g028
Figure 29. E40 Cooper— load live.
Constrmater 05 00038 g029
Figure 30. E60 Cooper—live load.
Constrmater 05 00038 g030
Figure 31. E80 Cooper—live load.
Constrmater 05 00038 g031
Figure 32. The 268 K live load.
Constrmater 05 00038 g032
Figure 33. The 286 K live load (Hopper).
Constrmater 05 00038 g033
Figure 34. Loaded transverse wind load.
Constrmater 05 00038 g034
Figure 35. Unloaded transverse wind load.
Constrmater 05 00038 g035
Figure 36. Temperature load (+).
Constrmater 05 00038 g036
Figure 37. Temperature load (-).
Constrmater 05 00038 g037
Figure 38. Vibration mode 1.
Constrmater 05 00038 g038
Figure 39. Vibration mode 3.
Constrmater 05 00038 g039
Figure 40. Sap2000 modeling of the Infiernillo Bridge.
Constrmater 05 00038 g040
Table 1. Design criteria according to resistance, maintenance, and E-Cooper loads.
Design CriteriaTPGDPGReticulado (Truss)
Static StrengthModerate (requires reinforcement)GoodExcellent
Dynamic StrengthModerate (high DAF)GoodExcellent
Fatigue StrengthModerate (prone to cracks)GoodExcellent (axial forces)
Material CostLow to moderateModerateHigh
MaintenanceSimpleModerateComplete
Suitability for E-Cooper LoadAcceptable with optimized designGood for E-CooperExcellent (recommended)
Table 2. Load combination group–design for Hyo-Hca. Railway.
GroupItemPermissible Percentage of Unitary Basic Tension
ILD + LL1 + I100
IILD + LL2 + I (Alternate)100
IIILD + LL + I + WTS + S1 + FL100
IVLD + LL + I + WTS + S2 + FL100
VLD + LL + I + WLS + S1 + FL100
VILD + LL + I + WLS + S2 + FL100
Table 3. Load combination group–design for FCCA Railway.
GroupItemPermissible Percentage of Unitary Basic Tension
ILD + LL + I100
IILD + LL + I + WC + S + FL125
IIILD + WD125
IVLD + LL + I + WC + S + A125
VLD + Exx + 0.3 Eyy + 0.3 Ezz133
VILD + 0.3 Exx + Eyy + 0.3 Ezz133
VIILD + 0.3 Exx + 0.3 Eyy + Ezz133
Table 4. FRA track categories according to speed—FRA.
Road ClassMax Speed Limit Operation Allowed for Load Trains (kph)Max Speed Limit Operation Allowed for Load Trains (Mph)Max Speed Limit Operation Allowed for Passenger Trains (Khp)Max Speed Limit Operation Allowed for Passenger Trains (Mph)
Class 116102415
Class 240254830
Class 364409660
Class 4966012880
Class 51288014490
Table 5. Railway locomotives of Huancayo–Huancavelica railway corridor.
Stress TypeAllowable Stress Normal RatingAllowable Stress Maximum Rating
Flexural tension 0.55 F y 0.8 F y
Flexural compression 0.55 F y 0.55 F y g 2 6.3 π 2 E g ( l r y ) 2
Or (for rolled beams only) 0.131 π E A f l d ( 1 + μ )
Whichever is larger, but should not exceed
0.55 F y
0.8 F y 0.8 F y 1.8 10 9 ( l r y ) 2
Shear 0.35 F y 0.75 ( 0.8 F y )
Table 6. Railway locomotives dead load.
ElementLoad
Guardrails57 kg/m
Rails57 kg/m
Wooden beams108 kg/m
Wooden guard beams29 kg/m
Total Dead Load251 kg/m
Table 7. Maximum and minimum temperatures in regions of Peru.
RegionMinimum Temperature (°C)Maximum Temperature (°C)AT (Standard Temperature
Values)
Coastal Zone10 °C30 °C20 °C
Highland Zone−10 °C25 °C35 °C
Rainforest Zone18 °C36 °C18 °C
Table 8. Thermal stress of TPG, DPG and truss bridges.
RegionAT (°C)Thermal Stresses (ft)
Coastal Zone20 °CFt = 210,000.12 × 10−6.20 = 50.4 Mpa
Mountain Zone35 °CFt = 210,000.12 × 10−6.35 = 88.2 Mpa
Rainforest Zone18 °CFt = 210,000.12 × 10−6.18 = 45.5 Mpa
Table 9. Summary of thermal stress of TPG, DPG and truss bridges.
RegionTPGTPGTruss
Coastal Zone168.5 MPa168.5 MPa85 MPa
Mountain Zone72 MPa72 MPa38 MPa
Rainforest Zone110 MPa110 MPa55 MPa
Table 10. The natural frequency of TPG, DPG and truss bridges.
PropertyTPG (45 m)DPG (45 m)Truss (45 m)
Total, Mass (M)679.11 t703.03 t655.15 t
Stiffness (K)1.165 × 10⁸ N/m1.747 × 108 N/m2.427 × 108 N/m
Natural Frequency (f)2.08 Hz2.51 Hz3.06 Hz
Table 11. Calculated allowable stresses for normal rating.
Bridge ComponentCalculated Allowable Stresses (ksi)
ShearFlexural CompressionFlexural Tension
Bridge 1
Girder Plate10.5016.1516.50
Floor Beam10.5016.5016.50
Stringer10.5016.5016.50
Bridge 2
Girder Plate10.5015.7516.50
Table 12. Calculated allowable stresses for maximum rating.
Bridge ComponentCalculated Allowable Stresses (ksi)
ShearFlexural CompressionFlexural Tension
Bridge 1
Girder Plate18.0024.0024.00
Floor Beam18.0024.0024.00
Stringer18.0024.0024.00
Bridge 2
Girder Plate18.0022.9124.00
Table 13. Live Load stress DPG Bridge.
Load EffectE-Cooper268 K286 KGT-42C39-8
Deck Plate GirderMax bending6041.64086.32569.72677.82435.8
Max shear283.7201.7120.6127.8114.7
Floor BeamMax bending403.7304.9171.8175.9165.3
Max shear97.874.542.4543.841.5
StringerMax bending127.897.975.5778.971.5
Max shear73.454.637.938.935.5
Table 14. Factor rating of different elements of TPG.
Cooper E RatingCooper E Equivalent Load
Load EffectNormalMaximum286 KGT-42C39-8
Through Plate GirderMomentE 82.0E 129.3E 54.3E 34.3E 32.1
ShearE 105.0E 189.5E 56.4E 34.5E 32.4
Floor BeamMomentE 67.7E 101.3E 60.3E 33.8E 32.1
ShearE 99.5E 174.6E 60.21E 34.3E 32.3
StringerMomentE 75.3E 111.5E 60.6E 47.6E 45.0
ShearE 80.68E 141.9E 61.8E 42.5E 40.1
Disclaimer/Publisher’s Note: The statements, opinions and data contained in all publications are solely those of the individual author(s) and contributor(s) and not of MDPI and/or the editor(s). MDPI and/or the editor(s) disclaim responsibility for any injury to people or property resulting from any ideas, methods, instructions or products referred to in the content.

