4.1. Evolution of GP Curve
Figure 3 and
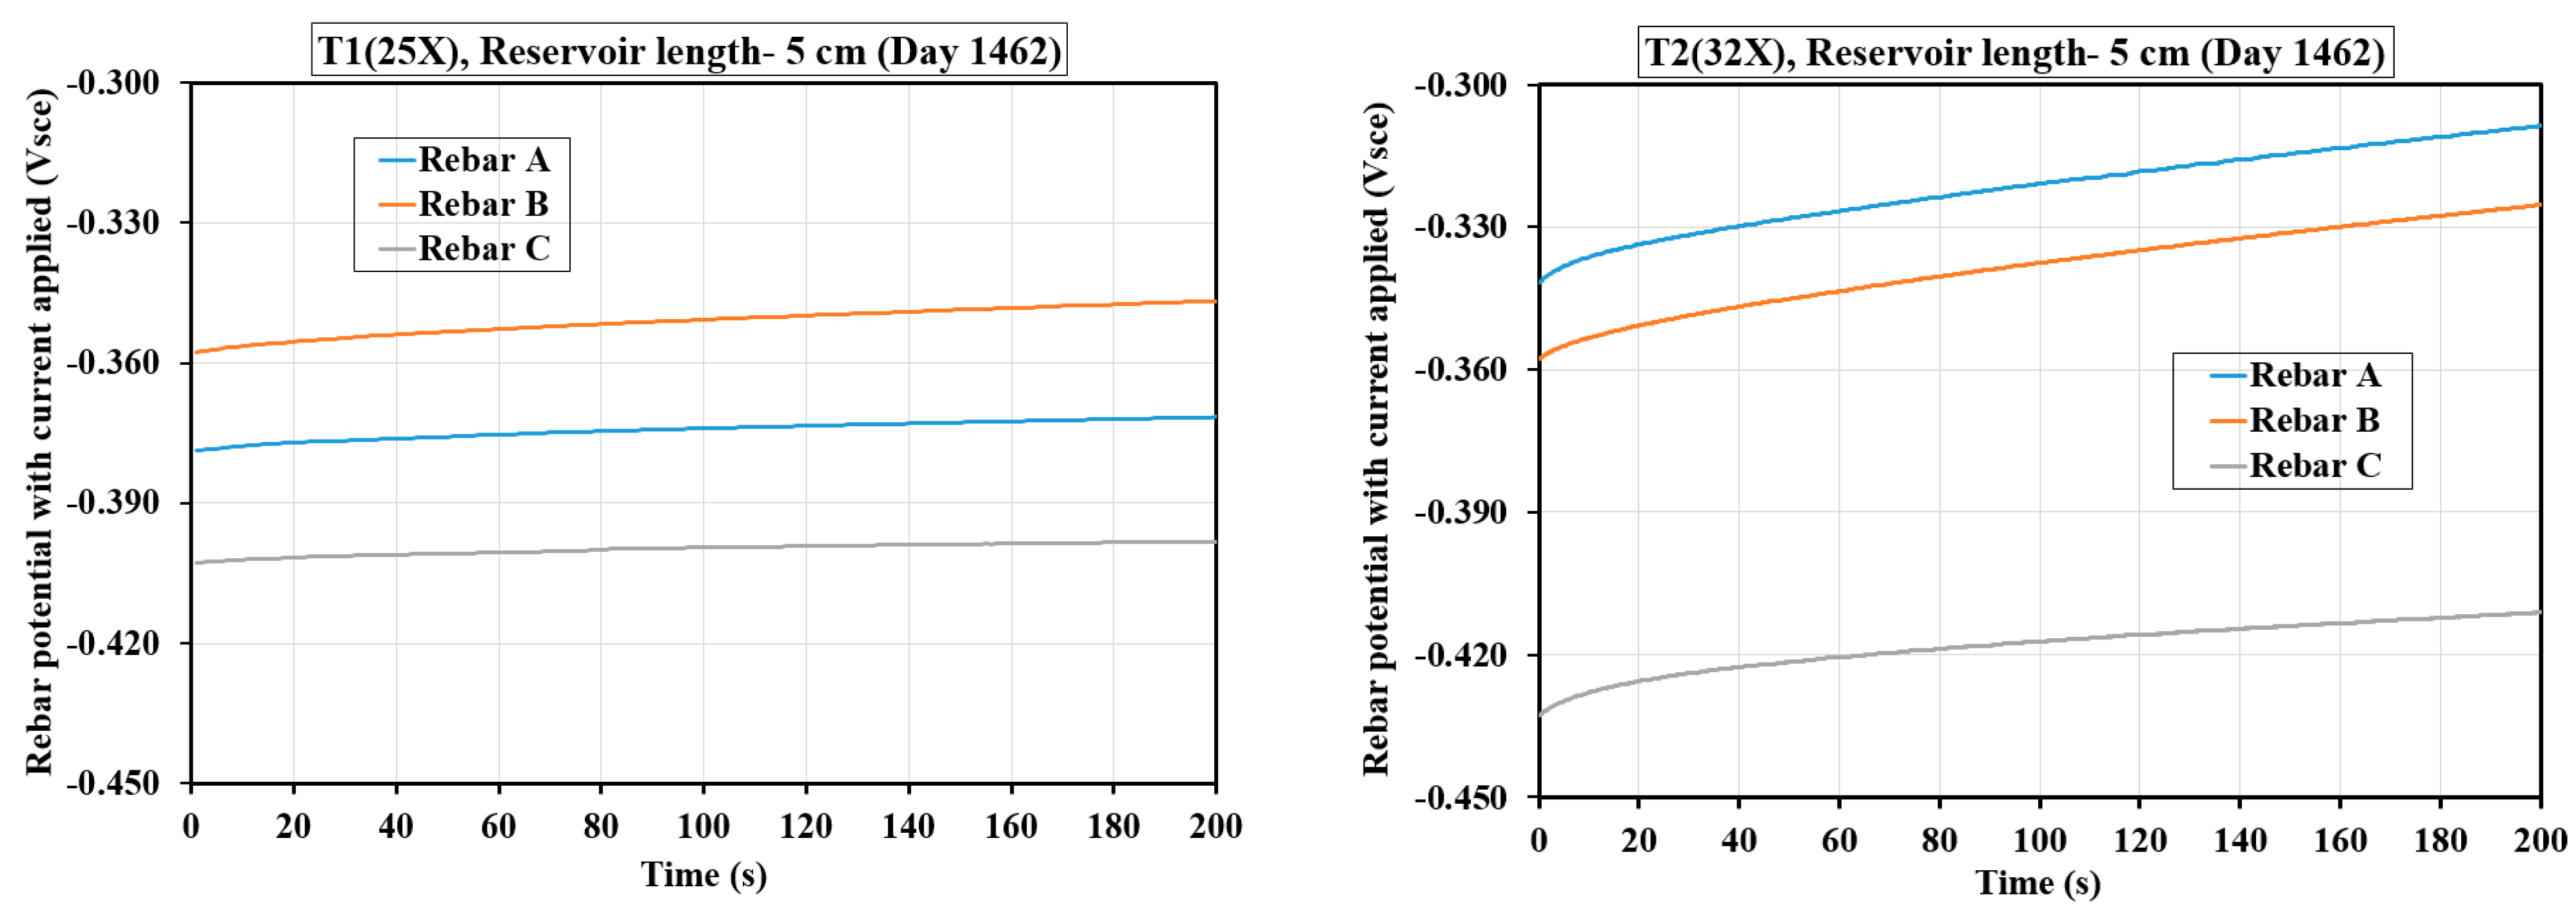
Figure 4 provide a detailed analysis of the GP curves for the three-rebar T1 and T2 samples, subjected to a 10 μA cathodic current pulse applied for 200 s. These tests were conducted with reservoir lengths of 5 cm (
Figure 3) and 10 cm (
Figure 4), allowing for a comparative assessment of corrosion behavior under varying exposure conditions. The GP curves in both figures (
Figure 3 and
Figure 4) track the evolution of rebar potential over time, highlighting the degree of potential shift (ΔV) in response to the applied current. This potential shift serves as an indicator of the electrochemical state of the rebar surface. The plotted data not only demonstrate how reservoir length and chloride concentration influence corrosion activity, but also emphasize how the nature of the voltage–time curve—its slope and shape—can signal whether the rebar remains protected or is undergoing active degradation.
Figure 3 shows the GP curves for three rebars in T1(25X) and T2(32X) samples, tracking their potential response to a 10 μA cathodic current pulse applied for 200 s with a 5 cm reservoir. In the T1(25X) sample, the ΔV for all rebars (A, B, C) was minimal (around 4–5 mV), showing a slow, gradual increase characteristic of capacitive behavior, suggesting that the rebars were in an active state with low corrosion activity. In contrast, the T2(32X) sample exhibited a steeper rise in potential, especially for rebars A and B (ΔV ~ 25–28 mV), indicating a significant corrosion activity. Rebar C in the T2(32X) sample showed a smaller shift (~9 mV), implying less corrosion compared to rebars A and B. Across both tests, the capacitor was not fully discharged within the monitored time, as evidenced by the continued upward trend in potential. The GP curve in corroding rebars typically shows a steeper initial slope and greater ΔV due to the interaction between the applied current and active anodic sites, as observed in the T2(32X) sample, confirming higher corrosion susceptibility under elevated chloride exposure.
Figure 4 presents the GP curves over time for selected samples under a 10 cm reservoir length, where the two test plots—T1(27X) and T2(29X)—conducted on day 742 with a 10 µA cathodic current pulse display distinct features characteristic of active corrosion. The actively corroding rebars tend to show a flat or steadily rising potential response during current application, lacking the sharp exponential drop or recovery typically associated with passive behavior, as the response is governed more by charge transfer processes than by pure capacitive effects. In both the T1 and T2 samples, rebars A, B, and C show a steady, linear-like increase in potential across the 200 s duration, with each rebar experiencing an approximate ΔV of 15 mV. This uniform, non-exponential rise across the rebars, coupled with the absence of a pronounced capacitor discharge tail, suggests that the system did not behave like a passive or non-corroding one; instead, the response is consistent with corrosion-active steel. Notably, in T2 samples, rebar A displays a more negative baseline potential (~−0.325 V), which may reflect either more aggressive localized corrosion or a delayed depolarization response. Despite the consistent trend, the short test duration may have limited the full characterization of capacitive recovery. Nevertheless, the overall shape and behavior of the voltage–time curves strongly support the interpretation that the rebars were in an actively corroding state, as indicated by the absence of a clear exponential recovery and the dominance of a gradual, linear-like potential rise throughout the test duration.
The GP curves offer a comprehensive perspective on the electrochemical behavior of rebar samples subjected to different exposure conditions. By applying a low-intensity cathodic current pulse over a fixed duration, the potential response of the embedded steel can be monitored to evaluate its corrosion state. The evolution of potential over time serves as a diagnostic tool, revealing whether the system behaves in a predominantly capacitive manner, typically associated with passive, non-corroding rebar, or in a charge-transfer dominated mode, indicative of active corrosion. For the shorter reservoir conditions, some rebar samples display a gradual, limited shift in potential, consistent with capacitive behavior. This indicates minimal corrosion activity. In contrast, when rebar is exposed to higher levels of chloride or longer electrolyte paths, the potential response becomes markedly steeper and more sustained. This behavior points to the onset of active corrosion, where anodic processes dominate the electrochemical interaction with the applied current.
The distinction between capacitive and corrosion-active responses is further reinforced by the shape of the voltage–time curves. The passive systems typically show a sharp rise followed by an exponential recovery as the system discharges stored charge. However, in actively corroding systems, the potential tends to increase steadily or linearly, lacking a distinct recovery phase. This is often due to the persistent influence of anodic reactions that continue to drive the potential upward even after the initial application of current. Therefore, the GP curves reveal that factors such as chloride concentration and reservoir length play a significant role in influencing corrosion behavior. A stronger, more linear potential rise and the absence of exponential decay patterns are indicative of corrosion-active steel. These tests underscore the utility of GP measurements in diagnosing the electrochemical condition of embedded rebars and in distinguishing between passive and actively degrading reinforcement.
4.2. Evolution of Rebar Potential with Time
In
Figure 5 and
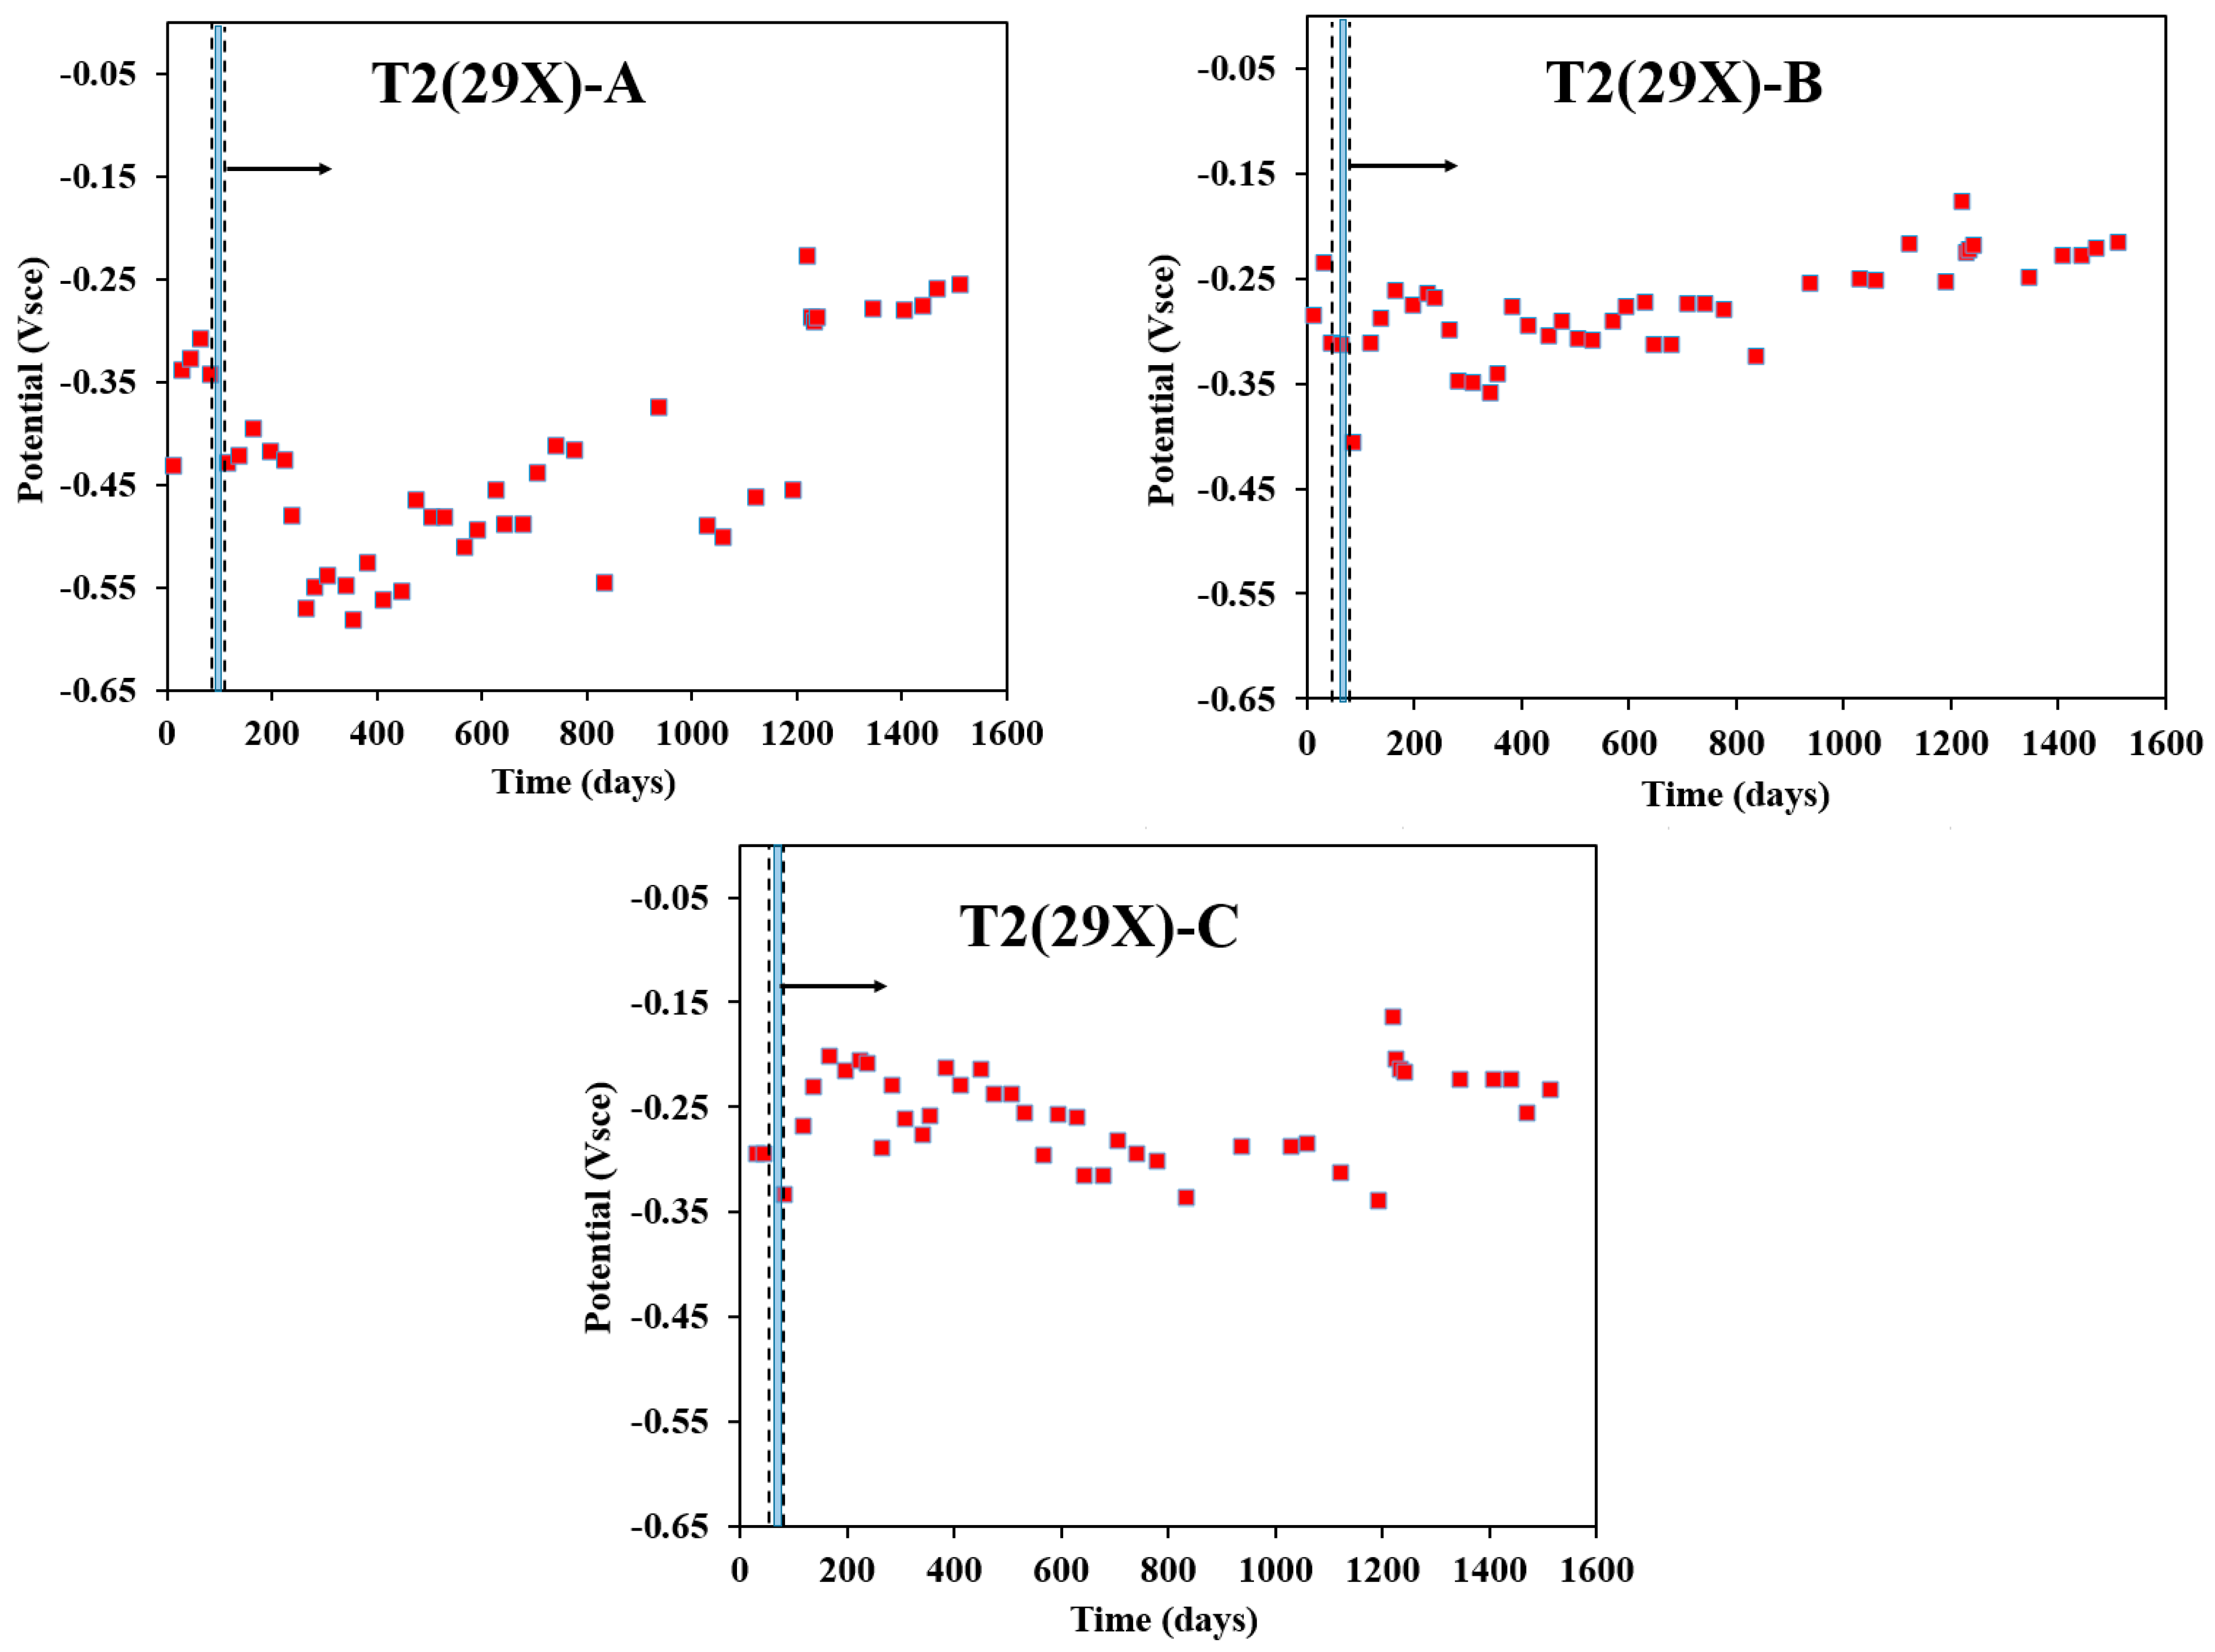
Figure 6, “Day zero” marks the start of solution introduction into the reservoir, not the sample’s age. Corrosion propagation is shown on the right portion of the dashed line, with arrows indicating the post-electromigration phase. When two dashed lines appear, the interval between them represents the total electromigration exposure time, while the blue prisms highlight the “system on” period when the electric field was applied.
Figure 5 illustrates the variation in rebar potential over time, measured using the GP technique, for three rebars (27X-A, 27X-B, and 27X-C) embedded in the T1 sample, with a reservoir length of 10 cm. A more negative potential was observed across all rebars, with significant shifts occurring within the first 100 days after the electromigration phase. For 27X-A, the potential dropped sharply after electromigration, reaching −0.613 Vsce by day 197, before gradually shifting toward more positive values. A similar trend was observed for 27X-B, where the potential declined rapidly post-electromigration, reaching −0.614 Vsce by day 217, followed by a gradual transition toward more positive values. In contrast, 27X-C initially exhibited a positive shift until day 145, after which it experienced a significant drop to −0.582 Vsce by day 337, followed by a gradual positive shift. By day 1242, the recorded rebar potentials were −0.164 Vsce (27X-A), −0.147 Vsce (27X-B), and −0.155 Vsce (27X-C), indicating distinct variations among the rebars. The gradual shift toward less negative values over time suggests the beneficial influence of fly ash and slag in improving the concrete matrix, potentially enhancing its resistance to chloride ingress and promoting passivation of the embedded rebars. These findings align with trends reported in previous studies [
41,
46].
Figure 6 depicts the variation in rebar potential over time for 29X-A, 29X-B, and 29X-C in the T2 sample, having a reservoir length of 10 cm. All rebars exhibited more negative potentials, particularly within the first 50 days after electromigration. For 29X-A, the potential declined significantly to −0.582 Vsce by day 356, fluctuating thereafter but remaining more negative than −0.220 Vsce throughout. Similarly, 29X-B dropped sharply to −0.401 Vsce by day 85, followed by a gradual positive shift, though it consistently stayed below −0.200 Vsce. In contrast, 29X-C initially moved toward more positive values until day 200, after which it fluctuated and gradually became more negative until day 800, then continued to fluctuate. By day 1346, the recorded potentials were −0.279 Vsce (29X-A), −0.249 Vsce (29X-B), and −0.225 Vsce (29X-C), indicating distinct corrosion behaviors. The influence of fly ash and silica fume in the T2 sample appears to enhance the long-term durability of the concrete matrix, potentially improving resistance to chloride ingress while still allowing fluctuations in rebar potential. These findings are consistent with previous research on T2 specimens [
41,
47].
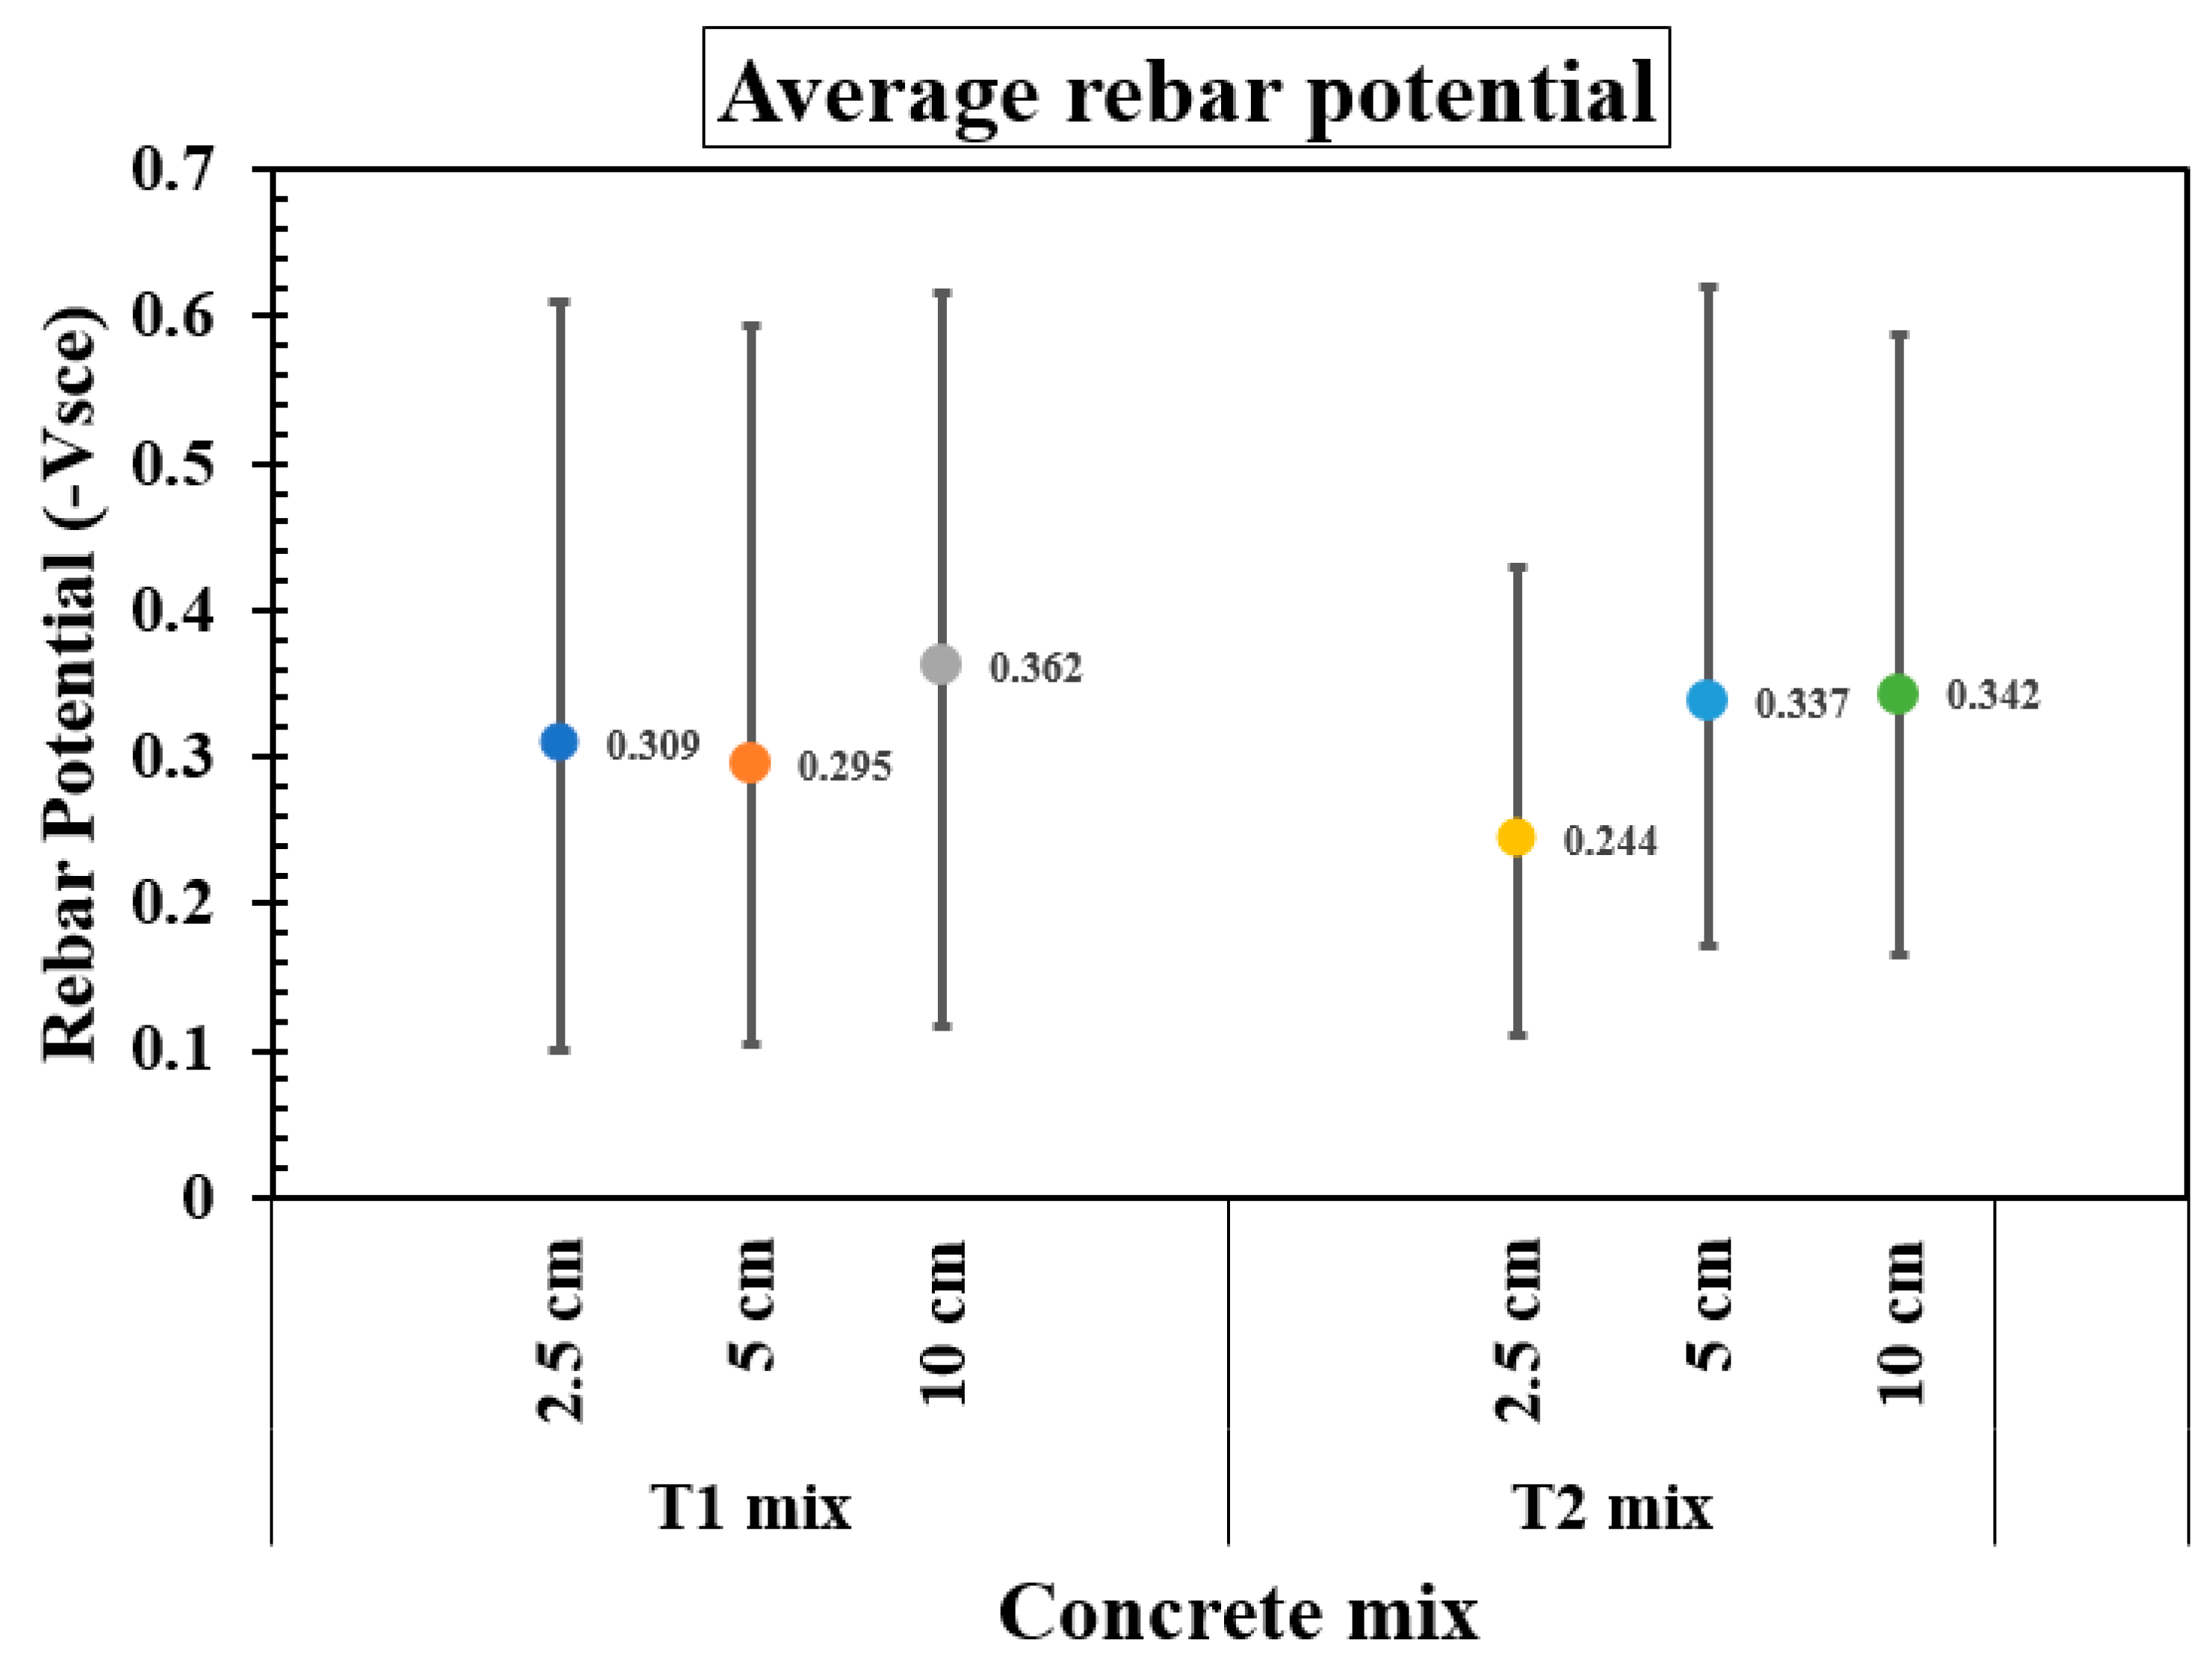
Figure 7 presents the average rebar potential, along with the corresponding maximum and minimum values, over approximately 1600 days for two concrete mixes—T1 and T2—tested with reservoir lengths of 2.5 cm, 5 cm, and 10 cm. In most cases, the average rebar potentials were more negative than the −0.150 Vsce threshold, indicating that active corrosion likely persisted throughout most of the monitored period. For the T1 mix, a trend toward more negative rebar potentials were observed with increasing reservoir length, reaching the more negative average value of −0.362 Vsce at 10 cm, implying that corrosion is likely taking place. In contrast, the T2 mix showed its most positive average potential at the shortest reservoir length (2.5 cm, −0.244 Vsce), but average rebar potential became progressively more negative as reservoir length increased, reaching −0.342 Vsce for 10 cm. Additionally, the variation (range) in rebar potential is consistently greater in the T1 mix compared to the T2 mix.
The variations in rebar potential within RC samples arise from differing levels of corrosion activity influenced by multiple interconnected factors. Concrete composition, oxygen availability, moisture distribution, and chloride penetration all contribute to localized corrosion zones, leading to fluctuations in measured potential. Additionally, environmental conditions such as temperature and relative humidity significantly impact electrochemical reactions at the steel–concrete interface, either accelerating or slowing corrosion rates and consequently altering rebar potential. As these external factors shift over time, they continuously reshape the electrochemical environment, driving dynamic changes in corrosion behavior. Therefore, the observed potential variations reflect the complex interplay between material properties and environmental influences that govern the corrosion process.
4.3. Evolution of Rs with Time
Figure 8 and
Figure 9 illustrate the time-dependent variations in Rs, measured using the GP technique, for specimens incorporating different concrete mixes and three embedded rebars. It is important to mention that in all of these plots, day zero represents the point when the solution was introduced into the reservoir, rather than the actual age of the specimens. Since the reservoirs were filled at different times, the elapsed days since the initial filling vary among the samples. For the T1 and T2 specimens, Rs measurements were recorded from day 200 to day 1600, with the corresponding plots in
Figure 8 and
Figure 9 reflecting these GP-based readings.
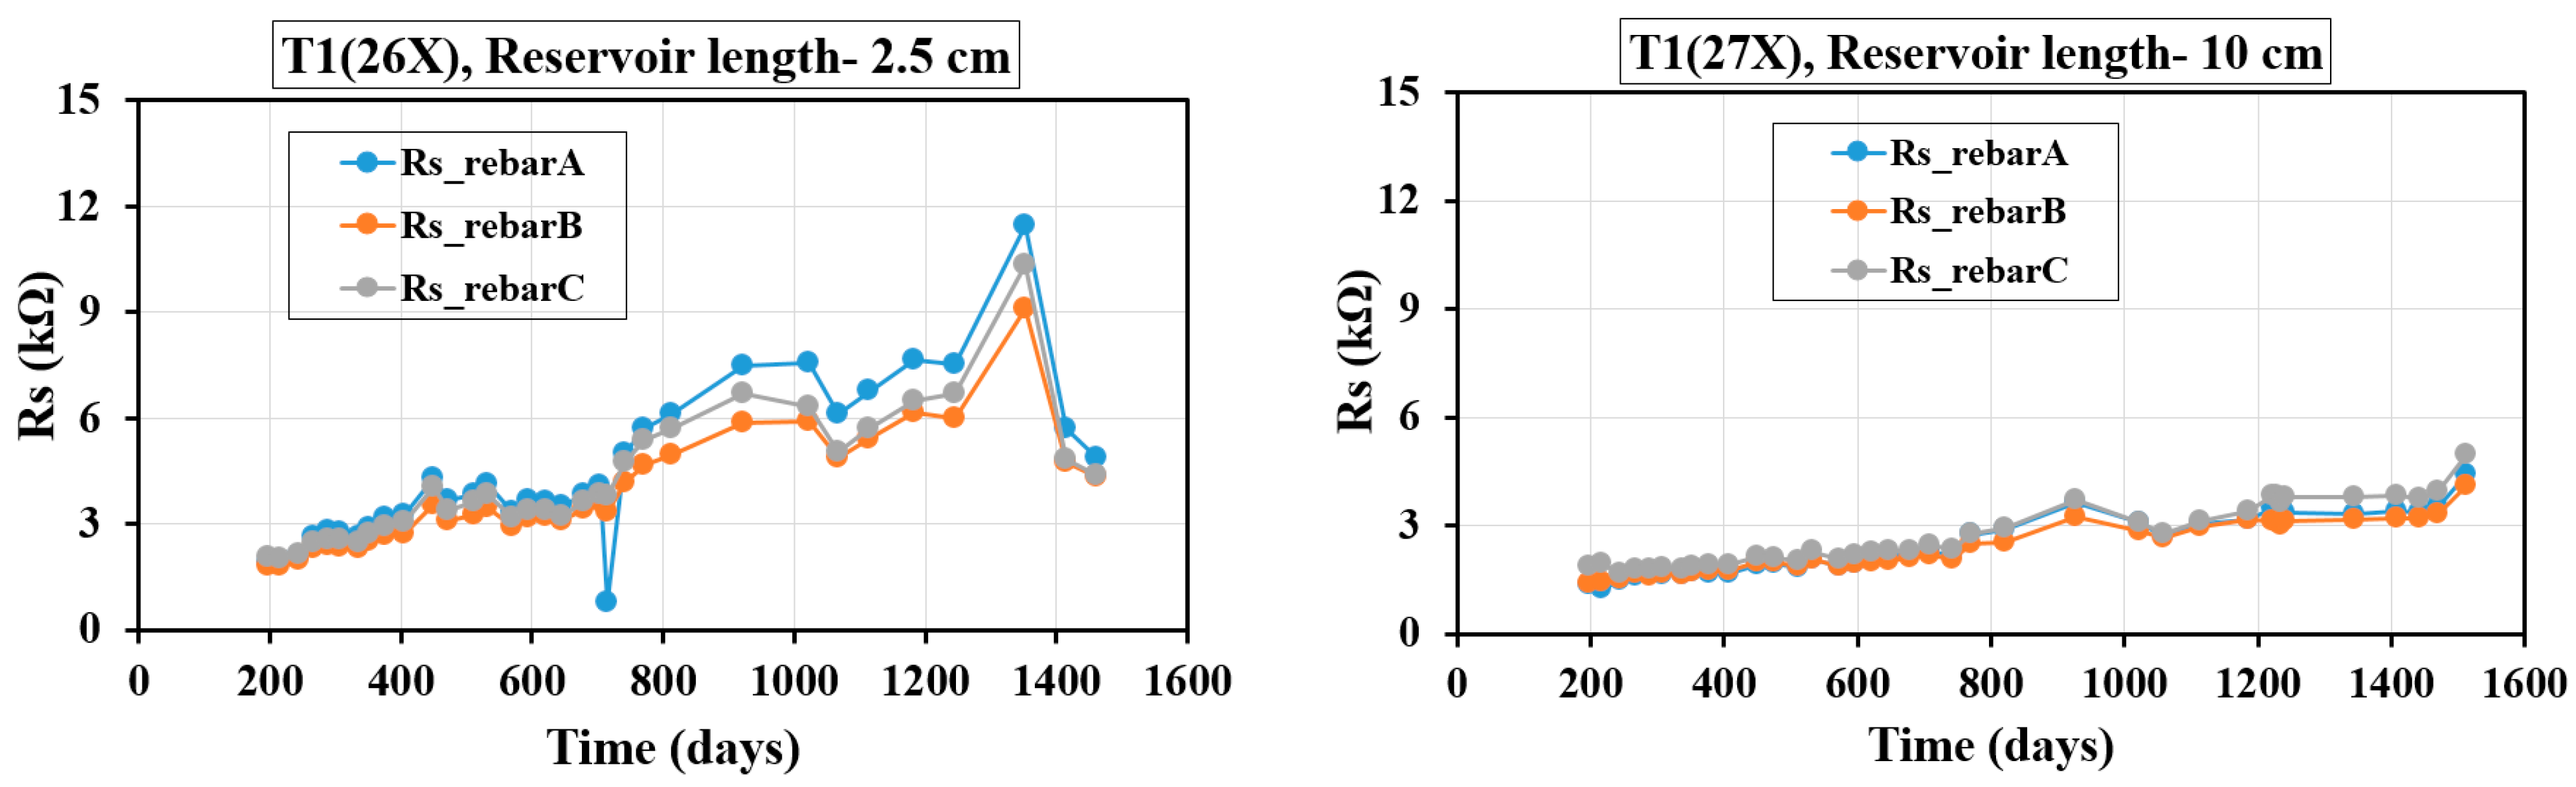
Figure 8 illustrates the variation of Rs over time for three-rebar T1 samples with reservoir lengths of 2.5 cm and 10 cm. In the 2.5 cm reservoir sample, T1(26X), Rs increases steadily, peaking around 1200–1400 days before slightly decreasing, with fluctuations, particularly around 600 days. The final Rs values (~11–12 kΩ) are significantly higher than the initial (~2–3 kΩ), suggesting increasing resistivity due to reduced ionic mobility and possible pore refinement. In contrast, the 10 cm reservoir sample, T1(27X), exhibits a gradual Rs increase with no major fluctuations, maintaining lower Rs values (1–4 kΩ) throughout, indicating a more stable and conductive pore structure due to sustained moisture presence. The higher Rs in the shorter reservoir suggests that limited moisture accelerates drying effects, leading to higher resistivity, whereas the longer reservoir maintains ionic conductivity through prolonged moisture exposure. The SCMs, fly ash and slag, contribute to Rs evolution by enhancing long-term hydration, refining pore structure, and reducing permeability, which gradually increases Rs over time as hydration continues and unreacted SCMs further densify the matrix. This highlights the combined effects of moisture availability and SCM-induced matrix densification on concrete resistivity and durability.
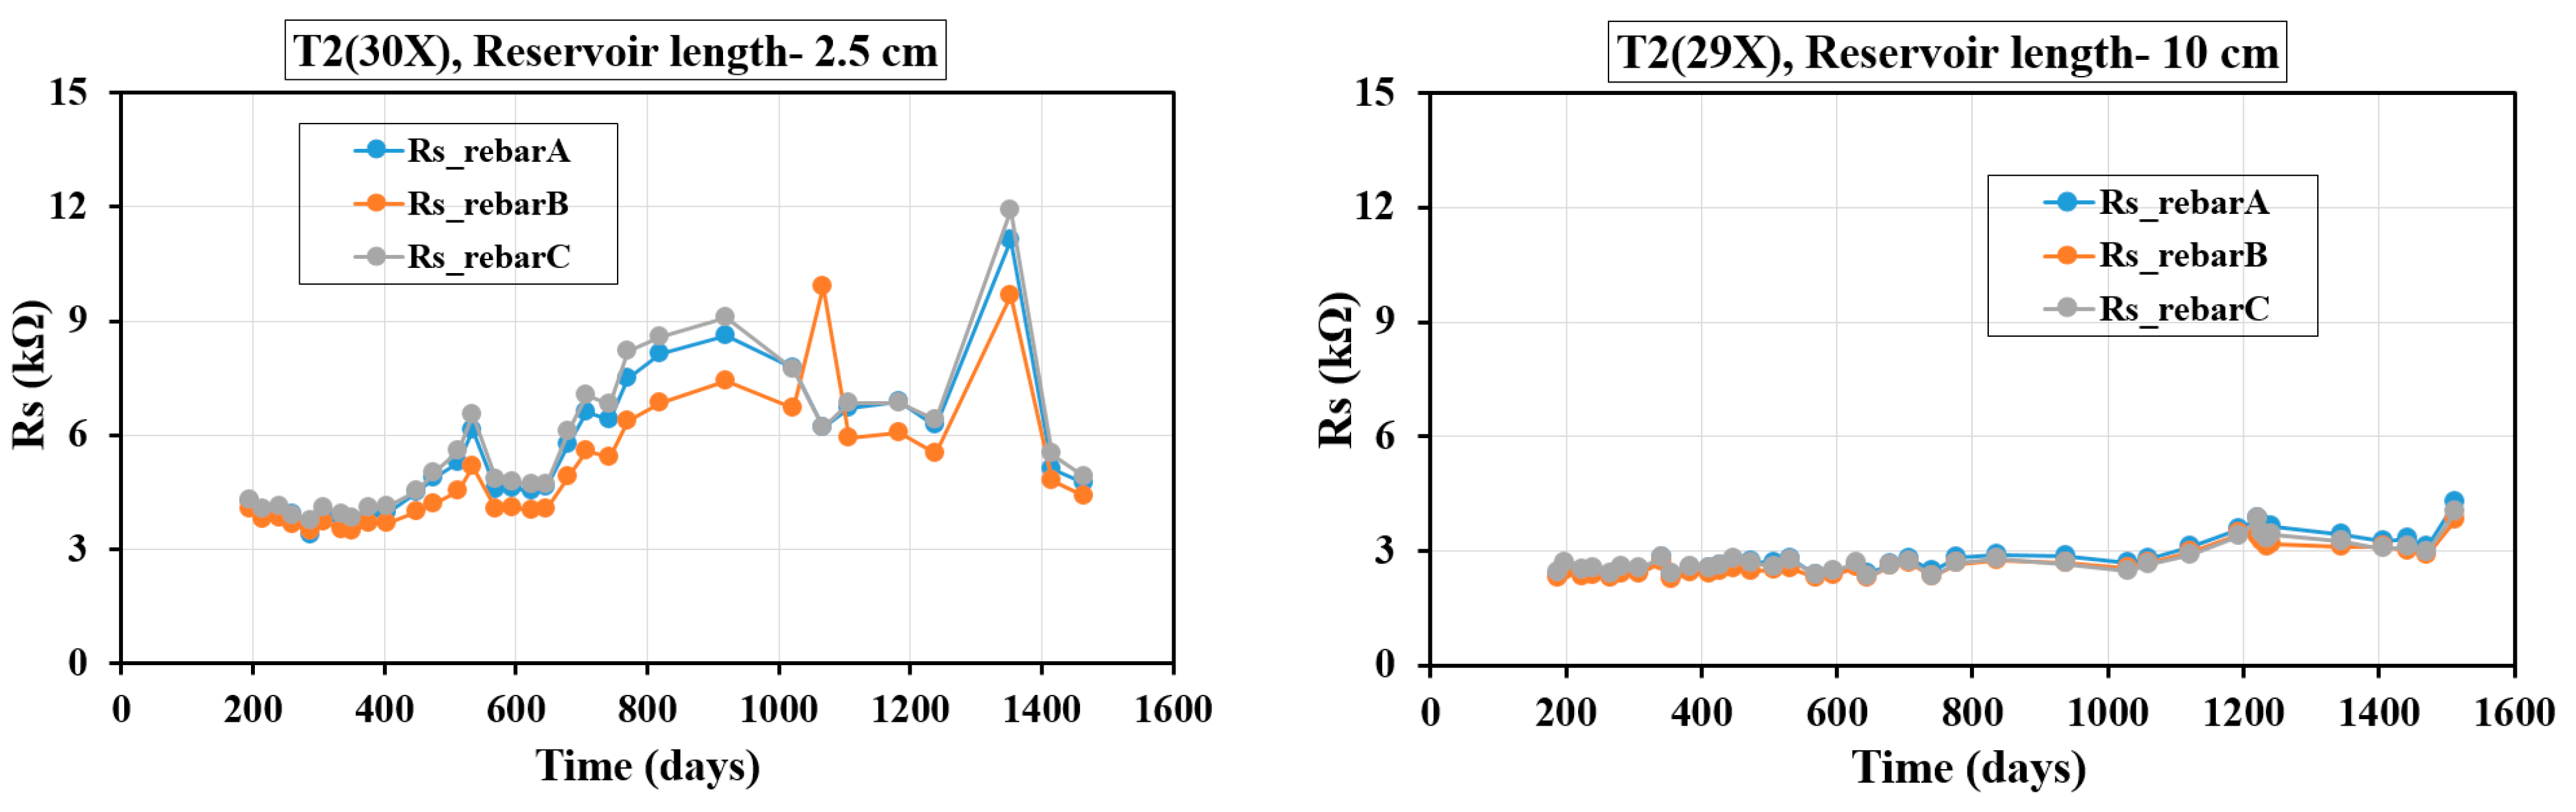
Figure 9 depicts the variation in Rs over time for three-rebar T2 samples with different reservoir lengths (2.5 cm and 10 cm). In the case of the 2.5 cm reservoir length, Rs initially remains stable before gradually increasing after approximately 600 days, peaking around 12 kΩ near 1350 days, and then declining significantly. The fluctuations indicate changes in pore solution chemistry and microstructural evolution influenced by SCMs, like fly ash and silica fume. Conversely, in the 10 cm reservoir length, Rs remains relatively stable, with only a slight increase over time, staying around 3 kΩ. The lower Rs values in the 10 cm reservoir length suggest a more sustained ionic conductivity due to a higher volume of pore solution. The presence of 20% fly ash and 8% silica fume likely contributes to the Rs increase by refining pore structure, reducing permeability, and altering ion transport—particularly in the shorter reservoir length, where moisture availability is limited. Similar observations were reported in prior studies [
46].
The influence of SCMs and reservoir length on Rs for the T1 and T2 three-rebar samples demonstrates the interplay between moisture availability and microstructural refinement. In both cases, Rs values are consistently higher in the 2.5 cm reservoir length compared to the 10 cm reservoir length, indicating that limited moisture availability leads to increased resistivity due to pore refinement and reduced ionic mobility. The presence of SCMs, such as fly ash and slag in the T1 mix and fly ash with silica fume in the T2 mix, contributes to the gradual increase in Rs over time by enhancing hydration reactions, densifying the microstructure, and reducing permeability. However, in the 10 cm reservoir samples, the more stable Rs values suggest sustained ionic conductivity due to prolonged moisture exposure, preventing excessive drying effects. The fluctuations observed in the shorter reservoir lengths indicate dynamic changes in the pore solution chemistry, while the steadier increase in Rs for the longer reservoir lengths highlights the buffering effect of sustained moisture presence. Therefore, the combination of SCMs and reservoir length significantly impacts Rs evolution, where reduced moisture availability accelerates resistivity increase, while SCM-induced matrix densification plays a crucial role in long-term durability.
4.4. Evolution of Rc with Time
Figure 10 and
Figure 11 show Rc variations over time for different T1 and T2 concrete mixes cast with three rebars, using the GP technique. Day zero represents the solution’s addition to the reservoir, not the specimens’ casting age. Since filling times varied, the elapsed days differ across samples. The Rc readings for the T1 and T2 specimens, as shown in
Figure 10 and
Figure 11, span from day 200 to day 1600.
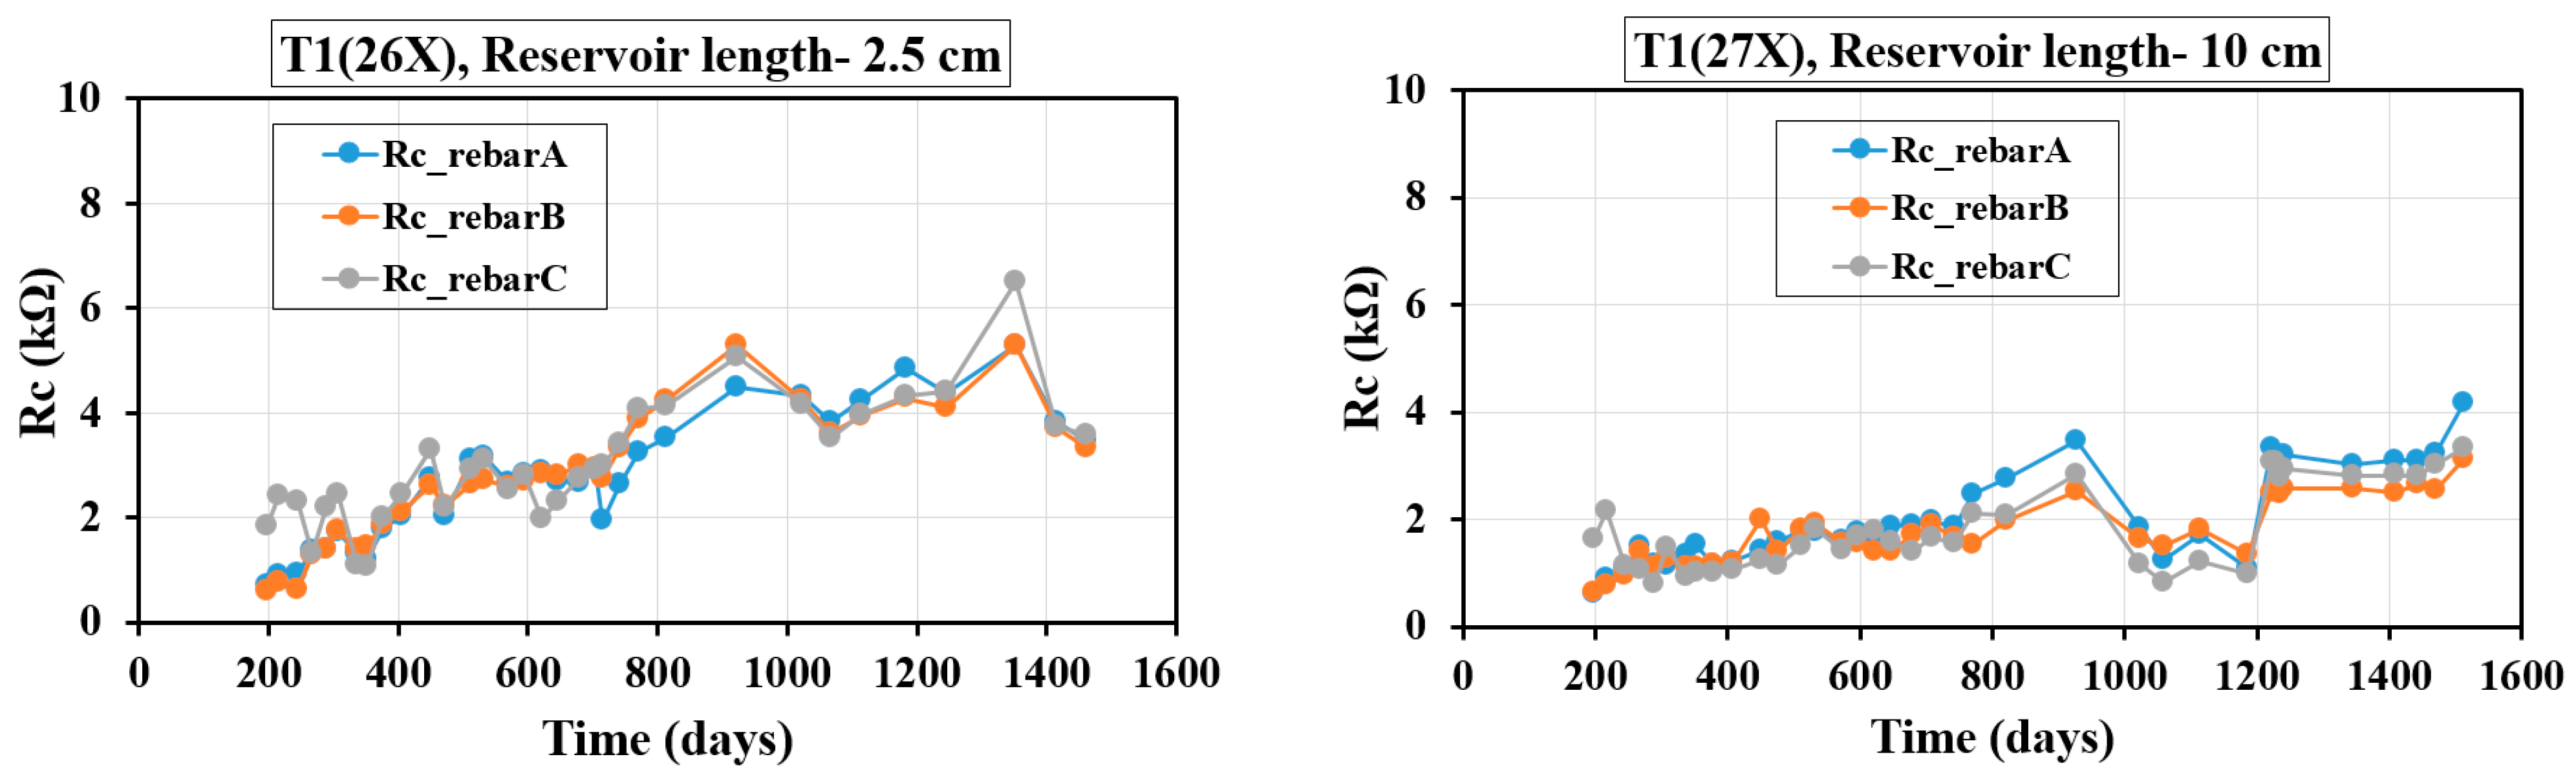
Figure 10 illustrates the variation of Rc over time for three-rebar T1 samples, with different reservoir lengths (2.5 cm and 10 cm). The Rc generally increases over time, indicating a reduction in corrosion activity as the concrete matures. In the initial phase (0–400 days), Rc remains low (<2 kΩ) for both reservoir lengths, followed by a gradual increase, with values reaching approximately 4–6 kΩ around 1400 days for the 2.5 cm reservoir sample. The shorter reservoir (2.5 cm) exhibits slightly higher Rc values compared to the longer reservoir (10 cm), particularly beyond 800 days, suggesting that moisture ingress and chloride penetration are more limited in shorter reservoirs, enhancing passivation. The use of SCMs significantly contributes to the increase in Rc, indicating improved durability and corrosion resistance over time. The presence of fly ash and slag in the T1 samples enhances pore refinement and reduces permeability, which likely explains the steady rise in Rc and the overall improvement in concrete’s protective properties against reinforcement corrosion.
Figure 11 shows the variation in Rc over time for three-rebar T2 specimens with different reservoir lengths. For the 2.5 cm reservoir length (T2-30X), Rc starts at lower values (~2–3 kΩ) and gradually increases, peaking around 8–9 kΩ after 900 days, indicating improved corrosion resistance over time due to passivation and densification of the concrete. However, occasional dips suggest localized chloride ingress. In contrast, for the 10 cm reservoir length (T2-29X), Rc values remain relatively stable between 2 and 5 kΩ for most of the test duration, with a slight increase beyond 1400 days. The consistently lower Rc values compared to the 2.5 cm reservoir sample suggest that the larger reservoir allows prolonged chloride and moisture penetration, reducing polarization resistance. The use of fly ash and silica fume in the T2 mix helps refine the concrete microstructure, improving its resistance to chloride ingress and enhancing long-term passivation. However, the longer reservoir still leads to increased exposure, highlighting the need for additional protective measures in aggressive environments. A comparable finding has been documented in previous research [
47].
The evolution of Rc over time highlights the impact of reservoir length and SCMs on corrosion resistance in concrete. In both the T1 and T2 samples, Rc generally increases over time, indicating reduced corrosion activity as the concrete matures and passivates the reinforcing steel. The shorter reservoir lengths (2.5 cm) consistently exhibit higher Rc values than longer ones (10 cm), suggesting that limited moisture ingress and chloride penetration enhance corrosion resistance. The T1 mix, incorporating fly ash and slag, shows a gradual and steady increase in Rc, reflecting improved pore refinement and reduced permeability. Similarly, the T2 mix, which includes fly ash and silica fume, demonstrates significant Rc growth, particularly in the 2.5 cm reservoir sample, reaching up to 9 kΩ. However, occasional Rc drops indicate localized chloride ingress. The reduced Rc values in the 10 cm reservoir samples highlight the impact of extended exposure, emphasizing the need for well-optimized mix designs and supplementary protective strategies to improve durability in harsh chloride conditions.
4.5. Evolution of Icorr with Time
This section details the time-dependent changes in Icorr, as measured using the GP technique, for specimens made with various concrete mixes and containing three rebars. It is important to note that in most of the plots in
Figure 12 and
Figure 13, day zero corresponds to the introduction of the solution into the reservoir, not the specimens’ actual age. Since the solution reservoirs were installed at different times, the number of days since the initial filling differs across the samples. For the T1 and T2 specimens, with three rebars, Icorr values were recorded from day 200 to day 1600, and the associated plots in
Figure 12 and
Figure 13 are based on these measurements using the GP method.
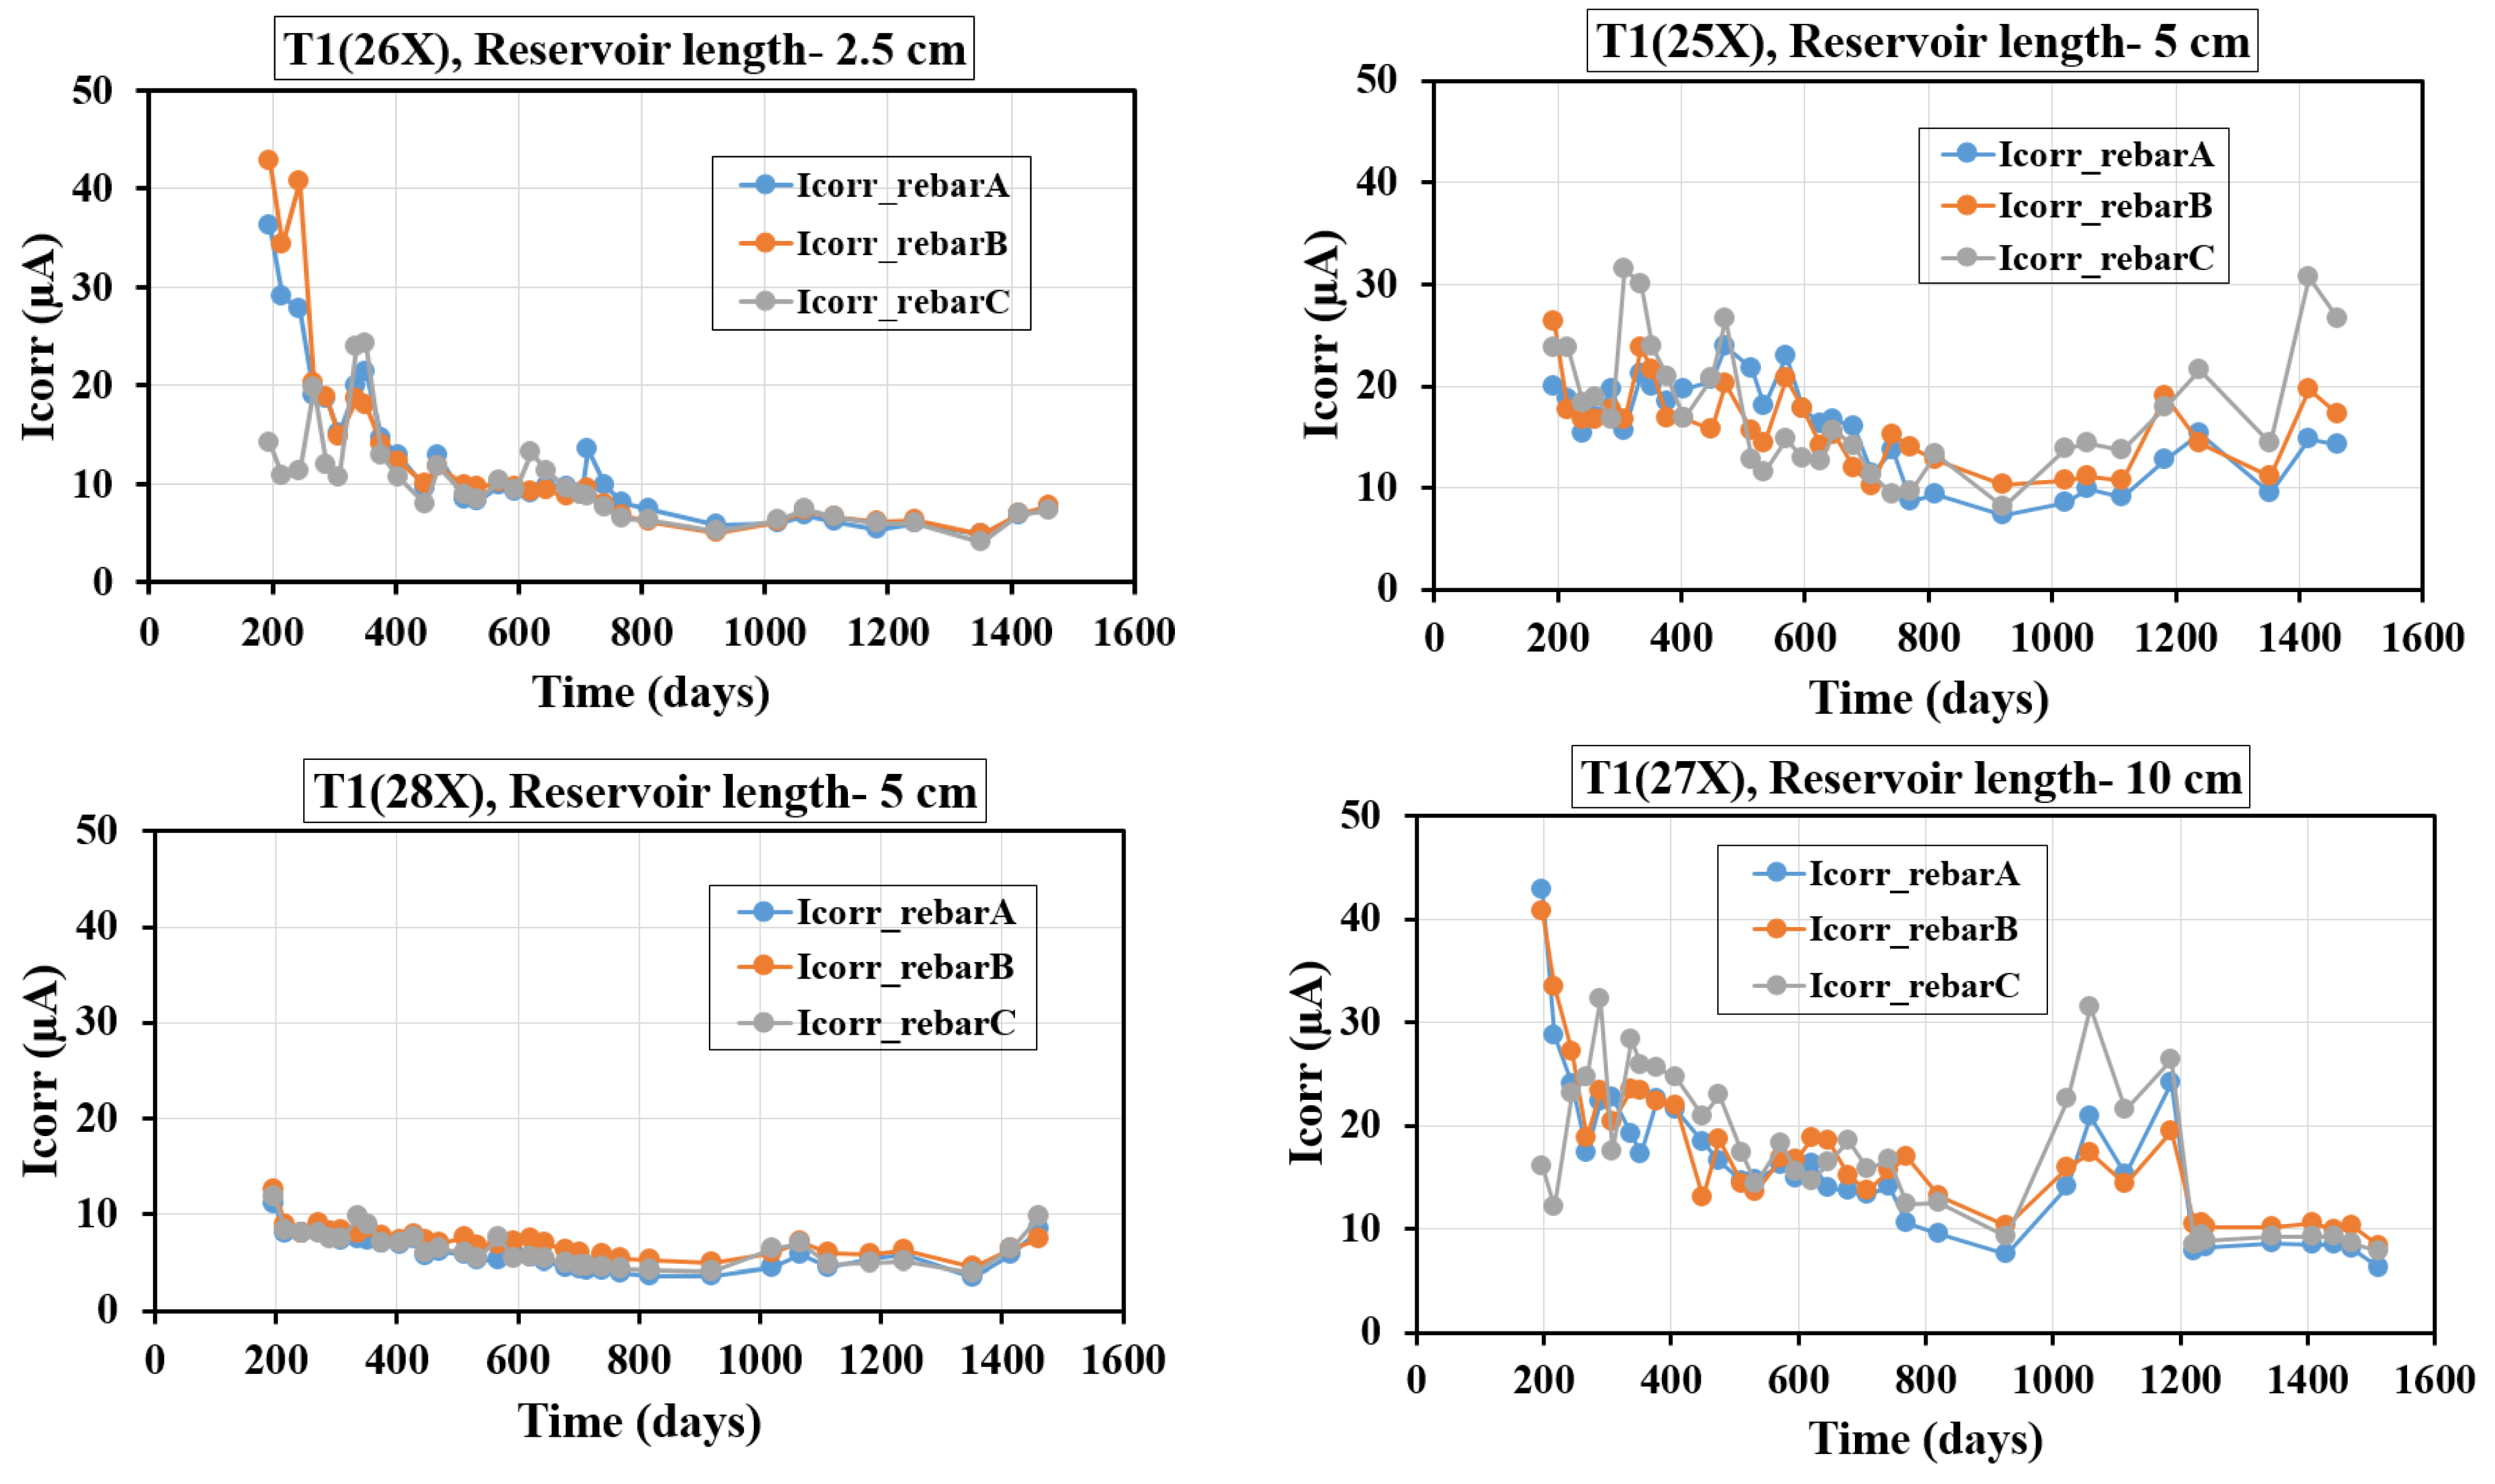
Figure 12 illustrates the progression of Icorr with time for T1 samples having different reservoir lengths and three embedded rebars (A, B, and C). For the specimen with a 2.5 cm reservoir length (T1-26X), Icorr begins at a high level (around 40–50 µA), rapidly declines within the first 200 days, and stabilizes below 10 µA by 600 days. This indicates an initial phase of active corrosion likely due to aggressive chloride ingress, followed by the formation of protective layers and limited ion availability. In the case of a 5 cm reservoir length (T1-25X), Icorr starts at moderate levels (around 20–25 µA) with significant fluctuations during the first 600 days, stabilizing around 10–15 µA between 600 and 1400 days, and showing a late-phase increase (up to ~30 µA for rebar C) after 1400 days. The larger reservoir likely prolonged moisture and ion ingress, causing periodic spikes in corrosion activity and suggesting a localized breakdown of protective layers. Meanwhile, the specimen with a 5 cm reservoir length (T1-28X) demonstrates superior corrosion resistance, with Icorr starting low (around 5–10 µA) and remaining stable with minimal fluctuation, likely due to enhanced densification and reduced chloride diffusion achieved by the fly ash and slag. For the specimen with a 10 cm reservoir length (T1-27X), Icorr initially starts high (around 30–40 µA) during the first 200 days, reflecting active corrosion due to incomplete hydration. Between 200 and 1000 days, Icorr decreases significantly (around 10–20 µA) as the fly ash and slag improve the concrete’s durability by reducing permeability and ion ingress. After 1000 days, a slight increase (around 10–30 µA) indicates possible re-initiation of corrosion due to chloride accumulation. When comparing all cases, smaller reservoirs (2.5 cm) exhibit rapid corrosion initiation due to aggressive ion ingress in the early stages. However, the limited size of the reservoir restricts the continuous supply of chlorides and moisture, resulting in lower long-term corrosion rates as the system stabilizes. In contrast, larger reservoirs (10 cm) provide a sustained pathway for chloride and moisture ingress, leading to prolonged corrosion activity over time, as reflected by higher long-term corrosion rates and periodic spikes in the Icorr values. Among the specimens, the T1-28X specimen demonstrates significantly better performance compared to the T1-25X specimen. The consistently lower Icorr values observed in T1-28X highlight the superior corrosion resistance achieved through the optimized material composition, specifically the use of fly ash and slag, which improve the concrete’s microstructure by reducing porosity and permeability. Additionally, effective curing conditions contribute to enhanced densification and the formation of robust passive layers on the steel rebars.
Figure 13 presents the evolution of Icorr over time for T2 specimens with varying reservoir lengths and three embedded rebars (A, B, and C). For T2(30X) specimens with a 2.5 cm reservoir length, Icorr begins low (around 10 µA) during the early phase (0–200 days), stabilizing below 10 µA after 200 days with minimal fluctuations, except for a spike (around 15 µA) around 1000–1200 days in rebar B, likely due to localized chloride ingress or passivation disruption. The smaller reservoir restricts ion ingress, maintaining low corrosion rates. For T2(31X) specimens with a 5 cm reservoir length, Icorr peaks higher (around 20–30 µA) during the first 250 days, indicating greater ion availability. It decreases to around 5–10 µA by 600 days, stabilizing with occasional late-phase spikes (around 15 µA for rebar B at 1430 days), reflecting prolonged ion ingress. For T2(32X) specimens with a 5 cm reservoir length, the Icorr initially peaks at 30–33 µA during the first 200 days due to higher moisture and chloride availability. It then decreases to around 10 µA by 200–600 days as the hydration of fly ash and silica fume reduces permeability and ion ingress. Beyond 600 days, Icorr stabilizes at 5–10 µA, indicating a passive state with minimal corrosion activity, apart from occasional late-phase spikes due to localized disruptions. For T2(29X) specimens with a 10 cm reservoir length, during the initial phase (0–200 days), all rebars show low Icorr values (<15 µA), followed by a significant rise for rebar A (peaking at 20–25 µA) between 200 and 600 days, indicating increased environmental susceptibility. The rebars B and C exhibit smaller peaks, and the Icorr values were mostly less than 10 µA. After 600 days, fluctuations in rebar A’s Icorr suggest wet-dry cycles, while rebars B and C stabilize with moderate corrosion activity. Beyond 1200 days, all rebars stabilize below 10 µA, possibly due to protective layer formation or reduced availability of corrosive agents. The reservoir length affects Icorr values by controlling ion availability. The smaller reservoirs (2.5 cm, T2-30X) restrict ion ingress, maintaining low Icorr values with minimal fluctuations. The medium reservoirs (5 cm, T2-31X and T2-32X) show higher initial Icorr peaks due to greater ion availability but stabilize at around 5–10 µA after 600 days as concrete densifies. The larger reservoirs (10 cm, T2-29X) exhibit delayed yet significant Icorr increases, particularly for rebar A, due to prolonged exposure. As time passed, all specimens stabilized, demonstrating the protective effects of fly ash and silica fume. Therefore, smaller reservoirs limit long-term corrosion by restricting ion ingress, while larger reservoirs sustain higher initial and long-term corrosion activity. SCMs like fly ash and silica fume enhance durability by reducing permeability and enhancing passivation, but larger reservoirs emphasize the need for additional protective measures to manage long-term corrosion risks. Comparable findings regarding Icorr values for the T1 and T2 samples have been documented in several studies [
41,
48,
49]. These studies consistently highlighted similar trends in corrosion activity, where the Icorr values aligned closely with those observed in the current investigation. The reported data not only corroborate the present results but also reinforce the influence of various experimental conditions and mix compositions on the corrosion performance of the samples. This consistency across studies suggests a robust relationship between the experimental parameters and the measured Icorr values for both the T1 and T2 specimens.
Table 5 highlights the average Icorr values along with the STD values across three rebar specimens (A, B, and C) at varying reservoir lengths for the T1 and T2 concrete mixes, which were calculated from the last 15 sets of data obtained through the GP tests. The influence of reservoir length is evident in both the T1 and T2 samples. As the reservoir length increases from 2.5 cm to 10 cm, there is a consistent rise in Icorr values for both sets of samples, indicating higher corrosion activity due to increased chloride and moisture ingress. However, T2 samples consistently exhibit lower Icorr values compared to T1 samples, especially at 5 cm and 10 cm, suggesting that the incorporation of silica fume in the T2 sample enhances corrosion resistance by reducing permeability and improving the microstructure of the concrete. The STD values also highlight the stability of corrosion behavior in the T2 samples, with lower variability compared to the T1 samples at all reservoir lengths. The role of SCMs is critical in controlling corrosion rates. The T1 samples, which incorporate fly ash and slag, exhibit higher Icorr and STD values compared to the T2 samples, which combine fly ash and silica fume. The combination of fly ash and slag improves durability and reduces permeability, but does not offer the same level of protection as silica fume, which significantly enhances the concrete matrix’s density and reduces permeability. Silica fume’s contribution results in more stable corrosion behavior across different exposure conditions. Therefore, the findings underline the importance of selecting appropriate SCMs, such as silica fume, and optimizing environmental exposure, such as reservoir length, to mitigate corrosion in reinforced concrete structures effectively. Moreover, comparisons of selected rebars between the T1 and T2 groups suggest that reservoir length plays a crucial role in determining corrosion behavior, with longer reservoir lengths correlating with higher average Icorr values and greater variability. The average Icorr values for the FA samples (containing 20% fly ash as a cement replacement) varied between 39.9 and 91.0 µA, as reported by Balasubramanian [
50]. These samples were installed vertically and subjected to electromigration techniques to expedite chloride ion transport [
50]. In contrast, the present study positioned the samples horizontally, with chloride ponds created directly above the embedded rebar within the specimens. Kayali and Zhu documented Icorr values ranging from 9.7 to 25.3 µA for the T2 specimens [
51]. Additionally, for concrete mixes incorporating fly ash as a partial cement replacement, Otieno et al. reported an average Icorr value of 49.9 µA [
7], while O’Reilly et al. observed an average Icorr value of 38.5 µA [
52].
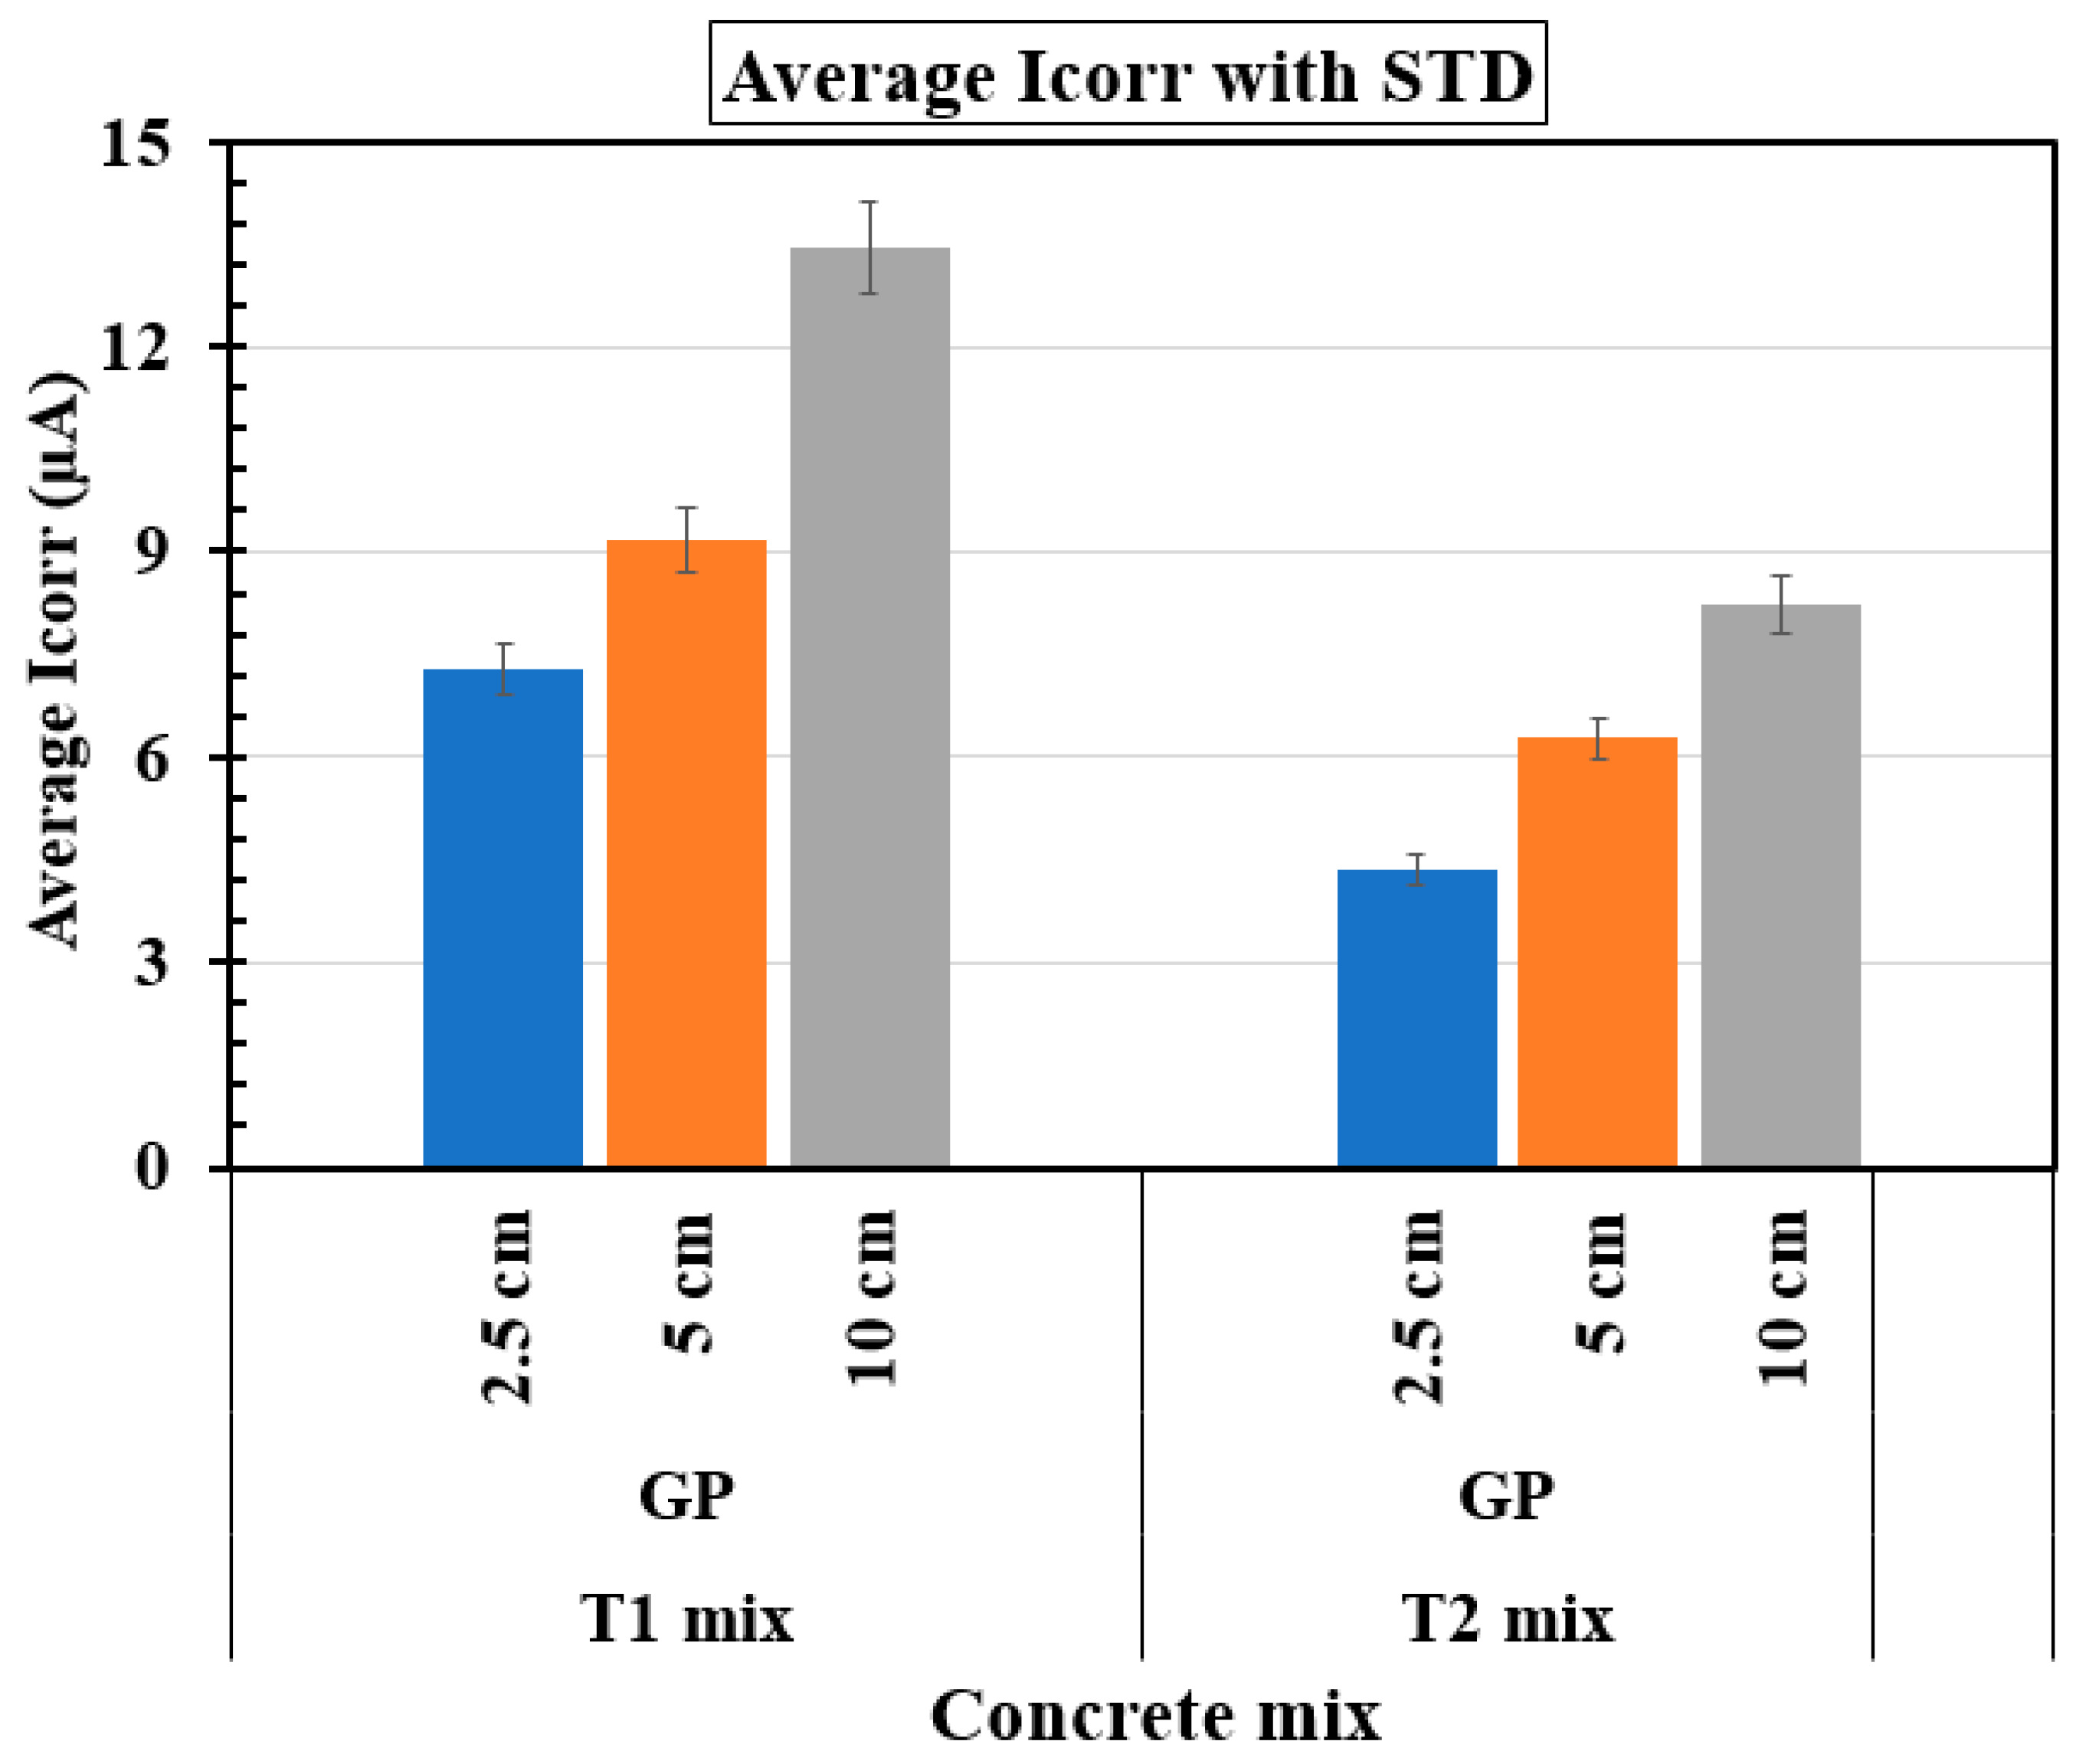
Figure 14 presents the variation of average Icorr with different reservoir lengths (2.5 cm, 5 cm, and 10 cm) for two concrete mixes, T1 and T2, each cast with three rebars. In both mixes, Icorr increases as the reservoir length increases, indicating a higher corrosion rate with greater moisture and ion ingress. For the T1 mix, Icorr is lowest at 2.5 cm (~7 µA), increases at 5 cm (~9 µA), and reaches its highest value at 10 cm (~13 µA). A similar trend is observed for the T2 mix, though the values are slightly lower than those for the T1 mix at each corresponding reservoir length. The higher Icorr values for longer reservoirs suggest that increased exposure to electrolytes accelerates corrosion, while shorter reservoirs provide better protection, likely due to reduced permeability. The improved corrosion resistance of the T2 mix compared to the T1 mix is likely due to differences in the SCMs. While the T1 mix (partial cement replacement of fly ash and slag) enhances long-term strength and reduces permeability, the T2 mix (partial cement replacement of fly ash and silica fume) provides superior pore refinement due to silica fume’s high reactivity. This leads to a denser matrix, reducing chloride and moisture ingress, which lowers Icorr values and improves reinforcement passivation. Thus, silica fume in the T2 mix plays a key role in enhancing durability and mitigating corrosion more effectively than slag in the T1 mix.
The time-dependent Icorr trends for the T1 and T2 concrete mixes reveal the influence of reservoir length and SCMs on corrosion behavior. The longer reservoirs led to higher Icorr values in both mixes, indicating greater chloride and moisture ingress. The T1 mixes showed initial corrosion spikes that later stabilized, though larger reservoirs caused periodic increases due to possible passive layer breakdowns. Fly ash and slag in the T1 mixes improved durability, but the T2 mixes—containing fly ash and silica fume—consistently exhibited lower, more stable Icorr values due to enhanced microstructure and reduced permeability. Therefore, the analysis underscores the effectiveness of silica fume in the T2 mixes for mitigating corrosion, highlighting the importance of optimized SCM selection and exposure control for long-term durability in RC structures.
4.6. Icorr vs. Rs
Figure 15 and
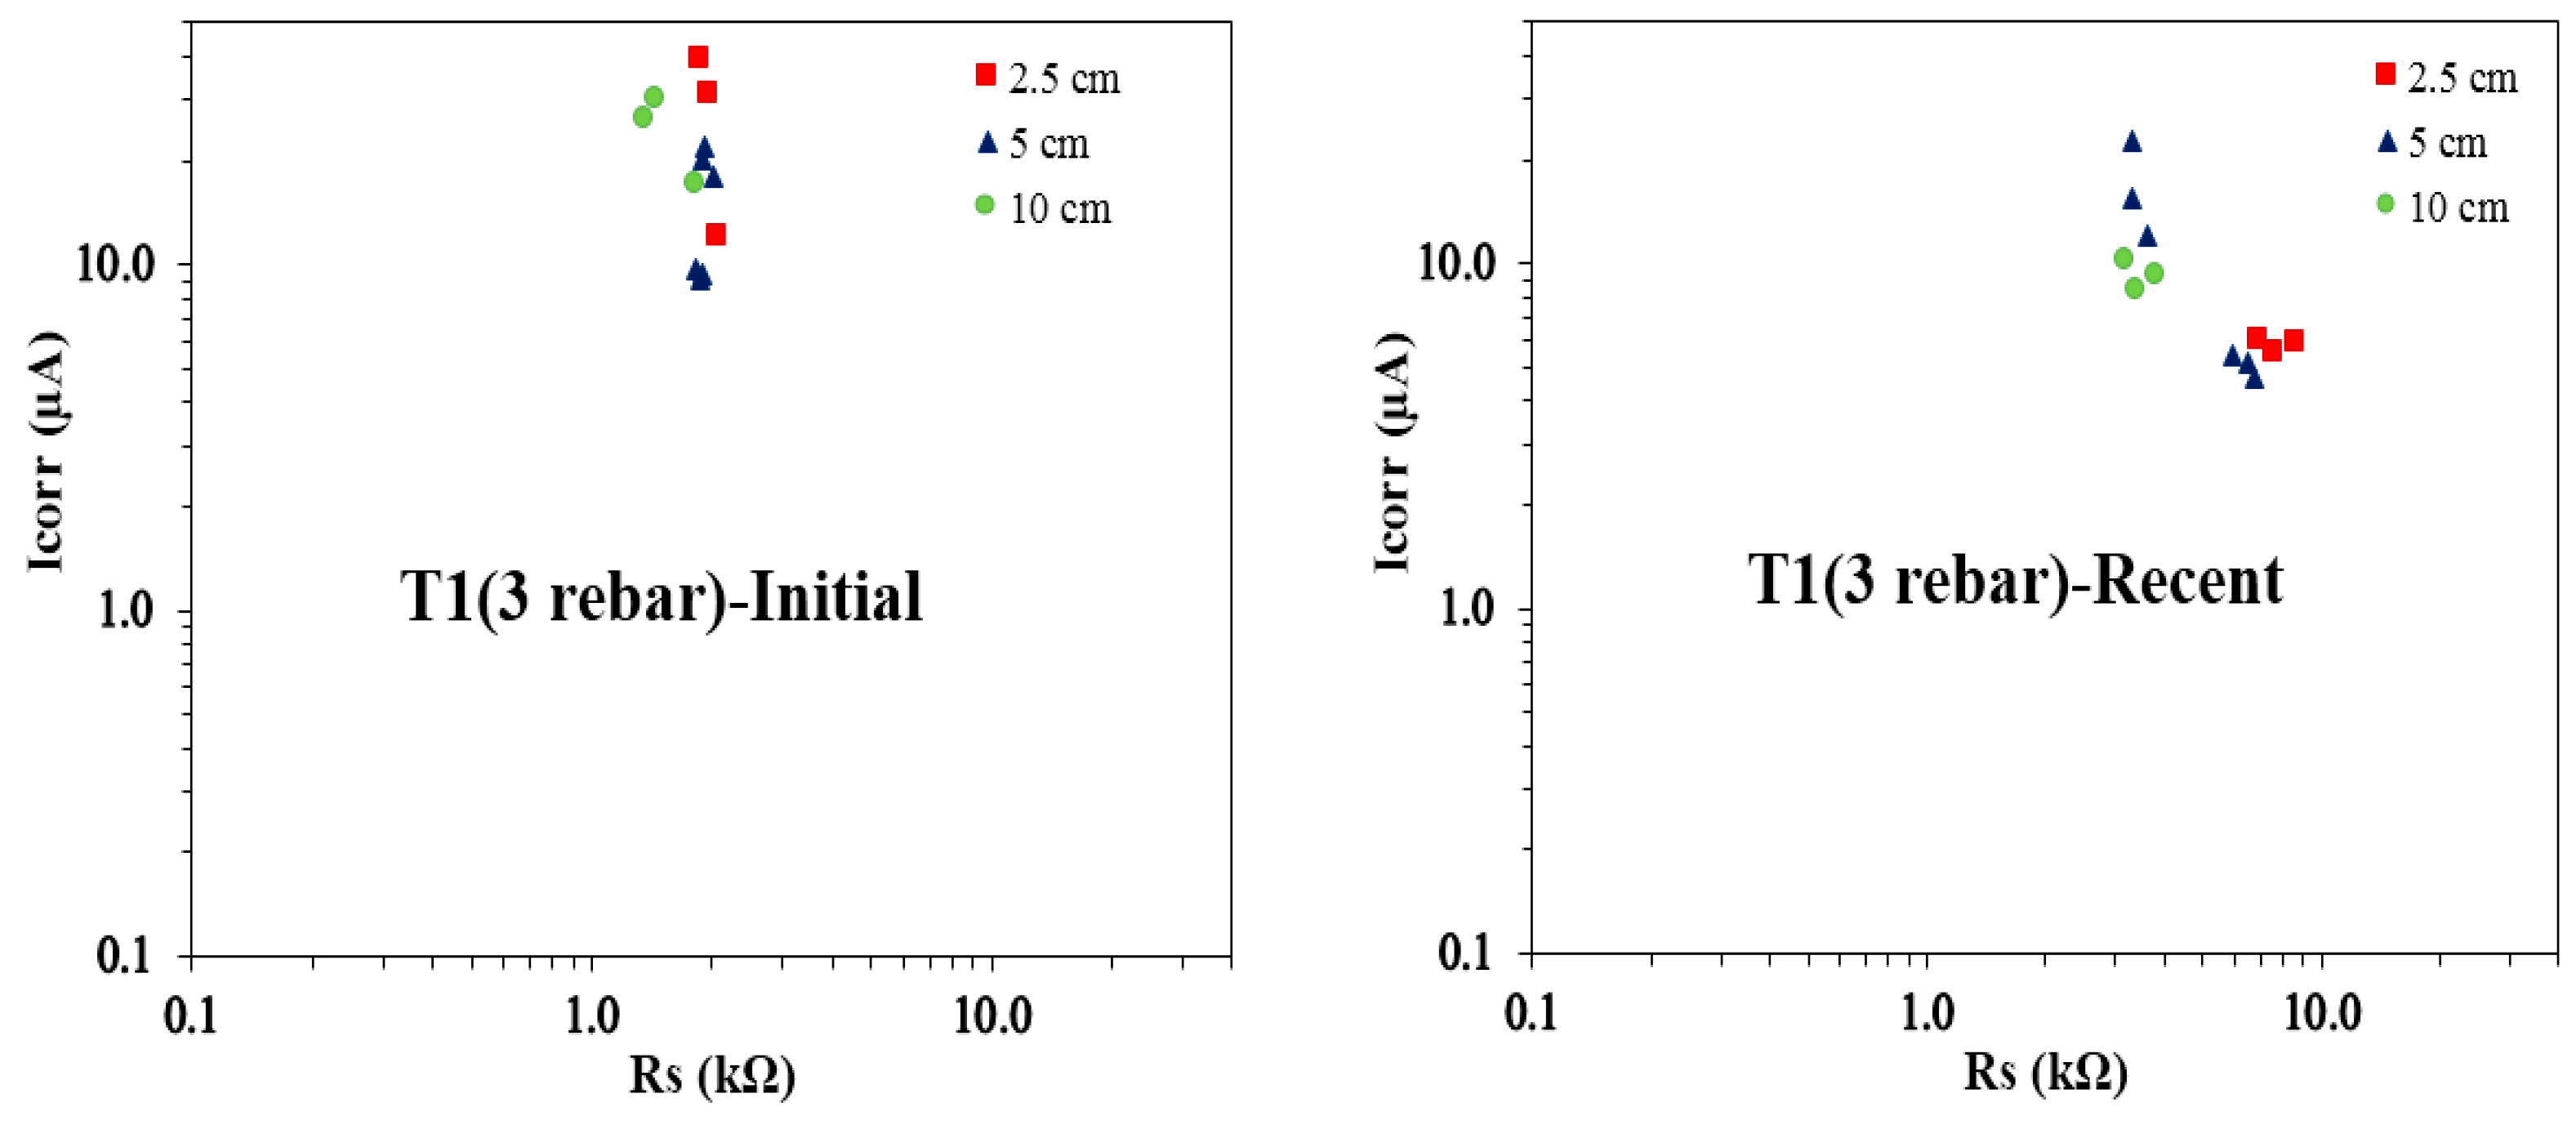
Figure 16 present the Icorr vs. Rs plots derived through GP measurements for the T1 and T2 concrete mixes, each incorporating three rebars. The plots to the left (termed ‘Initial’) illustrate the initial Icorr vs. Rs values, based on the first three measurement sets (from day 190 to day 250) taken shortly after GP monitoring commenced. In contrast, the plots to the right (termed as ‘Recent’) display the most recent Icorr vs. Rs values, derived from the last two measurement sets (from day 1410 to day 1480). This comparison highlights the progression of rebar corrosion behavior over time, revealing how the relationship between Icorr and Rs changes as the concrete specimens mature and are exposed to varying environmental conditions.
Figure 15 shows the relationship between Icorr and Rs for T1 concrete specimens with three rebars, comparing initial and recent measurements across different reservoir sizes. A consistent pattern emerges, with recent Rs values surpassing initial values for all reservoir sizes. Notably, the 10 cm reservoir samples display the lowest Rs values in both measurement sets. Initial Icorr readings for the 5 cm and 10 cm reservoirs are similar, whereas recent Icorr values show a closer alignment between the 2.5 cm and 5 cm reservoirs, suggesting comparable active corrosion areas under these conditions. Additionally, the highest initial Icorr values are observed in the 2.5 cm reservoir samples, while the 5 cm samples show the highest recent Icorr values, indicating a shift in corrosion behavior over time. The recent Icorr vs. Rs data for the 2.5 cm reservoir samples are tightly clustered, signifying more uniform corrosion activity. In contrast, the 5 cm and 10 cm samples exhibit broader variability in Icorr values despite relatively consistent Rs values, highlighting differences in corrosion progression influenced by reservoir size.
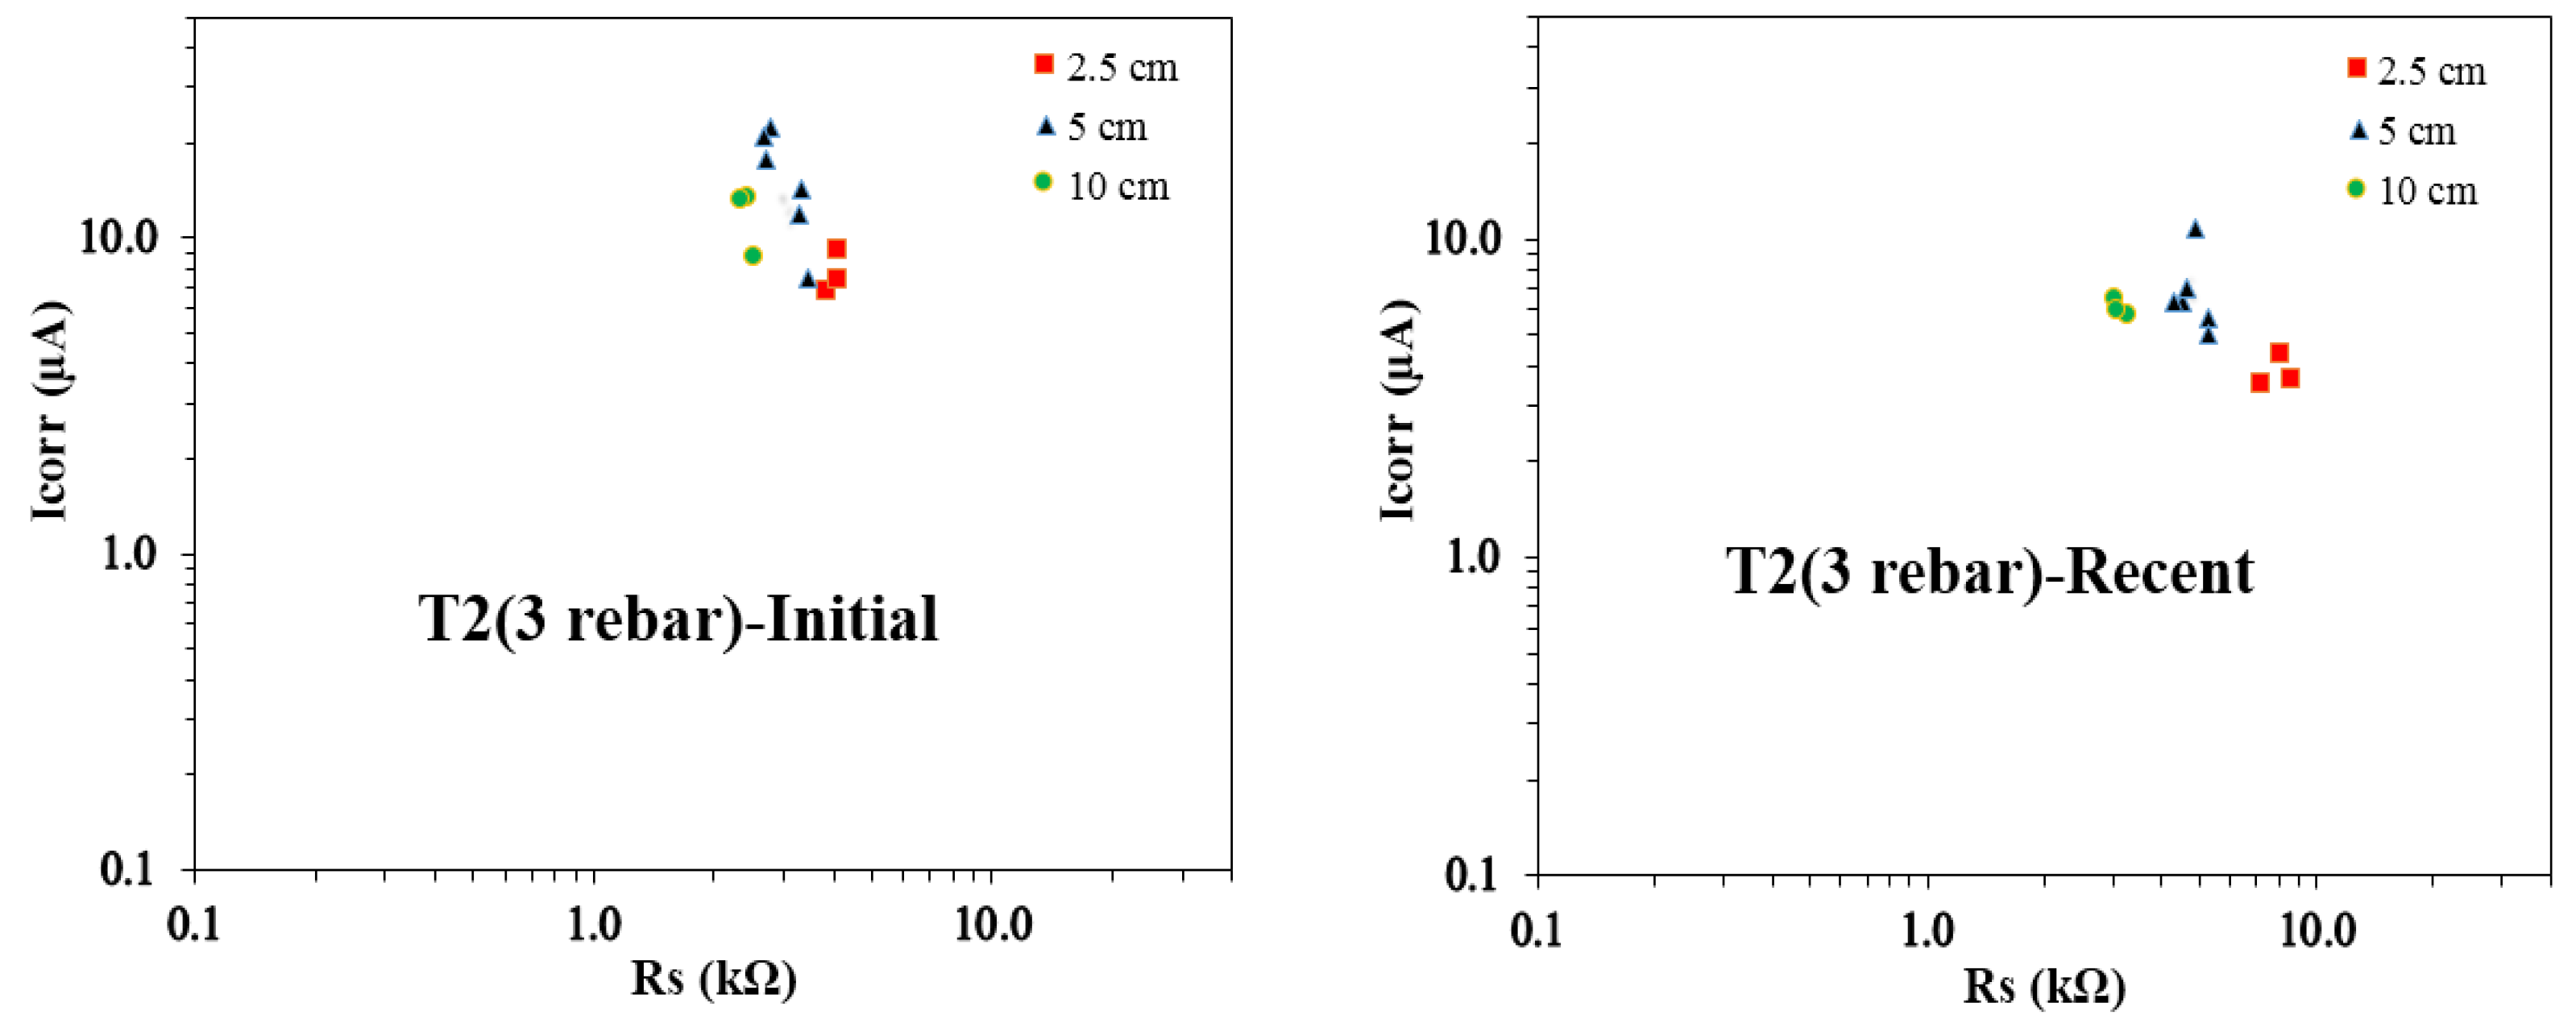
Figure 16 illustrates the Icorr vs. Rs plots for T2 concrete samples with three rebars, highlighting trends in corrosion behavior across different reservoir sizes. A consistent pattern emerges, with recent Rs values exceeding initial values for all reservoir sizes. Despite this increase, the 10 cm reservoir samples consistently show the lowest Rs values in both initial and recent measurements. Notably, initial Icorr values are similar between the 2.5 cm and 5 cm reservoirs, as well as between the 5 cm and 10 cm reservoirs. In contrast, recent Icorr values exhibit comparable trends across the 2.5 cm, 5 cm, and 10 cm reservoirs, indicating that the actively corroding areas may be of similar scale across these sizes. The highest initial and recent Icorr values are recorded for the 5 cm reservoir samples, suggesting a progression of corrosion activity over time, with sustained conditions favoring increased corrosion rates. A key pattern in the recent measurements is the tightly clustered Icorr vs. Rs pairs for the 2.5 cm and 10 cm reservoirs, signifying more uniform corrosion behavior. Meanwhile, the 5 cm reservoir samples display a wider spread in Icorr values alongside relatively consistent Rs values, reflecting more variability in corrosion current with stable resistance characteristics. Both
Figure 15 and
Figure 16 reveal consistent trends, aligning with previous studies [
41,
48] and reinforcing the observed relationships between Icorr, Rs, and reservoir size.
The analysis of Icorr vs. Rs relationships for the T1 and T2 concrete mixes provides valuable insights into the progression of corrosion behavior over time. A clear trend emerges, with recent Rs values exceeding initial values across all reservoir sizes, suggesting changes in concrete resistivity and corrosion dynamics due to prolonged exposure. The 10 cm reservoir samples consistently exhibit the lowest Rs values in both initial and recent measurements. The variations in Icorr trends across different reservoir sizes indicate shifts in active corrosion areas, with some reservoir sizes showing more tightly clustered recent Icorr vs. Rs values, signifying uniform corrosion activity. Notably, in both concrete mixes, the 5 cm reservoir samples display the highest recent Icorr values, highlighting an increase in corrosion activity over time. The wider variability in Icorr for certain reservoir sizes, despite stable Rs values, underscores the influence of reservoir size on corrosion progression. These observations emphasize the evolving nature of reinforcement corrosion as concrete specimens mature under environmental exposure.
4.7. Theoretical (Faradaic) Calculation of Mass Loss
In this study, a theoretical mass loss approach was employed since no visible cracks were observed in any of the samples. The GP method was intermittently conducted to measure Rc values, which were then used to estimate the corrosion current. The corrosion current for each time interval was calculated as the average of two consecutive Rc values. This average current was multiplied by the duration of the interval to determine the total charge for that period, and the cumulative charge for each rebar was obtained using Equation (1). Using Faraday’s law, the apparent mass loss was subsequently calculated, as described in Equation (2).
where
Q is in coulombs and
t is in seconds.
The mass loss calculated using Faraday’s law is expressed as follows:
where
Atomic Mass is 55.85 g (for Fe),
n is 2 (# of electrons), and
F is 96,500 C (Faraday’s constant).
Table 6 presents the estimated mass loss values for the T1 and T2 concrete samples, each embedded with three rebars, across different reservoir sizes. For the T1 samples, the 10 cm reservoirs (Sample 27X) showed the highest mass loss values (e.g., A: 0.458 g, B: 0.496 g, C: 0.535 g), likely due to greater moisture and oxygen availability accelerating corrosion. In contrast, the 5 cm reservoirs (Sample 25X) had the lowest mass loss values (A: 0.162 g, B: 0.195 g, C: 0.173 g), as smaller reservoirs limit exposure to aggressive agents. It is interesting to note that the two samples with 5 cm reservoirs (Samples 25X and 28X) exhibited significant variability, with sample 28X showing notably higher mass loss compared to sample 25X, likely influenced by differences in experimental conditions or concrete composition. For the T2 samples, the 10 cm reservoir (Sample 29X) also recorded relatively high mass loss values, though with considerable variability among rebars (e.g., A: 0.394 g, B: 0.242 g, C: 0.229 g), potentially due to localized corrosion. The 2.5 cm reservoir (Sample 30X) had the most uniform and lowest mass loss values (A: 0.165 g, B: 0.148 g, C: 0.148 g), suggesting limited corrosion due to restricted environmental exposure. The samples with 5 cm reservoirs (Samples 31X and 32X) demonstrated moderate mass loss values, with sample 32X showing slightly more consistent results across rebars. When comparing the T1 and T2 concrete samples, it is evident that the T1 samples consistently exhibited higher mass loss across the different reservoir sizes. This can be attributed to the distinct differences in the mix designs of the two types of concrete. The T1 concrete includes fly ash and slag as partial replacements for cement, which may have contributed to its increased susceptibility to corrosion under the given conditions. These materials, while offering benefits such as improved workability and durability in some contexts, can also alter the concrete’s pore structure and permeability, potentially making it more prone to the ingress of moisture and aggressive ions, thereby accelerating corrosion. Both the T1 and T2 samples showed an increase in mass loss with the larger reservoir sizes, particularly in the 10 cm reservoirs, where the higher availability of moisture and oxygen likely facilitated more extensive corrosion. The larger reservoirs provided a more conducive environment for the corrosion process to thrive, resulting in greater mass loss. In contrast, the 2.5 cm reservoirs showed significantly lower mass loss for both sample types, indicating that smaller reservoirs limit the exposure of the concrete to corrosive agents. The reduced space and limited water flow likely restricted the diffusion of oxygen and moisture, which are essential for the corrosion process, thus mitigating the overall mass loss in these samples.
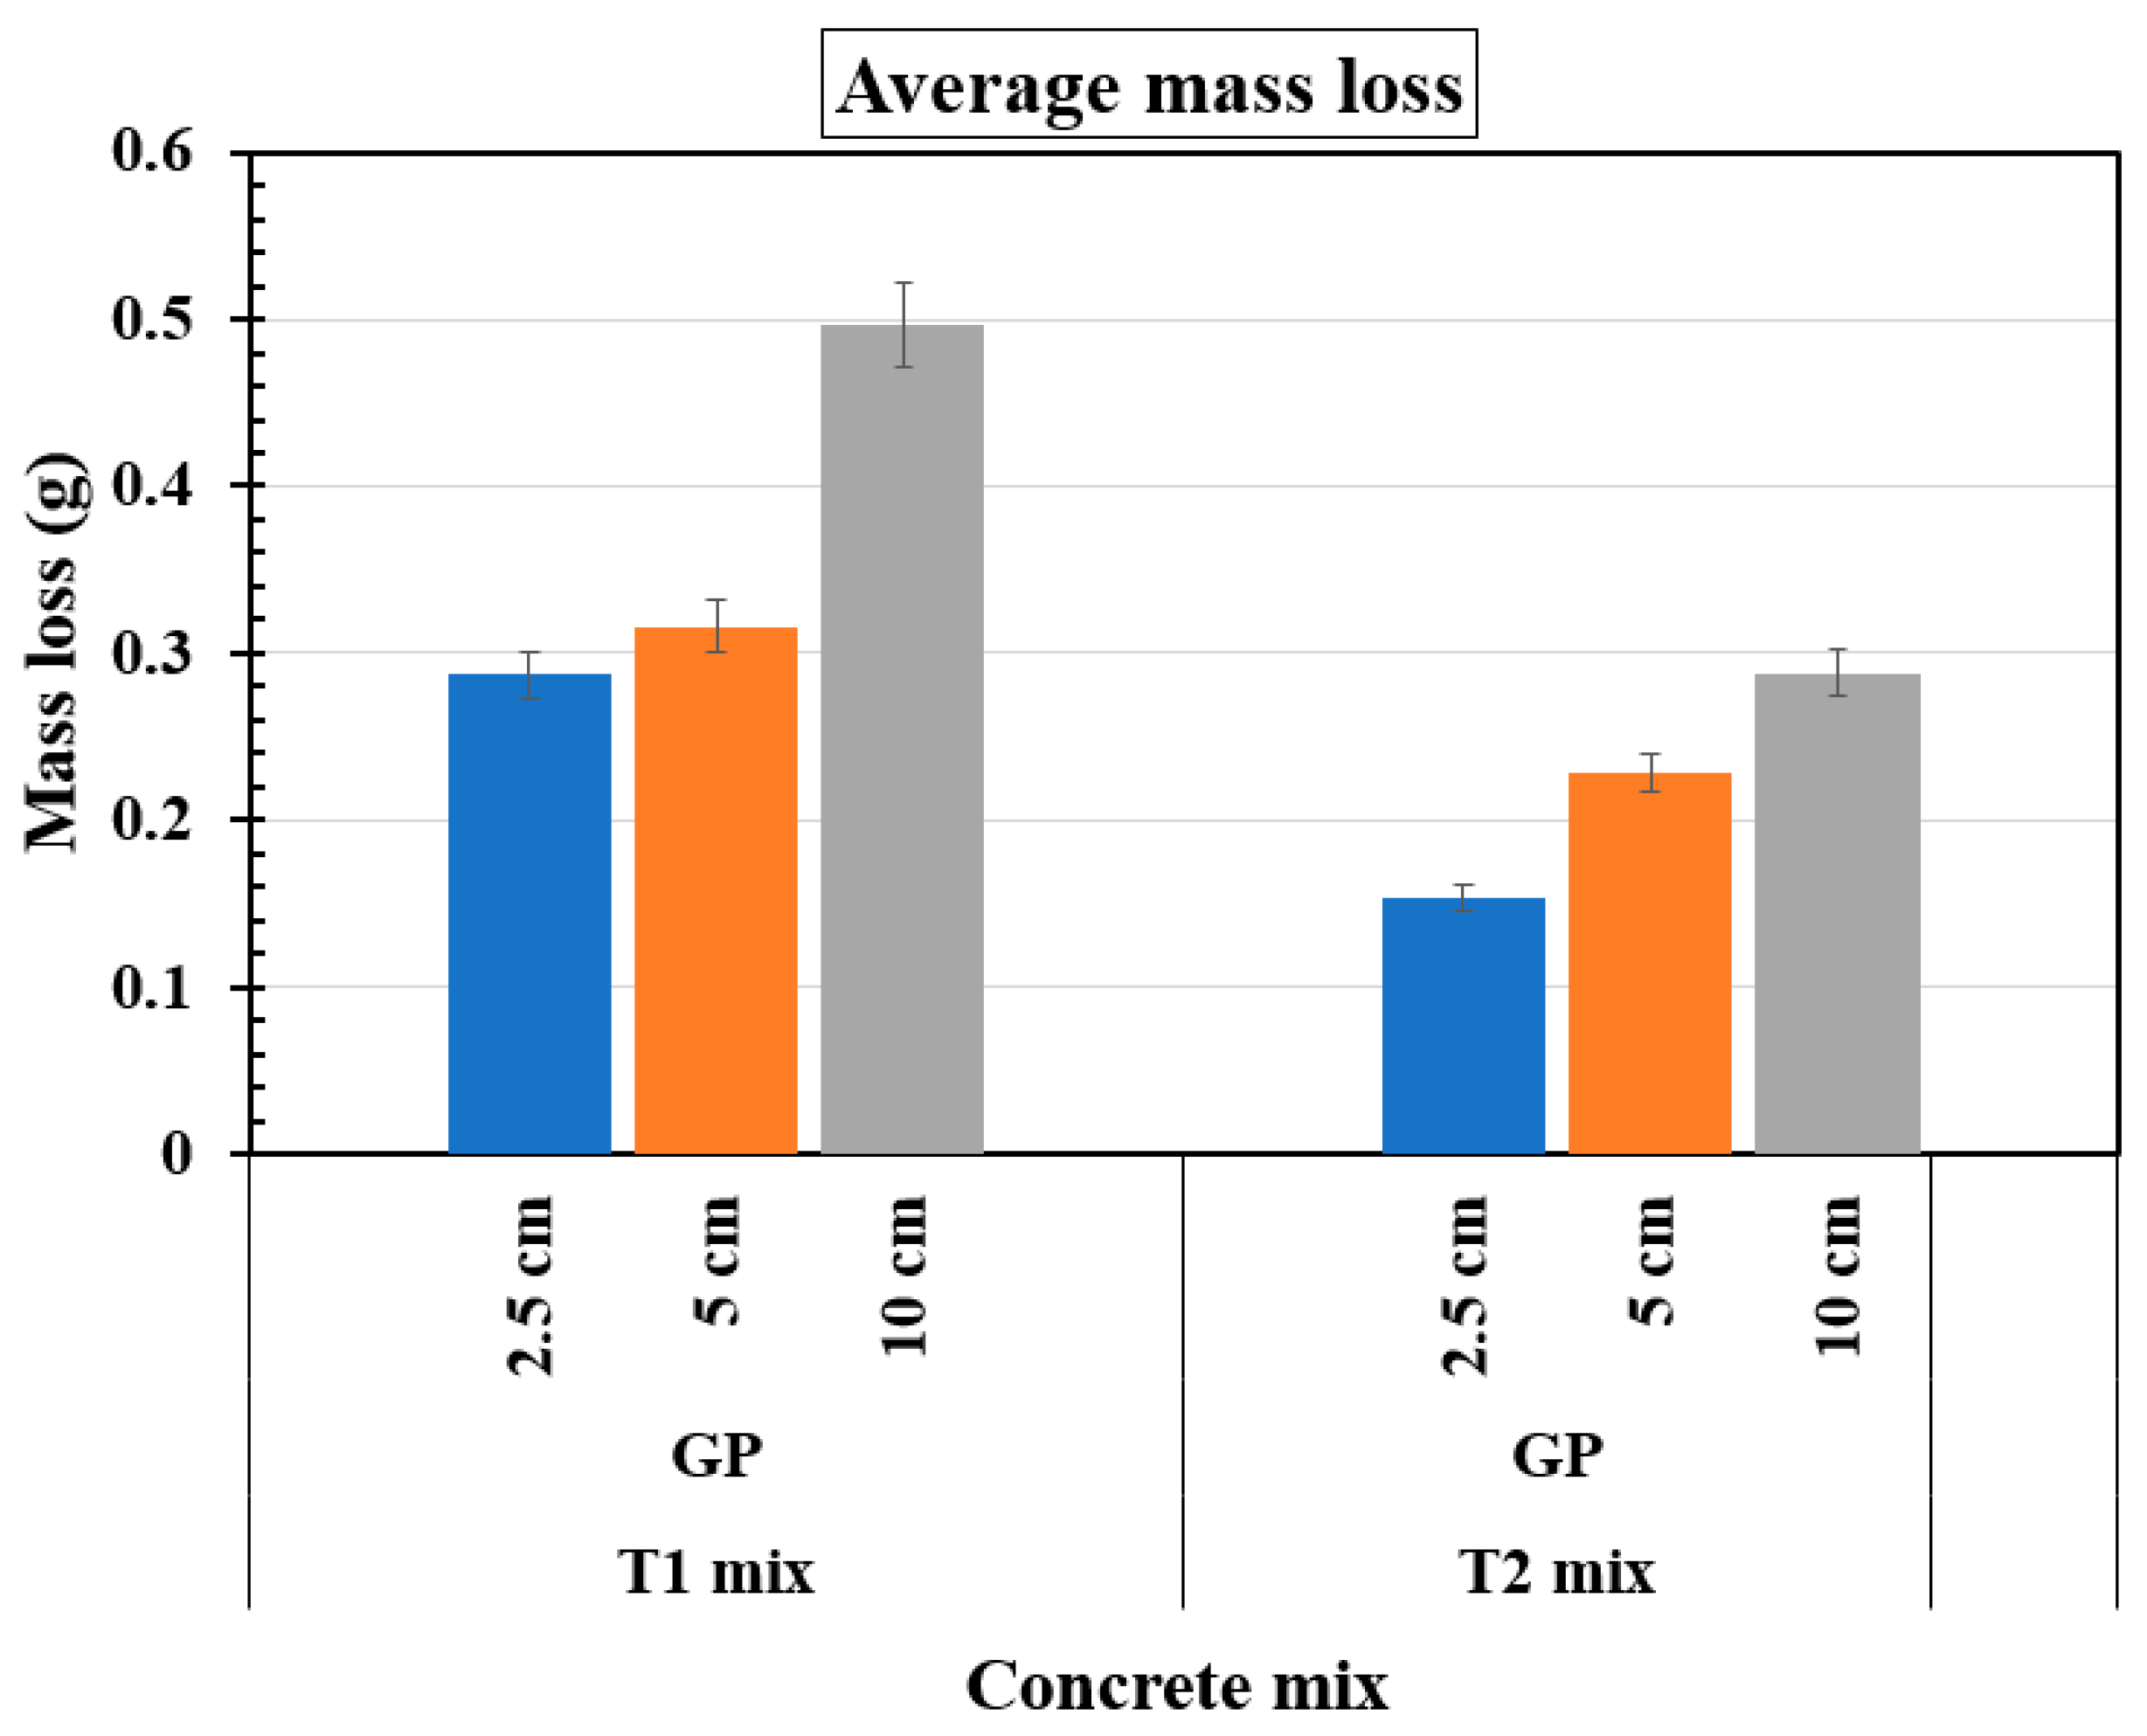
Figure 17 presents the variation in average mass loss as a function of reservoir length and concrete mix type (T1 and T2), each containing three embedded rebars. For the T1 mix, mass loss progressively increases with reservoir length, reaching its highest values in the 10 cm reservoir samples. This trend suggests that larger reservoirs promote more severe corrosion, likely due to greater moisture availability and sustained electrochemical activity. Similarly, the T2 mix also exhibits an increase in mass loss with reservoir length; however, the overall values remain significantly lower compared to the T1 mix. This indicates that the T2 mix provides enhanced resistance to corrosion, likely due to its refined microstructure and reduced permeability. Although both mixes follow the general pattern of higher corrosion activity in larger reservoirs, the T1 mix displays greater fluctuations and higher mass loss, emphasizing the superior durability of the T2 mix.
Torres-Acosta’s study on concrete beams and cylindrical specimens with chloride-contaminated mixes exposed to 75% RH and a 100 μA/cm
2 impressed current found mass loss ranging from 0.3 to 14.4 g (beams) and 0.7–5.1 g (cylinders) via forensic analysis, with similar Faradaic values (0.3–12.5 g for beams; 0.6–5.8 g for cylinders) [
53]. Corrosion-induced cracks were observed in all specimens, contrasting with the current study, where higher moisture levels prevented cracking despite some external rebar corrosion. Balasubramanian’s research on reinforced concrete pipes prepared with either fly ash or Portland cement, under 95% RH and electromigration-induced corrosion, showed mass loss of 2.0–10.3 g (fly ash) and 0.6–3.2 g (Portland cement) by forensic analysis, with slightly higher Faradaic values [
50]. The fly ash specimens in vertical exposure showed 0.6–1.2 g mass loss (forensic) and 2.0–5.9 g (Faradaic), while horizontal exposure reduced these to 0.1–0.3 g and 1.9–2.0 g, respectively [
50]. No cracks were observed in Balasubramanian’s study, likely due to high moisture enabling corrosion products to diffuse into the concrete, reducing localized stresses [
39,
40,
41].


