Article

Framework for Cement Plants Assessment Through Cement Production Improvement Measures for Reduction of CO2 Emissions Towards Net Zero Emissions

by
Esraa Khalil
* and
Mohamed AbouZeid
Department of Construction Engineering, School of Sciences and Engineering, The American University in Cairo, Cairo P.O. Box 74, Egypt
*
Author to whom correspondence should be addressed.
Constr. Mater. 2025, 5(2), 20; https://doi.org/10.3390/constrmater5020020
Submission received: 11 January 2025 / Revised: 4 February 2025 / Accepted: 12 February 2025 / Published: 1 April 2025

Abstract

:
Recent global strategies highlight the urgency of addressing greenhouse gas (GHG) emissions, particularly CO2 from energy-intensive industries such as cement production. Studies show that the cement industry contributes around 8% of the global CO2 emissions, emphasizing the need for innovative and structural mitigation strategies. While advancements in carbon capture technologies, LC3 cement, alternative raw materials, and renewable energy integration are critical for achieving the net zero emissions (NZEs) goal, the challenge lies in having a structured and comprehensive approach for systematically categorizing, prioritizing, and assessing various CO2 improvement measures within cement plants. To address this gap, this study introduces a structured assessment model designed to evaluate and rate proposed CO2 improvement measures based on their alignment with the global NZE targets and plant-specific milestones, providing an overall cement plant performance score. The assessment tool developed in this study provides a quantitative scoring system for assessing the implementation level and impact of various CO2 improvement measures within cement plants. The framework integrates the cleaner production concept and the 5Cs approach to the decarbonization of the cement industry, offering a systematic yet flexible method for cement industry decarbonization. To validate the assessment tool, two cement plants with different production scales and located at different geographical locations were analyzed. Plant A achieved an overall performance score of 3.315, while plant B scored 3.68. The assessment identified a potential CO2 reduction of 20–30% through targeted improvements, highlighting that even well-established cement plants have opportunities for emissions reduction and efficiency enhancement. This study advances existing assessment methodologies by providing an adaptable, data-driven, systematic, and scalable tool that enhances decision-making, strategic modifications, and resource allocation for achieving NZE targets. Additionally, this assessment tool bridges the gap between global targets and plant-level implementation, ensuring effective transition towards sustainability in the cement industry.

1. Introduction

Over the past decade, the construction industry has had the ambitious goal of achieving zero emissions by 2050, which is the motive for undertaking several encouraging initiatives. While efforts to reduce cement usage have been ongoing, the increasing global threat posed by climate change has amplified the urgency [1,2]. Several leading organizations have established pathways and roadmaps to achieve the 2050 target, including the World Green Building Council (WorldGBC), the International Energy Agency (IEA), United Nations Net Zero Coalition, the European Cement Association (CEMBUREAU), Global Cement and Concrete Association (GCCA), the Intergovernmental Panel on Climate Change (IPCC), Cement Sustainability Initiative (CSI), and Science-Based Targets initiative (SBTi). They have outlined a phased strategy to reach NZEs. This includes a key milestone to achieve a 40% reduction in embodied carbon by 2030, with all new buildings expected to operate in net zero carbon [3,4,5,6,7,8,9]. However, this does not imply a halt in construction or reduced building activity due to fast urbanization, which has led the cement industry to become one of the highest consumers of natural resources, energy, land, and water and a major contributor to CO2 emission worldwide [10,11]. Cement is a key construction material that is in high demand and is produced in large quantities yearly [12]. In 2022, the global production of Portland cement was 4.1 billion tons compared to 3.3 billion tons in 2010 [13]. To illustrate, producing 1 ton of cement requires, on average, approximately 1.5 tons of raw materials, between 3300 and 4300 MJ of fuel energy, and around 100 to 120 kWh of electrical energy, and releases between 0.73 and 0.99 tons of CO2, depending primarily on the clinker-to-cement ratio [14,15,16,17].
Moreover, according to the International Energy Authority (IEA)’s 2022 World Energy Outlook, cement production as a steadily growing and energy-intensive industry is estimated to produce around 1.4 Gt of CO2 emissions per year, which is roughly 8% of the global GHG emissions [18,19,20]. According to the Intergovernmental Panel on Climate Change (IPCC), by the year 2050, there should be around USD 1.6 trillion in investments per year to put the planet in a safe climate zone [20]. Environmental policies across the globe are affecting different industrial sectors, and the cement industry is expected to feel this impact [5,21,22]. In the past decades, there have been some international initiatives to reduce cement-generated CO2, the industry’s footprint, and to control emissions. Some of these initiatives include the Greenhouse Gas Protocol by World Resources, the World Resource Institute (WRI), the World Business Council for Sustainable Development (WBCSD), the Kyoto Protocol, and others [23,24,25]. Moreover, the ambition of limiting climate change to below 2 °C, as established by the Paris Agreement, has pushed the need for major industries, such as the cement industry, to assess, monitor, and modify their production processes [5,24,26]. For this reason, over the last decade, various pathways and strategies have proposed several mitigation and improvement measures for reducing CO2 emissions in the cement industry, including improving energy efficiency, using alternative raw materials and fuels, and assessing CO2 performance [26,27,28]. However, most of these strategies are directed towards available advanced technologies and reduction pathways that are directed towards clinker production rather than structured, systematic assessments to evaluate and rate the improvement measures across the entire cement production system. The introduction of a novel, structured, and data-driven assessment tool that addresses the limitations of the current methodologies by providing a structured, comprehensive, systematic, and quantitative scoring system for evaluating and prioritizing CO2 improvement measures within the cement value chain will bridge the gap to reach the 2050 NZE targets.

1.1. Study Aim

Despite the numerous studies on cement production decarbonization and energy efficiency by organizations such as GCCA, CSI, IPCC, and IEA, covering areas on alternative fuels, clinker substitutions, carbon capture technologies, process optimization, and others, there remains a significant gap in developing an integrated assessment model that rates and systematically assesses the performance of cement plants, particularly as concerns CO2 performance enhancements. The aim of this paper is to address critical gaps in the systematic evaluation of CO2 improvement measures within cement plants by developing a comprehensive assessment framework and an Excel-based assessment tool for the decarbonization of the cement industry [29]. These gaps include the need for a standardized methodology for evaluating and scoring several proposed CO2 improvement measures, the absence of a structured yet flexible model for integrating global NZE targets and decarbonization strategies, and the need for quantitative and qualitative decision-making tools that guide the sustainability efforts of plants towards NZEs by 2050. The model is based on the 5Cs approach, enabling systematic identification, collection, evaluation, and rating of the proposed measures that aim to reduce the carbon footprint of cement plants, hence reducing the CO2 emissions of the cement industry. The target is to incorporate advancements to reduce each of the 5Cs to achieve NZEs by 2050. The developed tool will facilitate resource allocation, future strategic planning, and decision-making supporting the NZE targets. This paper is the second in a series; the first introduced the cement production plan, the assessment tool, and its generic and case-specific application [29].

1.2. Theoretical Concept Behind Model Development

In theory, to systematically establish a framework for evaluating the improvement measures applied to a cement plant, the input and output flows of energy, materials, and others need to be studied. For this, the cleaner production theory and 5Cs approach for decarbonizing the cement industry and its relevant sectors are used for identifying, prioritizing, and setting evaluation targets for the improvement measures proposed as a roadmap for the reduction of CO2 emissions from cement manufacturing and the carbon footprint of the cement plants [30,31]. These elements are crucial in reducing emissions and promoting sustainability within the construction and related sectors. The 5Cs approach outlines the roadmap to decarbonization, focusing on clinker, cement, carbon capture and storage (CCS/CCU), construction (re)carbonation, and concrete for the assessment of CO2 improvement measures. It is a comprehensive strategy that seeks to achieve NZEs by 2050 in comparison to the 1990 baseline emissions of 783 kg CO2/ton of cement through target emissions reduction in the 5Cs across the cement and concrete value chain, as shown in Figure 1 [30]. The concept levers are in the adaption of material and energy efficiency, low-carbon fuel switching, promoting efficiency in material usage, reducing clinker-to-cement ratio, and implementing innovative and advanced technologies. The roadmap to achieve NZEs by 2050 looks at the CO2 emissions reduction pathways by acting at the different stages of the value chain [30].

2. Materials and Methods

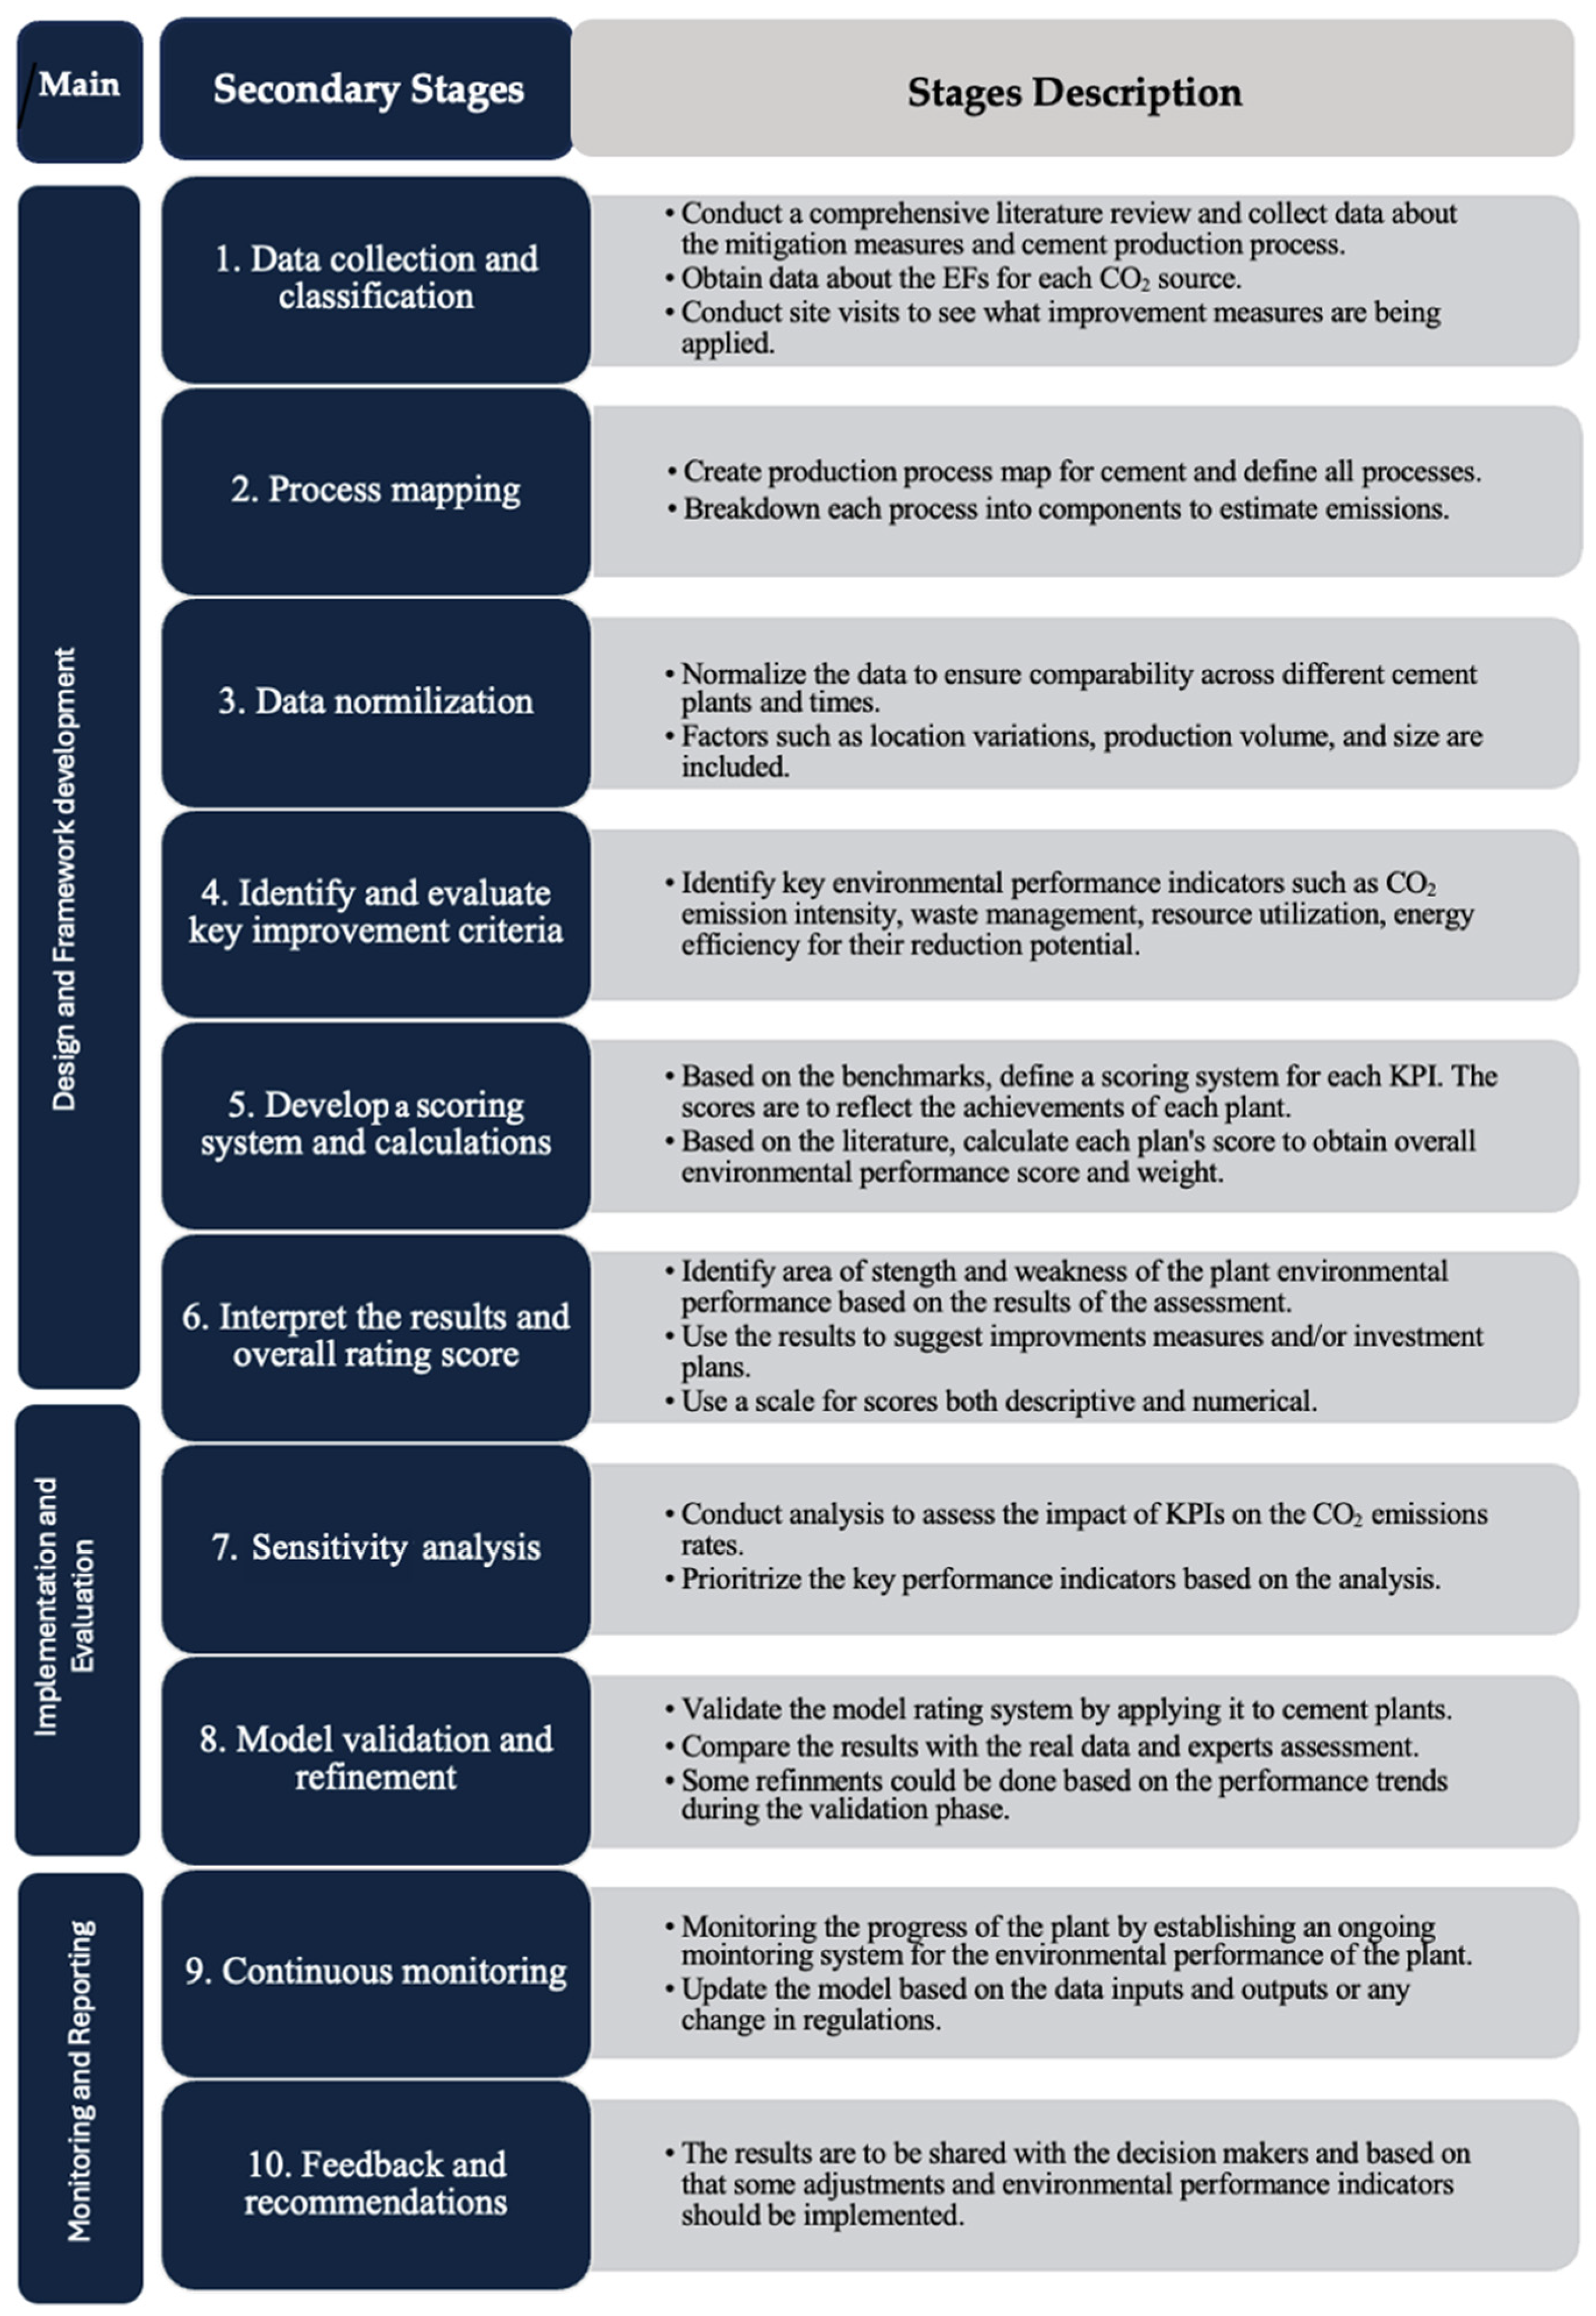
2.1. Methodological Framework and Structure

The proposed assessment model structure focuses on evaluating the cement plant’s sustainability with reference to the performance of improvement measures through the integration of multiple technologies, computations, and metrics. The model is built around key improvement parameters to reduce the CO2 emissions of the cement plants. This includes five main areas of improvement: process and technology efficiency, alternative fuels and energy management, alternative raw material and clinker production, emission control, and industry innovations and facility operations. In addition to the five main areas, 14 first subareas and 43 s subareas. The structure is designed to assess the impact of these measures on reducing the CO2 emissions of cement plants, hence reducing their environmental carbon footprint while maintaining efficiency. This model structure facilitates detailed analysis of cement plants while providing flexibility to modify weights and assumptions. Although the quantity of cement produced will directly impact the amount of CO2 emissions from the cement plant, the proposed evaluation tool remains consistent. The same methodological criteria and computations are used to assess the plant’s performance regardless of the amount of cement produced. However, larger cement production volumes will result in higher total emissions, hence lower overall plant performance and improvement measures scores.
A comprehensive methodology for rating cement plants based on their mitigation measures is developed. The three sustainability pillars on which the proposed improvement measures are based are the economy, environment, and society. This rating model is generic enough to be applied to a wide range of plants and is not site-specific or country-specific. Comparing green building and sustainability rating platforms with the developed cement-specific assessment tool in this study highlights that the platforms enable a broad, corporate-level sustainability evaluation that assesses corporate environmental, social, and governance (ESG) performance [32,33]. On the other hand, the developed assessment tool is tailored to the specific decarbonization needs of the cement industry, focusing on technical, process, and emission reduction improvement measures in the value chain by providing actionable insights and performance benchmarks. The developed assessment tool enables plant operators and decision-makers to implement targeted strategies to achieve decarbonization of the cement production process. The niche focus of the created assessment tool allows us to provide detailed guidelines as a roadmap for reducing CO2 emissions. One of the key strengths of this assessment tool is its ability to provide benchmarking capabilities against standards. This tool allows cement plants to compare their CO2 emission reduction measures against global best practices through the evaluation of weightage and significance factors. By applying this tool, cement plants can track the progress of the improvement measures to identify areas for improvement and areas that need implementation of best practices to reduce CO2 emissions. This quantitative approach differentiates the created tool from other sustainability frameworks. The main focus of the created tool is carbon emissions reduction, unlike other methods where carbon management is part of broader environmental criteria. A detailed comparison between the use of sustainable rating systems and a cement-specific assessment tool for achieving NZEs by 2050 showed that the created tool is different in the following ways:
  • Purpose: it focuses on assessing decarbonization measures for cement plants to achieve NZEs by 2050, while other systems evaluate sustainability performance.
  • Scope and assessment criteria: It covers improvement measures related to CO2 emissions reduction, energy efficiency, alternative fuels and raw materials, technology innovations, product improvements, and facility operations efficiency. On the other hand, the rating systems cover broad ESG factors.
  • Targeting: it is designed for cement plant decision-making and for operators to evaluate the performance of the plant, whereas companies across the industry use the rating system.
  • Certification: It offers scores for each improvement measure based on an evaluation key, with action plans and detailed results reporting to improve the plants’ performance across different improvement measures. Rating systems provide sustainability ratings of silver, gold, platinum, or bronze based on environmental performance.
  • Methodology: it uses quantitative and qualitative models with the needed KPIs and global targets as references to track the plant’s progress towards NZEs and is not based on questionnaires only.
  • Focus on carbon emissions: it focuses primarily on carbon emissions reduction in cement production facilities by evaluating CO2 emissions improvement measures, while the other rating systems include carbon emissions as one of many environmental criteria and do not specialize in cement-specific decarbonization strategies.
  • Benchmarking: it allows cement plants to compare the various CO2 emission reduction measures against global best practices and NZE targets. However, the other evaluation methods allow companies to compare their performance against industry peers.
  • Action plans: it offers technical insights tailored to specific cement plants to achieve the NZE targets based on scores, bar charts, and historical data logging across the supply chain in the cement industry.
The model framework is presented in stages and sub-stages that should be followed to complete the evaluation. Figure 2 demonstrates the assessment framework. The model has three main phases: the first phase is the design and framework development phase, the second phase is the implementation and evaluation phase, and the third phase is the monitoring and reporting phase.

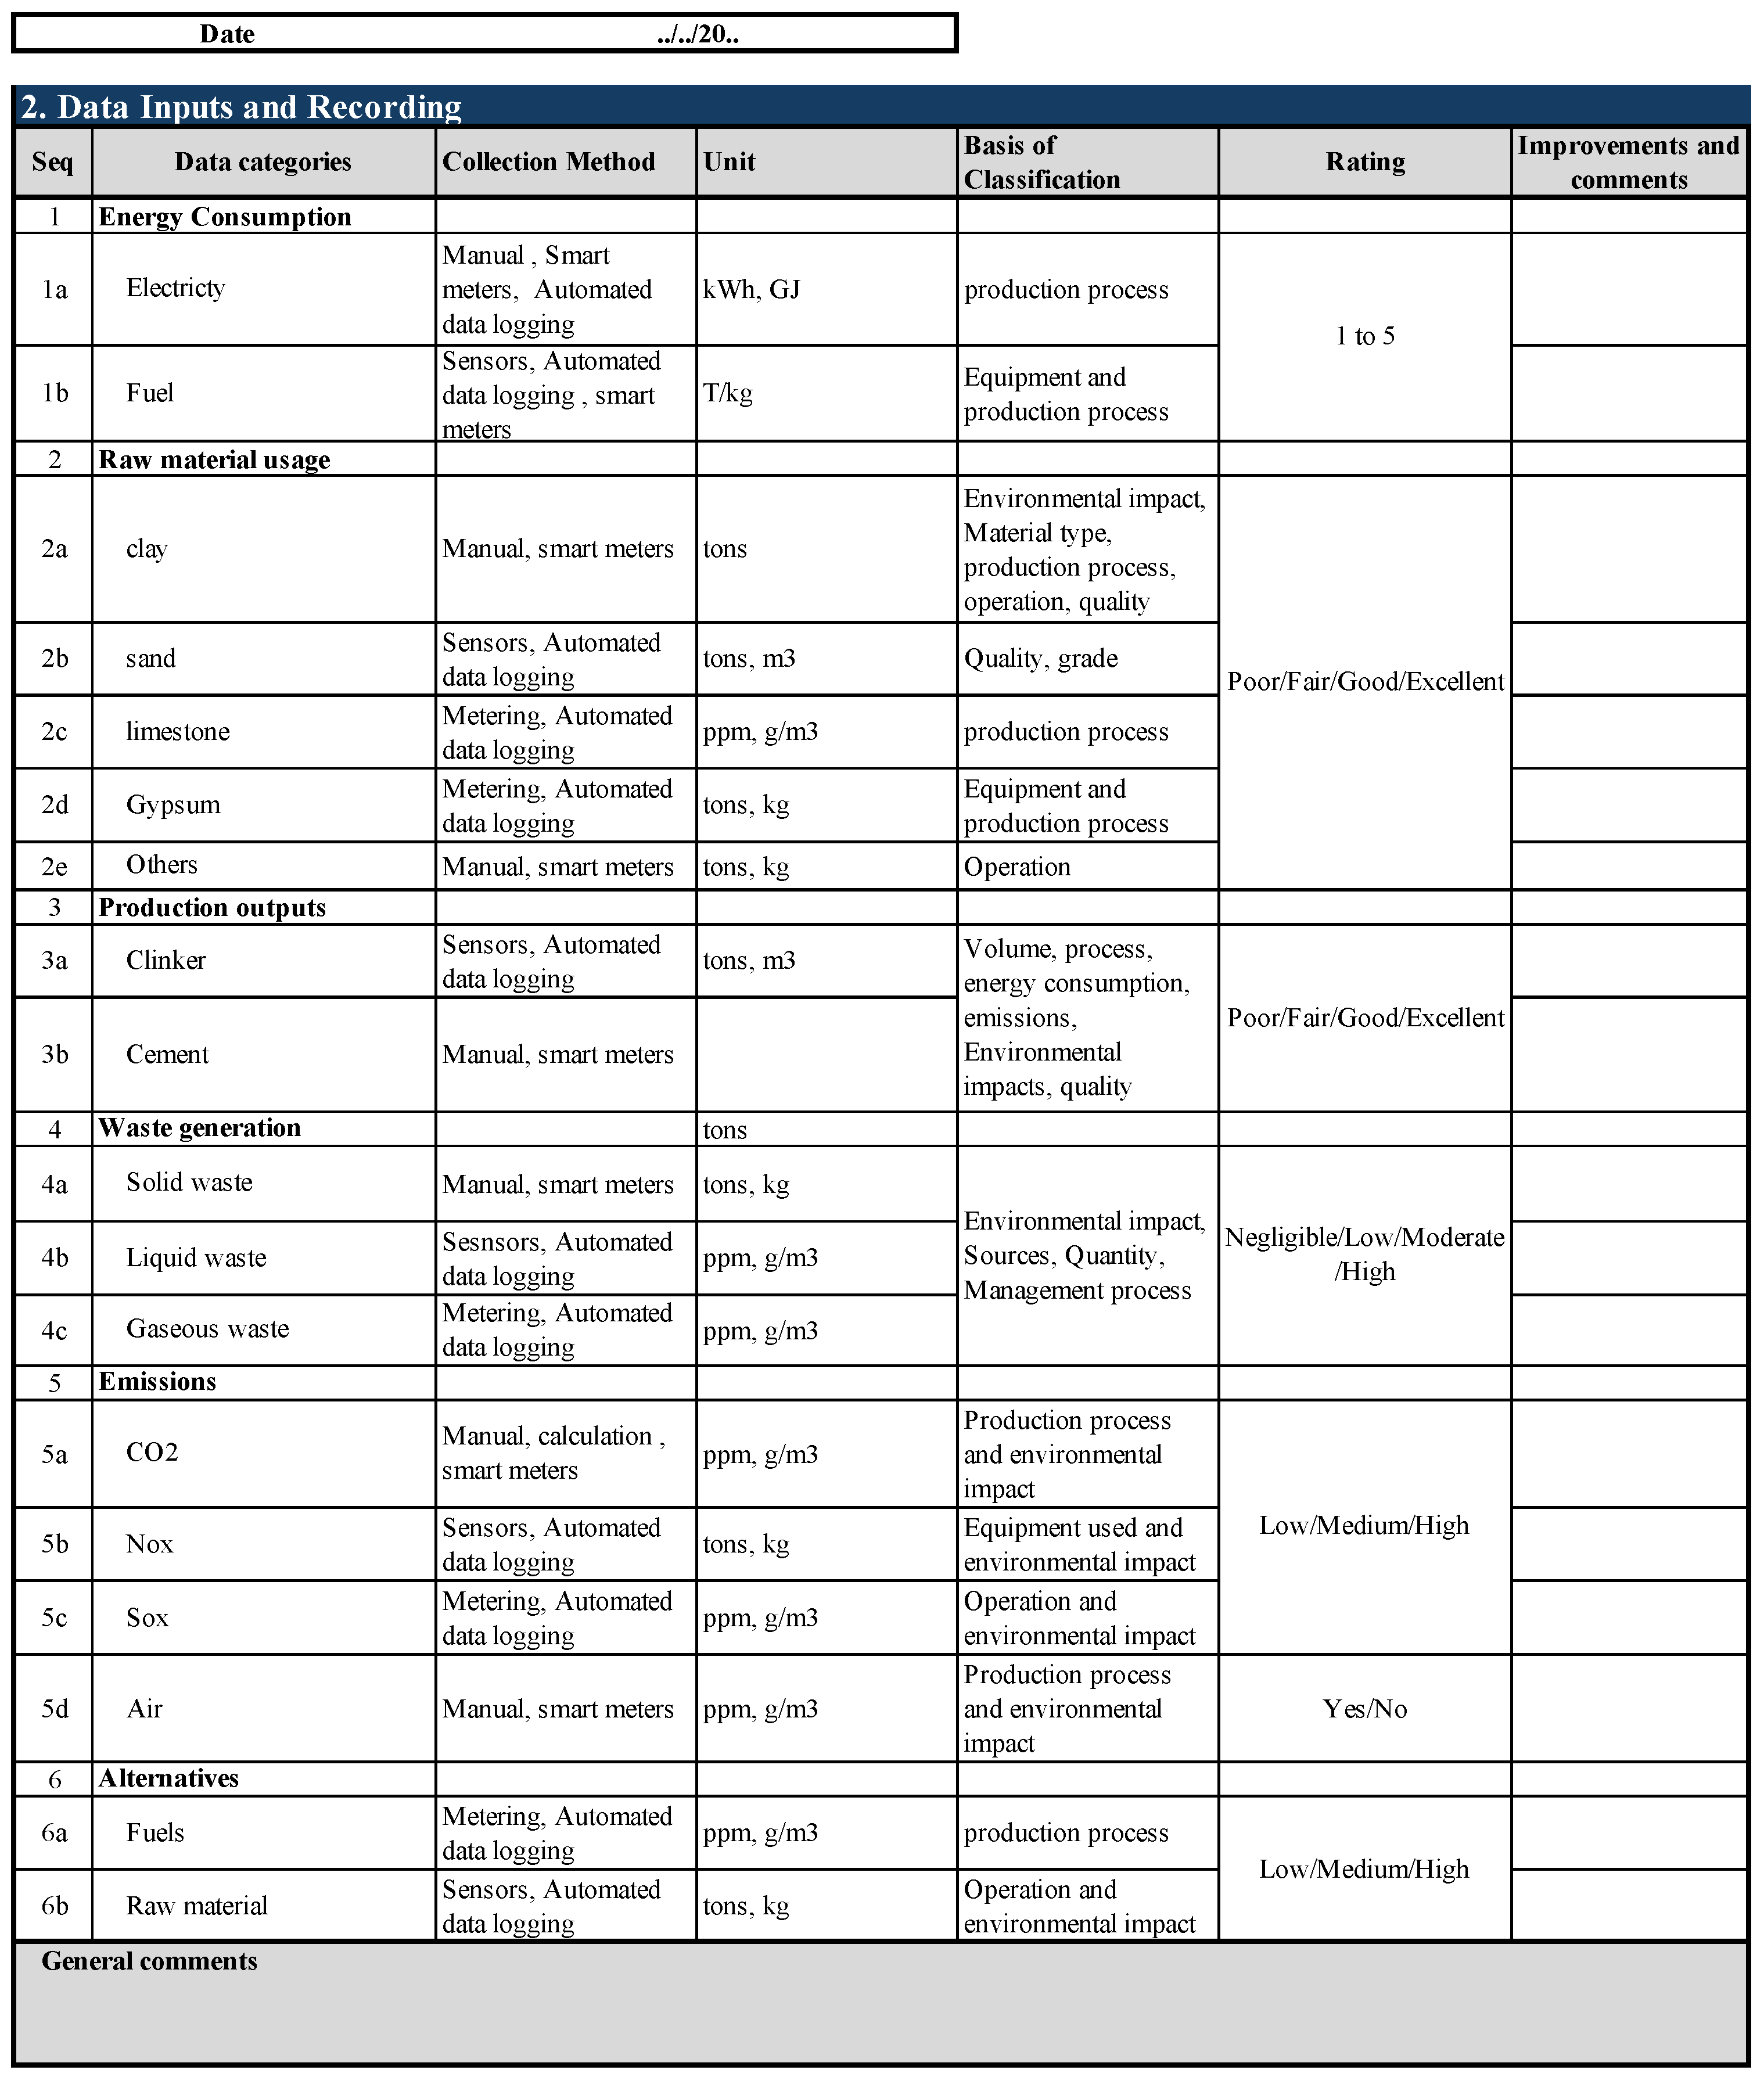
2.2. Data Collection and Classification

All necessary data on the cement production processes from inputs and outputs along the material and energy streams of cement production, including fuel consumption, energy usage, raw material consumption, and transportation, were gathered from five cement plants operated by leading national and international manufacturers. Their selection represented a diverse range of production capacities, different geographical locations, operational methods, and regulations. The data collection sources included sustainability reports, literature reviews, and site visits, ensuring comprehensive CO2 improvement measures compilation and assessment across different configurations and environments. This selection process allows for a broader applicability of the assessment tool developed in this study. To ensure the accuracy and comprehensiveness of the survey, interviews and site visits were conducted. This step includes the collection of data on any issues that emerge during the site inspection, from instant air emissions levels, waste management, water wastage, energy consumption, transparency levels regarding compliance with the regulations and environmental performance, and others. The site visit survey and the collected data on the environmental performance of the cement facility are gathered and organized in a sheet based on the recommendations of the GCCA, EBRD, IEA, CSI, WBCSD, and the European Cement Research Academy (ECRA) [3,4,5,6]. This sheet contains plant information, including plant name, company of ownership, country of the facility, plant type, kiln types, clinker capacity, verifications, and CO2 and energy protocol versions used. The survey ends with general comments and notes about this stage of the facility. Table 1 summarizes the parameters and data used for CO2 emissions calculations. The units of measurement and the proposed sources of data are indicated in the table. The data are measured preferably at the plant level; however, when this is not possible, default values are used.
In addition, a generic sheet is created for the plant data collection and classification phase. This sheet includes data inputs and records. It is a baseline for data documentation to normalize and unify data classification and collection. The data collection method, unit of record, basis of classification, tool rating, and improvements are recorded. It gives a clear overview of where the cement plant stands. This table provides a structural and unified format for documenting and organizing the data in categories based on the cement plant’s operational process. Figure 3 shows a model sample sheet for data inputs and recording where ratings are computed using the tool software.

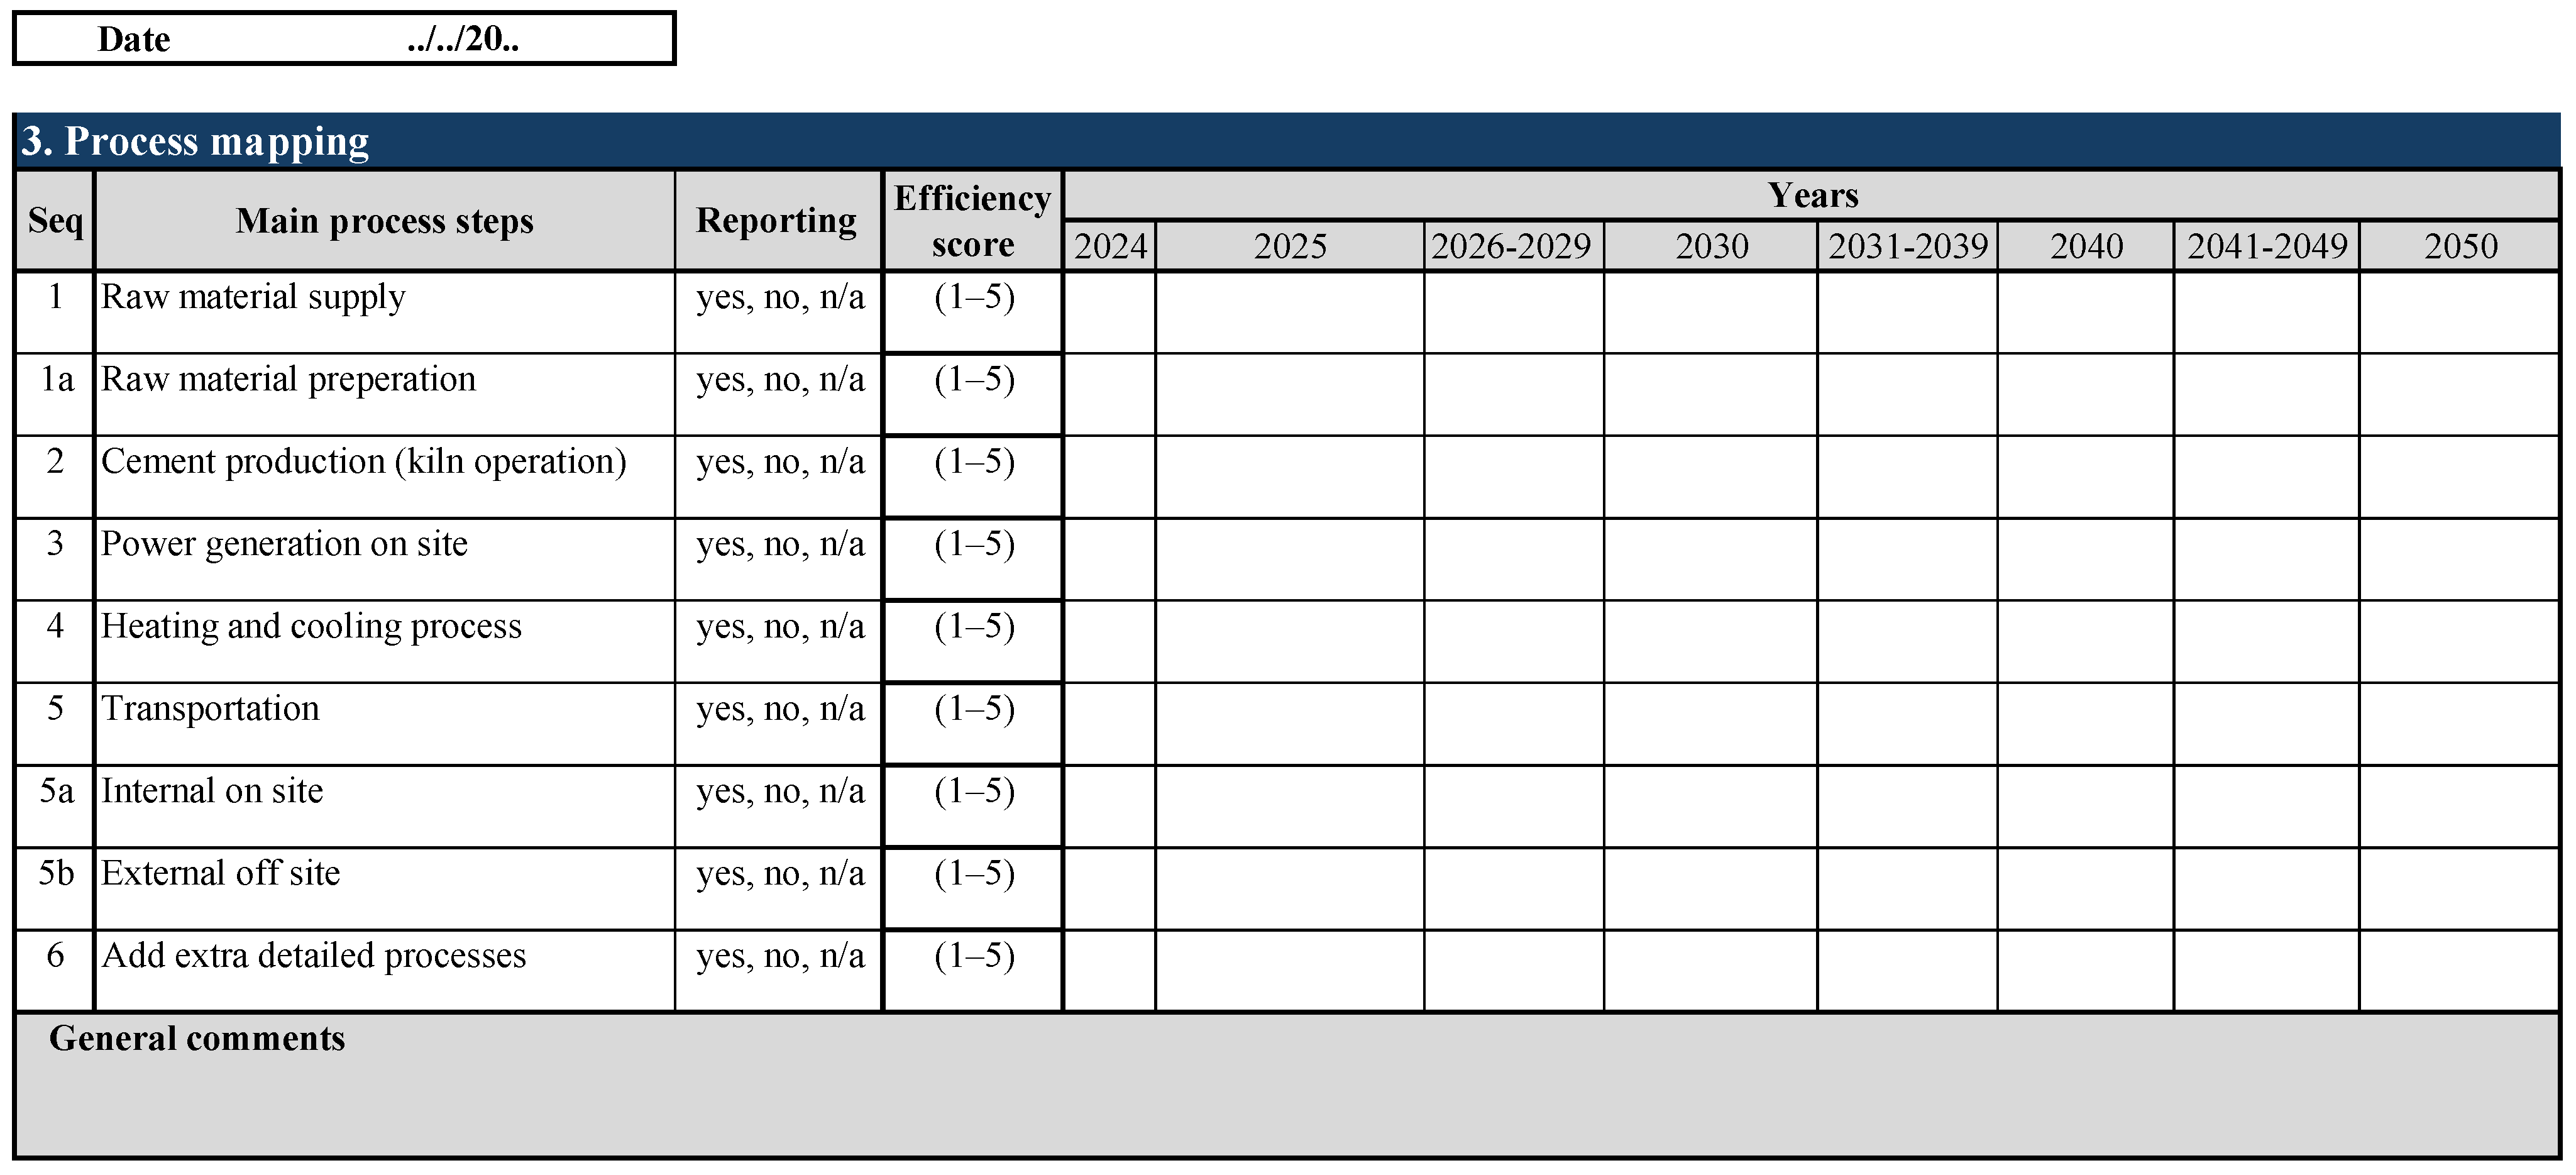
2.3. Process Mapping and Data Normalization

In this step, the cement production process is visually represented, and the various stages and steps are mapped. This stage includes quarrying, crushing, grinding, blending, calcination, clinker production, grinding of clinker, packaging, and transportation of the final product. In addition, each process step is broken down into individual components for accurate determination of the energy and materials needed for each stage and estimation of CO2 emissions and other air emissions. This stage helps to streamline operations, optimize operations, improve efficiency, and identify inefficiencies. An Excel sheet with the cement production process covering the main steps is created relative to the energy consumption and emissions of each step. The scoring is given as an evaluation using yes, no, or n/a points, where
  • Yes means the emissions and energy consumption of each step of production are reported as planned;
  • No means emissions are generated, and the energy consumption of each step of production is not reported as planned. This should be explained in the comments cell;
  • N/A means emissions are not generated or this step or does not exist at this plant.
The data collected in the first step and the process mapping step are normalized. The normalization helps with data completeness across different cement plants and regions based on standard sheets to be filled. The normalization stage standardizes the variations in different categories during the rating and evaluation process. Data normalization is based on the standards and protocols of the GCCA, EEAA reporting, IEA, ECRA, and others, as mentioned. Figure 4 is a simplified model sheet developed to summarize the assessment tool’s automatically rated efficiency of the cement production process in the cement plant based on the emissions generated as well as the energy consumed. This can be used as a guideline for determining the general efficiency of each step in the process of cement production to visualize the areas that need improvement to reach the 2050 goal.

2.4. Identifying and Evaluating Key Improvement Measures

At this stage of model development, each category is analyzed to identify the key improvement measures for evaluating the CO2 reduction potential of each plant. Due to the uncertainties and limitations surrounding the availability of the needed data, the results may lead to inaccurate results, undermining future risk identification, causing inaccurate prediction, limiting generalization for future global goals, and leading to ineffective policies and decision-making. This includes the following:
  • Accessibility: Accessing comprehensive and up-to-date data with respect to the study objective, especially in international cement plants;
  • Reliability: The accuracy of the data is subject to the source’s creditability;
  • Completeness: The parameters of systematic collection and reporting affect the depth of the analysis. Incomplete datasets could affect the results;
  • Confidentiality: Some data may be sensitive, with limited access and agreements needed for data provision. This could restrict the analysis of certain parameters;
  • Identification of key environmental performance indicators, including CO2 emission intensity, waste management, resource utilization, and energy efficiency for reduction potential.
Qualitative assessment based on a scoring system is used to select the best measures that have low, high, and medium potential for the reduction of CO2 emission by the cement plant. Table 2 presents the scale used to assess the parameters’ impact on improving emissions. This scale is assessed based on the improvements made to one of the major reduction potential measures, such as the following:
  • Energy consumption from clinker and cement production;
  • Process efficiency of each stage of cement production, waste generation, and water consumption;
  • Avoiding CO2 emissions by replacing or incorporating CO2 emissions;
  • Fuel from the calcination process.
Table 3 shows the improvement measures proposed for rating and scoring by the assessment tool in the application phase of this study based on a numerical rating scale. Each aspect is presented and given an abbreviation. The measures are selected and prioritized into categories, concentrating on the main area from the 5Cs approach. Additionally, the weight of each improvement measure, obtained from the literature review as well as observations from site visits, surveys, and industry experts, is based on a weighting matrix and mean values [8,9].

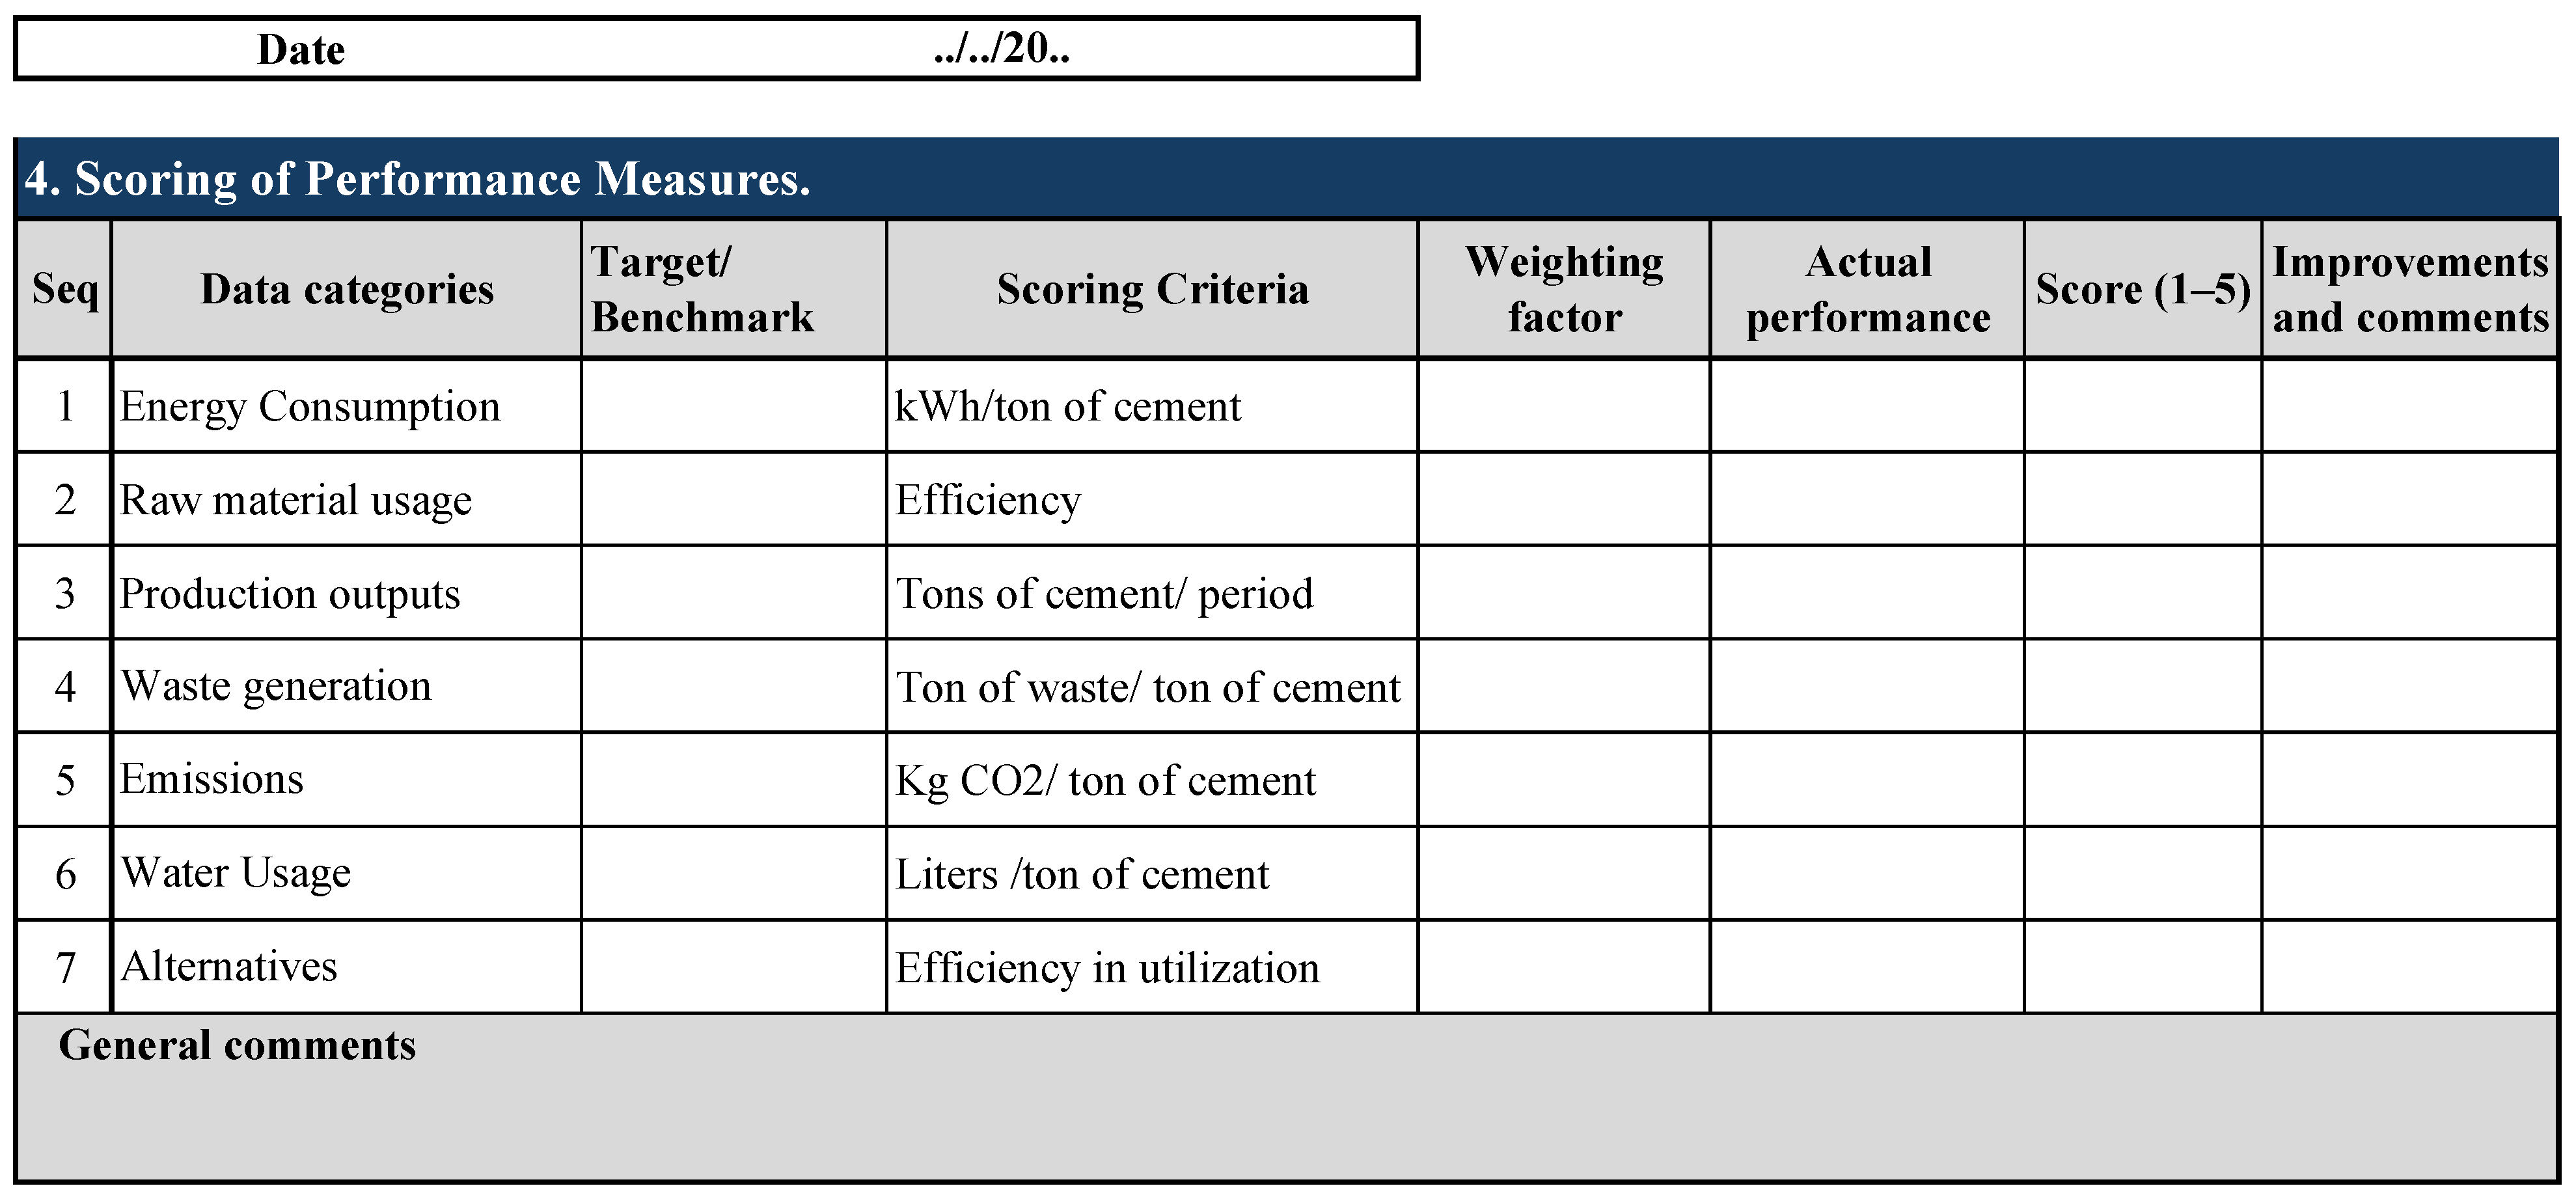
2.5. Develop a Scoring System and Calculations

This model stage involves developing a unified scoring system for evaluating the cement plants. After the last step, identifying the key improvement measures, the next step is to set targets or benchmarks for each measure based on specific plant standards, requirements, and sustainability targets. These measures are then given scores based on efficiency and effectiveness. A weightage factor is assigned relative to its significance. In addition, score calculation is assigned based on a comparison between actual performance against the established targets and assigned weight, deviation, and score. A generic template for scoring and comparing the performance indicators in a given cement plant is developed to help with the prioritization of improvement measures and to identify the most effective measures. Figure 5 Provides a sample of the sheet to be used in this stage of the evaluation model.

2.6. Interpreting the Results and Overall Rating Scores

The results are automatically interpreted to identify areas of weaknesses and strengths at each point for future improvement and/or investments. To evaluate the performance of each measure, a score from 1 to 5 is assigned to each measure. A visual representation of the rating scale representing the level of maturity and/or completeness is shown in Table 4; 5 is the highest implementation level and 1 represents a poor implementation level. These color-coded scores are programmed automatically to be displayed by the assessment tool.

2.7. Sensitivity Assessment

This stage of assessment of improvement measures in cement plants is conducted to understand their impact on certain parameters, such as effectiveness, viability, and results. In this stage of the model, technical maturity, sensitivity, and economic viability are analyzed to assess the applicability of the implementation of CO2 emission reduction measures. It gives a general guideline for checking the viability of an improvement measure to be implemented in a cement plant. In this framework, key factors that can determine the applicability of a CO2 emission reduction measure are technological viability, sensitivity, and maturity. This step assesses the feasibility of implementing a proposed improvement measure with respect to the plant’s available technology, resources, and infrastructure. Some of the factors considered at this stage include technological compatibility with the existing processes and equipment, the availability of the needed materials and energy resources, and the implementation of this technology within the existing operational state. In addition, the level of technological maturity affects the decision of whether or not to implement the measure. For this, a scale of the level of maturity is used to verify the technological maturity of the mitigation measure to be used. Table 5 outlines a qualitative scale for categorizing the various measures of technological maturity and sensitivity.
Additionally, economic viability is significant for determining the implementation of an improvement measure and its relationship to the plant’s business approach. This aspect evaluates the financial applicability of a certain measure and involves analyzing the implementation cost of each measure, the initial investment in the case of new or emerging technologies, and the operational costs. In addition, economic viability is impacted by the complexity of the plant’s business approach. Table 6 defines the qualitative scale for evaluating the economic viability and business approach complexity of implementing improvement measures in cement plants to reduce CO2 emissions.
The second step in the implementation and evaluation phase is the model validation and refinement. During this stage of the model, a thorough examination is applied to evaluate the model’s effectiveness and applicability by using a specific cement plant and considering the application and constraints associated with an improvement measure. This validation should be performed by a group of experts and a technical team. In addition, this phase considers three main aspects during the evaluation: site constraints and applicability, organizational readiness and resource allocation, and organizational implementation level.

2.8. Site Constraints and Applicability

This aspect assesses whether a certain improvement measure is applicable to a specific site. It evaluates the technical feasibility and compatibility with the cement plant’s existing infrastructure. It involves the evaluation of the technological compatibility of the improvement measure with the available equipment and systems. Table 7 provides a qualitative and quantitative scale for evaluating the site constraints and applicability of an improvement measure to a given cement plant.
Another parameter of significance is the organizational position of implementation of certain measures. This aspect examines the degree to which the current state of the cement plant is implementing a certain improvement measure. If an improvement measure is already established in the plant and is at a level of implementation that leaves no room for improvement, then the evaluation states this and refers to the next measure based on the prioritized benchmarks and targets. In addition, it involves assessing the degree of appearance of similar measures in the plant. It also assesses their effectiveness and performance. Table 8 defines the qualitative scale for evaluating the organizational position of the mitigation measures for reducing CO2 emissions.
By studying the impact of improvement measures on the facility’s existing level of adaption, the know-how about that measure, and the changes that will occur in case of implementation, company decision-makers can identify opportunities for expansion and improvements. In addition, they will be able to prioritize the measures and allocate funds and resources. Cement plant decarbonization and evaluation will be based on evaluations to assess the level of progress of a certain measure.

2.9. CO2 Emissions Calculations

Calculation of the CO2 emissions of the cement plant is conducted using equations based on the IPCC formula and recommendations as well as the literature. Emissions estimation involves two emission factors (EFs), one for clinker production and the other for cement kiln dust (CKD) [34,35,36,37]. Equation (1) is the formula for CO2 emission from clinker production and is a product of the lime fraction in the clinker and the factor 0.785, which is the theoretical CO2 emissions (by weight) associated with the production of 1 unit weight of CaO in the clinker [37].
Ef clinker = fraction CaO × 0.785.
A general approach to estimating CO2 emissions during clinker production is based on the guidelines of the IPCC; thus, the basic equation for estimating CO2 emissions from clinker production is as follows [37]:
CO2 Emissions from Clinker = Production Data × CKD Corrections Factor
The third equation used to calculate emissions is the total emissions that occur due to the manufacturing process, fuel emissions, and electricity emissions [37].
Total emissions = Process emissions + Fuel emissions + Electricity emissions.
The ratios used are based on the standard values in the industry. The clinker-to-cement ratio of Portland cement is taken as 95%, the raw material-to-clinker ratio is taken as 1.5, and the CaCO3-to-raw material ratio is taken as 78% based on the GHG Protocol guidelines. EFs are measured either from the cement plant level or default values provided in Table 1.

3. Results

After developing the assessment framework, the model is applied for analysis of improvement measures based on generic market analysis and two case-specific cement plants to evaluate the implementation level of the improvement measures proposed. Cement plant A is one of the largest production facilities in Egypt. The plant is located on the northern coast and has a production capacity of around 2 million tons per year and 6000 tons per day. On the other hand, company B is a leading international company that operates more than 65 cement plants worldwide. The studied cement plant B is located in Germany and has an approximate production capacity of 10 Mton per year.
Table 9 demonstrates the results of the quantitative analysis of plant A. Data input and output from the sustainability report for the year 2023, along with the estimated performance by the years 2025 and 2030, were used to calculate the expected percentage change in CO2 emissions according to the reporting standards of the GCCA, UNGC, IEA, IPCC equations, and IEA [3,4,5,6,7,8,9].

3.1. Industry Evaluation of Improvement Measures

The improvement measures proposed in Table 3 for evaluating the reduction potential of CO2 emissions and their categorization are qualitatively analyzed at this stage of the study to relate the most effective categories and sub-categories to be implemented and evaluated at the plants to assess the feasibility of their application. In this step of the study, the results of the analysis, data collection, and assessment of the CO2 emission reduction measures are presented based on the methodology in Section 2. The scale used to evaluate each improvement measure is from 1 to 5, where 1 is the least developed and implemented and 5 is the most developed and implemented level.
Table 10 shows the assessment of the cement plant’s performance in reducing CO2 emissions and the other performance factors based on generic industry analysis of each performance measure in relation to the technological maturity and economic viability applied in the plant. It also evaluates the performance measures based on their sensitivity to change and as a reference to site constraints, applicability, position, and readiness as a market comparison. It gives an indication of the position of the plant in relation to the market. The correlation between each measure and its improvement potential is determined for future improvements. This table was filled using data from the sustainability reports of the plant, site visits, official facility goals, and targets. It was verified by interviewing experts at the facility and re-evaluated during a major event in Egypt.

3.2. Analysis of the Proposed Improvement Measures in Two Case Studies (Plants A and B)

There are various sustainability measures that the plants are implementing to reduce CO2 emissions and the environmental impacts of the cement plants’ production. These measures are part of their broader strategies that align with the global decarbonization goals of the cement industry. Some of these measures, which align with those in Table 3 and have medium-to-high impacts, are as follows:
  • Alternative fuels (AF): Both plants are incorporating alternative fuels such as RDF, TDF, used oil, and biomass to reduce reliance on fossil fuels. For instance, the use of substitutional fuels in plant A was 13.1% in 2022 and 19.5% in 2023. In addition, alternative fuel utilization was recorded at 33.17%. Cement plant A has achieved a thermal substitution rate (TSR%) exceeding 30%. This is an indication of the percentage of thermal energy derived from alternative fuels that reflects the cement plant’s environmental performance and reliance on non-conventional fuels. The increased use of alternative fuels reduces CO2 emissions [38]. In 2023, cement plant A made significant efforts in improving its sustainability initiatives by safely utilizing RDF. This milestone helps to significantly reduce CO2 emissions by promoting co-processing.
The use of alternative fuels in cement plant B reached 25.7% of total fuel consumption in 2020 and increased to around 28% in 2022. In 2023, plant B successfully increased the use of AF to 29.9%, with waste-based biomass accounting for around 13% of this. The target is to increase the percentage of AF in the fuel mix to over 40% by 2030, with biomass accounting for 20% of this.
  • Energy Efficiency (EE) and Kiln technology upgrade (EK): Energy efficiency is a key factor in the decarbonization plans of both plants. In 2023, the consumption of thermal energy and electrical energy by plant A were 9756 TJ and 1235 TJ, respectively.
Cement plant B is implementing EE measures such as reducing electricity consumption and using waste to generate electricity to reach the NZE target, which has resulted in a 10% reduction in energy consumption. Also, to reduce CO2 emissions, the plant decreased the ratio of clinker in cement; clinker production is the intermediate and most energy-intensive process. There are some key energy-efficient measures being undertaken in both plants, including the following:
  • Upgrading kiln technology by modernizing kiln operations to optimize thermal energy consumption. This was performed by upgrading their preheater and calciner systems. Also, plant B is working on a novel kiln technology that will be able to capture more than 500,000 tons of CO2 emissions by 2025.
  • Waste heat recovery systems are implemented in some facilities to capture and reuse heat generated from kiln and clinker production, which helps in electricity generation and supplies energy for other processes, reducing overall energy consumption and, hence, the CO2 emissions of the plants.
  • Clinker-to-cement ratio is optimized using additives such as fly ash and slag in the cement production process. This leads to a significant reduction in CO2 emissions.
  • The use of modern, efficient grinding mills has contributed to the reduction in electricity consumption and led to the reduction in CO2 emissions. Vertical roller mills are more energy-efficient than traditional ball mills.
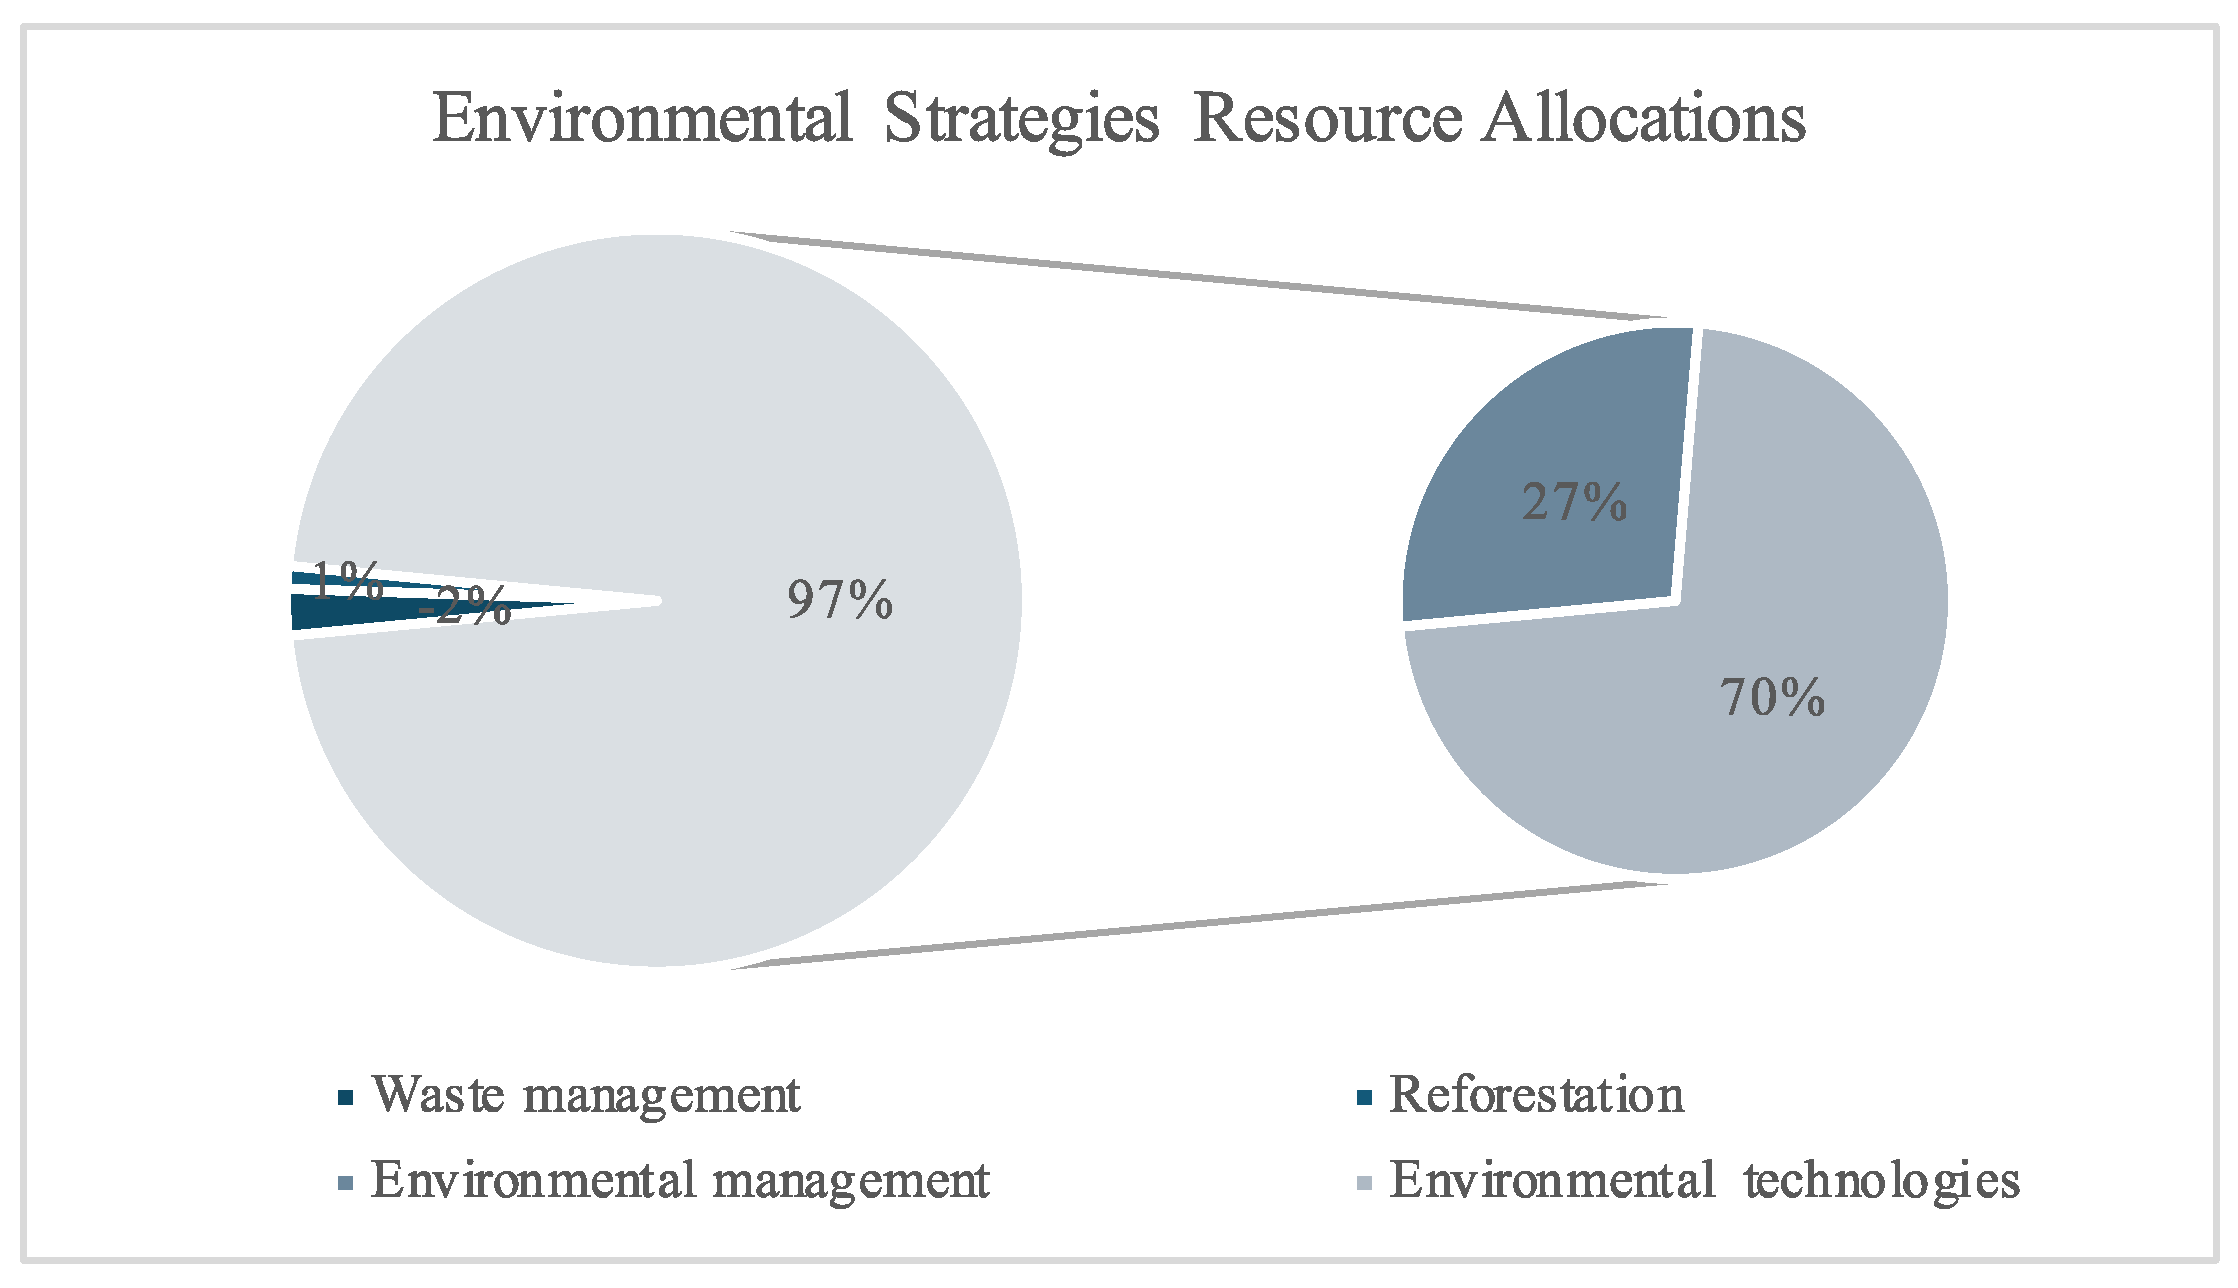
  • Cement plants A and B are ISO certified with ISO 50001, the energy management system certification [39]. In addition, plant A has invested 97% of its resource allocations in environmental strategies, where 27% are invested in environmental management, and 70% are invested in environmental technologies, for example, as shown in Figure 6.
  • Renewable Energy (AR): Plant A has initiated a major solar power project that will help reduce electricity consumption, contributing to a reduction in CO2 emissions. In addition, the use of renewable energy has risen to 11.4%.
Cement plant B has sourced renewable energy and has its own solar plants to generate renewable electricity. In 2023, they had secured around 12% of the plant’s energy demand, mainly from wind energy, and are targeting 100% renewable energy by 2050.
  • CO2 and heat control (IC) and Innovative technology and integration (II): Both plants are committed to the COP21 Paris Agreement goals. In 2022, the CO2 emissions per ton of cement for plant A had reduced to 679 kg/ton of cementitious product. In addition, in 2023, scope 1 emissions had reduced to 648 kg/ton of cementitious product, while scope 2 emissions remained at 0.16 million tons.
For cement plant B, the CO2 emissions per ton of cement had reached 534 kg/ton of cementitious product in 2023, reducing the specific net emissions by 2%. In addition, the plant’s goals for 2030 are to reduce scope 1 and scope 2 CO2 emissions by around 26% and to reduce NOx and SOx emissions by 40%.
  • Change in Raw Material and Product Development (RA, RP, and RC): Both plants produce advanced low-carbon cement, which is designed to be more environmentally friendly. It also has lower clinker content, which produces lower CO2 emissions compared with ordinary cement (CEM I). The percentage of low-carbon green products under development in cement plant A reached 13% in 2023, as presented in Figure 7. Cement plant B produces low-carbon cement with 30% lower CO2 emissions than CEM I, which translates into 30% low-carbon concrete.
In addition, both plants use alternative raw materials such as fly ash, slag, and others. In 2023, cement plant A’s usage of alternative raw materials reached approximately 6.4% and raw material usage reached 4.4 Mton. This was compared to 3.6% and 4.1 Mton, respectively, in 2022. Cement plant A’s clinker-to-cement ratio reduced to 78.8% in 2023 compared to 82.8% in 2022. In cement plant B, the use of alternative raw materials from by-products or industrial waste increased to around 12% in 2023 compared to around 9% in 2021. These materials are used in clinker production and as cement additives during cement grinding. This results in the use of around 30% less natural materials, which could reduce CO2 emissions by approximately 40 Mtons per year. The clinker-to-cement ratio decreased to around 70% in 2023 compared to 71.5% in 2022. The plant’s goal is to reach a clinker-to-cement ratio of 68% by 2030.
These improvement measures are part of the global sustainability roadmap of the company and reflect the efforts this plant is making to achieve net zero by 2050 in alignment with the European Green Deal, the UN’s 2030 Sustainable Development Goals (SDGs), and the Global Cement and Concrete Association (GCCA) [6]. This helps with the reduction of CO2 emissions. Although these measures are being implemented in the cement plant, there is still room for improvement to further reduce CO2 emissions associated with cement production. For instance, increasing the use of alternative fuels in the fuel mix, such as biomass, RDFs, and industrial by-products, can significantly reduce reliance on conventional fuels, hence reducing CO2 emissions. The use of these fuels not only enhances the sustainability of cement production but also encourages the recycling of waste materials instead of contributing to landfills, which aligns with the concept of cleaner production. The production of more low-carbon products like blended cement and green cement using fly ash pozzolans or slag can result in 10% to 30% less CO2 emissions and achieve a lower clinker-to-cement ratio, which is a major source of CO2 emissions [40,41]. In addition, the integration of renewable energy, such as wind and solar, can reduce dependence on conventional fossil fuels and reduce emissions [41]. It can be converted to supply cement plants with the energy needed for production. The implementation of advanced energy recovery and emission control systems, such as CCS technologies, can directly impact the sustainability of the plants by capturing CO2 emissions before they are released [42].
Furthermore, the existing level of implementation of CO2 emissions reduction measures was evaluated using the assessment model and its software tool through a systematic approach that categorizes the set of measures based on their integration with the sustainability plan of the company and their effectiveness in the cement production process. These improvement measures are evaluated throughout the cement production process and across the stages of inputs and energy efficiency, production optimization, and development of innovative and sustainable output products.
Figure 8 illustrates the various CO2 emission reduction measures implemented within the simplified cement production model from material and energy streams based on the assessment tool’s evaluation and scores. The level of implementation of the improvement measures is color-coded based on a ranking system that is implemented to assess the quality index of the CO2 emission reduction potential of each measure. This quality index helps evaluate and visually represent the effectiveness of each measure, facilitating the identification of the most impactful and feasible measures for cement plants [27].
The analysis between the reduction measures and their existing level of implementation in the company shows that some measures are more effective at reducing emissions than others; in particular, measures that have low technological maturity and high economic viability have lower scores compared with other measures. Furthermore, some measures that are related to the external measure of industry innovations and technological advancement have low scores due to their initial implementation levels. These improvement measures include waste treatment and power plant integration. Plant A conducts waste treatment integration and has also developed collaborations with co-located firms in different locations. These synergies focus on using high-impact factors, such as alternative fuels and materials from waste, which are co-processed during the production of cement. For instance, it uses waste-derived fuels such as biomass and industrial by-products as alternative fuels, which help to reduce the need for traditional fuels like coal and oil. Moreover, integrating RDF into its operations is part of its sustainability plan to meet the 2050 goals. It is aligned with cleaner production principles and the goals to reduce CO2 emissions. It is a means of closing the production loop by using waste as thermal energy in the cement kiln. This not only reduces GHG emissions but also helps with managing waste problems in Egypt by diverting waste from landfills. It is also exploring further synergies with local waste treatment facilities.
In Figure 8, simplified color coding is used to assess each improvement measure and its relation to the sensitivity analysis. Mapping the flow of energy and material through the cement plant shows the improvement measures that are not technologically mature and the ones that are already well implemented and economically viable. This mapping shows that most of the measures are technologically mature, and their sensitivity to market changes is low. Some measures that need industry innovations are in the medium-to-low implementation levels in the cement plant. This is due to the level of technological maturity in the market and the economic viability of each measure that is still in progress. Most of the other elements are either well or medium-implemented.

3.3. Assessment Tool Scores for Both Plants

An assessment software tool was developed to evaluate and score CO2 emissions improvement measures and overall cement plant performance based on the assessment framework. The tool was run to evaluate the proposed improvement measures for cement plants A and B, and the results are summarized using bar charts for cumulative assessment of the plants. Figure 9 and Figure 10 represent all the improvement measures, main areas, and subareas evaluated and their corresponding scores. These cumulative charts are a valuable tool for visualizing and analyzing performance. They effectively represent the areas that are well implemented and the ones that need further implementation, enabling decision-makers to identify trends, monitor progress, and make faster decisions.
Cement plant A received a performance score of 3.315, which is a high score based on the assessment tool, which highlights areas of high, medium, and low implementation. The model highlights a high score in two main areas: process and technology efficiency and alternative raw material and clinker production, with scores of 3.47 and 3.62, respectively. In addition, the tool highlighted two other main areas that are above average in their implementation levels: alternative fuels and energy management and emission control and industry innovations, with scores of 2.99 and 2.60, respectively. On the other hand, cement plant B received an overall performance score of 3.68, which is a high on-track score based on the assessment tool’s evaluation key. The model highlights that out of the five main areas evaluated, four received high on-track implementation level scores of 3.98, 3.48, 3.60, and 3.03 in process and technology efficiency, alternative fuels and energy management, alternative raw material and clinker production, and emission control and industry innovations, respectively. In addition, the fifth main area, facility operations, received an optimal score of 4.42.
The compiled results of the assessment tool for plant A and plant B are summarized and presented in Table 11, providing an evaluation of the plant’s performance scores for the main areas, first subareas, and second subareas.

4. Discussion

This study provides insights into CO2 reduction and improvement measures in the cement industry. It demonstrates the effectiveness of a structured yet flexible assessment framework, with its input and output, to systematically assess and score several proposed CO2 improvement measures within the cement value chain. Based on the tools developed in this study, the assessment framework provides a quantitative and qualitative assessment of cement plants using a scoring system based on the implementation level of each improvement measure (proposed in Table 3) to achieve decarbonization and reach NZEs by 2050. The model has milestones, with all the needed data collected from sustainability reports, site visits, and expert interviews. By applying the tool to two cement plants with different production scales and geographical locations, this study highlights the variability in emissions reduction potential and the need for continuously updating mitigation strategies.
Several studies have examined CO2 reduction plans during cement production, emphasizing the role of alternative fuels, energy efficiency, and clinker substitution in reducing CO2 emissions by cement plants. For instance, the GCCA is targeting a 20% reduction in emissions by 2030, consistent with the findings of this study [6,43]. However, unlike previous studies, which primarily focused on technological advancements and policy frameworks, this study introduces a structured scoring model that provides a standardized evaluation method for cement plants. By incorporating weighted criteria, this tool enables decision-makers to assess the implementation level of various improvement measures in a systematic manner to identify priority areas for improvement, bridging the gap between high-level decarbonization roadmaps and plant-level implementation. In addition, applying the assessment tool to two cement plants revealed the following insights:
  • Potential variability: both plants implemented several of the evaluated CO2 improvement measures, but their overall performance scores differed due to the implementation level of each measure and its impact on the sustainability of the plant and the reduction in CO2 emissions.
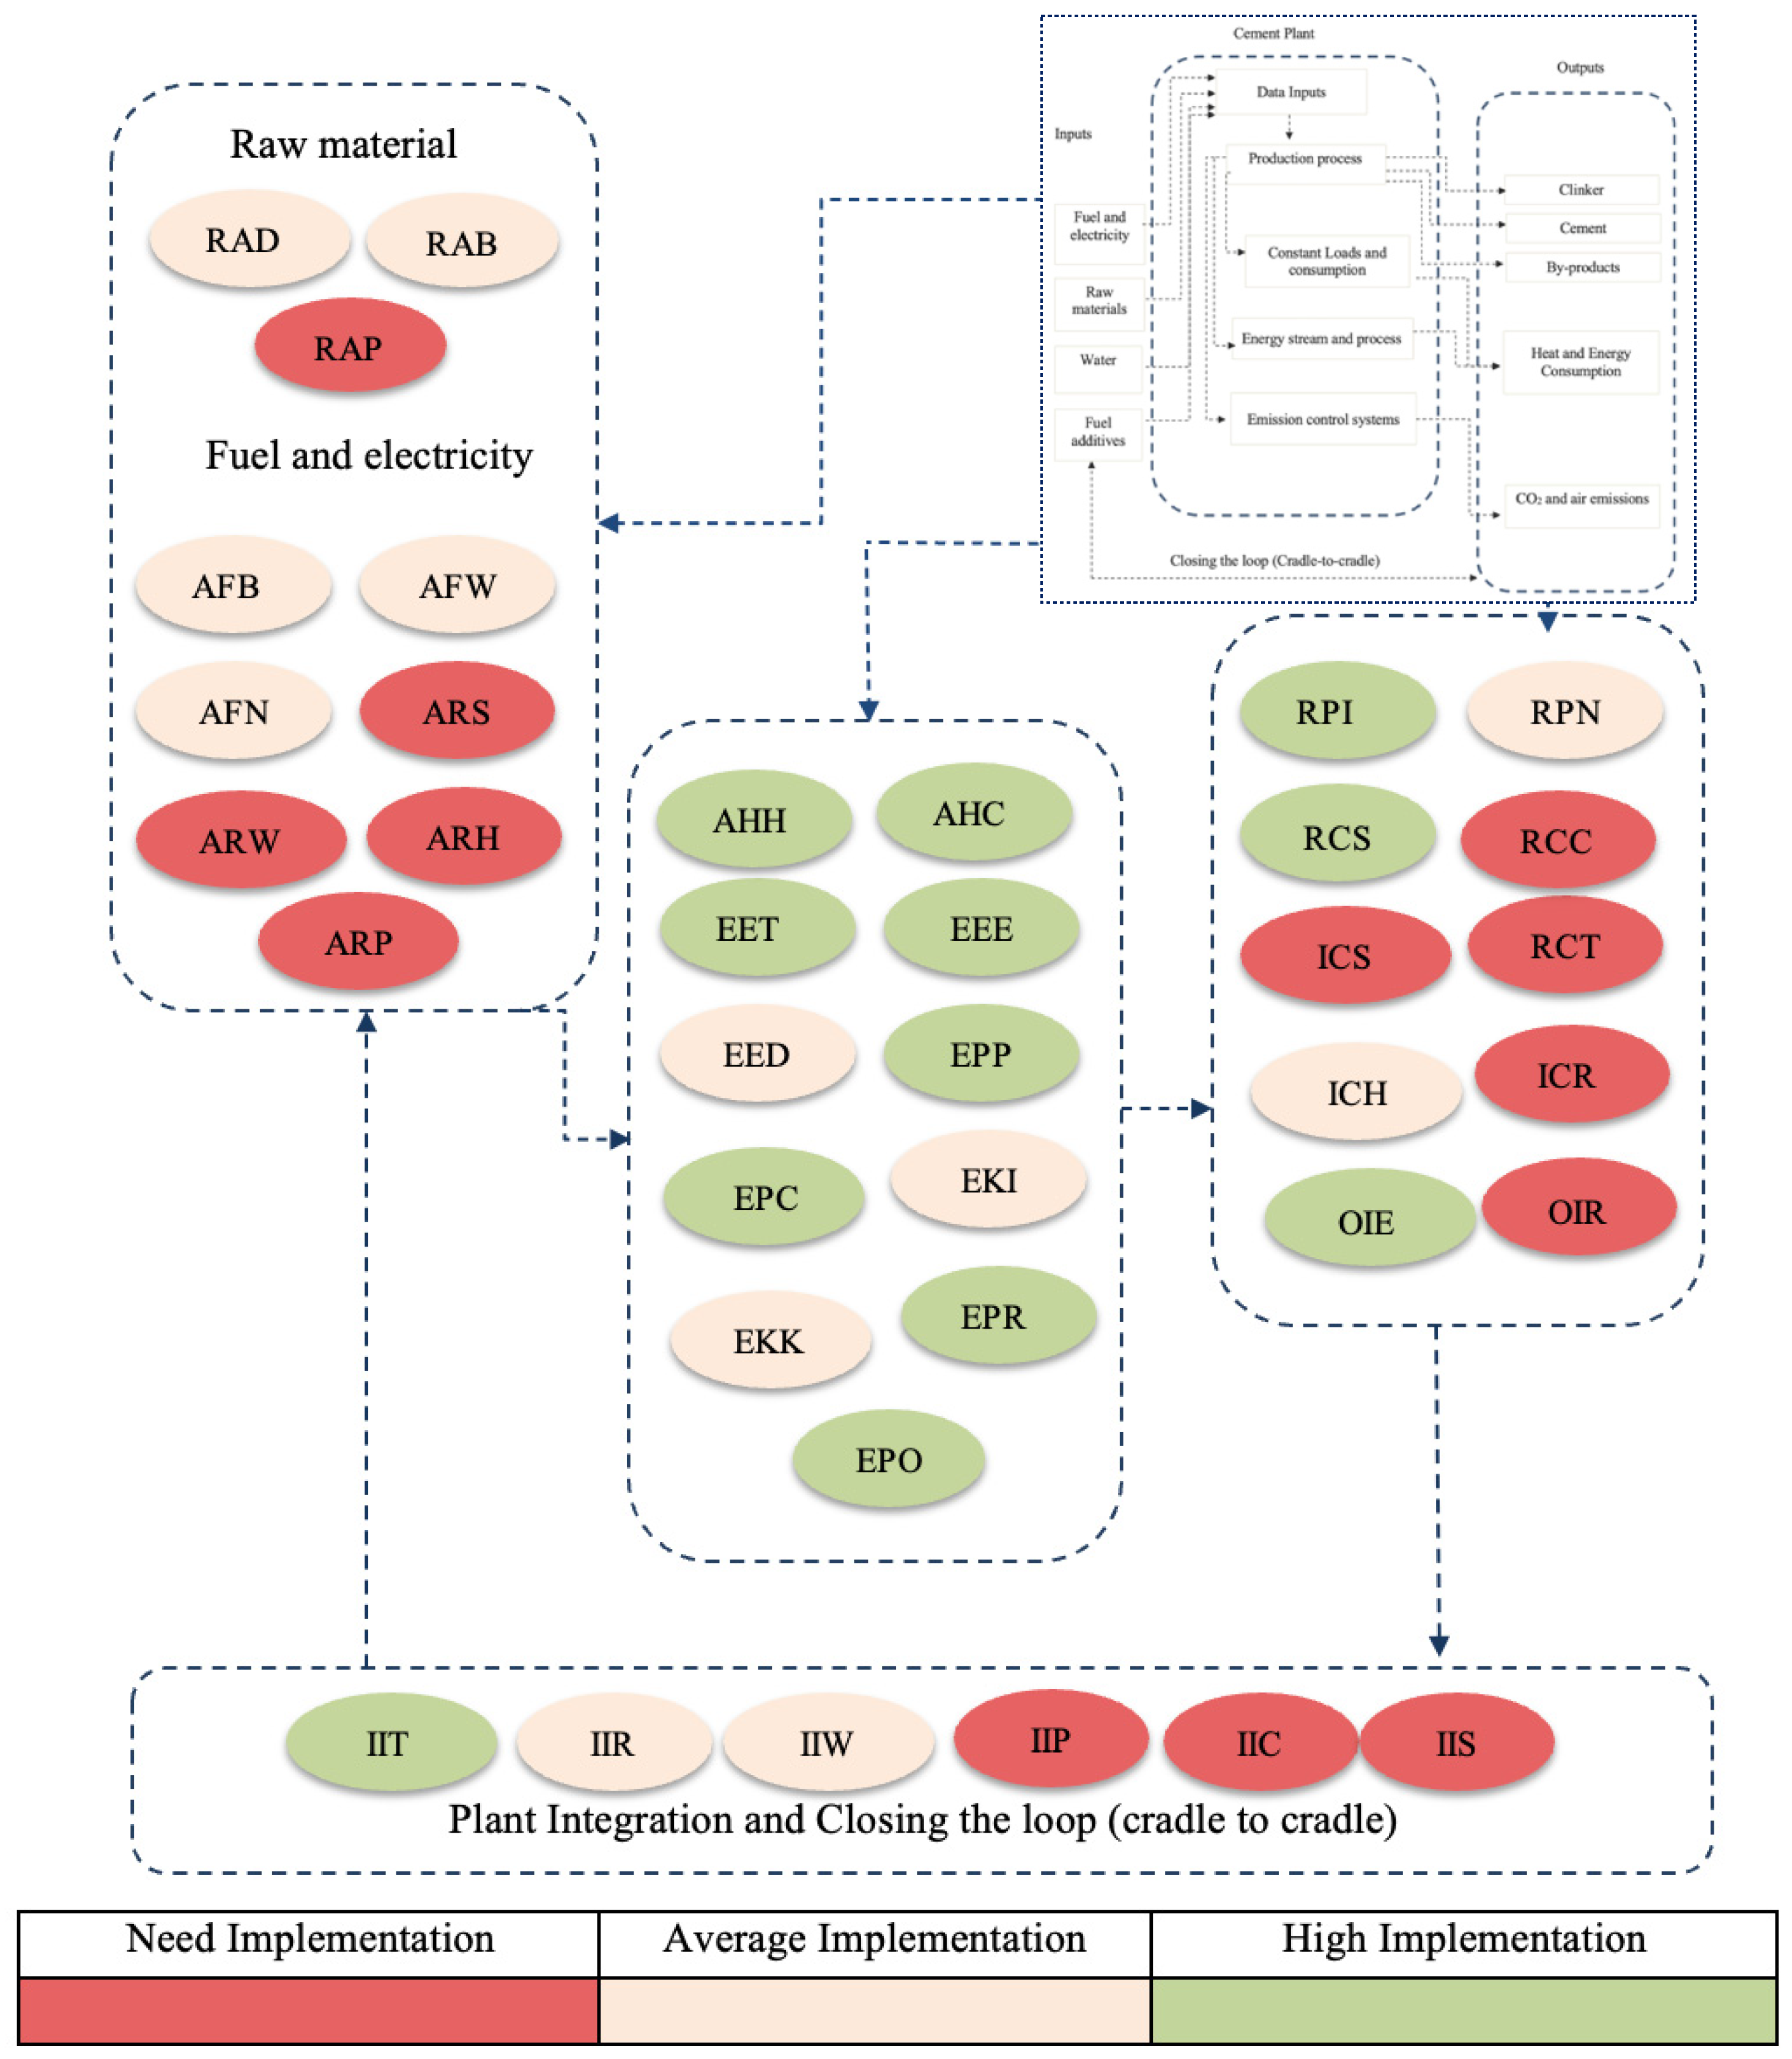
  • Future improvements: The model provides a cohesive mapping of the level of implementation of CO2 improvement measures across the cement value chain based on the materials and energy flow. By continuously applying the assessment tool, plants can track their progress over time and adjust strategies and resource allocation. The model revealed that even well-established cement plants have opportunities for improvement and further efficiency.
  • NZE goal alignment: The model is aligned with the NZEs goal for 2050 and the intermediate milestones for 2030 and 2040, and the tool takes these targets into account during the calculation and evaluation of emissions. The results confirm that achieving NZEs in the cement industry is challenging and requires the integration of technological, operational, and regulatory solutions.
Beyond the cement plants’ operations, this study has broader implications for the field of structural engineering and sustainable construction, where sustainable material selection and low-carbon construction practices are becoming essential. By providing a data-driven assessment tool for evaluating cement plant emissions and sustainability, this model enables structural engineers to select environmentally friendly materials, optimize carbon-efficient designs, and align with global net zero targets. Additionally, this study supports the development of industry-wide benchmarks and regulatory policies that drive innovation in green construction materials and techniques, facilitating the transition to a low-carbon built environment.

5. Conclusions

Several studies, roadmaps, and reports have focused on reducing CO2 emissions in the cement industry for its decarbonization to achieve net zero emissions by 2050. However, a structured, unified, and flexible method is needed to evaluate and rate the implementation of improvement measures within cement plants. This paper presents a comprehensive assessment framework that systematically categorizes, assesses, and rates several proposed CO2 improvement measures, aiding plant development and decision-making. The assessment framework is inspired by the concept of cleaner production and the 5Cs approach to cement industry decarbonization. The framework integrates both qualitative and quantitative assessments. An assessment tool that evaluates cement plants based on the implementation level of each improvement measure using evaluation questions with an evaluation score from 1 to 5 based on the weighted average approach is developed. The model serves as a diagnostic and mapping tool that can systematically evaluate a cement plant with hundreds of different improvement measures and identify the areas that need enhancements, the most applicable measures, and the most highly implemented measures while integrating strategies to achieve sustainability. It also facilitates decision-making, strategic planning, and resource allocation.
The model is scalable. It was successfully applied to two well-established cement plant case studies with different production scales and geographical locations. Cement plant A achieved a performance score of 3.315, while cement plant B scored 3.68. The results highlight the plants’ strong commitment to CO2 reduction while identifying future optimization opportunities.
This study contributes to the growing body of knowledge on decarbonization in the cement industry and provides a robust framework for evaluating and improving sustainability efforts. However, there are some limitations to this study that should be considered. Variability in real-world conditions, such as regional regulatory differences, plant-specific operational challenges, and variations in raw material availability, may impact the generalizability of these findings. Additionally, the cement industry is evolving, and this can impact the long-term durability of the proposed CO2 improvement measures, particularly in cement plant operations. The sustainability of these measures may vary over time and operational practices and under different environmental conditions. These should be considered in future updates to the model to adapt to any changes and incorporate the latest real-time data, emerging technologies, policies, and applications, ensuring its continuous effectiveness and maintaining progress toward NZE targets.

Author Contributions

Conceptualization, E.K. and M.A.; methodology E.K.; software, E.K.; validation, E.K. and M.A.; formal analysis, E.K.; writing—original draft preparation, E.K.; writing—review and editing, E.K.; visualization, E.K.; supervision, M.A. All authors have read and agreed to the published version of the manuscript.

Funding

This research received no external funding.

Data Availability Statement

Data are contained within the article.

Conflicts of Interest

The authors declare no conflicts of interest.

References

  1. Harraz, H.Z.; Hamdy, M.M.; Abu El-Ela, A.S.M.; El-Hoseiny, I.M. Assessment of Raw Materials for Cement Industry In El Sukhuna-Zaafrana Area, Eastern Desert, Egypt. Delta J. Sci. 2020, 42, 108–124. [Google Scholar] [CrossRef]
  2. Hamza, A.S. Assessment of Carbon Dioxide Emission and Its Impact on High-Rise Mixed-Use Buildings in Egypt. Master’s Thesis, The American University in Cairo, AUC Knowledge Fountain, Cairo, Egypt, 2021. [Google Scholar]
  3. IEA. Net Zero by 2050: A Roadmap for the Global Energy Sector; The International Energy Agency: Paris, France, 2021. [Google Scholar]
  4. CEMBUREAU. Cementing the European Green Deal: The 5Cs, Reaching Climate Neutrality Along the Cement and Concrete Value Chain By 2050; The European Cement Association: Brussels, Belgium, 2020. [Google Scholar]
  5. IPCC. Global Warming of 1.5 °C: An IPCC Special Report on the Impacts of Global Warming of 1.5 °C Above Pre-Industrial Levels and Related Global Greenhouse Gas Emission Pathways, in the Context of Strengthening the Global Response to the Threat of Climate Change, Sustainable Development, and Efforts to Eradicate Poverty; Cambridge University Press: Cambridge, UK, 2022. [Google Scholar]
  6. GCCA. Cement Industry Net-Zero Tracker; World Economy Forum: Geneve, Switzerland, 2023. [Google Scholar]
  7. IPCC. Climate Change 2022: Mitigation of Climate Change; Intergovernmental Panel on Climate Change: Geneva, Switzerland, 2022. [Google Scholar]
  8. UNFCCC. UNFCCC Secretariat Recognition and Accountability Framework Draft Implementation Plan with Respect to Net-Zero Pledges of Non-State Actors and Integrity Matters; United Nations Framework Convention on Climate Change: New York, NY, USA, 2023. [Google Scholar]
  9. USGCRP. The U.S. Global Change Research Program 2022–2031 Strategic Plan; United States Global Change Research Program: Washington, DC, USA, 2022.
  10. Khalil, E.A.; Abouzeid, M.N. Computation of the environmental performance of ready- mix concrete for reducing CO2 emissions: A case study in Egypt. J. Elsevier Energy Rep. 2023, 9, 144–148. [Google Scholar] [CrossRef]
  11. Adesina, A. Recent advances in the concrete industry to reduce its carbon dioxide emissions. J. Elsevier Environ. Chall. 2020, 1, 100004. [Google Scholar] [CrossRef]
  12. Fayomi, G.U.; Mini, S.E.; Fayomi, O.S.I.; Ayoola, A.A. Perspectives on environmental CO2 emission and energy factor in Cement Industry. IOP Conf. Ser. Earth Environ. Sci. 2019, 331, 012035. [Google Scholar]
  13. USGS. Cement Production Statistics and Information: Statistics and Information on the Worldwide Supply of, Demand for, and Flow of the Mineral Commodity Cement; National Minerals Information Center: Denver, CO, USA, 2023.
  14. Luo, J.; Hunang, R.; Wang, J.; Zhang, Y. Carbon Sequestration by Preparing Recycled Cement, Recycled Aggregates, and Recycled Concrete from Construction and Demolition (C&D) Wastes. Materials 2024, 17, 5020. [Google Scholar] [CrossRef]
  15. Mokhtar, A.; Nasooti, M. A decision support tool for cement industry to select energy efficiency measures. Energy Strategy Rev. 2020, 28, 100458. [Google Scholar] [CrossRef]
  16. Kusuma, R.T.; Hiremath, R.B.; Rajesh, P.; Kumar, B.; Renukappa, S. Sustainable transition towards biomass-based cement industry: A review. Renew. Sustain. Energy Rev. 2022, 163, 112503. [Google Scholar] [CrossRef]
  17. Fadayini, O.M.; Madu, C.; Oshin, T.T.; Obisanya, A.A.; Ajiboye, G.O.; Ipaye, T.O.; Rabiu, T.O.; Akintola, J.T.; Ajayi, S.J.; Kingsley, N.A. Energy and Economic Comparison of Different Fuels in Cement Production; IntechOpen: Rijeka, Croatia, 2021. [Google Scholar]
  18. IEA. World Energy Outlook 2022; Report by the International Energy Agency; IEA: Indianapolis, IN, USA, 2022. [Google Scholar]
  19. IEA. Global Thermal Energy Intensity from Cement Production; Report by The International Energy Agency; IEA: Indianapolis, IN, USA, 2023. [Google Scholar]
  20. Carbone, C.; Ferrario, D.; Lanzini, A.; Stendardo, S.; Agostini, A. Evaluating the Carbon Footprint of Cement Plants Integrated with the Calcium Looping CO2 Capture Process. Front. Sustain. 2022, 3, 809231. [Google Scholar] [CrossRef]
  21. IPCC. AR6 Synthesis Report: Climate Change 2023; Dadi, D.K., Zhai, P., Eds.; Intergovernmental Panel on Climate Change: Geneva, Switzerland, 2023. [Google Scholar]
  22. Elghamrawi, S. Greening the Cement Industry in Egypt: Exploring Decarbonisation Policies for the Cement Industry. Master’s Thesis, The American University in Cairo, AUC Knowledge Fountain, Cairo, Egypt, 2023. [Google Scholar]
  23. Costa, F.N.; Ribeiro, D.V. Reduction in CO2 emissions during production of cement, with partial replacement of traditional raw materials by civil construction waste (CCW). J. Clean. Prod. 2020, 276, 123302. [Google Scholar] [CrossRef]
  24. Khalil, E.A.; Abouzeid, M.N. Environmental Impact of Cement Plants in Egypt: A Comprehensive Study on Carbon Dioxide Mitigation Measures and Evaluation. In Proceedings of the Canadian Society for Civil Engineering (CSCE), Niagara Falls, ON, Canada, 5–8 June 2024. [Google Scholar]
  25. WBCSD. Vision 2050: Time to Transform; World Business Council for Sustainable Development: Geneva, Switzerland, 2021; Available online: https://archive.wbcsd.org/Overview/About-us/Vision-2050-Time-to-Transform/Resources/Time-to-Transform (accessed on 4 February 2025).
  26. Sayad, T.; Moursy, F.I.; El-Tantawi, A.M.; Saad, M.; Morsy, M. Assessment the impact of different fuels used in cement industry on pollutant emissions and ambient air quality: A case study in Egypt. J. Environ. Health Sci. Eng. 2023, 21, 107–121. [Google Scholar] [CrossRef]
  27. Vasileiadou, A.; Zoras, S.; Iordanidis, A. Fuel Quality Index and Fuel Quality Label: Two versatile tools for the objective evaluation of biomass/wastes with application in sustainable energy practices. Environ. Technol. Innov. 2021, 23, 101739. [Google Scholar] [CrossRef]
  28. Rocha, S.; Candia, O.; Valdebenito, F.; Flavio Espinoza-Monje, J.; Azócar, L. Biomass quality index: Searching for suitable biomass as an energy source in Chile. Fuel 2020, 264, 116820. [Google Scholar] [CrossRef]
  29. Khalil, E.A. A Global Assessment Tool for Reduction of CO2 Emissions Associated with Portland Cement and Relevant Sectors. Ph.D. Thesis, The American University in Cairo, AUC Knowledge Fountain, Cairo, Egypt, 2025. [Google Scholar]
  30. CEMBUREAU. Cementing the European Green Deal: Reaching Climate Neutrality Along the Cement and Concrete Value Chain by 2050. 2020. Available online: https://www.scribd.com/document/478753604/2020-Cementing-the-European-Green-Deal (accessed on 17 November 2024).
  31. El Haggar, S.M. Rural and Developing Country Solutions. In Environmental Solutions, 13th ed.; Elsevier: Amsterdam, The Netherlands, 2005; Volume 13, pp. 313–400. [Google Scholar]
  32. Yesilyurt, M.; Kocadagistan, B. Carbon Footprint Evaluation of a Ready-Mixed Concrete Plant. Nanoera 2023, 3, 8–15. [Google Scholar] [CrossRef]
  33. Breath. ESG in the Cement and Concrete Industry; Breathe Foundation: St. Louis, MO, USA, 2023. [Google Scholar]
  34. IPCC. Guidelines for National Greenhouse Gas Inventories. Agriculture, Forestry, and Other Land Use. The Intergovernmental Panel on Climate Change. Available online: https://www.ipcc.ch/report/2019-refinement-to-the-2006-ipcc-guidelines-for-national-greenhouse-gas-inventories/ (accessed on 20 November 2024).
  35. Nie, S.; Zhou, J.; Yang, F.; Lan, M.; Li, J.; Chen, Z.; Xu, M.; Li, H. Analysis of theoretical carbon dioxide emissions from cement production: Methodology and application. J. Clean. Prod. 2022, 334, 130270. [Google Scholar] [CrossRef]
  36. IPCC. Updates Methodology for for National Greenhouse Gas Inventories. The Intergovernmental Panel on Climate Change. Available online: https://www.ipcc.ch/2019/05/13/ipcc-2019-refinement/ (accessed on 25 January 2025).
  37. Gibbs, M.; Soyka, P.; Conneely, D. CO2 Emissions from Cement Production. The Intergovernmental Panel on Climate Change. Available online: https://www.ipcc-nggip.iges.or.jp/public/gp/bgp/3_1_Cement_Production (accessed on 14 October 2024).
  38. Vasileiadou, A. Reduction of CO2 emissions through the co-combustion of lignite with biomass residues: Renewable and non-renewable CO2 per produced megajoule and fuel characterization. Therm. Sci. Eng. Prog. 2024, 50, 102566. [Google Scholar] [CrossRef]
  39. ISO. International Organization for Standards in Energy Management. International Organization for Standards. Available online: https://www.iso.org/iso-50001-energy-management.html (accessed on 11 February 2025).
  40. Variny, M.; Varga, A.; Rimár, M.; Janošovský, J.; Kizek, J.; Lukáč, L.; Jablonský, G.; Mierka, O. Advances in biomass co-combustion with fossil fuels in the European context: A review. Processes 2021, 9, 100. [Google Scholar] [CrossRef]
  41. Saradar, A.; Rexakhani, Y.; Rahmati, K.; Majd, F.; Moein, M.; Karakouzian, M. Investigating the properties and microstructure of high-performance cement composites with nano-silica, silica fume, and ultra-fine TiO2. J. Innov. Infrastruct. Solut. 2024, 9, 84. [Google Scholar] [CrossRef]
  42. Plaza, M.G.; Martínez, S.; Rubiera, F. CO2 capture, use, and storage in the cement industry: State of the art and expectations. Energies 2020, 13, 5692. [Google Scholar] [CrossRef]
  43. Tkachenko, N.; Tang, K.; Mccarten, M.; Reece, S.; Kampmann, D.; Hickey, C.; Bayaraa, M.; Foster, P.; Layman, C.; Rossi, C.; et al. Global database of cement production assets and upstream suppliers. Sci. Data 2023, 10, 696. [Google Scholar] [CrossRef] [PubMed]
Figure 1. The 5Cs for decarbonizing the cement industry and other relevant sectors [30].
Constrmater 05 00020 g001
Figure 2. Study assessment framework for CO2 emissions reduction by cement plants.
Constrmater 05 00020 g002
Figure 3. Sample assessment tool sheet for framework data input and recording at cement plants.
Constrmater 05 00020 g003
Figure 4. Sample assessment tool sheet used in the model framework development for rating the efficiency of the plant’s cement production process.
Constrmater 05 00020 g004
Figure 5. Sample sheet for scoring and weighting performance measures.
Constrmater 05 00020 g005
Figure 6. Environmental strategic resource allocation percentages.
Constrmater 05 00020 g006
Figure 7. Percentage of plant’s green products usage between 2021 and 2023.
Constrmater 05 00020 g007
Figure 8. Simplified production model of cement plants and the assessment tool’s ranking of each improvement measure based on the model’s sensitivity analysis and technology maturity.
Constrmater 05 00020 g008
Figure 9. Cumulative chart for the 1st subarea improvement measures, corresponding main areas, and scores for plant A.
Constrmater 05 00020 g009
Figure 10. Cumulative chart for the 1st subarea improvement measures, corresponding main areas, and scores for plant B.
Constrmater 05 00020 g010
Table 1. Data collected and emission sources by scope.
Emission SourcesComponentUnit of CalculationData Source
Scope 1
CO2 from CalcinationClinker producedTonsPlant measured
Dust calcinationTonsPlant measured, reports
CKD emissiong/t clinkerPlant measured
CO2 from fuel combustionNCVGJ/t fuelPlant measured
EFkg CO2/GJfuCalculated or default IPCC/CSI
Fuel consumptionTonsCalculated, plant, reports
CO2 from mobile sourcesEFkg CO2/kmCalculated or default
Fuel consumptionLitersCalculated or plant
Scope 2
CO2 from external sourcesPower ConsumptionkWhPlant level or reports
EFgCO2/kWh
Table 2. Qualitative scale and level of impact on CO2 emission reduction.
CO2 Reduction PotentialImpact LevelEstimated % of Reduction
The measures cannot reduce CO2 emissions from the major sources but can significantly reduce CO2 emissions from at least one source.low<20%
The measures can effectively reduce CO2 emissions from at least one source.Medium 20% to 50%
The measures can effectively improve CO2 emissions from one or more sources.High >20%
Table 3. Detailed classification of CO2 emissions reduction and improvement measures used during cement production and plant operations.
CategoryAbb.Sub-CategoryAbb.
1. Process and technology efficiency
EEnergy efficiencyEEElectrical efficiencyEEE
Thermal efficiencyEET
Variable speed drivesEED
Process efficiency EPProcess control systemsEPC
Operational efficiency EPO
Recycle and reuseEPR
Pollution control and prevention EPP
Kiln technology upgradeEKKiln drive improvementsEKK
Insulation improvements EKI
2. Alternative fuels and energy management
AAlternative fuels AFBiomassAFB
Waste materials AFW
Non-traditional fuelsAFN
Renewable energyARSolar energy ARS
Wind energy ARW
Hydropower ARH
Hybrid solar panelsARP
Waste heat recoveryAHHeat exchanger AHH
Combined heat and powerAHC
3. Alternative raw material and clinker production
RAlternative raw materialsRADecoronated feedstocksRAD
Blending raw materials RAB
Preprocessing of materialsRAP
Clinker substitutionRCCalcareous oil shaleRCC
Supplementary materials RCS
Low-temperature clinkersRCT
Product developmentRPBlended cementRPI
New product technologiesRPN
4. Emission control and industry innovations
ICO2 and heat controlICCarbon capture and storage ICS
Selective non-catalytic reduction (SNCR) systems and CRSICR
Synergistic heating ICH
Innovative technology and integrationIIAdvanced process technologiesIIT
Developing CO2 reduction innovationsIIR
Waste treatment integrationIIW
Power plant integrationIIP
Power plant/cement plant carbonate loopingIIC
Syngas co-productionIIS
5. Facility operations
OBest practices in operationOBStaff training and public relationsOBT
Maintenance and program enhancing OBM
Water management OBW
Standards and complianceOSRegulatory compliance OSR
Sustainable material standardsOSS
Environmental impact assessment OSE
Breakthrough innovationsOIResearch and CO2 reduction innovationsOIR
Environmental strategies OIE
Table 4. Assessment tool’s automated visual representation of the performance indicators, with scores from 1 to 5.
PoorLowAverageOn TrackOptimal
Table 5. Qualitative scale for assessing technology maturity and sensitivity.
Sensitivity LevelMaturity LevelDescription
LowHighThe technology is well established and not easily affected by external factors.
MediumMediumThe technology is emerging and involves moderate complexity on external factors. May have moderate sensitivity to external factors.
HighLowThe technology is in the early development stages. It is affected by technological complexity and is sensitive to external factors and conditions.
Table 6. Qualitative scale for evaluating the economic viability and complexity of business approaches required by CO2 reduction measures.
Economic ViabilityBusiness Approach ComplexityDescription
High LowThe implementation of each measure offers significant cost savings and can easily be integrated with the existing plant processes.
Medium MediumThe implementation of each measure offers moderate cost savings and requires organizational adaption. It can be integrated with the existing plant processes but needs planning and coordination.
LowHighThe implementation of each measure offers limited cost savings and high risk. It requires substantial external support to be integrated with the plant processes.
Table 7. Qualitative and quantitative scale for validating CO2 emissions reduction by mitigation measures through site constraints and applicability.
LevelFeasibility Percentage Description
Low<50%The proposed mitigation measure is not feasible given the current site conditions and constraints.
Lack of infrastructure and resources.
Significant obstacles in the environment.
Medium50–75%The proposed mitigation measure could be implemented given the current site conditions and constraints.
Infrastructure and resources need to be modified.
Moderate obstacles in the environment.
High>75%The proposed mitigation measure is feasible and well suited given the current site conditions and constraints.
Infrastructure and resources are well aligned.
Environmental conditions are aligned and support the implementation.
Table 8. Qualitative scale for evaluating the organizational position.
LevelDescription
LowThe measure is not being implemented, and/or no similar measures are currently in practice.
Existing measures are ineffective and/or implemented poorly.
Significant room for improvement.
The know-how is not available at the plant level.
MediumThe measure is being implemented, and/or some similar measures are currently in practice but with variable effectiveness.
Existing measures are implemented but are inconsistent or lacking in some areas.
Moderate room for improvement.
The know-how is relatively available at the plant level.
HighThe measure is implemented, and/or many similar measures are currently in practice.
Existing measures are effective and implemented substantially and consistently.
Strong foundation for improvements.
The know-how is available at the plant level.
Table 9. Current and estimated (until 2030) environmental performance and CO2 emissions of plant A.
Performance MeasuresUnits2023Estimated
20252030%/yr
OPC Production Mton1.040.90.5(11)
Clinker–cement ratio%78.871.4154.3(4.8)
Thermal energy TJ97569198.37939.7(2.9)
Electrical energy TJ12351194.81100(1.63)
Natural raw material MM tons4.44.023.21(4.42)
Alternative raw material %6.412.2652.5138.42
Substitution fuel%19.229.1281.6723.2
Alternative fuel consumptionton118127.4154.457.33
Water consumptionMM30.660.5450.34(9.13)
Scope 1 emissions Kg/t647.6612.2529.4(2.78)
Scope 2 emissionsMtons0.160.14710.1196(4.12)
Scope 3 emissionsKg/t8379.672.1(2.05)
Green products %cem13.036.8238.868.17
Dust emissionsg/t Clinker59.979150.914.88
NOx emissions 12551249.51167.7(0.3)
Recycled wastetons20.727.861.116
RDF% heat10.513.124.111.7
Total CO2 emissionsMt2.12.071.99(0.72)
Table 10. Model sensitivity analysis of the evaluation of cement plants from the market and operation analysis perspective for CO2 emission improvement measures.
Abb.Performance MeasureEvaluation Points
Industry Generic AnalysisPlants Comparison to Apply These Measures
Technology Maturity and SensitivityEconomic ViabilityTechnology ApplicabilitySite ConstraintsOrganizational Position Organizational Readiness and AllocationsCO2 Reduction Potential
EEEElectrical efficiency5143443
EETThermal efficiency5143443
EEDVariable speed drives3353333
EPCProcess control systems3234444
EPOOperational efficiency 4344434
EPRRecycle and reuse5145553
EPPPollution control and prevention 5155544
EKKKiln drive improvements 4453334
EKIInsulation improvements 3355343
AFAlternative Fuels 3355343
AFBBiomass
AFWWaste materials
AFNNon-traditional fuels
ARRenewable Energy 3355344
ARSSolar energy
ARWWind energy
ARHHydropower
ARPHybrid solar panels (PVT)3445124
AHWaste heat recovery 5552554
AHHHeat exchanger
AHCCombined heat and power
RADDecarbonated feedstock3343334
RABBlending raw materials 5343333
RAPPreprocessing of materials2334233
RCCCalcareous oil shale 1235315
RCSSupplementary materials 3344455
RCTLow-temperature clinker1114314
RPIBlended cement 5551345
RPNNew product technologies1335345
ICSCarbon capture and storage 1511224
ICRCatalytic reduction systems (CSR) and SNCR4443345
ICHSynergistic heating 4443343
IITAdvanced process technologies4443445
IIRDeveloping CO2 reduction innovations3333335
IIWWaste treatment integration 4343344
IIPPower plant integration 4443345
IICPower plant/cement plant carbonated loop1225115
IISSyngas co-production1335115
O *Facility operations
* These are indirect factors and are not included in the industry assessment since they are plant-based; however, they are the foundation of the gross assessment.
Table 11. Assessment tool’s summary of improvement measures scores for cement plants A and B.
Main AreasFirst SubareaScore AScore BAbb.Second SubareaScore AScore B
Process and technology efficiencyEnergy efficiency3.354.18EEEElectrical efficiency3.044.13
EETThermal efficiency3.834.45
EEDVariable speed drives33.75
Process efficiency 3.723.93EPCProcess control systems3.53.83
EPOOperational efficiency 4.064.06
EPRRecycle and reuse3.273.75
EPPPollution control and prevention 4.134.13
Kiln technology upgrade3.283.63EKKKiln drive improvements 2.813.44
EKIInsulation improvements 3.853.85
Alternative raw material and clinker productionAlternative raw materials3.403.65RADDecarbonated feedstocks3.33.86
RABBlending raw materials 3.333.23
RAPPreprocessing of materials3.753.75
Clinker substitution3.503.12RCCCalcareous oil shale 1.251.25
RCSSupplementary materials 3.753.06
RCTLow-temperature clinkers3.753.75
Product development4.374.22RPIBlended cement4.534.53
RPNNew product technologies4.133.75
Alternative fuels and energy managementAlternative fuels 3.313.66AFBBiomass2.953.39
AFWWaste materials 2.983.37
AFNNon-traditional fuels4.334.50
Renewable energy1.962.81ARSSolar energy 1.253.75
ARWWind energy 1.883.13
ARHHydropower 3.212.50
ARPHybrid solar Panels (PVT)1.881.25
Waste heat recovery3.754.01AHHHeat exchanger 3.753.75
AHCCombined heat and power3.754.27
Emission control and industry innovationsCO2 and heat control2.502.88ICSCarbon capture and storage 1.252.50
ICRSelective non-catalytic reduction systems (SNCR) and CRS3.753.33
ICHSynergistic heating 3.753.13
Innovative technology and integration2.753.26IITAdvanced process technologies55
IIRDeveloping CO2 reduction innovations3.754.20
IIWWaste treatment integration 3.754.58
IIPPower plant integration 1.252.03
IICPower plant/cement plant carbonate looping0.380.77
IISSyngas co-production1.251.25
Facility operationsBest practices in operation4.174.36OBTStaff training and public relations4.174.45
OBMMaintenance and program enhancing 3.753.75
OBWWater management 4.645
Standards and compliance3.804.41OSRRegulatory compliance 3.755
OSSSustainable material standards4.384.37
OSEEnvironmental impact assessment 3.193.75
Breakthrough innovations4.504.50OIRResearch and CO2 reduction innovations55
OIEEnvironmental strategies 3.753.75
Disclaimer/Publisher’s Note: The statements, opinions and data contained in all publications are solely those of the individual author(s) and contributor(s) and not of MDPI and/or the editor(s). MDPI and/or the editor(s) disclaim responsibility for any injury to people or property resulting from any ideas, methods, instructions or products referred to in the content.

