Article

Effect of Process Parameters on the Physical and Mechanical Properties of Cornstarch-Based Construction Materials

1
Department of Agricultural and Biosystems Engineering, North Dakota State University, Fargo, ND 58102, USA
2
United State Department of Agriculture-National Institute of Food and Agriculture, Kansas City, MO 64105, USA
3
Department of Civil, Construction, and Environment Engineering, North Dakota State University, Fargo, ND 58102, USA
*
Author to whom correspondence should be addressed.
Constr. Mater. 2023, 3(3), 320-336; https://doi.org/10.3390/constrmater3030021
Submission received: 29 July 2023 / Revised: 15 August 2023 / Accepted: 26 August 2023 / Published: 1 September 2023

Abstract

:
Concrete is used globally due to its useful mechanical and durability properties. However, concrete requires a massive amount of cement, which is the second-largest source of carbon emission (5–7% of global CO2 emissions) due to its high energy consumption. The gelatinization effect of corn starch as a binder has been explored in the place of cement in concrete. However, there is a need to optimize the various processing conditions to enhance the material strength of the corn starch-based material known as CoRncrete. Two experiments were conducted to optimize the ratio of sand, starch, water, curing temperatures, and time. The compressive and tensile strength of the CoRncrete samples were analyzed. The results showed that the optimum processing conditions having a sand grain size of 0.250–0.425 mm, a mixture ratio of starch, water, and sand 1:1:5, and curing temperature and time of 110 °C and 24 h can yield a maximum compressive strength up to 18.9 MPa. Statistical analysis revealed that the size of sand grains and curing temperatures had the most significant impact on the material’s strength. Microstructural analysis, employing scanning electron microscopy (SEM) and micro-computed tomography (microCT), unveiled numerous internal pores and cracks within the hardened cubic blocks, which significantly decreased the strength. Consequently, future investigations should concentrate on reducing internal pore spaces and cracks to enhance the durability of CoRncrete.

1. Introduction

Concrete is one of the most popular construction materials worldwide due to its mechanical and durability properties [1]. Consequently, global annual concrete use is now 10 billion m3 or 25 billion tons, making it the most widely used engineered material on the planet [2,3]. Concrete use is anticipated to increase by 12–23% globally by 2050 compared to 2014. To support this increase in concrete usage, the expected upsurge in global cement production will be 4.83 billion metric tons in 2030, from 3.27 billion metric tons in 2010 [4]. In general, concrete consists of cement, water, coarse aggregate, and sand, where cement works as a binding material. Cement production is the second-largest source of carbon dioxide emission (5–7% of global CO2 emissions) due to its highly energy-intensive processes [5,6]. Hence, there is a need to explore the potential for different alternative materials to reduce cement consumption and develop viable, cost-effective, energy-saving, and environmentally friendly substitutes for cement.
Several alterations have been made to cement, aiming not only to decrease its carbon footprint but also to enhance its physical properties. Various factors have contributed to mitigate the potential CO2 emissions associated with the use of cement in concrete. For example, admixtures like glass powder and metamorphic rocks have been used to reduce cement consumption in concrete by 30% without reducing strength [7,8]. Consequently, various alternative materials, such as fly ash, slag cement, silica fume, rice husk ash, geopolymer, hempcrete, and recycled aggregate can be utilized as substitutes for traditional cement in construction industry [9,10,11].
Over the past few decades, there has been an increasing focus on exploring biopolymers and creating biodegradable bioplastic materials for the construction sector which not only reduce cement consumption but also enhance physical and mechanical properties of concrete. A polysaccharide like starch, which mostly consists of linear amylose and branched amylopectin and has a structural molecule made up of anhydroglucose units, has a number of uses in the construction sector [12,13,14]. Corn starch has been shown to be compatible with a range of construction materials and it is widely available and cost-effective compared to other starches [15]. Typical corn grain composition consists of 71% starch, 9% protein, and 4% oil on a dry basis. Previous studies have documented the potential reinforcement effects of cornstarch on ceramic composites and bone cement [16]. Another study examined the impact of corn starch-modified concrete, specifically investigating its influence on properties such as compressive strength, sorptivity, and permeability [17]. The findings indicate that incorporating 2.5% and 5% starch by weight of cement resulted in strength increases of up to 9% and 3%, respectively. Kulshreshtha et al. [18] used 100% corn starch and developed an intriguing and environmentally friendly construction material called CoRncrete. This lightweight biodegradable material was created by heating a blend of un-modified corn starch, sand, and water, in a convention oven. The material had a maximum compression strength of 13.7 MPa. This compressive strength is similar to conventional red clay bricks but must be improved if used in other applications. This study also found that CoRncrete had a low carbon footprint compared to bricks and traditional concrete. Since moisture has a negative impact on CoRncrete when exposed to a moist environment or submerged in water, Mansour et al. [19] tried to reduce this hydrophilicity issue of CoRncrete by using different conventional and natural coating materials. The CoRncrete after coating materials can withstand moist environments for up to 7 days, up from 2 days for CoRncrete without coating. Previous research predominantly emphasized employing microwave ovens instead of convection ovens, as the samples treated in microwave ovens exhibited better compressive strength in comparison to those processed in convection ovens. However, it should be noted that microwave ovens are costly and more challenging to scale up for industrial purposes. Considering the experiments conducted with convection ovens, there are promising prospects to explore deeper into the factors influencing compressive strength. In all these studies, there was no in-depth statistical analysis of the interaction and effects of different factors (sand grain size, mixture ratio, heating procedure) on the physical and mechanical properties. A detailed study is necessary because it will provide better understanding of these different factors, especially using only convention oven. Hence, this study will primarily focus on optimizing the mechanical strength of CoRncrete at different factors and levels by assessing the contribution of individual factors to the strength and find out the best processing condition to achieve maximum compressive strength.

2. Materials and Methods

2.1. Materials and Preliminary Study

The materials needed to produce CoRncrete are cornstarch, water, and sand. General purpose cornstarch used for cooking was purchased from a local supermarket. All-purpose sand was also purchased from a local store. The sand was later sieved using a laboratory sieve shaker to obtain the different sand grain sizes. Normal tap water at room temperature (approximately 23 °C) was used throughout the study. Based on previous studies, the main factors that affect the strength of CoRncrete are sand grain size, mixture ratio, curing temperature, and curing time [18,19].

2.2. Experimental Design

A design of experiment (DOE) was prepared using Minitab statistical software (21.2, Minitab Inc.; State College, PA, USA). As the factors and their levels were uneven, a full factorial design was implemented for this first experiment to know the full effect of the factors on compressive strength. Table 1 shows the first design constructed with 4 independent factors: sand grain size, mixture ratio (starch:water:sand), curing temperature, and curing time. The first design generated 48 different experimental runs, where each run was performed in triplicate to account for any experimental error.
Following the results of the first design, a second, reduced, DOE was prepared to explore additional levels for only three factors. This was conducted at a starch: water: sand ratio of 1:1:5. On the new DOE, a coarser sand grain size, some lower curing temperatures, and some lower curing times were added. The factors and their levels for the second DOE are shown in Table 2. The second design generated 27 experimental runs, where each run was performed in triplicate. The response variable for both experiments was compressive strength, which will be explained later.

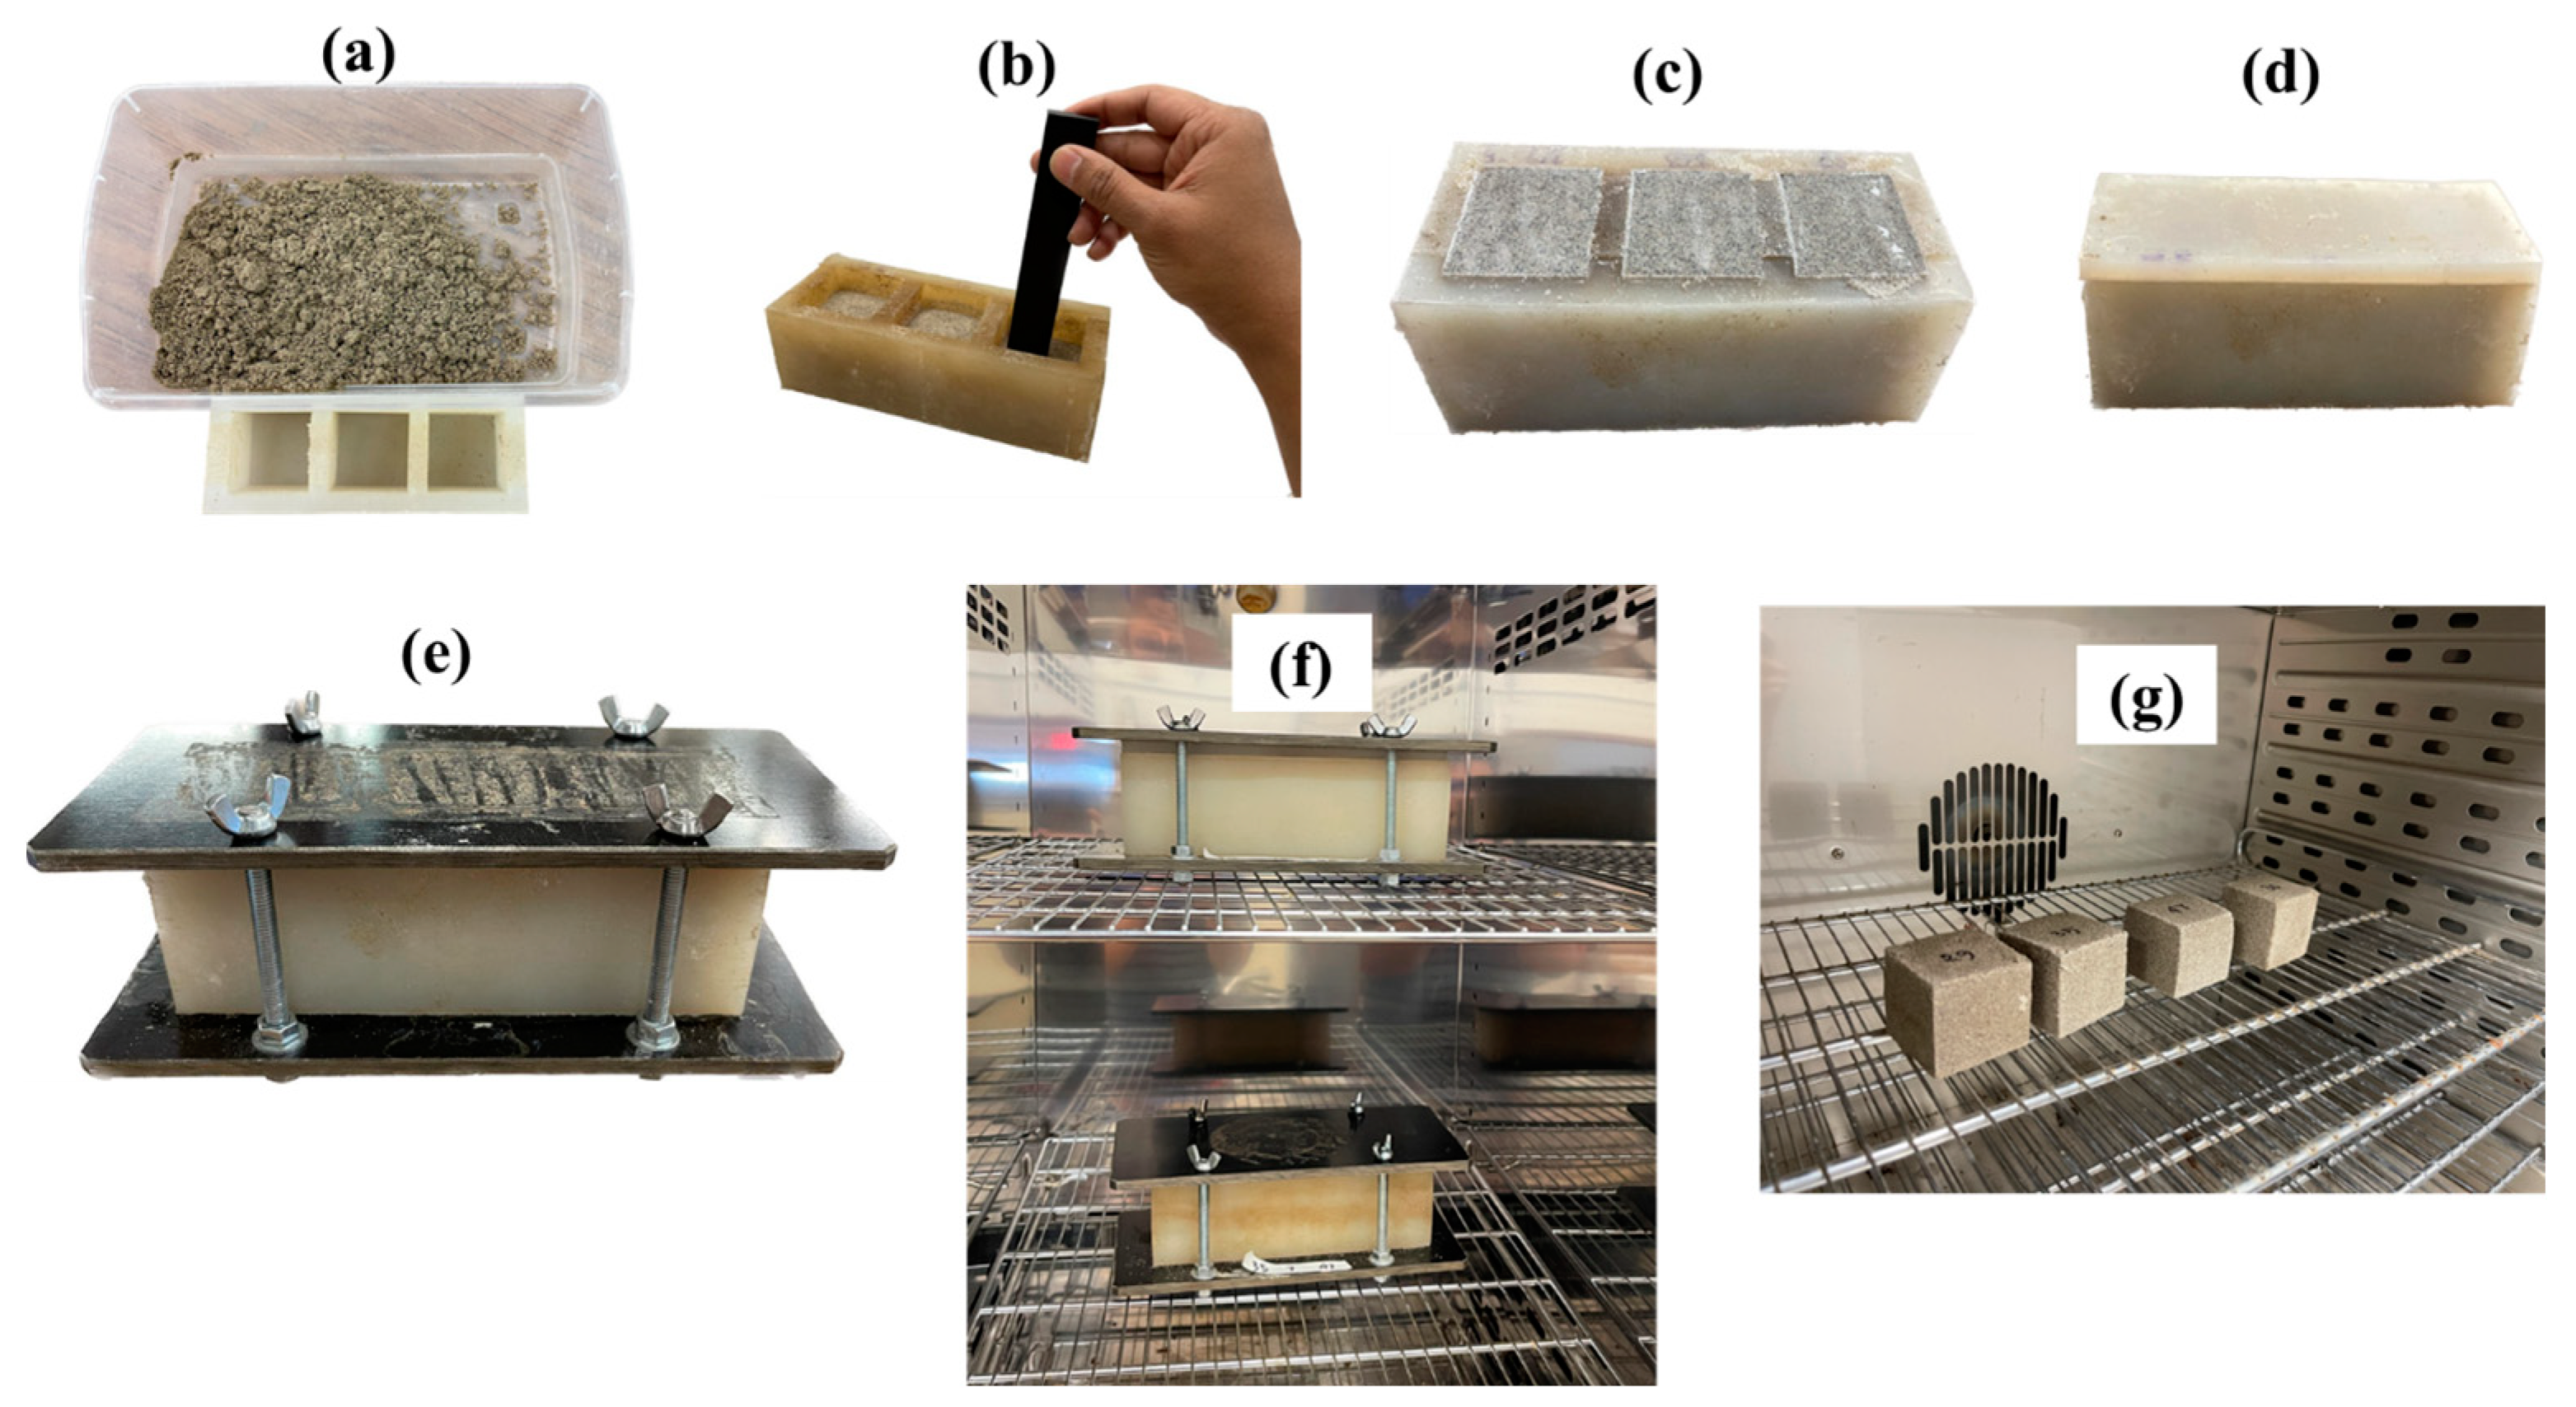
2.3. Sample Preparation for Testing

Each of the different sand grain sizes in Table 1 and Table 2 was first mixed with starch in a plastic container for 3 min using a 3-bladed propeller agitator of 30 cm shaft length and 2.54 cm bladed length pitched at 45°. The agitator was powered by a cordless driver (Bosch, model DDB 140: Peoria, IL, USA). Sand and starch were first mixed in order to prevent the clustering of starch in the mixture. After the sand and the starch were properly mixed, tap water was added to the mixture according to the ratio in Table 1 and was mixed again for 3 min to obtain the fresh CoRncrete. The fresh CoRncrete was then poured into a 2 × 2 × 2 inch3 (5.08 × 5.08 × 5.08 cm3) cubic silicon rubber mold, as shown in Figure 1a. Silicon rubber was used in this study because it can withstand temperatures up to 200 °C. Furthermore, this material can transfer heat evenly throughout the samples. Another benefit of using silicon rubber mold is that, after curing, the hardened CoRncrete can be easily extricated from the mold. For each run, a total of 750 g fresh CoRncrete was made to fill out the three cubes in the silicon rubber mold. The mixture ratio was maintained according to Table 1. For example, the amounts in the 1:1:5 ratio were 107.14 g corn starch, 107.14 mL water, and 535.71 g sand.
A rubber tamping rod, as shown in Figure 1b, was used to compress the mixture into the silicon rubber mold. Each sample was tamped with the rod approximately 32 times following the ASTM C109 testing procedure [20]. Finally, excess CoRncrete was screed off using a leveler, as shown in Figure 1c. The thermal conductivity of silicon rubber is lower than CoRncrete, which may create uneven heat distribution throughout the CoRncrete sample, especially on top of the mold. To minimize this issue, a silicon rubber lid was placed on top of the mold, as shown in Figure 1d. Additionally, the mold was placed between two plates and tightened with a screw, as shown in Figure 1e. This helped reduce the loss of moisture during the curing process. Figure 1f,g show the samples in the oven during curing and drying. The curing temperatures and times were according to the set up in Table 1 and Table 2. Lastly, each sample was dried in a convection oven (Precision Scientific, Inc.; Winchester, IL, USA) to produce the final hardened CoRncrete. The dried samples were stored in a closed polythene bag to avoid contact with atmospheric moisture before testing. The samples casted, as shown in Figure 1, were used for compressive strength testing, image analysis, and microCT analysis, which are described below.
Another set of molds was used to cast samples used for tensile strength testing. The mold can produce samples that have a diameter of 5 cm and thickness of 2.5 cm. This gave a sample thickness to diameter ratio t D = 0.5 0, which is according to the ASTM standard (ASTM D 3967) [21]. Fresh CoRncrete was prepared, cured, and dried according to the procedure described above, except for the change in mold. Figure 2 shows the molds and samples for tensile strength testing.

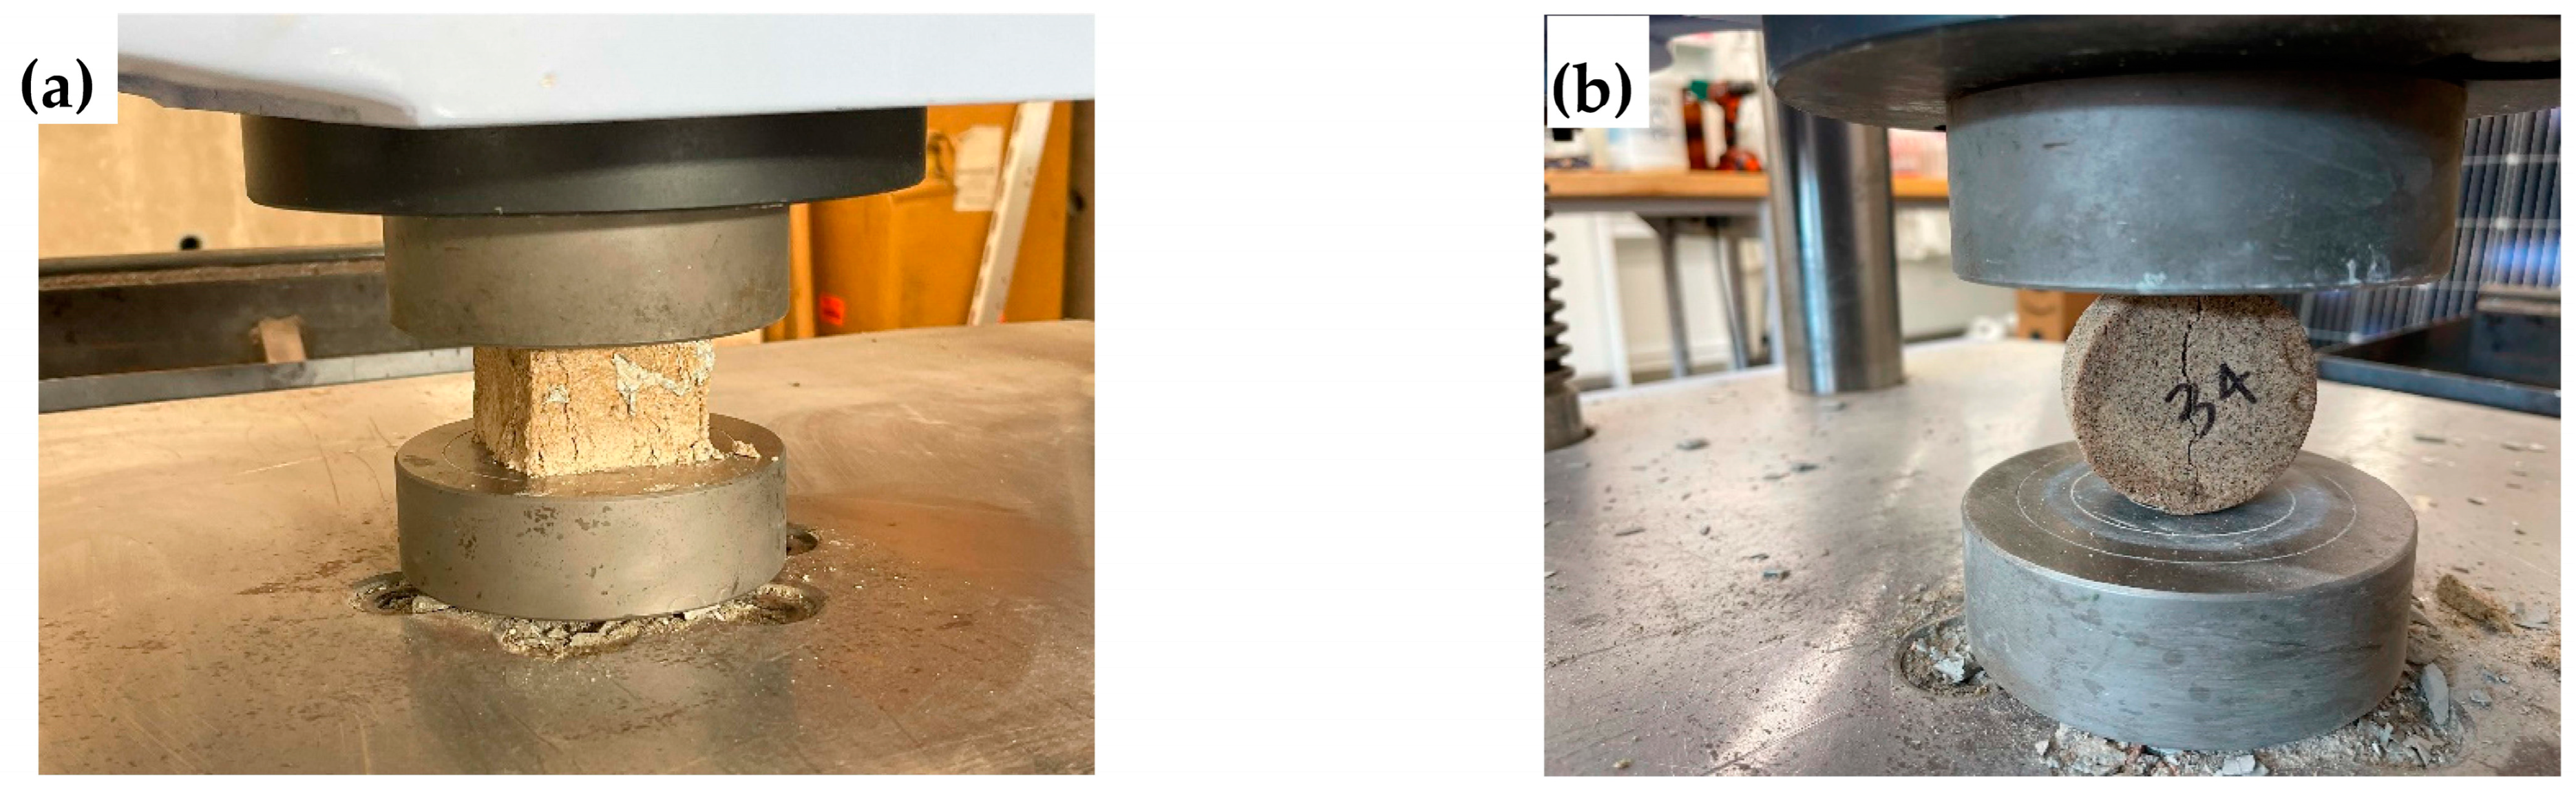
2.4. Mechanical Strength Measurement

Uniaxial compressive strength testing was performed for each dried sample in Figure 1g by roughly following the guidelines stated by the ASTM C109 procedure. This strength testing was conducted using an ASTM standard universal testing machine (UTM-UH-500KNX, Shimadzu, Kyoto, Japan) as shown in Figure 3a. Each sample was subjected to a fixed speed of 2 mm/min using load cells, resulting in a loading rate of 0.23 MPa s−1. The cubic sample was then monitored for the maximum force (KN) applied before any cracking occurred. Additionally, tensile strength was also measured by means of an indirect test method, according to a laboratory test called the Splitting Brazilian Test [20], which is one of the indirect methods used to measure the tensile strength of a material. The same universal testing machine (UTM) and loading rate discussed above were used to measure tensile strength, as shown in Figure 3b. The samples in Figure 2d were placed between the two flat loading plates of a UTM in such that a diametrical line load was applied throughout the length of the cylindrical sample. Three samples were prepared for each experimental run. Equation (1) was used to calculate the maximum value of the splitting tensile strength (σt) in MPa.
σ t = 2 P π L D
where D is testing specimen diameter (mm), L is test specimen thickness (mm), and P is applied axial load at failure (N).

2.5. Scanning Electron Microscopy

Scanning Electron Microscopy (SEM) was used to observe the internal structure of the CoRncrete samples. Two-dimensional images were generated from each sample that showed the interaction of starch, sand, and water. Nine samples of different sand grain sizes and curing temperatures were chosen and analyzed. Each sample was fractured to reveal the internal structure. Fractured samples were attached to cylindrical aluminum mounts using silver paint (SPI Products, Chester, PA, USA) and subsequently sputter-coated with a conductive coating of gold (Cressington 108auto, Ted Pella, Redding, CA, USA). Images were obtained with a JEOL JSM-6490LV scanning electron microscope (JEOL USA, Inc., Peabody, MA, USA) at an accelerating voltage of 15 kV.

2.6. X-ray Micro-Computed Tomography (microCT)

MicroCT was used to evaluate the features of pores and solid phases, such as their volume fraction and spatial distribution, and their relationships with physical parameters. A total of 5 CoRncrete samples were selected based on their compressive strength (highest, high, medium, low, lowest) to observe the relation between porosity and strength. Two traditional concrete samples having two different sand grain sizes were also prepared for the comparison process. Each sample was placed into a GE Phoenix v|tome|x s X-ray computed tomography system (microCT) equipped with a 180 kV nano-focus X-ray tube and a high-contrast GE DXR250RT flat-panel detector (GE Sensing & Inspection Technologies GmbH, Niels Bohr Str 7, Wunstorf, Germany). At a voltage of 130 kV and a current of 455 µA with a diamond target, 1500 projections were acquired. The detector’s timing was 200 msec. Sample magnification was 2.616× with a voxel size of 76.458 µm. Acquired images were reconstructed into a volume data set using GE datos|× 3D computer tomography software version 2.2 (GE Sensing & Inspection Technologies GmbH, Niels Bohr Str 7, Wunstorf, Germany). The reconstructed volume was then viewed and adjusted using VGStudioMax version 2022.4 (Volume Graphics, Inc., 3219 Arbor Pointe Drive, Charlotte, NC, USA).

2.7. Statistical Analysis

Statistical analysis was performed using Minitab 21 (State College, PA, USA). Results were analyzed at p-value < 0.05. The statistical parameters were estimated using analysis of variance (ANOVA), and the significance of the model equation and model terms were evaluated using the F-test in Minitab statistical software (version 21.2). Finally, grouping information using Tukey’s mean comparison of factors was also performed, with 95% confidence.

3. Results and Discussion

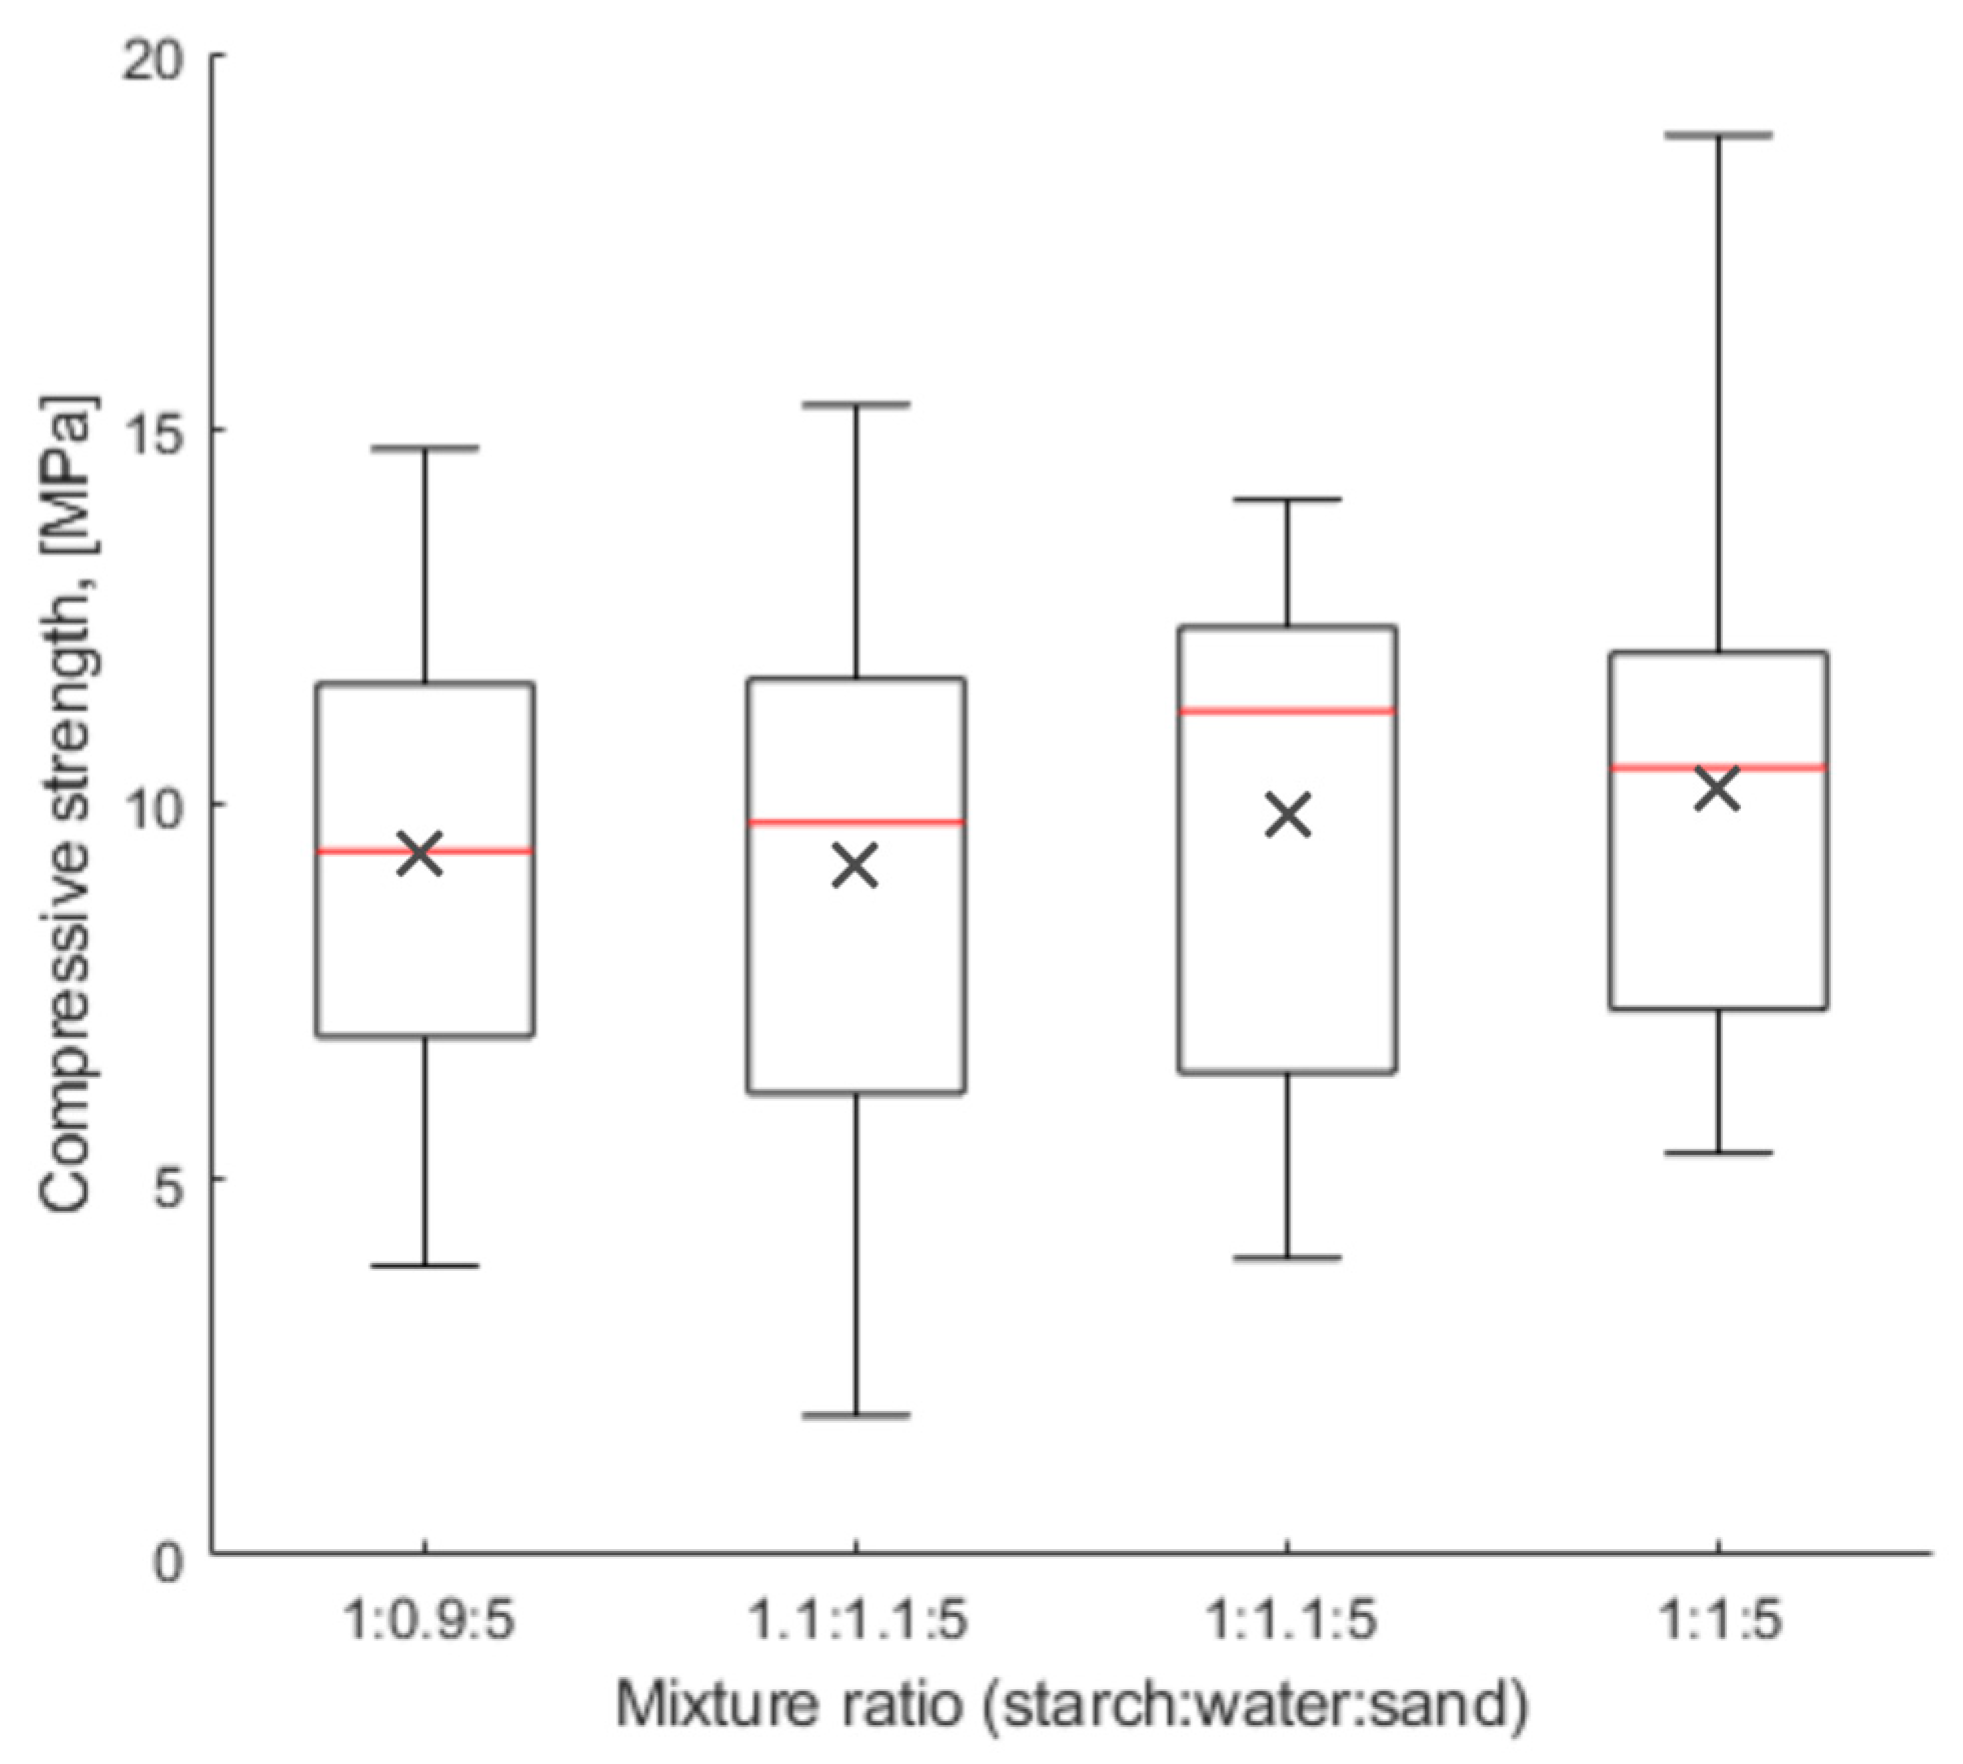
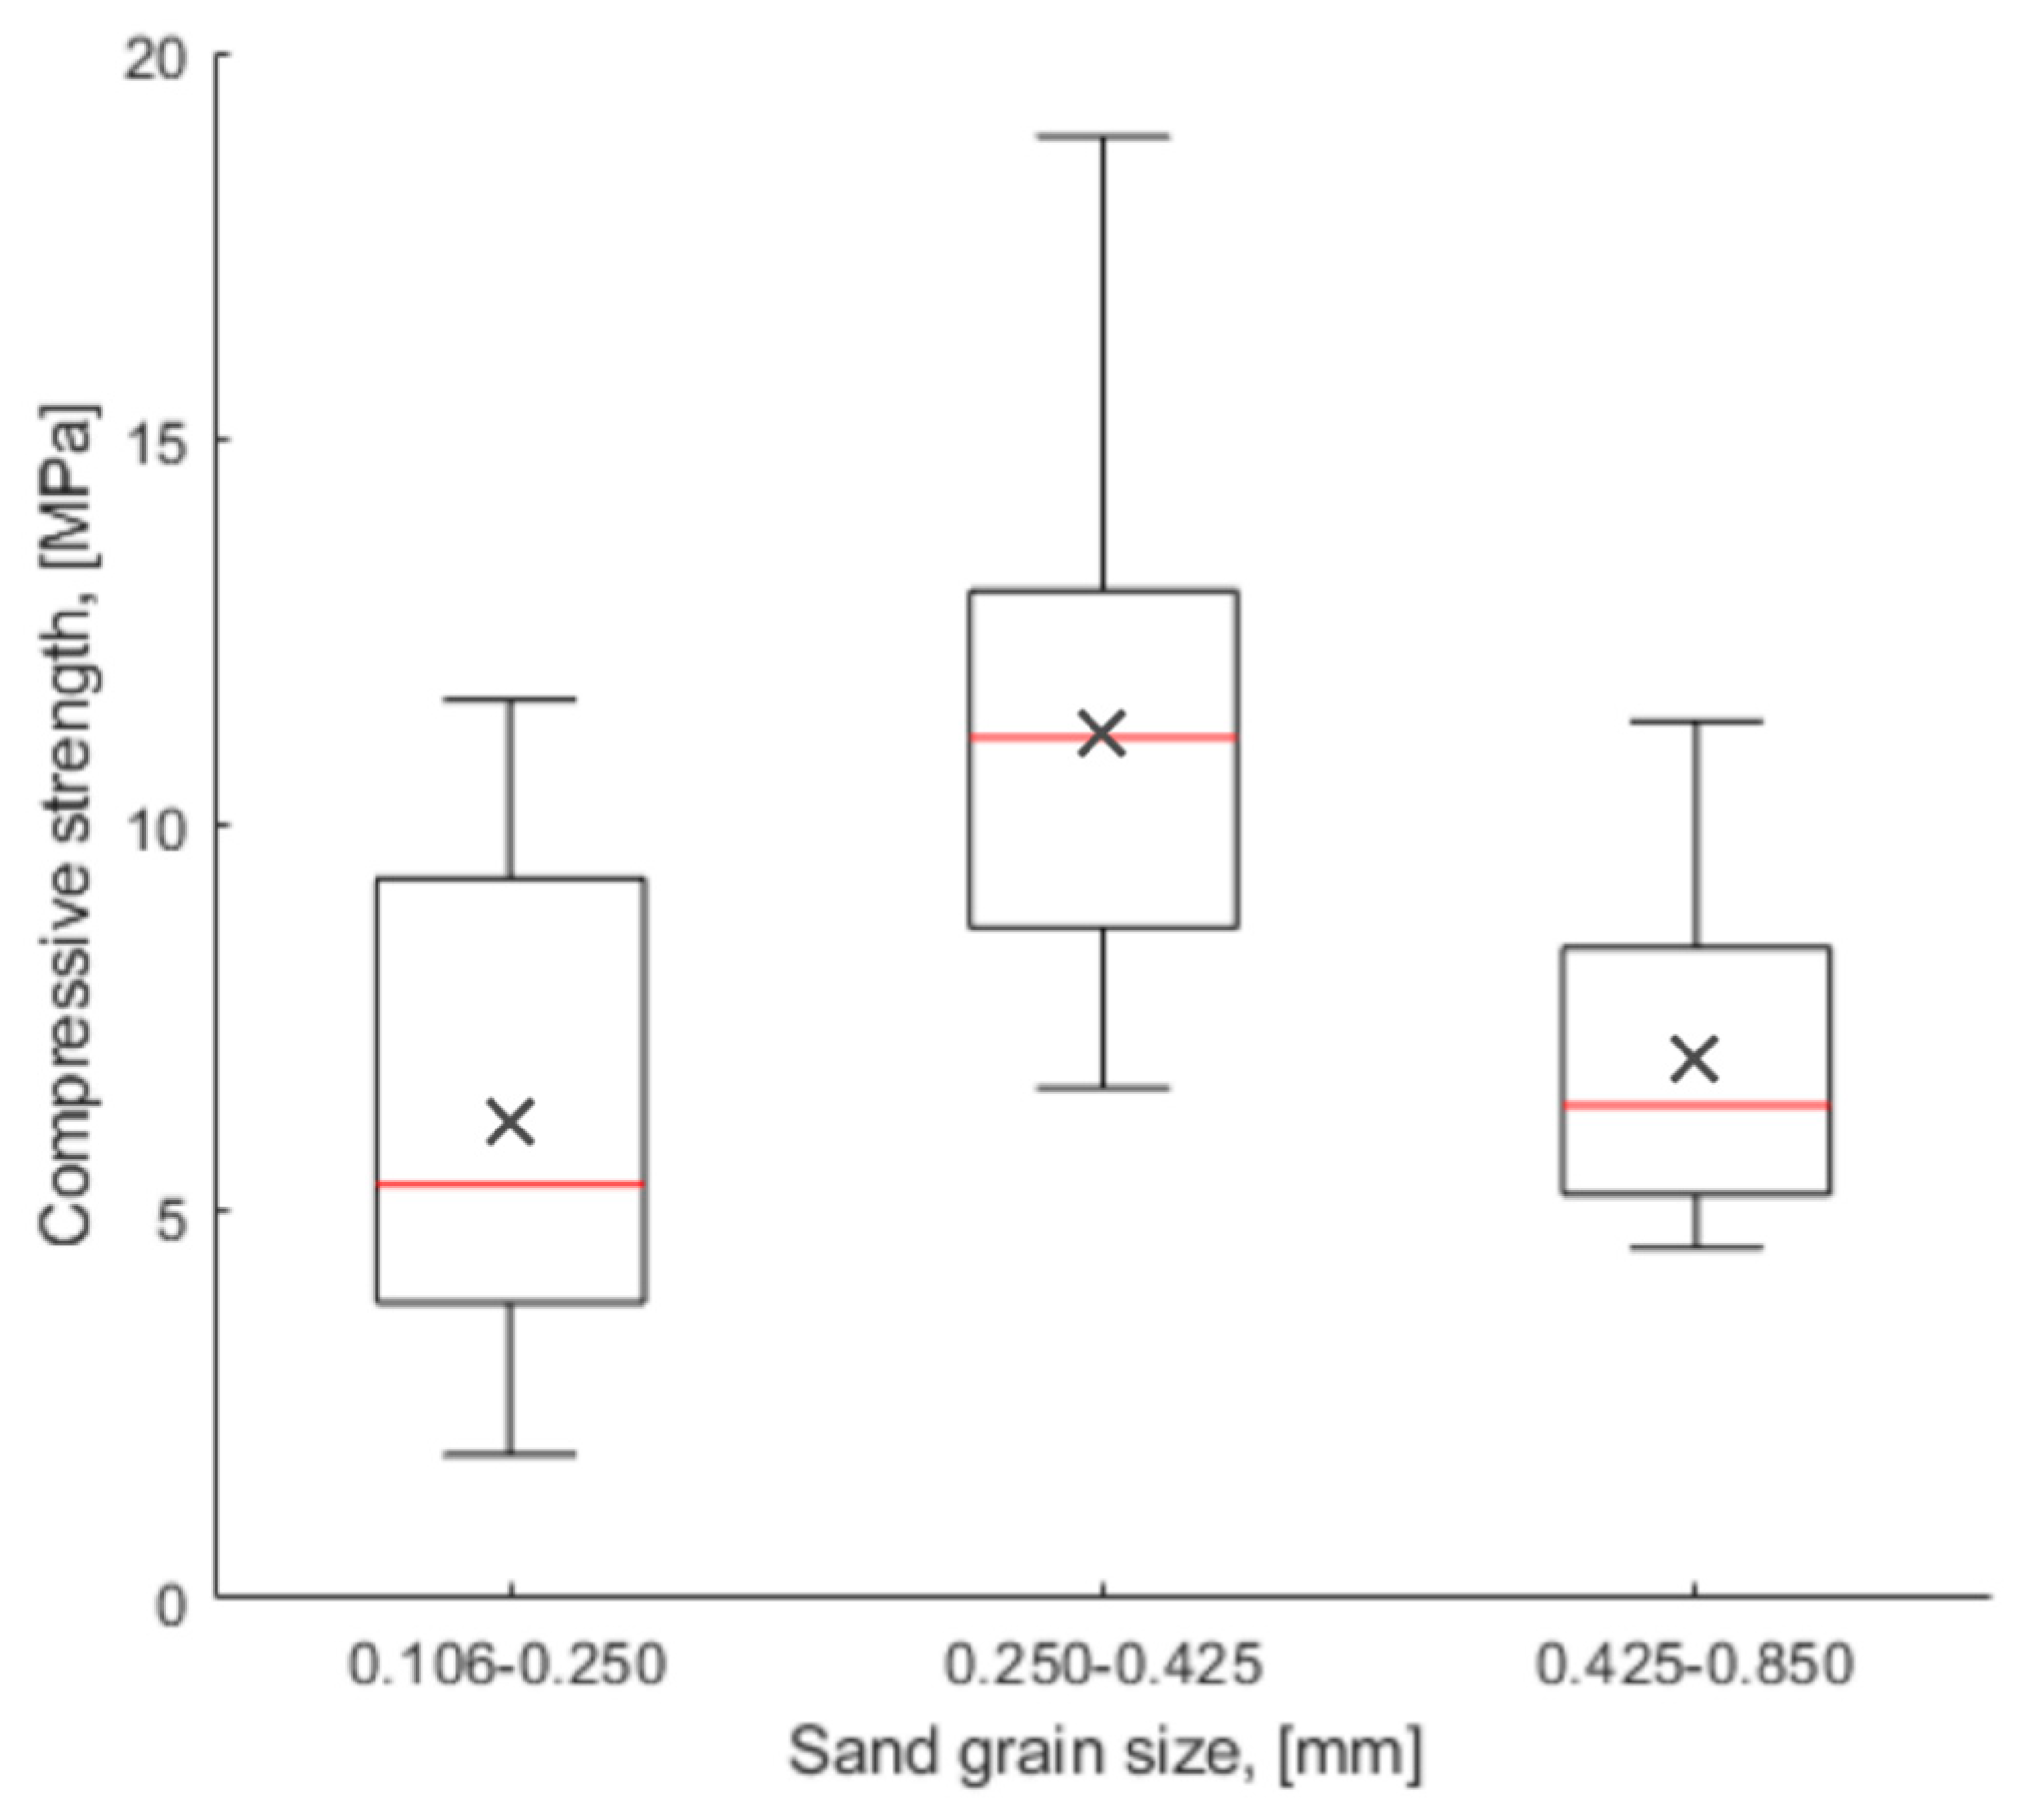
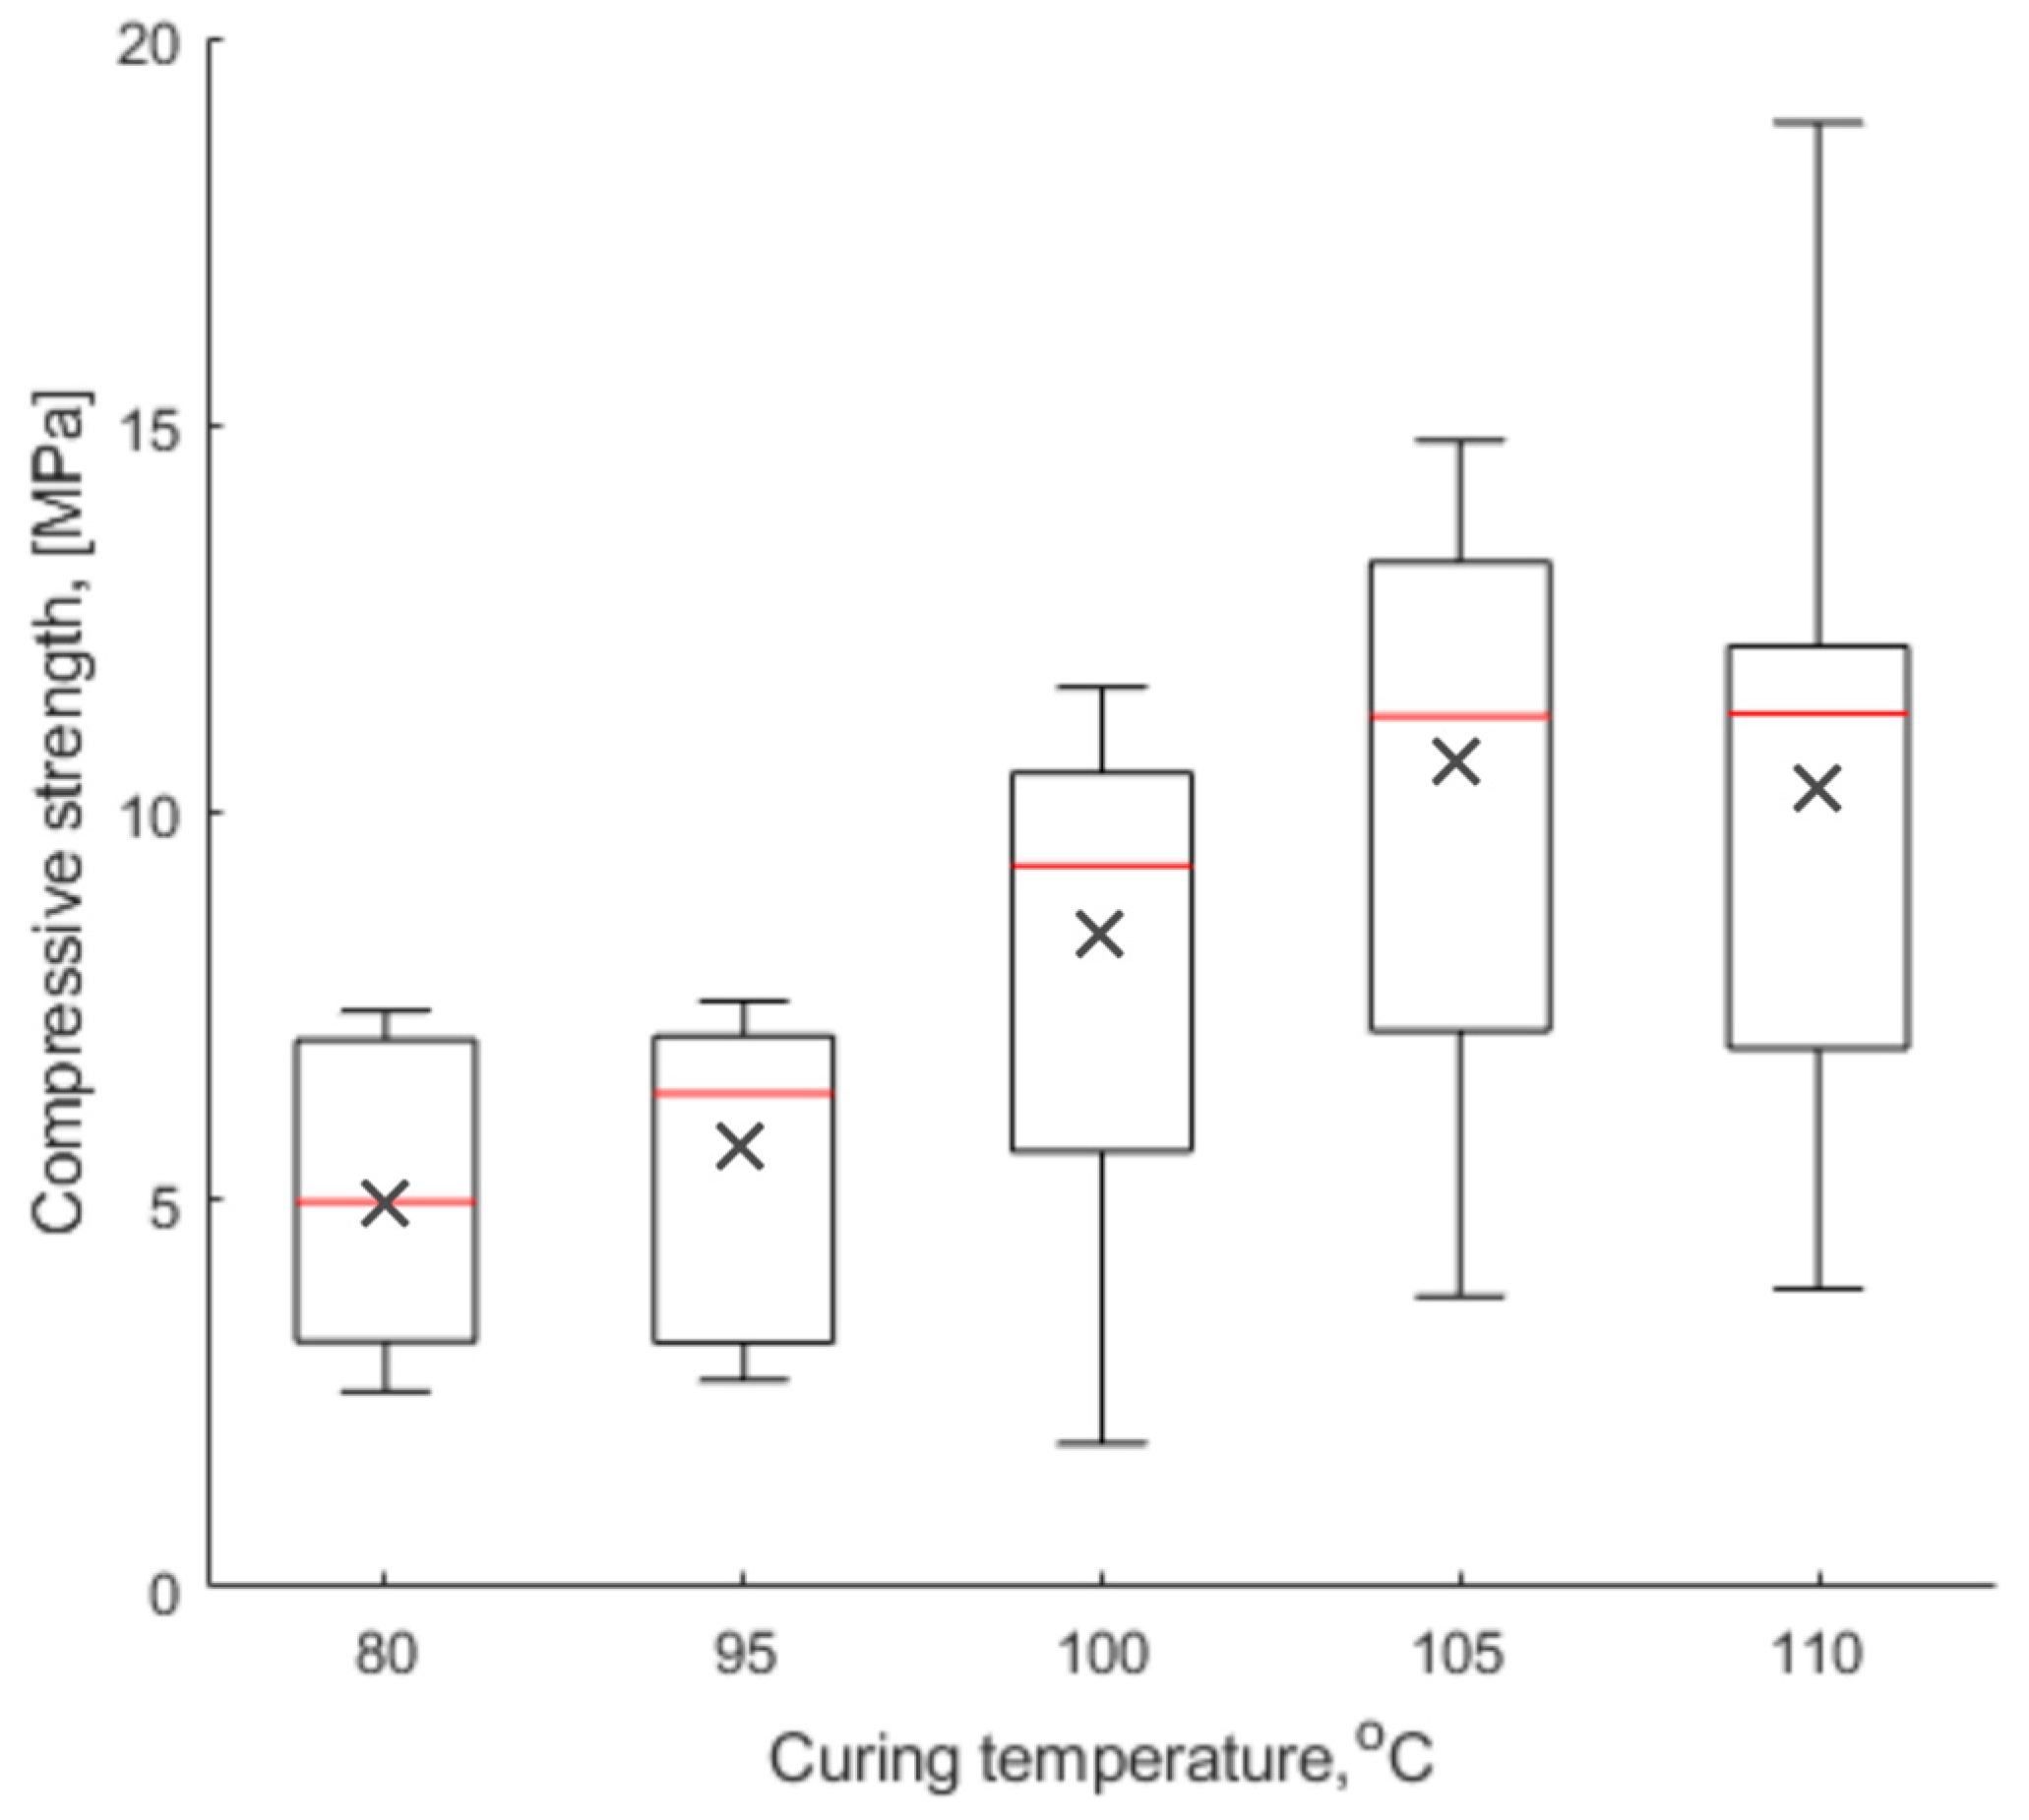
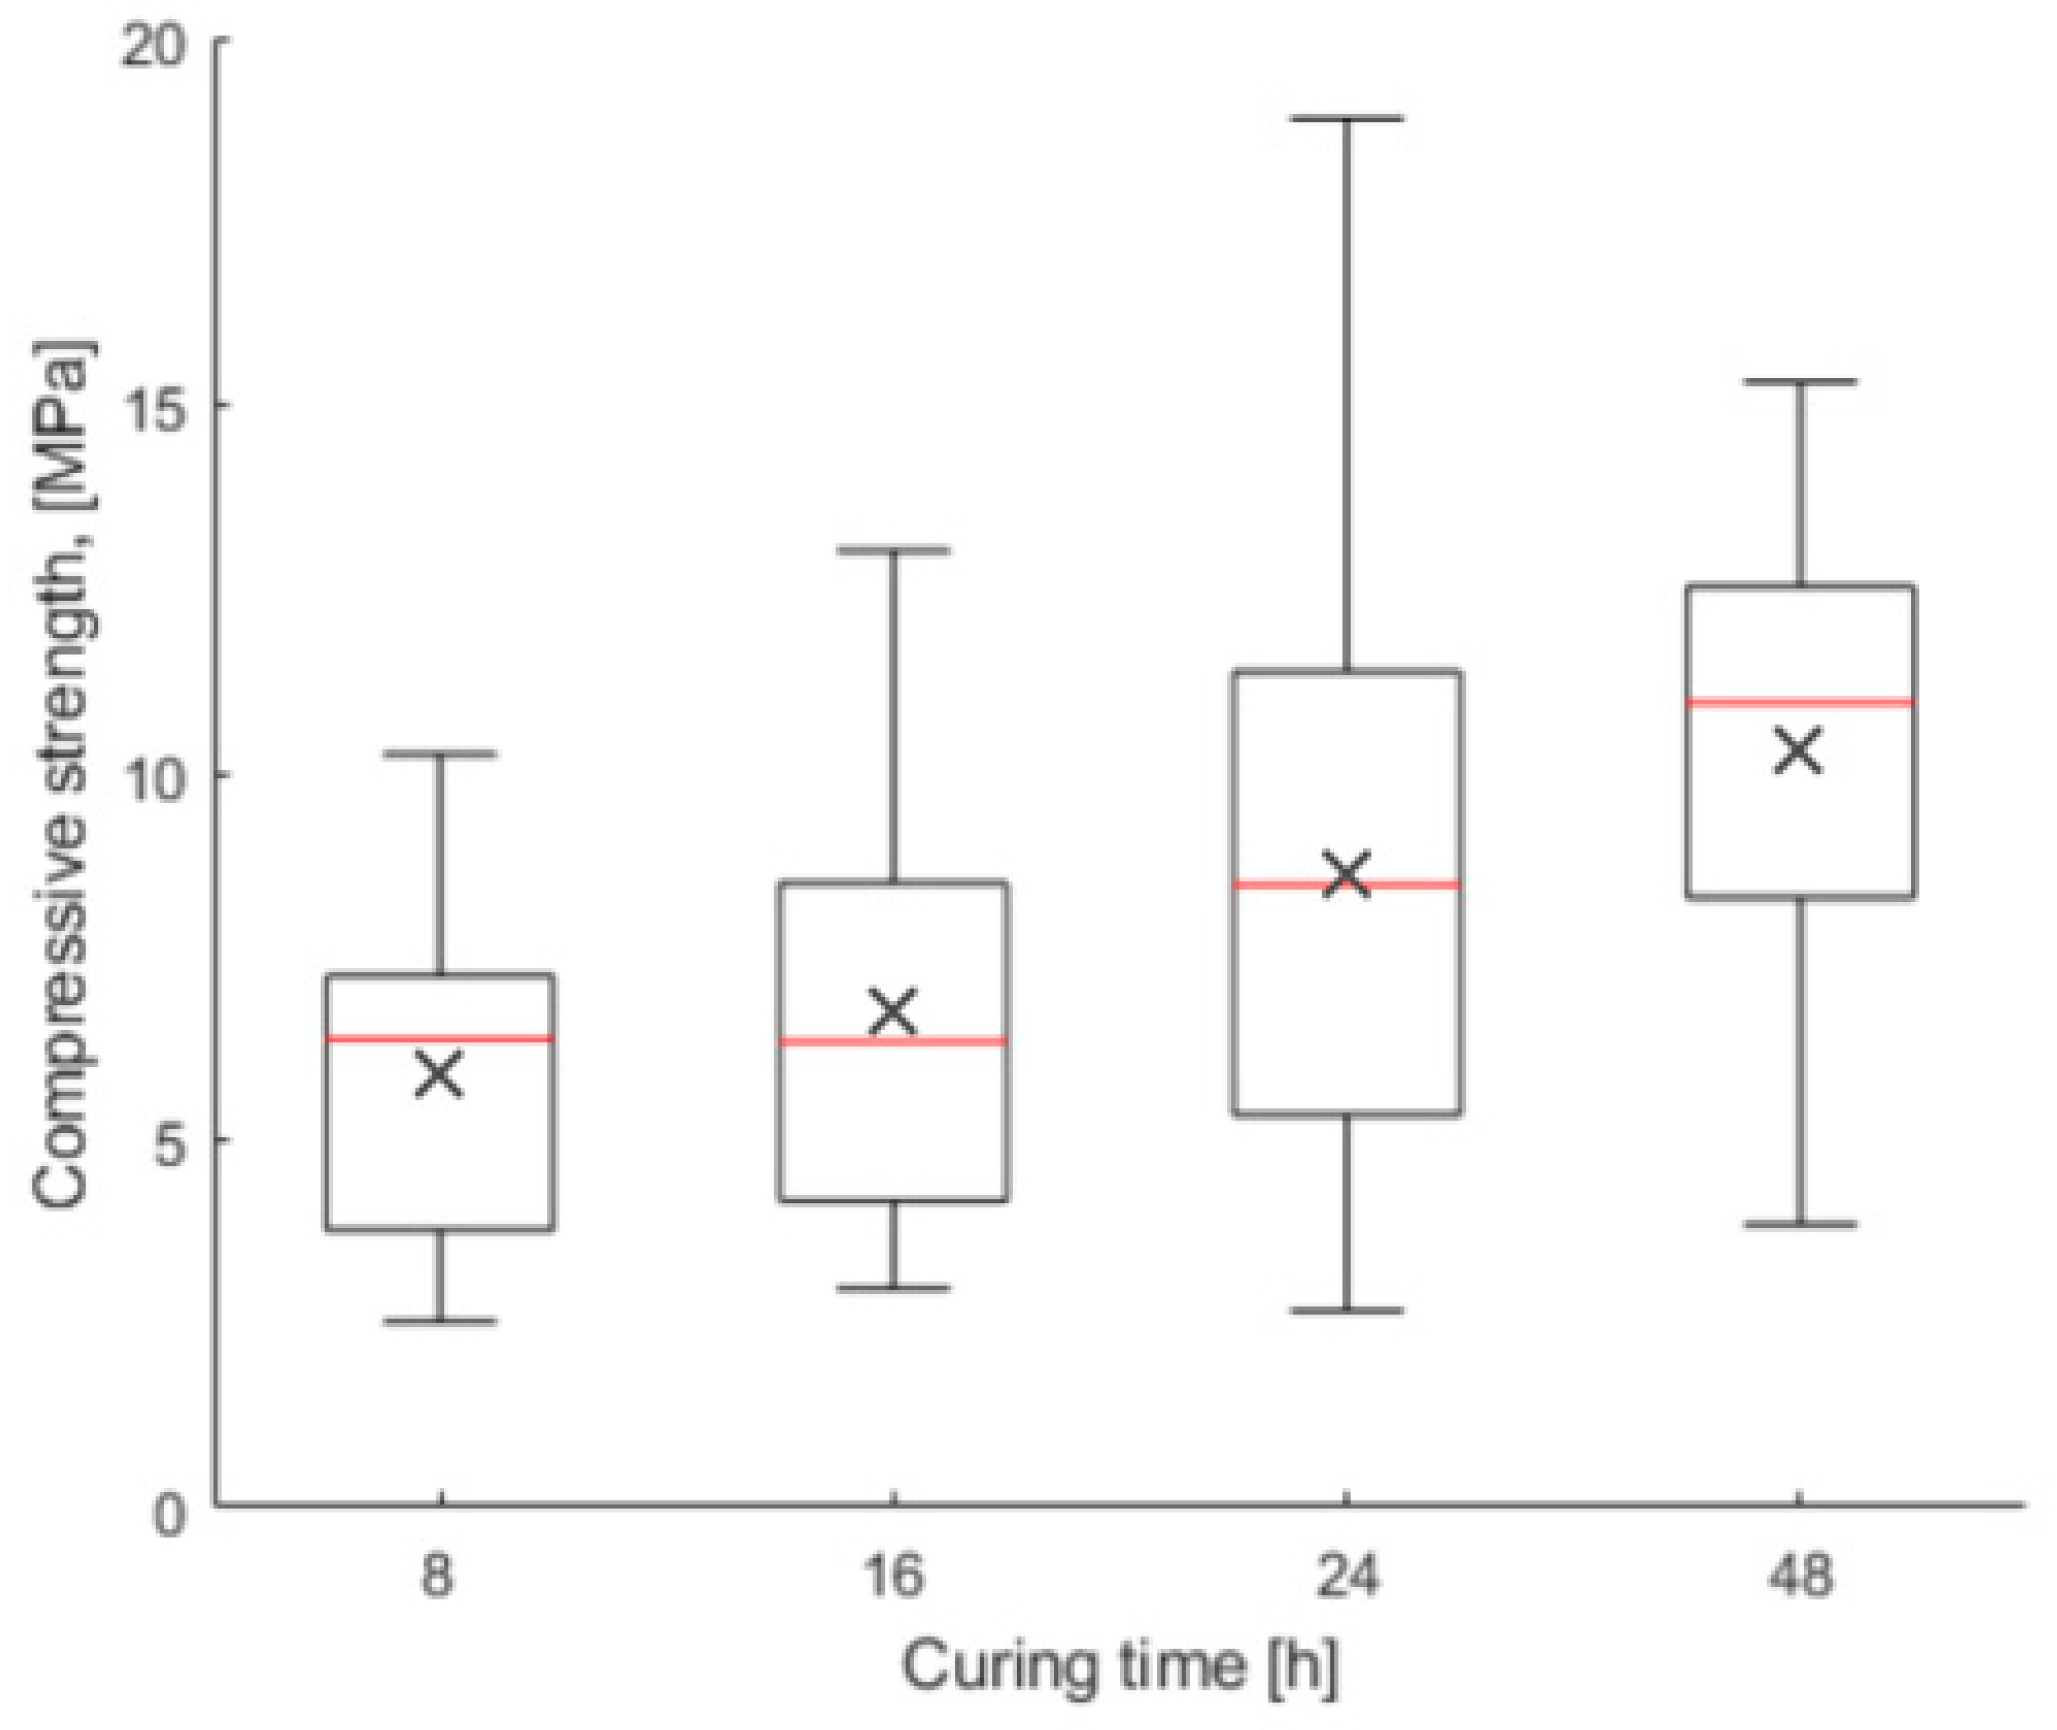
3.1. The Effect of Different Factors on the Compressive Strength of CoRncrete

To observe the impact of the different factors on compressive strength, a design of experiment (DOE) was generated with four factors at their various levels, as shown in Table 1. This was the first of the two experiments conducted. The compressive strength was the response variable for statistical analysis and ranged from 1.9 to 18.9 MPa for the first experimental design. The effect of the different factors on the changes observed in CoRncrete compressive strength is shown in Table 3. At p-value < 0.05, the differences in the sand grain size and curing temperature significantly affected the compressive strength. From the sum of square results, it is observed that, among the factors, sand grain sizes affected most on the compressive strength as it contributed to 39.4% of the changes observed, while curing temperature contributed to only 9.3% of the changes observed. The levels for the mixture ratio and curing time did not significantly affect compressive strength, since their p-values were greater than 0.05. The sum of squares of the error term was very high, which was approximately 48.1% of the changes observed. This is due to the model using factor levels that were not significant or not at their optimum levels. Hence, the model, from these data, is not suitable for predicting compressive strength at these factor levels.
To look at mean comparison for each factor, Table 4 shows the grouping information using the Tukey method with 95% confidence. The mean value of compressive strength is significantly greater while using a sand grain size of 0.250–0.425 mm compared to the other sand grain size (0.106–0.250 mm). Normally, the sand–starch interfacial area reduces as the sand grain size increases, and hence the compressive strength was expected to reduce as shown in Kulshreshtha et al. [18]. The increase in strength using a coarser sand in this study may likely be due to the fact that the sand–starch interfacial area was better when using conventional oven (slower curing than microwave) for heat and moisture transfer during curing and drying, respectively. With only two grain sizes used, it was very important to investigate further if the compressive strength increases with increase in grain size or at what point the strength will start decreasing. The curing temperature was barely significant at p = 0.029, with the mean compressive strength of temperature at 100 °C slightly different from those at 105 and 110 °C. Samples at 110 °C gave slightly better results in compressive strength than at 105 °C. The curing time at 48 h was slightly higher than 24 h, but statistically, the mean difference between 24 h and 48 h was not significant. Interestingly, the experiment with the highest compressive strength had a curing time of 24 h. It is important to have uniform gelatinization of the starch from the surface to the inner core of the coRncrete block. If moisture is trapped in the inner core, then that affects the mechanical properties.
The mixture ratio of starch was not significantly different but the ratio of 1:1:5 showed a slightly better compressive strength mean compared to the other ratios. To have a visual representation of how the mixture was the same, Figure 4 shows the mean compressive strengths and error bars. A mixture ratio of 1.1:1.1:5 shows the lowest mean value (9.23 MPa) and a mixture ratio of 1:1:5 shows the highest mean value of 10.24 MPa. Although the mean values of compressive strengths of all four mixture ratios did not differ significantly, the mixture having a ratio of 1:1:5 had the highest compressive strength (18.90 MPa). Because there is no statistically significant difference between these four mixture ratios, the mixture ratio of 1:1:5 was considered optimal for subsequent experiments.
From the above ANOVA and Tukey’s mean comparison results, it can be assumed that a higher sand grain size (larger than 0.250–0.425 mm) may have the ability to increase the compressive strength of the CoRncrete. Furthermore, lower levels of curing temperature and curing time should be implemented to observe the change in compressive strength due to temperature. The main reason to reduce the values of temperature and curing time was to observe if a higher strength CoRncrete can still be obtained by consuming less energy. The peak gelatinization temperature of the cornstarch was found between 70 and 75 °C [22,23,24]. This implies that at least 75 °C should be needed as a curing temperature, assuming that very little water is lost during the curing/heating process. For this reason, temperatures below 75 °C were not considered in the further experimental design. The factors and their levels for the second experimental design are described in Table 2. This experimental design generates 27 experimental runs along with their response variable (compressive strength). After executing all the runs, the minimum and maximum compressive strength of 2.53 MPa and 18.90 MPa were obtained. A second ANOVA (Table 5) was conducted to statistically test the effect of new levels of sand grain size, curing temperature, and curing time on compressive strength. The ANOVA shows that sand grain size and curing temperature significantly affect the compressive strength, since the p-values for these two factors were zero. On the other hand, curing time did not have a significant effect on compressive strength, as the p-value was slightly above 0.05. The sum of squares for the error term was around 18% of the total error. Hence, the model was better than the model in Table 4, but still not adequate for predicting compressive strength at these factor levels.
Determining sand grain size is one of the most important factors for CoRncrete production. As sand grain sizes have significantly affected the compressive strength of CoRncrete, it is very important to examine the strength while using specifically sized sand grains. Table 6 shows the grouping information using the Tukey method with 95% confidence from the data obtained from the second DOE. The mean difference between sand grain size of 0.250–0.425 mm and 0.425–0.850 mm is not statistically significant, which signifies that increasing the grain size above 0.425 mm did not significantly increase the compressive strength. The mean was significantly lower for concrete with sand grain size of 0.106–0.250 mm compared to the other two grain sizes. The samples having grain size of 0.250–0.425 mm show the best compressive strength compared to the other sizes. Figure 5 illustrates the compressive strengths for corresponding sand grain sizes while implementing different runs of the two experimental designs. The boxplots also show the error bars and mean and median values.
The range of the compressive strength observed by using the above three different grain sizes was from 1.86 to 18.90 MPa. While using the grain size of 0.106–0.250 mm, the range of compressive strength varies from 1.86 to 11.61 MPa, with a mean value of 6.31 MPa. The sand grain size of 0.425–0.850 mm shows slightly better mean values of strength compared to 0.106–0.250 mm grain size. However, the minimum and maximum value range is from 4.53 to 11.33 MPa, with a mean value of 7.21 MPa. The maximum strength of 18.90 MPa was observed while using sand grains of 0.250–0.425 mm. Furthermore, the mean (11.11 MPa) and median (11.13 MPa) values of compressive strength were much higher than the other two grain sizes. Kulshreshtha et al. [18] used four different grain sizes of sand. Amongst them, the maximum compressive strength of 13.70 MPa was obtained while using sand of 0.125–0.25 mm grain size and using a convection oven as curing media. While using sand grain size of 0.25–0.50 mm, they found a maximum strength of 9.27 MPa, which was smaller than the maximum in this study. The improved mechanical strength in our study may have occurred due to the use of a silicon rubber mold bounded lid curing environment and also the addition of drying after curing.
The ANOVA showed that curing temperature had a great impact on the strength of CoRncrete samples. In some previous studies, a microwave oven was used during the curing procedure, but in our study, a convection oven was used due to its wide availability at the industrial level. Figure 6 shows the compressive strength of five curing temperatures that was performed in the two experiments.
Figure 6 shows that the mean compressive strength increases with increasing curing temperature. Statistically, the mean values at 80 and 95 °C were the same but different from the rest of the mean values. The values were below 8 MPa, which shows that the starch could not be fully gelatinized below 100 °C. On the other hand, the mean values of 105 °C and 110 °C were statistically the same even though using 110 °C yielded the higher strength of up to 18.90 MPa compared to 105 °C of 14.79 MPa. It is recommended to use a curing temperature of 110 °C for the CoRncrete manufacturing process, which is almost similar to the 105 °C recommended by Kulshreshtha et al. [18] and Mansour et al. [19].
The length and intensity of heating also had a significant impact on the gelatinization process and the sand–starch matrix’s ability to connect. Four different curing time ranges from 8 h to 48 h were used for the two experiments. Figure 7 shows the range of strength along with their error bars for corresponding curing times.
An increasing trend of mean values can be observed while increasing the curing time. Although the mean value of 48 h (10.14 MPa) was greater than 24 h (8.58 MPa), statistically there was no significant difference in the means of curing time. The maximum strength of 18.90 MPa was achieved while using curing time of 24 h. In contrast, 48 h curing time produces a maximum compressive strength of 15.31 MPa, which is lower than some samples produced by using 24 h. Furthermore, the mean strength values of 8 h and 16 h curing time were 5.83 and 6.72 MPa, respectively. A much lower outlier value of 1.86 MPa was observed while using curing time of 48 h. In a previous study, only 24 h curing time in the convection oven was used to make the hardened CoRncrete [18].
At the onset of the experiment, drying was not incorporated. The CoRncrete samples were very soft after the curing process and had mold growth after 7 days, as seen in Figure 8a. To solve these problems, additional drying at 100 °C for 24 h was added to the whole CoRncrete manufacturing process. Figure 8b shows that the addition of drying not only prevented fungus growth on the surface but also doubled the compressive strength. Drying helped to remove moisture from the samples, which accelerates the retrogradation process. Starch retrogradation process is the opposite of starch gelatinization. Retrogradation is a recrystallization process in which disaggregated amylose and amylopectin molecules bond to create ordered structures in gelatinized starches.

3.2. Tensile Strength Analysis

Usually, concrete is brittle in both tension and compression, but the compressive strength is about 10 times the tensile strength. The tensile strength of traditional concrete is measured to verify its capacity to resist cracking or breaking under tension. While concrete is rarely loaded in a building under pull pressure, figuring out the tensile strength is essential for understanding the possible degree of the damage. To measure the tensile properties of CoRncrete, the Splitting Brazilian test method was used according to ASTM D 3967, which is an indirect method to test the tensile strength of rock core specimen [20]. This method is useful for assessing the tensile properties of brittle materials including concrete, rocks, coal, ceramics, and similar materials that have higher compressive strength than tensile strength [25]. Based on the results of the compressive strength test and in accordance with prior research [26,27,28], as the substance was identified as artificial rock material, and the Brazilian test was conducted following the ASTM standard. The method is classified as a diametrical compression test since the force is exerted through its diameter on the cylindrical sample. The center of the cylinder’s geometry experienced a significant concentration of stress in this method [29].
Table 7 shows the compressive and tensile strength along with the ratio of tensile to compressive strength for different hardened samples. From the three different sand sizes, it can be seen that the sand grain size of 0.106–0.250 mm has a greater ratio of around 0.2, compared to the other two sand grain sizes. However, the value of the ratio stands around 0.1 for traditional concrete and cement mortar [19,30]. According to Yang et al. [31], the higher the ratio between the tensile and compressive strengths, the lower the brittleness of the material. Since the ratio for tradition concrete is approximately 0.1, the CoRncrete samples prepared with 0.106–0.250 mm sand grains are less brittle compared to the traditional concrete and mortar. On the other hand, while using the other two sand grains (0.250–0.450 mm and 0.425–0.850 mm), the value of the ratio ranging from 0.04 to 0.07, which is less than the traditional concrete, implies higher brittleness compared to the traditional concrete. The higher ratio for the smallest grain may be due to improper curing between the corn starch and the small sand grain. Mansour et al. [19] used high-purity quartz sand with a grain size of 0.125–0.25 mm to prepare their material. They found the ratio of tensile to compressive strength of approximately 0.23–0.4. Another study found that the average tensile strength value obtained using Brazilian tests was about 4.37 MPa, while the ratio of tensile to compressive strength found ranged from 0.163 to 0.298 when using various types of quartz sand to manufacture cornstarch-based building materials [27].

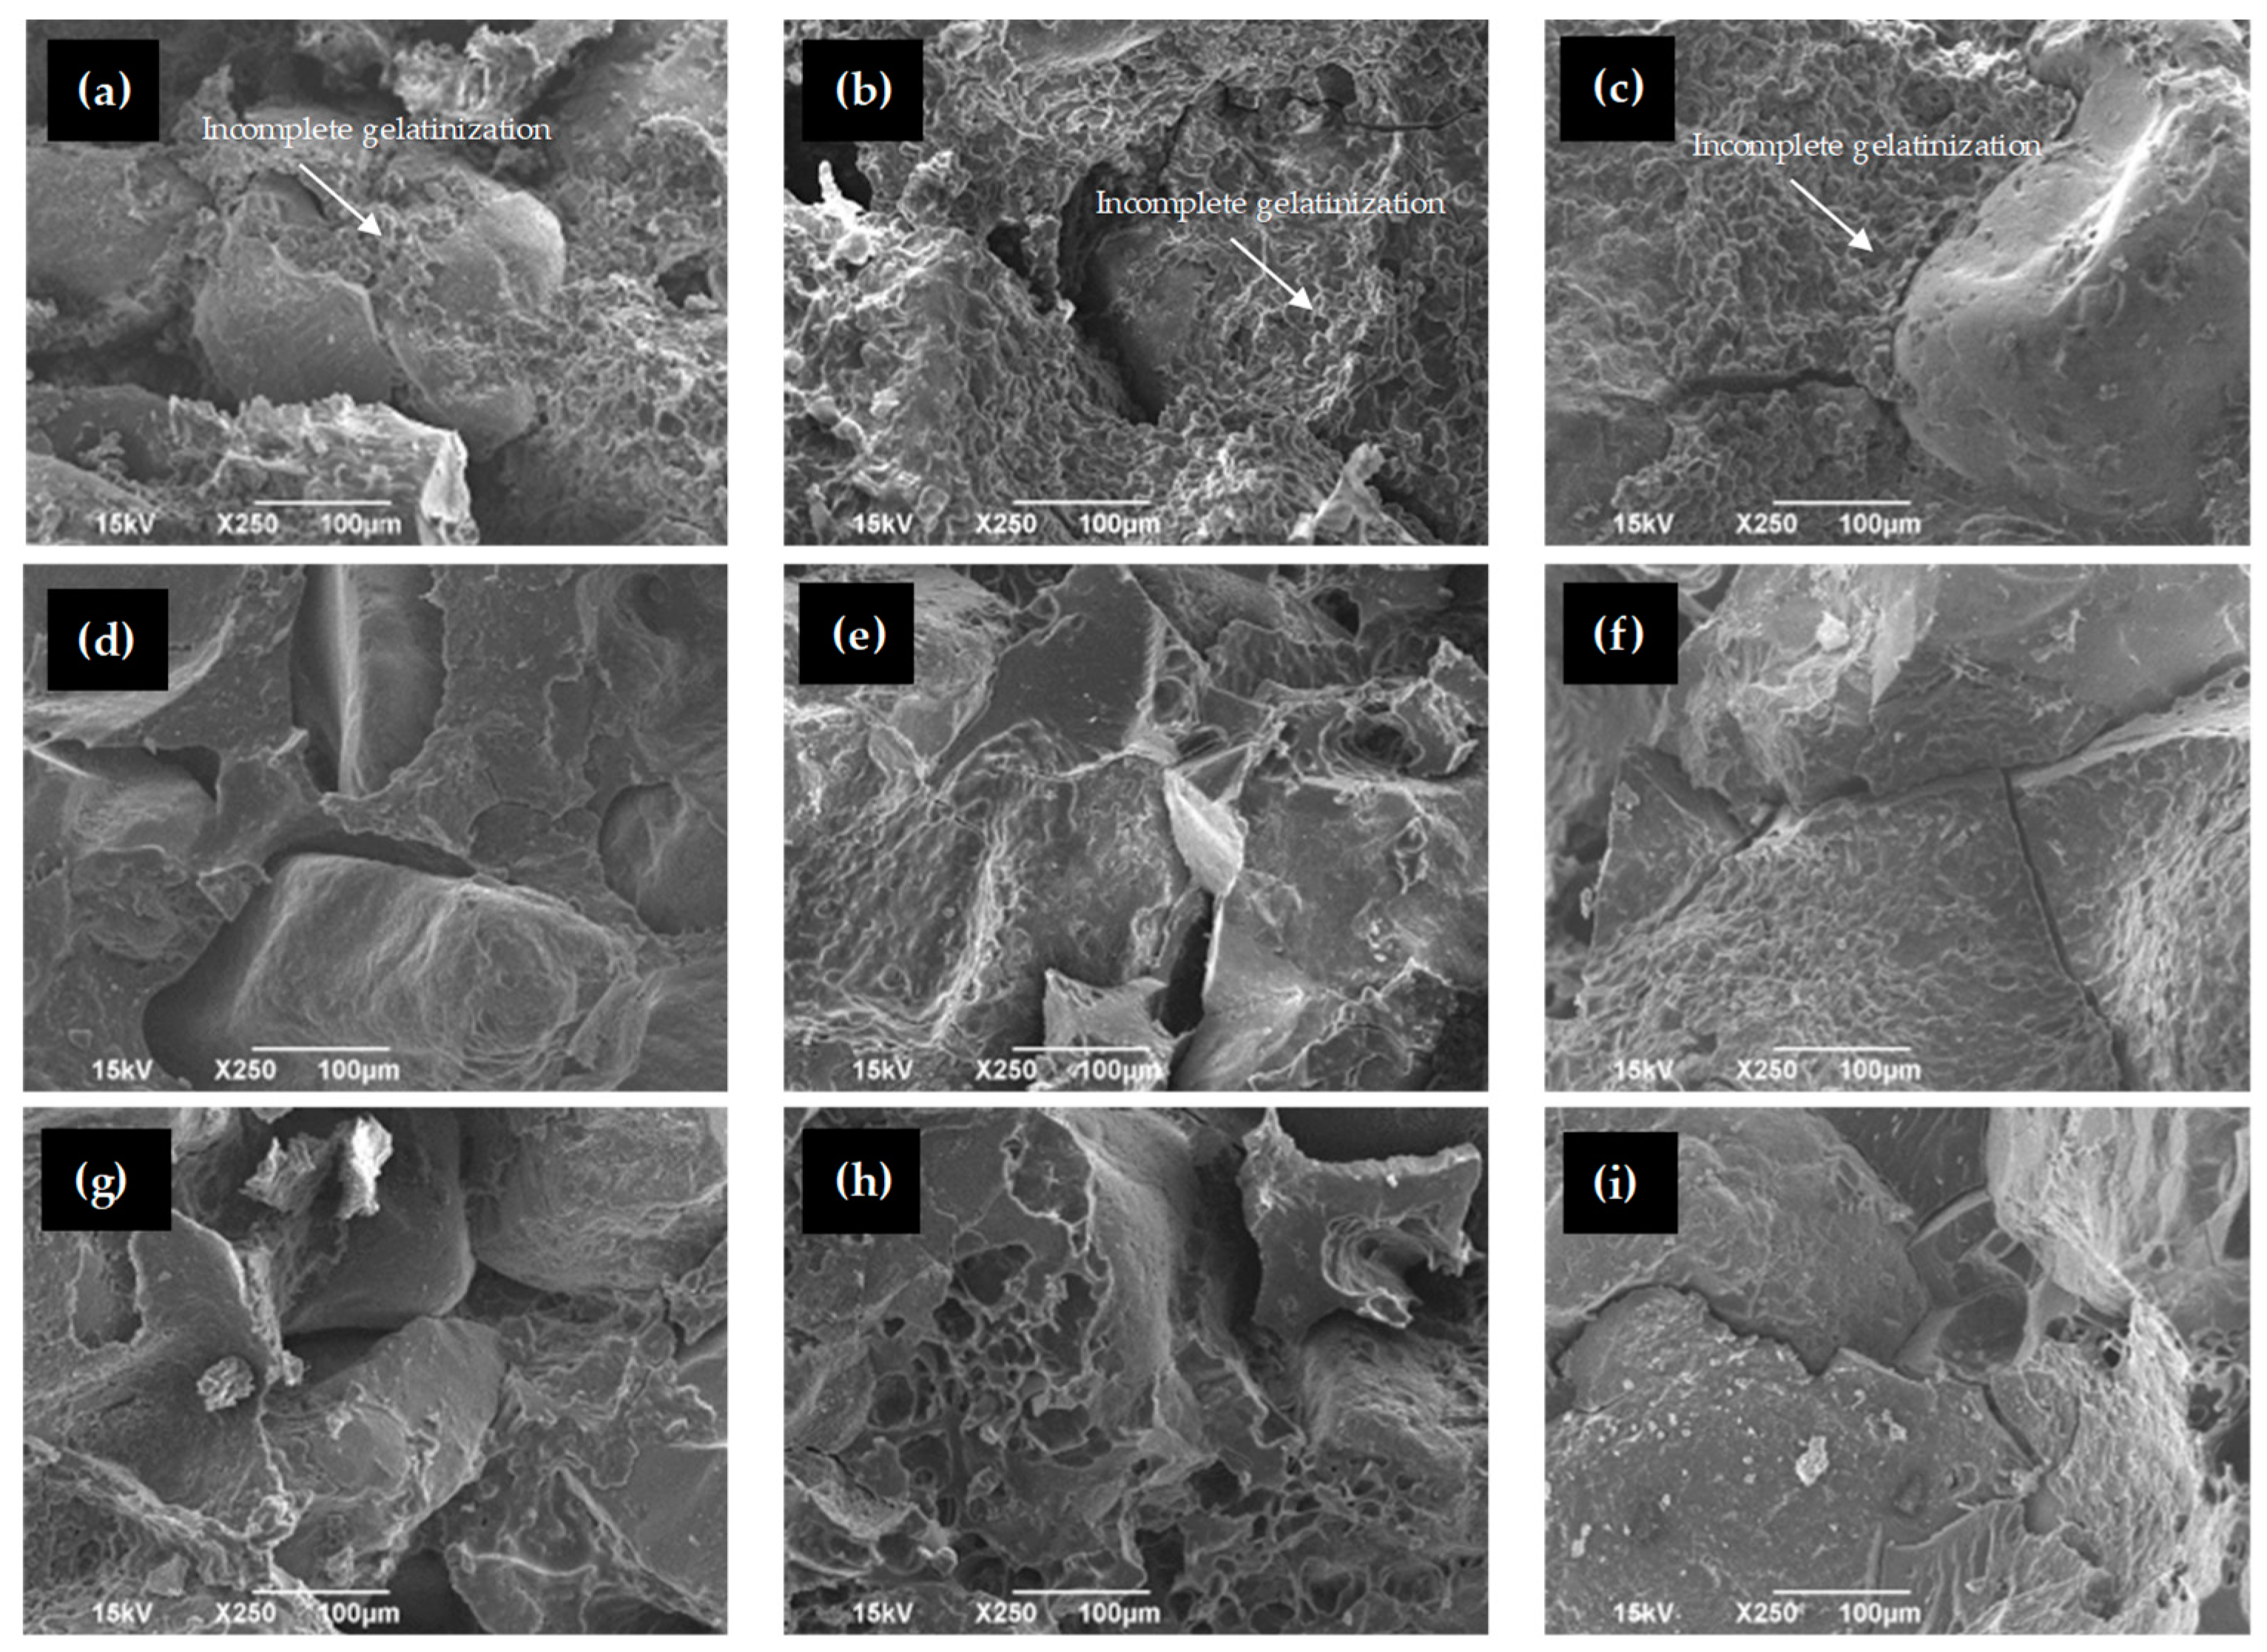
3.3. Microstructural Analysis Using Scanning Electron Microscopy (SEM)

The results from compressive and tensile strengths showed wide variability even though the CoRncrete block looked alike externally. It is vital to analyze the internal structure in order to identify differences that may have contributed to this wide variability in strength. The relation between compressive strength and different sand grain sizes can be explained further by the observations of SEM images. SEM has been commonly used to analyze the internal structure of materials. According to the statistical analysis, sand grain size and curing temperature have a great impact on the strength of CoRncrete. Considering these two factors, a total of nine different samples having different sand grain size and curing temperature were selected for SEM imaging, keeping a constant mixture ratio of starch, water, and sand of 1:1:5 and a constant curing time of 24 h. Figure 9 shows the 2D SEM images of the nine different samples. The images show sand grains having compact morphology surrounded by starch. Samples cured at 80 °C show incomplete gelatinization all over the surface for the three types of sand grains shown in Figure 9a–c. The starch granules swelled up at this temperature but did not burst, which results in incomplete gelatinization. By increasing the temperature, starch granules became fully swollen and burst completely. This converts the starch granules into a thick paste. Figure 9d–i show a thick paste all over the place acting as a binding material. The results also show that solid starch-based materials with an incredibly porous structure were produced when starch, sand, and water were combined. The percentage porosity of the sample can be obtained using microCT analysis.

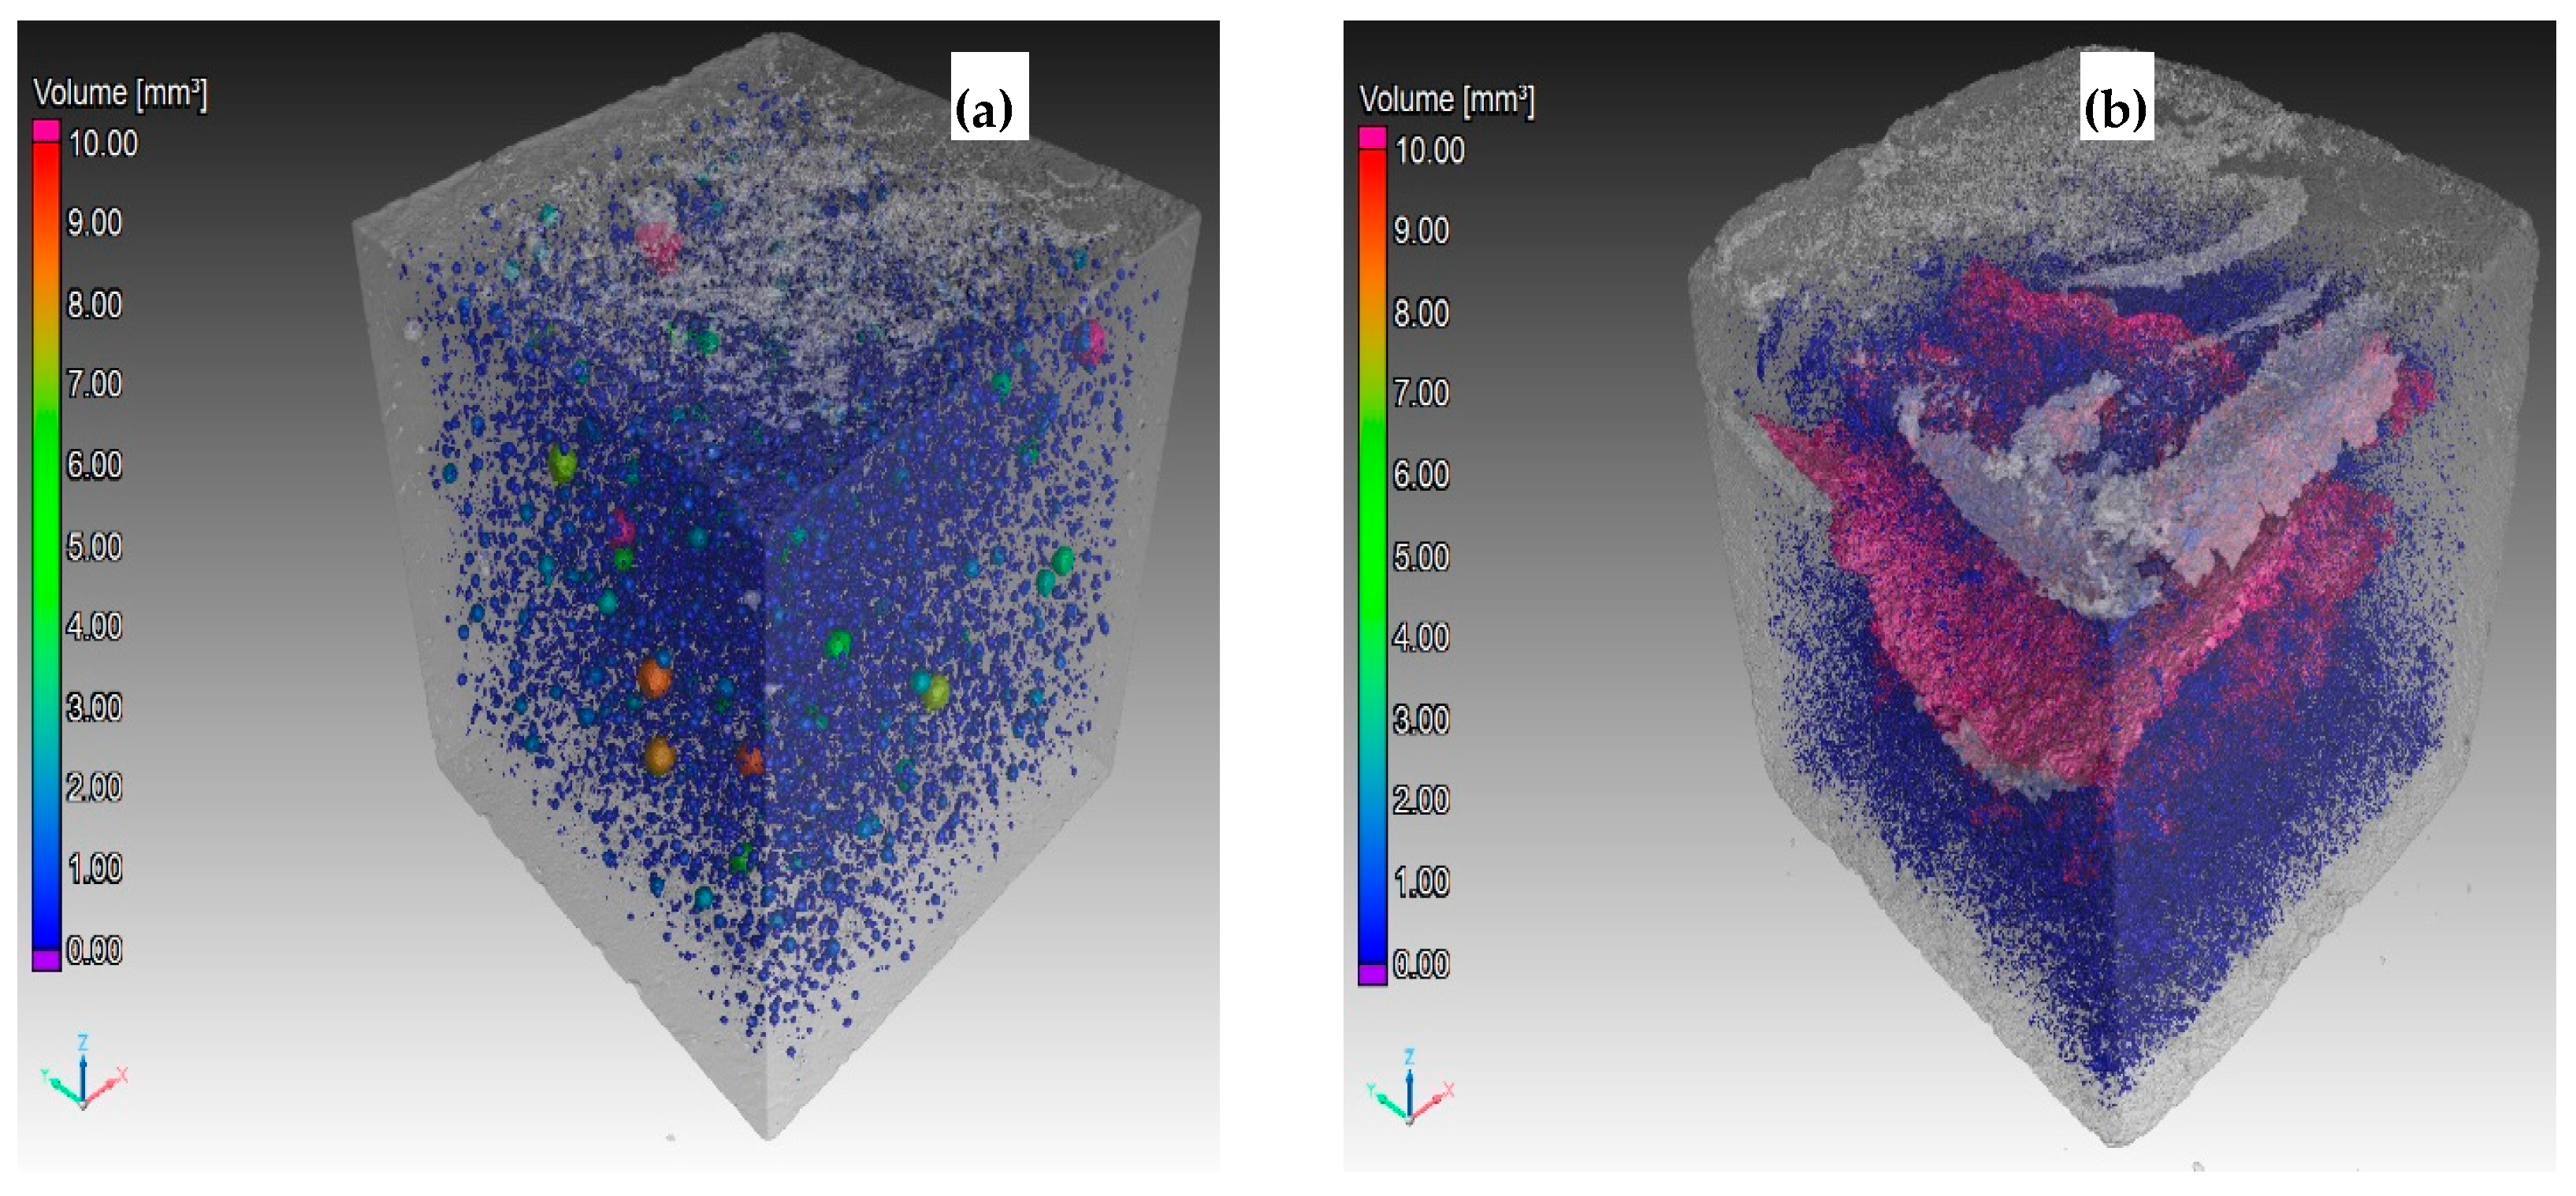
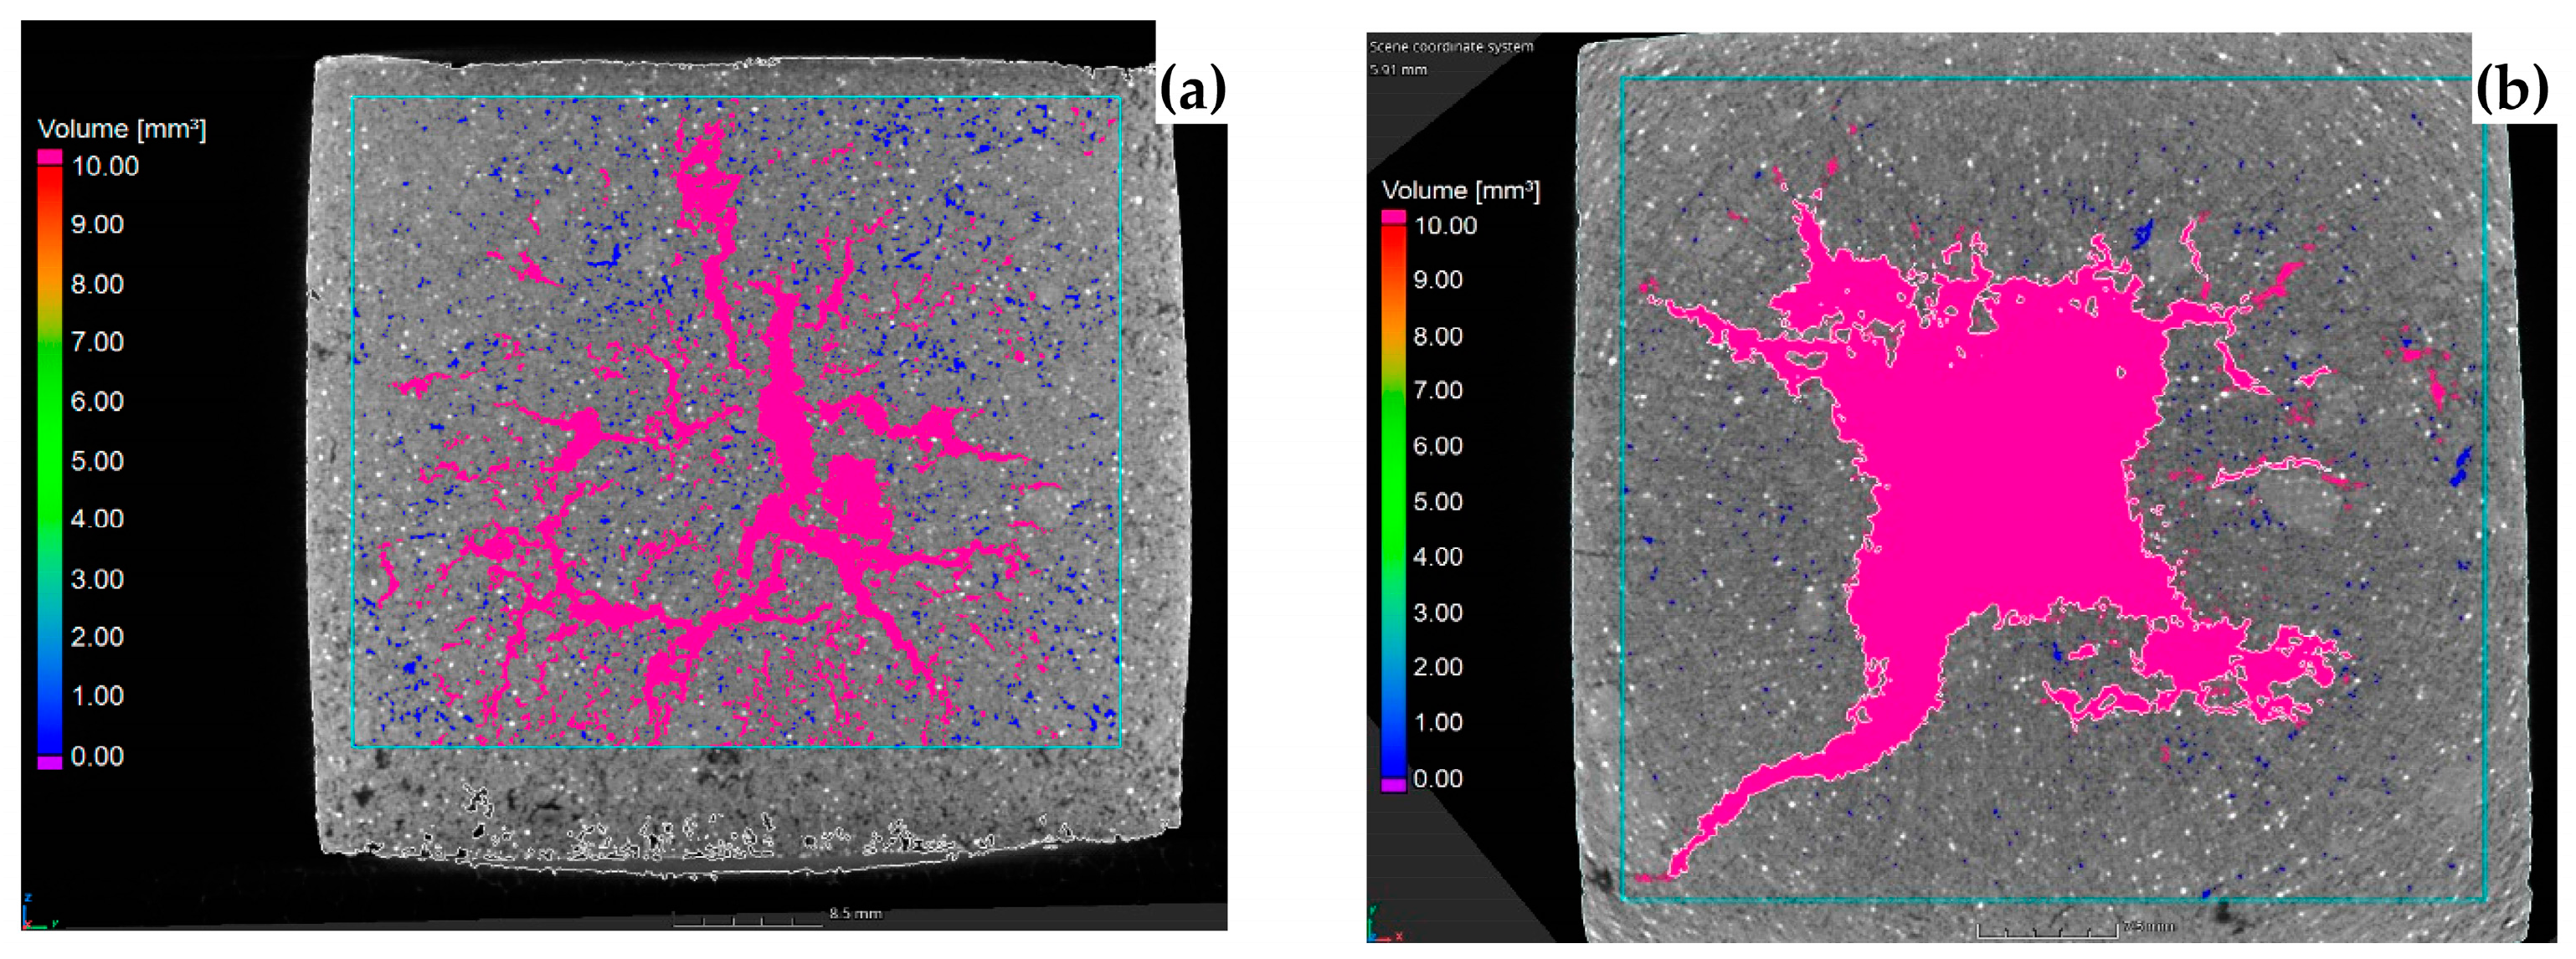
3.4. Internal Structure Analysis Using X-ray Micro-Computed Tomography (microCT)

MicroCT is a technique that allows for the examination of a material’s internal structure without damaging the specimen. It is possible to create a number of cross-sectional photographs of a material, with pixels as small as a few micrometers, which may be used to assess the material’s properties. MicroCT can be used to evaluate the features of pores and solid phases, such as their volume fraction and spatial distribution, and their relationships with physical parameters. X-ray microCT testing was performed for five different compressive strengths (highest, higher, medium, lower, lowest) of CoRncrete and two traditional concrete samples. Porosity/inclusion analysis was performed after scanning using VGStudioMax software (version 2022.4). To account for the irregularity of the sample’s outer surface, an imaginary square on each surface was considered after the microCT scanning and before porosity analysis. Density of the samples was calculated from the weight and volume of each sample.
Table 8 presents the percentage porosity resulting from the use of various sand grains. The data in the table reveal that increasing the size of sand grains in CoRncrete leads to higher porosity in the samples. Furthermore, the density of the samples increases as the size of the sand grains increases, although the porosity increases due to increase in the sand grain size. This is because the weight of the sample having large sand grains is higher compared to the small sand grains, which also consecutively increases the density. Similar findings were observed in traditional concrete. Notably, the porosity of CoRncrete samples is significantly higher than that of traditional concrete samples. However, there is no direct correlation between porosity and compressive strength. Previous studies have discussed how the highly porous structure of CoRncrete negatively impacts its strength and physical properties [19,26]. This porous structure also results in a hydrophilic condition when the hardened sample comes into contact with water. Understanding the percentage of pore space in different samples and the distribution of these pores within the samples is crucial for gaining clearer insights into the internal structure.
The spatial distribution of pore spaces needs to be analyzed for the CoRncrete samples to observe the internal curing pattern and its relationship with the strength and other physical properties. Traditional concrete samples having two different sand grain sizes were also prepared and analyzed to compare them with CoRncrete samples. Figure 10 shows the isometric view of the spatial distribution of pore spaces in the CoRncrete and traditional concrete samples. MicroCT can detect every pore space located inside the sample. Blue color represents lower pore volume and red indicates larger pore volumes. In the traditional concrete, a different volume of pore spaces is distributed all over the samples, whereas in the CoRncrete samples, bigger pore spaces were located mostly in the center core of the sample. Furthermore, the pore spaces of CoRncrete are much bigger than the traditional concrete.
One of the advantages of using X-ray microCT is that it can produce a number of cross-sectional pictures, which helps observation of the internal structure of a sample in three dimensions. Figure 11 shows the crack formed inside the CoRncrete samples. Most of the time, these large cracks and pore spaces were formed at the center of the samples. The volume of these large cracks contains around 70% of the total pore space. Figure 11 illustrates the crack formed in two different planes of a sample. The crack pattern and size can be affected by certain factors, i.e., mixing, compaction method, curing and drying temperature gradients, etc.
Previous studies reported that pore space distribution has a significant impact on the strength and crack pattern on the traditional concrete [32,33,34]. Although porosity is directly correlated with sand grain size, the pore spaces may also have significant impact on strength and physical properties of CoRncrete while using same-grain-sized sand. Cornstarch modification or admixtures can be used during the preparation process to reduce the pore spaces, which may also increase the strength of CoRncrete samples.

4. Conclusions

This study focused on the optimization of the physical and mechanical properties of a cornstarch-based construction material (CoRncrete). Two different experiments were conducted to explore the strength of CoRncrete statistically. This was performed by incorporating varying levels of each factor, with the aim of determining the optimal compressive strength under specific processing conditions. The factors that greatly influenced compressive strength were sand grain size and curing temperature. The maximum compressive strength of 18.9 MPa was achieved while using sand grain size of 0.250–0.425 mm, a mixture ratio of starch, water, and sand of 1:1:5, a curing temperature of 110 °C, and curing time of 24 h. To expedite the retrogradation process and prevent fungal growth on the sample, drying at 100 °C for 24 h was added after the curing procedure, which helped increase the strength of the CoRncrete by causing the gelatinized starch to slowly dry, hence improving the comprehensive strength. Therefore, it is important to study the effect of air-drying, where the drying rate is much slower than the in a conventional oven. Microstructure analysis by SEM and microCT revealed that the porosity of CoRncrete was higher for CoRncrete compared to the traditional concrete, which translated to lower strength. The microCT images also showed a large porous hole at the center of CoRncrete. Porosity increases with increasing the grain size of the sand. Future studies may be focused on reducing the pores by filling the cracks with other polymers, or maybe redesigning the processing steps to minimize these pores, and also explaining the interactions between the polymers and the other materials. In future studies, it is important to conduct a detailed analysis of energy consumption and environmental impact on the optimal condition and compare with traditional concrete. However, the current CoRncrete from this study and other related studies can be used as a lightweight and environmentally friendly option in low-load-bearing indoor structures.

Author Contributions

Conceptualization, N.N., M.Y. and E.M.; methodology, S.T., N.S., N.N. and E.M.; validation, S.T. and E.M.; formal analysis, investigation, S.T., N.N. and E.M.; resources, E.M. and N.N.; data curation, S.T. and N.S.; writing—original draft preparation, S.T.; writing—review and editing, N.S., N.N., M.Y. and E.M.; supervision, N.N. and E.M.; project administration, N.N. and E.M.; funding acquisition, N.N., M.Y. and E.M. All authors have read and agreed to the published version of the manuscript.

Funding

This research was funded by North Dakota Corn Utilization Council, grant number FAR0034024 and USDA-NIFA Hatch #ND01491.

Data Availability Statement

The data will be provided upon request.

Acknowledgments

The authors thank the North Dakota Corn Utilization Council for funding this research study. Additional support comes from North Dakota Agricultural Experiment Station and USDA-NIFA Hatch multistate ND01491. The acknowledgements also extend to NDSU Electron Microscopy Core for performing SEM and microCT scanning and analysis.

Conflicts of Interest

The authors declare no conflict of interest.

References

  1. Flower, D.J.M.; Sanjayan, J.G. Greenhouse gas emissions due to concrete manufacture. Handb. Low Carbon Concr. 2017, 12, 1–16. [Google Scholar] [CrossRef]
  2. Miller, S.A.; Horvath, A.; Monteiro, P.J.M. Readily implementable techniques can cut annual CO2 emissions from the production of concrete by over 20%. Environ. Res. Lett. 2016, 11, 074029. [Google Scholar] [CrossRef]
  3. Gursel, A.P.; Masanet, E.; Horvath, A.; Stadel, A. Life-cycle inventory analysis of concrete production: A critical review. Cem. Concr. Compos. 2014, 51, 38–48. [Google Scholar] [CrossRef]
  4. Statista. Cement Production in the United States from 2010 to 2020. 2020. Available online: https://www.statista.com/statistics/219343/cement-production-worldwide/ (accessed on 15 February 2022).
  5. Mehta, P.; Monteiro, P.J. Concrete: Microstructure, Properties, Materials; McGraw-Hill, T.: New York, NY, USA, 2006. [Google Scholar]
  6. Neville, A.M. Properties of Concrete, 5th ed.; Pearson Education Asia Pte. Ltd.: Singapore, 2011. [Google Scholar]
  7. Rajendran, R.; Sathishkumar, A.; Perumal, K.; Pannirselvam, N.; Lingeshwaran, N.; Madavarapu, S. An experiment on concrete replacing binding material as waste glass powder. Mater. Today Proc. 2021, 47, 5447–5450. [Google Scholar] [CrossRef]
  8. Rashwan, M.A.; Al-Basiony, T.M.; Mashaly, A.O.; Khalil, M.M. Behaviour of fresh and hardened concrete incorporating marble and granite sludge as cement replacement. J. Build. Eng. 2020, 32, 101697. [Google Scholar] [CrossRef]
  9. Hemalatha, T.; Ramaswamy, A. A review on fly ash characteristics—Towards promoting high volume utilization in developing sustainable concrete. J. Clean. Prod. 2017, 147, 546–559. [Google Scholar] [CrossRef]
  10. Fapohunda, C.; Akinbile, B.; Shittu, A. Structure and properties of mortar and concrete with rice husk ash as partial replacement of ordinary portland cement—A review. Int. J. Sustain. Built Environ. 2017, 6, 675–692. [Google Scholar] [CrossRef]
  11. Hassan, A.; Arif, M.; Shariq, M. Use of geopolymer concrete for a cleaner and sustainable environment—A review of mechanical properties and microstructure. J. Clean. Prod. 2019, 223, 704–728. [Google Scholar] [CrossRef]
  12. Müller, P.; Kapin, É.; Fekete, E. Effects of preparation methods on the structure and mechanical properties of wet conditioned starch/montmorillonite nanocomposite films. Carbohydr. Polym. 2014, 113, 569–576. [Google Scholar] [CrossRef]
  13. Afroz, S.; Manzur, T.; Borno, I.B.; Hasanuzzaman, M.; Hossain, K.M.A. Potential of Starch as Organic Admixture in Cementitious Composites. J. Mater. Civ. Eng. 2021, 33, 1–10. [Google Scholar] [CrossRef]
  14. ONI, D.O.; Mwero, J.; Kabubo, C. Experimental investigation of the physical and mechanical properties of cassava starch modified concrete. Open Constr. Build. Technol. J. 2019, 13, 331–343. [Google Scholar] [CrossRef]
  15. Abd, S.M.; Hamood, Q.Y.; Khamees, A.S.; Ali, Z.H. Effect of using corn starch as concrete admixture. Int. J. Engg. Res. Sci. Tech. 2016, 5, 35–44. [Google Scholar]
  16. Liu, H.; Guan, Y.; Wei, D.; Gao, C.; Yang, H.; Yang, L. Reinforcement of injectable calcium phosphate cement by gelatinized starches. J. Biomed. Mater. Res. Part B Appl. Biomater. 2016, 104, 615–625. [Google Scholar] [CrossRef]
  17. Akindahunsi, A.A.; Uzoegbo, H.C.; Iyuke, S.E. Use of starch modified concrete as a repair material. In Concrete Repair, Rehabilitation and Retrofitting III; CRC Press: Boca Raton, FL, USA, 2012; pp. 361–362. [Google Scholar]
  18. Kulshreshtha, Y.; Schlangen, E.; Jonkers, H.M.; Vardon, P.J.; van Paassen, L.A. CoRncrete: A corn starch based building material. Constr. Build. Mater. 2017, 154, 411–423. [Google Scholar] [CrossRef]
  19. Mansour, G.; Zoumaki, M.; Tsongas, K.; Tzetzis, D. Starch-sandstone materials in the construction industry. Results Eng. 2020, 8, 100182. [Google Scholar] [CrossRef]
  20. ASTM, C 109; Standard Test Method for Compressive Strength of Hydraulic Cement Mortars (Using 2-in. or [50-mm] Cube Specimens). ASTM International: West Conshohocken, PA, USA, 2020.
  21. ASTM D 3967-08; Standard Test Method for Splitting Tensile Strength of Intact Rock Core Specimens. ASTM International: West Conshohocken, PA, USA, 2008.
  22. Liu, H.; Yu, L.; Xie, F.; Chen, L. Gelatinization of cornstarch with different amylose/amylopectin content. Carbohydr. Polym. 2006, 65, 357–363. [Google Scholar] [CrossRef]
  23. Bertrand, R.; Holmes, W.; Orgeron, C.; McIntyre, C.; Hernandez, R.; Revellame, E.D. Rapid estimation of parameters for gelatinization of waxy corn starch. Foods 2019, 8, 556. [Google Scholar] [CrossRef]
  24. Coral, D.F.; Pineda-Gómez, P.; Rosales-Rivera, A.; Rodriguez-Garcia, M.E. Determination of the gelatinization temperature of starch presented in maize flours. J. Phys. Conf. Ser. 2009, 167, 012057. [Google Scholar] [CrossRef]
  25. Mansour, G.; Zoumaki, M.; Tzetzis, D. Starch sandstones in building bio-materials. MATEC Web Conf. 2020, 318, 01046. [Google Scholar] [CrossRef]
  26. Zoumaki, M.; Tsongas, K.; Tzetzis, D.; Mansour, G. Corn starch-based sandstone sustainable materials: Sand type and water content effect on their structure and mechanical properties. Sustainability 2022, 14, 8901. [Google Scholar] [CrossRef]
  27. da Silva, A.; Dionísio, A.; Coelho, L. Flexible-lean processes optimization: A case study in stone sector. Results Eng. 2020, 6, 100129. [Google Scholar] [CrossRef]
  28. Li, D.; Wong, L.N.Y. The brazilian disc test for rock mechanics applications: Review and new insights. Rock Mech. Rock Eng. 2013, 46, 269–287. [Google Scholar] [CrossRef]
  29. Newman, J.; Choo, B.S. Strength-testing machines for concrete. In Advanced Concrete Technology; Elsevier: Oxford, UK, 2003; pp. 1–9. [Google Scholar]
  30. Sari, M. Investigating relationships between engineering properties of various rock types. Glob. J. Earth Sci. Eng. 2018, 5, 1–25. [Google Scholar] [CrossRef]
  31. Yang, B.; He, M.; Deng, B.; Zhang, Z. Correlation between the tensile to compressive strength ratio and mechanical parameters of rock based on a nonlinear M-C criterion. Arab J Geosci. 2022, 15, 982. [Google Scholar] [CrossRef]
  32. Plessis, A.D.; Olawuyi, B.J.; Boshoff, W.P.; le Roux, S.G. Simple and fast porosity analysis of concrete using X-ray computed tomography. Mater. Struct. 2016, 49, 553–562. [Google Scholar] [CrossRef]
  33. Huang, Y.; Yang, Z.; Ren, W.; Liu, G.; Zhang, C. 3D meso-scale fracture modelling and validation of concrete based on in-situ X-ray Computed Tomography images using damage plasticity model. Int. J. Solids Struct. 2015, 67–68, 340–352. [Google Scholar] [CrossRef]
  34. Huang, Y.; Yan, D.; Yang, Z.; Liu, G. 2D and 3D homogenization and fracture analysis of concrete based on in-situ X-ray Computed Tomography images and Monte Carlo simulations. Eng. Fract. Mech. 2016, 63, 37–54. [Google Scholar] [CrossRef]
Figure 1. Preparation of cubic-shaped hardened CoRncrete for compressive strength testing. (a) Fresh CoRncrete with silicone rubber mold, (b) tampering with rubber rod, (c) samples after tampering, (d) silicon rubber mold with lid, (e) mold placed between two plates with tightening screw to avoid moisture loss during curing, (f) curing in the convection oven, and (g) drying in the convection oven.
Constrmater 03 00021 g001
Figure 2. Sample preparation for tensile strength measurement. (a) Silicon rubber mold for casting, (b) samples in the mold after tamping and screeding, (c) mold placed between two plates with screws, and (d) hardened samples after curing and drying.
Constrmater 03 00021 g002
Figure 3. Mechanical strength measurement on the universal testing machine: (a) compressive strength, (b) tensile strength.
Constrmater 03 00021 g003
Figure 4. Compressive strengths (MPa) while using different mixture ratios (starch:water:sand) (red line indicates median and black cross indicates mean values).
Constrmater 03 00021 g004
Figure 5. Compressive strengths (MPa) using different sand grain sizes (mm) (Red line indicates median and black cross indicates mean values).
Constrmater 03 00021 g005
Figure 6. Compressive strengths (MPa) using different curing temperatures (°C) (red line indicates median and black cross indicates mean values).
Constrmater 03 00021 g006
Figure 7. Compressive strengths (MPa) using different curing times (h) (red line indicates median and black cross indicates mean values).
Constrmater 03 00021 g007
Figure 8. The outer surface of the CoRncrete samples 7 days in a closed bag after curing (a) without drying, and (b) with drying.
Constrmater 03 00021 g008
Figure 9. Scanning Electron Microscopy (SEM) images for different sand grain sizes and curing temperatures: (a) 0.106–0.25 mm at 80 °C, (b) 0.25–0.425 mm at 80 °C, (c) 0.425–0.85 mm at 80 °C, (d) 0.106–0.25 mm at 95 °C, (e) 0.25–0.425 mm at 95 °C, (f) 0.425–0.85 mm at 95 °C, (g) 0.106–0.25 mm at 110 °C, (h) 0.25–0.425 mm at 110 °C, (i) 0.4.25–0.85 mm at 110 °C.
Constrmater 03 00021 g009
Figure 10. Isometric view of (a) traditional concrete and (b) CoRncrete, showing the inside spatial distribution of pore spaces.
Constrmater 03 00021 g010
Figure 11. Two-dimensional analysis of slices showing cracks formed inside of the CoRncrete samples: (a) y–z axis (b) x–y axis.
Constrmater 03 00021 g011
Table 1. First experimental design with factors and levels.
FactorsLevelsLevel Names
Sand grain size20.106–0.250 (mm)
0.250–0.425 (mm)
Mixture ratio (starch: water: sand)41:1:5
1:0.9:5
1:1.1:5
1.1:1.1:5
Curing Temperature (convection oven)3100 °C
105 °C
110 °C
Curing time224 h
48 h
Table 2. Second experimental design with factors and levels.
FactorsLevelsLevel Names
Sand grain size30.106–0.250 (mm)
0.250–0.425 (mm)
0.425–0.850 (mm)
Curing Temperature380 °C
95 °C
110 °C
Curing time38 h
12 h
24 h
Table 3. ANOVA on the effect of sand grain size, mixture ratio, and curing temperature and time on compressive strength.
Source of VariationDegree of FreedomSum of SquaresMean of SquareF-Valuep-Value
Sand grain size1240.3 (39.4%)240.25032.790.000
Mixture ratio37.42.4570.340.800
Curing temperature256.8 (9.3%)28.4083.880.029
Curing time112.212.2231.670.204
Error40293.1 (48.1%)7.327--
Total47609.7---
Table 4. Grouping information using the Tukey method and 95% confidence for first DOE.
FactorsLevelsNMeanGrouping *
Sand grain size (mm)0.250–0.4252411.88A
0.106–0.250247.41B
Mixture ratio (starch:water:sand)1:1:51210.24A
1:1.1:5129.75A
1:0.9:5129.36A
1.1:1.1:5129.23A
Curing temperature (°C)1101610.54A
1051610.28A
100168.11B
Curing time (h)24249.14A
482410.15A
* Means of each factor that do not share a letter are significantly different.
Table 5. ANOVA for the reduced model showing effect of sand grain size, curing temperature, and curing time on compressive strength.
Source of VariationDegree of FreedomSum of SquaresMean of SquareF-Valuep-Value
Sand grain size2143.9 (40.3%)71.922.070.000
Curing temperature2128.3 (35.9%)64.219.680.000
Curing time220.2 (5.7%)10.13.090.068
Error2065.2 (18.2%)2.1--
Total26357.5---
Table 6. Mean comparison using the Tukey method and 95% confidence for the reduced model.
FactorsLevelsNMeanGrouping *
Sand grain size (mm)0.250–0.42599.45A
0.425–0.85097.205A
0.106–0.25093.835B
Temperature (°C)11099.90A
9595.559B
8095.035B
Curing time (h)2497.94A
1696.72A
895.833A
* Means of each factor that do not share a letter are significantly different.
Table 7. Ratio of tensile and compressive strength for the different runs of CoRncrete.
Sand Grain Size (mm)Mixture Ratio (Starch:Water:Sand)Curing Temperature (°C)Curing Time (h)Compressive Strength (MPa)Tensile Strength (MPa)Ratio (Tensile/
Compressive)
0.106–0.2501.1:1.1:5110489.331.880.201
1:1:58082.530.380.152
1:1:595242.680.520.193
1:1:5110248.4751.810.214
0.250–0.4251:1:51102418.900.850.045
1.1:1.1:51102415.310.860.056
1.1:1.1:5100249.320.450.049
1:1:51101613.020.650.050
1:1:595246.600.390.060
1:1:5100249.490.660.070
0.425–0.8501:1:59586.370.340.054
1:1:51102411.3380.530.046
Table 8. Percentage porosity of different CoRncrete and traditional concrete samples obtained from X-ray microCT analysis.
-Compressive
Strength (MPa)
Sand Grain Size (mm)Curing
Temperature/Media
Curing TimeDensity (kg/m3)% Porosity
CoRncrete11.340.425–0.850110 °C24 h159232.5
18.900.250–0.425110 °C24 h156226.9
8.130.106–0.250110 °C24 h14379.6
5.190.106–0.250100 °C24 h13226.5
1.860.106–0.250100 °C48 h139211.0
Traditional concrete42.900.425–0.850water7 days20262.1
42.880.250–0.425water7 days19821.7
Disclaimer/Publisher’s Note: The statements, opinions and data contained in all publications are solely those of the individual author(s) and contributor(s) and not of MDPI and/or the editor(s). MDPI and/or the editor(s) disclaim responsibility for any injury to people or property resulting from any ideas, methods, instructions or products referred to in the content.

