Article

The Effect of Biochar on the Properties of Alkali-Activated Slag Pastes

Department of Civil, Architectural and Environmental Engineering, University of Miami, Coral Gables, FL 33146, USA
*
Author to whom correspondence should be addressed.
Constr. Mater. 2022, 2(1), 1-14; https://doi.org/10.3390/constrmater2010001
Submission received: 22 November 2021 / Revised: 7 December 2021 / Accepted: 11 December 2021 / Published: 23 December 2021
(This article belongs to the Special Issue The Applications of Alkali-Activated Materials in Construction)

Abstract

:
This paper examines the influence of biochar on the properties of alkali-activated slag pastes using two activator solutions, namely NaOH and Na2CO3. The biochar demonstrated different absorption kinetics in the mixture of slag and the two activator solutions. The pastes with biochar showed a delay in the heat flow peak, compared to the pastes without biochar, but the cumulative heat release in these pastes at later hours was increased, compared to the pastes without biochar. It was found that the use of biochar reduced autogenous shrinkage in the pastes and the reduction in autogenous shrinkage was more pronounced in the alkali-activated slag with NaOH, compared to Na2CO3. The void structure of the pastes was investigated using x-ray micro-computed tomography. It was found that refined pore structure due to reduced effective solution/slag in the pastes with biochar was able to compensate for the decreasing effect of biochar voids on compressive strength. The electrical resistivity was shown to be lower in the pastes with biochar.

1. Introduction

Binders based on alkali-activated slag materials are attracting increasing attention as being environmentally friendly, compared to Portland cement binders [1,2]. It is estimated that the production of alkali-activated slag binders encompasses 25–50% less carbon dioxide emissions and 40% less embodied energy, compared to the Portland cement binders [3]. Slag is a by-product of the iron ore smelting process and when mixed with alkaline activators, it results in binders with an increased strength [4] and improved resistance to fire and chemical attacks [5,6]. In spite of the beneficial features of alkali-activated slag binders, there exist concerns related to the high autogenous shrinkage of these binders, which can result in increased tendency of the binder to cracking [7,8,9]. In addition, alkali-activated slag binders have been shown in previous investigations to exhibit higher drying shrinkage than Portland cement binders [7,10,11,12,13,14,15].
Several investigations have been focused on mitigating the autogenous shrinkage in alkali-activated slag materials [9,10,16,17,18]. Internal curing has emerged as a proven method to reduce autogenous shrinkage in Portland cement binders as well as alkali-activated slag binders. In this method, water is gradually released to the interior of the material to maintain high relative humidity to prevent self-desiccation during the hydration process [17,18,19,20,21,22,23,24,25,26,27]. Saturated lightweight aggregates [9] and superabsorbent polymers (SAP) [1,18,19] as internal curing agents have been shown to reduce autogenous shrinkage in alkali-activated slag binders. It has been reported that the use of SAP was able to reduce autogenous shrinkage in alkali-activated fly ash-slag systems [1].
Biochar is derived by the pyrolysis of waste biomass under optimized conditions [28]. Due to its complex porous microstructure, biochar is able to absorb water; as such, it has been studied as an internal curing agent in Portland cement binders [28,29]. Research has shown that water released from biochar leads to enhanced strength by 12%, compared to the control paste at 28 days of age [30]. It has also been reported that biochar prepared using optimum conditions can have the filler effect and result in improved hydration in Portland cement binders due to the nucleation effect of fine biochar particles [31]. It has also been suggested that the use of biochar in construction materials could be a viable means of reducing waste and sequestering carbon in the built environment [28]. It has been estimated that biochar has the potential to lower up to 870 kg of carbon dioxide-equivalent of greenhouse gases per ton of biomass [32].
However, use of biochar for internal curing of alkali-activated slag binders has not been studied in the literature and currently there is a lack of understanding of the effect of biochar on the properties of alkali-activated slag binders. Thus, in order to address this research gap, this paper is aimed at investigating the influence of biochar on autogenous shrinkage, hydration, setting time, compressive strength, electrical resistivity, and microstructure of alkali-activated slag binders.

2. Materials and Methods

2.1. Materials

The biochar used in this study was purchased from a commercial vendor. The chemical characteristics and morphology of the biochar were investigated using scanning electron microscopy equipped with energy dispersive spectroscopy (SEM EDS) and Fourier transform infrared spectroscopy (FTIR). The biochar was first dried in an oven, then sieved to obtain a particle size distribution between 75 and 425 μm, and stored in a double layer plastic bag until use in the experiments. The chemical composition of the ground granulated blast furnace slag studied in this investigation is shown in Table 1. To activate slag, two solutions of NaOH and Na2CO3 were used.

Paste Mix Design

The mix designs and the designations of the alkali-activated slag pastes with and without biochar are shown in Table 2. The concentration of the NaOH and Na2CO3 solutions was 1.78 M and 1.85 M, respectively. The water/slag for the pastes with NaOH and Na2CO3 solutions was chosen to be 0.44 and 0.68, respectively. The rationale for selecting these ratios was to obtain workable mixtures with similar flowability. The flow values of the paste activated with the NaOH and Na2CO3 solutions were measured in this study to be about 25 cm using the flow test. The flow test method is detailed in our previous study [18]. The concentration of biochar used in the pastes was determined so that the amount of water absorbed in the pastes with NaOH and Na2CO3 solutions was similar. To this end, the absorption results from the modified teabag test were used. The average absorption value of the biochar in the first 10 min was calculated and used in determining the amount of biochar needed to absorb solution in the amount of solution/slag = 0.05. This means that the amount of solution taken up by biochar is equal in both NO-B and NC-B. A ZYLA water reducing admixture at a concentration of 0.17% per slag mass was added to all mixtures.
For the pastes with biochar, the dry biochar and slag were placed in a 5-gallon bucket and mixed for 3 min. Then, the activator solution was added and mixed with a mixer at a slow speed (440 RPM) for 30 s. The mixing was stopped for 15 s to allow time to scrape the interior wall of the mixing bucket. Immediately after that, the mixing was continued at a high speed (1600 RPM) for 60 s. The pastes were poured into 50 mm cubic molds and compacted on a vibrating table. The molds were covered with a plastic foil to prevent moisture loss at the room temperature of 23 °C. After 24 h, the paste cubes were removed from the molds and stored in double layer plastic bags at room temperature until testing.

2.2. Methods

2.2.1. Absorption Test

Obtaining an accurate determination of absorption of internal curing agents in alkali-activated slag binders is important for appropriate formulation of the material. A widely used method to measure the absorption of internal curing agents is the teabag test [20,25,33,34]. There are shortcomings associated with this method, namely, solution adsorption to the surface of internal curing agents and solution entrapment in interstitial space between internal curing agent particles. Additionally, since the teabag test is performed in a solution medium, the potential effect of the hydrating binder particles on the absorption of the internal curing agents is neglected. Thus, in this paper a modified teabag test was conducted to account for the interactions between the hydrating slag particles and biochar. This permits absorption measurement to be conducted in a more realistic condition. First, 2 g of biochar and 10 g of slag were dry mixed for 5 min and poured into the teabags. The teabags were submerged in separate beakers containing the activator solutions and the solutions were sealed using a Parafilm foil. The teabags were taken out of the solution at different times to measure their mass using a balance with a 0.001 g resolution. The surface of the teabags was gently dried to prevent inclusion of surface adsorbed solution in the mass measurement. To account for the amount of solution absorbed by dry slag and teabag, the test was also conducted with teabag containing slag without biochar. The biochar absorption was estimated using the following equation:
Absorption = m w m p m d m d  
where m d , m p , and m w are the mass of dry biochar, teabag with slag only, and teabag with biochar and slag, respectively. Teabag tests were also conducted to measure the absorption of biochar only in the activator solutions. The absorption tests were conducted in triplicate and the average is reported.

2.2.2. Setting Time Test

The initial and final setting times of the pastes with and without biochar were determined by the Vicat method. The penetration depth of the Vicat needle was measured every 15 min until final setting time. The measurements were performed at five separate locations on the sample and the average is reported.

2.2.3. Autogenous Shrinkage Test

The autogenous shrinkage of the pastes with and without biochar was measured according to ASTM C1698-16. Pastes with and without biochar were poured into corrugated polyethylene tubes with a diameter of 2.9 cm and a length of 42 cm. A DC linear variable differential transformer (Germann Instruments, Inc., Evanston, IL, USA) was employed to monitor the variation in the length of the tubes. The length measurement was initiated at a time approximately corresponding to the final setting time of the pastes. The test was performed in duplicate and the average is reported.

2.2.4. Isothermal Calorimetry Test

The heat flow and the cumulative heat of the reaction in the pastes with and without biochar were measured using isothermal calorimetry. In this test, approximately 6 g of the pastes was placed into glass ampoules and compacted using a tamper. Then, the ampoules were loaded into a TA Instrument isothermal calorimeter preconditioned at room temperature. Tests were conducted for 72 h in duplicate and the average is reported.

2.2.5. Thermogravimetric Analysis (TGA)

TGA analysis was conducted on the paste at the age of 24 days to investigate the influence of the biochar on the chemical characteristics of the pastes. In this test, small pieces obtained from the interior of the cubes broken in the compressive strength test were used for sample preparation. The small pieces were first submerged into acetone for 24 h, then ground into powder, and passed through sieve # 60. Approximately 35 mg of the powder was loaded into a Netzsch TG (Netzsch-Gerätebau GmbH, Selb, Germany) and heated up to 1000 °C with a temperature ramp of 20 °C per minute.

2.2.6. X-ray Micro-Computed Tomography (Micro-CT) Analysis

The internal void structure of the pastes with and without biochar was investigated using micro-CT. To this end, small disks sawed from the specimens used in the autogenous shrinkage test were used. The disks were 21 mm in diameter and 25 mm in length. Two samples per each mix design were used in the micro-CT analysis and the average is reported. A Skyscan 1273 from Bruker (Bruker, Kontich, Belgium) was employed to scan the disks. The scanning parameters were as follows: resolution = 15 μm/pixel, X-ray exposure time = 2070 ms, rotational step = 0.3°, current = 120 μA, and voltage = 125 kV. The quantitative reconstruction of the scanned volume was conducted using CTAnalyzer 1.20.8. A cylindrical core with a 10 mm diameter and a 10 mm height was considered in the analysis. Due to the imaging resolution, only voids larger than 30 μm were included in the void structure analysis. The samples used in the micro-CT imaging corresponded to the age of 20–24 weeks. It should be noted that the focus here is to examine the voids larger than 30 μm, which are attributed to biochar voids or air voids, which are not expected to significantly alter between 20 and 24 weeks.

2.2.7. Compressive Strength Test

The compressive strength of the paste cubes with and without biochar at the age of 7 and 24 days was measured using the SATEC testing machine. Three cubes were used for each mix design and the average is reported.

2.2.8. Electrical Resistivity Test

The electrical resistivity of the paste cubes at the age of 3, 7, and 24 days was determined using Electrochemical Impedance Spectroscopy (EIS) [35,36]. The EIS measurement was conducted using a Gamry Reference 600 potentiostat/galvanostat (Gamry, Warminster, PA, USA). The signal frequency range and amplitude used in this test were 106–10 Hz and 250 mV, respectively. The electrical resistivity of the cubes was obtained using the following equation:
ρ = (h)(a)/(b)
where b, a, and h, are the thickness, side surface area, and measured resistance of the cubes, respectively.

3. Results

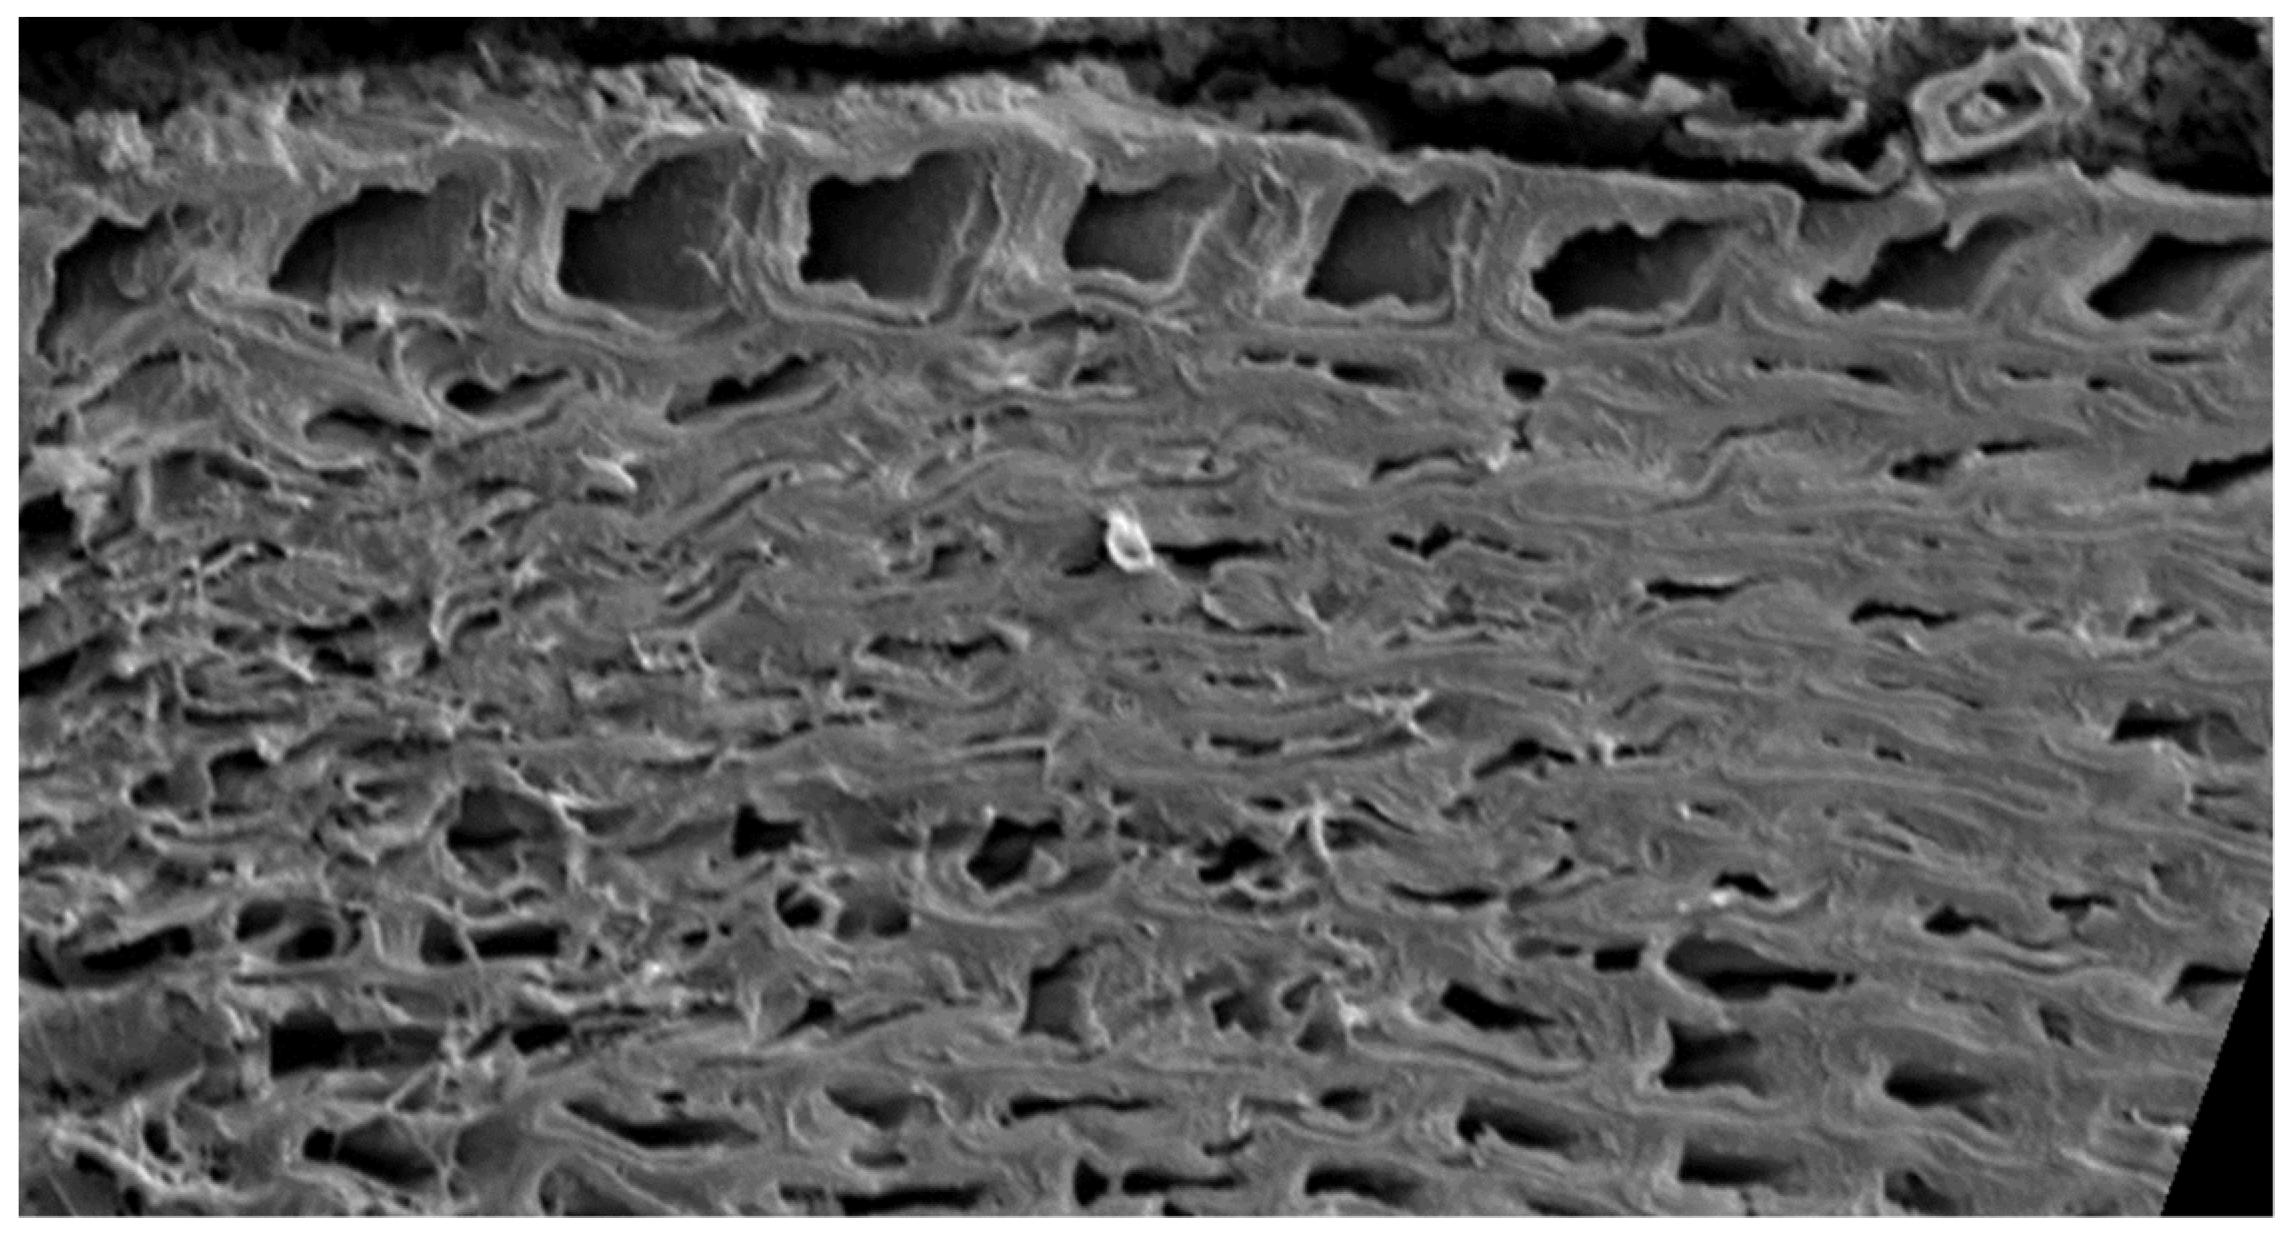
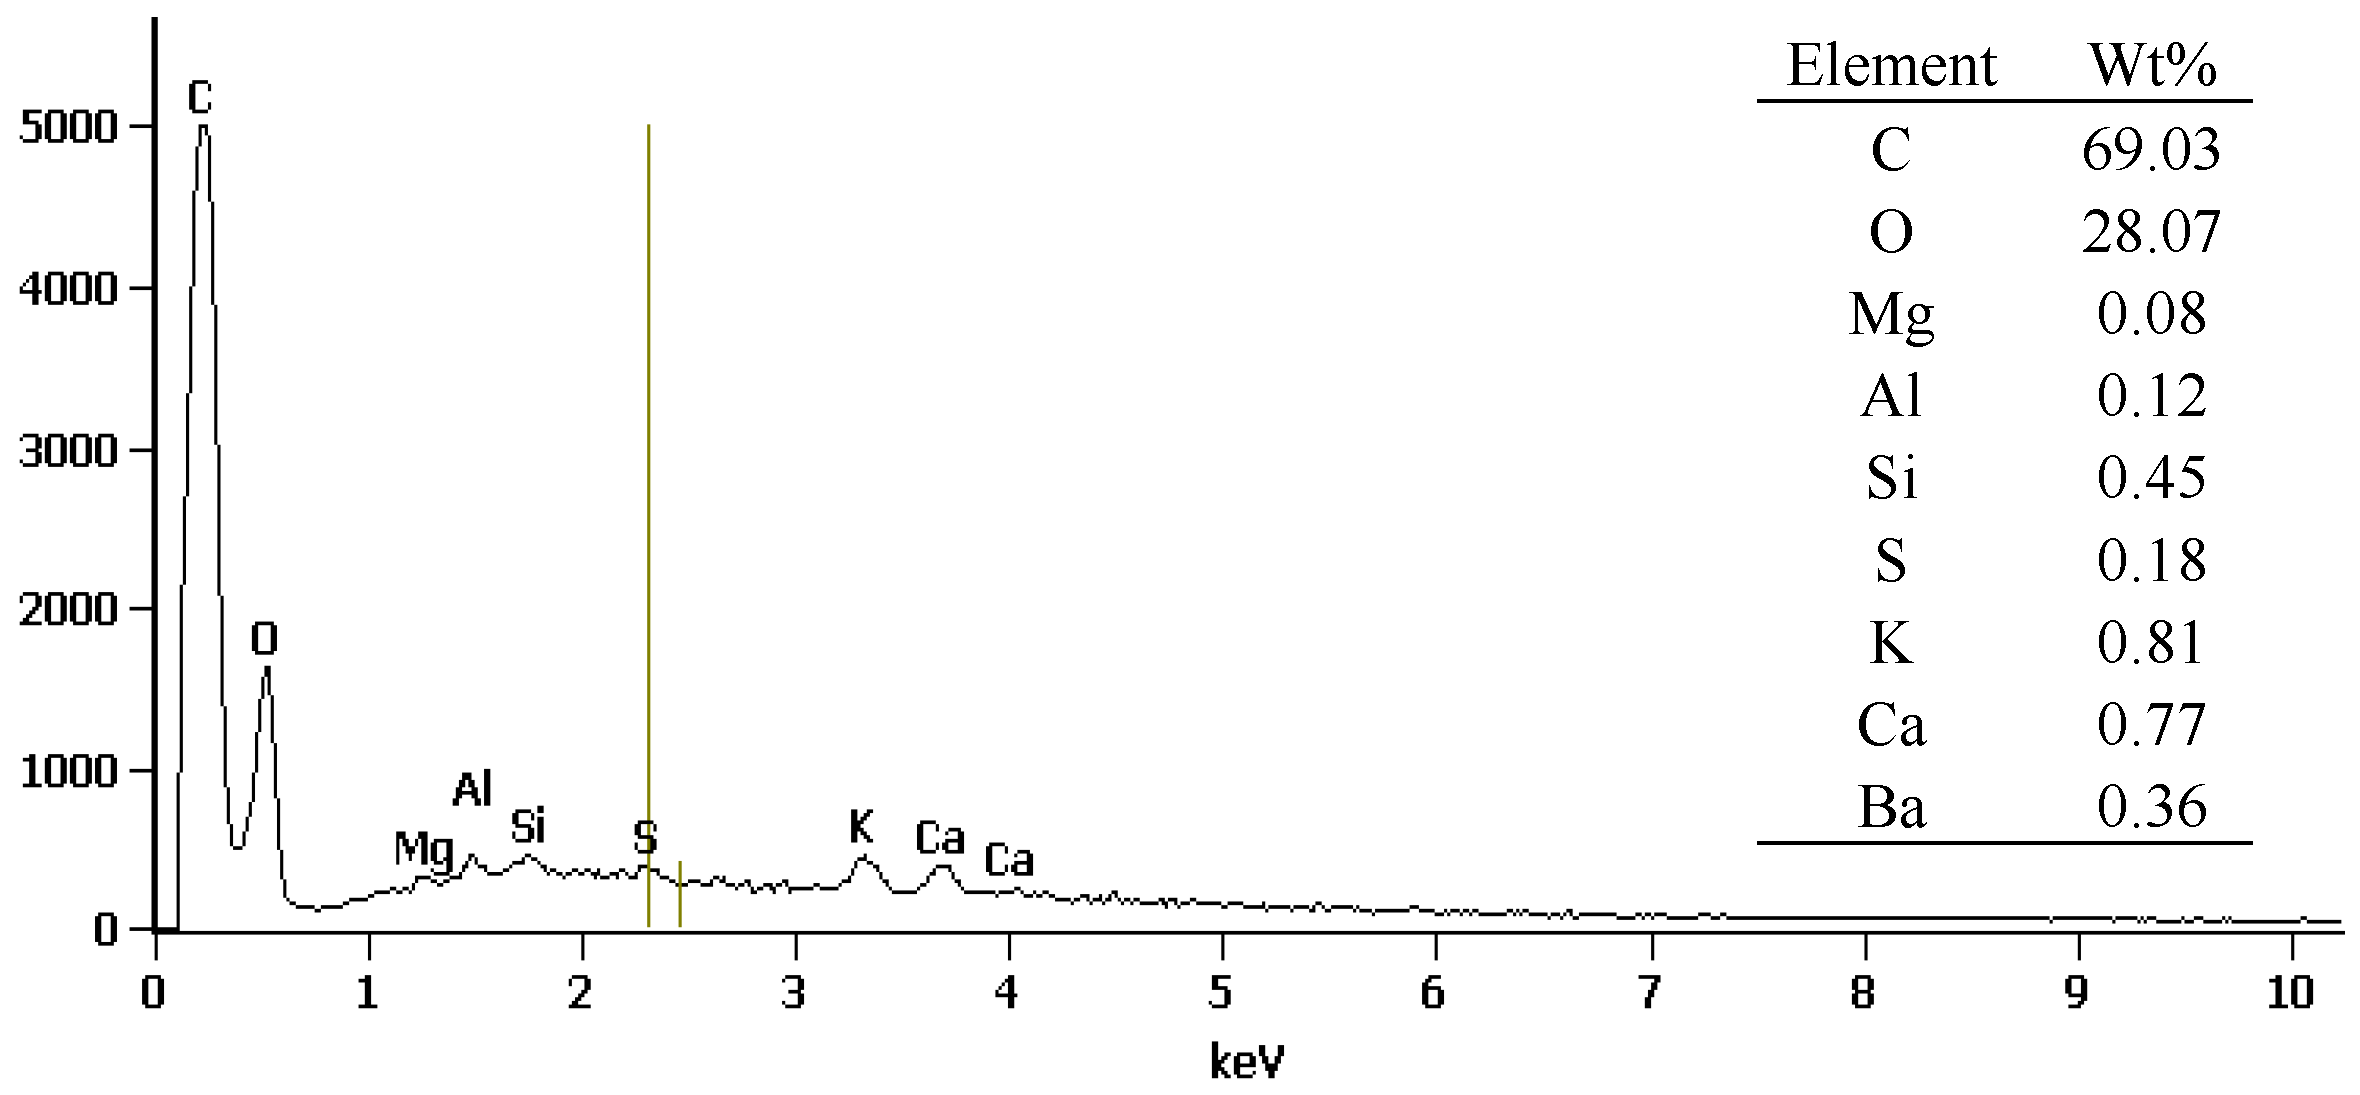
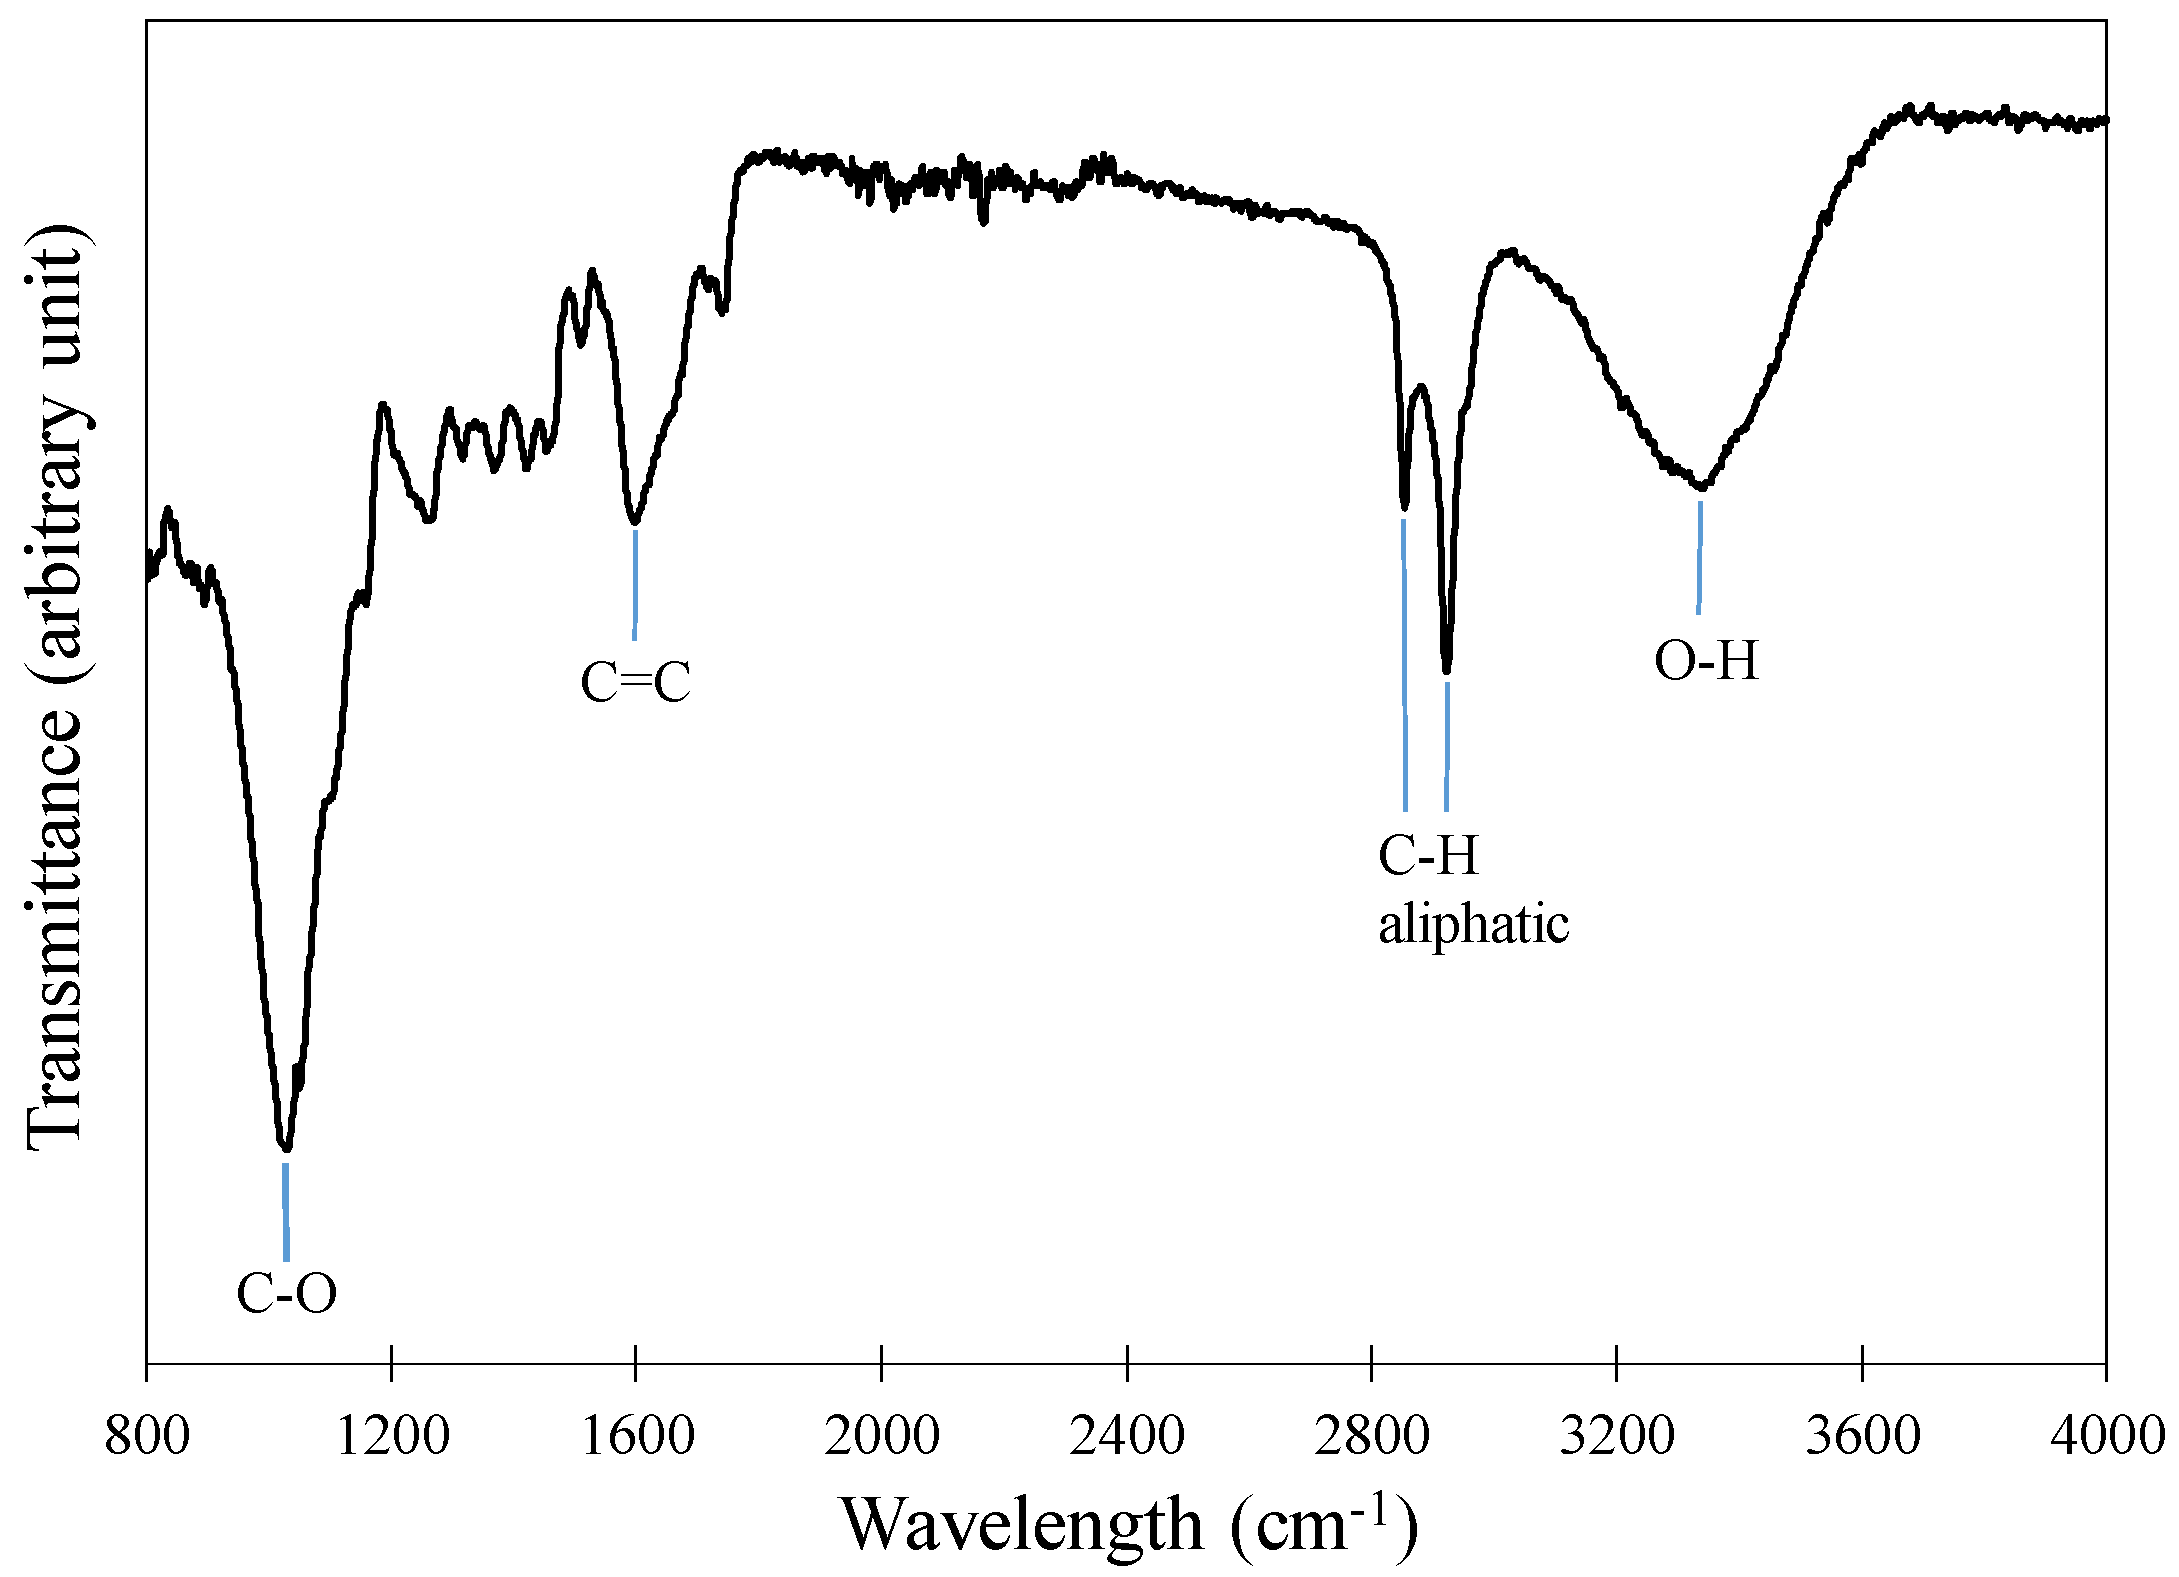
3.1. SEM, EDS, and FTIR of Biochar

The microstructure of biochar used in this study is shown in Figure 1. Uneven ridges and honeycomb pore structures can be observed on the surface of biochar, which is inherited from the biological capillary of the feedstock. It is seen that the surface of biochar is significantly porous. During the pyrolytic conversion, volatile and organic matters escape through application of heat. As a result, pores are created in a wide size range in biochar. It is important to note that pores on biochar surface act as channels to smaller pores, which have an important role to play in water absorption and water retention [29,30].
The elemental analysis of the surface of biochar obtained from EDS is shown in Figure 2. It is seen that the main elements are carbon (69%) and oxygen (28%) and a small trace amount of potassium, calcium, and silicon.
The FTIR spectrum of biochar is shown in Figure 3. The peaks at the wavelengths of approximately 3340, 2855–2923, 1599, and 1032 cm−1 are attributed to hydroxyl (O-H), aliphatic (C-H), alkene (C=C), and (C-O) groups, respectively [37]. The peaks observed in the FTIR spectrum are in agreement with the FTIR peaks of biochars observed in the literature [37].

3.2. Absorption

3.2.1. Absorption in Solution

The absorption results of the biochar in the NaOH and Na2CO3 solutions are shown in Figure 4. Biochar exhibited 21% higher absorption in the NaOH solution than in the Na2CO3 solution. It is also observed that biochar absorption in the NaOH solution reached a peak early on and then slightly decreased. Such a reduction in absorption after initially sudden increase could be due to the chemical or physical interactions between the biochar and the NaOH solution resulting in the release of solution from the biochar. However, biochar absorption in Na2CO3 did not exhibit such a behavior and continued to increase but at a much lower rate within the time frame of the test.

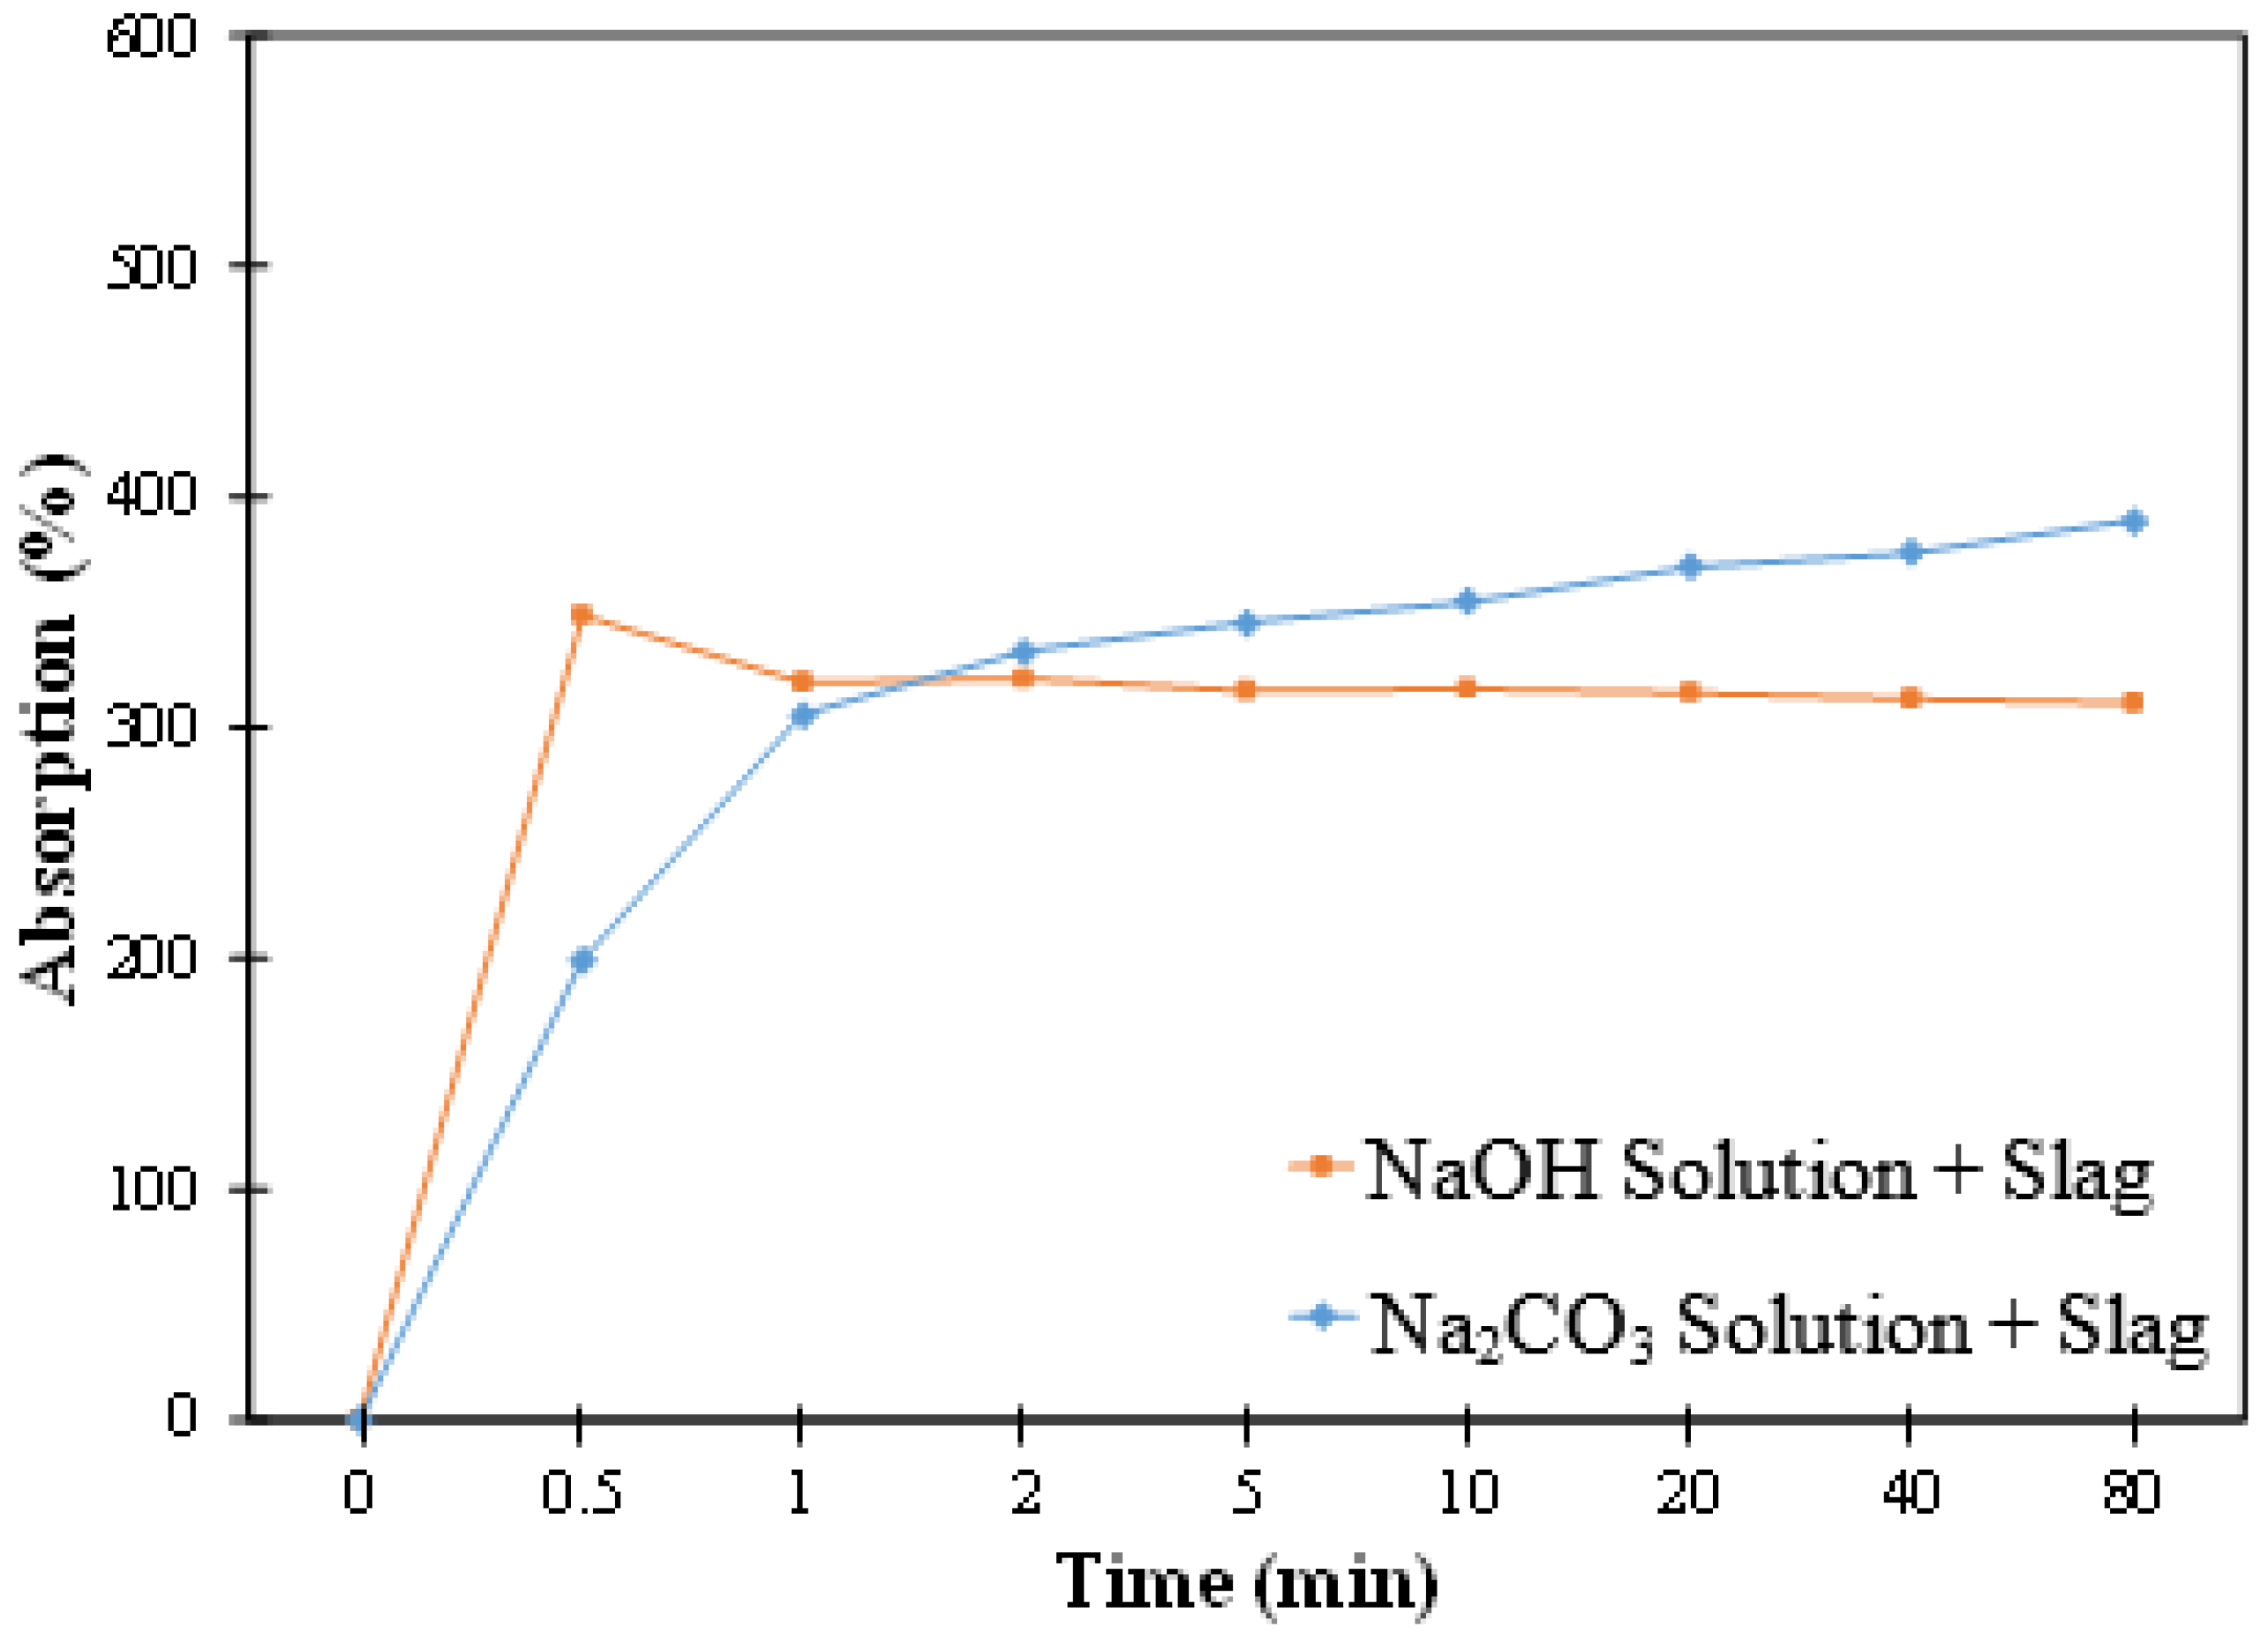
3.2.2. Absorption in the Activator Solution + Slag Mixtures

The biochar absorption in the activator solution + slag mixtures is shown in Figure 5. It is seen that biochar exhibited a slightly lower absorption in the NaOH solution + slag mixture than in the NaOH solution; the biochar absorption in the Na2CO3 solution + slag mixture is also lower than in the Na2CO3 solution initially, but the difference diminished at later times. The lower biochar absorption in the slag mixture compared to the solution could be due to the fact that in the slag mixtures, solution is not as freely available for biochar absorption as in the case of solution [38]. It is interesting to note that in the NaOH solution + slag mixture, the biochar demonstrated a sudden increase in absorption followed by a small reduction before reaching a plateau. A similar behavior was also observed in biochar absorption in the NaOH solution.

3.3. Isothermal Calorimetry

The heat flow and cumulative heat of the pastes are shown in Figure 6a,b, respectively. A first peak can be seen in the heat flow curves, which is ascribed to the initial wetting and dissolution of the slag when it comes into contact with the activator solutions. It is interesting to note two peaks at later times in all pastes. These peaks are attributed to the formation of the reaction product calcium (sodium)-silicate (aluminate)-hydrate C (N)-S (Al)-H in the pastes [39]. It is observed that the peaks corresponding to NC showed a higher value and occurred earlier, compared to NO. While the second peak appeared higher than the third peak in NC, this was reversed in the case of NO. It appeared that the first and second peaks in NO overlapped. The higher peaks and earlier occurrence in NC, compared to NO could be due to higher solution/slag increasing the reaction rate at the early age in these pastes. The observed reaction rate in NC compared to NO is interesting in view of higher pH of the activator in NO compared to NC, which is expected to enhance the reaction rate; however, for the mix designs studied here, the higher solution/slag seemed to overcome the lower pH of the activator in NC compared to NO.
The addition of biochar is seen to delay and lower the second and third peaks in the paste; this effect appeared to be more pronounced in NO-B, compared to NC-B. In the pastes with biochar, due to the absorption of the activator solution by biochar as well as creation of voids by biochar, the interstitial space between the slag particles is reduced. When the interstitial space is filled with reaction product, the dissolution of slag and transport of ions are slowed down, resulting in delayed reaction in the pastes with biochar [1]. In spite of delayed reaction at early hours, it is interesting to see from Figure 6b that the pastes with biochar improved the cumulative heat, compared to the pastes without biochar at later hours. A reason for enhanced cumulative heat of the pastes with biochar, compared to the pastes without biochar, could be that the biochar with a large specific surface area acts as nucleation site for the formation of reaction product. However, additional research is needed to reveal the underlying mechanisms responsible for such influence of biochar on the reaction process of alkali-activated slag pastes.

3.4. Setting Time

The initial and final setting times of the pastes with and without biochar are depicted in Table 3. It is noted that the effect of biochar on the setting times of the paste is different in NC-B than in NO-B. While the setting time is increased in NO-B compared to NO, it is decreased in NC-B, compared to NC. However, the difference in the setting time of the pastes with and without biochar is larger in the case of the pastes activated with NaOH. The increase in the setting time of NO-B, compared to NO appeared to be in general agreement with the noticeable delayed peaks of NO-B, compared to NO, observed in the heat flow curves shown in Figure 6a. The acceleration of setting time in NC-B and delay of setting time in NO-B is attributed to the way biochar affected the percolation of reaction products in these pastes. A reduction in setting time in alkali-activated slag containing superabsorbent polymers as the internal curing agent while delaying reaction rate was also observed in a previous investigation [1].

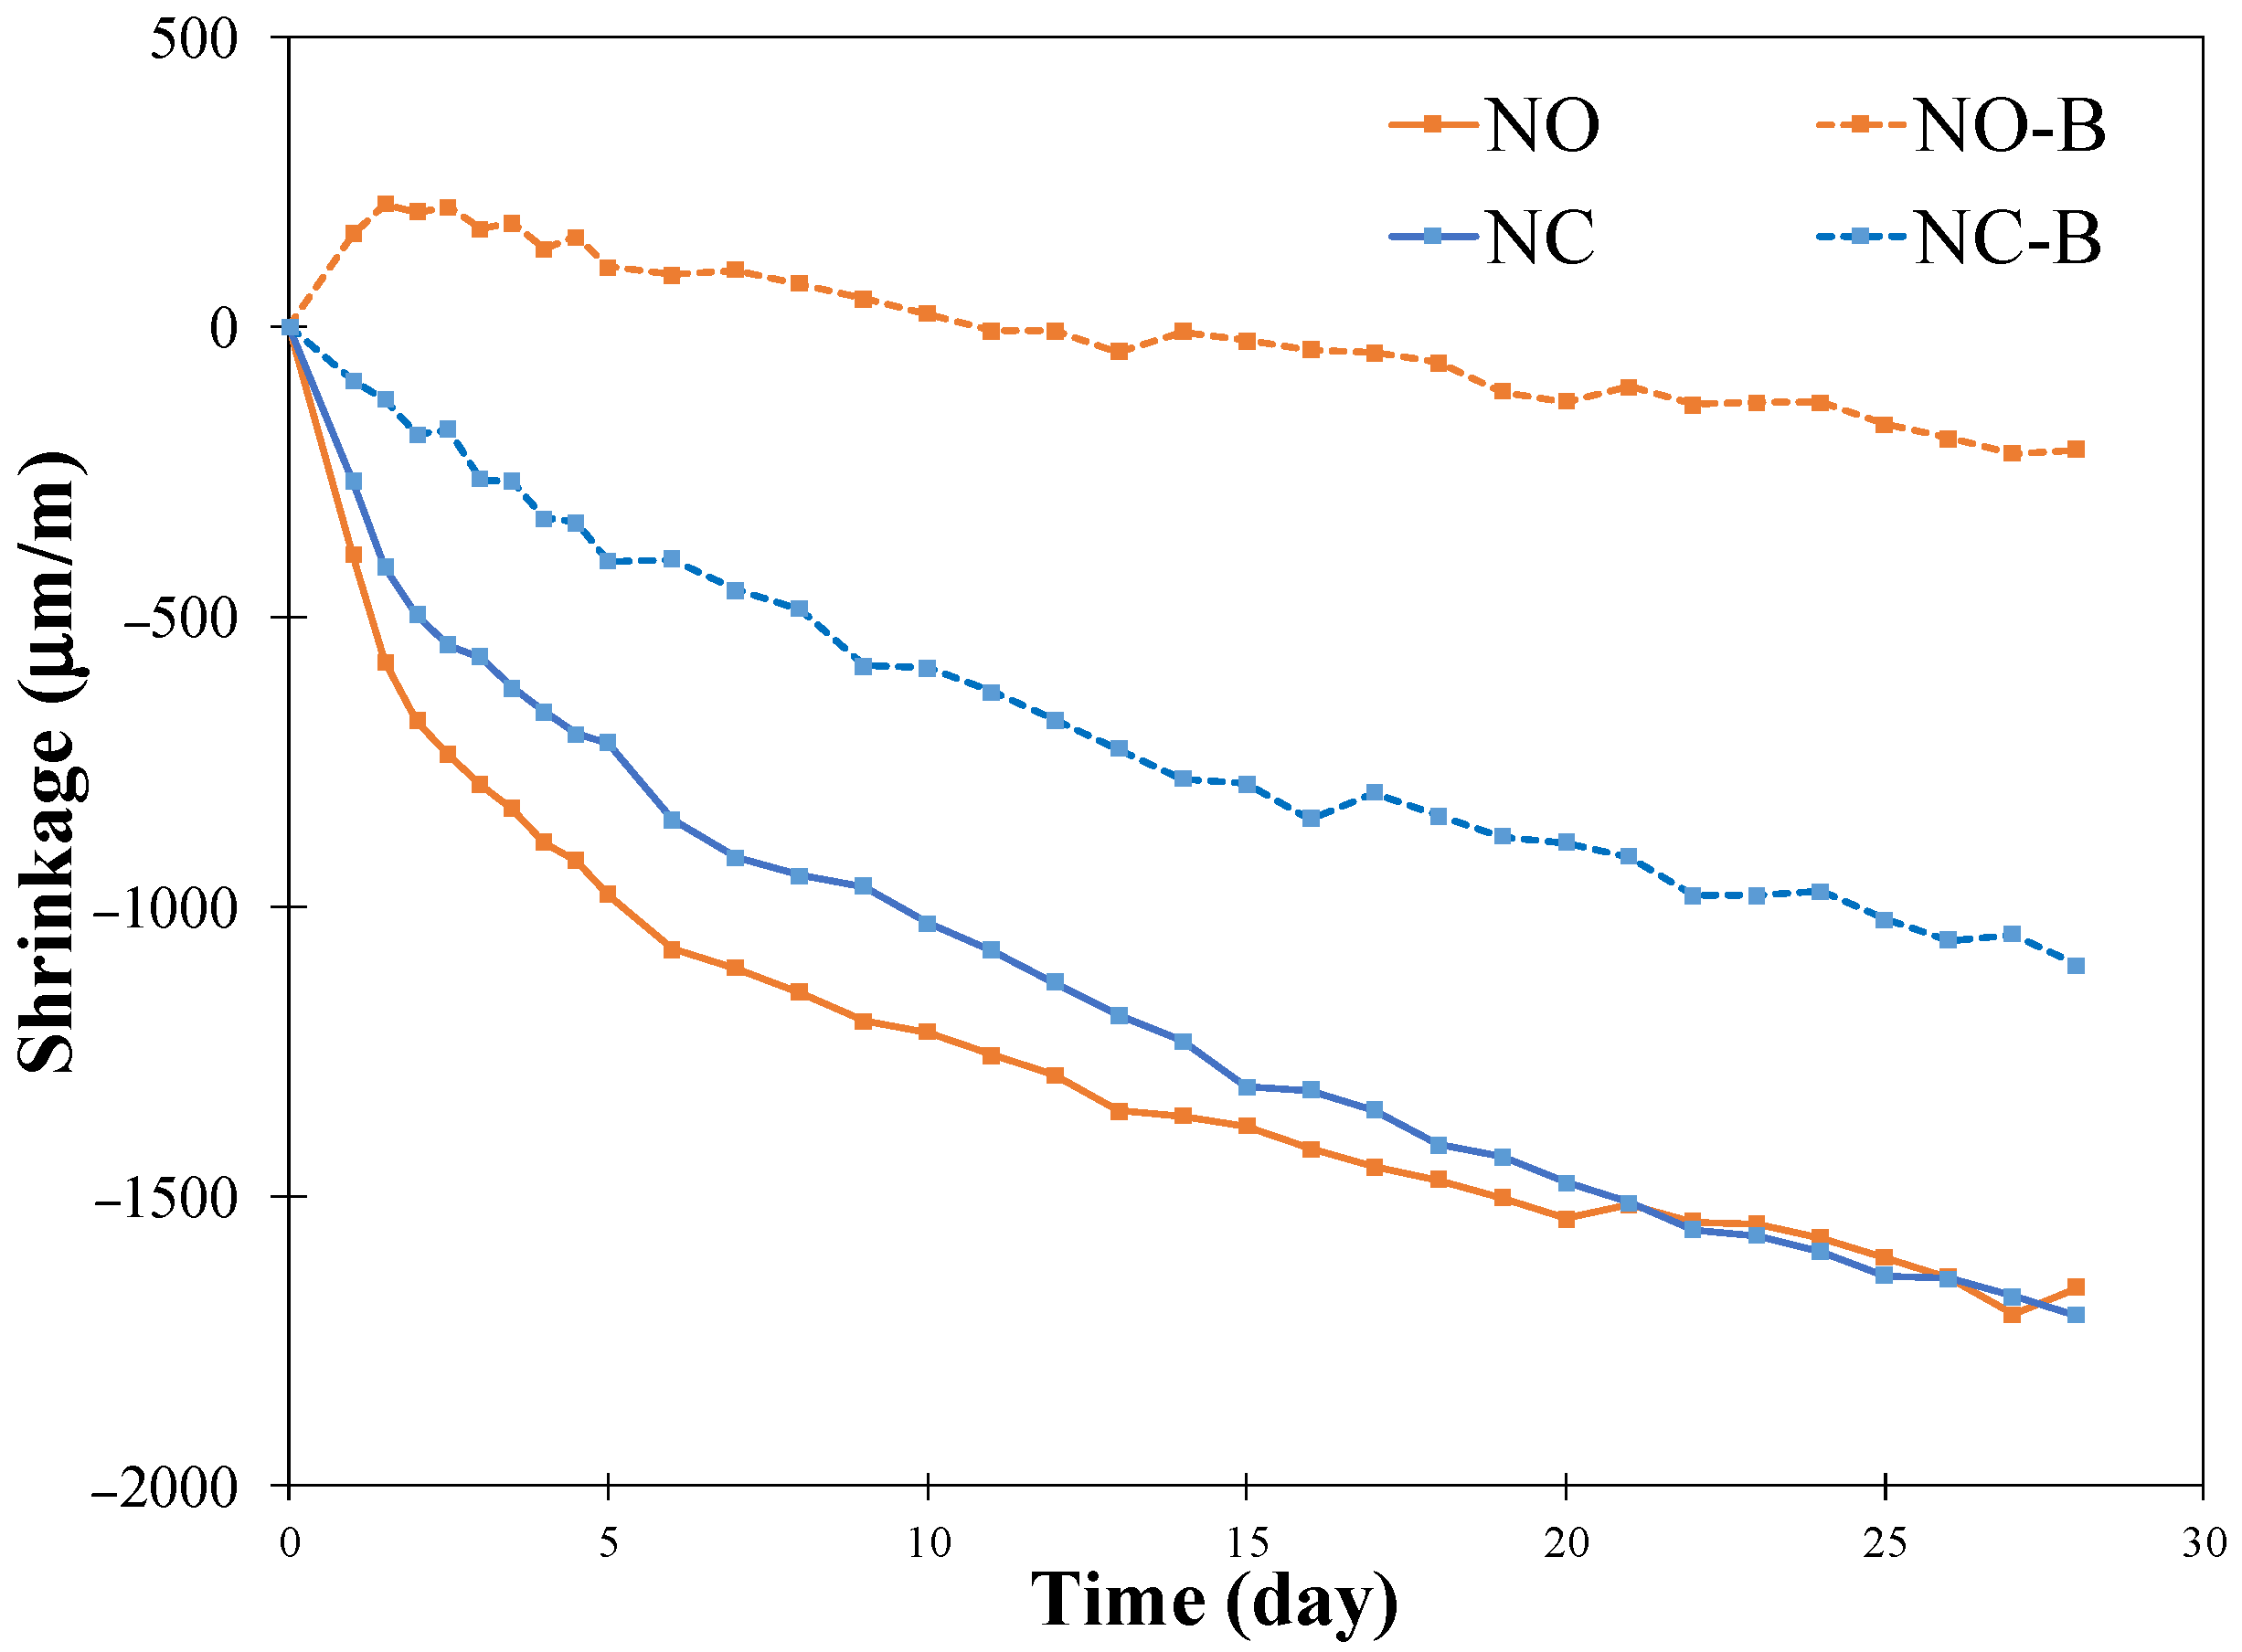
3.5. Autogenous Shrinkage

The autogenous shrinkage of the alkali-activated slag pastes with and without biochar is shown in Figure 7. It is observed that the alkali-activated slag pastes without biochar showed large shrinkage reaching values more than 1500 μm/m at 28 days of age. The high autogenous shrinkage observed in the alkali-activated slag pastes is attributed to more refined pores in the microstructure of the alkali-activated slag pastes [7,11,19]. It is documented that alkali-activated slag pastes possess more 2–50 nm mesopores than Portland cement paste; this range of pore sizes is effective in developing the capillary forces that are the cause of autogenous shrinkage in the pastes [11,40,41]. It is seen that biochar was able to reduce the autogenous shrinkage in both NO-B and NC-B. The reduction in autogenous shrinkage is seen to be more pronounced in the case of NaOH activated slag paste than Na2CO3 activated slag paste. The water released from the biochar aids in preventing the relative humidity from dropping in the paste. Since the capillary forces that are responsible for autogenous shrinkage increase with decreasing relative humidity in the pore structure, the internal curing provided by biochar reduces the autogenous shrinkage in the slag paste. It is noted that both NO and NC showed a sudden increase in shrinkage until approximately 36 h, and then their shrinkage continued gradually at a lower rate. NO-B demonstrated an expansion within the first 36 h and then started to shrink at a low rate. On the other hand, NC-B exhibited a gradual increase in shrinkage from the beginning at a similar rate to that of NC after 36 h, as seen from Figure 7. From the above observation, it seems that the effect of biochar on reducing autogenous shrinkage was primarily limited to the early age, and this was more pronounced in the case of NC-B. It should be noted that the effect of biochar on reducing autogenous shrinkage of the alkali-activated slag pastes appeared to be less than that of SAP, as evidenced by the authors’ previous work [18]. The smaller influence of the biochar, compared to SAP, on mitigating autogenous shrinkage of alkali-activated slag pastes could be related to the absorption behavior; SAP typically demonstrates a higher absorption, compared to biochar.

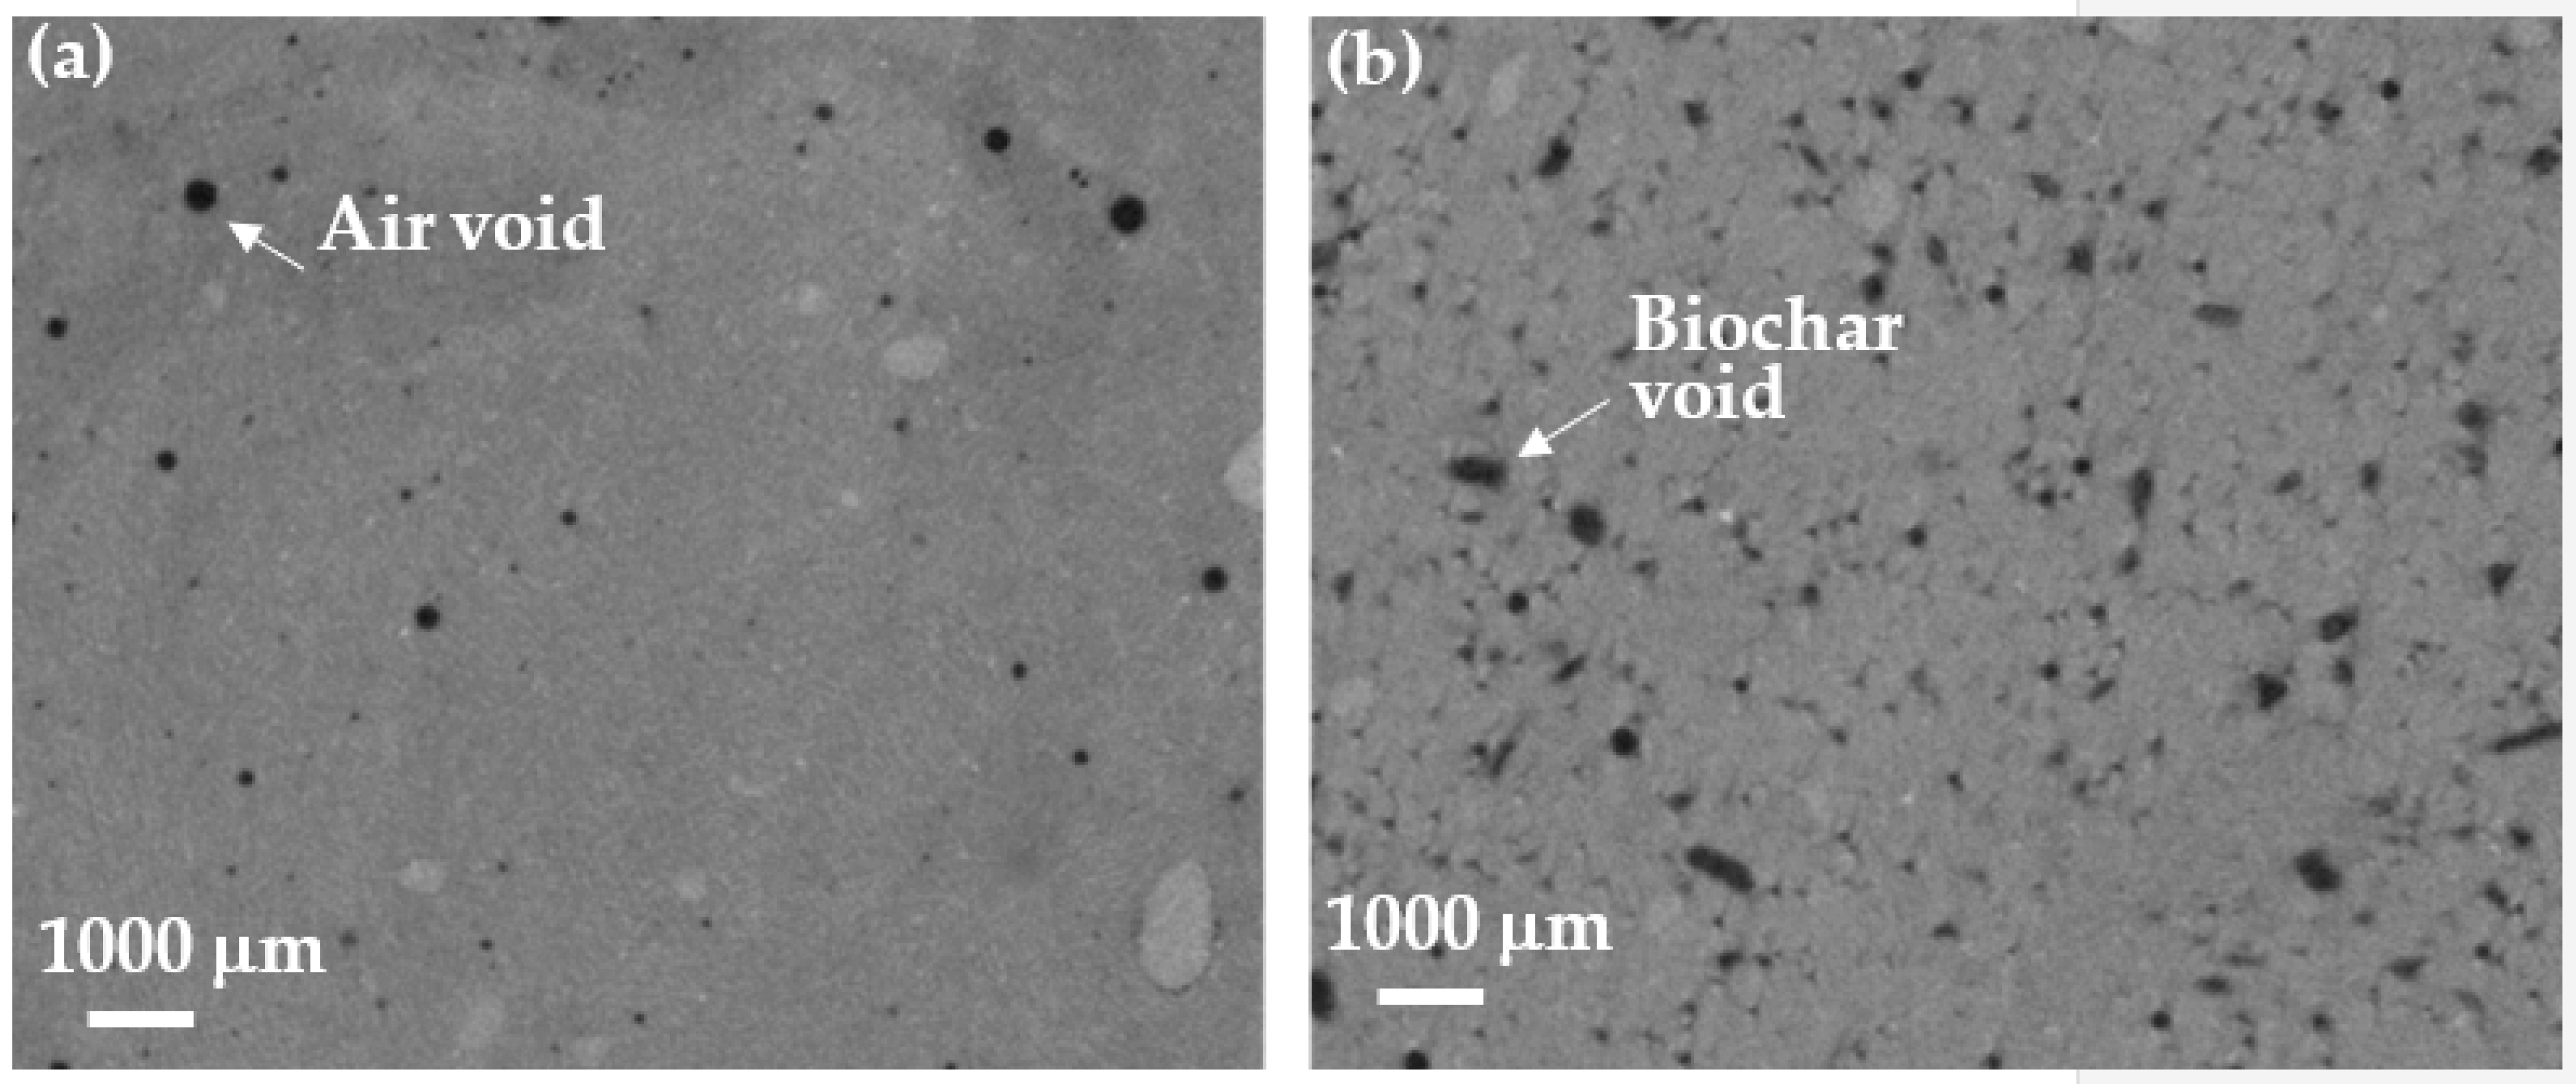
3.6. Void Structure Analysis
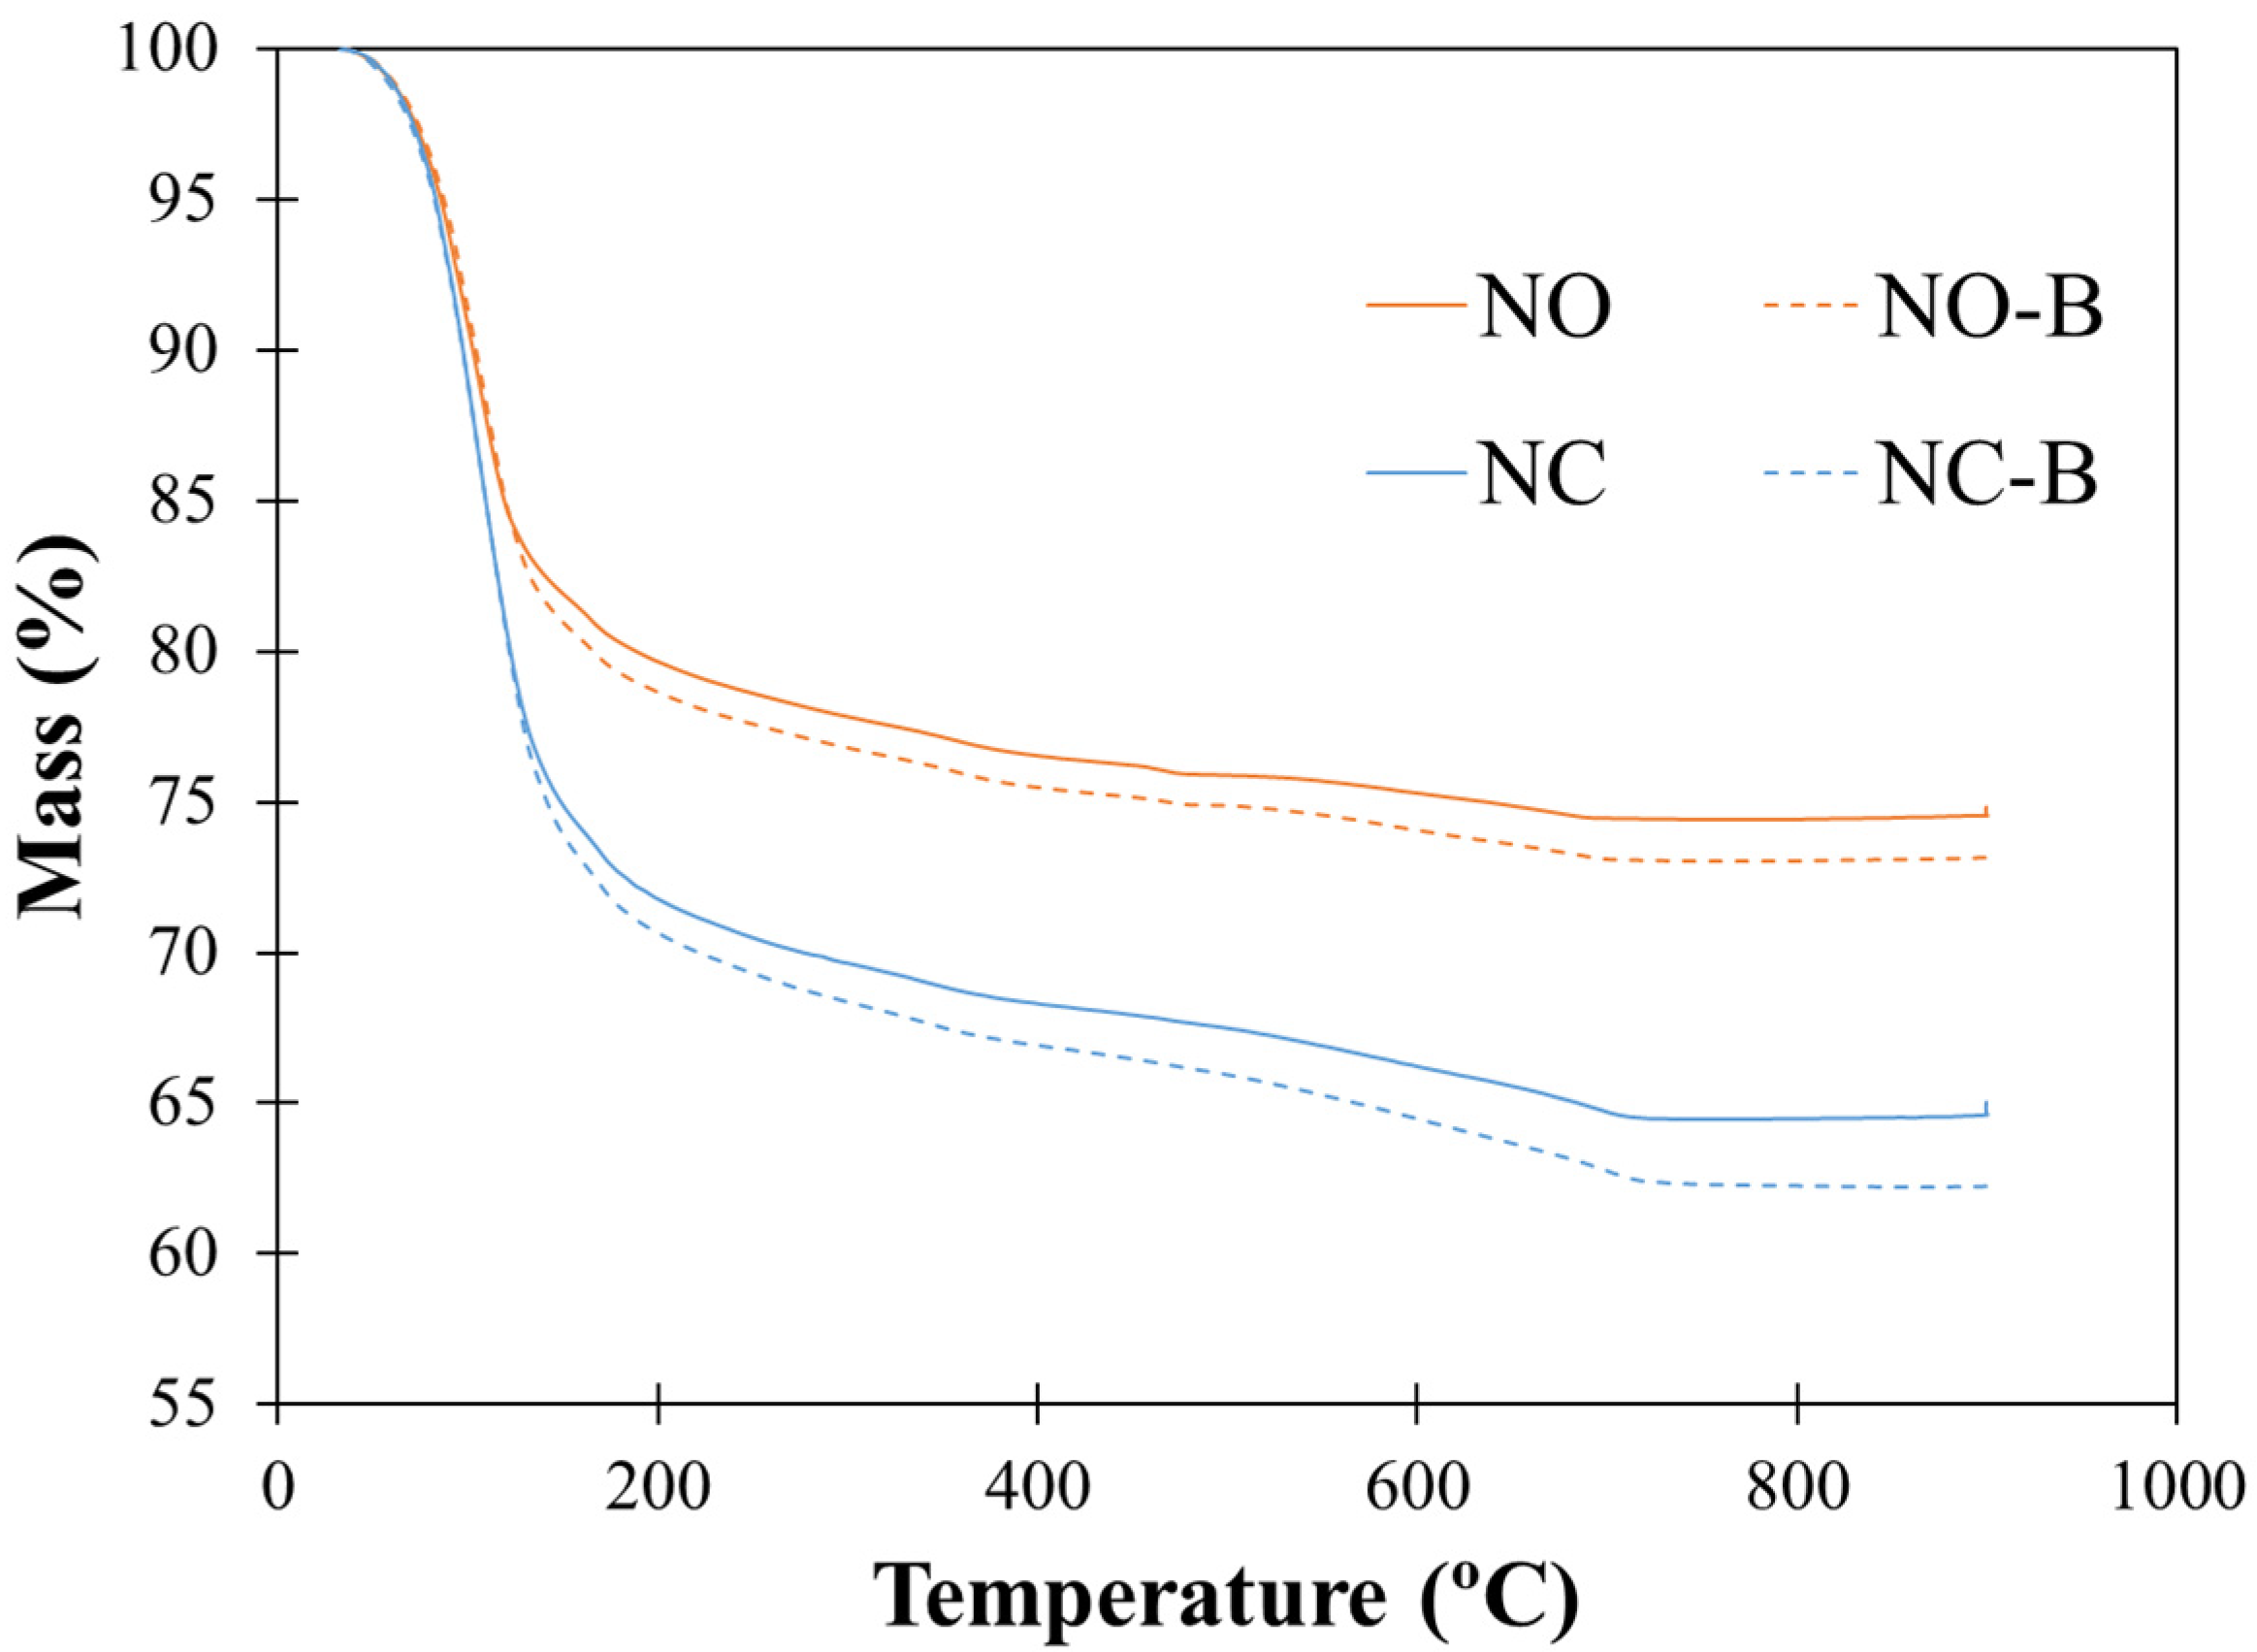
The results of the void structure analysis in the pastes with and without biochar are presented in this section. Figure 8a,b show a 2D reconstruction of the void structure of NC and NC-B, respectively. Air voids with spherical morphology are seen in black in NC and NC-B. In addition, there are dark gray, non-spherical features in Figure 8b, which are attributed to biochar voids. The total porosity and total number of the voids larger than 30 μm are shown in Table 4. As expected, the porosity of the pastes with biochar increased, compared to the pastes without biochar. It is interesting to note the higher porosity of NO and NO-B compared to NC and NC-B, respectively, in spite of higher solution/slag of NC and NC-B. A comparison of the porosity between the pastes with and without biochar seems to suggest that NO-B demonstrated a slightly higher porosity, compared to NC-B. The larger number of voids in NO-B, compared to NC-B is also observed which cannot be attributed solely to the voids occupied by biochar as the concentration of biochar used in NC-B and NO-B was close. Thus, the presence of biochar affects the void structure of the pastes differently in the alkali-activated slag pastes.

3.7. TGA

The results of the TGA analysis are depicted in Figure 9. The change in mass in the range below 150 °C is typically due to the evaporation of unbound water [42,43]. It is seen that NC and NC-B exhibited a larger unbound water loss, compared to NO and NO-B. The change in mass in the range of 150–550 °C is attributed to the decomposition of reaction products including C(N)-S(A)-H and hydrotalcite [42]. Since the exact decomposition temperatures of these phases are not clear, it is difficult to quantitatively determine the amount of these phases in the pastes [42]. An examination of the TGA curves appears to indicate similar features among the pastes, which leads to the conclusion that the addition of biochar did not result in the formation of new products or significantly alter the phase composition of the reaction product in the alkali-activated slags being studies here.

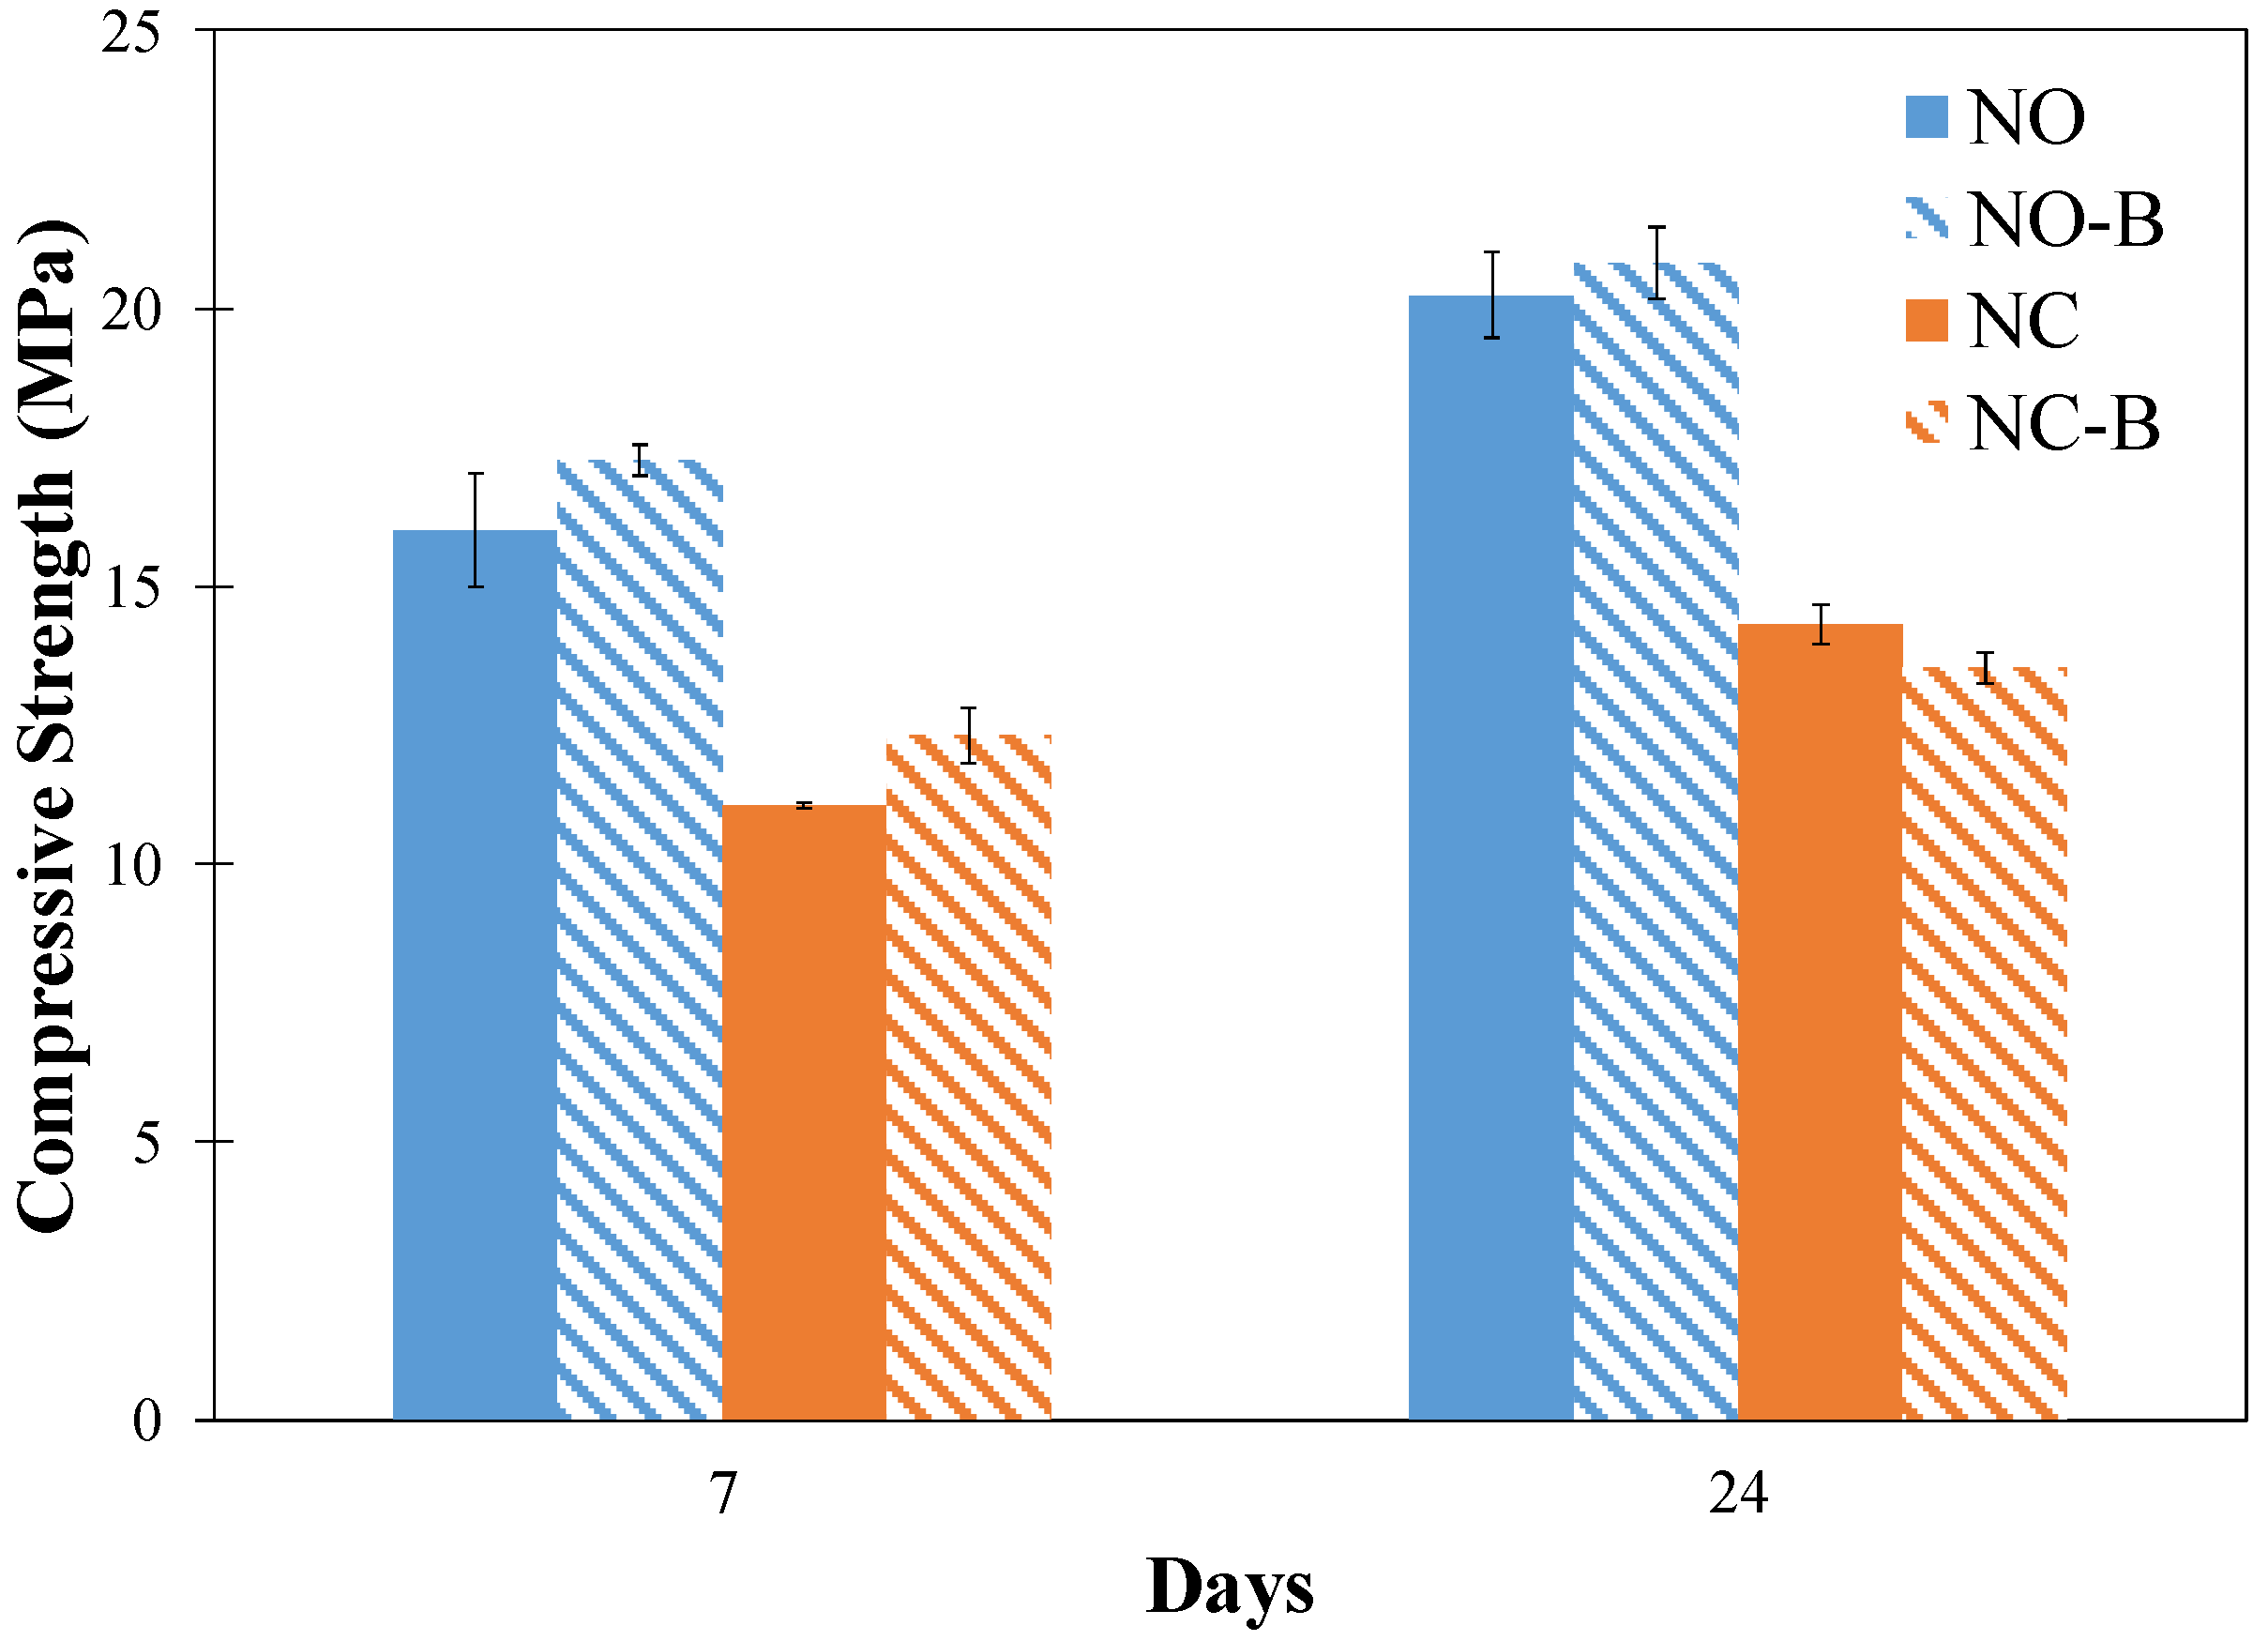
3.8. Compressive Strength

The compressive strength of the pastes with and without biochar at 3 and 24 days are shown in Figure 10. An increase in compressive strength of all pastes between 3 days and 24 days was observed, which is due to the continued reaction with age and increased formation of reaction product in the microstructure of the pastes. It is interesting to note that the pastes with biochar demonstrated a slightly increased compressive strength, compared to the pastes without biochar, except in NC-B at 24 days. Due to the absorption of activator solution by biochar, the solution/slag is reduced in the pastes with biochar resulting in more densified pore structure, which enhances compressive strength. It should be noted that the presence of biochar voids is expected to have a decreasing effect on compressive strength as the biochar voids act as stress concentration sites in the material. Thus, the combined effects of refined pore structure and presence of biochar voids determine compressive strength in the pastes with biochar. It appears that the effect of refined pore structure compensated and even overcame the effect of biochar voids in most of the pastes being studied here. It is evident that the interaction between the above-mentioned mechanisms is strongly dependent on the mix design of the pastes and further investigations are needed in this area.

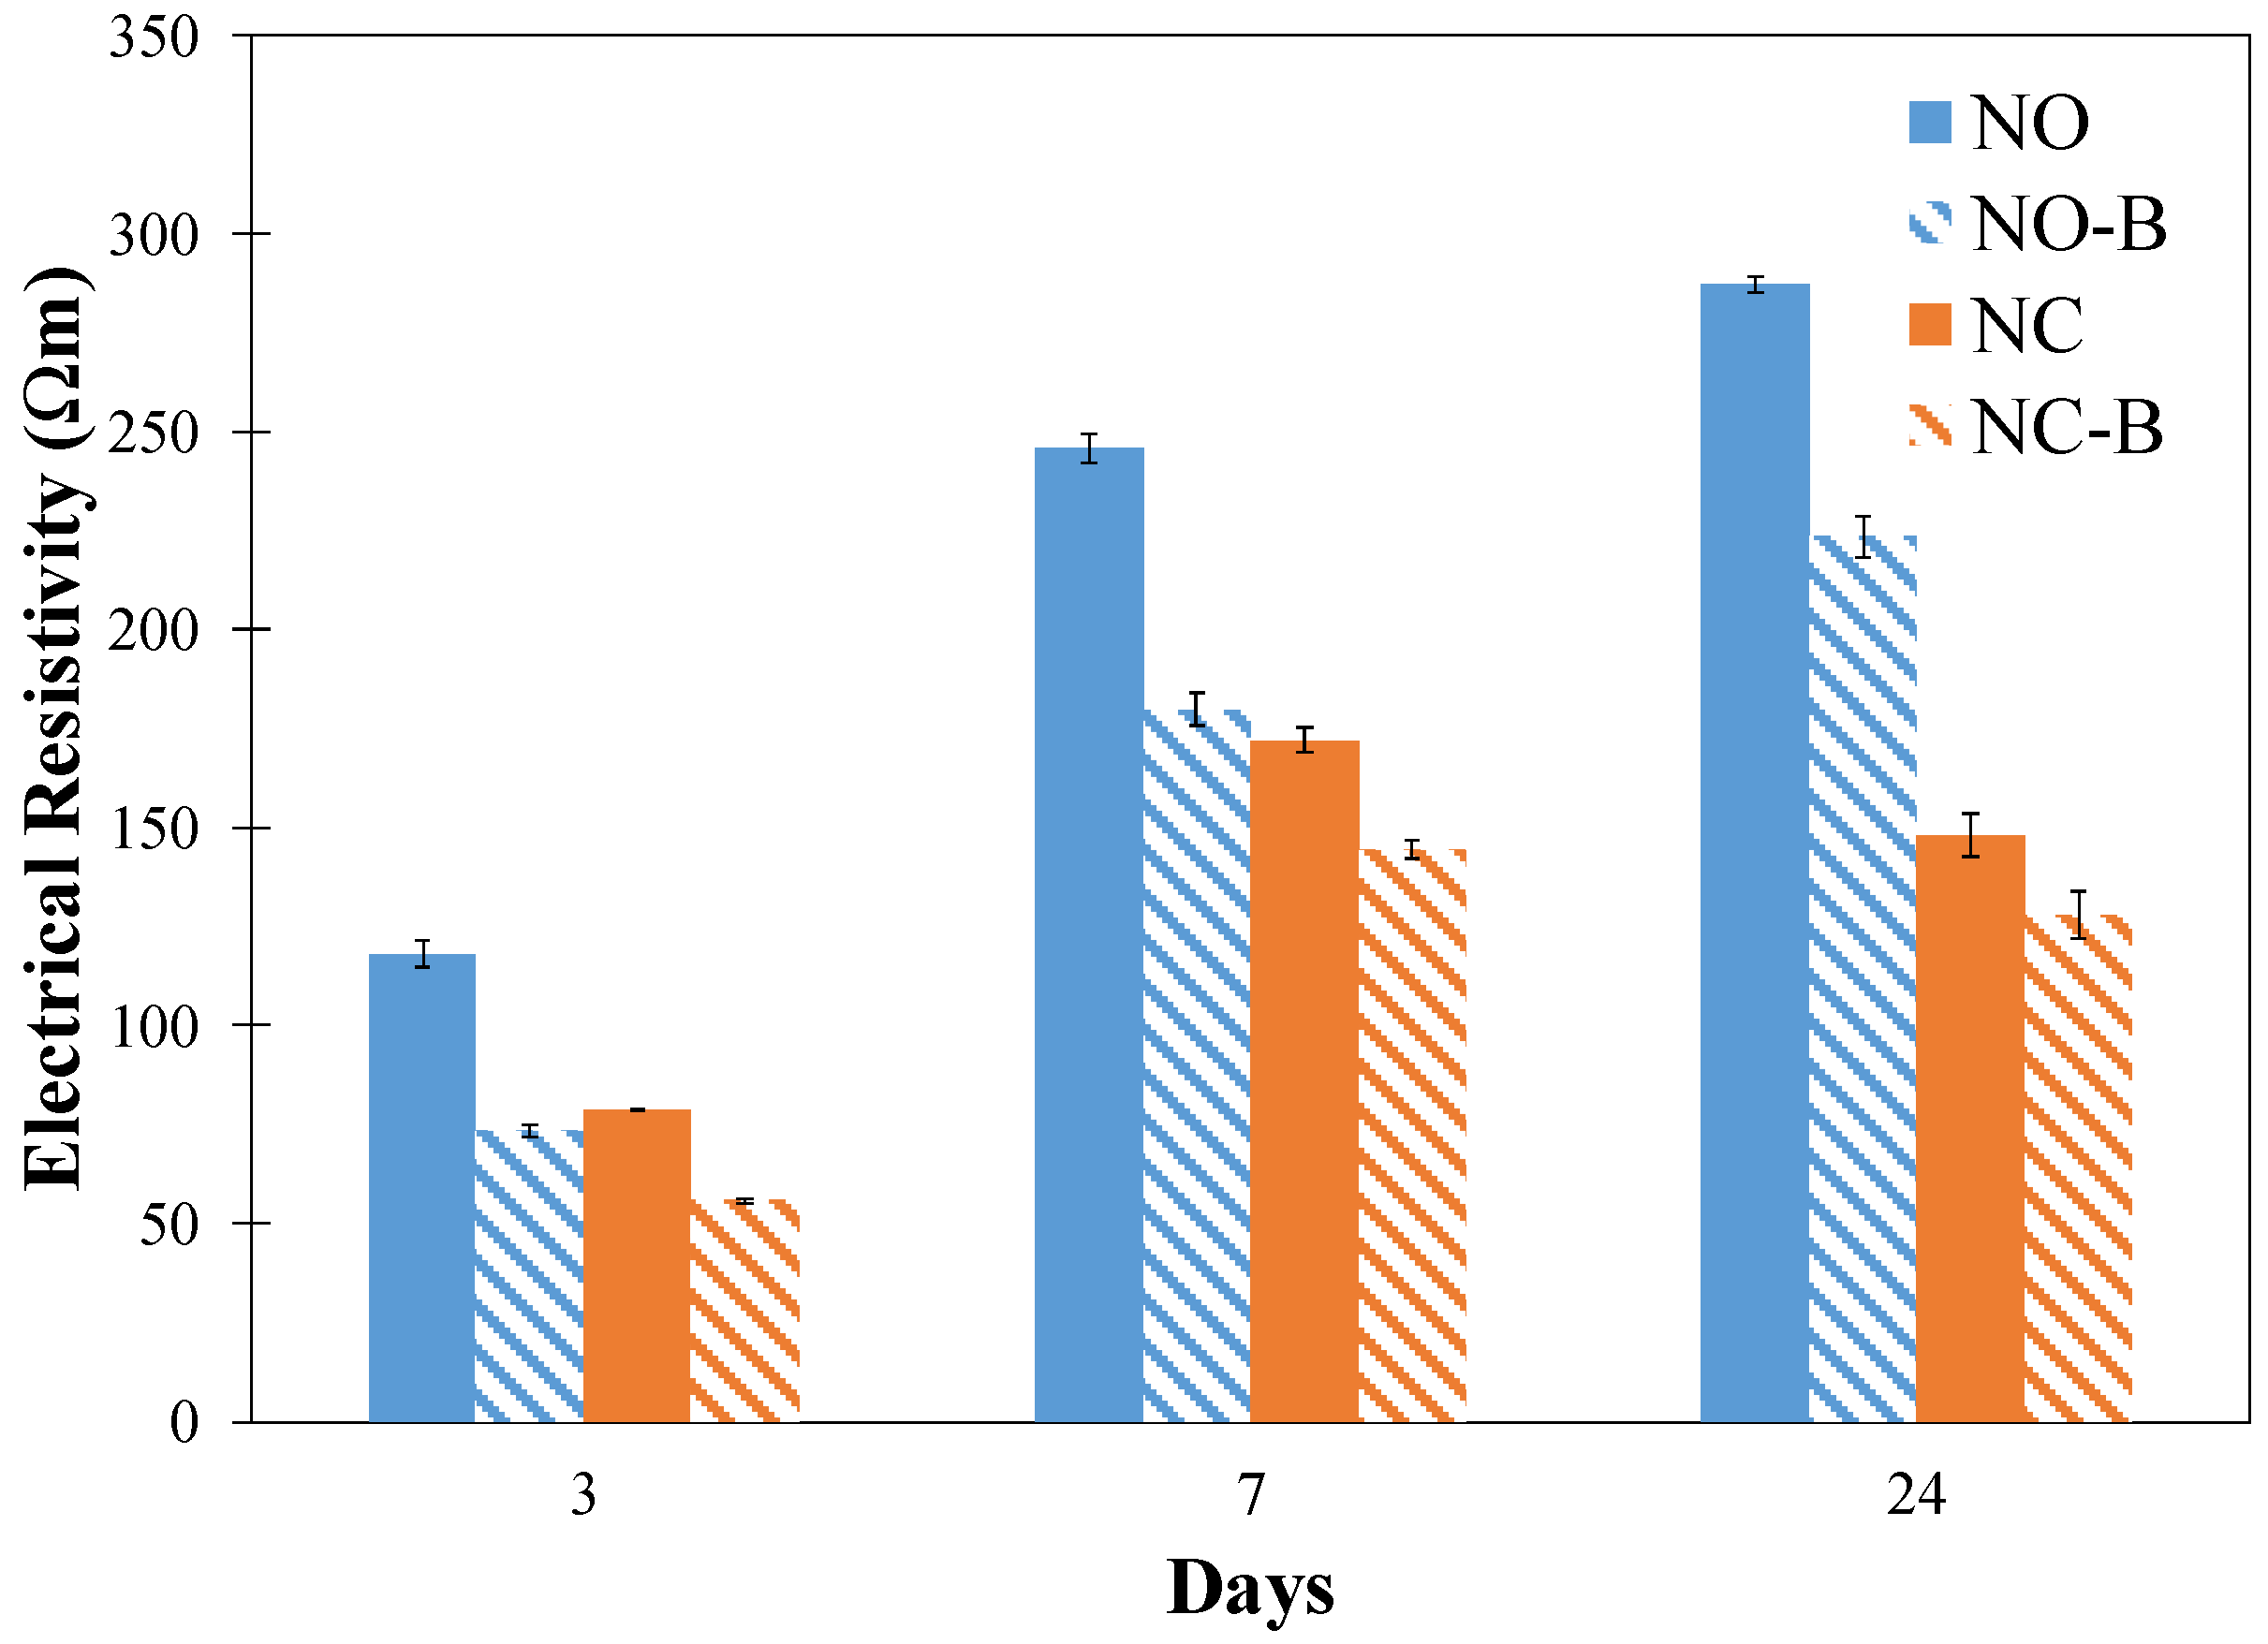
3.9. Electrical Resistivity

The electrical resistivity of the pastes with and without biochar is depicted in Figure 11. Electrical resistivity of binder materials is dependent on their pore structure and pore solution resistivity [36]. It is seen that the electrical resistivity of most pastes increased with age because of the refinement of pore structure in the pastes. However, an unexpected decrease in the electrical resistivity of NC and NC-B between 7 days and 24 days was observed; the reason for such a decrease is not known and is currently being explored and will be reported in the future. The pastes with biochar showed a lower electrical resistivity, compared to the pastes without biochar; this observation was not expected as the effective solution/slag in the pastes with biochar is reduced, which would result in enhanced microstructure refinement and consequently increased electrical resistivity. One explanation could be that biochar particles are conductive and their presence in the material could decrease the overall electrical resistivity of the pastes. The change in pore solution chemistry due to the absorption of ionic species by the biochar is expected to be negligible and cannot explain the lower electrical resistivity in the pastes with biochar. It is noted that the electrical resistivity of NC and NC-B are lower than that of NO and NO-B, respectively. This is attributed to the higher solution/slag in NC and NC-B resulting in less densified capillary pore structure in these pastes, compared to NO and NO-B.

4. Conclusions

The effect of biochar on the behavior of alkali-activated slag pastes using NaOH and Na2CO3 was examined. The following conclusions are drawn from the findings of this study:
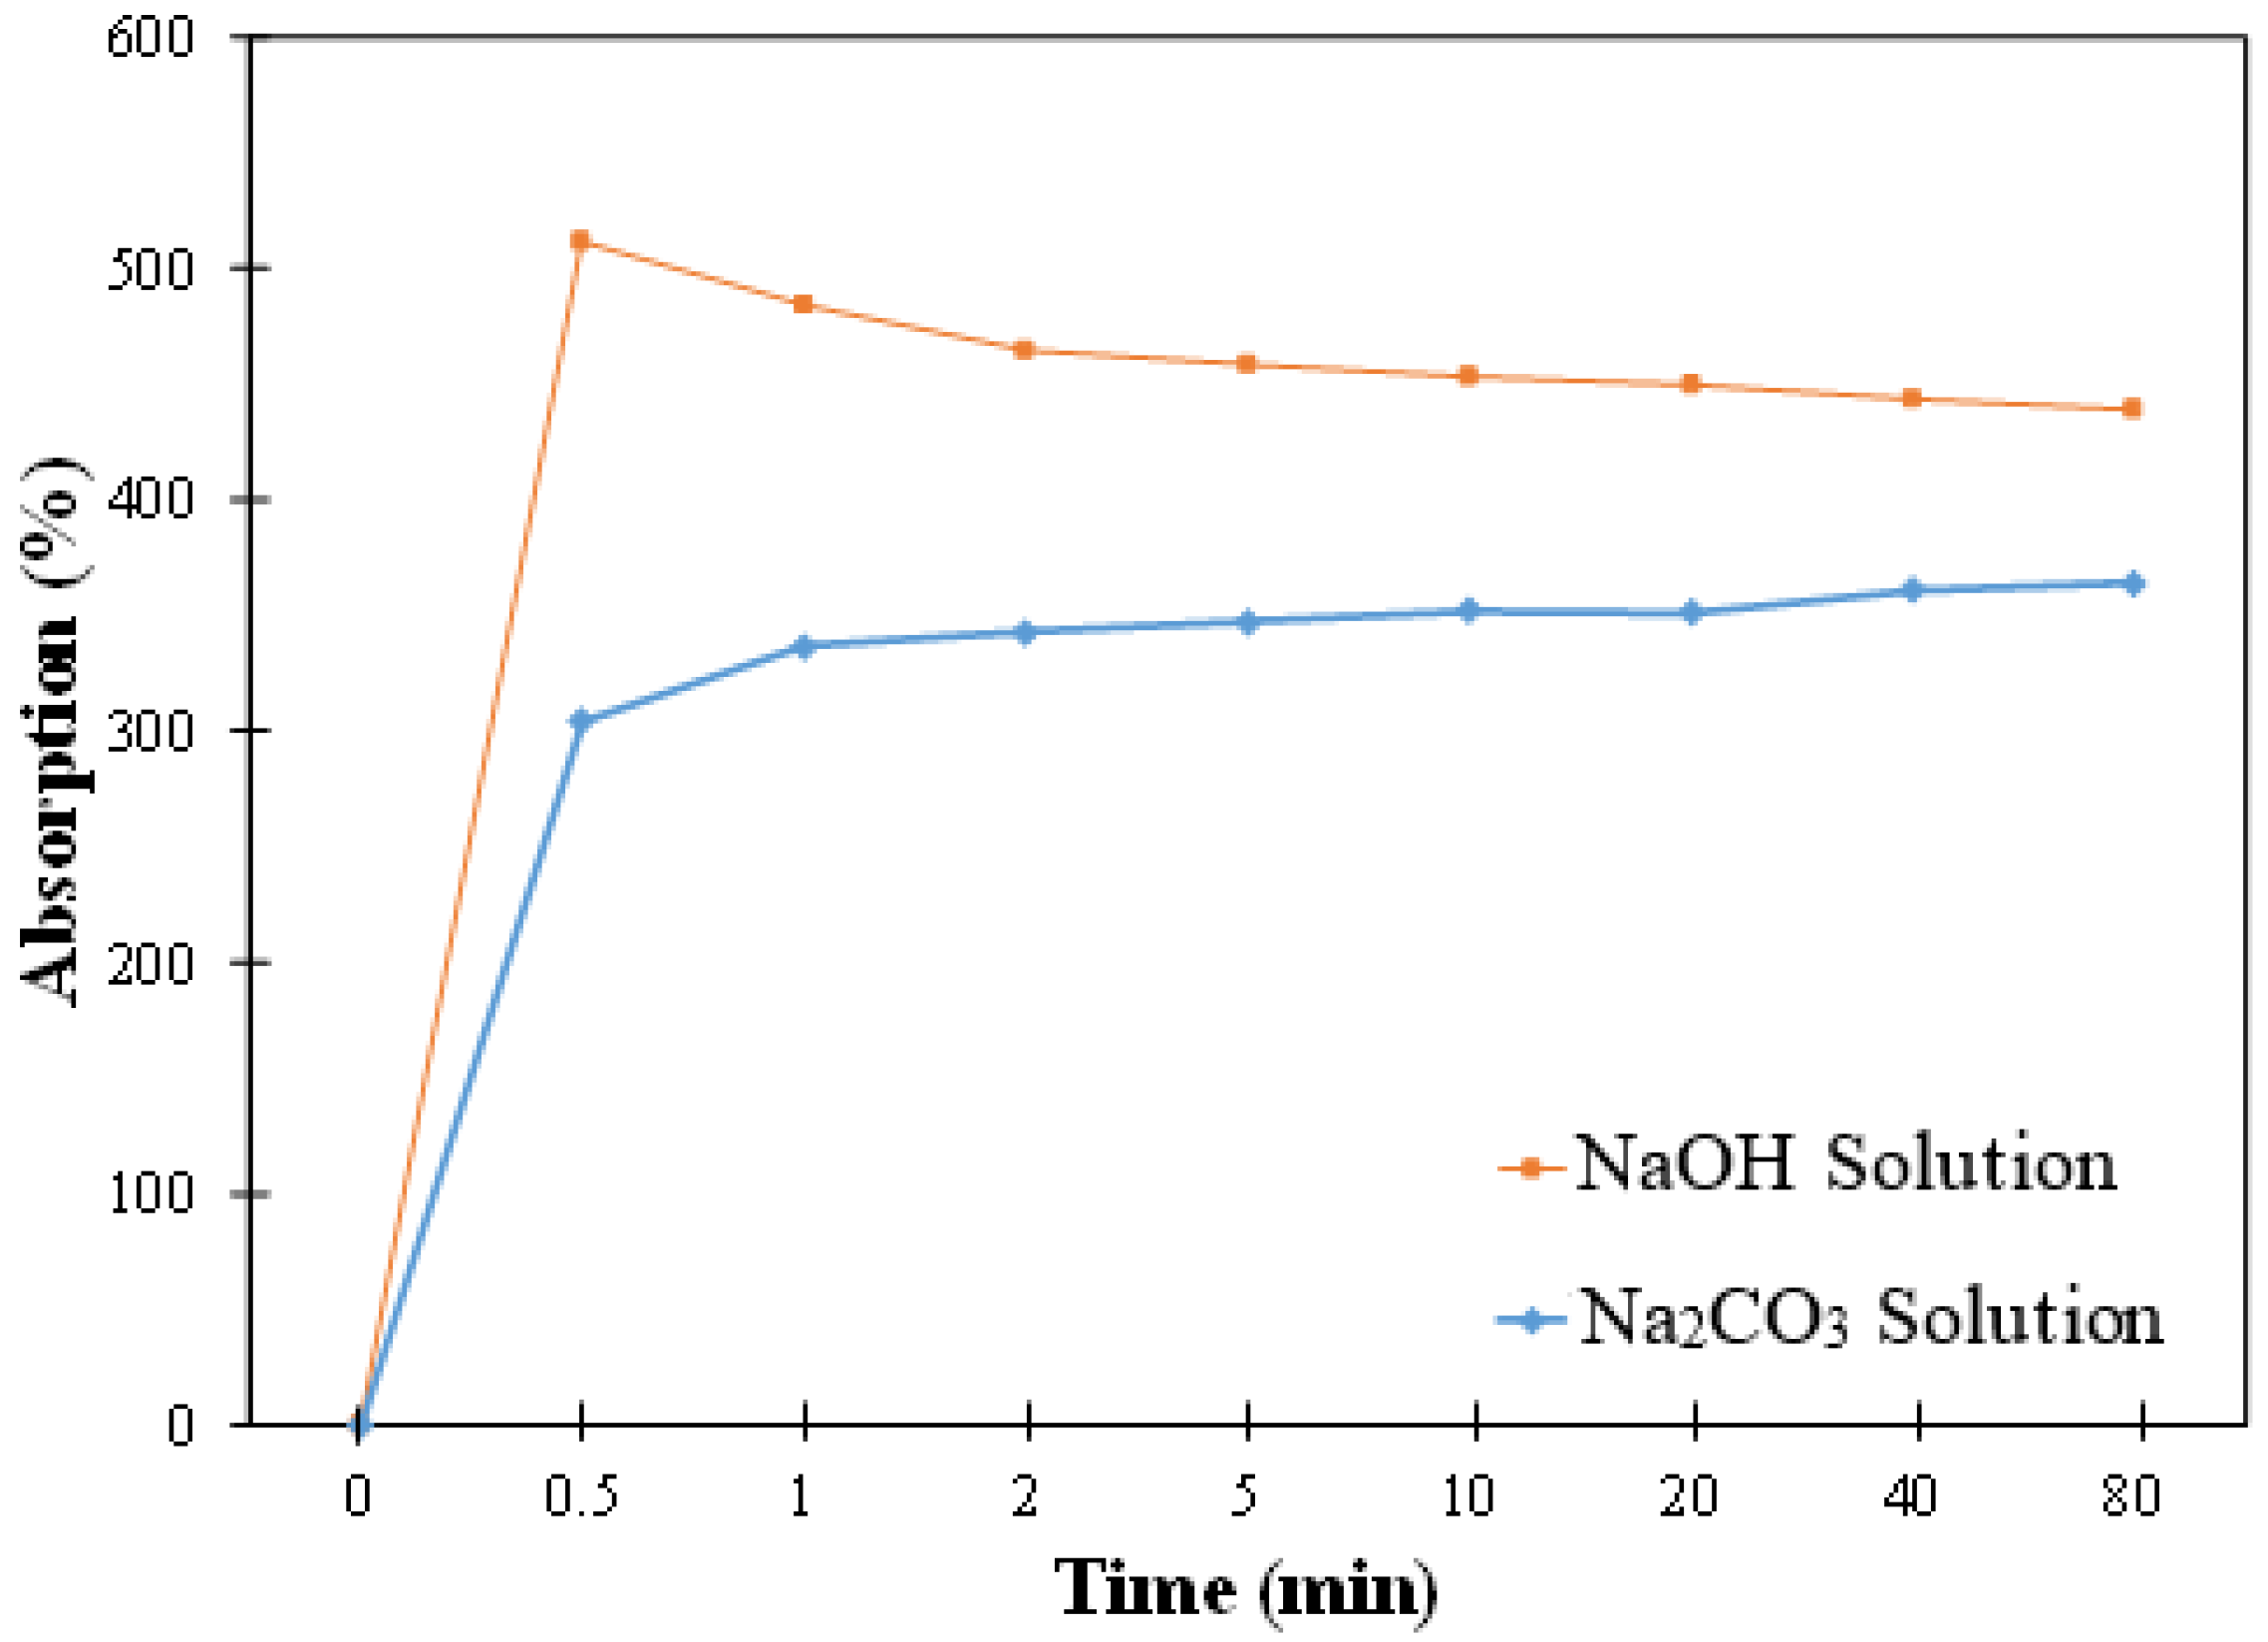
  • The difference in the absorption values of biochar in the mixture of slag and the two activator solutions was small. However, the kinetics of absorption seemed to differ; in slag and NaOH solution, the biochar showed a rapid initial increase followed by a small reduction and then reached a plateau; on the other hand, in slag and Na2CO3 solution, the biochar showed a rapid initial increase followed by a slower increase in absorption.
  • The heat flow peak was delayed in the pastes with biochar, compared to the pastes without biochar, but the cumulative heat release was higher at later hours in the pastes with biochar, compared to the pastes without biochar.
  • The pastes with biochar showed a reduced autogenous shrinkage, compared to the pastes without biochar, and this effect was more pronounced in the pastes activated with NaOH solution than the paste activated with Na2CO3 solution.
  • In the pastes with biochar, micro-CT analysis indicated a slightly higher increase in the number of and the porosity of the voids larger than 30 μm in the paste activated with the NaOH solution, compared to the Na2CO3 solution.
  • It was found that the compressive strength of most pastes was slightly increased when biochar was added. The pore structure refinement due to reduced solution/slag is believed to compensate for the negative effect of biochar voids on compressive strength in the pastes.
  • The pastes with biochar demonstrated a lower electrical resistivity, compared to the pastes without biochar. This unexpected behavior could be due to the conductive nature of biochar decreasing the overall resistivity of the pastes.

Author Contributions

A.G. and B.V. conceived of and designed the experiments. J.P. and E.B. performed the experiments. A.G. and B.V. analyzed the data. A.G. wrote the paper. All authors have read and agreed to the published version of the manuscript.

Funding

The micro-CT imaging was made possible by the National Science Foundation under the MRI award number 1920127.

Data Availability Statement

The data presented in this study are available on request from the corresponding author.

Acknowledgments

Sadegh Tale Masoule is hereby thanked for assistance with the micro-CT analysis.

Conflicts of Interest

The authors declare no conflict of interest.

References

  1. Li, Z.; Wyrzykowski, M.; Dong, H.; Granja, J.; Azenha, M.; Lura, P.; Ye, G. Internal curing by superabsorbent polymers in alkali-activated slag. Cem. Concr. Res. 2020, 135, 106123. [Google Scholar] [CrossRef]
  2. Provis, J.L. Alkali-activated materials. Cem. Concr. Res. 2018, 114, 40–48. [Google Scholar] [CrossRef]
  3. Duxson, P.; Provis, J.L.; Lukey, G.C.; Van Deventer, J.S.J. The role of inorganic polymer technology in the development of ‘green concrete’. Cem. Concr. Res. 2007, 37, 1590–1597. [Google Scholar] [CrossRef]
  4. Sakulich, A.R.; Anderson, E.; Schauer, C.; Barsoum, M.W. Mechanical and microstructural characterization of an alkali-activated slag/limestone fine aggregate concrete. Constr. Build. Mater. 2009, 23, 2951–2957. [Google Scholar] [CrossRef]
  5. Bakharev, T.; Sanjayan, J.; Cheng, Y.-B. Resistance of alkali-activated slag concrete to acid attack. Cem. Concr. Res. 2003, 33, 1607–1611. [Google Scholar] [CrossRef]
  6. Hi, C.; Krivenko, P.; Roy, D. Alkali-Activated Cements and Concrete; Taylor and Francis: New York, NY, USA, 2006. [Google Scholar]
  7. Cartwright, C.; Rajabipour, F.; Radlińska, A. Shrinkage Characteristics of Alkali-Activated Slag Cements. J. Mater. Civ. Eng. 2015, 27, 1–9. [Google Scholar] [CrossRef]
  8. Ye, H.; Cartwright, C.; Rajabipour, F.; Radlińska, A. Understanding the drying shrinkage performance of alkali-activated slag mortars. Cem. Concr. Compos. 2017, 76, 13–24. [Google Scholar] [CrossRef] [Green Version]
  9. Sakulich, A.R.; Bentz, D.P. Mitigation of autogenous shrinkage in alkali activated slag mortars by internal curing. Mater. Struct. 2012, 46, 1355–1367. [Google Scholar] [CrossRef]
  10. Palacios, M.; Puertas, F. Effect of shrinkage-reducing admixtures on the properties of alkali-activated slag mortars and pastes. Cem. Concr. Res. 2007, 37, 691–702. [Google Scholar] [CrossRef]
  11. Collins, F.; Sanjayan, J. Effect of pore size distribution on drying shrinking of alkali-activated slag concrete. Cem. Concr. Res. 2000, 30, 1401–1406. [Google Scholar] [CrossRef]
  12. Neto, A.M.; Cincotto, M.A.; Repette, W. Drying and autogenous shrinkage of pastes and mortars with activated slag cement. Cem. Concr. Res. 2008, 38, 565–574. [Google Scholar] [CrossRef]
  13. Neto, A.A.M.; Cincotto, M.A.; Repette, W. Mechanical properties, drying and autogenous shrinkage of blast furnace slag activated with hydrated lime and gypsum. Cem. Concr. Compos. 2010, 32, 312–318. [Google Scholar] [CrossRef]
  14. Atiş, C.D.; Bilim, C.; Çelik, Ö.; Karahan, O. Influence of activator on the strength and drying shrinkage of alkali-activated slag mortar. Constr. Build. Mater. 2009, 23, 548–555. [Google Scholar] [CrossRef]
  15. Bakharev, T.; Sanjayan, J.; Cheng, Y.-B. Effect of elevated temperature curing on properties of alkali-activated slag concrete. Cem. Concr. Res. 1999, 29, 1619–1625. [Google Scholar] [CrossRef]
  16. Ye, H.; Radlińska, A. Shrinkage mechanisms of alkali-activated slag. Cem. Concr. Res. 2016, 88, 126–135. [Google Scholar] [CrossRef] [Green Version]
  17. Oh, S.; Choi, Y.C. Superabsorbent polymers as internal curing agents in alkali activated slag mortars. Constr. Build. Mater. 2018, 159, 1–8. [Google Scholar] [CrossRef]
  18. Vafaei, B.; Farzanian, K.; Ghahremaninezhad, A. The influence of superabsorbent polymer on the properties of alkali-activated slag pastes. Constr. Build. Mater. 2020, 236, 117525. [Google Scholar] [CrossRef]
  19. Song, C.; Choi, Y.C.; Choi, S. Effect of internal curing by superabsorbent polymers—Internal relative humidity and autogenous shrinkage of alkali-activated slag mortars. Constr. Build. Mater. 2016, 123, 198–206. [Google Scholar] [CrossRef]
  20. Krafcik, M.J.; Erk, K.A. Characterization of superabsorbent poly(sodium-acrylate acrylamide) hydrogels and influence of chemical structure on internally cured mortar. Mater. Struct. 2016, 49, 4765–4778. [Google Scholar] [CrossRef]
  21. Bentur, A.; Igarashi, S.-I.; Kovler, K. Prevention of autogenous shrinkage in high-strength concrete by internal curing using wet lightweight aggregates. Cem. Concr. Res. 2001, 31, 1587–1591. [Google Scholar] [CrossRef]
  22. Mignon, A.; Snoeck, D.; Dubruel, P.; Van Vlierberghe, S.; De Belie, N. Crack Mitigation in Concrete: Superabsorbent Polymers as Key to Success? Materials 2017, 10, 237. [Google Scholar] [CrossRef] [Green Version]
  23. Mechtcherine, V.; Reinhardt, H.-W. Application of Super Absorbent Polymers (SAP) in Concrete Construction; Springer: Berlin, Germany, 2012. [Google Scholar]
  24. Igarashi, S.; Watanabe, A. Experimental study on prevention of autogenous deformation by internal curing using super-absorbent polymer particles. In Proceedings of the International RILEM Conference on Volume Changes of Hardening Concrete: Testing and Mitigation, RILEM Proceedings PRO 052; RILEM Publications S.A.R.L.: Bagneux, France, 2006; pp. 77–86. [Google Scholar]
  25. Schröfl, C.; Mechtcherine, V.; Gorges, M. Relation between the molecular structure and the efficiency of superabsorbent polymers (SAP) as concrete admixture to mitigate autogenous shrinkage. Cem. Concr. Res. 2012, 42, 865–873. [Google Scholar] [CrossRef]
  26. Justs, J.; Wyrzykowski, M.; Bajare, D.; Lura, P. Internal curing by superabsorbent polymers in ultra-high performance concrete. Cem. Concr. Res. 2015, 76, 82–90. [Google Scholar] [CrossRef]
  27. Jensen, O.M.; Hansen, P.F. Water-entrained cement-based materials II. Experimental observations. Cem. Concr. Res. 2002, 32, 973–978. [Google Scholar] [CrossRef]
  28. Dixit, A.; Gupta, S.; Pang, S.D.; Kua, H.W. Waste Valorisation using biochar for cement replacement and internal curing in ultra-high performance concrete. J. Clean. Prod. 2019, 238, 117876. [Google Scholar] [CrossRef]
  29. Gupta, S.; Kua, H.W. Effect of water entrainment by pre-soaked biochar particles on strength and permeability of cement mortar. Constr. Build. Mater. 2018, 159, 107–125. [Google Scholar] [CrossRef]
  30. Choi, W.C.; Yun, H.D.; Lee, J.Y. Mechanical Properties of Mortar Containing Bio-Char From Pyrolysis. J. Korea Inst. Struct. Maint. Insp. 2012, 16, 67–74. [Google Scholar] [CrossRef] [Green Version]
  31. Gupta, S.; Kua, H.W.; Pang, S.D. Biochar-mortar composite: Manufacturing, evaluation of physical properties and economic viability. Constr. Build. Mater. 2018, 167, 874–889. [Google Scholar] [CrossRef]
  32. Roberts, K.G.; Gloy, B.A.; Joseph, S.; Scott, N.R.; Lehmann, J. Life Cycle Assessment of Biochar Systems: Estimating the Energetic, Economic, and Climate Change Potential. Environ. Sci. Technol. 2010, 44, 827–833. [Google Scholar] [CrossRef]
  33. Zhu, Q.; Barney, C.W.; Erk, K.A. Effect of ionic crosslinking on the swelling and mechanical response of model superabsorbent polymer hydrogels for internally cured concrete. Mater. Struct. 2014, 48, 2261–2276. [Google Scholar] [CrossRef]
  34. Siriwatwechakul, W.; Siramanont, J.; Vichit-Vadakan, W. Behavior of Superabsorbent Polymers in Calcium- and Sodium-Rich Solutions. J. Mater. Civ. Eng. 2012, 24, 976–980. [Google Scholar] [CrossRef]
  35. Jain, J.A.; Neithalath, N. Chloride transport in fly ash and glass powder modified concretes—Influence of test methods on microstructure. Cem. Concr. Compos. 2010, 32, 148–156. [Google Scholar] [CrossRef]
  36. Neithalath, N.; Weiss, W.; Olek, J. Characterizing Enhanced Porosity Concrete using electrical impedance to predict acoustic and hydraulic performance. Cem. Concr. Res. 2006, 36, 2074–2085. [Google Scholar] [CrossRef]
  37. Praneeth, S.; Saavedra, L.; Zeng, M.; Dubey, B.K.; Sarmah, A.K. Biochar admixtured lightweight, porous and tougher cement mortars: Mechanical, durability and micro computed tomography analysis. Sci. Total Environ. 2021, 750, 142327. [Google Scholar] [CrossRef]
  38. Zhong, P.; Wang, J.; Wang, X.; Liu, J.; Li, Z.; Zhou, Y. Comparison of Different Approaches for Testing Sorption by a Superabsorbent Polymer to Be Used in Cement-Based Materials. Materials 2020, 13, 5015. [Google Scholar] [CrossRef] [PubMed]
  39. Brough, A.R.; Atkinson, A. Sodium silicate-based, alkali-activated slag mortars—Part I. Strength, hydration and microstructure. Cem. Concr. Res. 2002, 32, 865–879. [Google Scholar] [CrossRef]
  40. Shi, C. Strength, pore structure and permeability of alkali-activated slag mortars. Cem. Concr. Res. 1996, 26, 1789–1799. [Google Scholar] [CrossRef]
  41. Collins, F.; Sanjayan, J. Microcracking and strength development of alkali activated slag concrete. Cem. Concr. Compos. 2001, 23, 345–352. [Google Scholar] [CrossRef]
  42. Sakulich, A.; Miller, S.; Barsoum, M.W. Chemical and Microstructural Characterization of 20-Month-Old Alkali-Activated Slag Cements. J. Am. Ceram. Soc. 2010, 93, 1741–1748. [Google Scholar] [CrossRef]
  43. Komnitsas, K.; Zaharaki, D.; Perdikatsis, V. Effect of synthesis parameters on the compressive strength of low-calcium ferronickel slag inorganic polymers. J. Hazard. Mater. 2009, 161, 760–768. [Google Scholar] [CrossRef]
Figure 1. SEM micrograph of biochar.
Constrmater 02 00001 g001
Figure 2. EDS elemental analysis of biochar.
Constrmater 02 00001 g002
Figure 3. FTIR spectrum of biochar.
Constrmater 02 00001 g003
Figure 4. Absorption of biochar in the activator solutions using the teabag test.
Constrmater 02 00001 g004
Figure 5. Absorption of biochar in the activator solution + slag mixtures using the modified teabag test.
Constrmater 02 00001 g005
Figure 6. (a) Heat flow and (b) cumulative heat release corresponding to the pastes with and without biochar.
Constrmater 02 00001 g006
Figure 7. Autogenous shrinkage of the pastes with and without biochar.
Constrmater 02 00001 g007
Figure 8. A 2D representation of reconstructed void structure of (a) NC and (b) NC-B using micro-CT.
Constrmater 02 00001 g008
Figure 9. TGA curves of the pastes with and without biochar.
Constrmater 02 00001 g009
Figure 10. Compressive strength of the pastes with and without biochar.
Constrmater 02 00001 g010
Figure 11. Electrical resistivity of the pastes with and without biochar.
Constrmater 02 00001 g011
Table 1. Oxide composition of slag.
Composition(%)
SiO231.62
Al2O311.01
FexOy0.92
CaO44.57
MgO6.45
Na2O0.17
K2O0.41
SO33.13
LOI1.14
Table 2. Mix designs of the alkali-activated slag pastes.
DesignationWater/SlagWater-Reducing Admixture (% per Slag Mass)Biochar (% per Slag Mass)Water (g)NaOH (g)Na2CO3 (g)
NO0.440.17-1760124.8-
NO-B0.440.171.541760124.8-
NC0.680.17-1760-534.2
NC-B0.680.171.631760-534.2
Table 3. Setting times of the pastes with and without biochar.
Paste DesignationInitial Setting Time (min)Final Setting Time (min)
NO223445
NO-B341651
NC306474
NC-B248405
Table 4. Porosity and number of the voids larger than 30 μm in the pastes.
Paste DesignationPorosity (%)Number of Voids
NO0.958684
NO-B5.752,197
NC0.5810,084
NC-B4.1535,819
Publisher’s Note: MDPI stays neutral with regard to jurisdictional claims in published maps and institutional affiliations.

