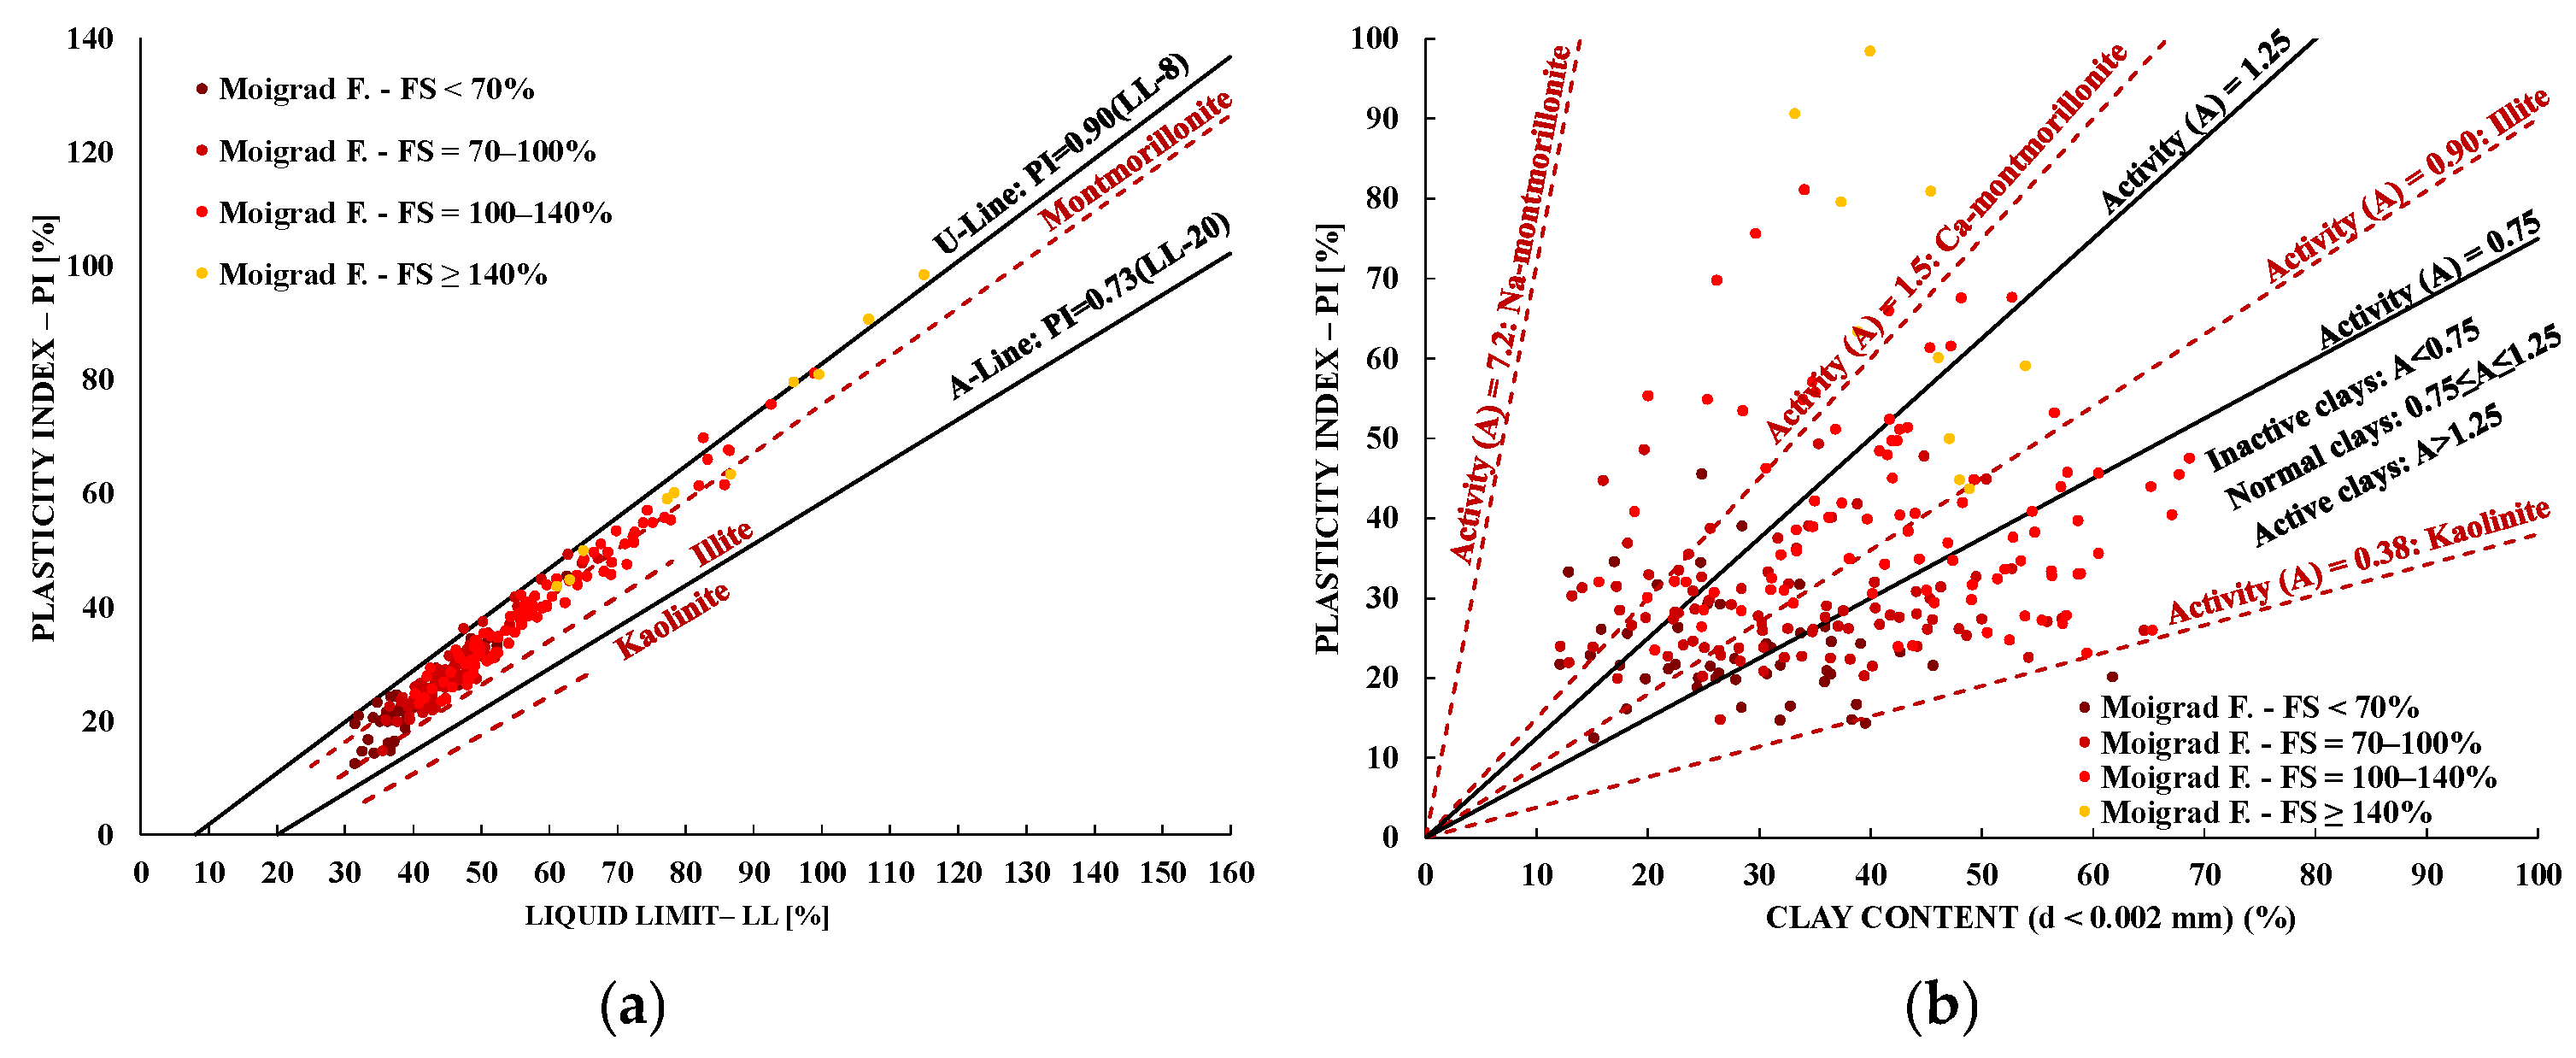
Indirect techniques included plotting of the samples on the Casagrande (1948) plasticity chart [
6], supplemented with characteristic lines for major clay minerals (Holtz and Kovacs, 1981 [
7]), and correlating the activity index (AI) with clay content, following the Skempton (1953) classification [
8]. Indirect indices (LL, PI, AI, and clay fraction <2 µm) provide a behavioral proxy for clay–water interactions, but they are non-unique: they integrate mineralogy with fabric, cementation, and dilution by non-clay phases. Therefore, mineralogical inference from Casagrande [
6]/Skempton [
8] charts should be treated as probabilistic rather than deterministic. XRD offers an independent benchmark by directly identifying the crystalline phases and by quantifying (semi-quantitatively) the relative abundance of expandable components. To make the two approaches comparable, the most relevant metric is not the bulk wt% of smectite alone (which can be strongly diluted by quartz/feldspars/carbonates), but the expandable proportion within the clay-mineral pool, i.e., (montmorillonite + mixed-layer montmorillonite–chlorite) normalized by total clay minerals (expandables + illite/muscovite + chlorite + kaolinite). This normalization links directly to AI, which is also defined per unit clay fraction. Within this framework, agreement (or divergence) between XRD and indirect indices can be interpreted mechanistically: high swelling may reflect either (i) a higher expandable fraction and/or (ii) a higher volumetric continuity of the clay matrix, while carbonates primarily act as microstructural constraints (cementation/aggregation) that decouple mineralogical potential from the expressed free swell.
Accordingly, the mismatch between index-based swelling susceptibility and measured free swell (FS) reflects physico-chemical and microstructural mediation of clay–water interaction rather than lithology alone. Index property charts (LL–PI, PI–clay, and AI–clay content) are proxies that combine mineralogical predisposition with fabric state, cementation, and dilution by non-clay phases; they can therefore indicate a high susceptibility even when the macroscopic strain is partly restrained. This is particularly relevant in carbonate-affected deposits, where CaCO3-related bonding/cementation and aggregate stiffening reduce the volumetric continuity and deformability of the active clay matrix and may limit water access at the specimen scale. Consequently, FS captures the effective expression of swelling under the existing pore-scale conditions and fabric constraints, whereas empirical indices primarily reflect a potential of swelling.
Mixed-layer montmorillonite–chlorite (Mnt–Chl) interstratifications indicate the presence of partially expandable phyllosilicate assemblages, in which smectitic interlayers alternate with chloritic (non-expandable) layers. Such mixed-layer structures may still contribute to swelling because hydration of the smectitic component promotes interlayer expansion; however, the chloritic component tends to impose microstructural restraint, such that the expressed swelling is commonly lower than for separate montmorillonite phases at comparable bulk abundance. X-ray diffraction (XRD) is suitable for identifying Mnt–Chl through characteristic basal-reflection behavior in oriented mounts, including shifts upon ethylene glycol solvation and collapse/thermal response upon heating. Nevertheless, in semi-quantitative bulk (RIR-based) datasets, the precise proportion of smectitic layers within Mnt–Chl cannot be robustly constrained due to peak overlap, preferred orientation effects, and variability in mixed-layer ordering. Accordingly, Mnt–Chl is grouped here with montmorillonite as part of the potentially expandable fraction, and its relevance is interpreted at formation scale rather than used for specimen-level prediction of free swell (FS).
5.1. Brebi Formation
For the Brebi Formation, free swell values range from 50% to 135% (
Table 1), indicating a low-to-active swelling activity, without reaching the “very active” domain (FS ≥ 140%) defined by NP 126:2010 [
5]. According to NP 126:2010 [
5], based on free swell behavior the formation comprises soils with low activity (FS < 70%), medium activity (FS = 70–100%), and active soils (FS = 100–140%), while no very active soils (FS ≥ 140%) were identified. The distribution across FS classes shows that most specimens fall within the medium- and active-activity classes (41.2% and 36.5%, respectively), whereas the low-activity category is less represented (22.4%). This distribution suggests that expansivity is not an isolated behavior controlled by a few particular strata, but rather a recurrent property of the formation, expressed to varying degrees depending on internal deposit variations (fine-grained lithology, degree of cementation, and matrix homogeneity/heterogeneity).
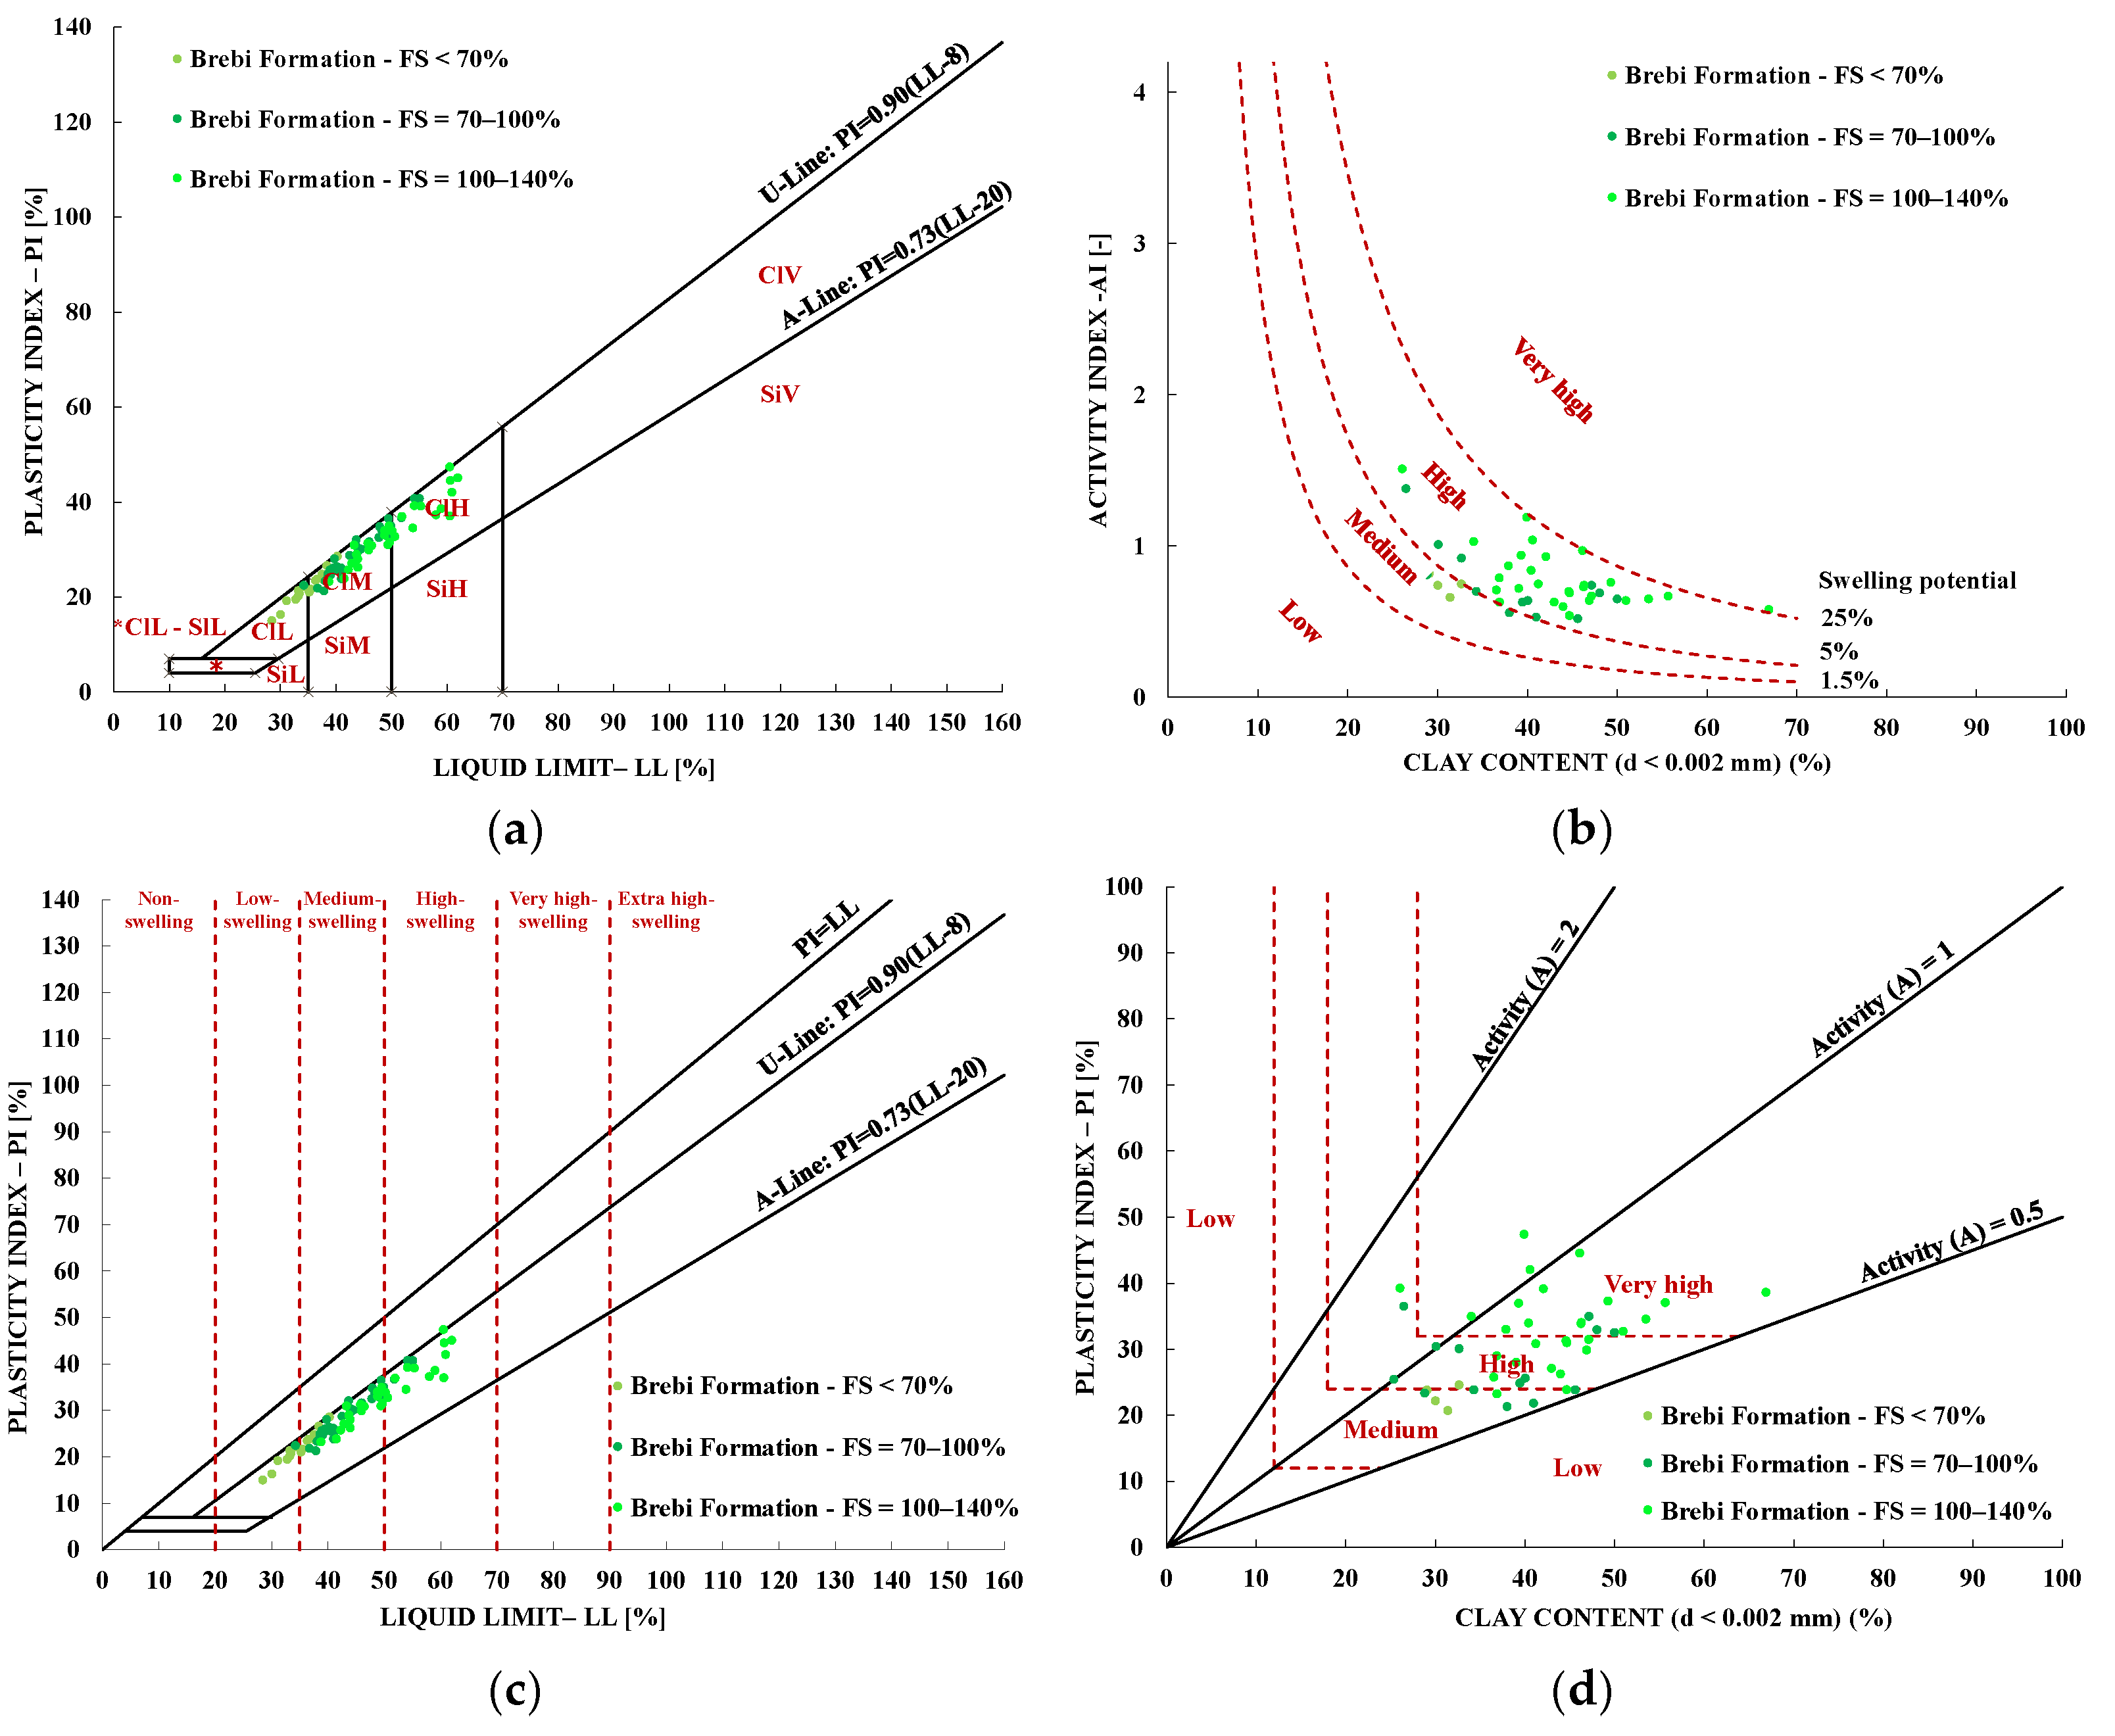
The classification of specimens by FS classes shows that, as free swell increases, the materials tend to occur more frequently within higher-plasticity domains (from CIL/CIM towards the CIM–CIH range). This trend is consistent with an increased water-retention capacity and the more pronounced role of the fine parts in governing volumetric behavior. However, the activity index (AI) does not exhibit the same pattern: the mean values remain relatively similar across the FS classes and generally fall within the range proposed by Skempton (1953) [
8] for inactive to normally active clays (
Figure 10b). This contrasting evolution of FS and AI suggests that the intensification of swelling within the Brebi Formation does not necessarily reflect a major shift in the dominant clay mineralogy, but rather the combined effects of clay-fraction content (continuity of the fine matrix and water distribution within the mass) and microstructural controls (e.g., localized stiffening/cementation), which may either amplify or constrain the volumetric response to wetting.
Building on this interpretation, it is useful for the Brebi Formation to distinguish between: (i) the influence of the clay fraction and (ii) the structural conditions that govern how this potential is expressed at the material scale. In practical terms, the activity index (AI) (Skempton, 1953) [
8] serves as an indicator of the plastic behavior of the <2 µm fraction normalized by clay content, and thus primarily reflects the nature and reactivity of this fraction. By contrast, free swell (FS) directly quantifies macroscopic volumetric deformation, integrating not only mineralogical effects but also the amount of fine matrix, its distribution within the soil skeleton, and intergranular bonding (cementation) that may impose constraints on deformation. In this context, for Brebi, the fact that AI remains on average within the range of inactive to normally active clays, whereas FS locally indicates active soil behavior (NP 126:2010 [
5]), supports the view that expansivity variability is controlled mainly by clay-fraction proportion and microstructure, rather than by a major change in the expansive mineralogy (
Figure 10b).
Against this background, calcium carbonate (CaCO
3) should be interpreted as a factor that attenuates the manifestation of expansivity through structural effects, rather than as a direct predictor of swelling potential. The statistical correlations indicate a tendency for both FS and AI to decrease with increasing CaCO
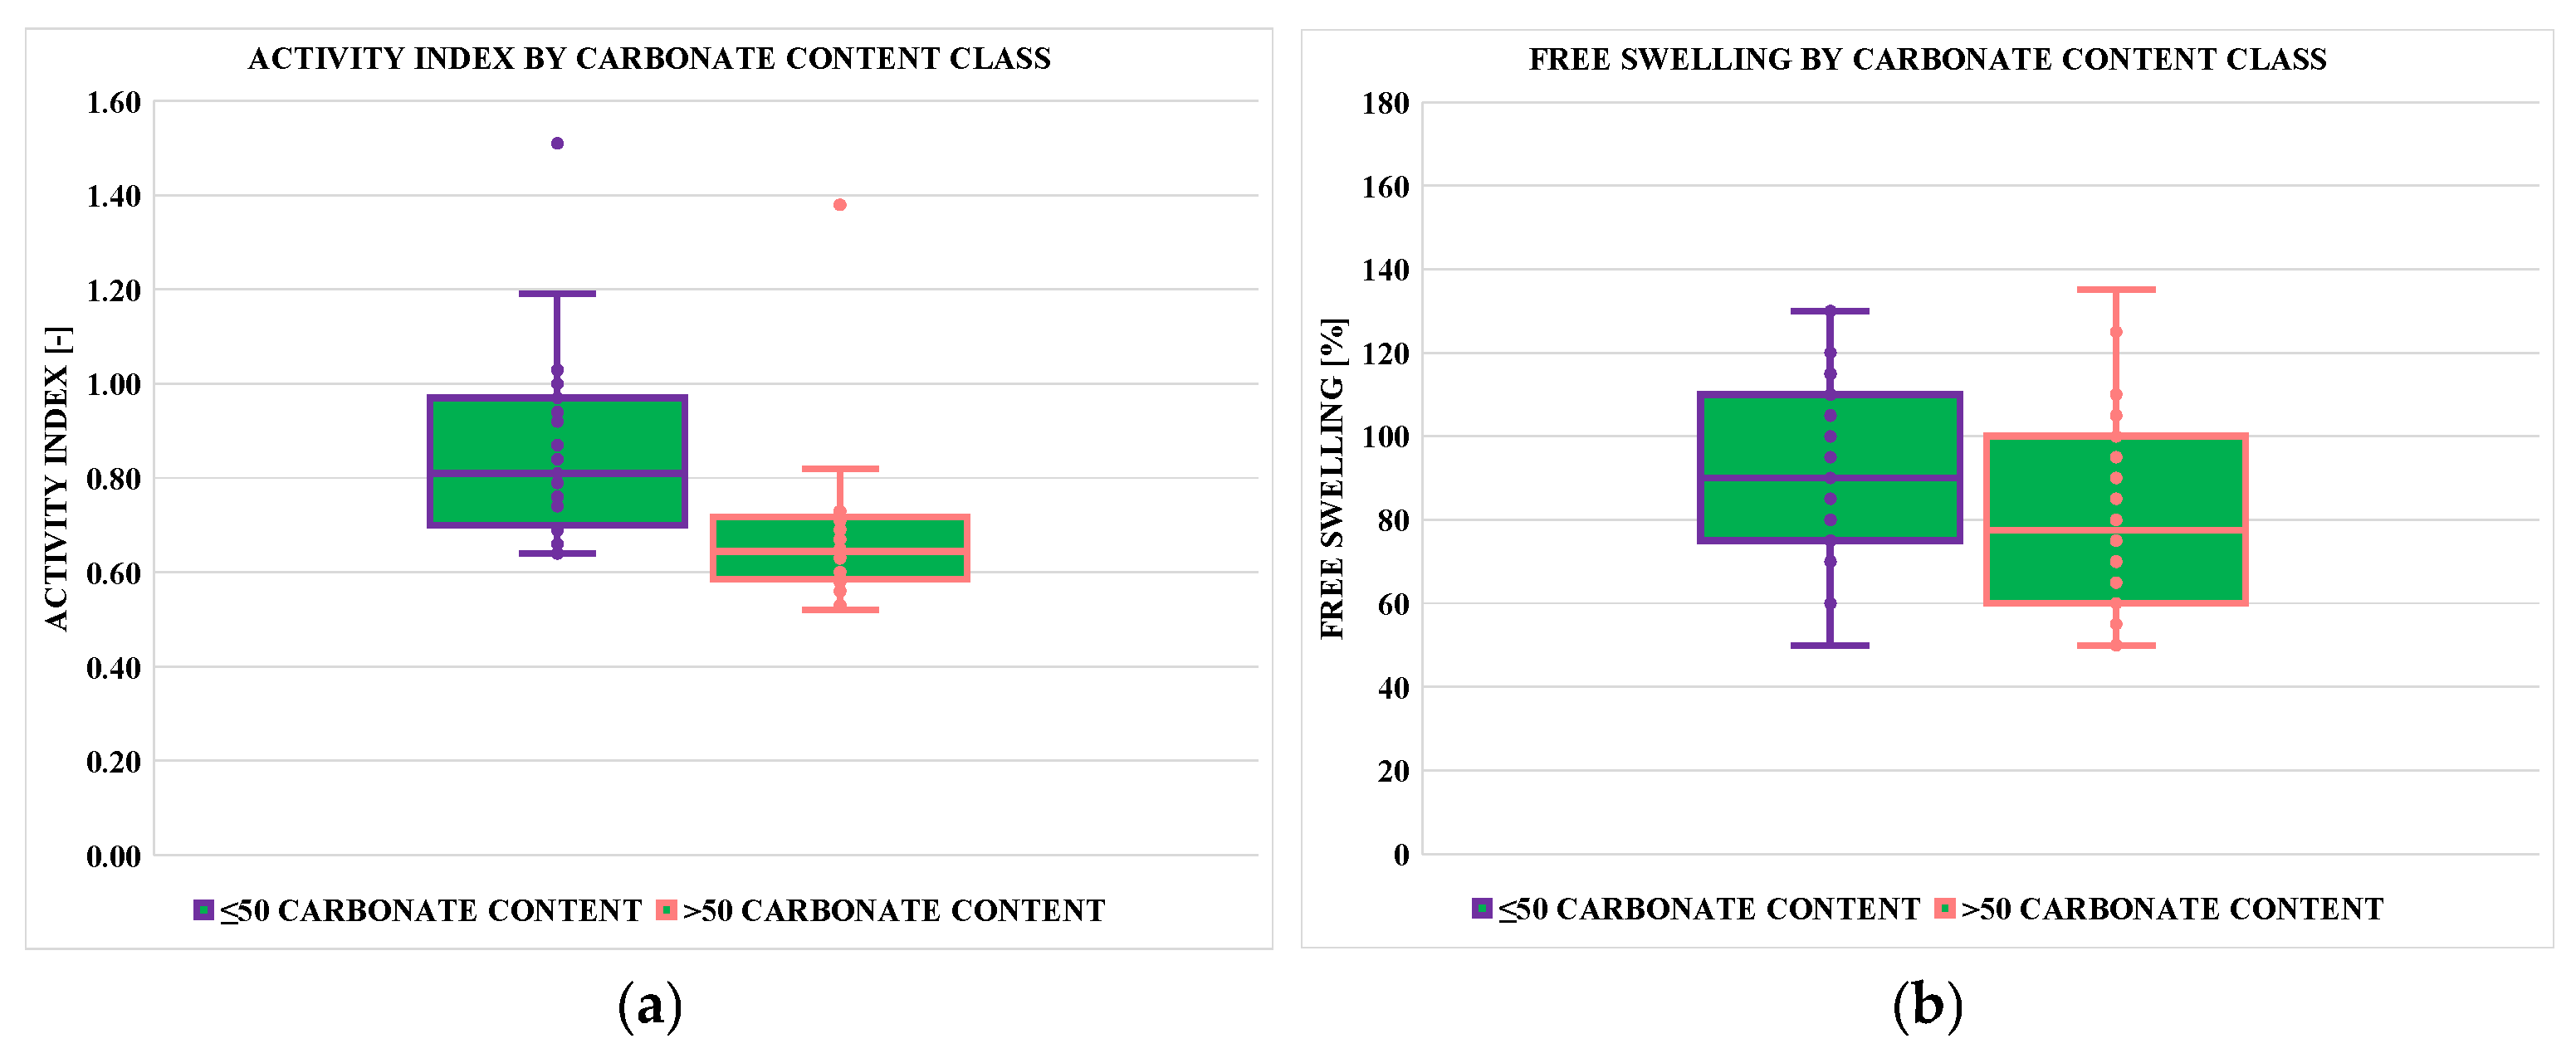
3, which is mechanistically plausible through two complementary processes: (i) intergranular carbonate cementation, which increases skeleton stiffness and limits volume changes of the fine matrix; and (ii) localized coating/impregnation of clay surfaces by carbonate phases, which reduces water access and diminishes the effective hydration of aggregates. As a result, more carbonate-rich specimens tend to exhibit a more constrained volumetric response, even where the clay fraction remains sufficient to generate swelling. Therefore, in the Brebi Formation, increasing continuity of the clay matrix (i.e., a higher <2 µm fraction) promotes higher FS, whereas carbonates act in the opposite sense by reinforcing the microstructure and reducing volumetric deformability (
Figure 4a,b; [
37]).
In parallel with the direct assessment provided by FS, empirical classification schemes also confirm the expansive character of the Brebi Formation, while revealing systematic differences among methods (
Figure 3b–d). Approaches that explicitly account for clay content tend to yield higher estimates of swell susceptibility: the Van der Merwe (1964) method [
10], based on the PI–clay fraction relationship, and the Seed et al. (1962) method [
9], which relates AI to clay content, place a substantial proportion of specimens in the higher expansivity classes. By contrast, the Dakshanamurthy and Raman (1973) classification [
11], founded solely on Atterberg limits (LL, PI), results in a more moderate rating for the same materials.
This divergence is geotechnically explainable and, for the Brebi Formation, appears relevant to the distinction between swelling potential and its effective expression. Methods that are sensitive to the clay fraction (Seed [
9]; Van der Merwe [
10]) better capture the “volumetric” component of susceptibility, i.e., the capacity of a more abundant fine matrix to retain water and generate larger strains. However, for Brebi, the direct FS response indicates a medium- to highly swelling activity without reaching the “very active” domain (FS ≥ 140%), suggesting the presence of microstructural constraints on swelling. In a material with elevated carbonate content, cementation/stiffening effects may limit dilation of the fine matrix and reduce the magnitude of volumetric deformation. Consequently, clay-inclusive classifications can be interpreted as more conservative—reflecting a higher potential—whereas the LL–PI-based classification (Dakshanamurthy and Raman [
11]) may better approximate the effective behavior evidenced by FS under the existing fabric/structure. Therefore, for the Brebi Formation, the combined use of these methods is justified: Seed [
9] and Van der Merwe [
10] characterize susceptibility associated with the fine fraction, while Dakshanamurthy and Raman [
11] provide an estimate closer to the observed global response when microstructure (including the influence of CaCO
3) modulates the expression of swelling (
Figure 3b–d and
Figure 4a,b).
Building on the interpretation that distinguishes between the volumetric response (FS) and clay-fraction activity indicators (AI), the mineralogical inferences drawn from empirical charts should be understood as having different levels of specificity. For Brebi, the key observation is a partial decoupling between swelling expression (FS) and clay-fraction “reactivity” indicators (AI): while FS spans 50–135% (NP 126:2010 [
5] low-to-active range; no very active soils, FS ≥ 140%), AI remains, on average, within the inactive-to-normally active range. This pattern is consistent with a relatively stable clay-mineral assemblage across the formation, where differences in FS are driven predominantly by the amount/continuity of the fine matrix and fabric-related constraints, rather than by a formation-scale increase in expansive clay mineralogy. In carbonate-bearing clays, this decoupling is expected because swelling strain integrates mineralogical potential with the stiffness and bonding of the skeleton.
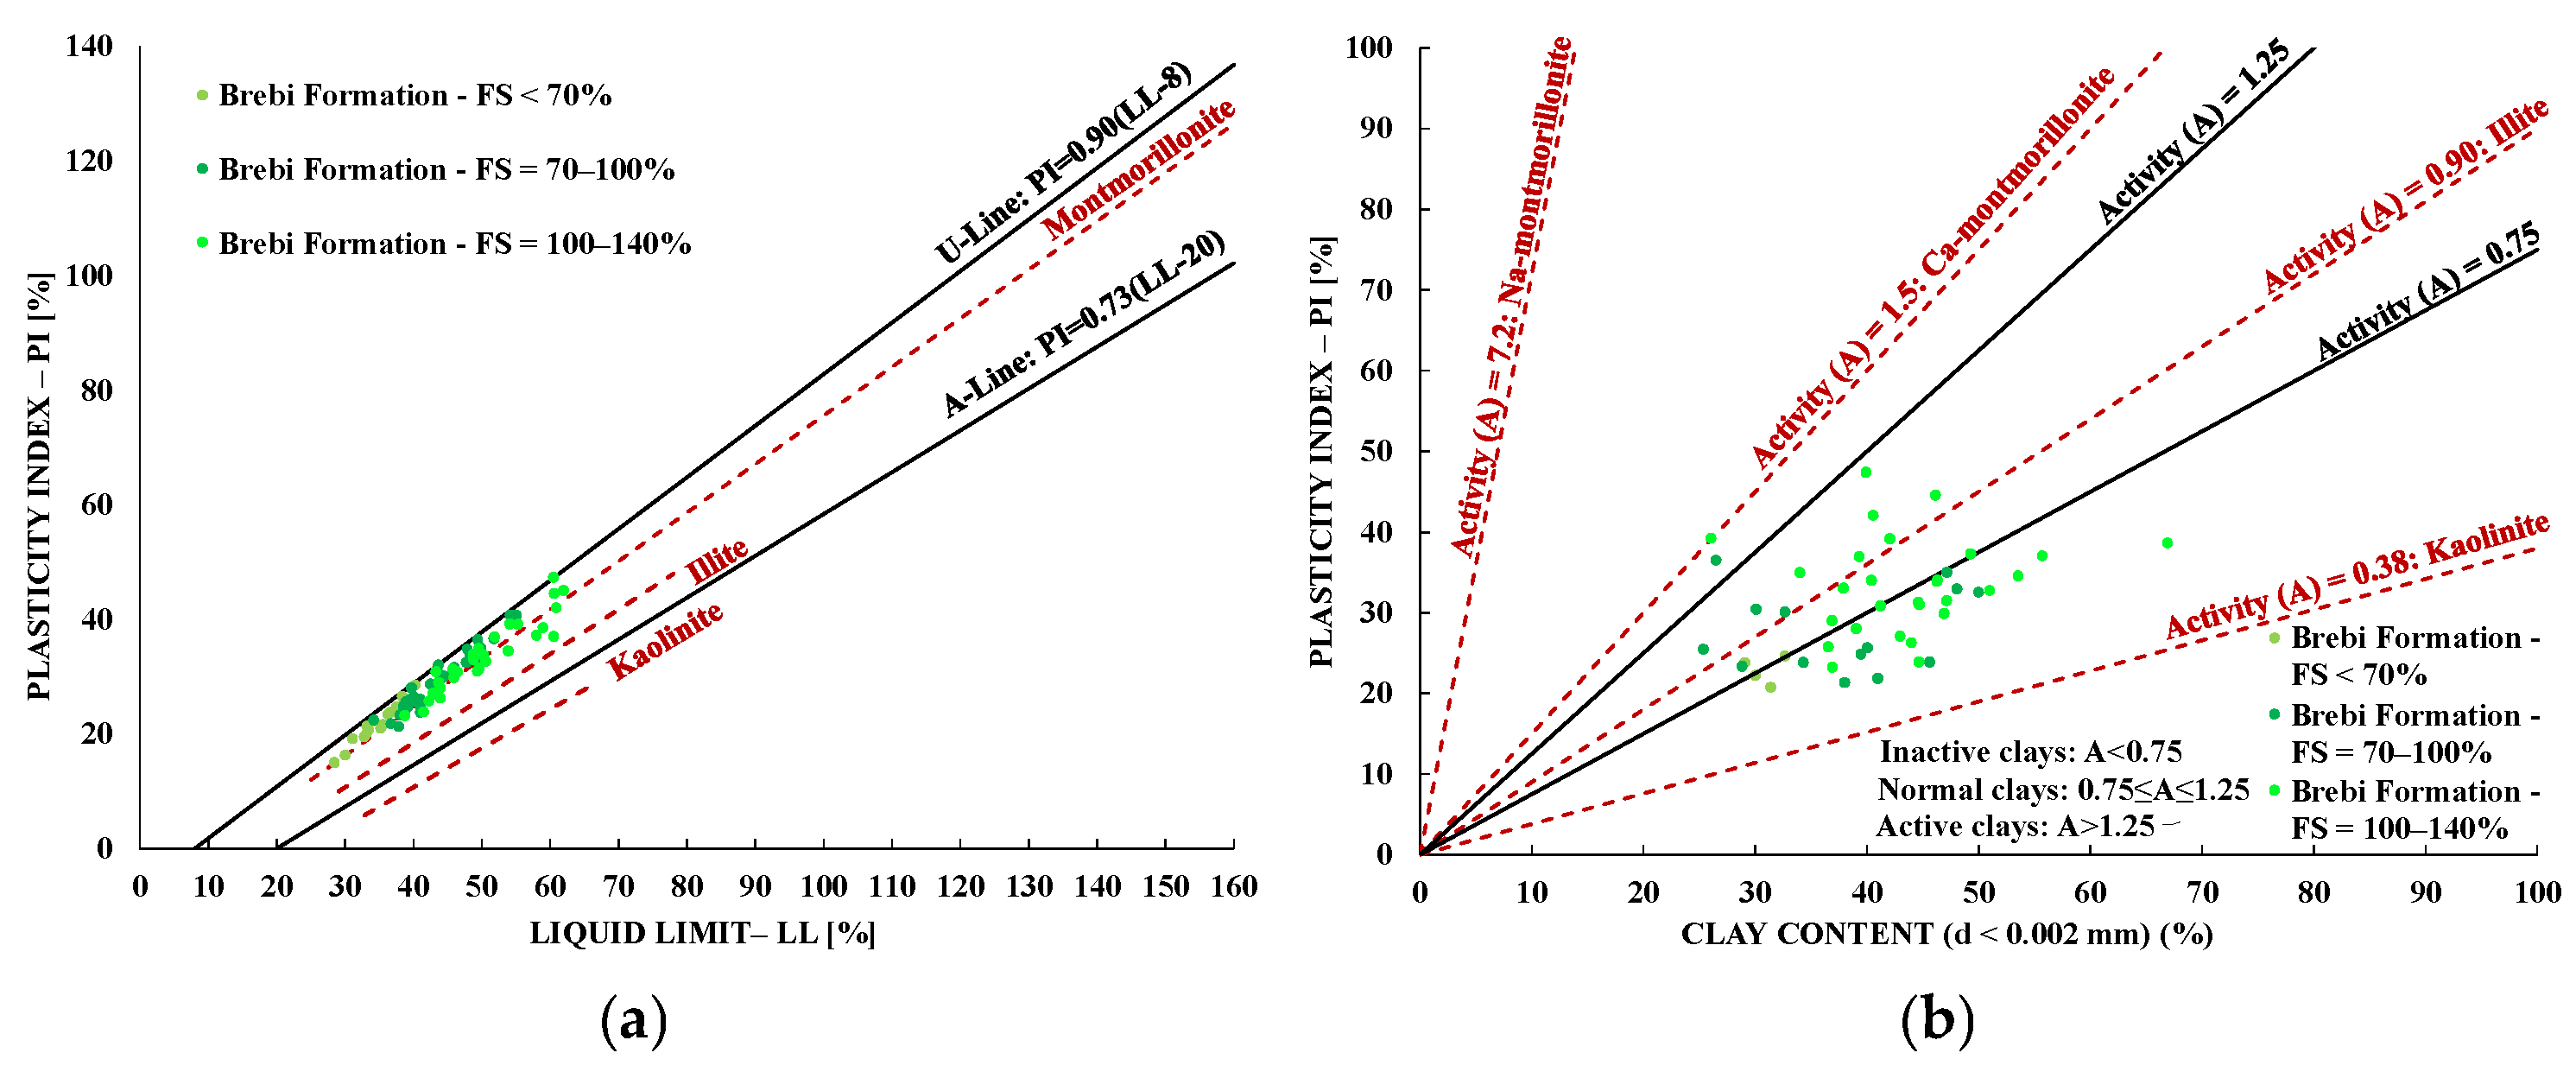
For the Brebi Formation, the Casagrande (1948) plasticity chart [
6], supplemented with the indicative fields proposed by Holtz and Kovacs (1981) [
7] (
Figure 10a), suggests a smectitic influence on plastic behavior. However, this representation remains essentially behavioral: the LL–PI position is jointly controlled by overall plasticity, the amount of fines, and fabric-related features (aggregation/dispersion), and in carbonate-rich deposits it may also be influenced by microstructural effects (stiffening/cementation) that modify the expression of plasticity. Therefore, for Brebi, the signal in
Figure 10a should be interpreted primarily as indicating that a smectitic component (even if subordinate) may affect plasticity, rather than implying that smectites mineralogically dominate the clay fraction at the formation scale. The indirect mineralogical fields on the Casagrande chart should therefore be interpreted cautiously for Brebi: LL–PI position reflects bulk plasticity behavior, but carbonate cementation and aggregate structure can shift the apparent plasticity response without requiring a major change in clay mineral species.
By contrast, for estimating the mineralogical composition of the clay fraction, Skempton’s activity chart [
8] (
Figure 10b) is arguably more informative and relevant, because it relates plasticity (PI) to clay content (<2 µm) and thus captures the reactivity of the clay fraction more directly. In Brebi, the placement of AI within the inactive-to-normally active clay range is consistent with the interpretation discussed above: a predominantly illitic mineralogical background, with local/subordinate smectitic contributions, upon which the expansive behavior measured by FS is amplified by the proportion and continuity of the fine matrix and modulated by structural effects associated with CaCO
3. Within this framework, the two charts are not contradictory, but they carry different evidential weight: the Casagrande chart [
6] (with the Holtz and Kovacs fields [
7]) provides a broad indication of plastic behavior, whereas the Skempton chart [
8] offers a more robust basis for mineralogical inference regarding the <2 µm fraction (
Figure 10b). The relatively modest AI values argue against a smectite-dominated clay fraction and are consistent with subordinate expandable contributions within an overall illitic background. Accordingly, for Brebi, Skempton’s activity concept [
8] provides a closer formation-scale match to the XRD mineralogy than the Casagrande mineralogical fields (Casagrande [
6] complemented by Holtz and Kovacs (1981) [
7]).
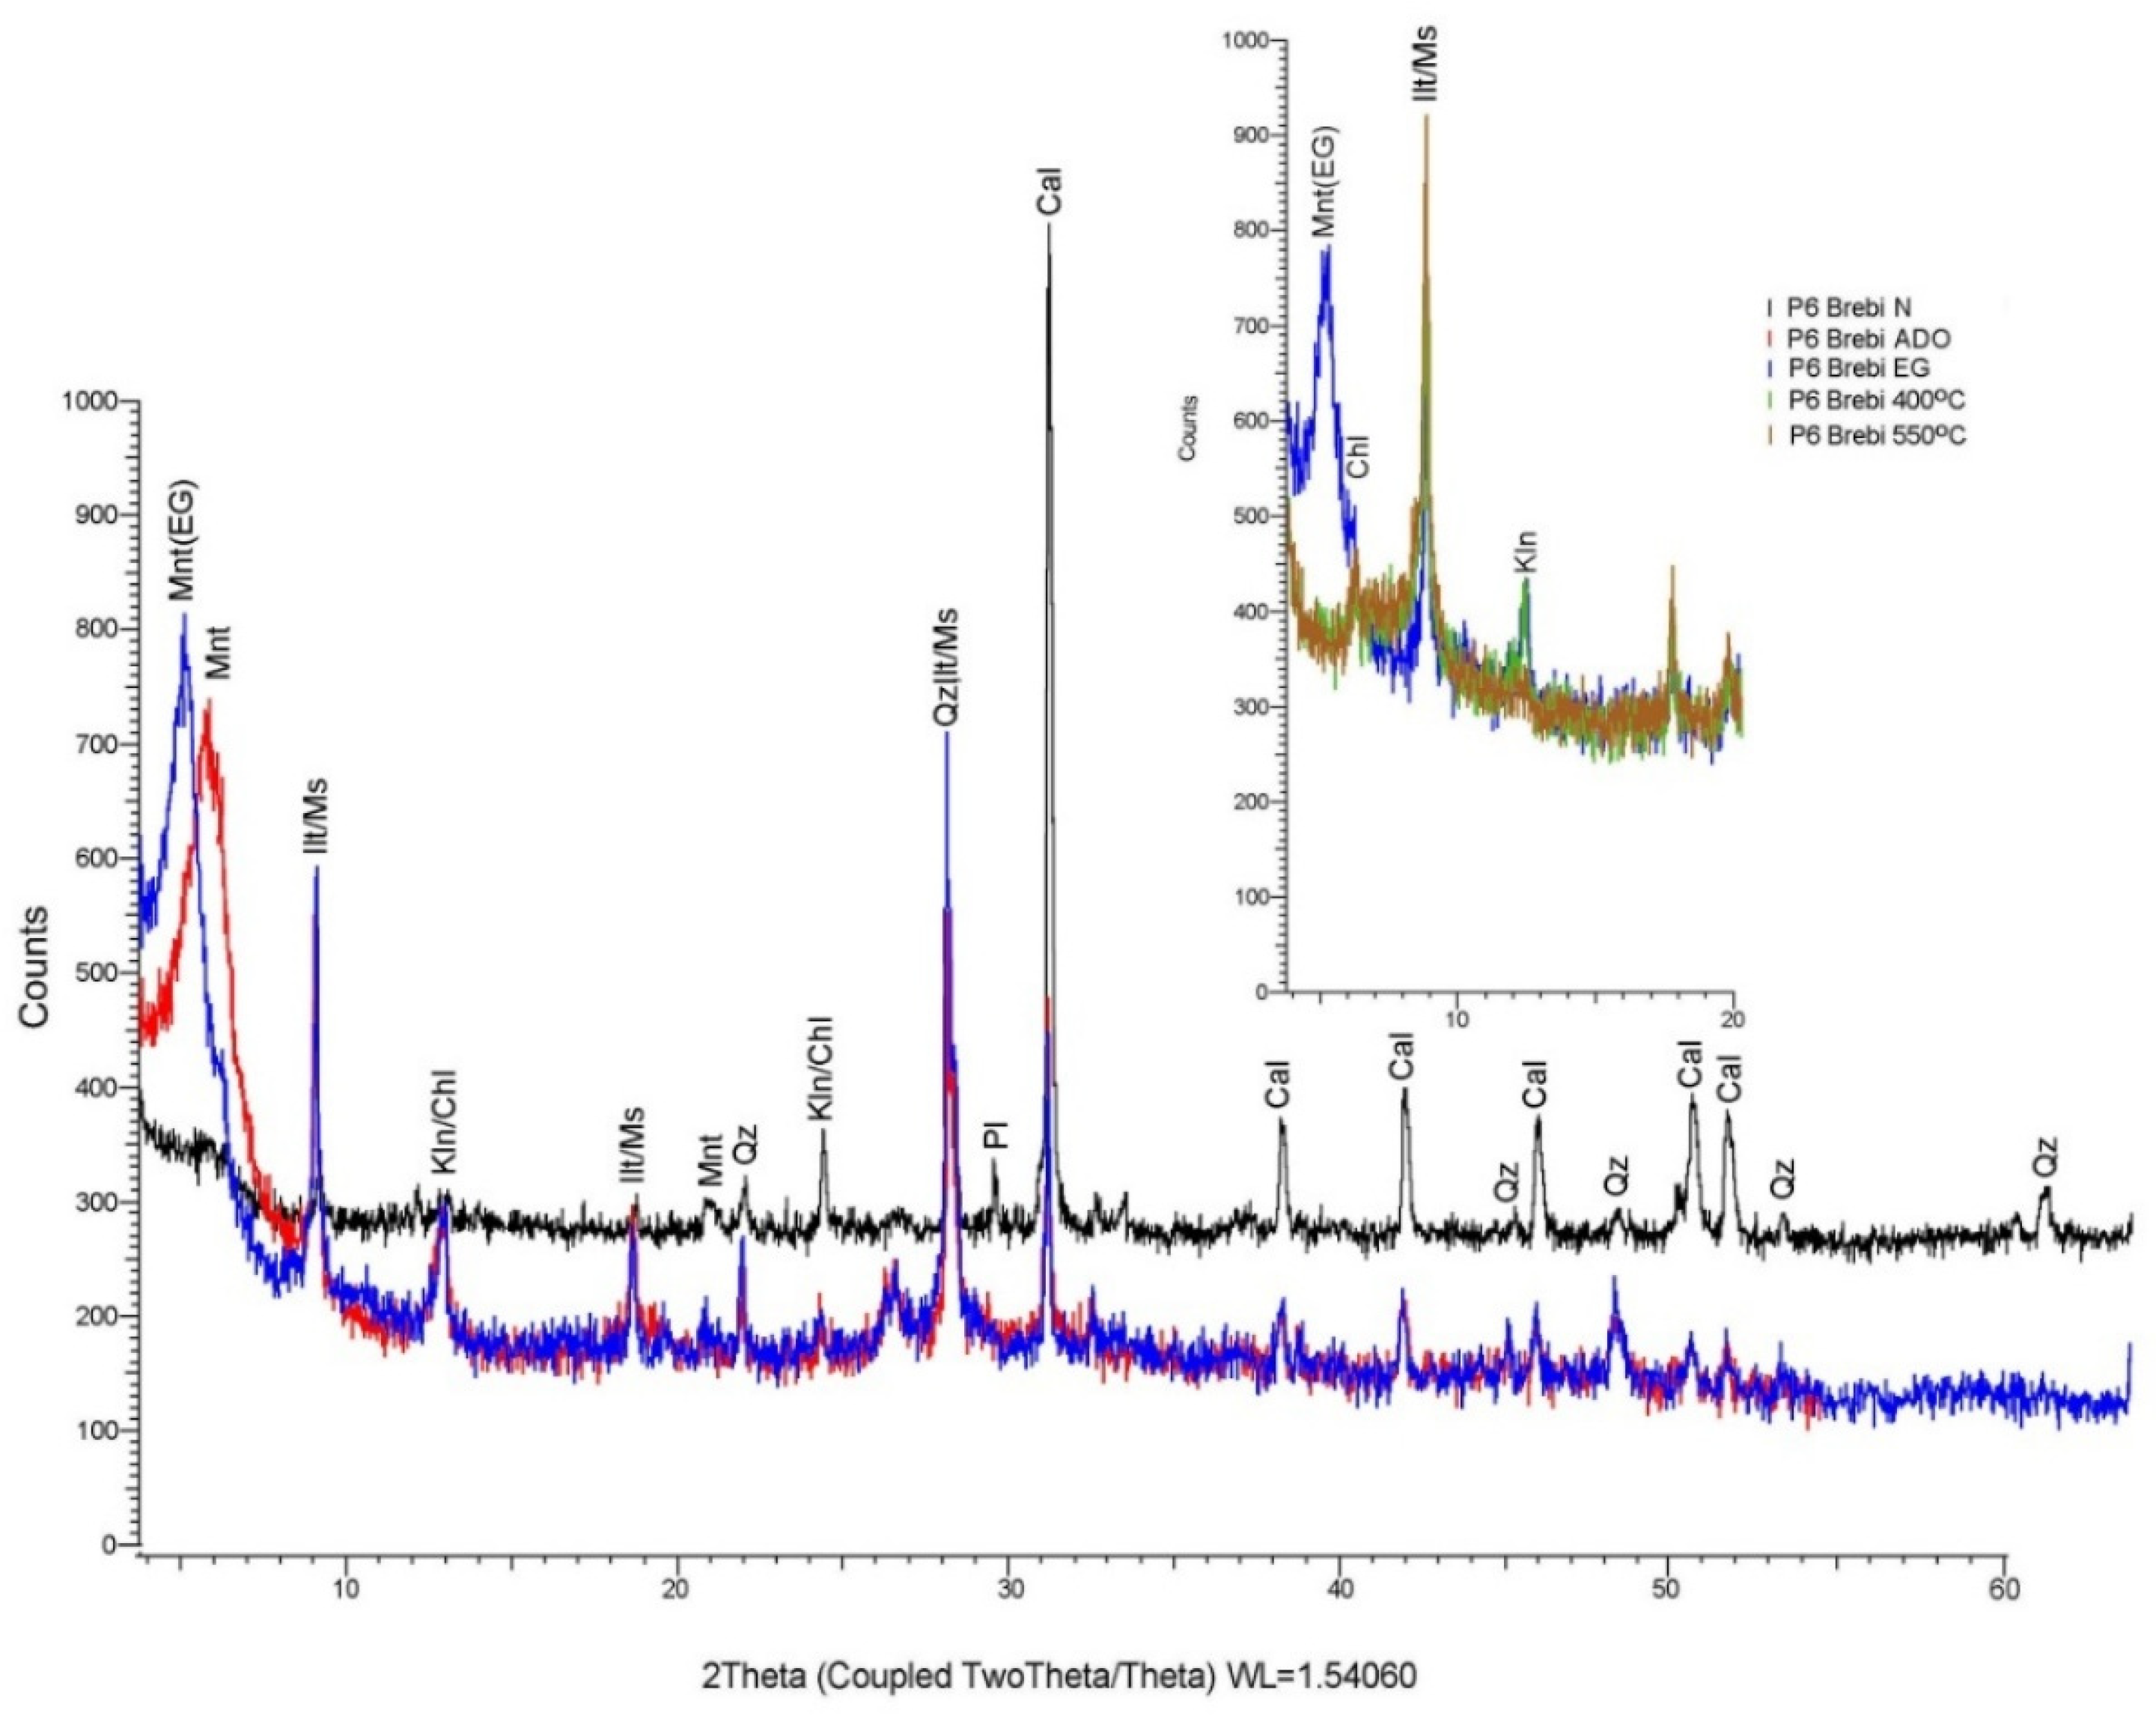
For the Brebi Formation, X-ray diffraction (XRD) analysis (Brebi subset n = 8;
Section 4.2) provides an independent mineralogical benchmark for the interpretations discussed above. The semi-quantitative XRD results show carbonate-rich samples (calcite 35.54–76.25 wt%, mean 53.52 wt%) and a clay-mineral pool dominated by illite/muscovite (8.62–45.18 wt%, mean 24.82 wt%) with minor clinochlore and kaolinite (means 1.98 wt% and 1.65 wt%, respectively), whereas expandable components are minor in bulk terms (montmorillonite 0.56–1.51 wt%, mean 1.02 wt%; montmorillonite–chlorite interstratifications 1.00–2.69 wt%, mean 2.06 wt%; total expandables 1.67–3.78 wt%, mean 3.08 wt%). To make the mineralogical signal comparable with AI (defined per unit clay fraction), the most relevant metric is the expandable proportion within the clay-mineral pool, i.e., (montmorillonite + montmorillonite–chlorite interstratifications) normalized by total clay minerals; under this normalization, the expandable fraction remains modest (mean expandable/clay minerals ≈ 0.10), consistent with AI clustering in the inactive-to-normally active range and with the absence of very active FS values (≥140%). At the same time, the wide variability in calcite supports the interpretation of carbonates as a microstructural control factor, capable of decoupling mineralogical potential from expressed free swell through cementation/stiffening effects.
It should be emphasized, however, that the XRD dataset does not overlap with the specimens tested geotechnically (including FS). Therefore, the mineralogical results can be used as a qualitative validation of the interpretative framework (illitic background with chloritic/kaolinitic contributions, subordinate smectites, and a modulating role of CaCO3), but not as a basis for direct quantitative correlations between mineralogical percentages and swelling levels. In this respect, XRD serves as a mineralogical “benchmark” reinforcing the idea that, in Brebi, expansive behavior variability is more robustly controlled by the proportion of the fine fraction and microstructural constraints (including CaCO3) than by large formation-scale variations in smectite content.
5.2. Mera Formation
Unlike the Brebi Formation—where FS remains within the low-to-active range—Mera spans the full NP 126:2010 spectrum [
5], including very active soils. This broader distribution provides a clearer basis for tracking how plasticity, clay-fraction activity, and microstructural constraints jointly control swelling intensity.
For the Mera Formation, FS values range from 30% to 170%, spanning all four activity categories defined by NP 126:2010 [
5]. The distribution across FS classes shows a predominance of active soils (FS = 100–140%), which account for 40.0% of all specimens, followed by medium-activity soils (FS = 70–100%) at 33.3%. Low-activity soils (FS < 70%) and very active soils (FS ≥ 140%) are equally represented, each comprising 13.3%. This distribution indicates that, at the formation scale, expansive behavior is a recurrent characteristic expressed over a broad range of intensities, rather than a response confined to a few isolated lithological levels.
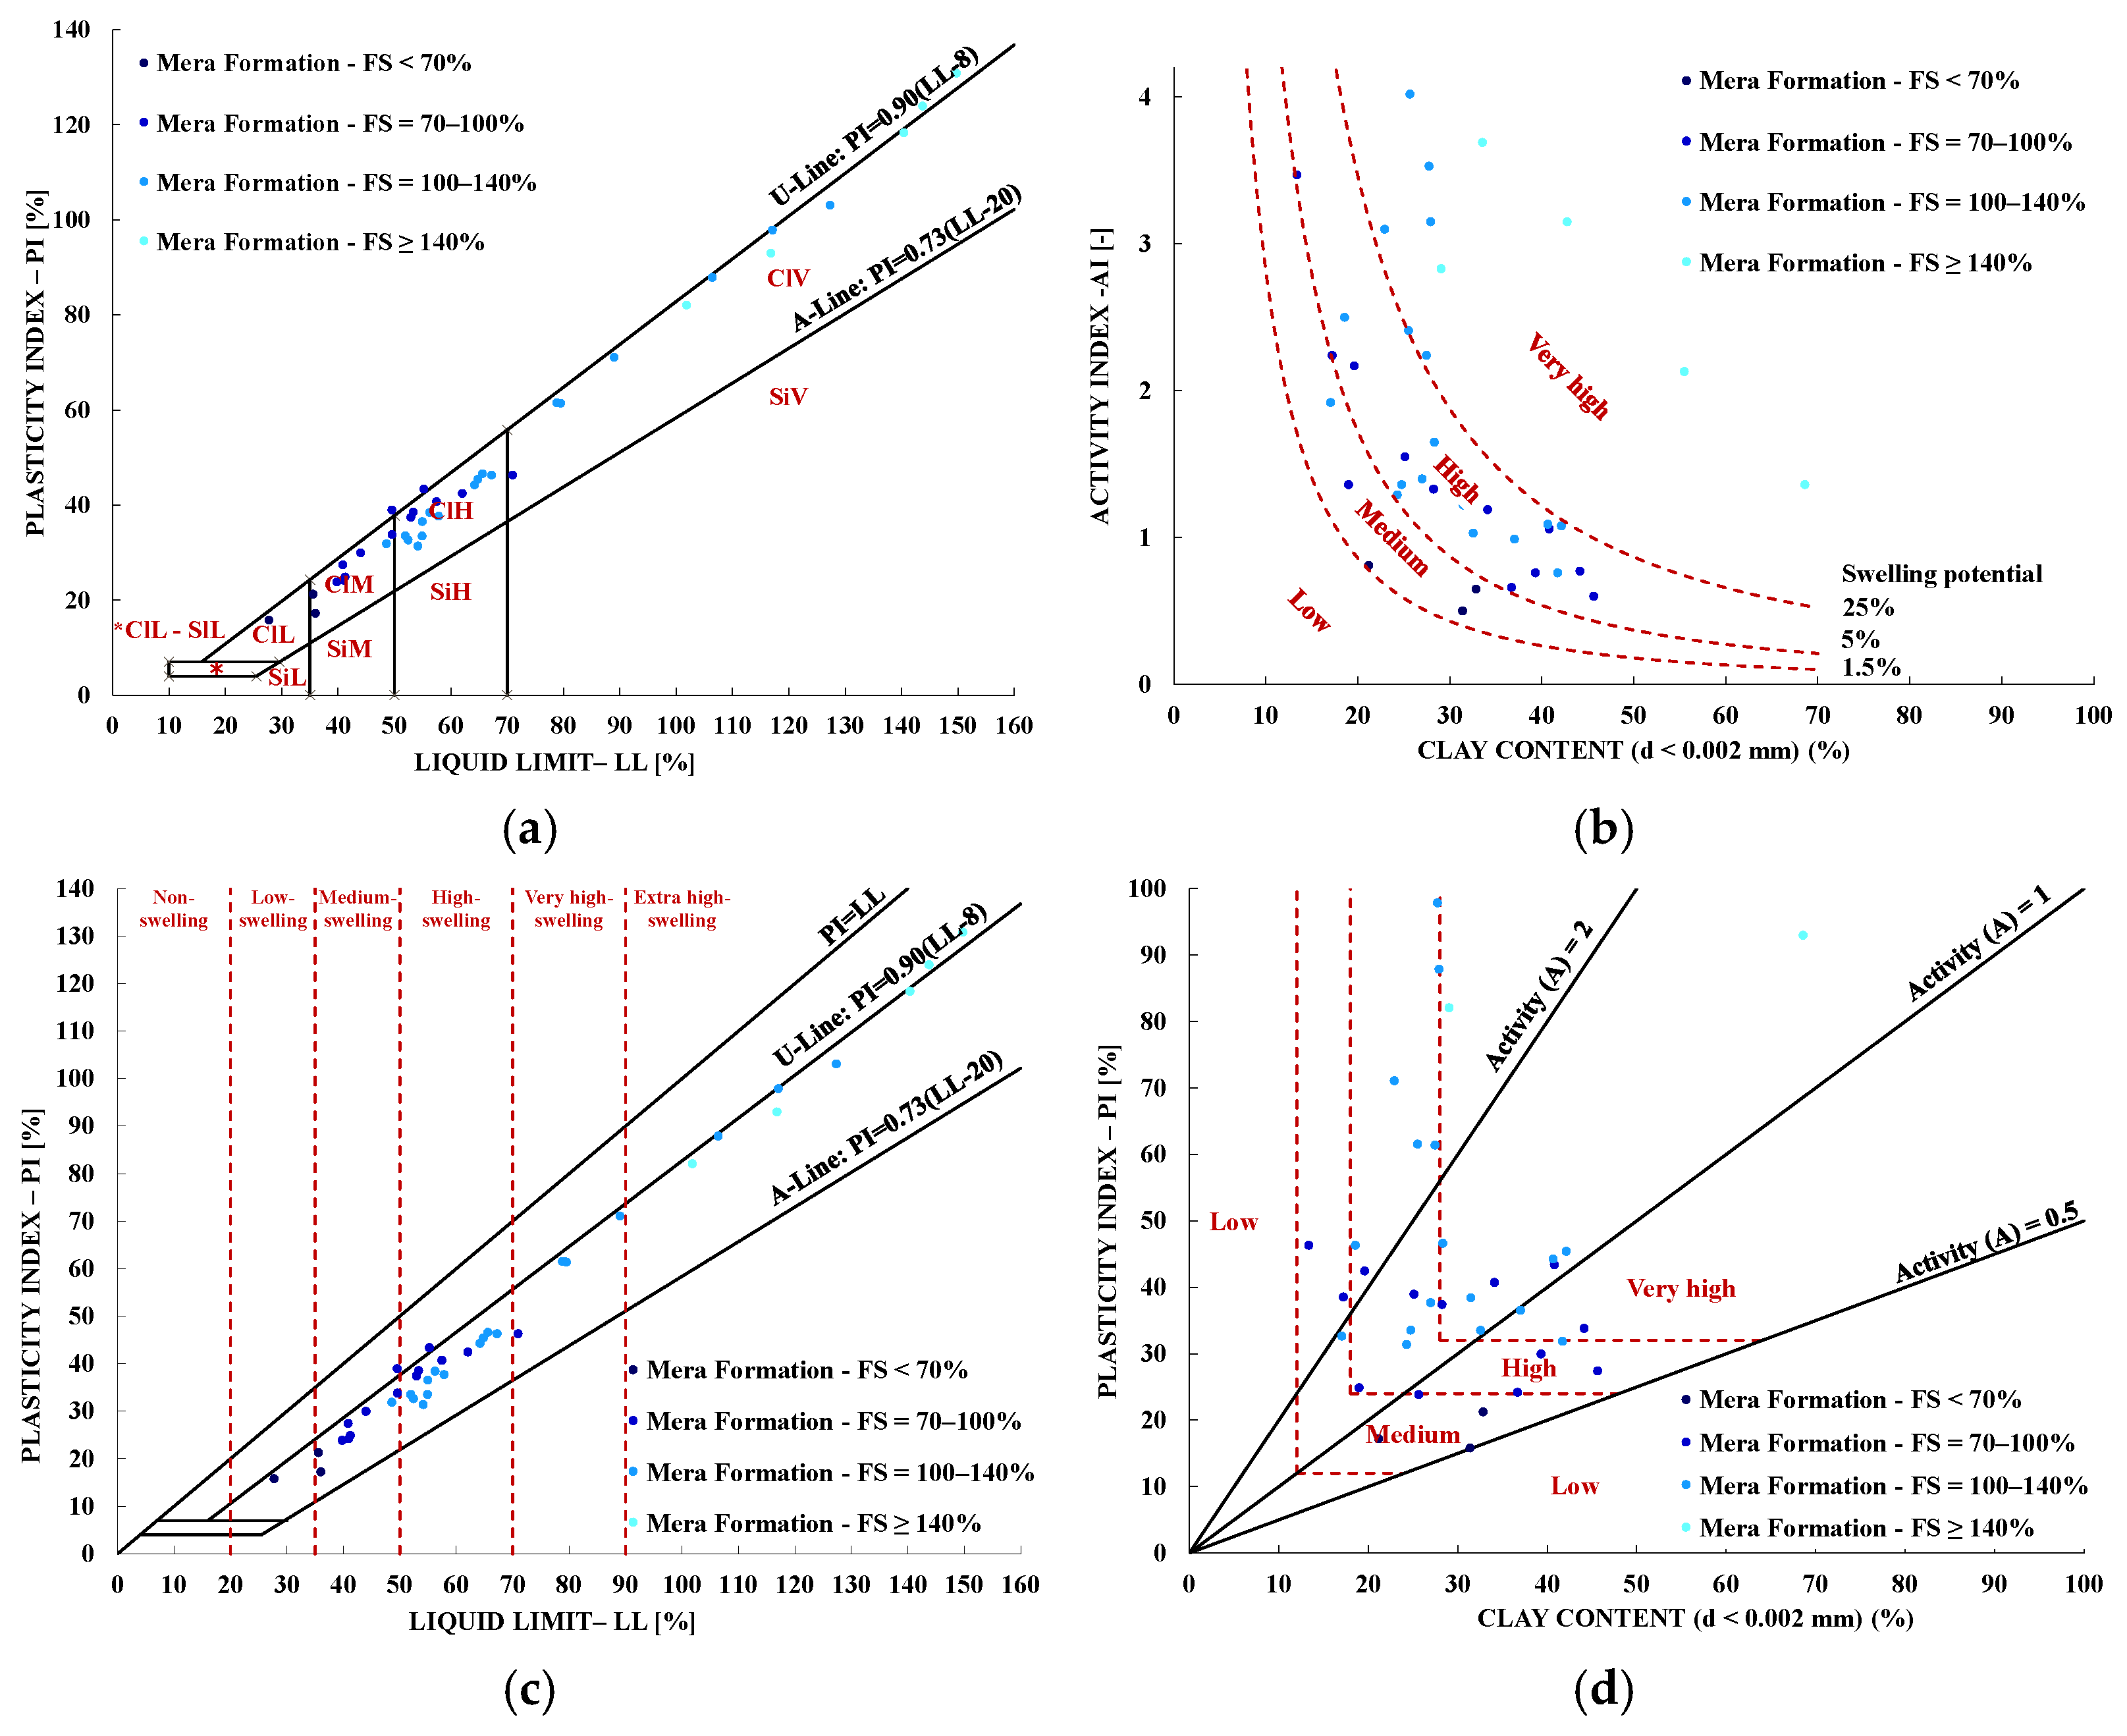
As FS increases, specimens tend to occur more frequently within higher-plasticity domains, shifting from low-plasticity fields (predominantly CIL for FS < 70%) towards very high plasticity (CIV for FS ≥ 140%) (
Figure 5a). This association does not imply a direct causal relationship between plasticity and FS; rather, it suggests that strata developing larger swell are generally characterized by a more plastic, water-sensitive fine matrix, which provides favorable conditions for the development of volumetric strains. In parallel, increasing FS is accompanied by a systematic rise in clay-fraction activity: mean AI values increase from approximately 0.65 (low-activity class) to 1.39 (FS = 70–100%), 1.93 (FS = 100–140%), and 2.63 for FS ≥ 140%. This increase in AI should be interpreted as an indicator of enhanced clay-fraction reactivity rather than as a direct statement of mineralogical dominance: even secondary smectite-group minerals or illite–smectite mixed-layer components can produce a disproportionate effect on swelling behavior, particularly when carbonate-related constraints are less pronounced than in Brebi and the fine matrix becomes volumetrically continuous. Because the mean clay content remains relatively stable for FS < 140% (≈27.5–30.6%), the increase in AI below the 140% threshold primarily indicates enhanced reactivity of the <2 µm fraction (i.e., mineralogical shifts toward a greater smectitic contribution and/or more favorable hydration/dispersion conditions), rather than merely an increase in total clay content. The FS ≥ 140% threshold, however, marks a different regime in which the mean clay content rises to ≈42.7%, suggesting that a volumetrically continuous fine matrix is reached—capable of amplifying mineralogical reactivity into macroscopic deformation.
An important control on how swelling potential is manifested is the calcium carbonate (CaCO
3) content, through carbonate cementation and associated microstructural constraints. Similar to the Brebi Formation, in the Mera Formation CaCO
3 can be interpreted as a proxy for the degree of carbonate cementation, with the potential to limit free swell by increasing structural stiffness. However, carbonation levels in Mera are markedly lower than in Brebi; therefore, CaCO
3 acts primarily as a modulating factor of the expansive response rather than as a formation-scale dominant control. Within this framework, the decrease in CaCO
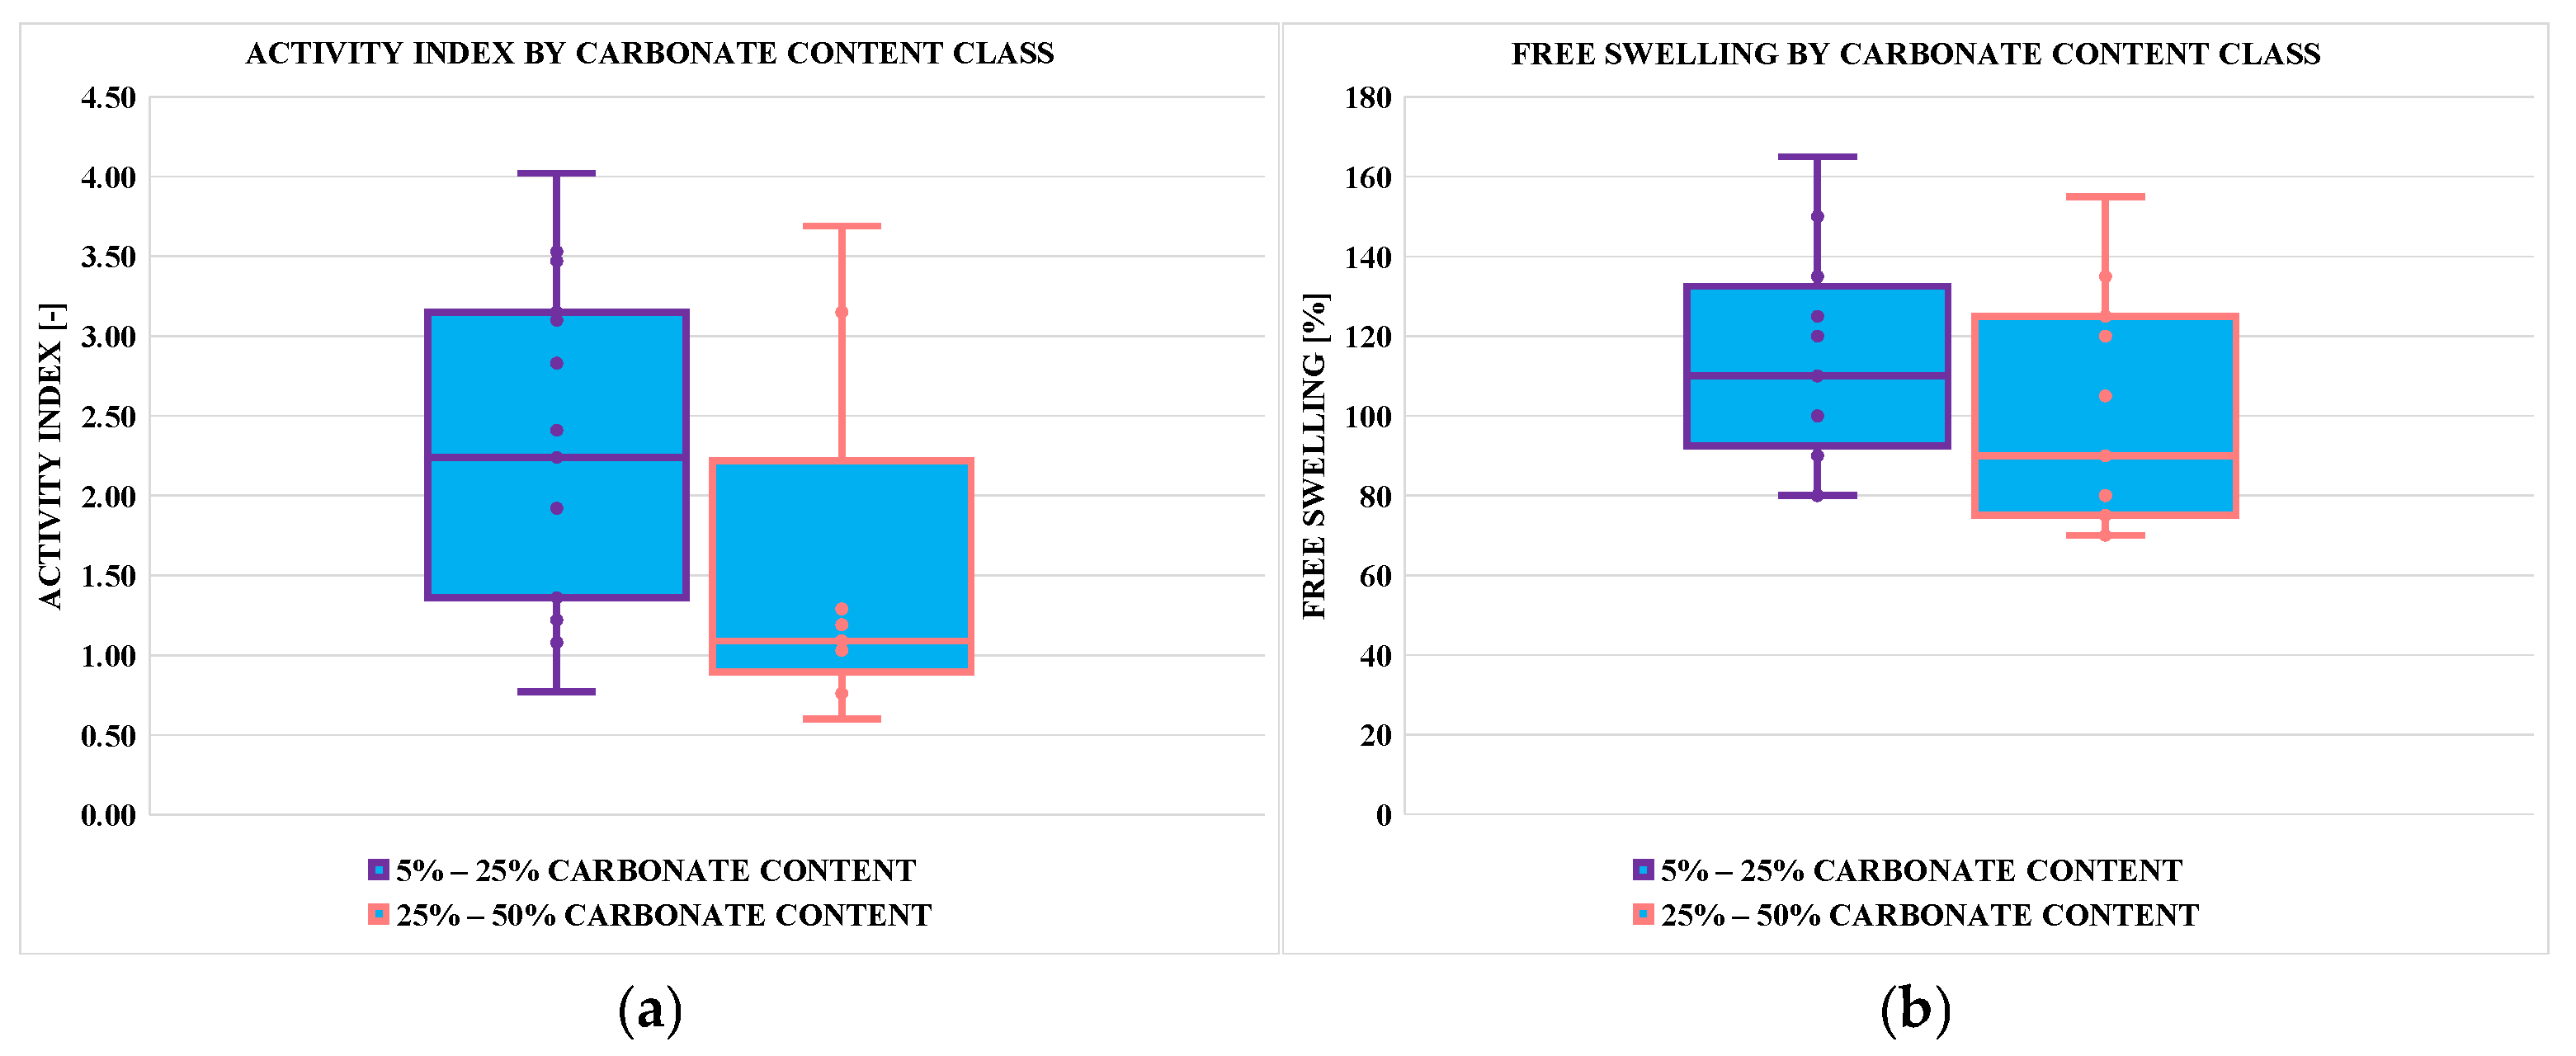
3 with increasing FS (from ≈29% in the FS = 70–100% class to ≈21% for FS ≥ 140%) implies a reduction in carbonate cementation, which may allow a more pronounced expression of swelling. The analysis by carbonate-content classes supports the same trend, suggesting that at lower CaCO
3 contents the volumetric response is less constrained, whereas at higher contents stiffening effects become more evident (
Figure 6a,b).
With respect to the indirect assessment of swell susceptibility, the empirical classification schemes applied to the Mera Formation show a consistent convergence toward high swelling-potential domains (
Figure 5b–d). Methods that explicitly incorporate the clay fraction (Seed et al., 1962 [
9]; Van der Merwe, 1964 [
10]) classify a very large proportion of specimens within the high–very high categories (≈84–85%). The Dakshanamurthy and Raman (1973) [
11] method, which is based solely on Atterberg limits, confirms the same tendency by assigning a high proportion of specimens to the high class and to the upper classes (very high + extra high), which together account for more than 70%. From an interpretative standpoint, the agreement between a plasticity-controlled method (Dakshanamurthy and Raman [
11]) and methods that incorporate the volumetric effect of the fine fraction (Seed [
9]; Van der Merwe [
10]) suggests that, in Mera, swelling potential arises from a combination of high plasticity and the capacity of the fine matrix to retain water and facilitate moisture transfer through the material mass.
Regarding mineralogy inferred indirectly from physico-geotechnical parameters, the systematic FS–AI trend noted above indicates a progressively more reactive <2 µm fraction in the higher-FS classes. This behavior is consistent with an increasing contribution of expandable components (smectite and/or mixed-layer smectitic structures) and/or a progressive shift toward hydration-favorable fabric states (dispersion, reduced bonding), rather than being explained solely by changes in total clay percentage. Importantly, the Casagrande (1948) plasticity chart [
6] captures this evolution as a shift toward higher-plasticity domains and toward the montmorillonitic trend; however, as in all mixed-mineral soils, the Casagrande position is behavioral and does not uniquely define mineralogy.
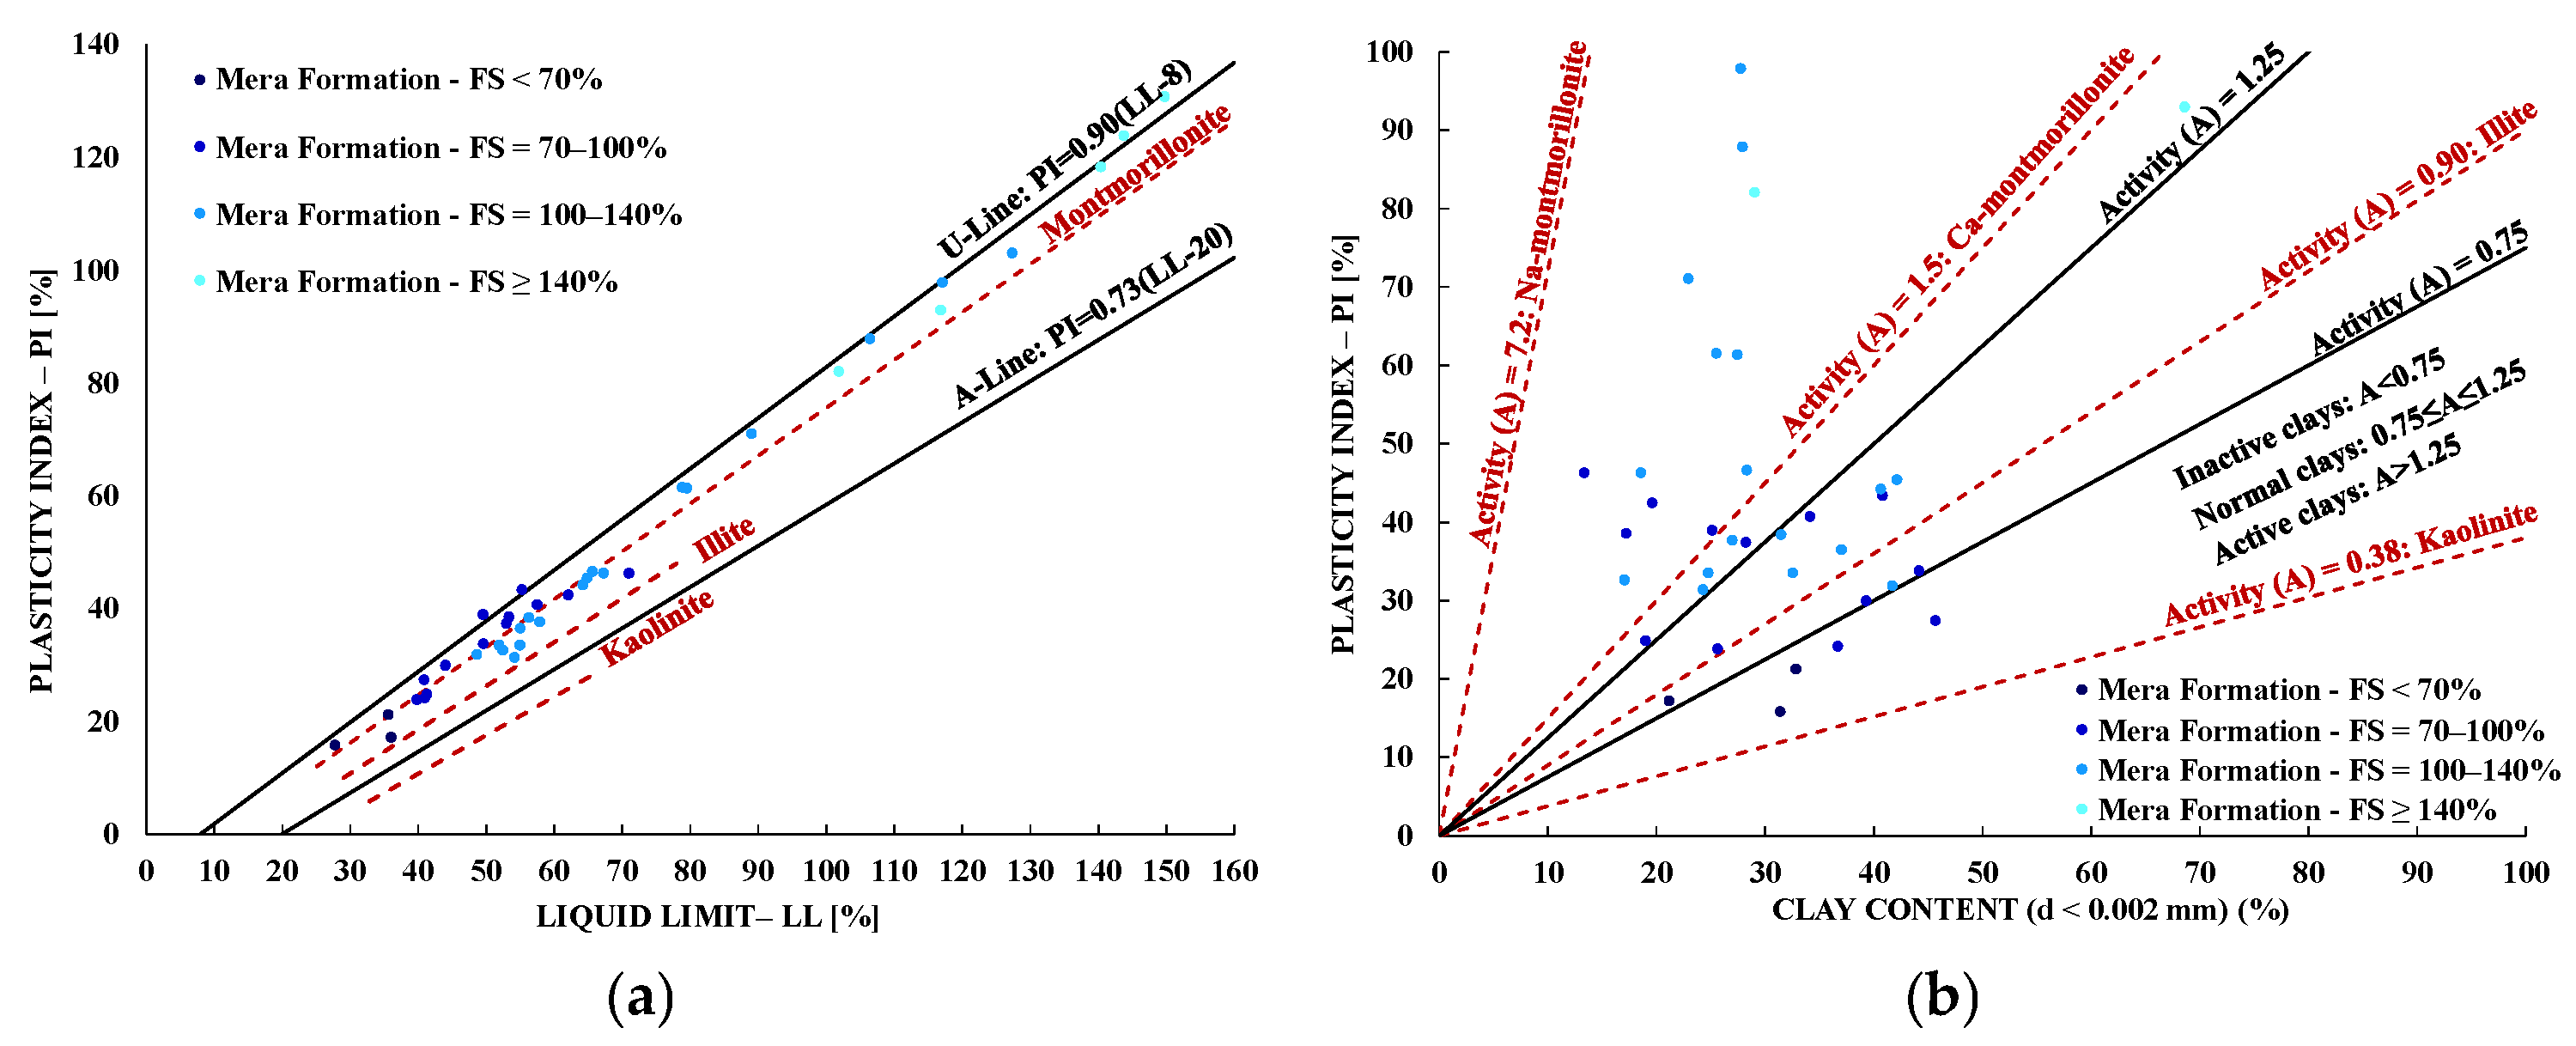
On the Casagrande (1948) plasticity chart [
6], complemented by the clay-mineral reference fields/lines of Holtz and Kovacs (1981) [
7], most specimens cluster in the transition zone between the illitic and montmorillonitic fields—typically along the montmorillonite line and, secondarily, within the montmorillonitic field (
Figure 12a). Skempton’s activity concept [
8] provides a more diagnostic indication for the <2 µm fraction because it normalizes PI by clay content; in Mera, the systematic AI increase with FS supports a progressively more reactive clay fraction in the higher-FS classes (
Figure 12b).
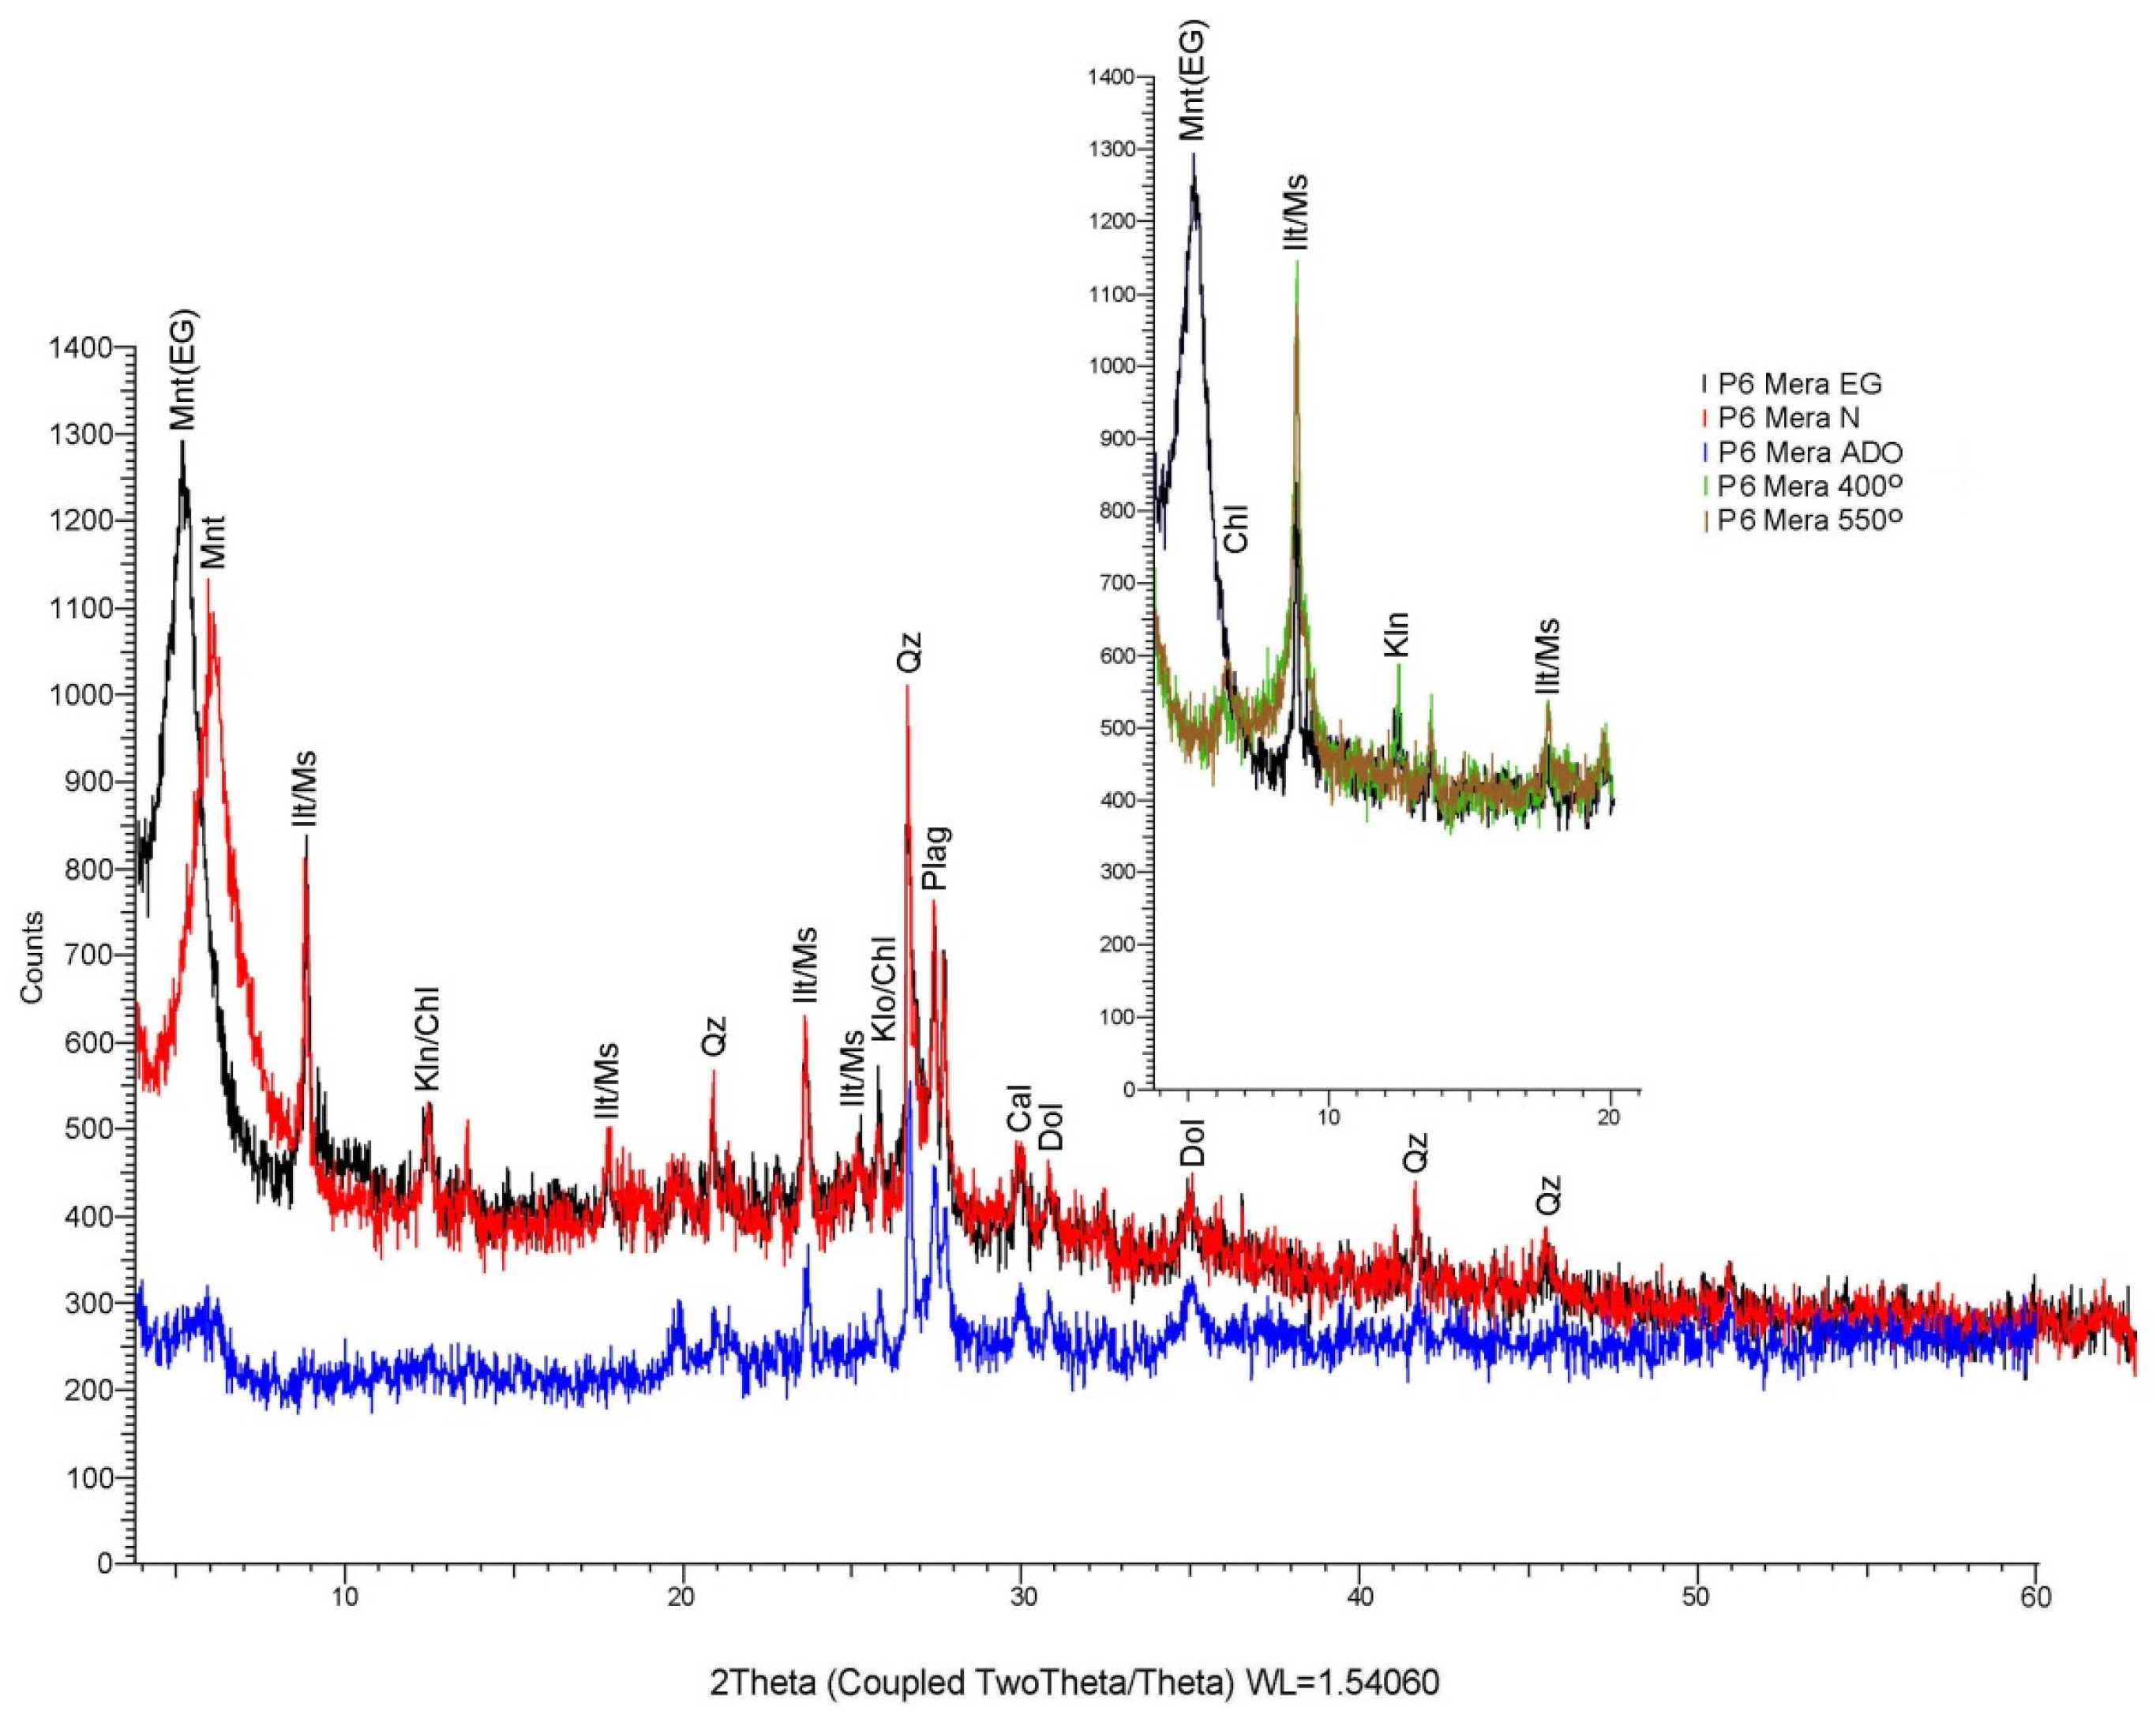
The semi-quantitative XRD dataset provides an independent mineralogical benchmark at formation scale (Mera subset n = 12;
Section 4.2). Bulk mineralogy is dominated by framework silicates, with orthoclase as the prevailing phase (22.12–79.46 wt%, mean ≈ 55.31 wt%), quartz as the main accessory constituent (2.91–21.75 wt%, mean ≈ 10.04 wt%), and locally elevated plagioclase (0–18.92 wt%, mean ≈ 1.58 wt%). Crystalline calcite is generally scarce (0–15.21 wt%, mean ≈ 1.33 wt%) and is absent from most specimens, with one carbonate-bearing outlier (
Table 5). The clay-mineral pool (montmorillonite + montmorillonite–chlorite interstratifications + illite/muscovite + chlorite + kaolinite) averages ≈ 31.68 wt% (range 6.39–53.25 wt%) and is typically dominated by illite/muscovite (1.66–49.22 wt%, mean ≈ 23.24 wt%), accompanied by variably developed chlorite (1.19–7.74 wt%, mean ≈ 2.80 wt%) and minor kaolinite (0–6.13 wt%, mean ≈ 1.42 wt%). Among the studied formations, Mera exhibits the largest dispersion in expandable components: montmorillonite varies from 0.34 to 3.50 wt% (mean ≈ 1.63 wt%), while montmorillonite–chlorite interstratifications span 0.76–6.64 wt% (mean ≈ 2.60 wt%), yielding a combined potentially expandable fraction of 1.10–9.90 wt% (mean ≈ 4.23 wt%) (
Table 5).
Taken together, the agreement between (i) AI increasing with FS and (ii) the presence and variability of expandable components in XRD supports the interpretation that the highest swelling in Mera reflects the combined effect of a reactive clay fraction and the attainment of a volumetrically continuous fine matrix in the highest-FS domain. The carbonate effect is best treated as locally dependent on occurrence and cementation state rather than as a uniform formation-scale control—especially given that the XRD subset is mostly low-calcite, while the broader geotechnical dataset documents variable CaCO
3 at formation scale (
Table 2;
Figure 6a,b).
5.3. Moigrad Formation
Moigrad also spans the full range of FS-based activity classes defined by NP 126:2010 [
5]; however, its internal controls differ from Mera: a practical threshold emerges around FS ≈ 100%, above which the volumetric dominance of the fine matrix becomes decisive, while carbonate effects appear non-linear across compositional classes.
For the Moigrad Formation, FS values range from 20% to 190% (
Table 3), spanning all four activity categories defined by NP 126:2010 [
5]. The FS-class distribution is dominated by medium-activity soils (FS = 70–100%), which account for 37.1% of all specimens, followed by active soils (FS = 100–140%) at 33.9%. Low-activity soils (FS < 70%) represent 21.6%, whereas the very active category (FS ≥ 140%) is less common (7.4%). This distribution indicates that, at the formation scale, expansive behavior is a recurrent characteristic expressed predominantly within the moderate-to-high swell range, while very large swell values occur less frequently and are associated with particular lithological levels.
The classification across FS domains highlights a practical threshold at around FS ≈ 100%, which marks a shift in the degree of control exerted by the fine fraction on swelling response. For FS < 100%, the mean clay content remains nearly constant (≈27–28%), and CaCO3 shows mean values on the order of ≈16%. Under these conditions, the transition from low-FS to medium-FS levels cannot be attributed to a quantitative increase in clay content or to a systematic change in carbonate content. Therefore, differences in swelling are more likely related to internal features of the fine matrix and the nature of the clay component, which can vary substantially even at comparable total clay percentages: lithological alternations involving a more reactive fine fraction, differences in aggregation/dispersion state, and variations in the distribution and connectivity of clay domains within the mass.
For FS ≥ 100%, however, a robust change emerges: mean clay content increases sharply to approximately 43–46%. From an interpretative standpoint, this is the clearest indication that, in Moigrad, high swelling no longer depends solely on the nature of the fine fraction, but also on its amount and continuity. Beyond this threshold, the clay matrix becomes sufficiently dominant to control the material’s volumetric response and to sustain large macroscopic expansive strains, through an increased water-retention capacity.
The relationship between FS and the activity index (AI) provides an important mechanistic clarification. Mean AI values remain relatively similar across the FS < 70%, FS = 70–100%, and FS = 100–140% classes—around ≈1—with a more evident increase observed only in the FS ≥ 140% domain. At the same time, the AI ranges are very wide, indicating pronounced internal heterogeneity: within the same FS domains, levels with less active fines can coexist with levels exhibiting much higher reactivity, including cases exceeding the AI > 1.25 threshold (
Figure 14b). Technically, AI expresses the ratio between plasticity (PI) and the <2 µm clay content; thus, a large dispersion in AI indicates that, for comparable clay contents, the potential of the fine fraction to generate plasticity and wetting sensitivity differs substantially among specimens. This observation supports the interpretation that the transition into the active range (FS ≥ 100%) is primarily controlled by the volumetric effectiveness/continuity of the fine matrix, whereas very high swelling (FS ≥ 140%) additionally requires the occurrence of locally more reactive clay fractions and favorable microstructural conditions for strain expression.
For the Moigrad Formation, calcium carbonate (CaCO
3) can influence how swelling is expressed, primarily through its effects on microstructure and on the pathways of water ingress and redistribution within the material mass. Classifying the specimens into slightly calcareous (CaCO
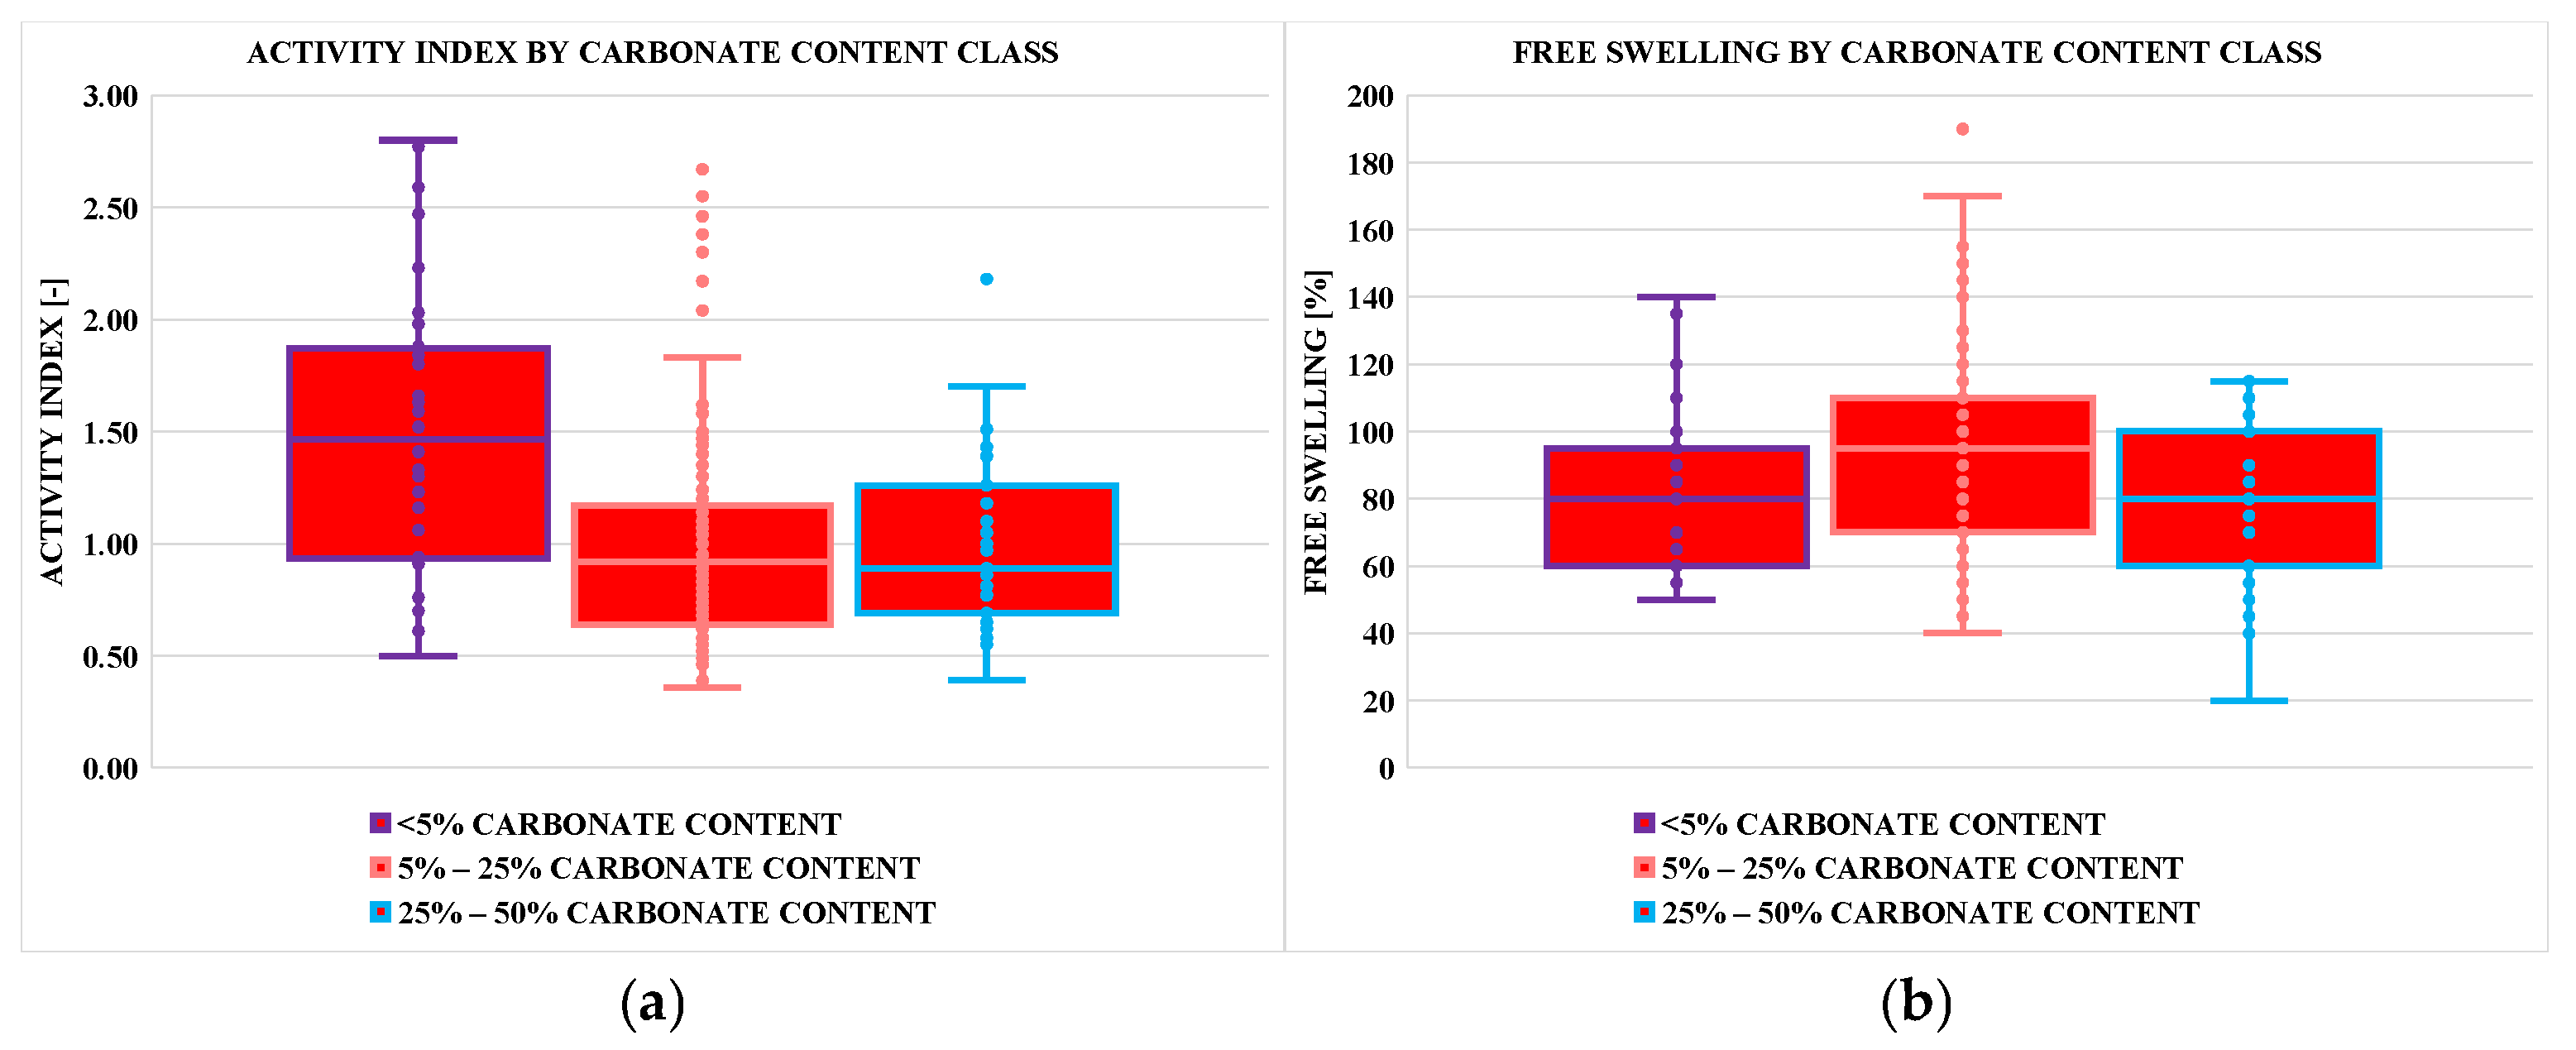
3 < 5%), calcareous (5–25%), and highly calcareous (25–50%) groups highlights that the relationship between CaCO
3 and swelling-related indices is non-linear and cannot be described by a single trend over the full compositional range. Instead, it varies with CaCO
3 content and with how carbonates are distributed within the soil fabric (
Figure 8a,b).
In the slightly calcareous class, the highest mean activity index is recorded (AI ≈ 1.49), together with a free swell of about 82%. This combination suggests that, when carbonate input is low, the response is dominated by the properties of the clay fraction, with minimal carbonate-related modification of the structure. In the calcareous class (5–25%), AI decreases to ≈0.99, whereas FS increases to ≈94%. This association shows that a decrease in AI does not automatically translate into reduced swelling; at this CaCO
3 level, the primary effect is likely related to fabric organization and local wetting permeability, such that water can penetrate and redistribute efficiently throughout the mass, promoting a larger overall swell (
Figure 8a,b).
In the highly calcareous class (25–50%), AI remains essentially unchanged relative to the calcareous class (≈0.99), but FS drops to ≈78%. The persistence of AI alongside a decrease in free swell indicates the emergence of more pronounced structural constraints, consistent with intensified carbonate bonding that stiffens the skeleton and limits volumetric change of the fine matrix. In this compositional range, CaCO
3 becomes relevant mainly through its effect on fabric and stiffness, reducing the ability of the clay matrix to dilate upon wetting even under similar fine-fraction activity (
Figure 8a,b).
Overall, the results suggest that the influence of CaCO
3 in Moigrad arises from the superposition of mechanisms whose effects vary across the compositional range: at lower to intermediate CaCO
3 contents, microstructural configuration and wetting conditions may enable high swelling even at lower AI, whereas at higher CaCO
3 contents the stiffening/bonding effect becomes dominant and constrains free swell. The dispersion of values among classes further indicates that swelling response remains controlled by multiple factors, with CaCO
3 acting in conjunction with fine-fraction heterogeneity and deposit-specific microstructural features (
Figure 8a,b).
In addition to the direct FS assessment, the empirical classification schemes applied to the Moigrad Formation confirm formation-scale swell susceptibility, but allocate specimens differently across susceptibility classes (
Figure 7b–d). The Dakshanamurthy and Raman (1973) [
11] method assigns most specimens to the medium class (55.12%), followed by high (30.31%), whereas very high (8.66%) and extremely high (2.76%) are subordinate and low is marginal (3.15%) (
Figure 7c). By contrast, the Van der Merwe (1964) [
10] and Seed et al. (1962) [
9] methods place a larger share of the dataset in the high and very high domains: 44.49% high and 29.53% very high for Van der Merwe [
10], and 51.18% high and 19.29% very high for Seed [
9] (
Figure 7b,d), with the remaining specimens distributed between the medium and low classes.
From an interpretative standpoint, this discrepancy reflects distinct methodological sensitivities. Relative to the direct FS evaluation, the Dakshanamurthy and Raman (1973) [
11] classification appears, at formation scale, the closest to the overall swelling signal, because its ranking is governed by plasticity indicators (LL, PI) that directly condition wetting-induced response across both low–medium activity regimes and active–very active regimes (NP 126:2010 [
5]) (
Figure 7c). At the same time, the transition into FS ≥ 100% regimes (active and very active soils in NP 126:2010 [
5]) coincides with a robust increase in clay fraction. Under these conditions, clay-sensitive criteria (Seed [
9]; Van der Merwe [
10]) tend to highlight more clearly the elevated predisposition to swelling (
Figure 7b–d). However, within these higher-FS regimes, the magnitude of FS may still be modulated by microstructural features and CaCO
3-related effects (
Figure 8a,b), such that the plasticity signal expressed by Atterberg limits can separate specimens differently than criteria that explicitly incorporate clay content. Within this framework, Seed [
9] and Van der Merwe [
10] are particularly useful for identifying interbeds where the clay fraction becomes decisive, whereas Dakshanamurthy and Raman [
11] provide a formation-scale reference that more closely tracks the FS response across the full activity range.
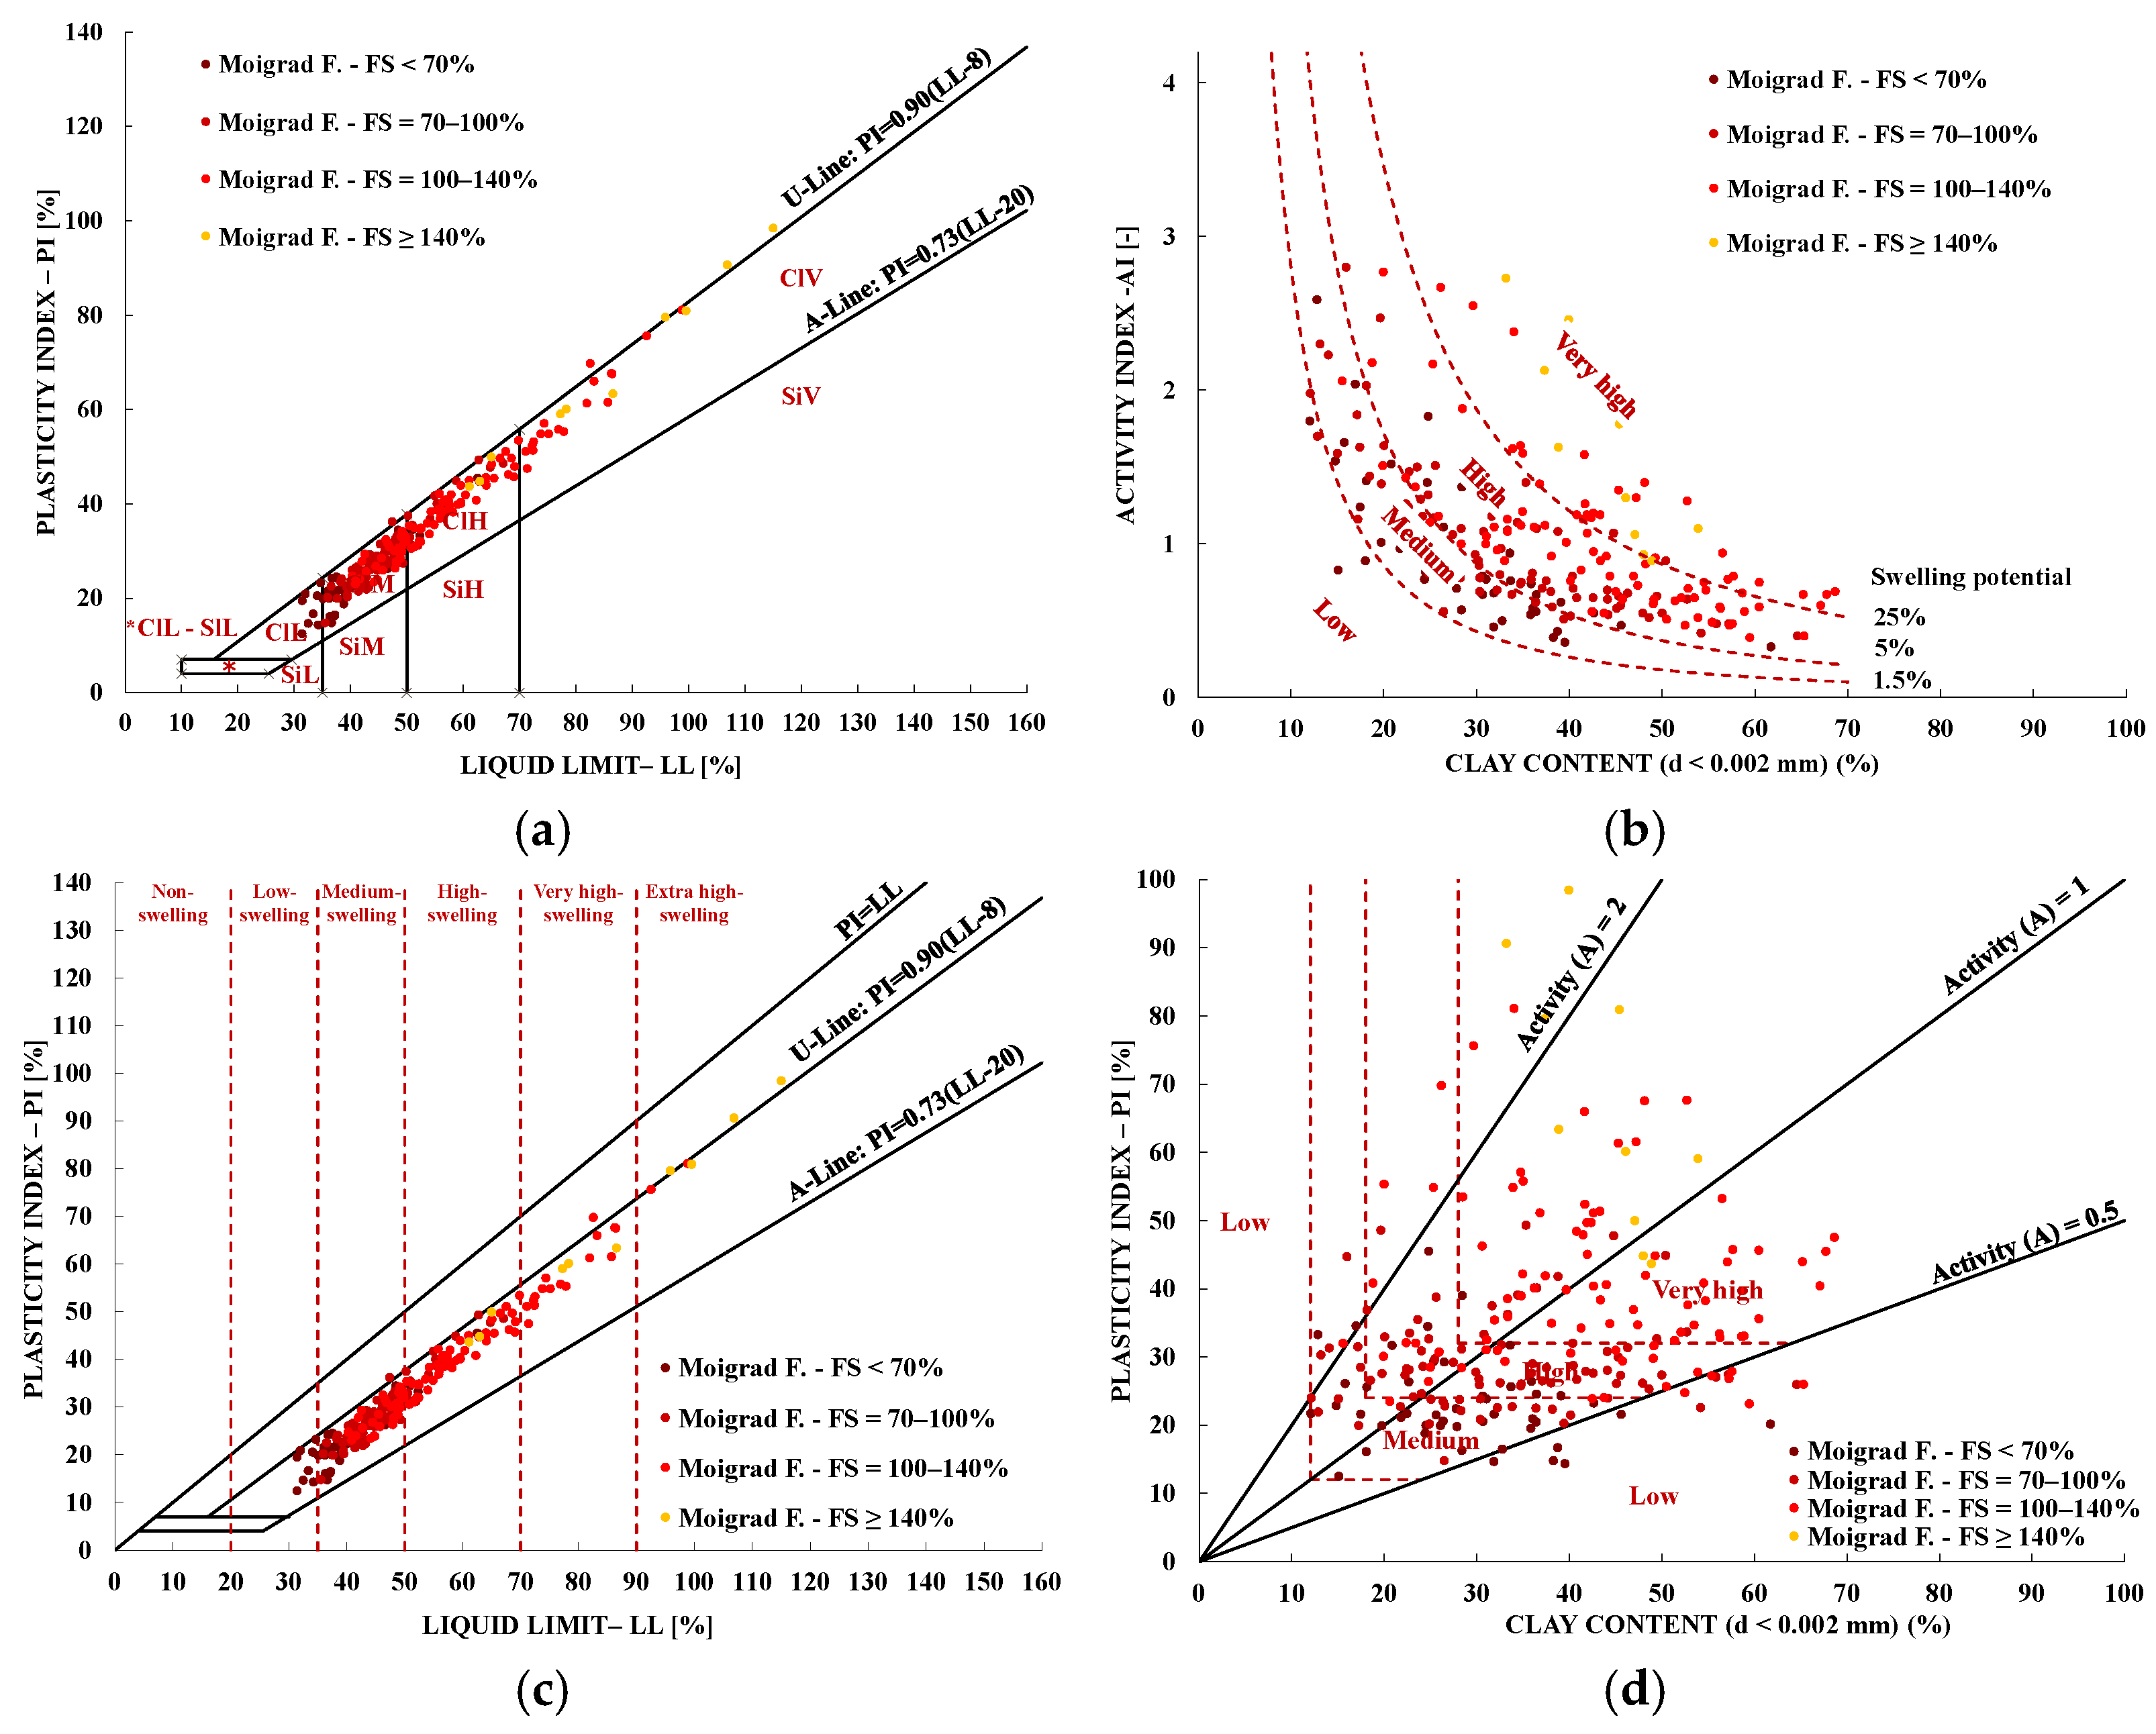
Regarding mineralogy inferred indirectly from physico–geotechnical parameters, the charts applied to the Moigrad Formation lead to a broadly convergent interpretation, albeit with different emphasis depending on the indicator considered. On the Casagrande (1948) plasticity chart [
6], supplemented with the characteristic montmorillonite, illite, and kaolinite lines proposed by Holtz and Kovacs (1981) [
7], most specimens cluster in the transitional zone between the illitic and montmorillonitic fields, with secondary occurrences within the montmorillonitic field and isolated cases within the illitic field (
Figure 14a). This distribution is consistent with plastic behavior influenced by a smectitic component, while still allowing for a persistent illitic background at the formation scale.
At the same time, Skempton’s (1953) activity chart [
8], based on the relationship between plasticity index and clay content (<2 µm), yields a mean of AI ≈ 1.09 for Moigrad (
Figure 14b), which supports a predominantly illitic mineralogical background with secondary contributions from montmorillonite and kaolinite. Overall, the indirect evidence points to a mixed clay matrix in which smectitic influence is present but not dominant.
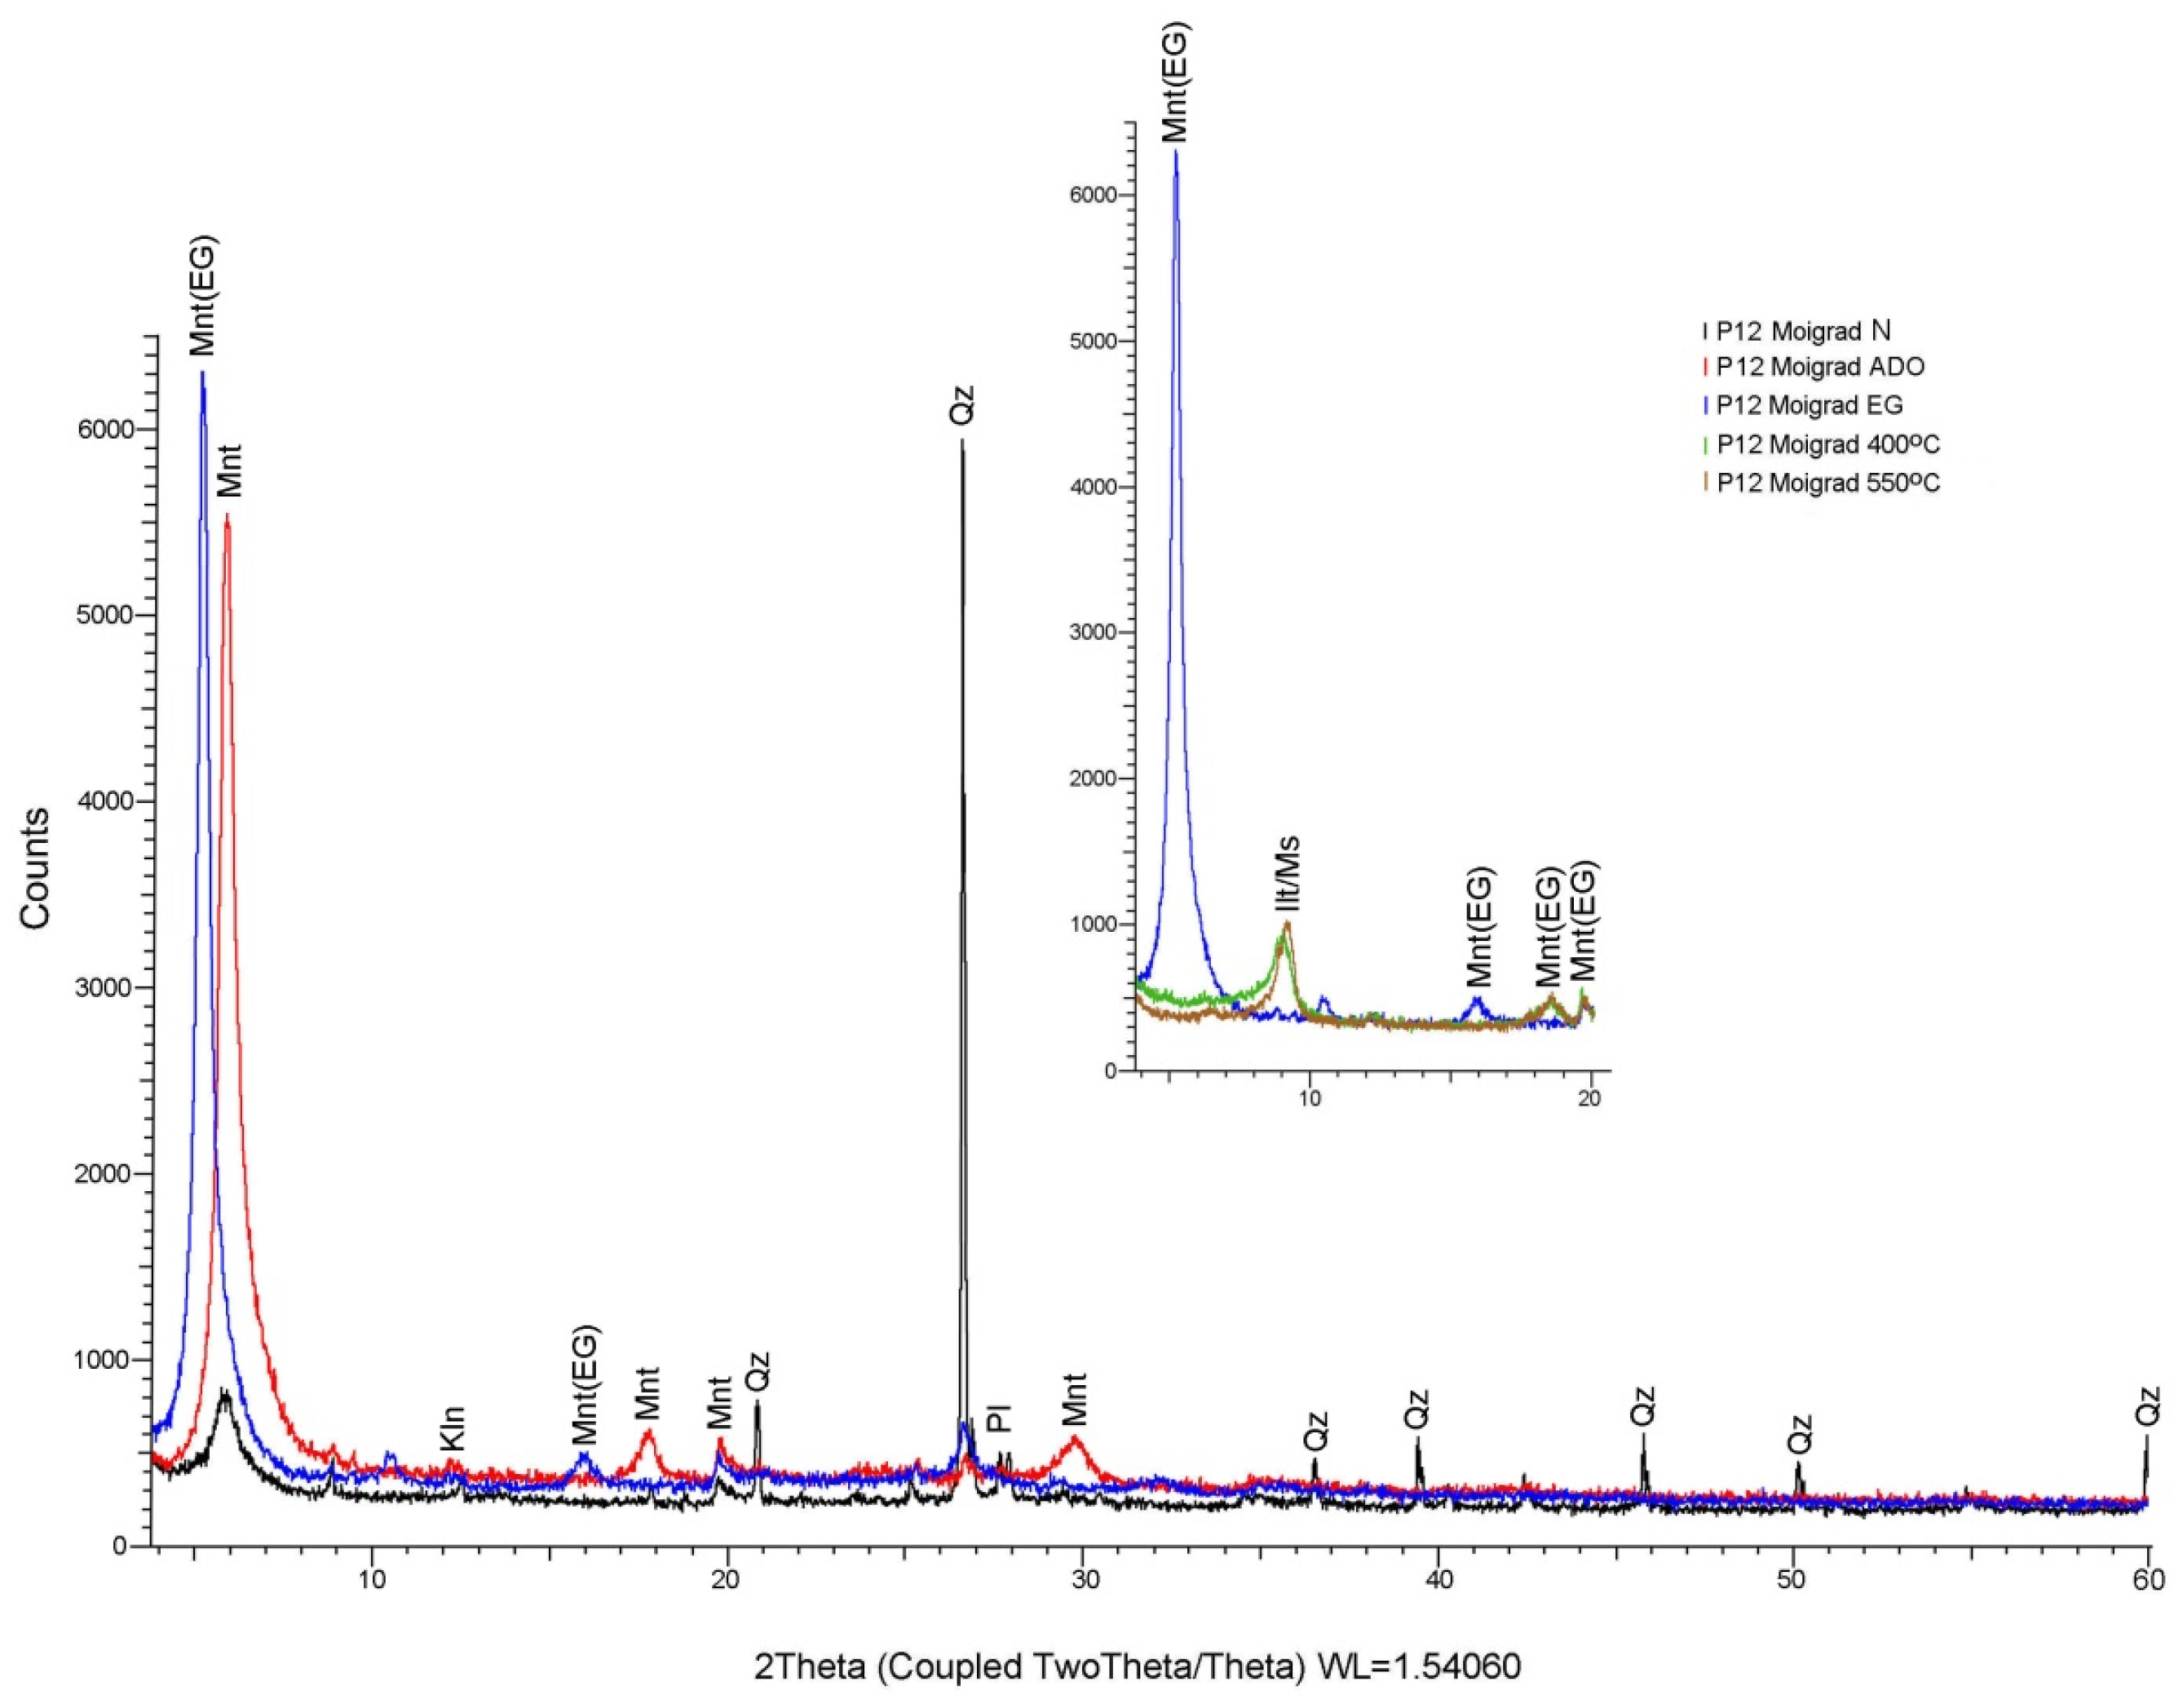
For the Moigrad Formation, semi-quantitative XRD analyses (Moigrad subset n = 11;
Section 4.2) provide an independent mineralogical benchmark at formation scale (
Table 6). The bulk mineralogy is predominantly siliciclastic, with quartz as a major constituent (mean ≈ 33.8 wt%, up to 66.1 wt%), while the total clay-mineral pool remains substantial (mean ≈ 38.76 wt%). Calcite is generally low in the analyzed subset (typically near detection, with one minor-carbonate specimen), indicating that carbonate cementation is not a pervasive control in the XRD subset, even though carbonate-related fabric effects may still be relevant across the broader geotechnical dataset.
Within the clay-mineral pool, the physico–geotechnical signal (mean Skempton activity AI ≈ 1.09 [
8];
Figure 14b) is consistent with an overall illitic background (with chlorite/kaolinite-group contributions) coupled with subordinate but persistent expandable components. In bulk terms, expandable phases occur at low absolute proportions—e.g., montmorillonite ranges from 0.92 to 3.11 wt%, while mixed-layer expandable components range from 1.56 to 6.50 wt%—yet bulk wt% alone understates their relevance because XRD is performed on whole-rock powders. When the expandable fraction is normalized to the total clay-mineral pool (i.e., expandable/clay minerals), the proportion becomes markedly more informative and variable (up to ≈0.37 in the analyzed subset). This reconciliation is critical for Moigrad: a few wt% of expandable clays in bulk composition can correspond to a sizeable share within the clay-mineral pool, disproportionately increasing surface area, bound water, diffuse double-layer effects, and therefore PI/AI, even when the formation retains an illitic “background” signature in mean activity.
This mixed mineralogical framework helps explain why Moigrad is dominated by moderate-to-high FS classes at formation scale while still exhibiting large internal scatter. Up to FS < 140%, the near-constant mean AI (≈1) combined with the sharp clay-content increase beyond FS ≈ 100% supports the interpretation that swelling intensity is primarily governed by the volumetric effectiveness and continuity of the fine matrix (i.e., clay volume/connectivity), rather than by a systematic formation-scale increase in intrinsic clay reactivity. By contrast, the emergence of very active behavior (FS ≥ 140%) is consistent with the joint requirement of (i) high clay content (a volumetrically continuous fine matrix) and (ii) locally more reactive clay fractions/fabrics, reflected by the high-AI tail (
Figure 14b), which can be mineralogically enabled by higher relative shares of expandable components within the clay-mineral pool. As for carbonate effects, the low calcite levels in the XRD subset are compatible with the non-linear CaCO
3 behavior observed across compositional classes in the geotechnical dataset: carbonate influence is best treated as a fabric- and occurrence-dependent microstructural modifier rather than a uniform formation-scale mineralogical control.





 and
and