
Article

Rapid Prediction for Overburden Caving Zone of Underground Excavations

1
School of Chemical Engineering, University of Adelaide, Adelaide, SA 5005, Australia
2
School of Electrical and Mechanical Engineering, University of Adelaide, Adelaide, SA 5005, Australia
3
Faculty of Engineering, China University of Geosciences, Wuhan 430074, China
4
NeuRizer Ltd., Adelaide, SA 5000, Australia
*
Author to whom correspondence should be addressed.
Geotechnics 2026, 6(1), 14; https://doi.org/10.3390/geotechnics6010014
Submission received: 26 November 2025 / Revised: 14 January 2026 / Accepted: 21 January 2026 / Published: 2 February 2026

Abstract

Underground coal gasification (UCG) is an emerging energy technology that involves the in situ conversion of coal into syngas through controlled combustion within a subsurface excavation. The geomechanical processes associated with UCG can lead to significant overburden caving and surface subsidence, posing risks to surface infrastructure and groundwater systems. To accurately predict the size of overburden caving zones and associated surface subsidence, a prediction model was developed based on simulation results using discrete element method (DEM) numerical models. The main purpose of developing such a model is to establish a systematic and computationally efficient method for the rapid prediction of the height of overburden caving and its associated surface subsidence induced by underground excavation. The model is broadly applicable to different types of underground excavations, and UCG is used in this study as a representative application scenario to demonstrate the relevance and performance of the model. Sensitivity analysis indicates that excavation span, tensile strength, and burial depth are the primary controls on the height of the caving zone within the ranges of parameters investigated. Rock density is retained as a secondary background parameter to represent gravitational loading and its contribution to the in situ stress level. The derived model was validated using published numerical, experimental, and field measurement data, showing good agreement within practical ranges. To further demonstrate the application of the model developed, the predicted caving geometries were incorporated into finite element method (FEM) models to simulate surface subsidence under different geological conditions. The results highlight that the arch structure formed by overburden caving can help redistribute stresses and thereby reduce surface deformation. The proposed model provides a practical, parameter-driven tool to assist in underground excavation design, environmental risk evaluation, and ground stability management.

1. Introduction

Surface subsidence resulting from underground excavations poses significant threats to infrastructure safety, operational efficiency, and environmental sustainability [1,2,3,4,5,6]. The caving of the overburden above underground cavities significantly influences surface subsidence [7]. The accurate prediction of caving geometry, specifically the height and shape of the caving zone, remains challenging due to variability in geological conditions, the complexity of rock mass behaviour, and uncertainties in rock properties and in situ stresses [8]. As a representative application, underground coal gasification (UCG) involves the progressive formation of underground cavities accompanied by complex thermo-mechanical disturbances, which further complicate overburden response and subsidence development, making UCG a particularly relevant and challenging scenario for testing and validating caving and subsidence prediction methods [9]. Over the past few decades, numerous methods for predicting surface subsidence and rock mass caving have been developed based on empirical, analytical, experimental, or numerical approaches. While each method offers specific merits, their effectiveness is often constrained by simplified assumptions, scale limitations, or high computational demands. To date, no tools are available to provide a universally applicable, parameter-driven, and rapid prediction method for caving zone geometry across different geological conditions. Accordingly, this study aims to develop a rapid, parameter-driven prediction model for the height of overburden caving and apply it to assess the resulting surface subsidence using UCG as a representative application example. Relevant existing studies are reviewed below to examine their assumptions, approaches, and limitations.
Empirical approaches to overburden caving prediction are widely used in coal mining practice and are typically derived from regression analyses of extensive field monitoring data [10,11,12]. These methods provide estimates of the height of the caving and fractured zones as functions of excavation geometry and overburden characteristics and have therefore become standard tools for preliminary assessment and operational decision-making. Their main scientific contribution lies in identifying reproducible trends between subsidence-related indicators and mining parameters across large datasets. However, empirical formulations are inherently correlation-based and rely on simplifying assumptions regarding fracture propagation, stratigraphic control, and stress redistribution. As a result, they often struggle to generalize beyond their calibration conditions, particularly in cases involving heterogeneous lithology, transitional stratigraphy, or complex stress regimes. In addition, most empirical models focus on predicting a single scalar quantity (typically caving height) and provide limited information on the full geometry of the caving zone, which restricts their applicability for physically consistent subsidence modelling. Consequently, while empirical methods are efficient and useful in practice, they also require a numerical or physical model for reliable prediction under different geological and operational conditions.
Limit analysis constitutes one of the most widely adopted analytical approaches for estimating the shape and extent of caving zones above underground excavations [13,14,15,16,17,18]. Based on plasticity theory and failure criteria such as Hoek–Brown, these methods derive kinematically admissible collapse mechanisms and energy balance conditions to obtain theoretical bounds or closed-form expressions for caving zone boundaries. Their primary scientific value lies in providing physically interpretable relationships between excavation geometry, rock mass strength, and predicted failure envelopes, while maintaining high computational efficiency for preliminary design and rapid assessment. However, limit analysis formulations typically rely on idealized assumptions, including perfect plasticity, material homogeneity, simplified boundary conditions, and prescribed kinematic mechanisms. As a result, they often neglect stratigraphic variability, excavation-induced stress redistribution, and progressive damage accumulation, and frequently treat burial depth in a discretized manner (e.g., “shallow” versus “deep”) rather than as a continuous controlling parameter. These simplifications restrict their ability to capture transitional failure behaviours and limit their applicability in heterogeneous geological environments and across broad ranges of excavation span, depth, and material properties.
Physical similarity modelling has been widely used to investigate the evolution of overburden caving and surface subsidence induced by underground excavations [19,20,21,22,23]. By constructing scaled laboratory models that satisfy geometric, kinematic, and mechanical similarity, this approach enables direct observation of fracture initiation, arch formation, progressive collapse, and overburden movement, providing valuable qualitative insight into failure mechanisms and deformation processes. Its primary scientific contribution lies in revealing the kinematics and sequence of failure in a controlled and observable environment, which is difficult to obtain from field measurements or purely numerical simulations. However, the physical similarity model has its limitations. Firstly, scaled models cannot fully replicate the nonlinear mechanical behaviour of rock masses, especially under complex jointing or anisotropic conditions [21,22]. Secondly, due to limited model size and simplified boundary conditions, physical models often suffer from scale distortion and edge effects, which compromise their representativeness. Lastly, the setup process is costly and labour-intensive, especially for large-scale models that require multiple components and fine-tuned material compositions [22,23].
Continuum-based numerical methods, including the finite element method (FEM) and finite difference method (FDM), are widely used for predicting surface subsidence induced by underground excavations [24,25,26]. By treating the rock mass as a continuous medium, these approaches efficiently simulate large-scale elastic and elastic–plastic deformation and are therefore well suited for subsidence analysis. In particular, thermo-mechanical continuum models have been applied to UCG to investigate the influence of cavity growth and thermal effects on surface deformation, demonstrating their utility for representing coupled processes in cavity-forming operations [25,26]. However, their representation of the overburden remains fundamentally continuous, which limits their ability to capture discrete fracture and caving processes. A fundamental limitation of continuum-based models is their inability to realistically represent progressive roof collapse and discontinuous failure. Severe mesh distortion can arise once large deformations occur, and the caving zone is therefore often predefined, simplified, or neglected, preventing its natural evolution with excavation-induced stress redistribution [27]. Although adaptive remeshing strategies have been proposed to improve numerical robustness, they do not resolve the conceptual limitation of representing inherently discontinuous failure within a continuum framework. In addition, most continuum-based studies focus on single site-specific cases with fixed geological and material properties, which restricts their generalization across broader geological and operational conditions.
Discontinuum-based numerical methods, particularly the discrete element method (DEM), have therefore been adopted to explicitly simulate fracturing, block detachment, and progressive collapse of overburden rocks [28,29,30,31,32,33]. Block-based DEM and hybrid FEM–DEM approaches can reproduce joint-controlled deformation and large-scale roof caving when fracture networks are sufficiently characterized. However, their predictive performance is highly sensitive to assumptions regarding joint and fracture distributions, which are often poorly constrained and difficult to generalize. Particle-based DEM (e.g., Particle Flow Code—PFC) avoids the need for predefined joint geometries and enables simulation of crack initiation and propagation in heterogeneous brittle rocks. However, particle-based DEMs are computationally expensive and have often been applied in narrowly defined, case-specific studies without systematic parameter exploration. Consequently, despite their superior physical realism, existing DEM-based approaches have not yet yielded rapid, generalizable prediction tools for overburden caving geometry across diverse geological and operational settings.
Despite extensive developments in empirical, analytical, experimental, and numerical approaches, a fundamental trade-off persists in the prediction of overburden caving induced by underground excavations. Empirical and analytical methods offer high computational efficiency but rely on simplified assumptions and provide limited geometric information, while physical similarity modelling and high-fidelity numerical simulations can capture progressive failure mechanisms at the expense of substantial experimental or computational costs. As a result, existing approaches rarely achieve both mechanistic reliability and rapid applicability, particularly when fast predictions are required across a wide range of geological conditions and excavation configurations, which limits their usefulness for systematic parametric assessment and engineering decision-making.
In practice, direct in situ characterization of caving geometries is often technically challenging, costly, and in some cases, infeasible. Validated discrete element models, therefore, provide a viable alternative as physics-informed virtual experimental platforms, enabling systematic exploration of overburden failure behaviour under controlled and repeatable conditions that are otherwise inaccessible in field or laboratory settings. However, the direct use of DEM for engineering assessment remains limited by computational expense and scalability.
To bridge this gap, the present study proposes a hybrid DEM–regression–FEM workflow for the rapid prediction of overburden caving geometry induced by underground cavity formation. DEM simulations are employed to generate a structured dataset across systematically varied geomechanical and geometric parameters, including tensile strength, rock density, excavation span, and burial depth. Regression analysis is then used to distil these results into an explicit, parameter-driven prediction model that preserves the underlying failure mechanisms while enabling rapid evaluation. As a representative application, UCG is used as a demonstration example where the cavity geometries predicted from the developed model are incorporated into FEM-based subsidence simulations to quantify surface deformation. Overall, the proposed model prioritizes practical applicability and efficiency, providing a practical and physically grounded tool for rapid engineering assessment of overburden response in different underground excavation scenarios.
The main contributions of this study can be summarized as follows:
(1)
A systematic hybrid framework is established, in which DEM–regression is used to translate discontinuum simulations of overburden caving into a simplified prediction model while retaining key failure characteristics, and FEM is subsequently employed for surface subsidence assessment while incorporating the predicted caving geometry.
(2)
A unified multivariate prediction model for the height of the overburden caving zone is derived and assessed across a structured parameter space covering excavation geometry and key rock mass properties, providing a more general representation beyond individual site-specific case studies. Representative models from different applications published in the literature are collected and compared and jointly used to help derive (validate) the unified model developed.
(3)
The direct impact of overburden caving geometry on surface subsidence is quantitatively examined by incorporating the predicted caving profiles into subsidence simulations, showing the influences of caving on surface deformation development.

2. Methodology

2.1. DEM Numerical Modelling

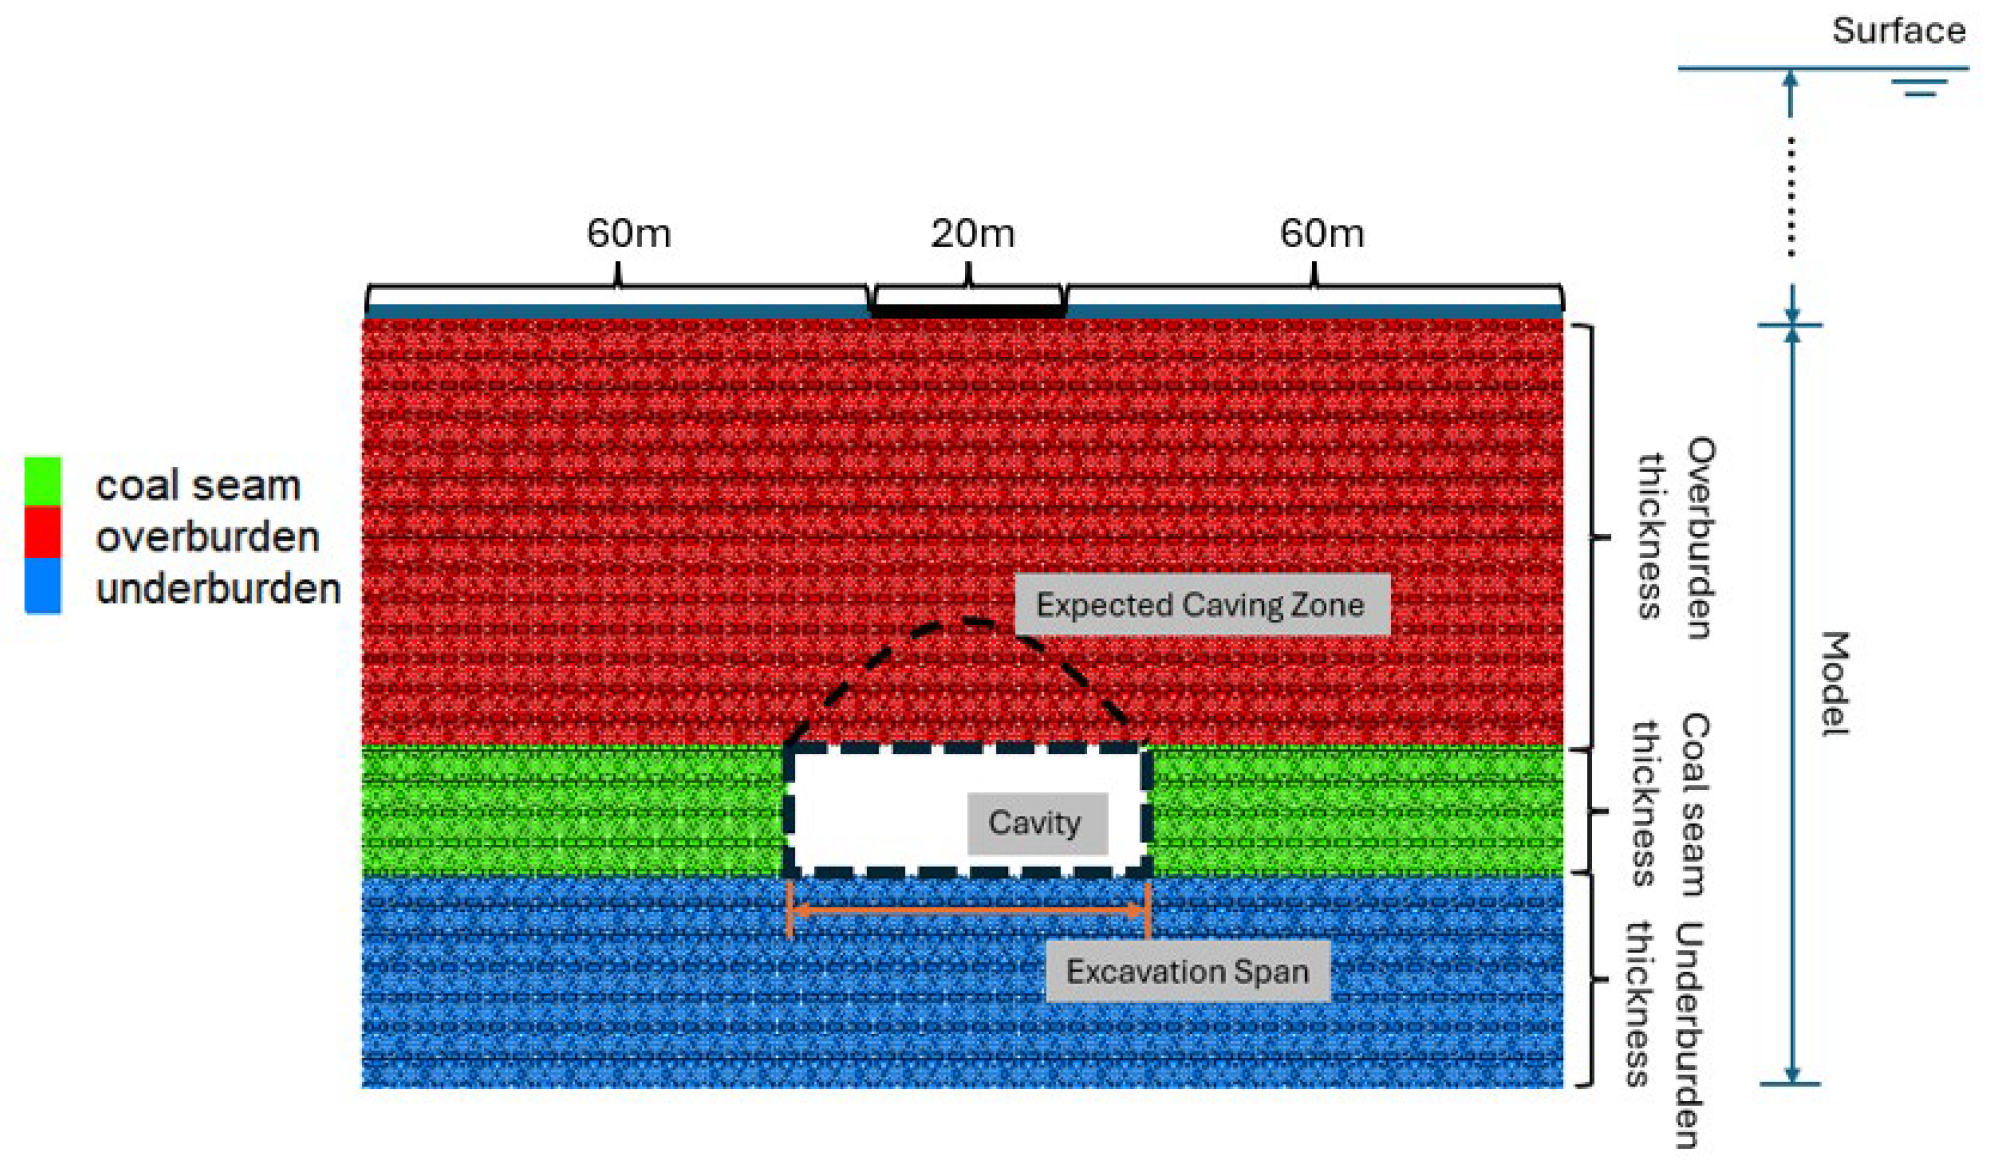
To investigate overburden caving induced by underground excavation, this study employs the two-dimensional discrete element software PFC2D 5.0 to conduct a series of numerical simulations. The excavation geometry is defined in a two-dimensional plane-strain condition, representing a transverse cross-section of an underground cavity formed by excavation. Within this model, the excavation span characterizes the effective opening width of the underground cavity in cross-section (Figure 1), controlling roof stability and caving development. This abstraction allows a systematic investigation of overburden response across a range of excavation scenarios. The modelling process includes model construction, material parameter calibration, boundary stress loading, and simulation of the excavation process.
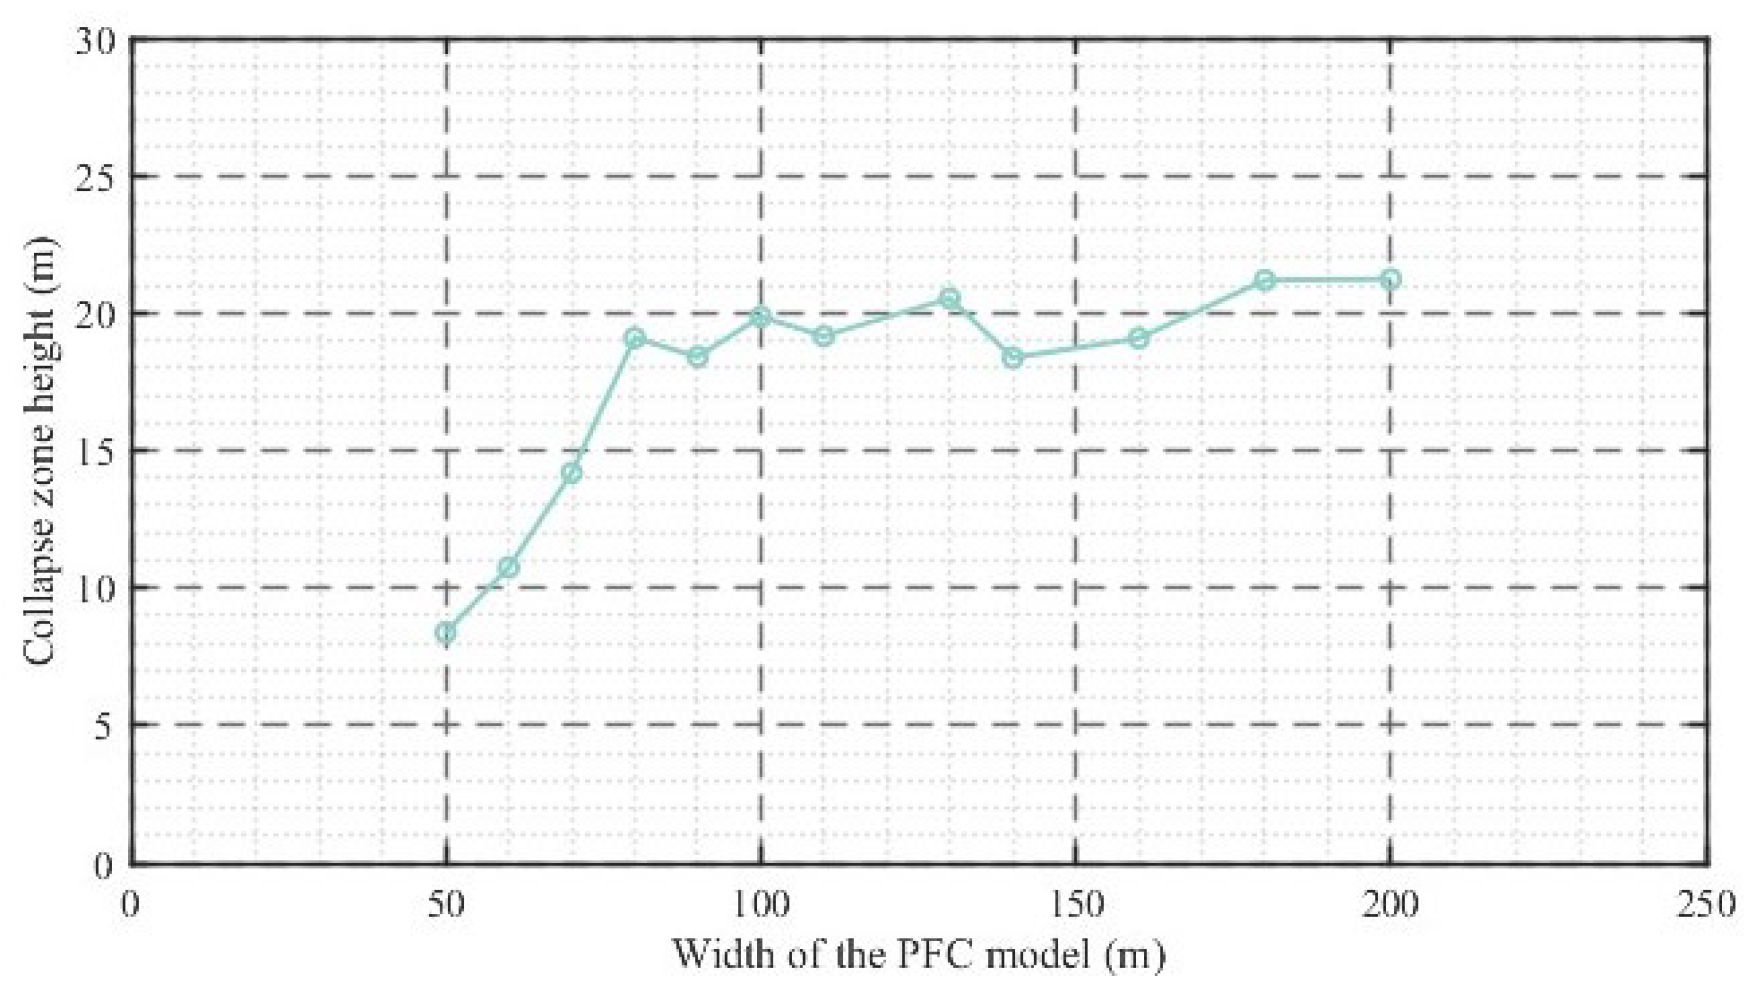
To minimize boundary effects, the model width should be sufficiently larger than the excavation span. In this study, a model-width sensitivity analysis was performed under a representative case with an excavation span of 40 m, while keeping the other parameters constant (Figure 2). The results indicate that the predicted caving height converges once the model width exceeds approximately 80 m, suggesting that lateral boundary effects become negligible beyond this threshold. Accordingly, a model width of 140 m was adopted to ensure adequate separation between the excavation cavity and the lateral boundaries while maintaining computational efficiency. For large burial depth cases, it is not feasible to consider the entire vertical dimension from the surface to the cavity. Accordingly, an explicit overburden thickness of 50 m above the excavation roof was included in the numerical model domain, while the gravitational effect of the remaining overlying strata was represented through equivalent vertical stress applied at the top boundary (Figure 1). Within the ranges of parameters investigated in this study, the predicted height of the caving zone remained well below the top boundary, indicating that its development was not constrained by the model height. The initial in situ stresses were calculated based on the gravitational stress at the burial depth. In PFC2D simulations, vertical boundary stress was applied through velocity-controlled servo loading at the top boundary. To maintain continuous contact between the top boundary and particles during large roof settlement following excavation, the top boundary was divided into three wall segments (60 m–20 m–60 m, Figure 1). This partition provides a narrow central control segment directly above the model centre and two wider side segments, allowing the servo controller to apply slightly different wall velocities when settlement is concentrated above the excavation. The segmentation is a numerical stabilization strategy to prevent the local loss of wall–particle contact and to maintain the target average vertical stress. Fixed walls were used for the bottom and both side boundaries. The thickness of the underburden was set to 25 m. Previous studies indicate that the maximum depth of floor failure typically does not exceed 22 m. Therefore, a 25 m thickness ensures the minimization of its influence on the caving behaviour [34]. The height of excavation is set at 15 m, corresponding to the main series coal seam thickness at Leigh Creek, South Australia [35]. The site is currently being investigated for a potential underground coal gasification project to generate syngas for urea production [36]. This study is part of the investigation to understand the environmental impacts of the gasification process.
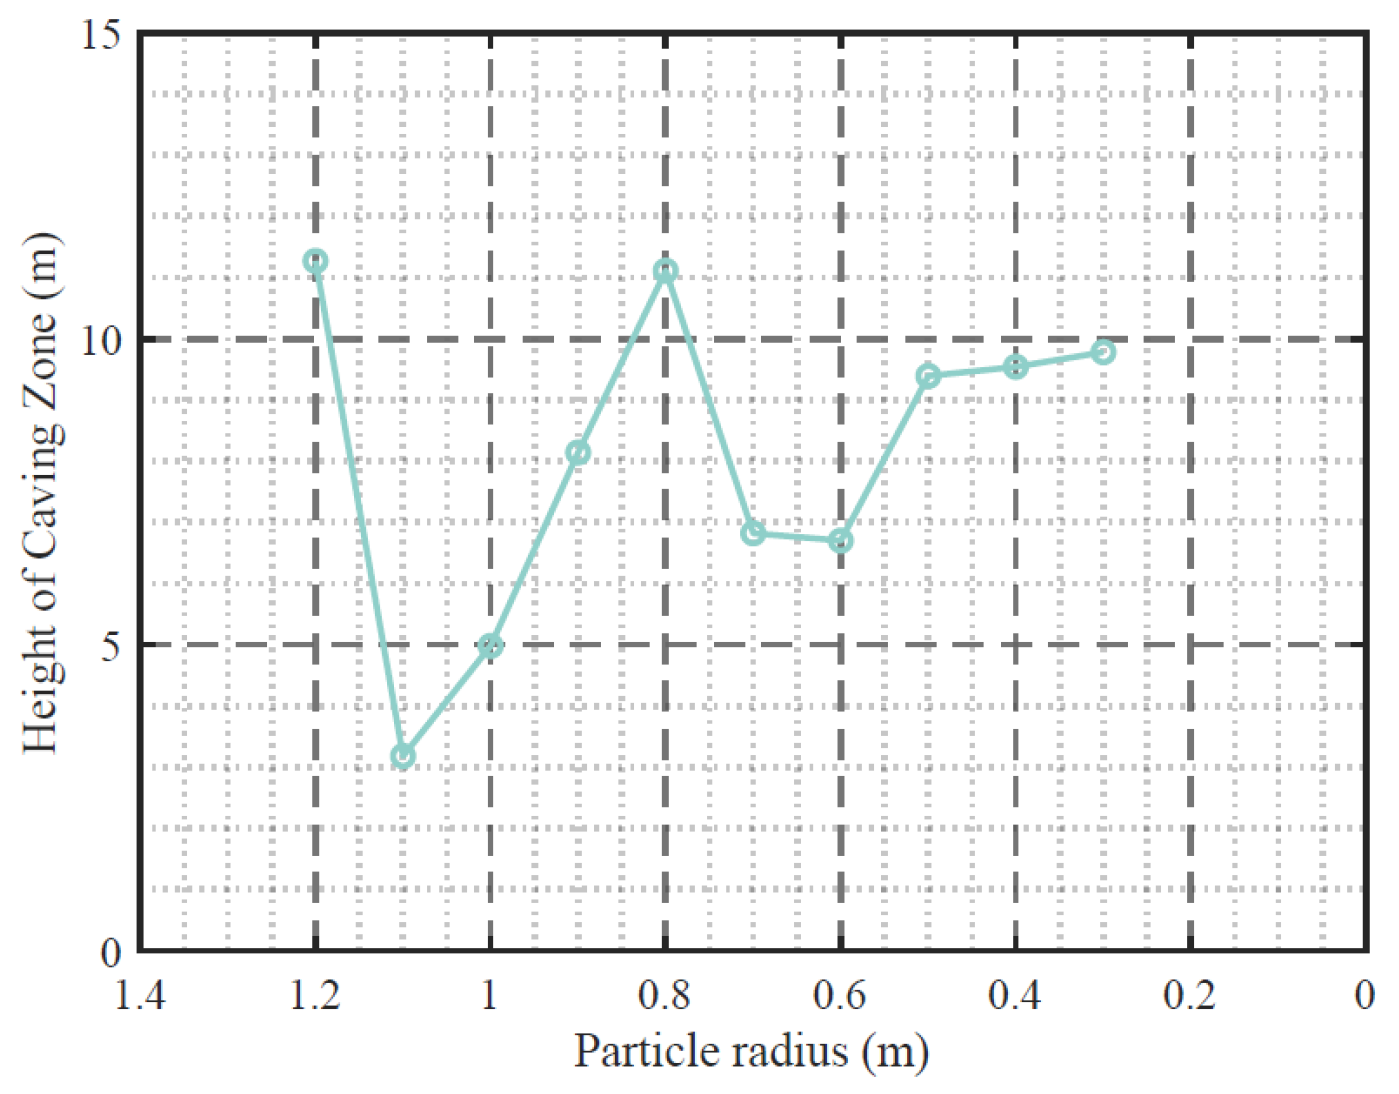
In PFC models, particles of the same size were distributed in a regular hexagonal spatial pattern. Although regular distribution reduces randomness, it also compromises the ability to correctly simulate the porosity of natural rock masses. A particle size sensitivity analysis was conducted to identify a suitable particle size to be used in the models that balances computational efficiency and model accuracy. Simulations using a particle radius ranging from 0.3 m to 1.2 m were performed while keeping other parameters unchanged, and the results are shown in Figure 3. The results indicate that the predicted caving zone height becomes more variable when the particle radius is too large. To ensure reliable and stable results and avoid excessive computational costs, a particle radius of 0.4 m was selected, resulting in approximately 23,000 particles in the PFC models.
The flat-jointed model (FJM) was used to simulate the bonds of particles, which is capable of representing both tensile and shear failures and effectively simulating fracture propagation and roof caving processes. Micro-parameters for bonds between particles were calibrated based on the simulation of uniaxial compression and direct tensile tests in PFC2D. Using the micro–macro-calibration approach proposed by Zhou et al. [37], Young’s modulus is predominantly controlled by the effective modulus of bond (E*), so E* can be adjusted to match the target modulus. Poisson’s ratio is influenced by both E* and the stiffness ratio of contact (k*) and calibrated by tuning k* once E* is fixed. The TS depends jointly on E*, k*, and the bond tensile strength (t*); in practice, t* is adjusted after the elastic properties are matched. The UCS is the most sensitive parameter, being affected by all micro-parameters mentioned above as well as the cohesion of bond (c*). Therefore, c* is calibrated at the final stage. The calibration procedure is illustrated using a representative material in the Supplementary Materials (Figures S1 and S2 and Table S1), which show the DEM stress–strain responses and quantitative comparisons with the target macroscopic properties.
In the initial stage, all three segments were assigned identical downward velocities to simulate a uniform vertical in situ stress field. The downward movement of the top boundary continued until the average contact stress between the top boundary and the particles reached the target vertical stress, calculated based on the overburden density and burial depth. In this study, excavation is idealized as an instantaneous removal of material over the full thickness of the seam within the two-dimensional plane-strain cross-section. The excavation was simulated by deleting particles in the expected excavation area. The unsupported overburden began to cave due to stress redistribution. Caving was driven by bond breakage, simulating fracture propagation, leading to the formation of the arch-shaped cavity. In the post-excavation phase, roof settlement can cause spatially uneven wall–particle contact along the top boundary. To maintain stable stress transfer and keep the average vertical stress close to the target value, a slightly higher servo loading velocity was applied to the central wall segment than to the two side wall segments. The simulation proceeded until the average convergence ratio fell below 1 × 10⁻⁵, indicating system stabilization in terms of particle velocity and contact stresses. The height of the final caving zone was then recorded for subsequent regression modelling and FEM analysis.
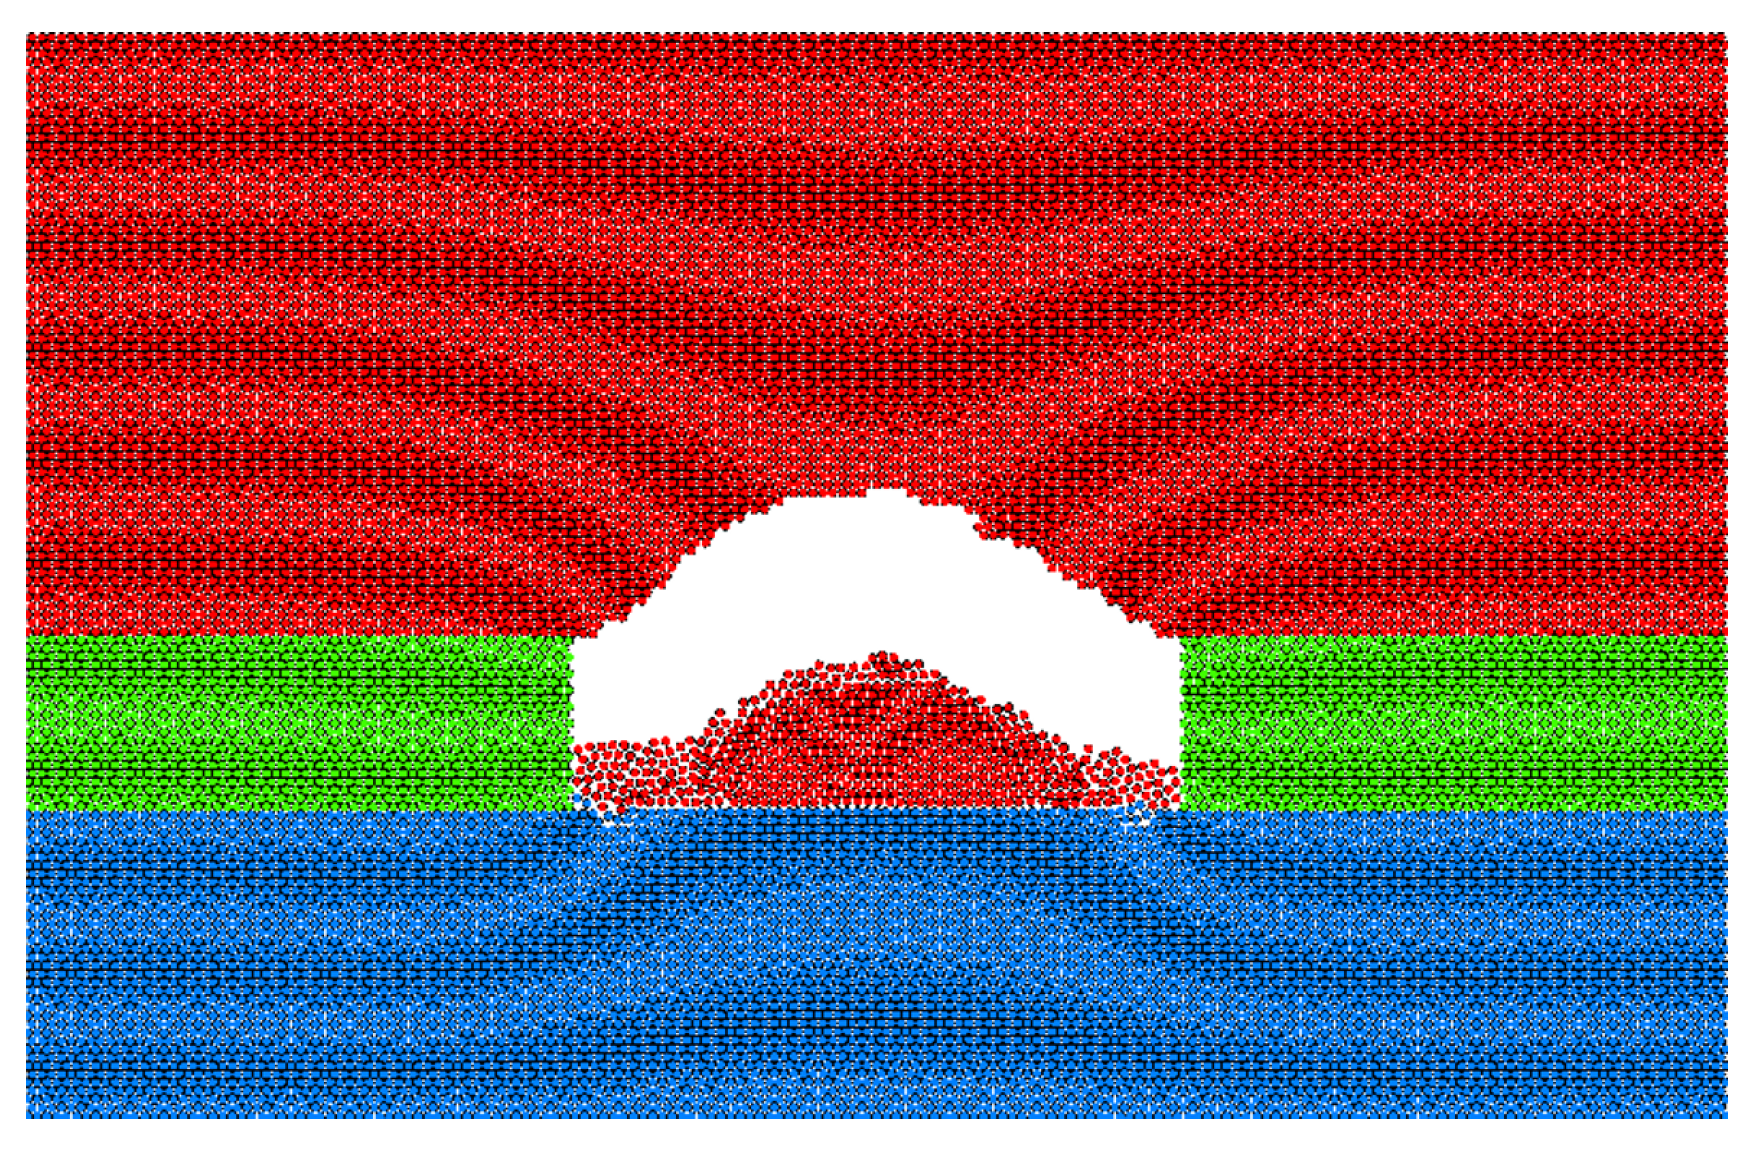
To qualitatively demonstrate the failure evolution captured by the PFC model, a representative simulation scenario is shown in Figure 4, where the caving initiates from bond breakage near the roof of the excavation, gradually forming an arch-shaped cavity and propagating upward as the overburden loses support. This example shows that the adopted DEM modelling approach can capture the key mechanisms of overburden failure induced by underground excavation. In the present model, the stress state is governed by the imposed vertical loading together with the elastic response of the rock mass under lateral constraint. Under such conditions, horizontal stresses develop naturally through the Poisson effect as a consequence of vertical compression, and their magnitude is controlled by Poisson’s ratio. This formulation typically results in a vertically dominated stress regime (σv > σh) for the elastic parameters representative of sedimentary rocks [38]. In such a stress environment, tensile cracking driven by stress relief and bending of the roof strata is the primary mechanism governing caving development. In contrast, in regions where the horizontal stress approaches or exceeds the vertical stress, confinement effects become more pronounced, and failure mechanisms would shift toward compression- or shear-dominated behaviour, which are not explicitly addressed in the present formulation.

2.2. Parameter Sensitivity Analysis and Regression Model

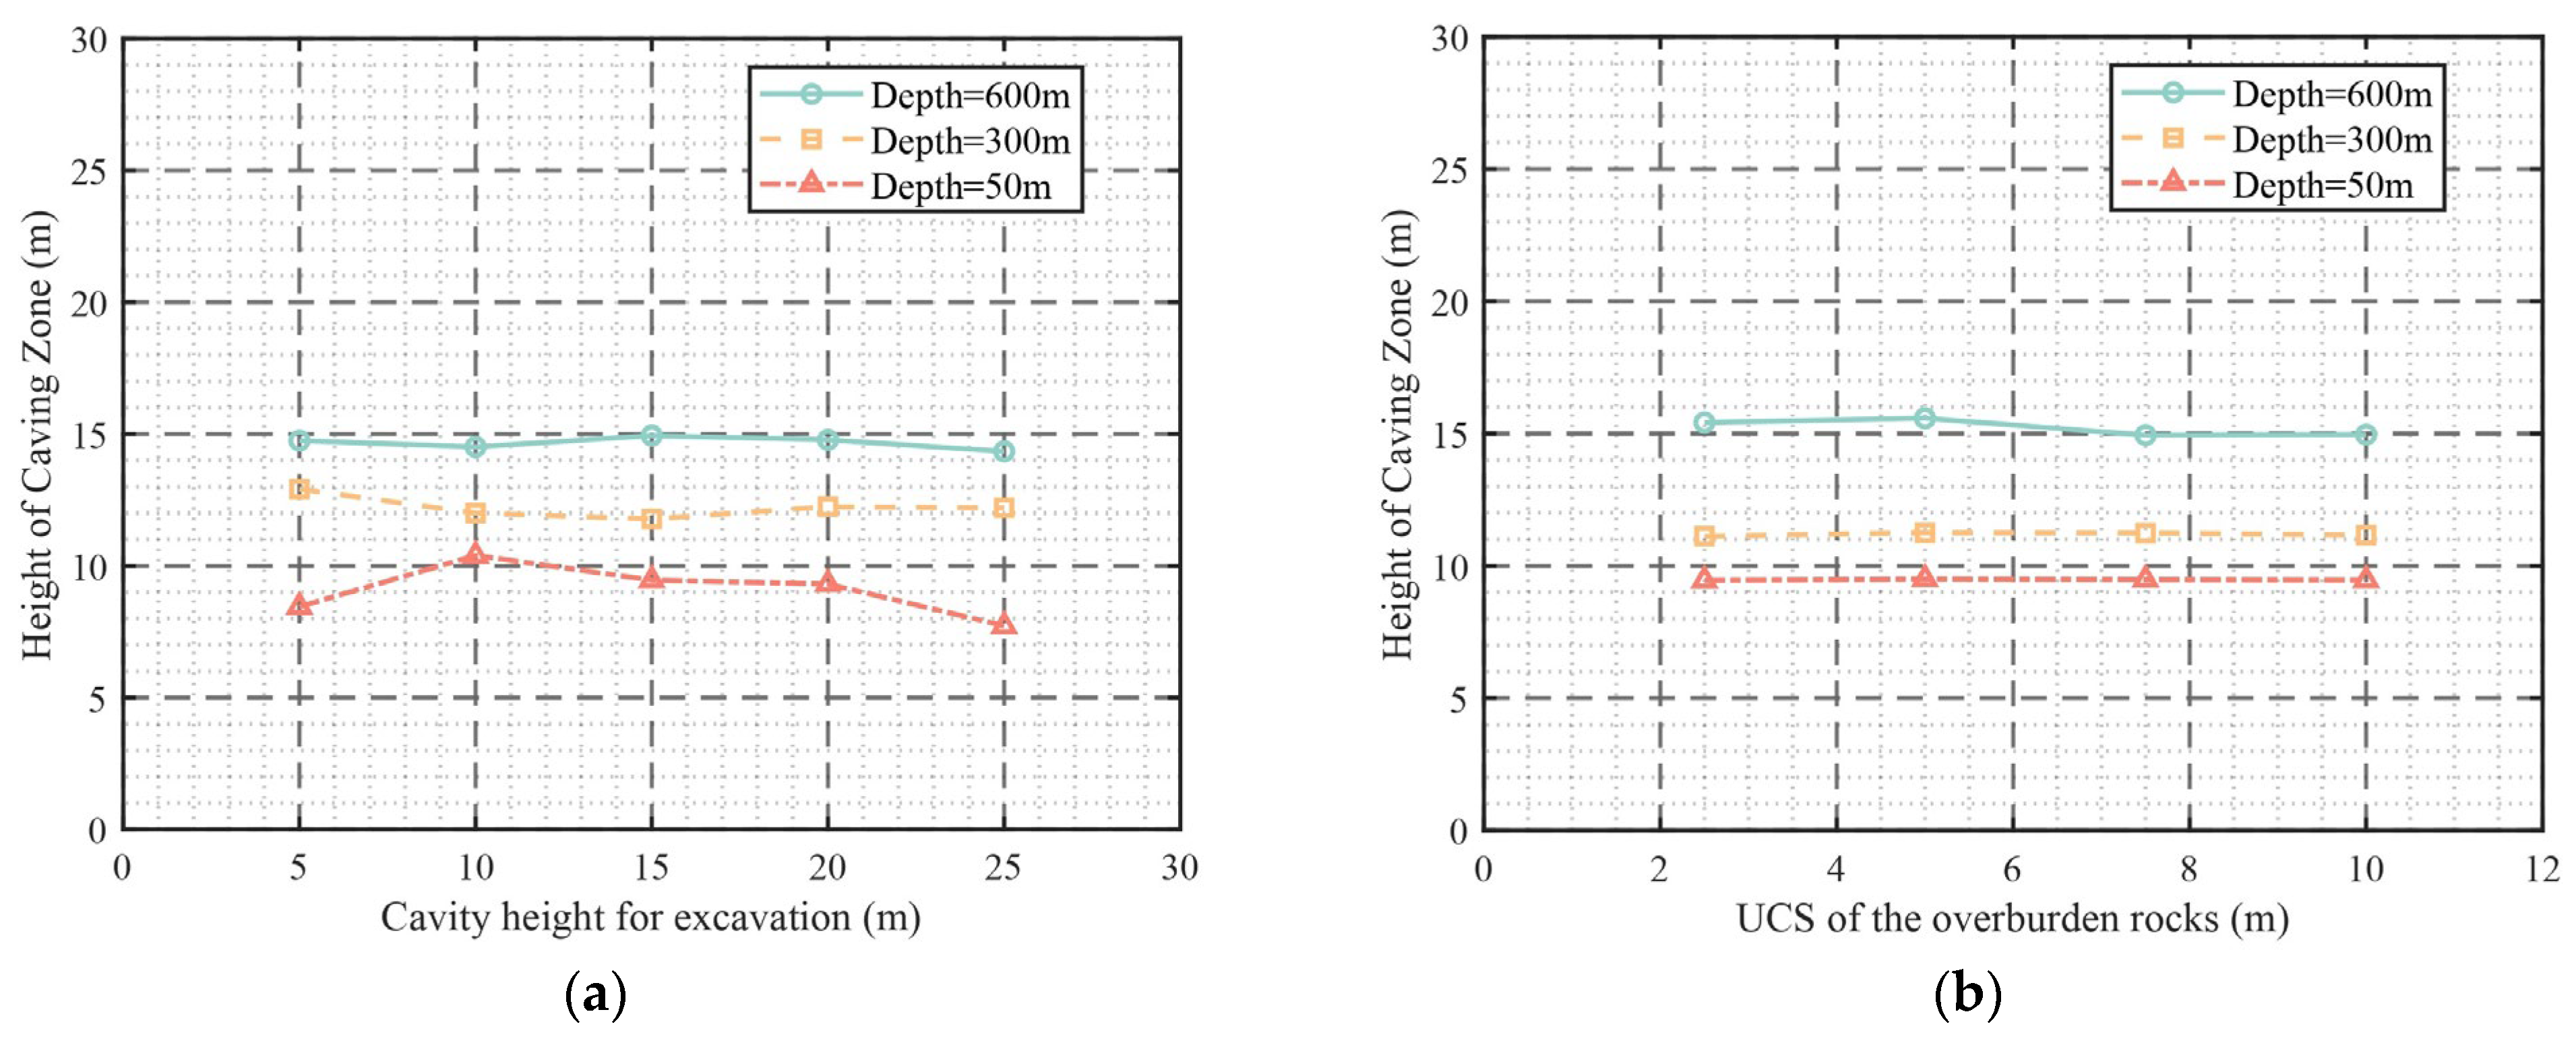
In this study, sensitivity analyses were performed based on DEM results to identify dominant parameters, followed by the development of a regression model. Six variables were considered initially, including tensile strength (TS), uniaxial compressive strength (UCS), density of overburden rocks ( ρ ), excavation span (s), height of excavation (h), and burial depth (d). The results shown in Figure 5 indicate that the height of excavation and UCS of the overburden rocks have limited impacts on the height of the caving zone in the PFC2D simulations. Therefore, to avoid introducing weakly correlated variables into the regression analysis, these two variables were excluded from the inputs for the final regression model. However, it should be noted that the limited impact of excavation height and UCS in the PFC models is purely due to the assumption used and the focus of the simulation. In this case, the excavation height is much smaller than the excavation span, and no significant horizontal tectonic stresses are considered in this study. The horizontal in situ stresses in the model arise only from gravitational loading, as stated above. Under such geometrical and stress conditions, variations in excavation height introduce relatively minor additional stress disturbance compared with changes in excavation span, and therefore, their influence on the development of the caving zone is not considered in the model. Consequently, the model developed is not applicable for excavations where the height or horizontal stresses are significant. And the caving of overburden in the model is assumed to be controlled by the bond breakage governed mainly by tensile failure, which makes the tensile strength the dominant mechanical property, overshadowing the effect of UCS. In reality, tensile strength and UCS of rocks are in general highly correlated, and the impact of UCS in this case can be considered as being implemented implicitly via tensile strength.
A total of 290 DEM simulations were performed. A second-order polynomial regression model was developed to describe the relationship between the four input variables and the height of the caving zone. In this, the general expression of the regression model involving four independent variables is given as follows:
y = a 0 + i = 1 4 a i x i + i = 1 4 a i i x i 2 + 1 i < j 4 4 a i j x i x j ,
where y is the height of the caving zone, a 0 is the constant term, a i are the coefficients for the linear terms, a i i are the coefficients for the quadratic terms, and a i j are the coefficients for the interaction terms between variables x i and x j . This form allows the model to capture both individual and combined nonlinear effects of the input variables on the response. The full models include 15 coefficients. Stepwise regression was conducted to eliminate less significant coefficients, only retaining coefficients with statistical significance (p < 0.05). This procedure was adopted to reduce model complexity and avoid over-parameterisation, given the finite size of the dataset (290 cases). The final model therefore represents a balance between flexibility and interpretability, retaining only statistically and physically meaningful terms. With 290 cases and 15 coefficients, the case-to-parameter ratio is approximately 19:1, which helps mitigate the risk of overfitting.
To verify the reliability of the developed regression model, the model was applied to a validation dataset derived from numerical simulation results. In addition, several published field measurements, similar physical model results, and numerical model results from the published literature were used to further assess the performance of the prediction model.

2.3. Comparison Between Two-Dimensional and Three-Dimensional PFC Models

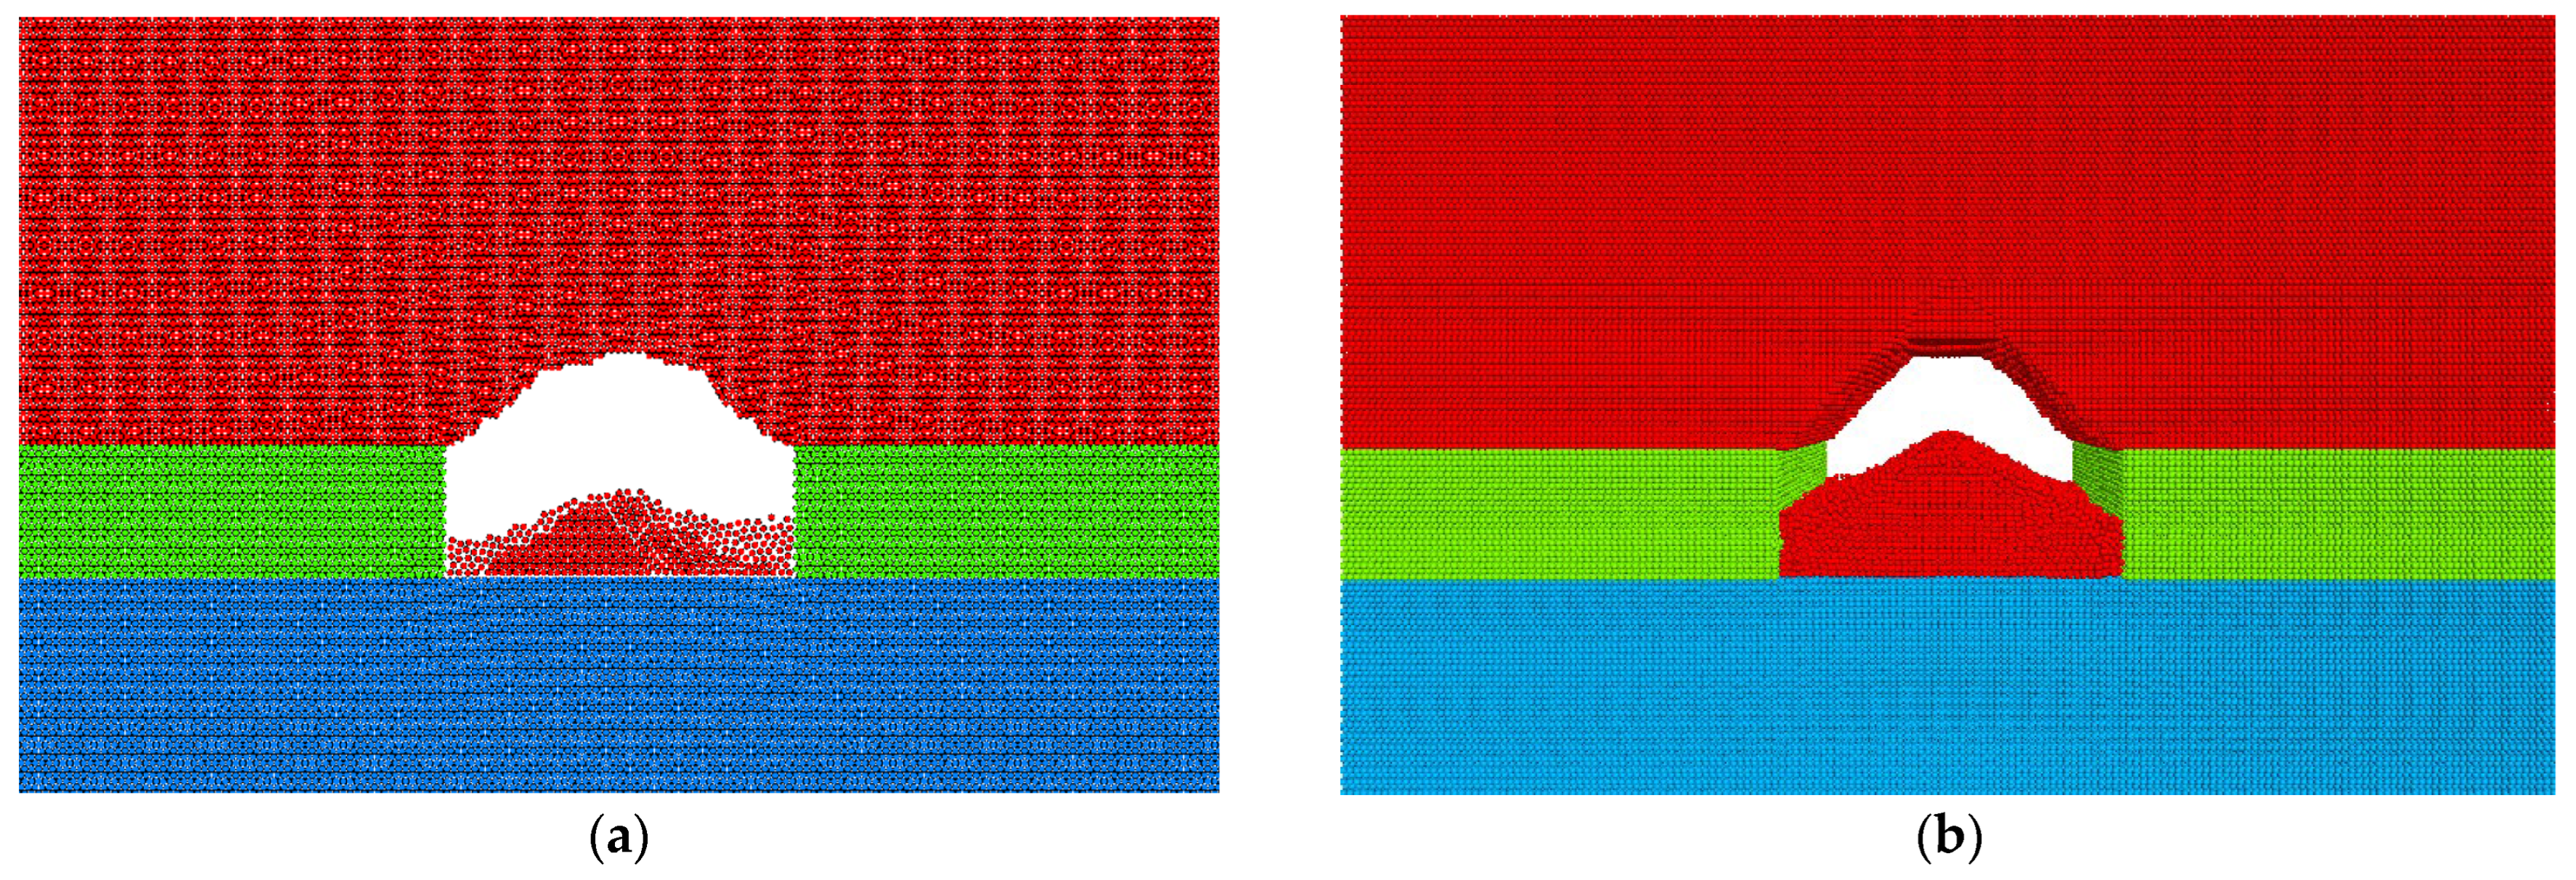
To assess the suitability of using 2D plane-strain simulations to model the caving response of a 3D problem, a representative three-dimensional model was constructed in PFC3D using the same excavation geometry, boundary conditions, and calibrated material properties as the 2D model. The 3D model adopted the same particle radius (0.4 m) as the 2D model to ensure consistent numerical resolution, and an out-of-plane thickness of 50 m was used to balance computational cost. Figure 6 compares the failure evolution and resulting cavity geometry predicted by the two approaches. The predicted caving heights are comparable (11.16 m in 2D versus approximately 12 m in 3D), indicating that the main features of the caving mechanism and overall failure extent are captured consistently. Differences in local cracking patterns are expected due to three-dimensional packing and boundary constraints. In addition, finite model thickness may suppress certain out-of-plane failure modes. Therefore, the 3D simulation is used here as a consistency check rather than a comprehensive representation of full three-dimensional failure processes. The 3D model required 1,647,425 particles compared with 21,574 particles in 2D, leading to substantially higher computational demand. For this reason, the subsequent parametric study and regression dataset generation are based on the 2D simulations, which are appropriate for long, approximately uniform excavation geometries that can be idealized as plane-strain problems.

2.4. FEM Modelling and Analysis of Surface Subsidence

To investigate the influences of key parameters on the surface subsidence, a series of FEM models using ANSYS 2024 R1 under 2D plane-strain conditions were developed based on the caving zone predicted from the developed regression model. Due to geometrical and loading symmetry, only half of the model domain was simulated, with the symmetric boundary condition imposed to reduce computational costs. In FEM models, the full overburden depth dimension was used to minimize the boundary effect. The height of the FEM model therefore varied with burial depth, ranging from 365 m to 615 m, corresponding to the burial depths of 50 m to 300 m, while the width was fixed at 1500 m. The boundary conditions were set as follows: the left boundary of the model is the symmetric boundary (restricting normal displacement), the right boundary is restricted in horizontal displacement, the bottom boundary is restricted only in vertical (Y-direction) displacement, and the top boundary is a free surface. The rock mass is modelled as a homogeneous, linear elastic material with properties including Young’s modulus (E), Poisson’s ratio (ν), and density (ρ), consistent with those used in the DEM to ensure model consistency. This simplified constitutive representation is adopted to provide a consistent and computationally efficient basis for comparing the influence of different caving geometries on surface displacement patterns. It is not intended to reproduce the full nonlinear or plastic response of the overburden, but rather to isolate the geometrical effects of the caved zone on subsidence development under controlled mechanical assumptions. As a result, the FEM analysis cannot capture plastic yielding, progressive damage accumulation, or the nonlinear evolution of settlement troughs that may occur in real rock masses under large deformation. Accordingly, the FEM results in this study should be interpreted in a comparative sense, highlighting relative trends and sensitivities associated with variations in caving height and shape, rather than as quantitative predictions of absolute settlement magnitudes or yielding zones. To benchmark the finite element implementation adopted in this study, the predicted maximum surface subsidence for representative single-cavity cases was compared with the corresponding results reported by Jiang et al. [39] using the same geometric configuration and modelling assumptions. The reported maximum surface subsidence for the largest cavity ( 30   m × 30   m × 15   m ) is 7.14 mm, whereas the present model yields 7.82 mm. For the 26   m × 26   m × 15   m cavity, the reported maximum subsidence is 5.15 mm, and the present model predicts 6.10 mm. These comparisons indicate that the present FEM setup is broadly consistent with the published results for single-cavity subsidence and is therefore suitable for the subsequent comparative analyses performed in this study. In addition, an external consistency check was conducted by compiling representative published field monitoring cases of surface subsidence above underground extractions. Given the differences in mining geometry, stratigraphy, and constitutive behaviour between sites and the simplified elastic FEM adopted here, this comparison is intended as an order-of-magnitude plausibility check based on the reported maximum subsidence, rather than a site-specific validation. According to the caving patterns obtained from PFC2D simulations and supported by field observations, the collapsed cavity typically exhibits an arched geometry. Therefore, in the FEM model, after the caving zone height was determined using the regression model, an arched roof was manually constructed to represent the cavity geometry.
Three representative FEM cases were modelled. Vertical displacements at the top surface of the model (ground surface) were extracted to derive surface subsidence curves. The analysis focused on two key subsidence indicators: maximum subsidence and zone of influence. These indicators are critical as they directly reflect the potential risk to surface infrastructure and the spatial extent of the affected area.

3. Results and Discussion

3.1. Analysis of the Impacts of Key Parameters on the Height of the Caving Zone

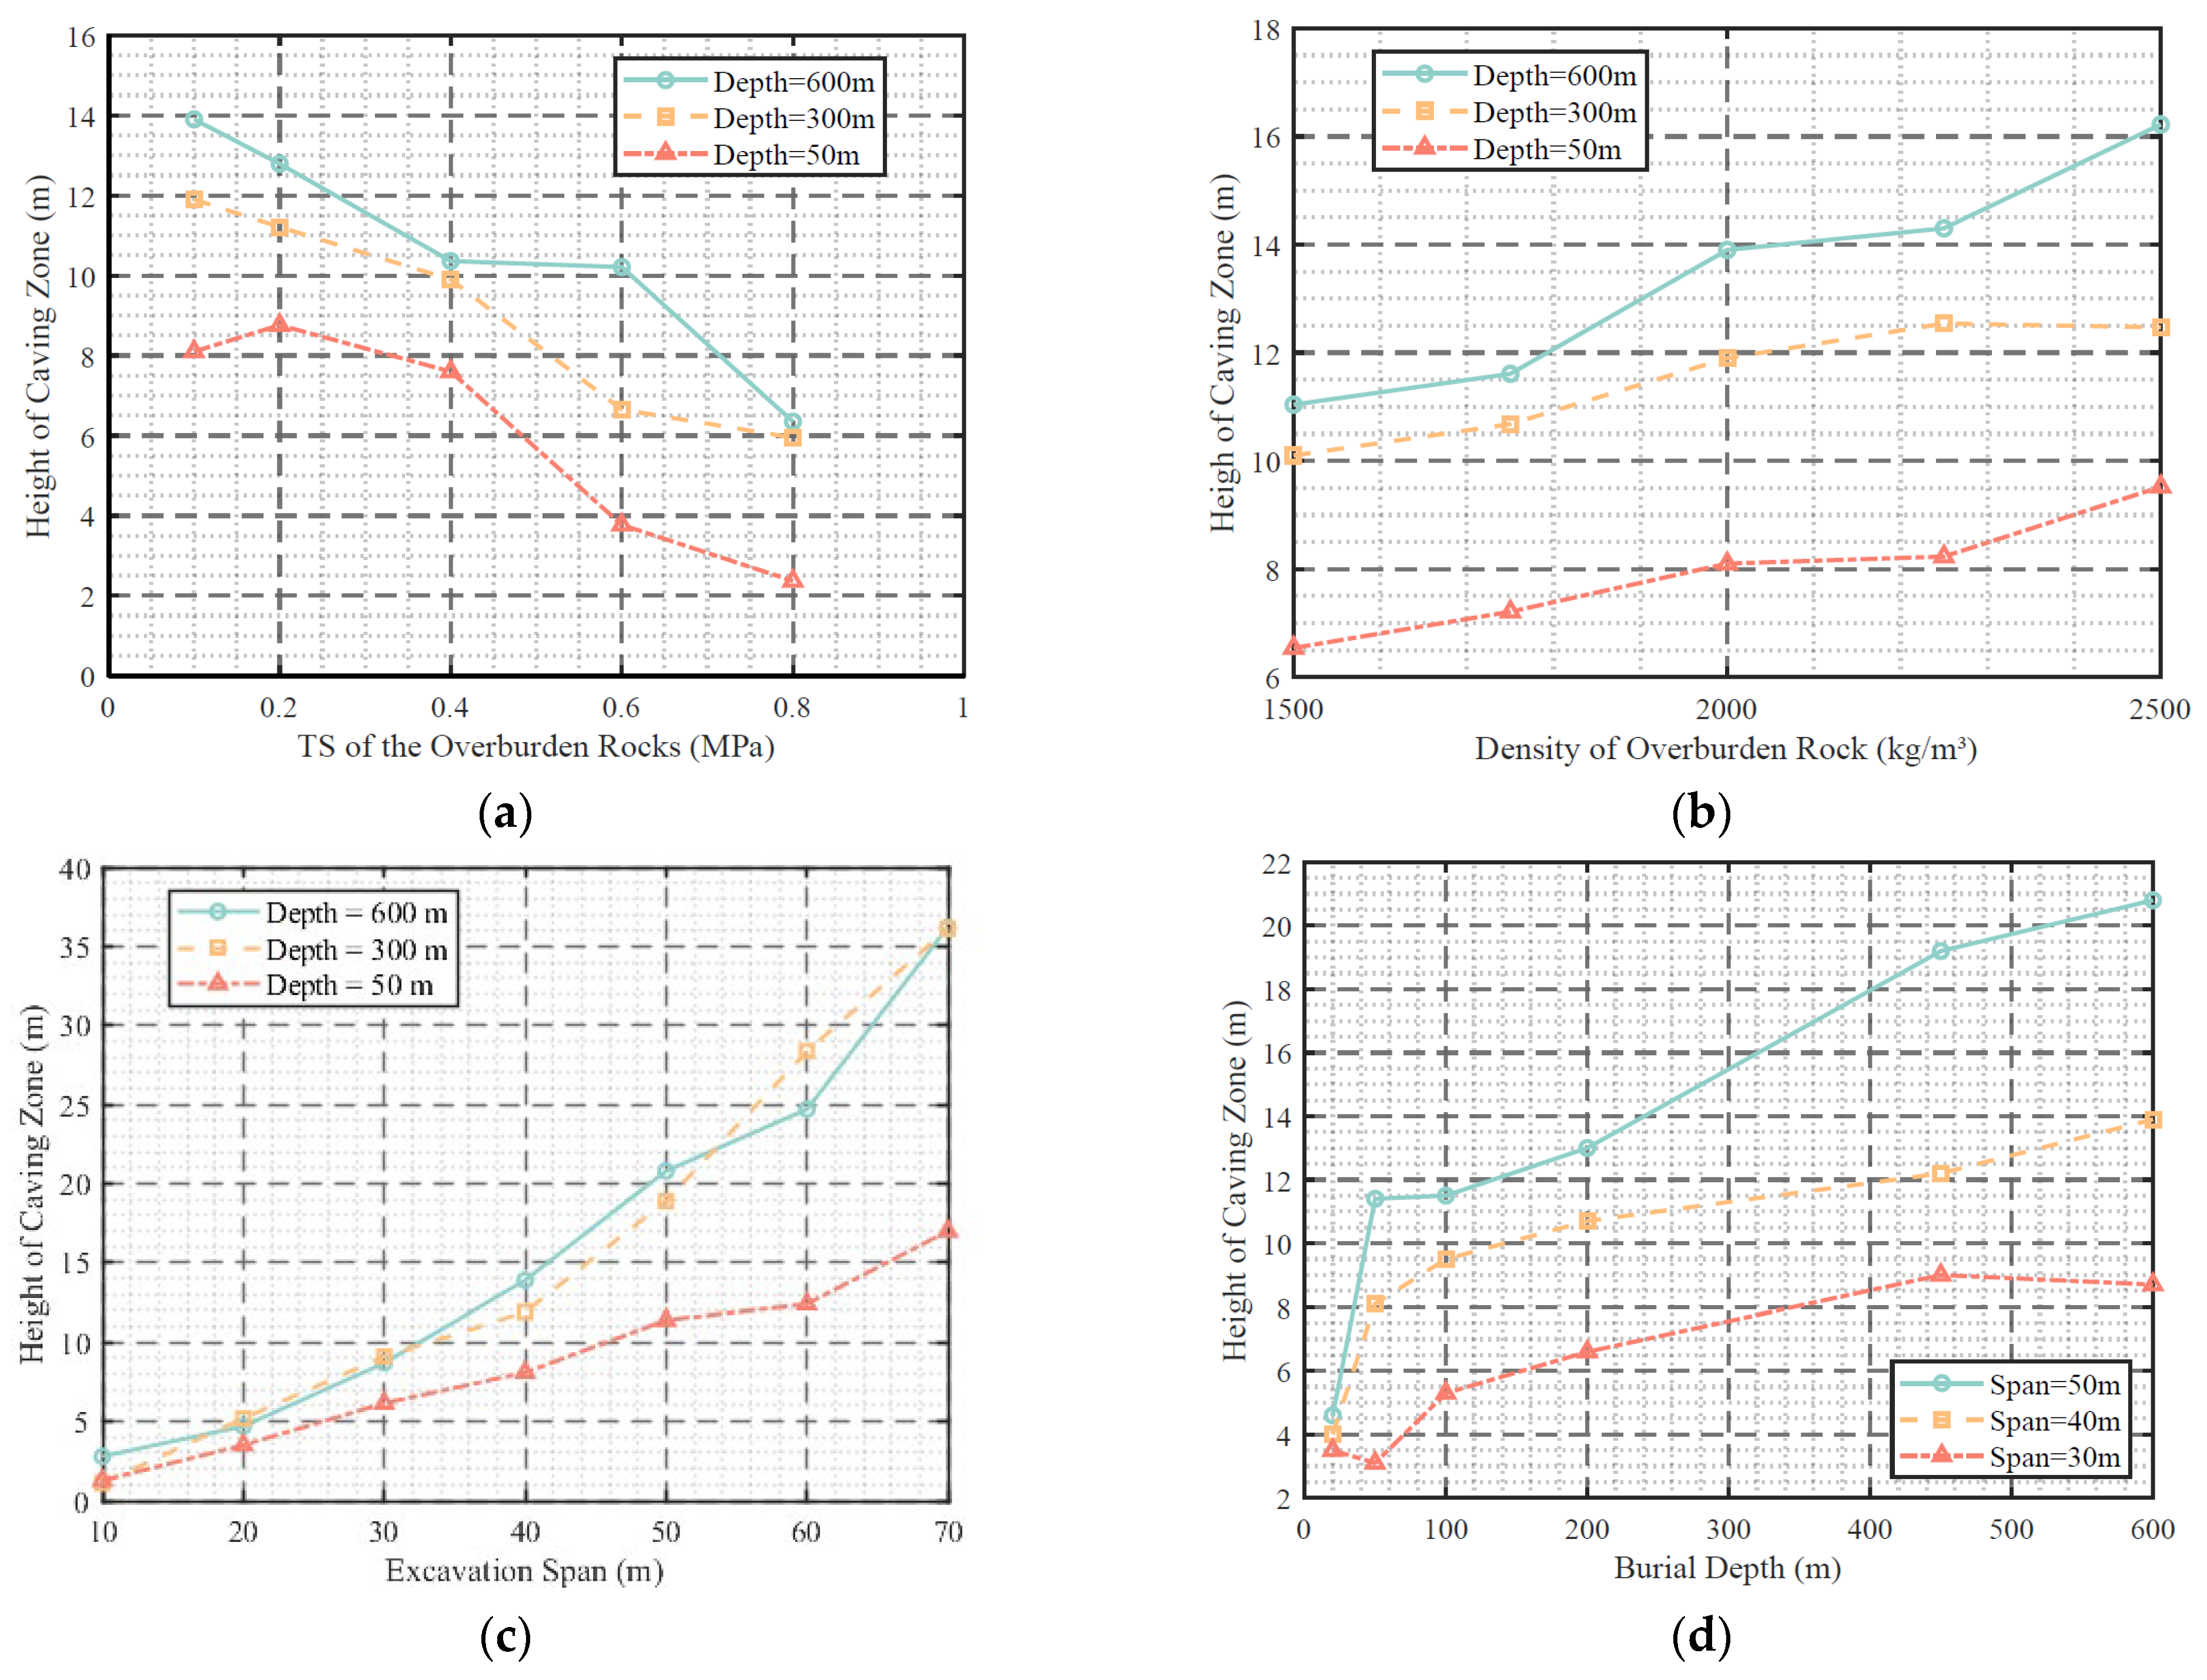
Figure 7 illustrates the influences of rock tensile strength, rock density, and excavation span on the height of the caving zone obtained from the PFC2D models under burial depths of 600 m, 300 m, and 50 m, respectively. Figure 7d shows the variation in the height of the caving zone against increasing burial depth, while keeping tensile strength, density, and excavation span constant.
From the figure, the following nonlinear and depth-dependent characteristics relevant to model formulation can be identified:
  • Tensile strength (TS): The influence of tensile strength on caving height is strongly nonlinear, with high sensitivity at low TS values and a diminishing marginal effect at higher TS. This behaviour indicates that a linear representation would be insufficient and motivates the inclusion of higher-order terms in the regression formulation.
  • Density: The effect of density becomes significant only at greater burial depths, suggesting that density primarily acts through its coupling with in situ stress rather than as an independent controlling parameter. Accordingly, density is treated as a secondary variable whose influence is conditional on burial depth.
  • Excavation span: Excavation span exerts a dominant and nonlinear control on caving development, reflecting the geometric control on stress redistribution and roof stability. This supports its role as a primary predictor and justifies the use of nonlinear and interaction terms involving the span parameter.
  • Collectively, these observations provide the basis for the structure of the subsequent regression model, in which excavation span, burial depth, and tensile strength are treated as primary predictors, while density is included as a secondary modifier.
The effect of the excavation span aligns well with the arching theory—wider spans reduce the self-supporting capacity of rock masses, leading to a greater increase in caving height. Regarding burial depth, its primary impact shows the effect of in situ stress variations. At shallow depth, increased depth elevates vertical stress, intensifying tensile failure and accelerating the growth of the height of the caving zone. In deep conditions, under high in situ stresses, fractures can be suppressed and tend to close, leading to a transition in failure mode from tensile failure to shear failure; therefore, the degree of impact on the caving height is reduced. Rock density primarily influences the magnitudes of in situ stresses through its contribution to overburden weight. These findings suggest that in deep mining, optimizing the excavation span is a more practical and effective strategy than relying on the inherent strength of the rock mass to reduce the size of the caving zone. The impact of rock density on overburden caving is limited, as it acts only through its contribution to gravitational loading and the resulting in situ stress field, particularly in shallow excavations. Rock density is therefore interpreted as a secondary background parameter rather than a dominant parameter. In a particular site, the variation in rock density is limited. Given that the proposed model is intended to be applicable across different geological conditions where density variations may be more pronounced, density is still incorporated in our model as a variable. Note that the rock mass is assumed to be homogeneous in the models, and as such, the influence of natural joints and bedding planes, which commonly exist in laminated rock masses, is not considered at this stage. This simplification may lead to an underestimation of the actual height of the overburden caving zone.

3.2. Regression Model and Visualization

In total, 290 PFC simulations were conducted to generate the dataset to derive the prediction model. These simulations cover the excavation span with a range of 10–80 m, tensile strength from 0.05 to 1.8 MPa, burial depth from 50 to 600 m, and density from 1500 to 2500 kg/m3. The applicability and reliability of the regression model are therefore limited to predictions within these parameter ranges. Based on the quadratic polynomial regression described earlier and subsequent stepwise regression to assess parameter sensitivity, only those terms that were statistically significant (p < 0.05) and contributed meaningfully to the model performance were retained, while the remaining higher-order and interaction terms were eliminated due to negligible or redundant effects. As a result, the final prediction model retains two quadratic terms and four interaction terms, as shown in Equation (2) below:
h = 0.0017 × s 2 + 2.785 × t 2 + 0.00032 × s × d 0.178 × s × t + 0.000075 × s × ρ 0.002 × t × ρ ,
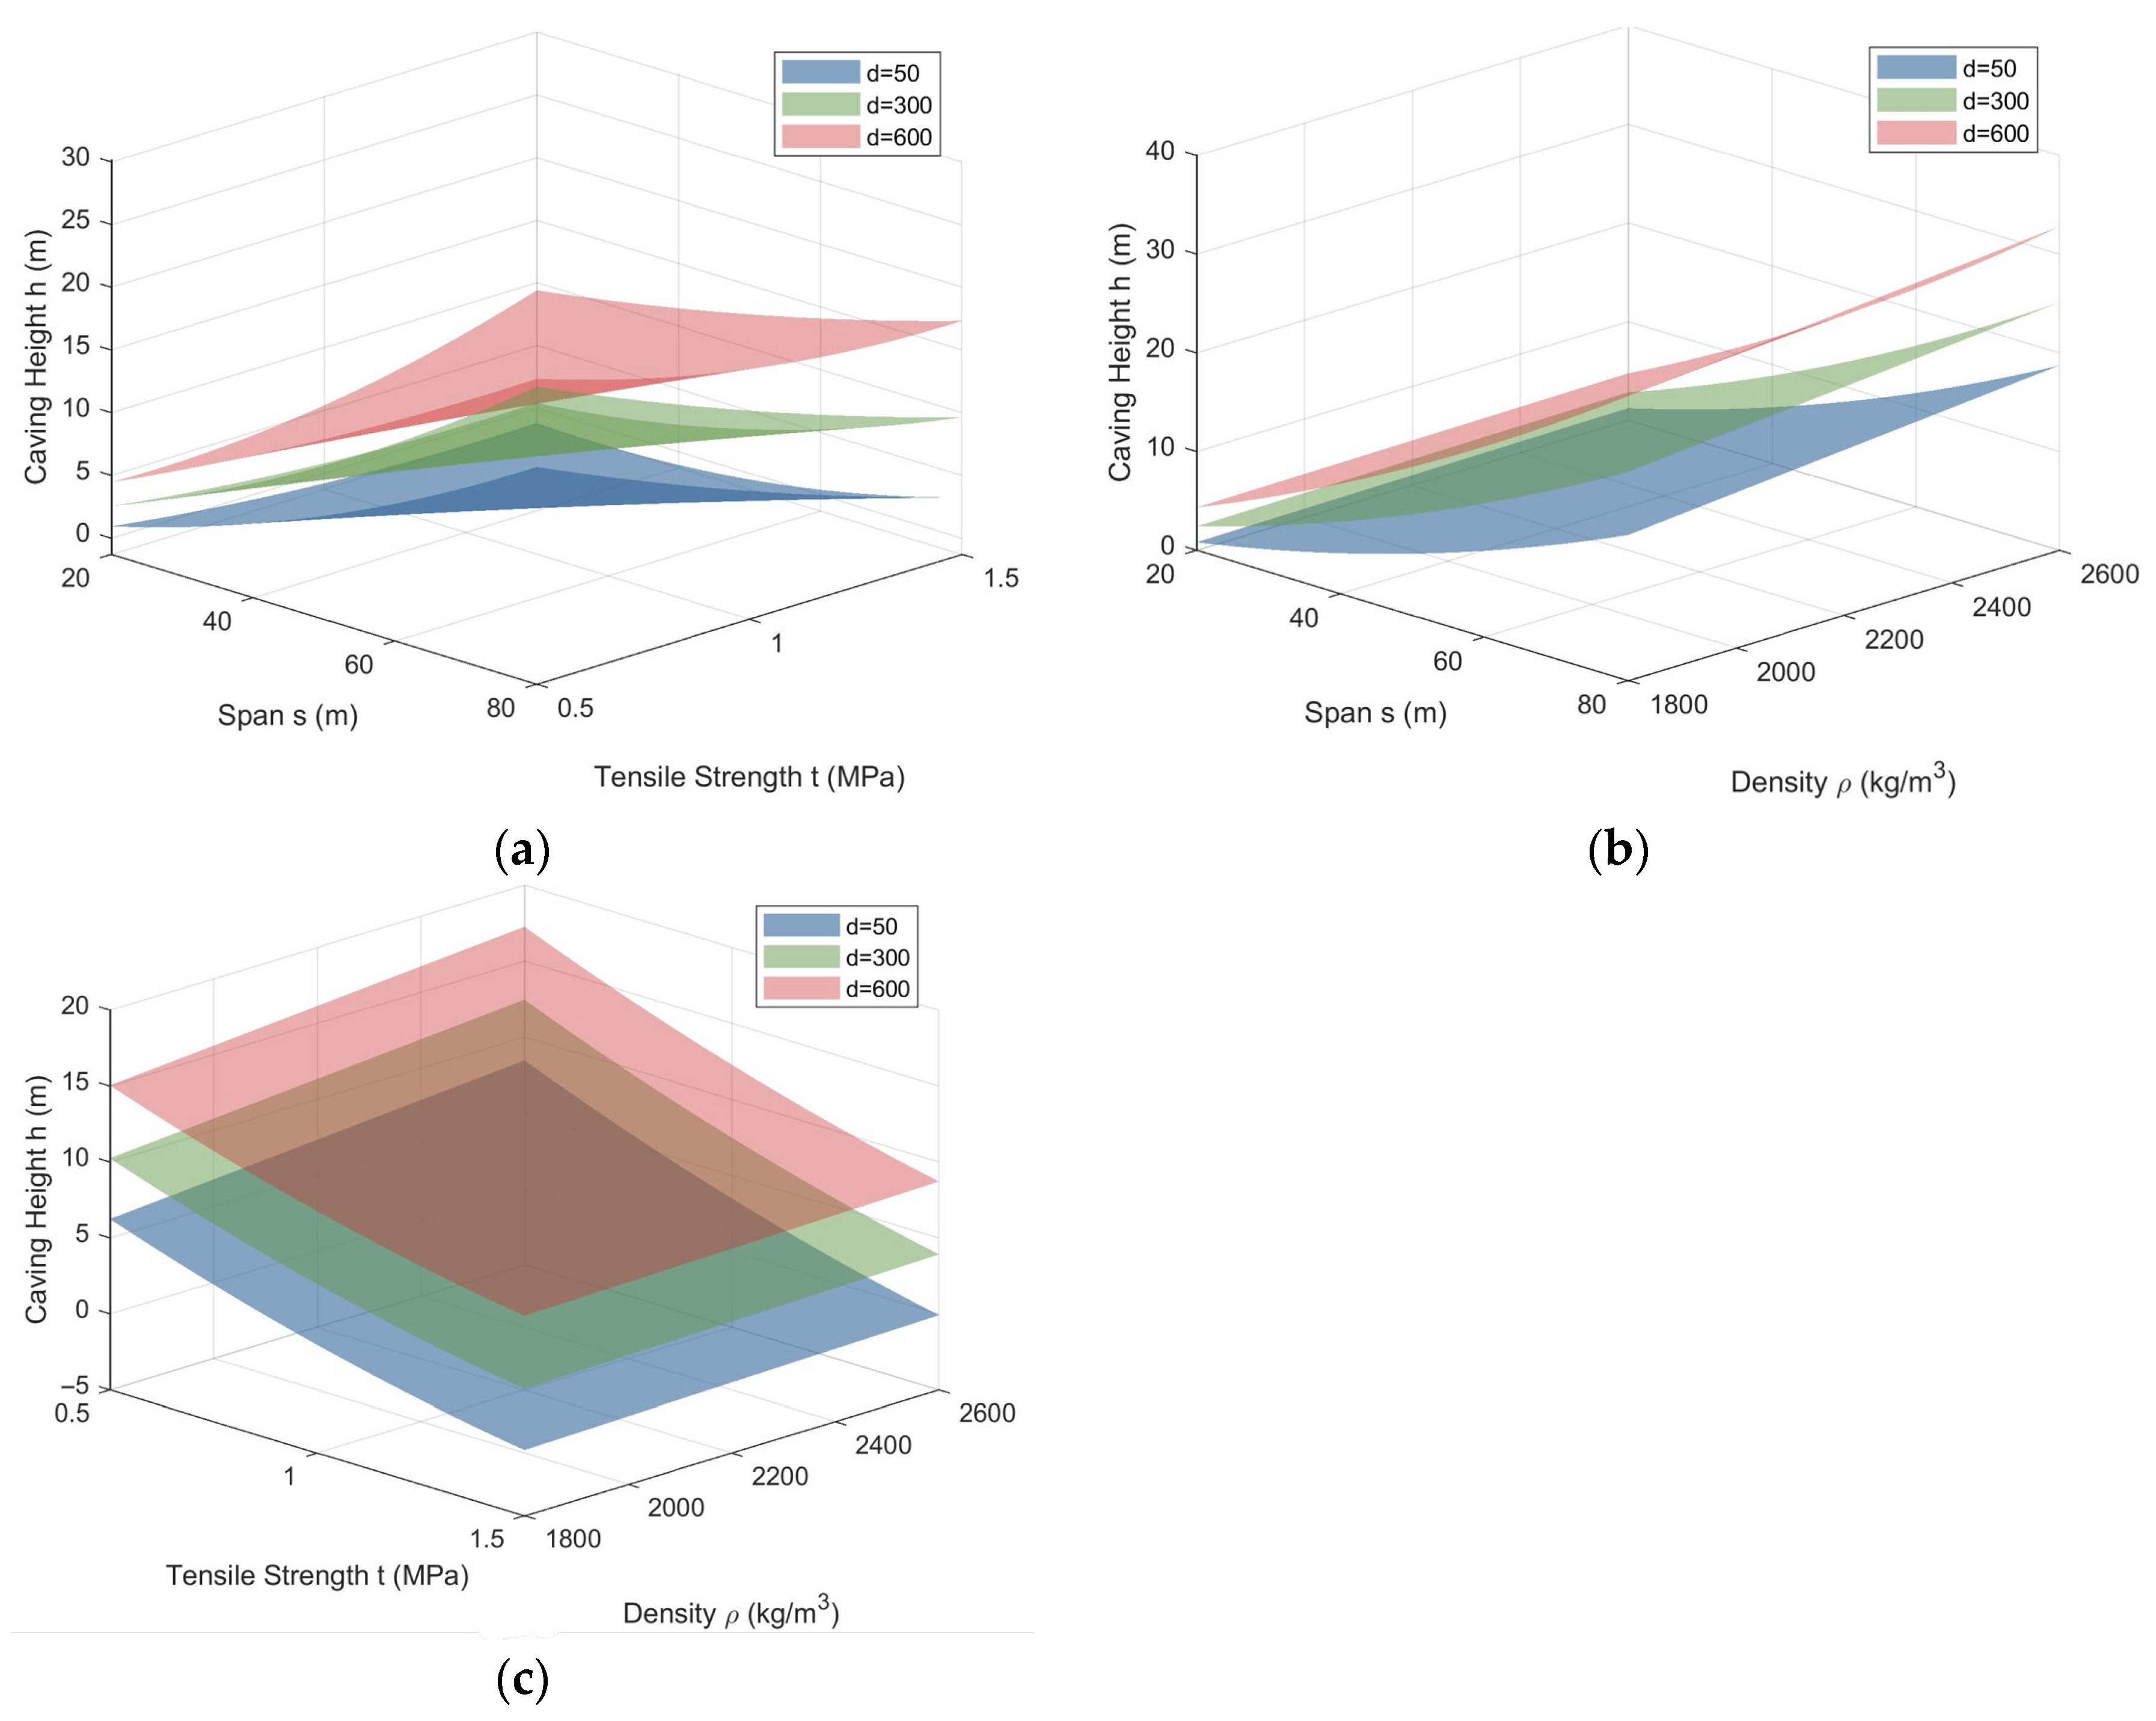
where h = height of caving zone (m), s = excavation span (m), t = TS (MPa), d = depth (m), and ρ = density (kg/m3). Figure 8 presents some key surface plots of the regression model, showing the variation in h against a combination of three pairs of input variables.
A nonlinear term in the excavation span is included in the regression model, and its coefficient varies with burial depth to reflect the increasing sensitivity of caving height to span in deeper conditions. The fitted model further indicates that tensile strength has a stronger influence under shallow burial conditions, where low-strength rock masses are more susceptible to tensile failure, whereas under deep burial conditions, this influence is reduced due to increased confinement from higher overburden and lateral in situ stresses. Similarly, density acts primarily as a depth-dependent modifier: its influence becomes more pronounced at greater burial depths through its contribution to overburden stress but remains secondary under shallow or small-span conditions. Figure 8 provides an illustrative visualization of these modelled response patterns and their interactions. Overall, the derived model suggests that excavation span is the primary variable impacting the overburden caving, especially in deep conditions, while rock tensile strength governs caving behaviours under shallow burial conditions. Therefore, excavation span, burial depth, and tensile strength exert dominant influences on the size of the caving zone, while the effect of density is negligible under conditions of small excavation span, shallow burial depth, or high tensile strength conditions. These insights may help guide parameter selection for excavation design and highlight the need to consider burial depth when evaluating the relative importance of material properties.

3.3. Sensitivity Analysis and Validation of the Regression Model

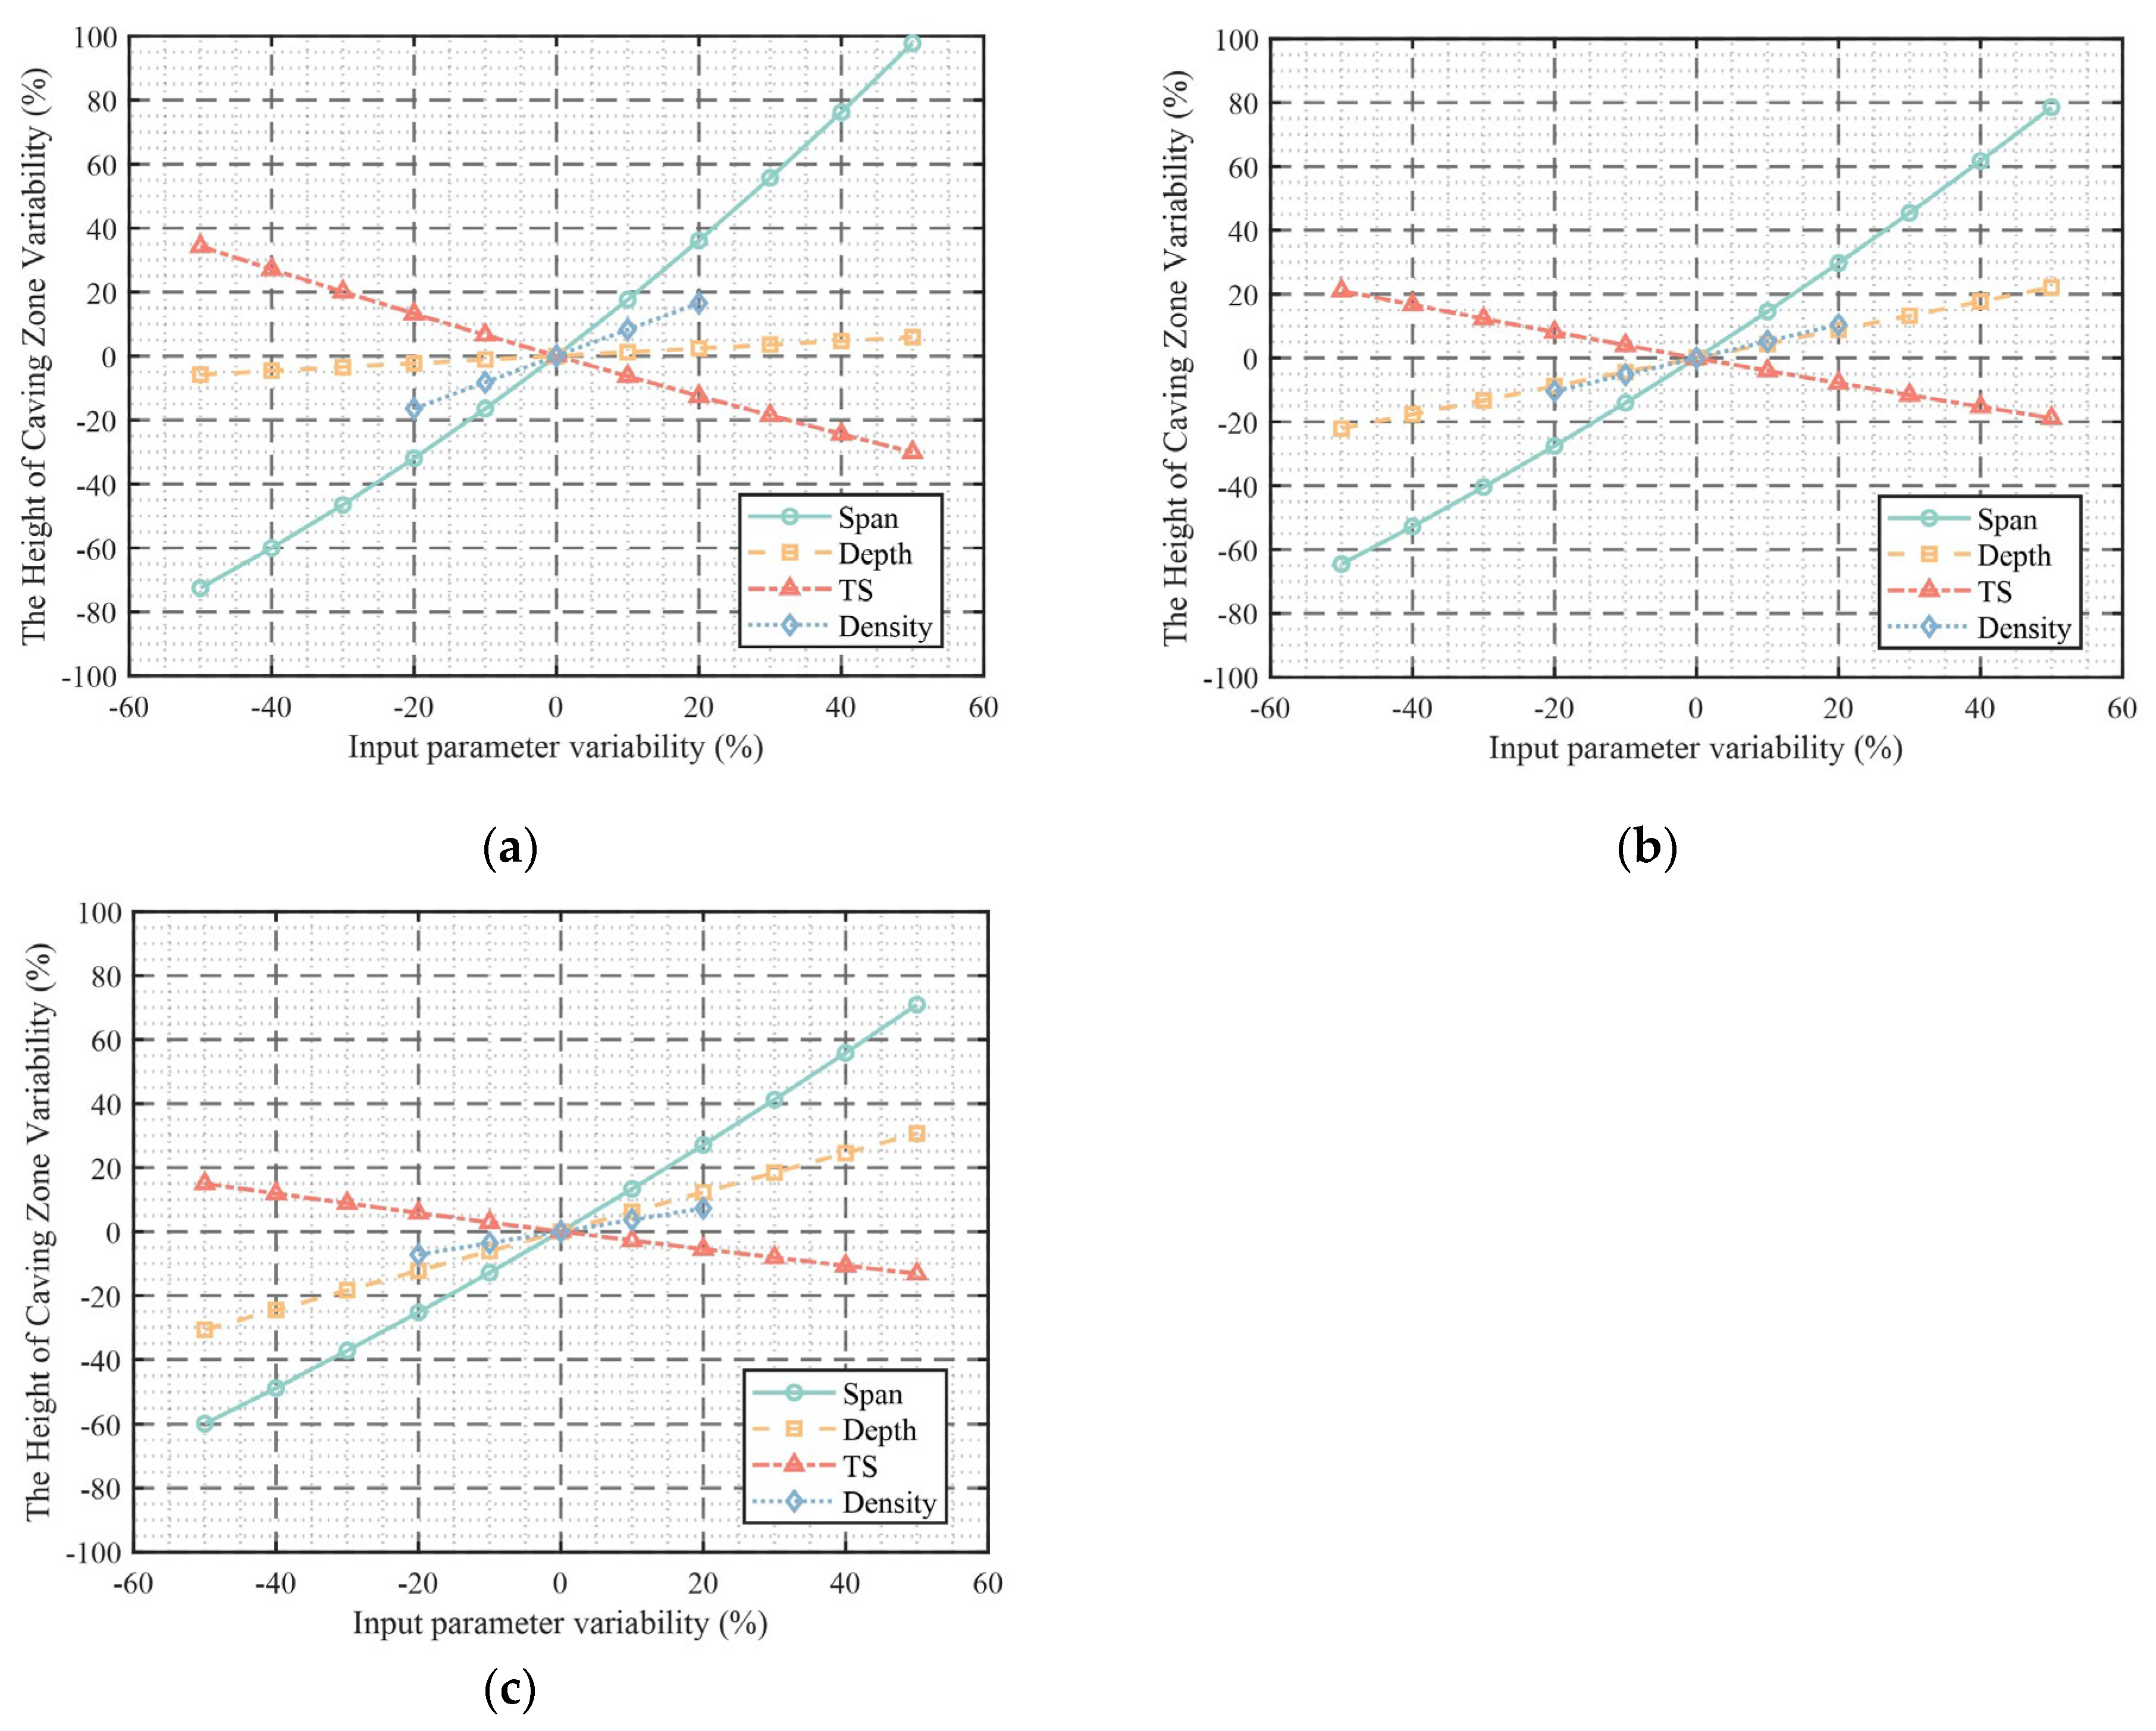
To evaluate the performance and robustness of the regression model, a sensitivity analysis was conducted using synthetic input perturbations. Each input parameter (excavation span, burial depth, TS, and density) was independently varied by ±50% from its baseline value, while the remaining parameters were held constant. The relative changes in the predicted height of the caving zone at different burial depths of 50, 300, and 600 m are shown in Figure 9 below. The baseline parameters in these assessments are as follows: excavation span = 40 m, TS = 0.4 MPa, rock density = 2000 kg/m3, and burial depths are 50, 300, and 600 m in Figure 9a,b,c, respectively. Note that the density is only varied by ±20% from the baseline value to ensure the density value is within the realistic range for rocks.
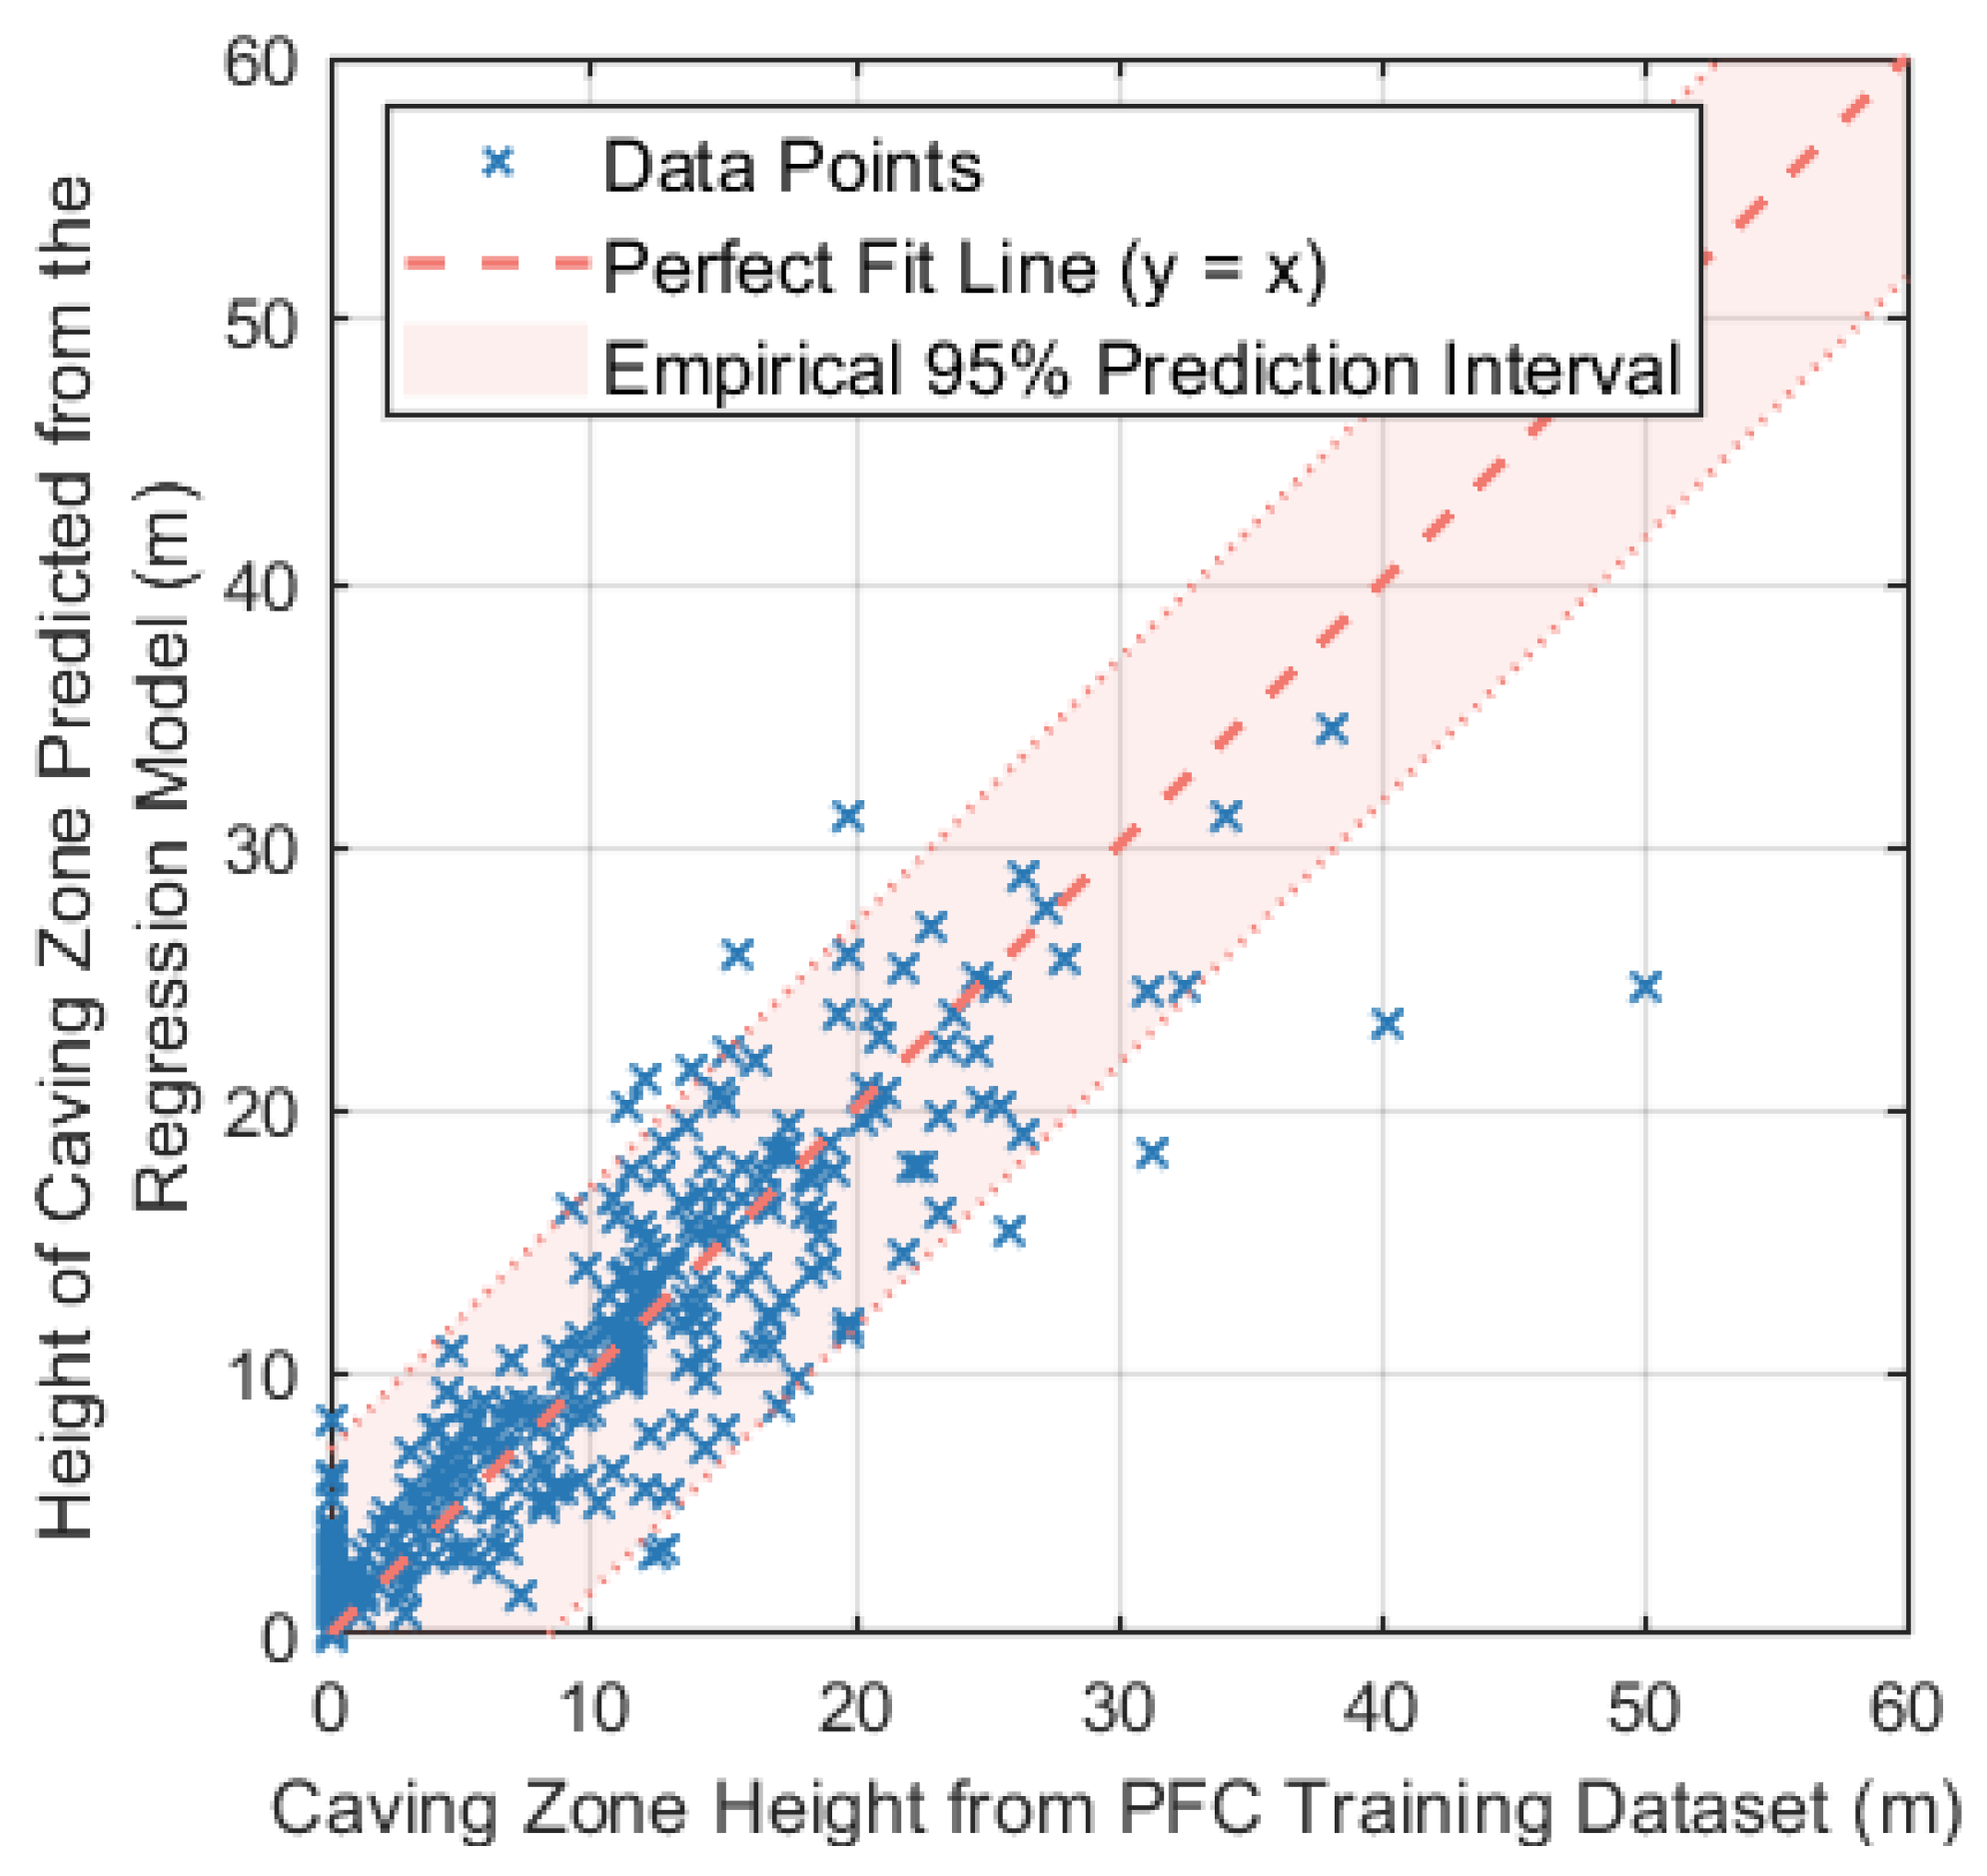
The sensitivity analysis quantifies how variations in each input parameter affect the predicted caving height within the investigated ranges and is used here to compare their relative influences. The regression model shows a weaker sensitivity to variations in burial depth under shallow conditions (Figure 9a) compared to the PFC simulations (Figure 7d). This is attributed to the limited depth range considered in the sensitivity test (25–75 m around the 50 m baseline), within which variations in depth exert only a modest influence on the overburden caving behaviour. Figure 10 shows the comparison of the predicted values from the regression model with the results obtained from PFC simulations, which were also used as the training dataset. The scatter around the 1:1 line reflects the variability in the regression estimates relative to the numerical simulations within the investigated parameter ranges and highlights the uncertainty associated with individual predictions. This variability arises from approximating the highly nonlinear and discrete fracturing processes captured by the PFC simulations with a simplified, continuous second-order polynomial formulation. The coefficient of determination (R2 = 0.79) and the relative mean absolute error (RMAE = 3.2 m) indicate a moderate level of agreement rather than high-precision predictive capability. Accordingly, the regression model is intended to provide rapid, first-order estimates of caving height for screening and preliminary assessment. An empirical 95% prediction interval was estimated from the residual distribution of the training dataset and is shown in Figure 10 to provide an explicit indication of prediction uncertainty. Based on this analysis, 95% of the prediction errors fall within approximately −8.35 m to +7.05 m relative to the PFC simulation results. This interval represents an average uncertainty level across the investigated parameter ranges; in practice, uncertainty is expected to increase toward the upper end of the caving height range, where failure mechanisms become more complex and data coverage is sparser. Consistently, the regression model shows reduced accuracy for large caving heights (approximately > 30 m), reflecting both the increasing complexity of failure mechanisms in this range and the limited number of training and validation cases available. This behaviour indicates that predictions in the upper range should be interpreted with greater caution.
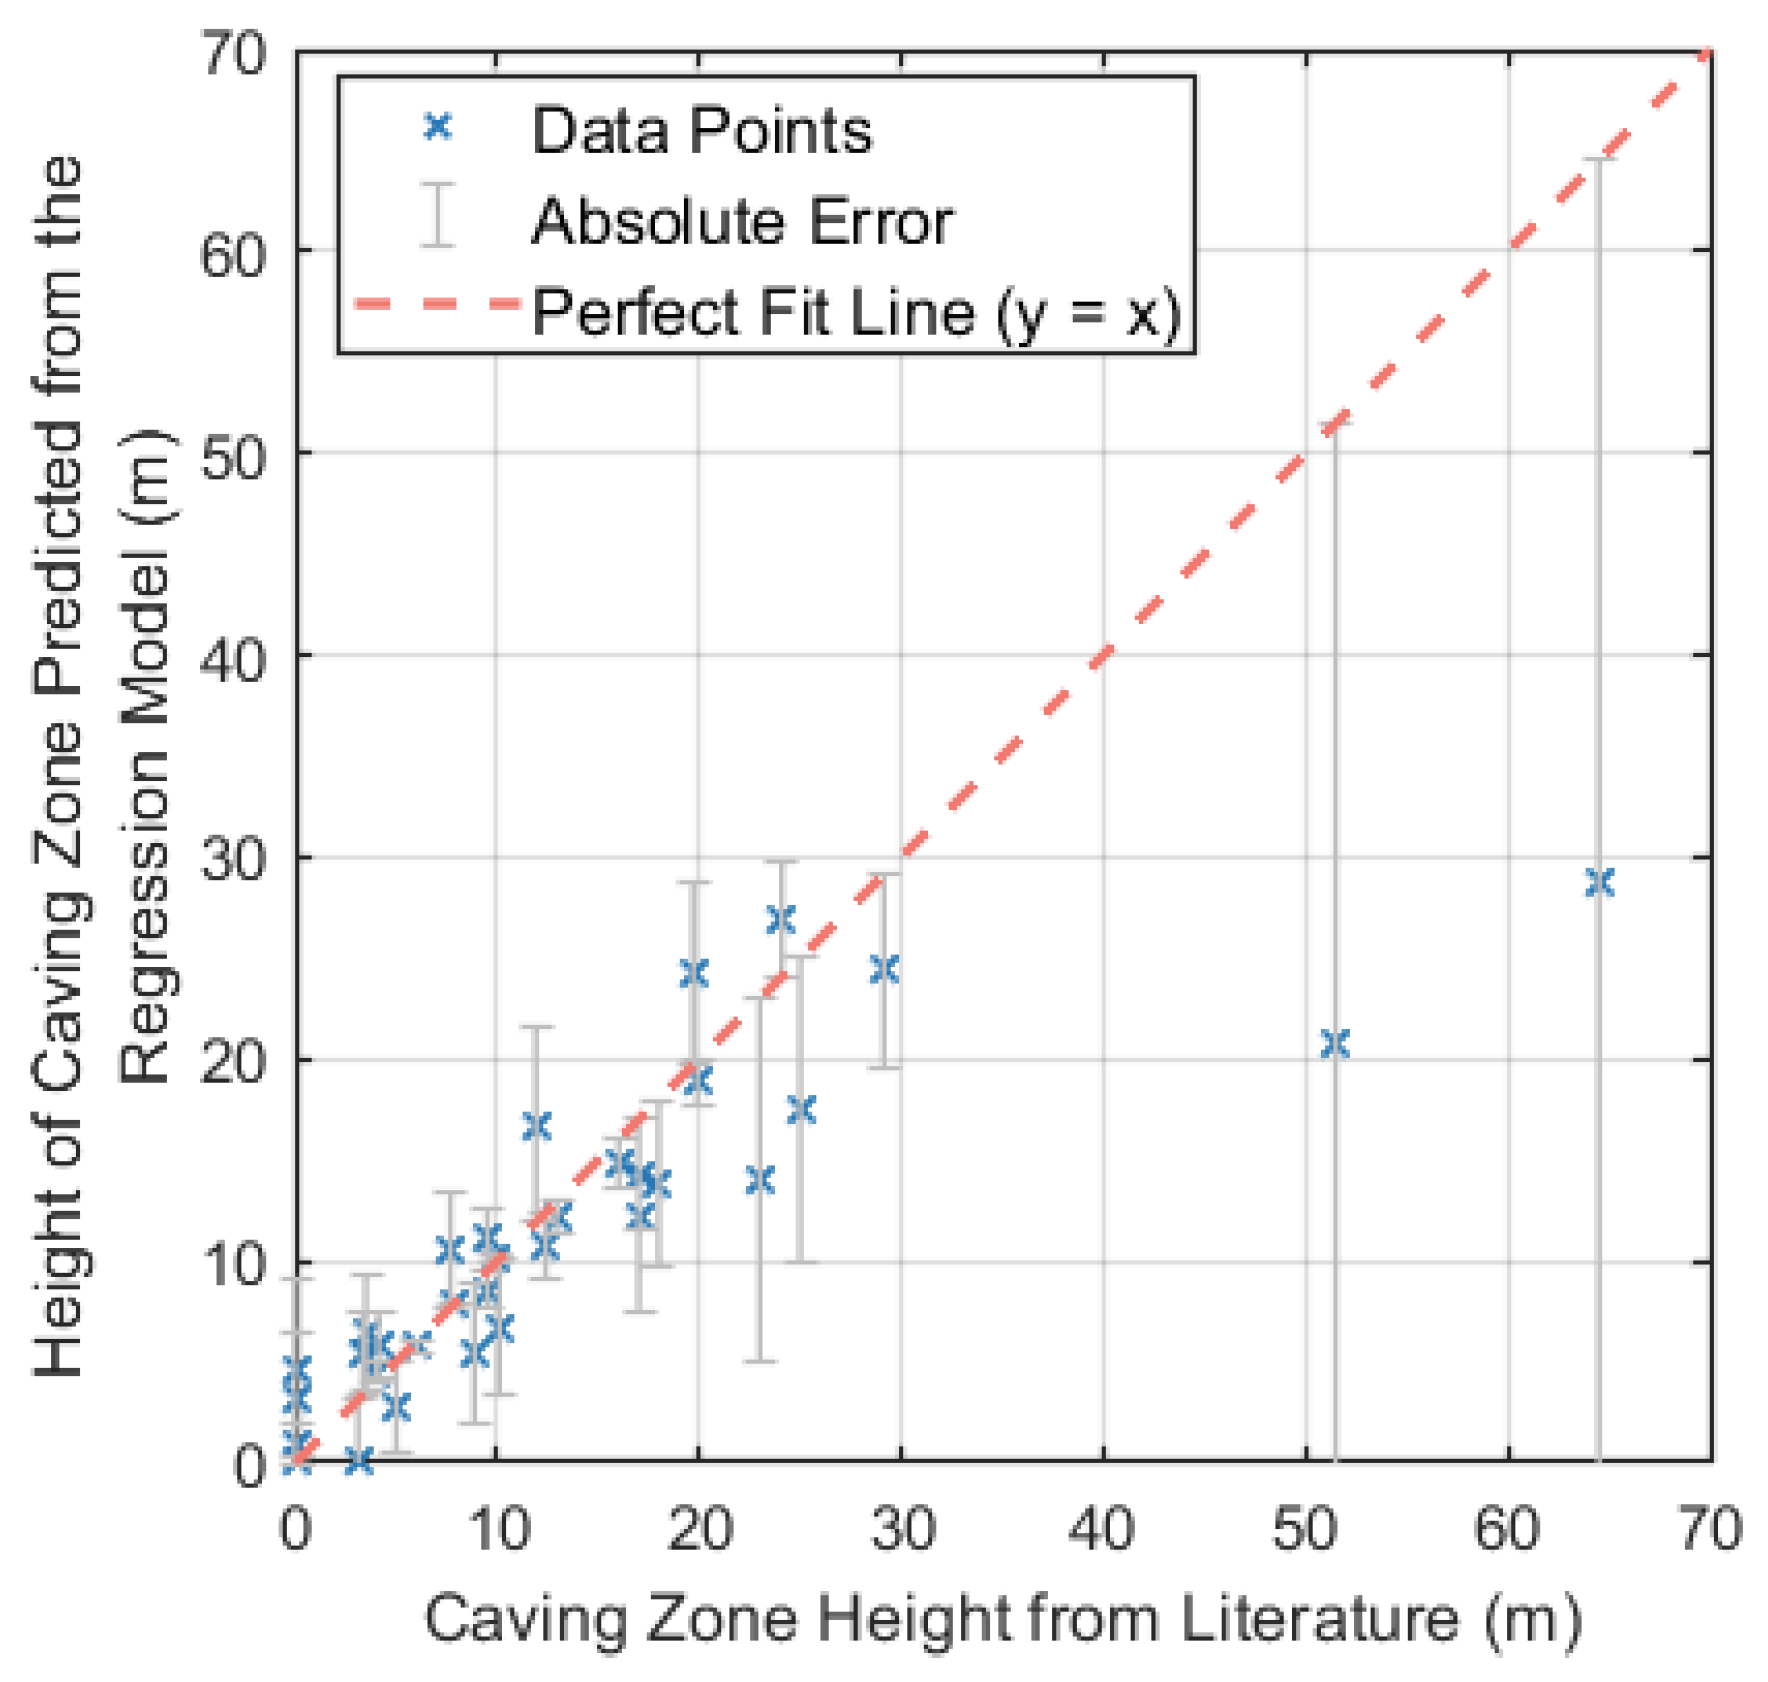
As an external consistency check, a comparative analysis was conducted using a limited number of published data obtained from similar physical model measurements [40,41] and numerical simulation [42,43,44], as shown in Figure 11. Within the ranges where the literature data are available, when the caving height is below approximately 30 m, the predictions from the regression model are of comparable magnitude to the reported values, indicating that the model provides reasonable first-order estimates in this range. The reported and predicted caving heights together with the corresponding absolute prediction errors for each validation case are summarized in Table 1. For large caving sizes, significant differences are observed, though only two data points are available from the literature. This further highlights that the current model is best suited for first-order estimation for the range of low-to-moderate caving height, and that extrapolation beyond the validated range is associated with increased uncertainty. The literature sources and associated geometric and geological parameters used in this comparison are listed in Table 2.
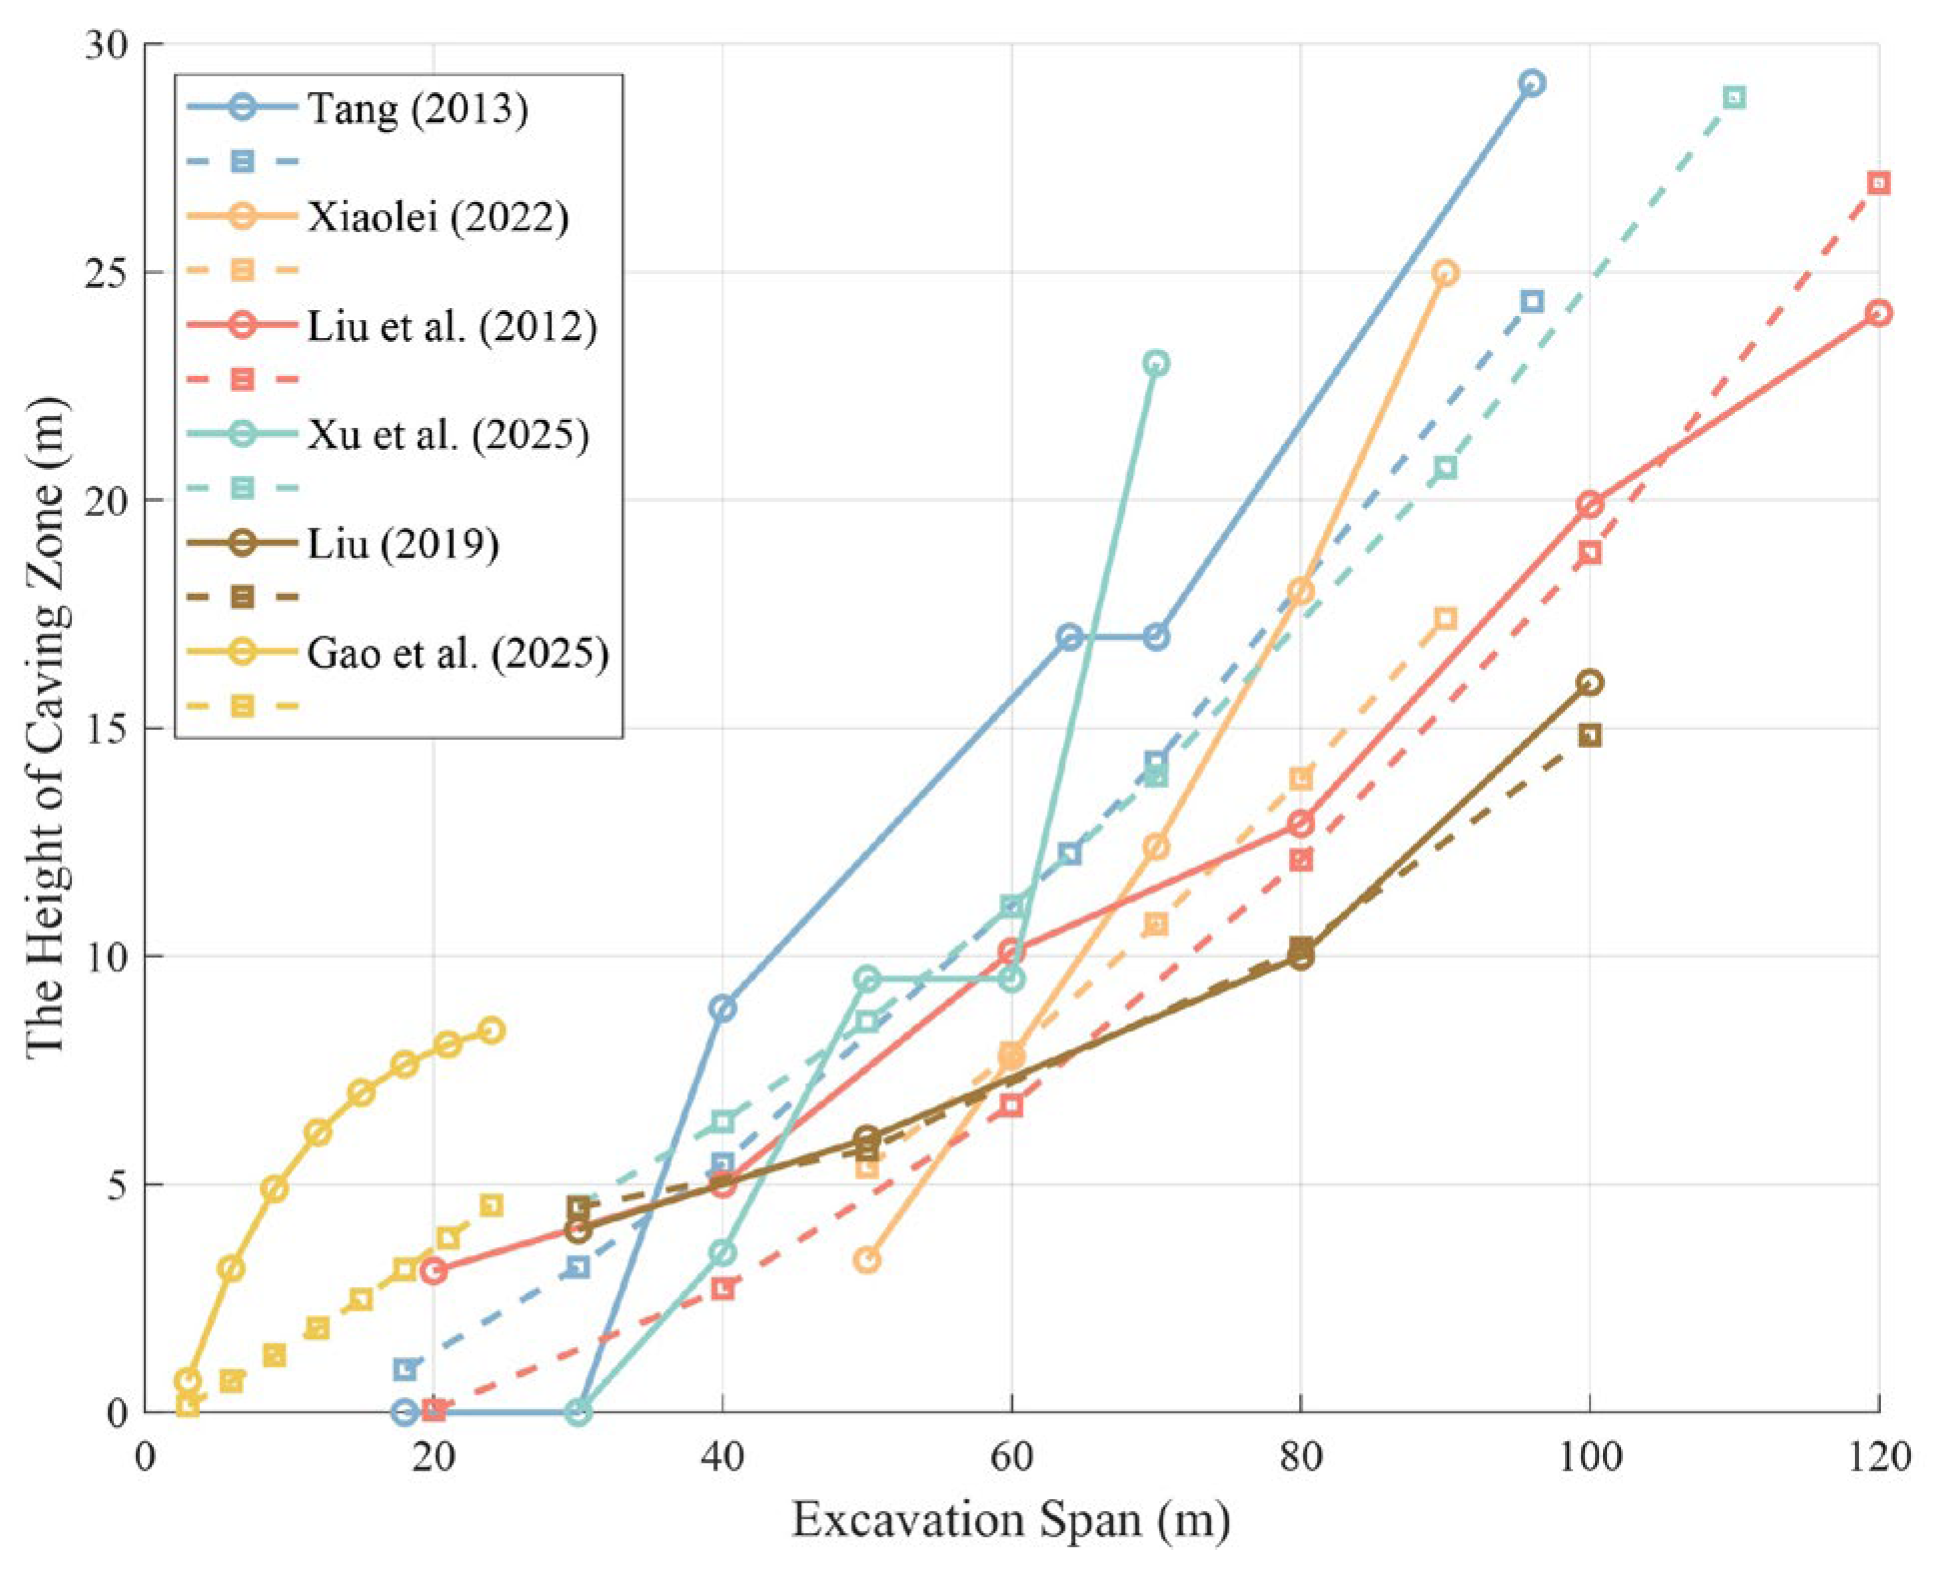
To further validate the capability of the developed regression model, Figure 12 presents a comparative analysis between the developed model and several representative models reported in the literature. In Figure 12, the solid lines represent the models from the literature, while the corresponding dashed lines are the results predicted by the regression model developed in this study using the same geological and operational parameters. The model proposed by Xu et al. [43] gives the prediction of exceptionally large caving zone heights of 51.5 m and 64.5 m at spans of 90 m and 110 m, respectively. Because these values deviate excessively from the other results, they are not included in the figure. In addition, the model proposed by Gao et al. [45] is the only explicit regression-based model presented in this figure, which was originally developed for tunnel excavation scenarios, with its applicable span explicitly restricted to the range of 6–24 m. This substantially limits its applicability to large-scale excavation problems such as coal seam extraction. In addition, this model only considers the influence of excavation span on caving zone height, but the regression model proposed in this study allows multiple input variables. Therefore, for this case [45], the other three input parameters used to produce the dashed line are assumed according to the paper (TS = 0.1 M, rock density = 2000 kg/m3, burial depth = 100 m). As can be observed from this comparison study, the regression model developed in this study shows good agreement in general with other published models, particularly when the caving height is below 30 m and the excavation span ranges from 20 m to 100 m.
This cross-comparison demonstrates that the proposed model provides comparative prediction performance compared to existing ones and validates its generalization across different excavation conditions. It also highlights the diversity of modelling approaches in the literature, underscoring the importance of contextual calibration when applying these models to site-specific scenarios. It should be noted that the prediction ability of the regression model developed in this study tends to be limited when the caving zone height is too high. This is due to the range of the excavation span in the generated dataset used to derive the model only being from 10 m to 80 m, which covers most cases in engineering applications. As the excavation span is the most sensitive parameter for overburden caving, the reliability of the predicted results will be impacted if the range of span is outside the range of the dataset.

3.4. Application of the Developed Model for Surface Subsidence Assessments

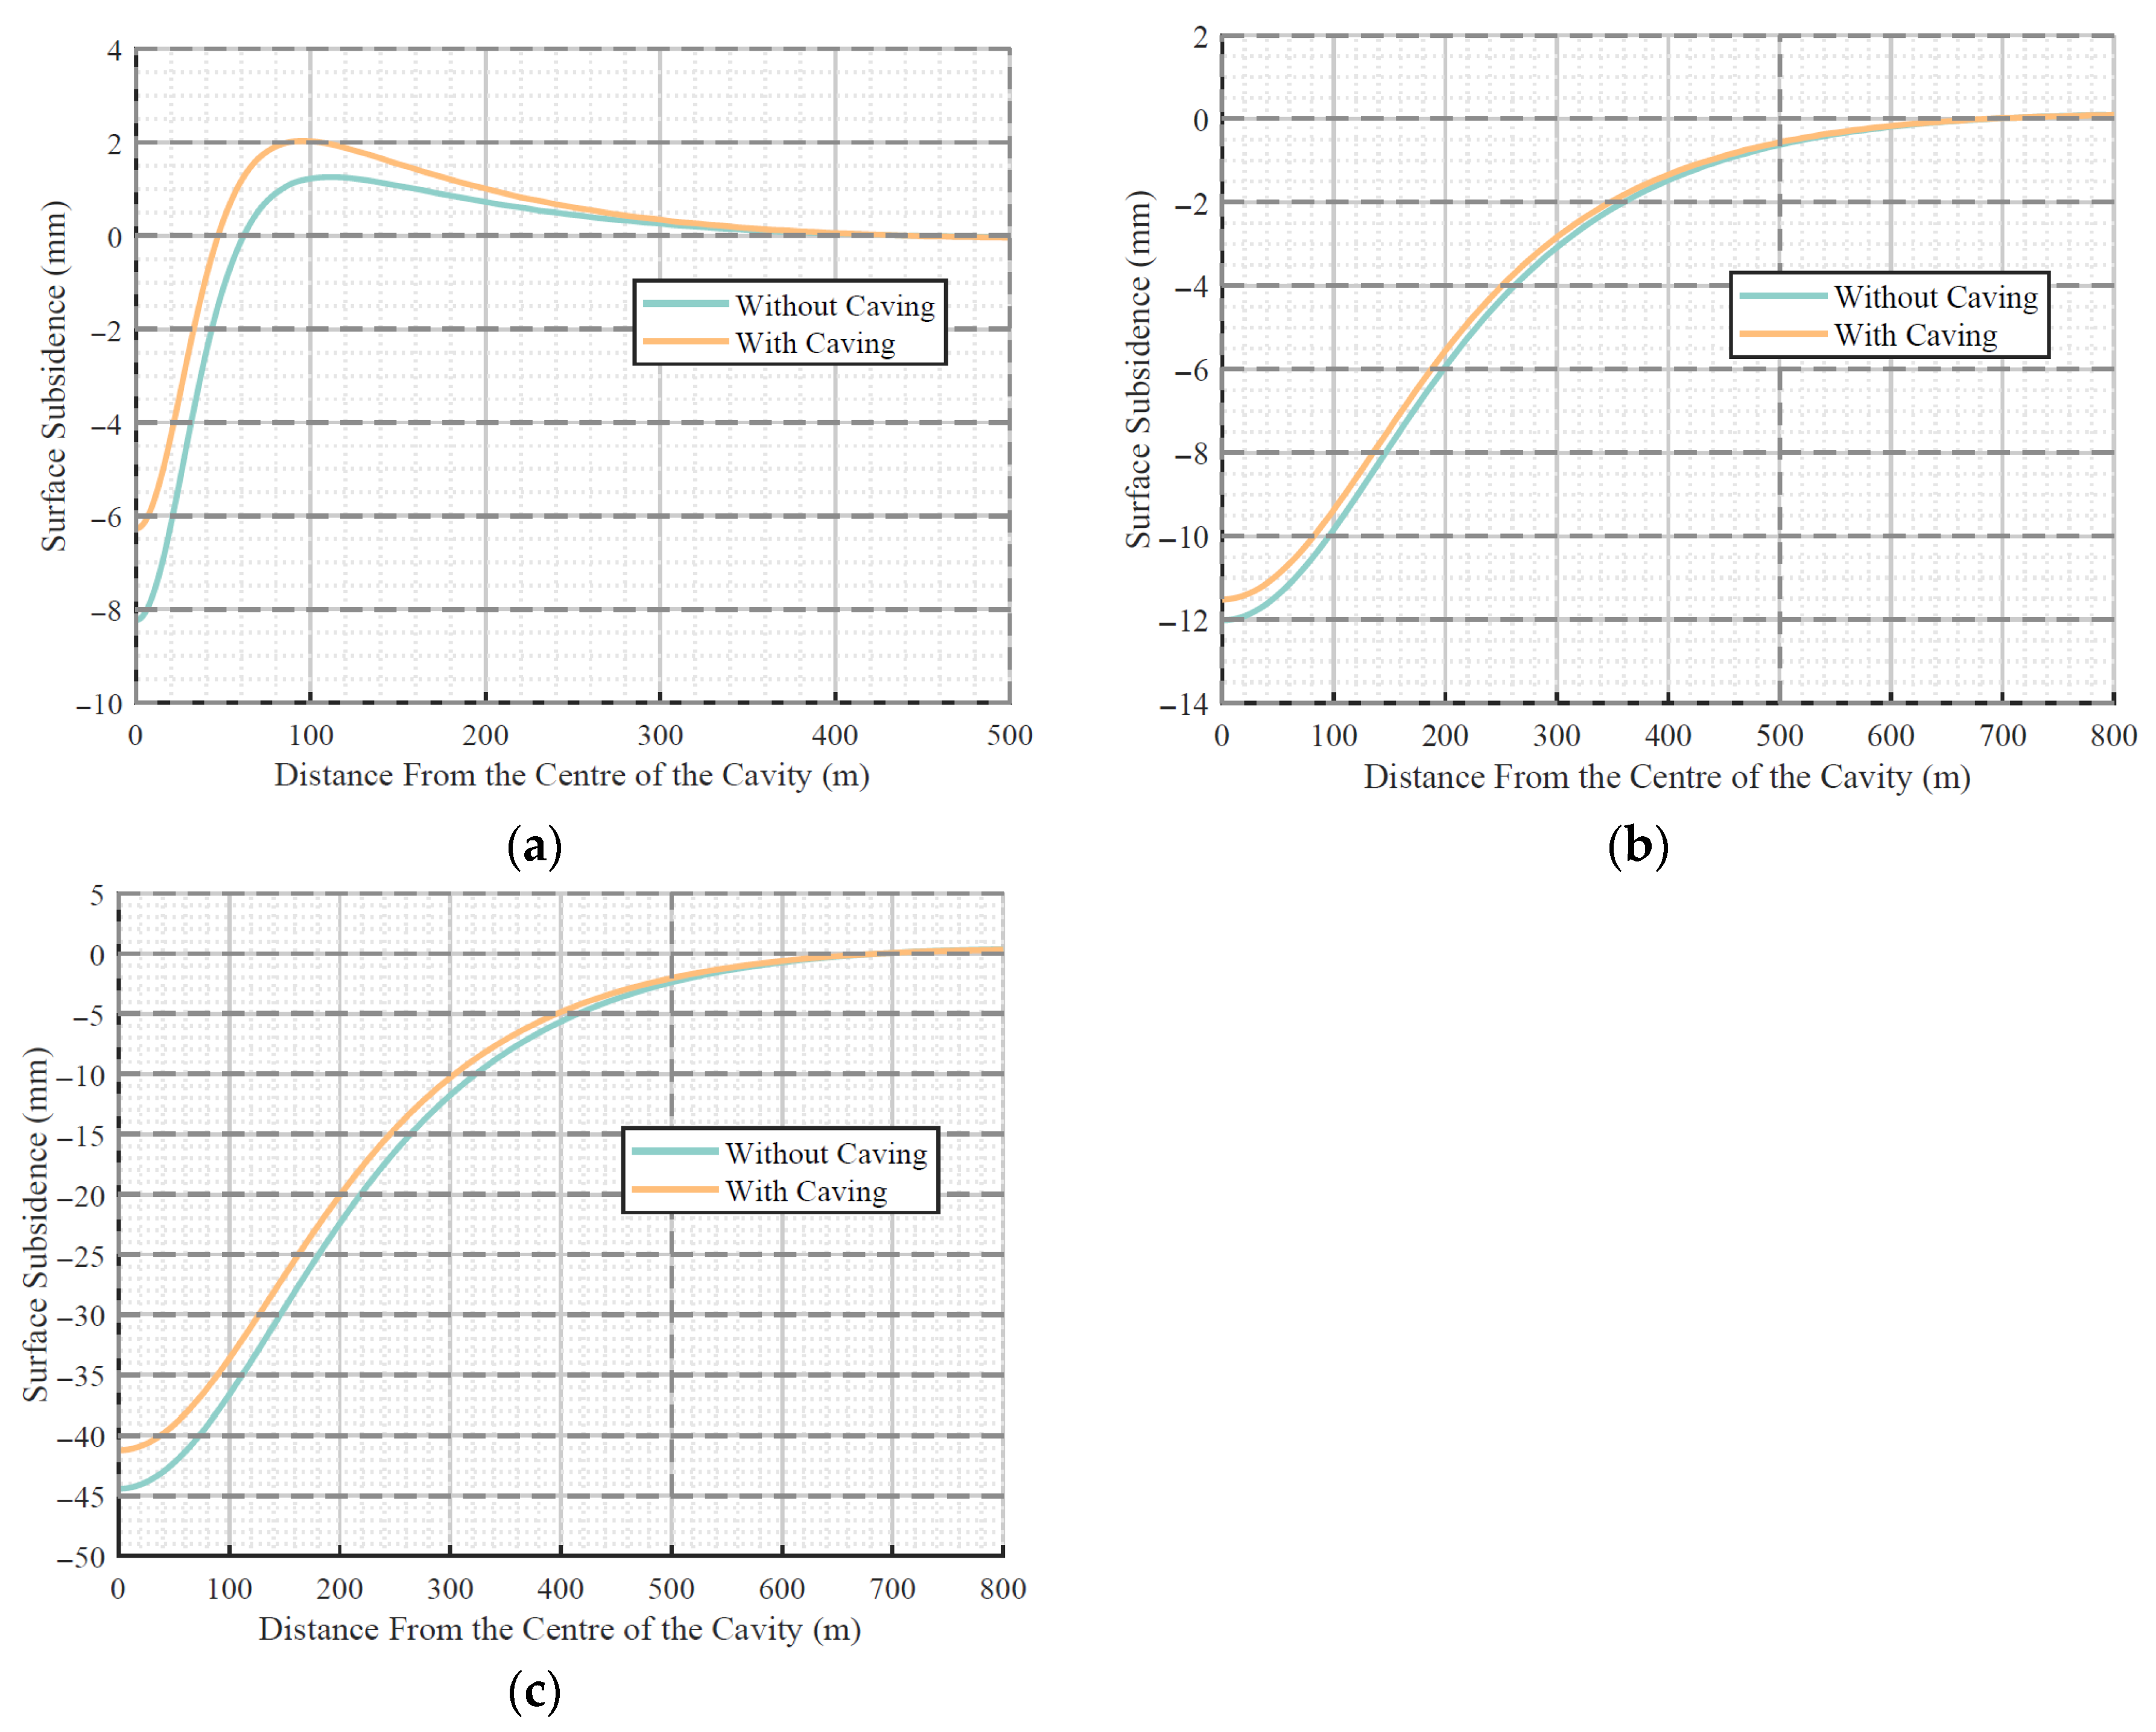
Based on the caving zone predicted by the model developed in this study, FEM models of three representative scenarios were constructed to simulate surface subsidence curves under different conditions. Scenarios A, B, and C represent a combination of excavation spans and burial depths of (40 m, 50 m), (40 m, 300 m), and (80 m, 300 m), respectively. In all cases, the rock density is 2000 kg/m3 and the tensile strength is 0.1 MPa. Based on the regression model proposed, the corresponding heights of caving zones are 8.26, 11.41, and 28.62 m, respectively. Figure 13 shows the comparison of the surface subsidence profiles with and without considering the overburden caving. Note that the phenomenon of upward surface deflection observed in Figure 13a has also been reported in the literature. According to Ghabraie et al. [46], this effect results from the use of thin isotropic elastic layers with cohesionless interfaces, which is a known shortcoming of simplified elastic approaches, producing a numerical artefact in the form of local upward displacement that has a negligible effect on the overall accuracy of the model.
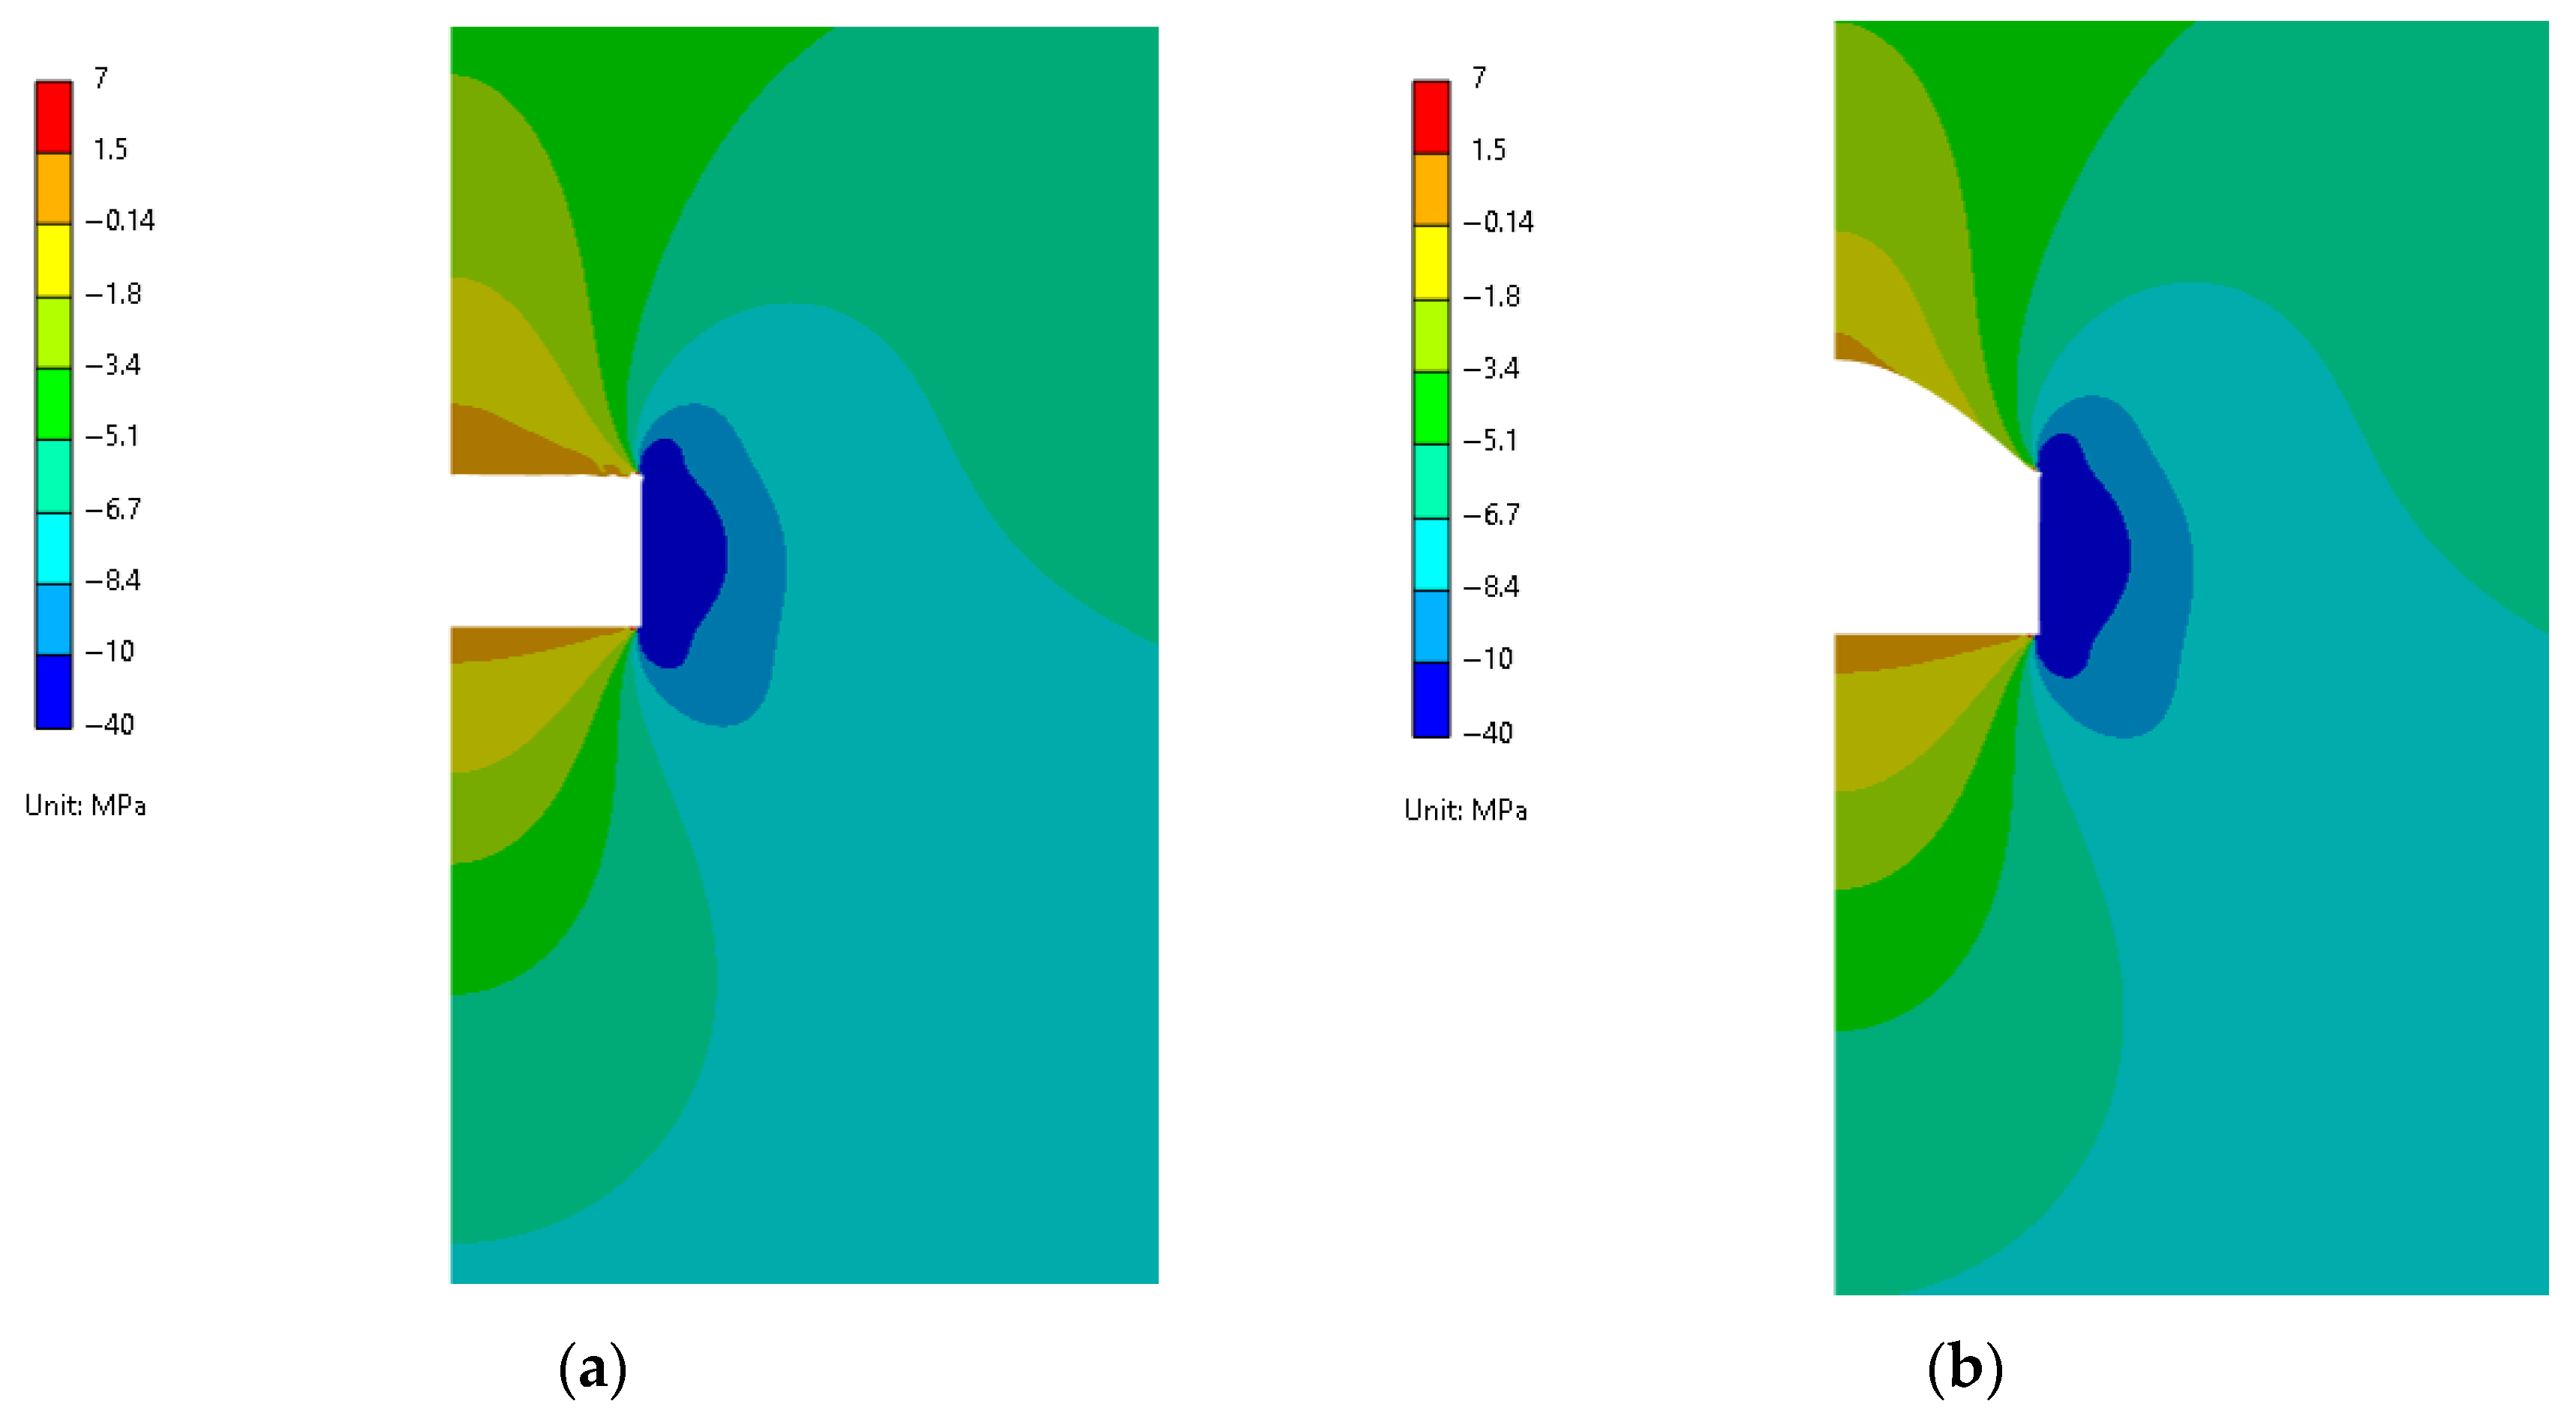
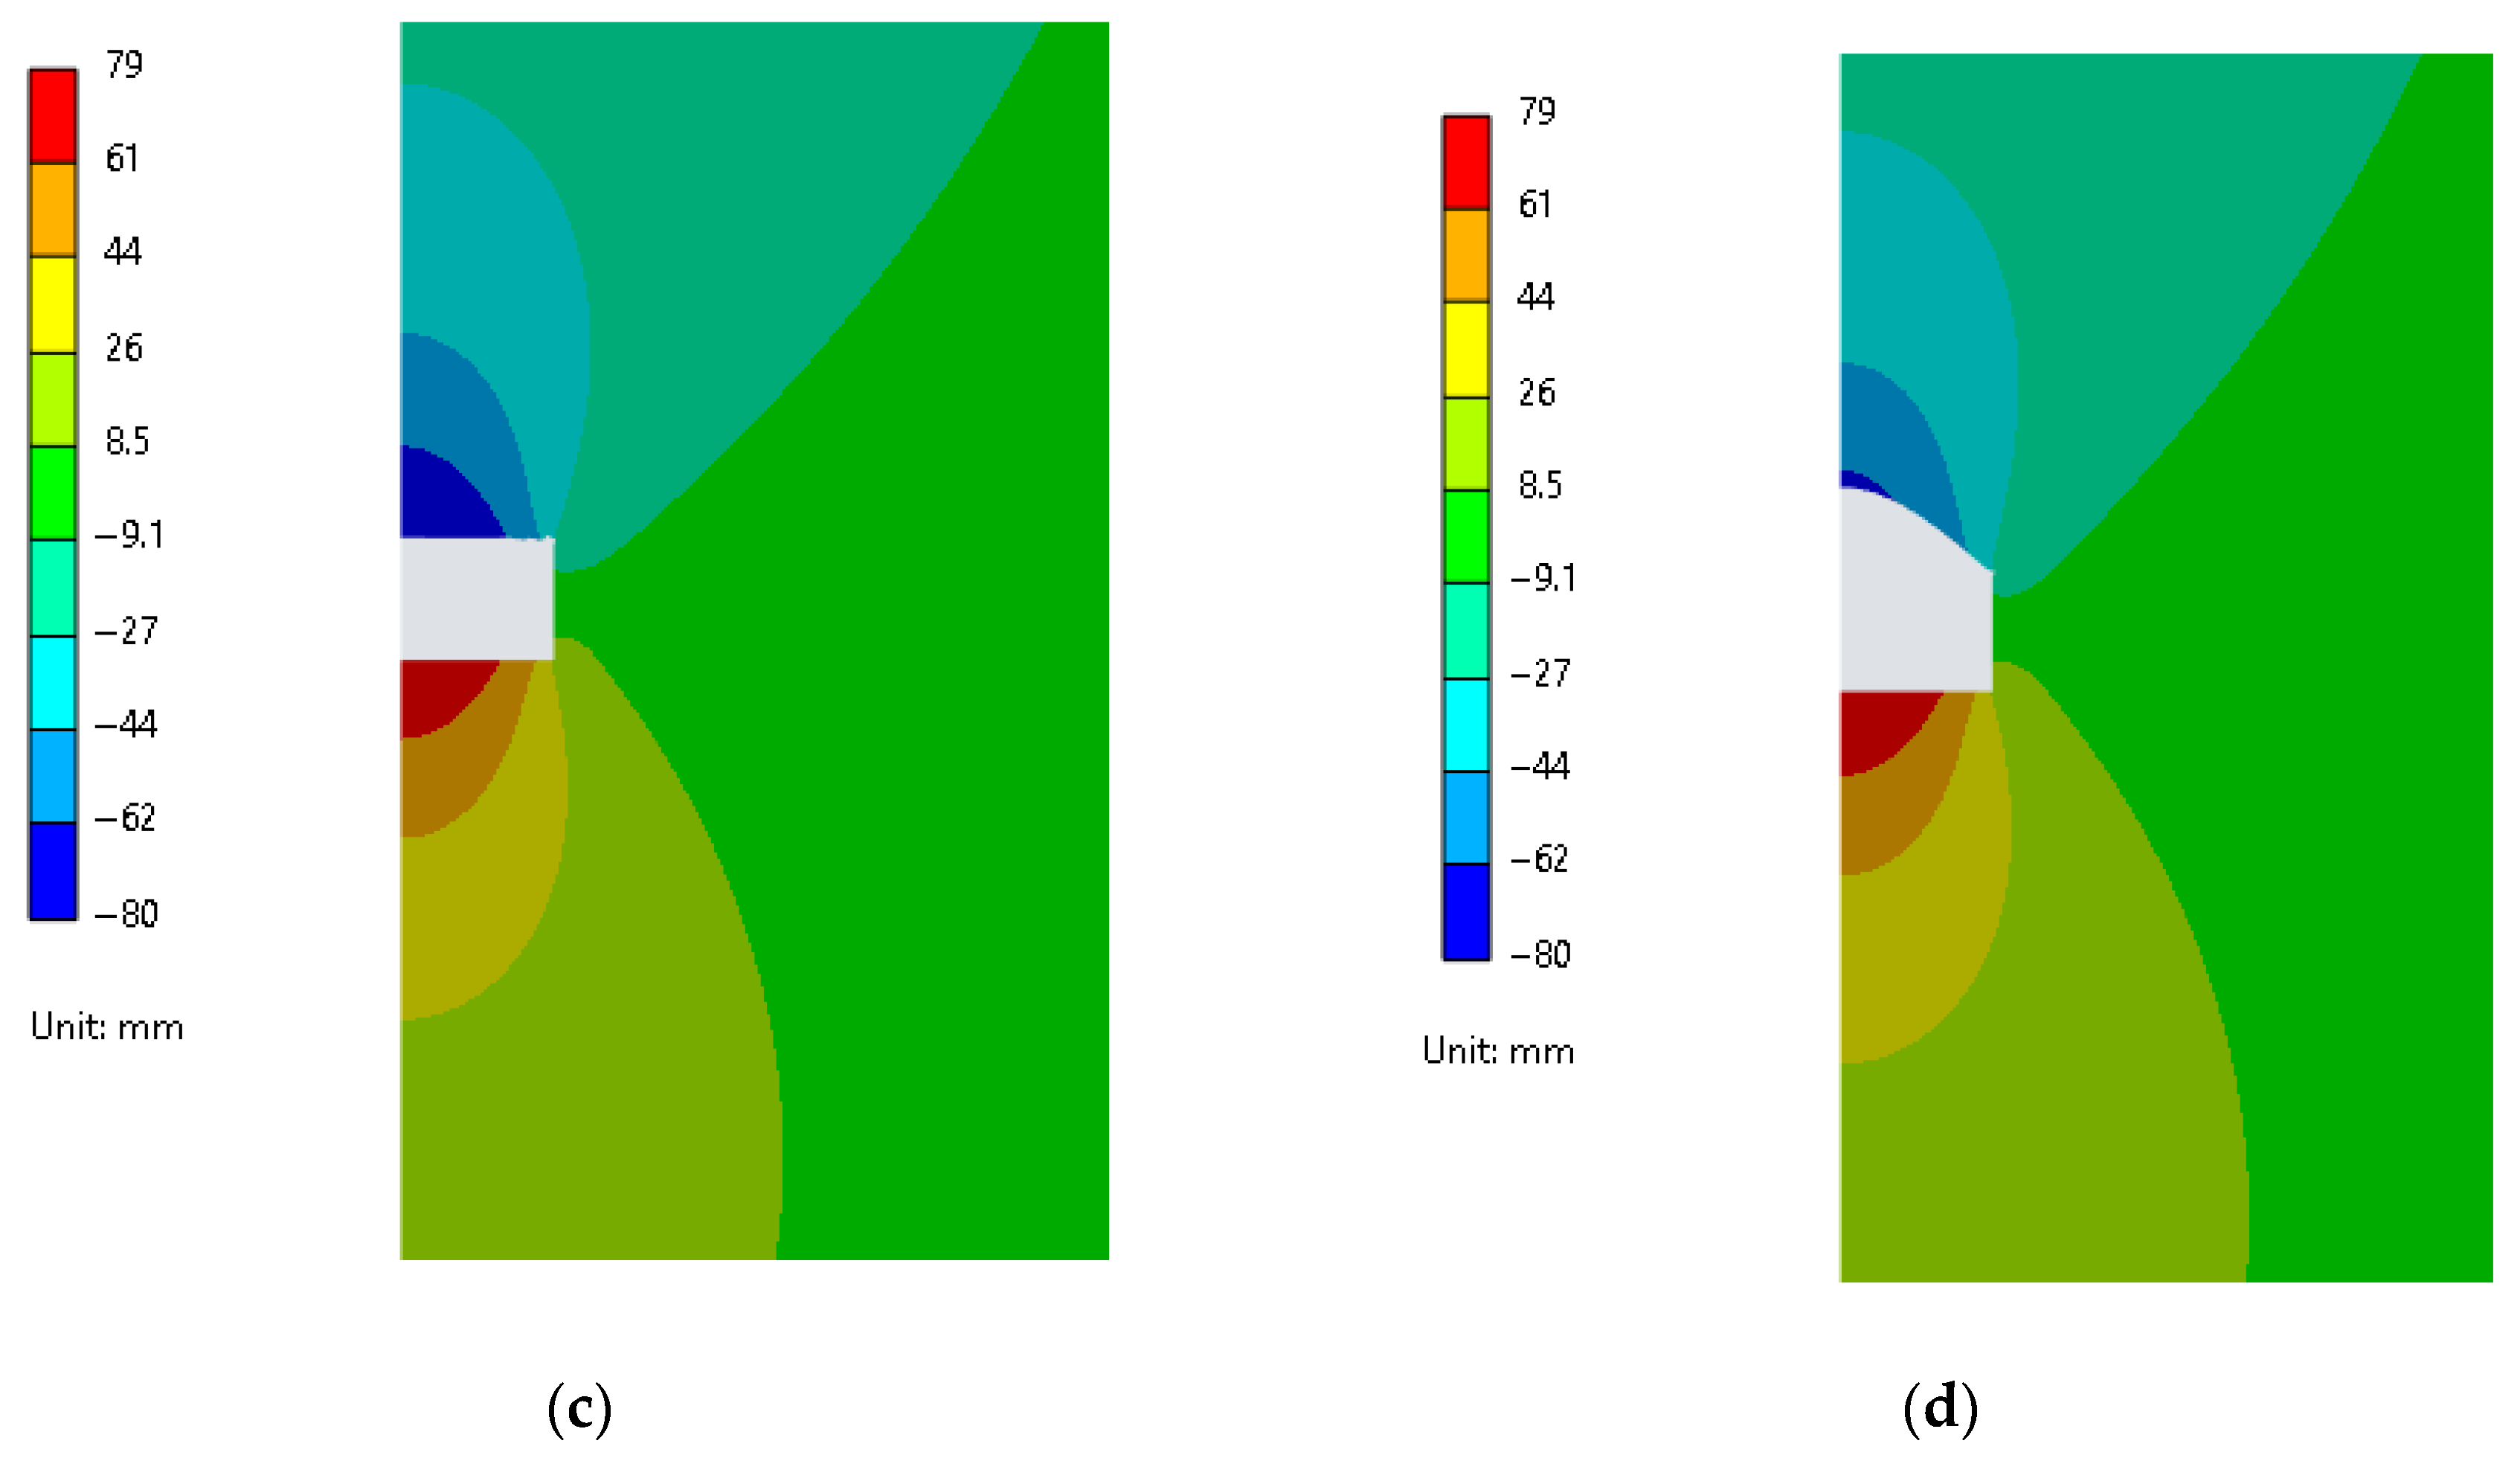
To provide a spatial interpretation of the subsidence curves, Figure 14 presents a contour of vertical normal stress (σyy) and vertical displacement (Uy) for Scenario B. The stress contours illustrate vertical stress redistribution and concentration around the excavation, while the displacement contours show the deformation field and how the inclusion of the caving cavity modifies the subsidence mechanism. For completeness, the corresponding global σyy contours (initial pre-excavation state) are provided in Supplementary Material Figure S3. Supplementary Figures S4 and S5 show the corresponding full-field stress distributions after excavation at the model scale. For visual clarity, only the left-hand portion of the domain is shown, as stress variations in the far field remain close to the initial state.
To provide field-scale context for the subsidence magnitudes obtained from the simplified 2D plane-strain elastic FEM analyses, representative published subsidence monitoring cases were compiled from two longwall sites. At the Integra Underground Mine (Australia) [47], monitoring until the completion of Longwall 8 reported a maximum subsidence of 1.31 m at a burial depth of 330 m. In addition, Xu et al. [48] reported detailed surface subsidence monitoring results for a high-intensity longwall panel in the Shendong coalfield, China, where the excavation height was 7.0 m, the burial depth ranged from 184 to 222 m (average about 201 m), and the working face width was 302.5 m. Their measurements indicate that the maximum subsidence reached approximately 3.7 m. These published monitoring cases are used here as an external consistency check on the maximum subsidence under comparable depth ranges, rather than for site-specific calibration, because the FEM framework adopted in this study is intentionally simplified to isolate the geometric influence of the predicted caving zone. The selected monitoring cases are summarized in Table 3.

3.5. Model Applicability and Limitations

The proposed model is developed within a set of clearly defined modelling assumptions, which also determine its scope of applicability. In the present study, the overburden rock mass is assumed to be homogeneous and isotropic, and failure is governed predominantly by tensile bond breakage under a stress regime where the vertical in situ stress exceeds the horizontal stress. Within this framework, the regression model captures the dominant influences of excavation span, equivalent rock mass tensile strength, and burial depth on the height of the caving zone.
It should be noted that the proposed model is not intended for direct application to strongly stratified or highly jointed rock masses without modification. In laminated sedimentary formations, the presence of bedding planes and joint networks may significantly reduce the effective tensile strength and stiffness of the roof strata, potentially leading to larger caving heights than those predicted under homogeneous assumptions. In such cases, the effects of structural discontinuities may be partially represented through reduced equivalent tensile strength, but explicit consideration of layered or anisotropic behaviour would be required for more accurate prediction.
The regression model is derived from a numerically generated dataset and is therefore intended as a rapid, first-order estimation tool rather than a high-precision predictive model. Its reliability is constrained to the investigated parameter ranges, particularly for excavation spans up to 80 m, beyond which prediction uncertainty increases. Future work will extend the dataset to incorporate layered rock masses, variable vertical–horizontal stress ratios, and temperature-dependent mechanical properties to improve the robustness and general applicability of the framework. Although the dataset comprises 290 systematically generated cases, its coverage remains sparse at very large excavation spans and extreme caving heights. This limits the prediction accuracy of the model in these cases and warrants caution when applying the model outside the investigated parameter ranges. Similarly, the FEM-based subsidence analysis in this study adopts a linear elastic constitutive model and therefore cannot represent plastic yielding, irreversible damage, or nonlinear subsidence mechanisms. Its purpose is to provide a comparison study of the relative influences of different caving geometries on surface displacement patterns, rather than to reproduce site-specific subsidence magnitudes or failure processes.

4. Conclusions

In this study, a regression-based model combining discrete element simulations and polynomial regression analysis was developed for rapid, first-order estimation of the height of overburden caving and associated surface subsidence induced by underground excavations. Key conclusions drawn from the presented analyses include the following:
  • Within the investigated parameters, excavation span, rock tensile strength, and burial depth were identified as the primary parameters controlling the height of the caving zone, with excavation span exhibiting the strongest influence. Rock density showed a secondary effect through its contribution to overburden stress, particularly at greater depths.
  • A second-order polynomial regression model constructed from 290 discrete element simulation cases was able to reproduce the nonlinear response of the height of the caving zone to variations in excavation geometries and geomechanical parameters within the investigated parameter ranges. Comparisons with additional numerical simulations and a limited set of published experimental data indicate that the model provides reasonable first-order agreement (R2 = 0.79, relative mean absolute error = 3.2 m) rather than high-precision predictive accuracy.
  • Comparative analysis of overburden caving patterns between two-dimensional and three-dimensional discrete element simulations suggests that the 2D plane-strain model is reasonable to represent 3D excavations with a long third dimension, supporting its use for large-scale parametric studies where full 3D modelling is computationally prohibitive.
  • Finite element simulations incorporating the derived caving geometry indicate that overburden arching due to caving can reduce surface subsidence under shallow burial conditions, while its influence becomes less significant at greater depths. In this context, excavation span and burial depth emerge as the dominant parameters shaping the subsidence profile within the modelled scenarios.
  • The developed prediction model provides a rapid and practical means of translating detailed numerical simulation outputs into parameter-driven estimates that can support preliminary screening, scenario comparison, and trend assessment in underground excavation design. It is not intended to replace site-specific accurate numerical analysis or field investigation.
This study advances current capabilities in the rapid prediction of overburden caving due to underground excavations, providing valuable insights for safer, more informed decision-making in underground engineering practices. Several limitations of this study warrant further research. The assumptions of homogeneous and isotropic rock masses ignore the impacts of structural discontinuities, such as bedding planes and joints, potentially leading to an underestimation of caving sizes in stratified rock strata. The modelling framework also assumes that vertical in situ stress is greater than horizontal stress. This stress condition favours tensile-dominated failure. However, in regions with high horizontal stress, failure mechanisms may shift toward compressive-dominated behaviour, potentially altering caving height and geometry. Future work should therefore extend the dataset to incorporate layered anisotropy, temperature-dependent rock properties, and variable stress ratios or site-specific stress measurements to improve the robustness and general applicability of the proposed regression model and to enable more rigorous validation against independent field observations.

Supplementary Materials

The following supporting information can be downloaded at: https://www.mdpi.com/article/10.3390/geotechnics6010014/s1. Figure S1. Stress–strain response obtained from the DEM uniaxial compression test used for calibration of the elastic modulus and uniaxial compressive strength. The axial stress is plotted against axial strain for the representative material case. The peak stress corresponds to the calibrated UCS, and the initial linear portion of the curve defines the elastic modulus. Figure S2. Equivalent tensile stress–strain response obtained from the DEM direct tensile test used for calibration of the tensile strength for the representative material case. The peak stress corresponds to the tensile strength used in the parametric simulations. Table S1. Target macroscopic properties and corresponding DEM-calibrated values for the representative material case used in the parametric study. Table S2. Summary of micro-parameters used for the representative calibration. Figure S3. Initial vertical normal stress field (σyy) in the FEM model prior to excavation. The contour illustrates the prescribed in situ stress state in the global coordinate system, with σyy increasing with depth (compressive stress shown as negative values). This figure is provided to demonstrate the far-field stress condition and the overall model domain used for subsidence modelling. Figure S4. Vertical normal stress contours (σyy) of the FEM model after excavation without incorporating the caving geometry. The plot shows the post-excavation redistribution of σyy at the model scale and serves as a global reference for the local stress patterns presented in Figure 14 (main text). Figure S5. Vertical normal stress contours (σyy) of the FEM model after excavation with the arched caving geometry incorporated based on the predicted caving zone. Compared with Figure S4, the inclusion of the caved void modifies the stress redistribution around the excavation at the global scale. This figure is provided as supplementary information, while Figure 14 focuses on the corresponding local stress—deformation fields near the excavation.

Author Contributions

Conceptualization, Z.Z., C.X., F.X. and J.C.; Methodology, Z.Z., C.X. and Z.F.T.; Resources, C.X. and J.C.; Writing—original draft preparation, Z.Z.; Writing—review and editing, C.X., Z.F.T., F.X. and J.C. All authors have read and agreed to the published version of the manuscript.

Funding

This research was funded by the Industry Doctoral Training Centre (IDTC) pilot program: 119765, and NeuRizer Ltd.

Institutional Review Board Statement

Not applicable.

Informed Consent Statement

Not applicable.

Data Availability Statement

The raw data supporting the conclusions of this article will be made available by the authors on request.

Acknowledgments

The authors express their sincere gratitude for NeuRizer Ltd. for providing the field parameters essential to model development and validation.

Conflicts of Interest

John Centofanti was employed by the company NeuRizer Ltd. The authors declare that this study received funding from Industry Doctoral Training Centre (IDTC) pilot program and NeuRizer Ltd. The funder was not involved in the study design, collection, analysis, interpretation of data, the writing of this article, or the decision to submit it for publication.

References

  1. Davydzenka, T.; Tahmasebi, P.; Shokri, N. Unveiling the global extent of land subsidence: The sinking crisis. Geophys. Res. Lett. 2024, 51, e2023GL104497. [Google Scholar] [CrossRef] [Scilit]
  2. Lee, F.T.; Abel, J.F. Subsidence from Underground Mining: Environmental Analysis and Planning Considerations; US Geological Survey: Reston, VA, USA, 1983; Volume 876. [Google Scholar]
  3. Bazaluk, O.; Kuchyn, O.; Saik, P.; Soltabayeva, S.; Brui, H.; Lozynskyi, V.; Cherniaiev, O. Impact of ground surface subsidence caused by underground coal mining on natural gas pipeline. Sci. Rep. 2023, 13, 19327. [Google Scholar] [CrossRef] [Scilit]
  4. Nguyen, T.T.; Le, V.D.; Huynh, T.Q.; Nguyen, N.H. Influence of settlement on base resistance of long piles in soft soil—Field and machine learning assessments. Geotechnics 2024, 4, 447–469. [Google Scholar] [CrossRef] [Scilit]
  5. Cameron, D.; Karim, M.R.; Johnson, T.; Rahman, M.M. Influence of weather, soil variability, and vegetation on seasonal ground movement: A field study. Geotechnics 2023, 3, 1085–1103. [Google Scholar] [CrossRef] [Scilit]
  6. Nowamooz, H. Equilibrium Stage of Soil Cracking and Subsidence after Several Wetting and Drying Cycles. Geotechnics 2023, 3, 193–211. [Google Scholar] [CrossRef] [Scilit]
  7. Wang, C.; Li, H.; Zhang, M.; Liao, C.; Zhang, S. Characteristics of overlying strata and mechanisms of arch beam failure in shallowly buried thick bedrock coal seams: A case study in western China. Energy Sci. Eng. 2023, 11, 3317–3331. [Google Scholar] [CrossRef] [Scilit]
  8. Zhao, D.; Wu, Q. An approach to predict the height of fractured water-conducting zone of coal roof strata using random forest regression. Sci. Rep. 2018, 8, 10986. [Google Scholar] [CrossRef] [Scilit] [PubMed]
  9. Sakhno, I.; Sakhno, S.; Vovna, O. Surface subsidence response to safety pillar width between reactor cavities in the underground gasification of thin coal seams. Sustainability 2025, 17, 2533. [Google Scholar] [CrossRef] [Scilit]
  10. Tammetta, P. Estimation of the height of complete groundwater drainage above mined longwall panels. Groundwater 2013, 51, 723–734. [Google Scholar] [CrossRef] [Scilit]
  11. Ditton, S.; Merrick, N. A new sub-surface fracture height prediction model for longwall mines in the NSW coalfields. In Proceedings of the Sydney Basin Symposium, Newcastle, NSW, Australia, 7–10 July 2014. [Google Scholar]
  12. Waddington, A.; Kay, D. The incremental profile method for prediction of subsidence, tilt, curvature and strain over a series of panels. In Proceedings of the Mine Subsidence Technology Society, 3rd Triennial Conference on Buildings and Structures Subject to Ground Movement, Newcastle, NSW, Australia, 5–7 February 1995. [Google Scholar]
  13. Christiansen, E. Limit analysis of collapse states. Handb. Numer. Anal. 1996, 4, 193–312. [Google Scholar]
  14. Fraldi, M.; Guarracino, F. Limit analysis of collapse mechanisms in cavities and tunnels according to the Hoek–Brown failure criterion. Int. J. Rock Mech. Min. Sci. 2009, 46, 665–673. [Google Scholar] [CrossRef] [Scilit]
  15. Fraldi, M.; Guarracino, F. Analytical solutions for collapse mechanisms in tunnels with arbitrary cross sections. Int. J. Solids Struct. 2010, 47, 216–223. [Google Scholar] [CrossRef] [Scilit]
  16. Fraldi, M.; Guarracino, F. Evaluation of impending collapse in circular tunnels by analytical and numerical approaches. Tunn. Undergr. Space Technol. 2011, 26, 507–516. [Google Scholar] [CrossRef] [Scilit]
  17. Yang, X.L.; Huang, F. Collapse mechanism of shallow tunnel based on nonlinear Hoek–Brown failure criterion. Tunn. Undergr. Space Technol. 2011, 26, 686–691. [Google Scholar] [CrossRef] [Scilit]
  18. Liang, J.; Cui, J.; Lu, Y.; Li, Y.; Shan, Y. Limit analysis of shallow tunnels collapse problem with optimized solution. Appl. Math. Model. 2022, 109, 98–116. [Google Scholar] [CrossRef] [Scilit]
  19. Kang, H.; Lou, J.; Gao, F.; Yang, J.; Li, J. A physical and numerical investigation of sudden massive roof collapse during longwall coal retreat mining. Int. J. Coal Geol. 2018, 188, 25–36. [Google Scholar] [CrossRef] [Scilit]
  20. Liu, P.; Gao, L.; Zhang, P.; Wu, G.; Wang, Y.; Liu, P.; Kang, X.; Ma, Z.; Kong, D.; Han, S. Physical similarity simulation of deformation and failure characteristics of coal-rock rise under the influence of repeated mining in close distance coal seams. Energies 2022, 15, 3503. [Google Scholar] [CrossRef] [Scilit]
  21. Chen, S.; Wang, H.; Zhang, J.; Xing, H.; Wang, H. Experimental study on low-strength similar-material proportioning and properties for coal mining. Adv. Mater. Sci. Eng. 2015, 2015, 696501. [Google Scholar] [CrossRef] [Scilit]
  22. Li, G.; Ma, F.-S.; Guo, J.; Zhao, H.-J. Experimental study on similar materials ratio used in large-scale engineering model test. J. Northeast. Univ. Nat. Sci. 2020, 41, 1653. [Google Scholar]
  23. Wang, H.; Cheng, J.; Li, H.; Dun, Z.; Cheng, B. Full-scale field test on construction mechanical behaviors of retaining structure enhanced with soil nails and prestressed anchors. Appl. Sci. 2021, 11, 7928. [Google Scholar] [CrossRef] [Scilit]
  24. Migliazza, M.; Chiorboli, M.; Giani, G. Comparison of analytical method, 3D finite element model with experimental subsidence measurements resulting from the extension of the Milan underground. Comput. Geotech. 2009, 36, 113–124. [Google Scholar] [CrossRef] [Scilit]
  25. Ekneligoda, T.; Marshall, A. A coupled thermal-mechanical numerical model of underground coal gasification (UCG) including spontaneous coal combustion and its effects. Int. J. Coal Geol. 2018, 199, 31–38. [Google Scholar] [CrossRef] [Scilit]
  26. Najafi, M.; Jalali, S.M.E.; KhaloKakaie, R. Thermal–mechanical–numerical analysis of stress distribution in the vicinity of underground coal gasification (UCG) panels. Int. J. Coal Geol. 2014, 134–135, 1–16. [Google Scholar] [CrossRef] [Scilit]
  27. Zhang, Z.; Mei, G.; Xu, N. A geometrically and locally adaptive remeshing method for finite difference modeling of mining-induced surface subsidence. J. Rock Mech. Geotech. Eng. 2022, 14, 219–231. [Google Scholar] [CrossRef] [Scilit]
  28. Keilich, W. Numerical Modelling of Mining Subsidence, Upsidence and Valley Closure Using UDEC; University of Wollongong: Wollongong, NSW, Australia, 2009. [Google Scholar]
  29. Elmo, D.; Roberts, D.; Rogers, S.; Yanske, T. Simulations of roof collapse and cave development using a hybrid finite/discrete approach. In Proceedings of the ARMA US Rock Mechanics/Geomechanics Symposium, Salt Lake City, UT, USA, 27–30 June 2010; American Rock Mechanics Association: Brooklyn, NY, USA, 2010; p. ARMA-10-472. [Google Scholar]
  30. Chen, B.; Barboza, B.R.; Sun, Y.; Bai, J.; Thomas, H.R.; Dutko, M.; Cottrell, M.; Li, C. A review of hydraulic fracturing simulation. Arch. Comput. Methods Eng. 2022, 29, 1–58. [Google Scholar] [CrossRef] [Scilit]
  31. Shi, L. Numerical simulation and actual measurement analysis of overburden failure height based on PFC. Min. Saf. Environ. Prot. 2021, 48, 43–49. [Google Scholar]
  32. Zhang, D.-Y.; Zhang, X.; Li, P. Influence of overlying rock structure in goaf of shallow-buried contiguous coal seams on working face hypoxia. Coal Eng. 2022, 54, 84–89. [Google Scholar]
  33. Arasteh, H.; Saeedi, G.; Farsangi, M.A.E. Numerical Study of the Roof Fall and Out of Seam Dilution and Their Event Risk in a Mechanized Longwall Panel. Geotech. Geol. Eng. 2023, 41, 967–984. [Google Scholar]
  34. Feng, Y.; Bi, Y.; Li, D. Prediction of Floor Failure Depth in Coal Mines: A Case Study of Xutuan Mine, China. Water 2024, 16, 3262. [Google Scholar] [CrossRef] [Scilit]
  35. Golder Associates Pty Ltd. Field Investigation and Geotechnical Studies for U.C.G. Feasibility Study, Leigh Creek; 82612075; Golder Associates Pty Ltd.: Richmond, VIC, Australia, 1985. [Google Scholar]
  36. Department for Energy and Mining (South Australia). NeuRizer In-Situ Gasification. Available online: https://www.energymining.sa.gov.au/industry/energy-resources/regulation/projects-of-public-interest/neurizer-in-situ-gasification (accessed on 3 November 2025).
  37. Zhou, C.; Xu, C.; Karakus, M.; Shen, J. A systematic approach to the calibration of micro-parameters for the flat-jointed bonded particle model. Geomech. Eng. 2018, 16, 471–482. [Google Scholar]
  38. Mills, K.; Doyle, R. Impact of vertical stress on roadway conditions at Dartbrook Mine. In Proceedings of the 19th Conference on Ground Control in Mining, Morgantown, WV, USA, 8–10 August 2000; Department of Mining Engineering, College of Engineering and Mineral Resources, West Virginia University: Morgantown, WV, USA, 2000; pp. 291–296. [Google Scholar]
  39. Jiang, Y.; Chen, B.; Teng, L.; Wang, Y.; Xiong, F. Surface subsidence modelling induced by formation of cavities in underground coal gasification. Appl. Sci. 2024, 14, 5733. [Google Scholar] [CrossRef] [Scilit]
  40. Tang, F. Fracture Evolution and Breakage of Overlying Strata of Combustion Space Area in Underground Coal Gasification. Ph.D. Thesis, China University of Mining and Technology, Xuzhou, China, 2013. (In Chinese) [Google Scholar]
  41. Xiaolei, W. Similar simulation test of overlying rock failure and crack evolution in fully mechanized caving face with compound roof. Geotech. Geol. Eng. 2022, 40, 73–82. [Google Scholar] [CrossRef] [Scilit]
  42. Liu, Y.-L.; Wang, L.-G.; Tang, F.-R.; He, Y. Fracture evolution of overlying strata over combustion cavity under thermal mechanical interaction during underground coal gasification. J. China Coal Soc. 2012, 37, 1292–1298. [Google Scholar]
  43. Xu, J.; Pan, J.; Li, M.; Wang, H.; Chen, J. Dynamic Evolution of Fractures in Overlying Rocks Caused by Coal Mining Based on Discrete Element Method. Processes 2025, 13, 806. [Google Scholar] [CrossRef] [Scilit]
  44. Liu, W.-R. Experimental and numerical study of rock stratum movement characteristics in longwall mining. Shock Vib. 2019, 2019, 5041536. [Google Scholar] [CrossRef] [Scilit]
  45. Gao, X.; Liu, H.; Li, L.; Li, S.; Fan, H.; Wang, S.; Cai, H. Analysis of cascade collapse mechanism and prediction model for determining collapse height of block rock tunnel. Eng. Fail. Anal. 2025, 173, 109463. [Google Scholar] [CrossRef] [Scilit]
  46. Ghabraie, B.; Ren, G.; Zhang, X.; Smith, J. Physical modelling of subsidence from sequential extraction of partially overlapping longwall panels and study of substrata movement characteristics. Int. J. Coal Geol. 2015, 140, 71–83. [Google Scholar] [CrossRef] [Scilit]
  47. Mills, K. Part 3A Subsidence Assessment for Mining in Hebden, Barrett and Middle Liddell Seams at Integra Underground Mine; SCT Operations Pty Ltd.: Wollongong, NSW, Australia, 2009. [Google Scholar]
  48. Xu, J.; Zhu, W.; Xu, J.; Wu, J.; Li, Y. High-intensity longwall mining-induced ground subsidence in Shendong coalfield, China. Int. J. Rock Mech. Min. Sci. 2021, 141, 104730. [Google Scholar]
Figure 1. Geometry of the model used in this study.
Geotechnics 06 00014 g001
Figure 2. The height of the caving zone from the PFC2D model with different model widths.
Geotechnics 06 00014 g002
Figure 3. The height of the caving zone from the PFC2D model with different particle radii.
Geotechnics 06 00014 g003
Figure 4. The excavation-induced caving from the PFC model. The red, green, and blue regions represent the overburden, coal seam, and floor, respectively.
Geotechnics 06 00014 g004
Figure 5. The caving zone height from the PFC2D model with different (a) heights of excavation and (b) UCS.
Geotechnics 06 00014 g005
Figure 6. Comparison of overburden caving evolution simulated using (a) PFC2D and (b) PFC3D with a 50 m out-of-plane thickness (particle radius = 0.4 m). The red, green, and blue regions represent the overburden, coal seam, and floor, respectively.
Geotechnics 06 00014 g006
Figure 7. Height of overburden caving zone simulated by PFC2D models (a) vs. rock tensile strength at burial depths of 50, 300, and 600 m and density of 2000 kg/m3, with a span of 40 m; (b) vs. rock density at TS of 0.1 MPa and excavation span of 40 m; (c) vs. excavation span at TS of 0.1 MPa and density of 2000 kg/m3; (d) vs. burial depth at the excavation spans of 30, 40, and 50 m, TS of 0.1 MPa, and density of 2000 kg/m3.
Geotechnics 06 00014 g007
Figure 8. Illustrative response surfaces of the regression model for the predicted height of the overburden caving zone under burial depths of d = 50, 300, and 600 m: (a) variation with excavation span and tensile strength at a fixed density of 2000 kg/m3; (b) variation with excavation span and density at a fixed tensile strength of 0.5 MPa; (c) variation with tensile strength and density at a fixed excavation span of 40 m.
Geotechnics 06 00014 g008
Figure 9. Local sensitivity of the predicted caving height from the regression model with ±50% variations in input parameters at different burial depths: (a) 50 m, (b) 300 m, and (c) 600 m.
Geotechnics 06 00014 g009
Figure 10. Comparison between predicted caving heights from the regression model and the corresponding PFC simulation results used for model training. The dashed line represents the 1:1 reference, and the shaded band indicates the empirical 95% uncertainty interval estimated from the residual distribution of the training dataset.
Geotechnics 06 00014 g010
Figure 11. Comparison between predicted caving heights from the regression model and a limited set of published experimental and numerical results reported in the literature.
Geotechnics 06 00014 g011
Figure 12. Comparison of prediction models for the height of the caving zone from different studies [40,41,42,43,44,45].
Geotechnics 06 00014 g012
Figure 13. Comparison of surface subsidence profiles with and without the consideration of overburden caving: (a) scenario A; (b) scenario B; (c) scenario C.
Geotechnics 06 00014 g013
Figure 14. FEM contours for scenario B: (a) vertical normal stress σyy without considering overburden caving; (b) vertical normal stress σyy considering overburden caving; (c) vertical displacement Uy without considering overburden caving; (d) vertical displacement Uy considering overburden caving.
Geotechnics 06 00014 g014aGeotechnics 06 00014 g014b
Table 1. Quantitative comparison between caving heights reported in the literature and their predictions from the regression model.
SourceSpan (m)Depth (m)Reported h (m)Predicted h (m)Abs. Error (m)
Tang [40]18273.500.90.9
30273.503.23.2
40273.58.95.53.4
64273.517.012.34.8
70273.517.014.32.7
96273.529.124.44.8
Xiaolei [41]50115.473.35.42.0
60115.477.87.90.1
70115.4712.410.71.7
80115.4718.013.94.1
90115.4725.017.47.6
Liu et al. [42]201603.10.13.0
401605.02.72.3
6016010.16.73.4
8016012.912.10.8
10016019.918.91.0
12016024.1272.9
Xu et al. [43]3069004.54.5
406903.56.42.9
506909.58.60.9
606909.511.11.6
706902314.09
9069051.520.730.8
11069064.528.835.7
Liu [44]3057044.50.5
5057065.80.2
805701010.20.2
1005701614.81.2
Table 2. The literature used in Figure 11 and Figure 12.
ModelMethodsConditions
Tang [40]Similarity physical model
  • Mining method: UCG
  • Burial depth: 273.5 m
  • Overburden tensile strength: 0.8 MPa
  • Overburden density: 2180 kg/m3
  • Working face spans: 18, 30, 40, 64, 70, and 96 m
Xiaolei [41]Similarity physical model
  • Mining method: Fully mechanized caving mining
  • Burial depth: 115.5 m
  • Overburden tensile strength: 0.9 MPa
  • Overburden density: 2500 kg/m3
  • Working face spans: 50, 60, 70, 80, and 90 m
Liu et al. [42] Numerical model (COMSOL)
  • Mining method: UCG
  • Burial depth: 160 m
  • Overburden tensile strength: 1 MPa
  • Overburden density: 2125 kg/m3
  • Working face spans: 20, 40, 60, 80, 100, and 120 m
Xu et al. [43]Numerical model (UDEC 7.0)
  • Mining method: Longwall mining
  • Burial depth: 690 m
  • Overburden tensile strength: 1.9 MPa
  • Overburden density: 2500 kg/m3
  • Working face spans: 20, 40, 60, 70, 80, 90, 100, 110, 160, 200, 240, 280, and 300 m
Liu [44]Numerical model (PFC2D)
  • Mining method: Longwall mining
  • Burial depth: 570 m
  • Overburden tensile strength: 2.5 MPa
  • Overburden density: 2578 kg/m3
  • Working face spans: 30, 50, 80, and 100 m
Gao et al. [45]Machine learning from physical model
  • Method: Underground tunnelling
  • Burial depth: 10–120 m
  • Working face spans: 6–24 m
Table 3. Comparison of field-measured and model-predicted maximum surface subsidence (Smax) for representative underground excavation case studies.
Site/SourceDepth, d (m)Span, s (m)Field Smax (m)Predicted Smax (m)
Integra Mine [Annex-E] [47]3302501.311.22
Shendong Coal Field [48]2003033.73.35
Disclaimer/Publisher’s Note: The statements, opinions and data contained in all publications are solely those of the individual author(s) and contributor(s) and not of MDPI and/or the editor(s). MDPI and/or the editor(s) disclaim responsibility for any injury to people or property resulting from any ideas, methods, instructions or products referred to in the content.