Abstract
The offshore wind industry is expanding from shallow water to deep water. As a cost-effective and efficient anchoring solution, drag embedment anchors have been widely used for mooring floating offshore structures. However, there is currently no well-established method for predicting the installation trajectory and holding capacity of drag anchors in sand. This paper reports an integrated anchor–chain–soil large-deformation finite-element model for simulating the complete installation of drag anchors in sand. The proposed approach restores the effects of anchor chains and detailed structures of the anchor, which is essential for detailed anchor design. Sensitivity analysis is conducted to investigate the convergence of model parameters. The performance of the numerical model is benchmarked against a centrifuge test conducted at the University of Western Australia (UWA), which demonstrates satisfactory accuracy and reliability. Installation simulations are then performed using a popular commercial anchor design in sands of different friction angles. Three characteristic stages during the drag embedment process are identified. The results highlight the significant influence of the soil resistance to the shank on the anchor penetration performance. The large-deformation analysis approach proposed provides a powerful tool for further investigation on drag anchor installation behavior in sand.
1. Introduction
The drag embedment anchor (DEA), as illustrated by Figure 1, is an appealing choice as an anchoring foundation due to its high holding capacity efficiency (ratio of holding capacity to self-weight) and relatively inexpensive installation.
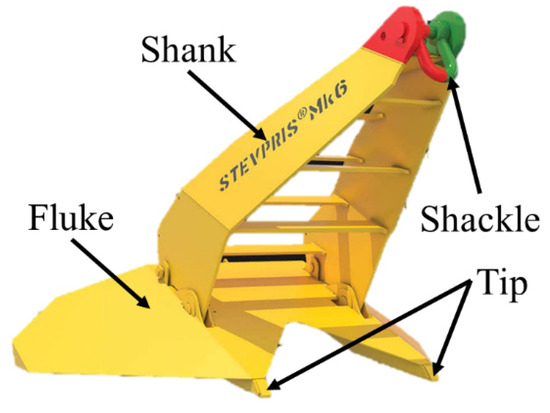
Figure 1.
A commercial drag embedment anchor (modified after [1]).
A drag embedment anchor is installed by a drag force applied at the shackle, as illustrated in Figure 2. The DEA is initially landed on the seabed with the tip of the fluke and the shackle resting on the seabed (despite an initial penetration depth due to its self-weight). As the anchor penetrates, the angle between the fluke and the seabed (hereinafter referred as the penetration angle θ) decreases gradually, i.e., the fluke flattens out. When the penetration angle θ decreases to a certain extent, the anchor will move horizontally without gaining further penetration [2,3,4,5]. The holding capacity of DEAs is dictated by their embedment depth; therefore, being able to predict the installation trajectory of the anchor is vital for sizing the anchor and planning for the installation at the design stage.
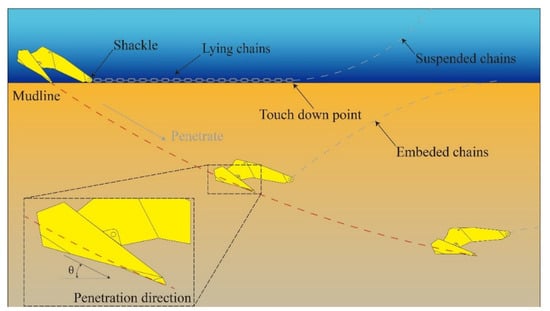
Figure 2.
Penetration process of a drag anchor.
In clayey seabeds, the installation performance of DEAs is relatively well understood [3,4,6,7,8,9,10,11,12,13,14,15,16,17,18,19,20,21,22,23,24,25,26,27] and established methods are available to predict the installation trajectory and holding capacity [28]. However, for DEAs in sandy seabeds, there is no well-established method for predicting the penetration depth and consequently the holding capacity [28,29,30]. For this reason, design guidelines such as [28] prescribe that drag anchors in sand should be pretensioned to 100% of the design capacity or higher for permanent mooring at the installation stage to ensure the safety of the anchor during service. This will, however, demand installation equipment with a large bollard pull capacity which could drastically increase the installation cost.
A number of studies have attempted to develop analytical models to predict the installation behavior and holding capacity of DEAs in sand [14,15,21,24,30,31,32,33,34] with varying degrees of success. A common challenge with those analytical models is that the predictions are generally sensitive to the values of empirical model parameters [35]. Another major issue is over-simplification of the anchor geometry. The anchor fluke is commonly simplified as a rectangular plate/wedge and the shank is simplified into a beam with a rectangular cross-section. However, simplifications of an anchor’s geometry may fail to capture the complex geometric features of commercial drag anchor designs, according to [9,36]. Various assumptions are also often made in the analytical models which could prevent their application in practice. For example, in [32]’s model for installation trajectory, the DEA is assumed to have a completely buried initial position instead of the posture illustrated in Figure 2. In [15], the anchor is assumed to move parallel to its rectangular fluke. However, it is hard to identify the moving direction of the anchor in practical engineering because of its complex fluke geometry. The challenges discussed above are reflected by the fact that there is no well-established method for drag anchor design in sandy seabeds as of today.
Centrifuge tests and 1 g physical tests have been conducted by researchers to study the mechanical and kinematic behavior of DEAs in sandy soils [8,14,32,37,38,39,40,41,42,43], together with field tests carried out in the Norwegian North Sea [44,45]. While field testing serves as a valuable benchmark for validating analytical and numerical investigations, its implementation is significantly constrained by substantial financial requirements and limited soil conditions that can be covered. Despite these extensive experimental efforts, the reliance on simplified anchor geometry presents a critical knowledge gap, underscoring the urgent need for more sophisticated approaches that can better reflect real DEA configurations.
With the development of computational power, there has been significant progress in numerical techniques for simulating large-deformation problems in geotechnical engineering. Methods such as “the remeshing and interpolation technique with small strain (RITSS)” and the coupled Eulerian–Lagrangian method (CEL) [46] provide unique opportunities for numerically simulating the installation process of drag anchors. In the past decade, many researchers have applied the CEL method to simulate the installation process of DEAs [3,4,17,19,20,26,47,48,49,50], most of which are concentrated in clay except for [46]. Going through these studies, two key issues are identified:
- (1)
- Similar to the analytical treatment, the anchor geometry is often over-simplified and fails to capture the geometric features of commercial drag anchor design. However, according to [9,36], the geometric simplification has important implications for anchor performance.
- (2)
- In some studies, the interaction between anchor chains and DEAs is considered in a decoupled manner, which means that the DEA’s movement is achieved by prescribing a calculated displacement/force/velocity boundary in the numerical model [17,26,49]. While in some other studies which did attempt to model the soil–chain interaction, too few chain units were modeled [19,20,47]; this can lead to significant inaccuracy as the model fails to capture the reverse-catenary shape of the embedded chain at deep embedment. As the anchor’s kinematics depends on the loading angle at the shackle, which is strongly influenced by the interaction between the chains and the soil [11,51,52], it is critical to correctly capture the soil–chain interaction in the CEL model.
Based on the above discussions, it is clear that the current understanding of drag anchor penetration behavior in sand is far from mature. The purpose of this paper is therefore to establish a reliable method for numerical simulation of a DEA’s installation trajectory in which the complex interplay between the anchor, the chain, and the soil is considered in a single consistent model with realistic modeling of the anchor geometry and the chains. In this paper, the numerical methodology is first described in detail. Parametric sensitivity analyses are then performed to investigate the convergence and efficiency of the proposed method with different modeling parameters. The result is then verified by back-analysis of a centrifuge test reported by [8]. It is demonstrated that the currently proposed method offers satisfactory accuracy and numerical efficiency. The numerical method is then applied to investigate the installation behavior of a popular commercial drag anchor design in sand, and preliminary findings on the soil mechanisms are reported.
While drag anchors form a cost-effective, self-installing cornerstone of marine mooring systems, diverse alternatives suit varying seabed conditions, depths, and loads. Suction caissons deliver high reusability and capacity via friction and end-bearing, but require pumps and risk deformation from pressure imbalances. Driven piles enable versatile catenary or taut moorings with formulaic predictability, though high costs arise from hammers, noise, and equipment. Gravity anchors provide reliable vertical restraint for tension-leg platforms via mass, yet bulkiness inflates transport expenses.
Emerging torpedo anchors, free-fall installed, achieve rapid embedment (up to 9 m) in soft soils with holding capacities around five times their weight, ideal for taut moorings in depths up to 1200 m [53]. However, tilt instability from a suboptimal center-of-gravity (>5° inclination) yields about 16.7% failure rates, curbing sandy soil use [53]. Recent innovations include streamlined C- and V-shaped gravity anchors, slashing wave-induced surge by 73–75% and pitch by 46–48% during lowering [54], plus variable buoyancy systems for instability mitigation in deep waters (>60 m) [55]. Piggy-backed drag anchors optimize spacing and angles for enhanced embedment in clays [56]. Yet, drag anchors’ erratic paths in strata highlight ongoing simulation hurdles.
2. Integrated Anchor–Chain–Soil Large-Deformation Finite-Element Analysis Method
2.1. Coupled-Eulerian–Lagrangian Method (CEL Method)
The coupled Eulerian–Lagrangian (CEL) method, available in the commercial software Abaqus/Explicit, is a finite-element method that is widely used to deal with large-deformation problems in geotechnical engineering. In this method, materials that will not experience large deformation are defined as Lagrangian bodies (the anchor in the current study), and materials that will experience large deformation (the soil in the current study) are defined as Eulerian bodies. The material in the Eulerian body will “flow” freely in a fixed mesh, which avoids the problem of element distortion, making it suitable for dealing with large-deformation issues. The authors of [46] compared the performance of the CEL method with two other alternative finite-element methods for large deformation, namely the efficient arbitrary Lagrangian–Eulerian method (EALE) developed at the University of Newcastle [57,58,59] and the remeshing and interpolation technique with small strain method (RITSS) developed at the University of Western Australia [60,61] for three representative geotechnical engineering problems that involve large deformation (cone penetration test, submarine pipeline buckling, and free-fall penetration test). It was found that the CEL method can yield comparable results to the EALE and RITSS methods for quasistatic problems. For this reason, the CEL method is used in this study to develop an approach to simulate the drag anchor installation in which the anchor–chain–soil interaction is modeled in an integrated manner. For ease of description, an example CEL model developed for a Vryhof Stevpris Mk6 anchor in loose sand is presented below.
2.2. Simulation of the Drag Anchor and the Seabed
Figure 3 illustrates the CEL model which includes the soil domain, the drag anchor, and the chain. The dimensions of the Eulerian domain (i.e., the soil) are 167 m, 50 m, and 40 m, respectively, for length, width, and depth. At the beginning of the simulation, the top 10 m of the Eulerian domain is empty, and the remaining part is filled with soil. The element type of the Eulerian domain is EC3D8R. The soil is modeled using the Mohr–Coulomb model which is described by a submerged unit weight (γ’ = 9.6 kN/m3), an internal friction angle (φ), a cohesion (c), a Young’s modulus (E), and a Poisson’s ratio (ν). It should be noted that although there is no cohesion in clean sand, a small cohesion (1 kPa) is assigned to the soil to improve the numerical stability.
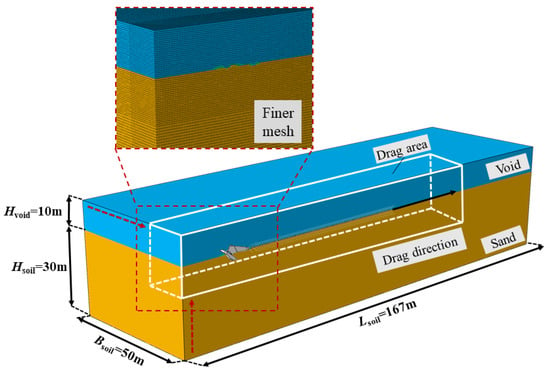
Figure 3.
CEL finite-element model of the integrated anchor–soil–chain system.
The CEL analysis is sensitive to the mesh size. For this reason, the mesh of the Eulerian domain is biased towards the drag area both vertically and laterally as illustrated by Figure 3. In the drag area, the hexahedral elements have a typical size (d) of 0.3 m. Compared to the size of the drag anchor, this represents an Ls/d ratio of 28.67 where Ls represents the length of shank. As will be demonstrated by the sensitivity analysis later, this mesh size yields a good balance between numerical efficiency and accuracy.
To model the complex anchor geometry, a work flow across different platforms is developed. The Vryhof Stevpris Mk6 anchor geometry is first constructed in Rhino [62] based on specifications provided in [1]. Subsequently, because of the challenge when meshing complex geometries in Abaqus—that significantly distorted elements will appear on the boundary of geometric shapes based on the mesh algorithm in Abaqus, which may induce a nonconvergence problem—the anchor model is transferred to Hypermesh [63] for advanced meshing operations, where a high-quality hexahedral mesh is generated. The fully meshed anchor model is then imported into Abaqus for subsequent simulations.
The geometry of the anchor and its mesh is illustrated in Figure 4. The detailed dimensions of the anchor are summarized in Table 1, corresponding to a large (46 tons) Vryhof Stevpris Mk6 anchor.
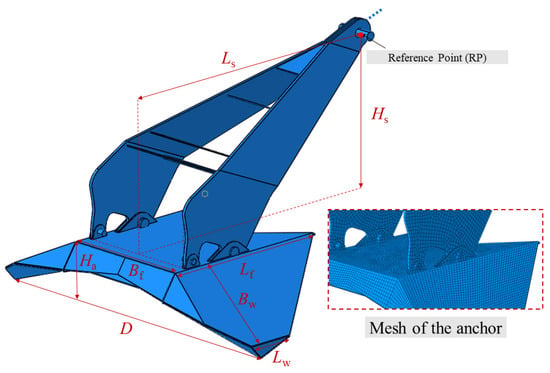
Figure 4.
Drag anchor model and its mesh.

Table 1.
Dimensions of the drag anchor.
2.3. Simulation of the Chain
The dragging force applied at the shackle is transmitted from the chain. During the penetration process of DEA, the embedded part of the chain will form a reverse-catenary shape due to soil resistance. This leads to continuous evolution of the magnitude and direction of the dragging force at the shackle. For this reason, it is critical to appropriately simulate the chain–soil interaction in order to accurately capture the installation process of the DEA in the soil. In previous studies which modeled the chain, the chain units were usually modeled as rigid cylinders and connected by a “Link” connector [4,17,64,65,66] or “Hinge” connector [19,20,47]. However, the implementation of these connectors in the current numerical simulations revealed significant limitations, indicated by anomalous displacement normal to the connector’s longitude axis. Consequently, in this current study, the alternative connector “Join + Rotation” is used which allows for free rotation but no elongation of the linkage between the chain units.
A separate issue with the previous approach of modeling the chain units as cylinders is that the cylinders attract too much end residence from the soil, which is considered unrealistic. In the current study, chain units are simplified into a series of evenly spaced cylinders with rounded ends and assembled using the “Join + Rotation” connectors, as shown in Figure 5. In this example, an R3S studless mooring chain with a nominal bar diameter of 142 mm is modeled. According to [66], the chain geometry can be characterized by four parameters as illustrated by Figure 5. The parameters for the 142 mm R3S studless chain are as follows: db = 142 mm; lc = 710 mm; sc = 150 mm; dc = 367 mm. In order to ensure that the complete reverse-catenary shape of the chain can be captured during the anchor installation, a sufficient chain length must be simulated. In this example, 70 chain units are modeled, representing a total length of 60 m. Accurately modeling full-length chains is critical, as their interaction with the seabed soil significantly influences the anchor kinematics. As the axial deformation of the chain is negligible compared to the soil, the chain units are modeled as rigid bodies. Based on weight equivalency, the submerged unit weight of the chain material is set to 37.66 kN/m3. The first unit of the chain is also connected to the shackle of the anchor with the “Join + Rotation” connector.
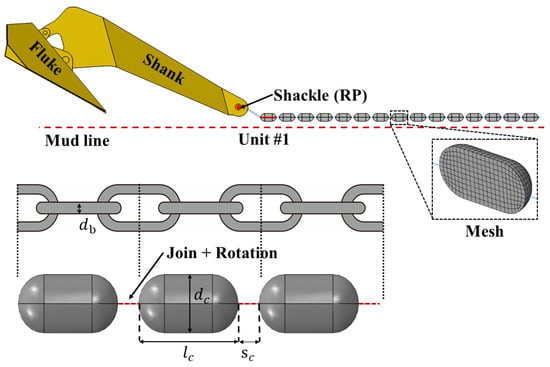
Figure 5.
Simulation of the chain.
2.4. Analysis Steps, Boundary Conditions, and Interface Interaction
There are in total three analysis steps involved in each simulation and the details are described below:
- (1)
- The “geostatic” step. This purpose of this step is to generate the initial stress field within the soil domain.
- (2)
- The “initialization” step. Gravity is activated on the anchor and the chains in this step and the anchor achieves a small initial penetration due to its self-weight.
- (3)
- The “drag” step. A horizontal drag velocity is applied at the last chain unit and the anchor penetrates into the seabed under the dragging motion.
The boundary conditions and interactions between the DEA, the chain units, and the soil in the CEL model are detailed below:
- For the Eulerian domain, side boundaries (including the bottom of the soil) are prescribed with a zero-velocity boundary condition normal to the surfaces. This is different from the normally applied zero-displacement boundary because precluding nonzero displacement boundaries in the Eulerian domain would deform the mesh, contradicting the formulation where nodes stay stationary. Abaqus ignores such conditions, restricting displacements to zero. Instead, zero-velocity boundaries control movement of materials by preventing outflow during deformation like impermeable “walls”. This ensures stability, realism, and accurate flow tracking around Lagrangian domains like the anchors in the current study.
- An Eulerian outflow boundary with a “no reflection” option is applied on the side boundaries of the Eulerian domain (except the bottom of the soil). This is essential for modeling infinite domains. The fixed Eulerian mesh prevents material from deforming nodes, but without this condition, outgoing soil flow would artificially reflect back at the domain edge, distorting force balances, trajectories, and overall dynamics, leading to unphysical stiffening or oscillations. The non-reflecting outflow absorbs these waves simulating an infinite domain and ensuring realistic movement of material out of the mesh without re-entry. This enhances accuracy in transient analyses with extreme deformations.
- The vertical symmetry plane of the model is assigned a symmetry boundary condition.
- A constant drag velocity is prescribed at the reference point (RP) of the last chain unit, which aims to simulate the dragging of anchor holding vehicle in practical engineering.
- The contact between the DEA and the soil, and the chain units and the soil, is defined using “general contact”. The tangential behavior follows the Coulomb friction law, with a friction coefficient of 0.5. The normal behavior is defined as “hard contact, allow separation after contact”.
3. Parametric Sensitivity Analysis
In order to verify the convergence of the proposed CEL method, a comprehensive suite of parametric sensitivity analysis was performed. The following parameters were examined.
- Width of the soil domain perpendicular to the dragging direction—Bsoil = 3D, 4.5D, and 6D (where D represents the overall width of the drag anchor)—for which two sets of analyses with two soil friction angles (20° and 27.5°) are performed.
- Mesh size in the drag area—Mesh_S = 0.25 m, 0.3 m, 0.4 m, and 0.5 m—for which three sets of analyses with three friction angles (φ = 20°, 27.5° and 35°) are performed.
- Dragging speed—vc = 0.4 m/s, 0.6 m/s, and 1.0 m/s.
The matrix of CEL analyses is summarized in Table 2, Table 3 and Table 4. Note that in the parametric analyses, the majority of the analyses were performed with relatively low friction angles (e.g., 20° and 27.5°). These are lower than the typical values seen for clean sand. They were selected for the parametric analyses as they were much quicker to run than higher friction angles. The conclusions from these cases are considered equally applicable to sand with higher friction angles. In the parametric analyses, the anchor was simplified in order to save calculation time. The shank of the anchor is simplified to a polygonal plate and situated in the middle of the fluke. The fluke is also simplified to plates and the external contour of the upper surface is kept the same as that of the prototype. The geometry of the simplified anchor is shown in Figure 6. The holding capacity of the anchor is defined as the force at the shackle, which is obtained by extracting the force on the connector between the reference point and the first chain unit. The penetration depth is defined as the vertical distance from the tip of fluke to the original seafloor.

Table 2.
Sensitivity analyses of soil domain width perpendicular to the pulling direction.

Table 3.
Sensitivity analyses of mesh size of the drag area.

Table 4.
Sensitivity analyses of drag velocity.
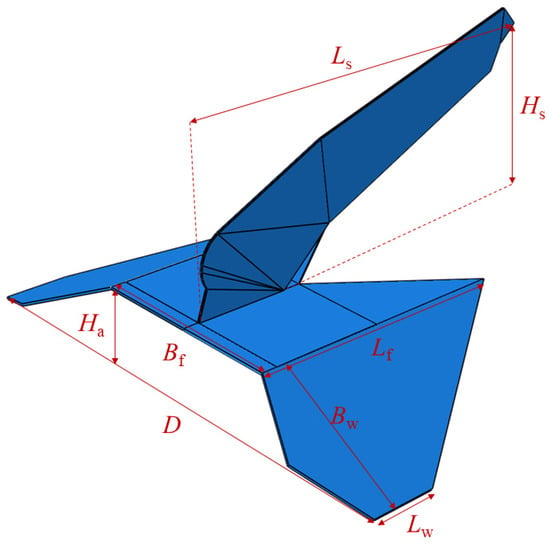
Figure 6.
Simplified DEA model used in parametric sensitivity analysis.
3.1. The Influence of Soil Size Perpendicular to the Dragging Direction
Figure 7 presents the results of the numerical sensitivity analyses on the effect of soil domain width perpendicular to the dragging direction. It is clear that for different internal friction angles (20 and 27.5 degrees), the holding capacity development and trajectory of the anchor show little difference, which indicates that the 3D width of the soil domain is large enough to prevent the boundary effect. Therefore, a soil domain width of 3D is recommended.
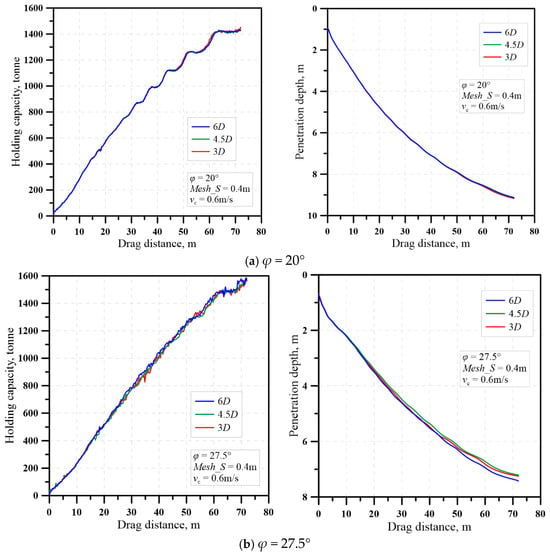
Figure 7.
Sensitivity analysis on the soil domain width perpendicular to the dragging direction.
3.2. The Influence of Mesh Size in the Drag Area
As described in Section 2.2, a refined mesh is used in the drag area to improve the numerical accuracy. Four different mesh sizes ranging from 0.25 m to 0.50 as illustrated in Figure 8 are examined by sensitivity analysis.
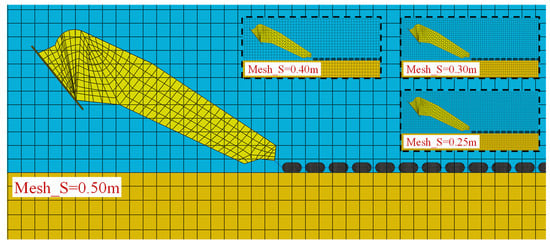
Figure 8.
Mesh size in drag area.
Figure 9 presents the results of the sensitivity analysis on the effect of element size. The results clearly illustrate that the coarser the mesh in drag area, the smaller the penetration depth of the drag anchor, and consequently the lower the holding capacity. Moreover, the effect of mesh size appears to be dependent on the friction angle of the sand. The mesh size shows greater impact on the results for sands with higher friction angles. However, the results seem to converge for an element size of 0.3 m. To balance between numerical efficiency and accuracy, a mesh size of 0.3 m is recommended.
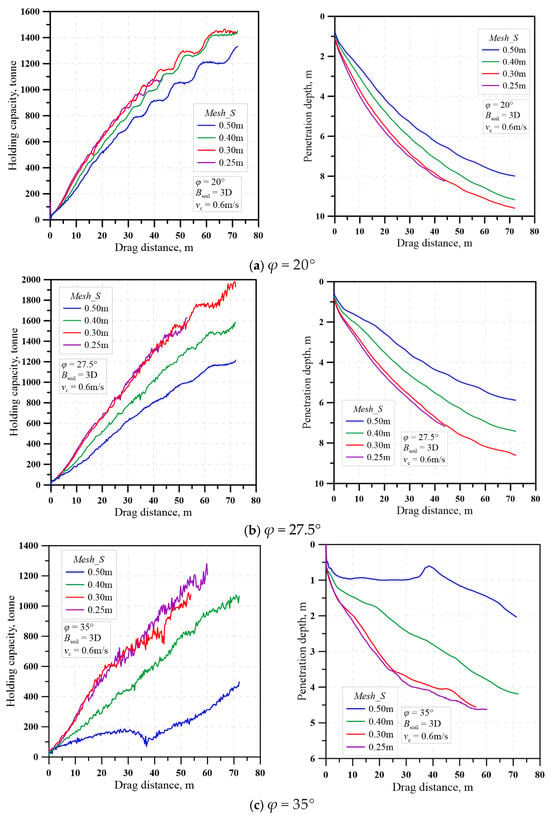
Figure 9.
Sensitivity analysis of drag area mesh size.
3.3. Influence of Drag Velocity
Figure 10 shows the results of the sensitivity analysis on the effect of drag velocity. From the results, it can be seen that as the drag velocity increases, the penetration depth of the anchor decreases slightly, and so does the holding capacity. The numerical results seem to converge for a drag velocity of 0.6 m/s, which is therefore recommended.
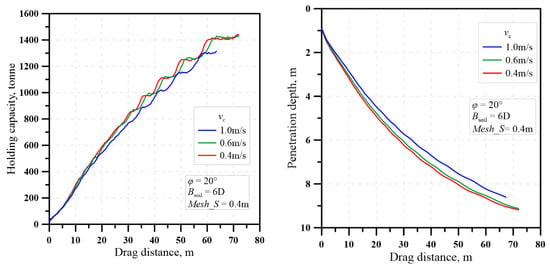
Figure 10.
Sensitivity analysis of drag velocity.
4. Verification Against Centrifuge Test in Sand
A series of centrifuge tests were conducted at UWA and reported by [8]. To validate the numerical model, a centrifuge test carried out in calcareous sand is back-analyzed using the proposed CEL method. A 1:80 model of a 32t Vryhof Stevpris anchor with a fluke–shank angle θfs of 32° was adopted in the centrifuge test (Figure 11, cited from [8]) and the numerical model is developed with the prototype geometry of the centrifuge test, as illustrated in Figure 11. In the centrifuge test, the DEA was firstly placed at one end of the strongbox with an initial pre-embedment and a penetration angle (θ) of 38°, as illustrated in Figure 12a. The test was performed by applying a dragging motion to the anchor. The calcareous sand used in the centrifuge tests is modeled using the Mohr–Coulomb model. A friction angle of 42.7° and a submerged unit weight of 8.33 kN/m3 are selected according to [8], and the Young’s modulus (E = 12 MPa) and the Poisson’s ratio (ν = 0.3) are empirically determined. A velocity boundary condition (vc = 0.2 m/s) is applied at the end of the chains, which drags the anchor into the soil. Figure 12b illustrates the conditions around the anchor at a drag distance of 20 m.
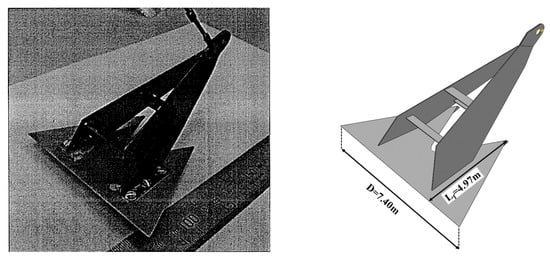
Figure 11.
Physical and numerical model of a Vryhof Stevpris anchor.

Figure 12.
Views of the anchor and the surrounding soil before and after the dragging.
The comparison of results between the centrifuge test and CEL simulation is shown in Figure 13. The scaling of force and distance follows the relationships proposed by [67]. Anchor efficiency is calculated as ηa = Ta/Wa in which Ta represents the dragging force at the padeye and Wa stands for the self-weight of the anchor. The horizontal padeye drag length xa and embedment depths of padeye (da) and fluke tip (dt) are normalized by the fluke length Lf. The results reveal good overall agreement between the centrifuge test and the CEL simulation, which verifies the reliability of the CEL method.
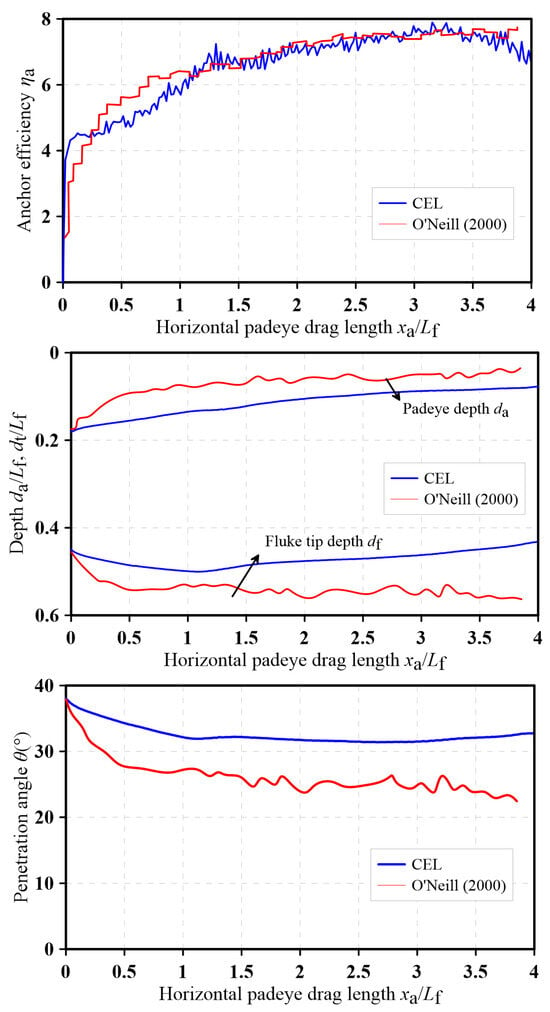
Figure 13.
Comparation of results of CEL method and centrifuge test [8].
5. Installation Behavior of Drag Anchor in Sand
In this section, the proposed CEL model is used to investigate the installation behavior of a drag anchor in uniform sand using the realistic anchor geometry shown in Figure 4. Two analyses with two different friction angles (φ = 20° and 30°) are performed, exploring the influence of the sand friction angle. In both analyses, the converged set of parameters, i.e., Bsoil/D = 3, vc = 0.6 m/s, and Mesh_S = 0.3 m are adopted. Figure 14 presents the different stages of installation from the analysis with φ = 20°.
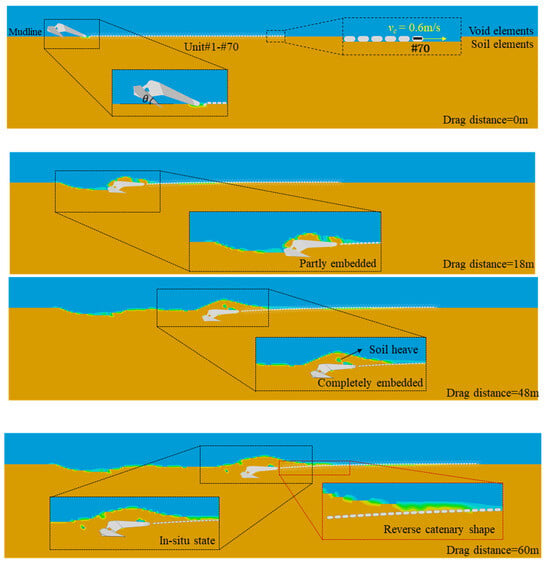
Figure 14.
The continuous penetration process of the drag anchor.
- (1)
- Initial stage: The DEA rests on the seabed in a “bowing” posture, and the chain is laid flat on the seabed. The tip of fluke achieves an initial penetration of about 1.8 m due to the self-weight of the anchor.
- (2)
- Partial embedment: As the chain begins to move, the DEA gradually penetrates into the seabed but is still visible at the seafloor. The failure mechanism is quite similar to that of a shallowly embedded plate anchor [68], in which the soil wedge in front of the anchor ruptures and the DEA’s behavior is linked to a plough-type mechanism.
- (3)
- Complete embedment: As the anchor gains further penetration, the DEA is completely embedded into the seabed. The sand particles in front of the DEA are ploughed out from the seabed, moving through the shank to the surface, forming a “horseshoe” soil heave. As the dragging process continues, the sand particles gradually fall down to the ditch behind the anchor. This in–out balance of sand particles makes the soil heave move with the anchor, with its size and shape nearly unchanged.
- (4)
- Final stage: The drag distance reaches the predetermined value, marking the end of anchor’s embedment process. Compared with the initial stage, the angle between fluke and seabed (i.e., the penetration angle θ) is clearly reduced, and the chains form a reverse-catenary shape.
Figure 15a presents the evolution of the holding capacity and penetration depth with the drag distance predicted by the numerical simulation. The solid line in Figure 15a shows the development of holding capacity with drag distance. The holding capacity–drag distance curve can be clearly divided into three stages: linear increasing stage (0–8 m), nonlinear increasing stage (8–50 m), and stabilized stage (50–72 m). In the initial stage, the holding capacity of anchor increases roughly linearly with drag distance before the curve starts to bend from approximately 8 m drag distance. Hereafter, the capacity of the anchor keeps increasing with drag distance but at gradually reducing rates. In the stabilized stage, the capacity of the anchor does not increase with further drag distance, reaching its ultimate holding capacity. The development of capacity vs. drag distance coincided well with the development of penetration depth with drag distance, which is shown by the dashed line in Figure 15a.
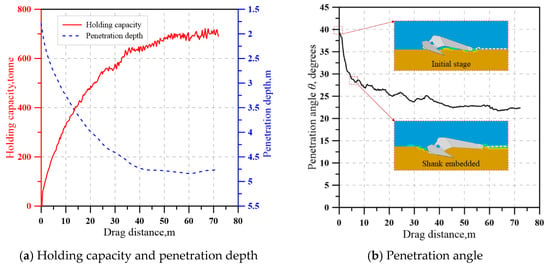
Figure 15.
Evolution of holding capacity, penetration depth, and penetration angle during the installation process.
Figure 15b illustrates the evolution of the penetration angle (θ) with drag distance. Initially, the penetration angle measures approximately 40°, followed by a rapid decline during the first 8 m of dragging until the shank starts penetrating into the seabed. Subsequently, the penetration angle continues to decrease, albeit at a significantly reduced rate. A stable penetration angle about 22.4° is attained at a drag distance of 50 m, which exhibits excellent correlation with the trajectory profile shown in Figure 15a.
In Figure 16, the development of holding capacity and penetration depth with drag distance in analyses with two different friction angles (20° and 30°) are compared. The results show that with the increase in friction angle, the penetrability of the anchor sharply decreases which leads to a significant reduction in the holding capacity. The results demonstrate excellent agreement between the two soils within the initial 8 m of dragging. However, the two curves start diverging from each other after this point. Numerical simulations indicate that this critical point corresponds to the onset of shank embedment into the soil. As the soil resistance acting on the shank in sand with φ = 30° is substantially greater than that in sand with φ = 20°, the marked divergence that subsequently develops underscores the pivotal influence of soil resistance to the shank on the drag anchor’s penetration behavior. Large soil resistance acting on the shank can drastically impede anchor penetration, as demonstrated by the current analyses, consistent with the statement by [68].
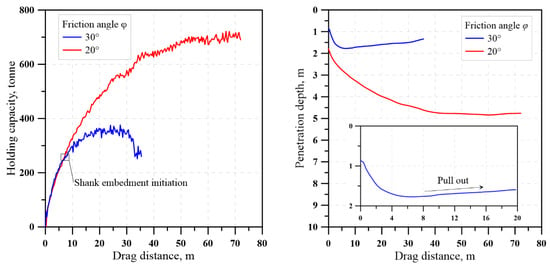
Figure 16.
Effect of sand friction angle φ on the installation performance of drag anchor in uniform sand.
The above discussions clearly suggest that the holding capacity of a drag anchor in sand is primarily dictated by its penetration depth. Although the shear strength parameter (i.e., φ) influences the shear resistance on the rupture surfaces of the failure mechanism, a seabed with denser sand does not necessarily lead to a higher anchor holding capacity due to reduced anchor embedment.
6. Concluding Remarks
Drag embedment anchors are an appealing option as mooring foundations for floating offshore wind turbines. While methods to predict the installation trajectory and holding capacity of drag anchors in clayey soils are well-established, there is no widely recognized method for sandy soils. For this reason, a large-deformation finite-element model which can simulate realistic drag anchor geometry and the complete installation process with satisfactory accuracy is developed using the CEL method in Abaqus/Explicit. By cleverly simplifying the chain geometry and joining the chain units with “Join + Rotation” connectors, the complex interaction between the anchor, the chain, and the soil is modeled in an integrated manner. Verification has been conducted against a centrifuge test and close agreement is observed on all aspects of the anchor performance. Through a comprehensive sensitivity analysis, the finite-element model is optimized in terms of domain size, mesh, and drag velocity.
The numerical model is applied to investigate the installation behavior of a commercial drag anchor design in sands of different friction angles. The results highlight the critical role played by the soil resistance acting on the shank for limiting the embedment depth of drag anchors in sand. The denser the soil, the lower the achievable penetration depth. The ultimate holding capacity of the drag anchor in sand is primarily dictated by its embedment depth; therefore, a denser seabed can lead to lower anchor holding capacities.
The numerical model developed in this study provides a powerful tool for further investigation of the installation behavior of drag anchors in sand. Aspects such as the shank geometry, the fluke design, the misalignment between the pulling direction, and the anchor and effect of soil layering are areas where further investigations are needed.
Author Contributions
Methodology, P.G.; Validation, D.L.; Writing—original draft, C.W.; Writing—review & editing, Y.Z. All authors have read and agreed to the published version of the manuscript.
Funding
This research was funded by the National Natural Science Foundation of China under Grant No. 52109117.
Institutional Review Board Statement
Not applicable.
Informed Consent Statement
Not applicable.
Data Availability Statement
The data presented in this study are available on request from the corresponding author. The data are not publicly available due to privacy.
Acknowledgments
The authors wish to gratefully acknowledge financial support from the National Natural Science Foundation of China under Grant No. 52109117.
Conflicts of Interest
The authors declare no conflict of interest.
References
- Vryhof Manual. In The Guide to Anchoring; Vryhof: Schiedam, The Netherlands, 2018; ISBN/EAN: 978-90-9028801-7.
- O’Neill, M.P.; Randolph, M.F.; Neubecker, S.R. A Novel Procedure for Testing Model Drag Anchors. In Proceedings of the Seventh International Offshore and Polar Engineering Conference, Honolulu, HI, USA, 25–30 May 1997. [Google Scholar]
- Zhao, Y.; Liu, H. The drag effects on the penetration behavior of drag anchors during installation. Ocean Eng. 2015, 109, 169–180. [Google Scholar] [CrossRef]
- Dou, Y.; Yu, L. Numerical investigations of the effects of different design angles on the motion behaviour of drag anchors. Appl. Ocean Res. 2018, 76, 199–210. [Google Scholar] [CrossRef]
- Qiao, D.; Guan, B.; Liang, H.; Ning, D.; Li, B.; Ou, J. An improved method of predicting drag anchor trajectory based on the finite element analyses of holding capacity. China Ocean Eng. 2020, 34, 1–9. [Google Scholar] [CrossRef]
- Dunnavant, T.W.; Kwan, C.-T.T. Centrifuge modelling and parametric analyses of drag anchor behavior. In Proceedings of the Offshore Technology Conference (OTC), Houston, TX, USA, 3–6 May 1993. [Google Scholar] [CrossRef]
- Thorne, C.P. Penetration and load capacity of marine drag anchors in soft clay. J. Geotech. Geoenviron. Eng. 1998, 124, 945–953. [Google Scholar] [CrossRef]
- O’Neill, M.P. The Behaviour of Drag Anchors in Layered Soils. Ph.D. Thesis, University of Western Australia, Crawley, WA, Australia, 2000. [Google Scholar]
- O’Neill, M.P.; Bransby, M.F.; Randolph, M.F. Drag anchor flukesoil interaction in clays. Can. Geotech. J. 2003, 40, 78–94. [Google Scholar] [CrossRef]
- Ruinen, R.M. Penetration analysis of drag embedment anchors in soft clays. In Proceedings of the Fourteenth International Offshore and Polar Engineering Conference, Toulon, France, 23–28 May 2004. [Google Scholar]
- Kim, B.M. Upper Bound Analysis for Drag Anchors in Soft Clay. Ph.D Thesis, Texas A&M University, College Station, TX, USA, 2005. [Google Scholar]
- Aubeny, C.P.; Murff, J.D.; Byoung, M.K. Prediction of anchor trajectory during drag embedment in soft clay. Int. J. Offshore Polar Eng. 2008, 18, 314–319. [Google Scholar]
- Aubeny, C.P.; Chi, C. Mechanics of drag embedment anchors in a soft seabed. J. Geotech. Geoenviron. Eng. 2010, 136, 57–68. [Google Scholar] [CrossRef]
- Liu, H.; Li, Y.; Yang, H.; Zhang, W.; Liu, C. Analytical study on the ultimate embedment depth of drag anchors. Ocean Eng. 2010, 37, 1292–1306. [Google Scholar] [CrossRef]
- Liu, H.; Liu, C.; Yang, H.; Li, Y.; Zhang, W.; Xiao, Z. A novel kinematic model for drag anchors in seabed soils. Ocean Eng. 2012, 49, 33–42. [Google Scholar] [CrossRef]
- Liu, H.; Zhang, W.; Liu, C.; Hu, C. Movement direction of drag anchors in seabed soils. Appl. Ocean Res. 2012, 34, 78–95. [Google Scholar] [CrossRef]
- Liu, H.; Zhao, Y. Numerical Study of the Penetration Mechanism and Kinematic Behavior of Drag Anchors Using a Coupled Eulerian-Lagrangian Approach. Geotech. Eng. J. SEAGS AGSSEA 2014, 45, 29–39. [Google Scholar]
- Zhang, W.; Liu, H.; Zhao, Y.; Yue, Y. Interactional Properties between Drag Anchor and Installation Line. J. Geotech. Geoenviron. Eng. 2014, 140, 04013018. [Google Scholar] [CrossRef]
- Grabe, J.; Wu, L. Coupled Eulerian-Lagrangian simulation of the penetration and braking behaviour of ship anchors in clay. Geotechnik 2016, 39, 168–174. [Google Scholar] [CrossRef]
- Osthoff, D.; Heins, E.; Grabe, J. Impact on submarine cables due to ship anchor–soil interaction. Geotechnik 2017, 40, 265–270. [Google Scholar] [CrossRef]
- Peng, J.; Liu, H. Analytical study on comprehensive behaviors of drag anchors in the seabed. Appl. Ocean. Res. 2019, 90, 101855. [Google Scholar] [CrossRef]
- Lai, Y.; Zhu, B.; Huang, Y.; Chen, C. Behaviors of drag embedment anchor in layered clay profiles. Appl. Ocean Res. 2020, 101, 102287. [Google Scholar] [CrossRef]
- Wu, X.; Chow, Y.K.; Leung, C.F. Kinematic analysis of drag anchor installation trajectory considering both shallow and deep anchor behavior of horizontal fluke. Appl. Ocean. Res. 2020, 100, 102157. [Google Scholar] [CrossRef]
- Peng, J.; Liu, H.; Liang, K.; Xiao, Z. A theoretical model for analyzing the behavior of drag anchors in layered soils. Ocean. Eng. 2021, 222, 108568. [Google Scholar] [CrossRef]
- Fanning, J.; Sivakumar, V.; Nanda, S.; Gavin, K.; Murray, T.; Bradshaw, A.; Black, J.; Jalilvand, S. Pullout Capacity of Single and Biwing Anchors in a Soft Clay Deposit: Model Investigation in a Centrifuge and FEM Predictions. J. Geotech. Geoenviron. Eng. 2023, 149, 04023050. [Google Scholar] [CrossRef]
- Zhang, Y.; Fan, S.; Li, S.; Yin, J. Analysis of the drag anchor behaviour at shallow depths. Comput. Geotech. 2023, 160, 105518. [Google Scholar] [CrossRef]
- Maitra, S.; Tian, Y.; Cassidy, M.J. Investigation of the installation process of drag-in plate anchors from LDFE modelling. Geotech. 2024, 74, 1215–1227. [Google Scholar] [CrossRef]
- DNV-RP-E301; Design and Installation of Fluke Anchors. DNV: Høvik, Norway, 2021.
- ISO 19901-7:2013; Stationkeeping Systems for Floating Offshore Structures and Mobile Offshore Units. ISO: Geneva, Switzerland, 2013.
- ABS. Guidance Notes on Design and Installation of Drag Anchors and Plate Anchors; ABS Plaza: Houston, TX, USA, 2018. [Google Scholar]
- Neubecker, S.R.; Randolph, M.F. The static equilibrium of drag anchors in sand. Can. Geotech. J. 1996, 33, 574–583. [Google Scholar] [CrossRef]
- Neubecker, S.R.; Randolph, M.F. The kinematic behaviour of drag anchors in sand. Can. Geotech. J. 1996, 33, 584–594. [Google Scholar] [CrossRef]
- Zhang, W.; Liu, H.; Li, X.; Li, Q.; Cao, J. An analytical method for positioning drag anchors in seabed soils. China Ocean Eng. 2015, 29, 49–64. [Google Scholar] [CrossRef]
- Ren, Y.; Guo, W.; Wang, Y.; Gao, X.; Zhuang, D.; Yan, S. Kinematic trajectory analysis of dragging hall anchor in sand. Ocean Eng. 2022, 247, 110699. [Google Scholar] [CrossRef]
- Pretti, G.; Coombs, W.M.; Augarde, C.; Puigvert, M.M.; Gutiérrez, J.A.R.; Cross, L. A Review Of Drag Anchor Penetration Models to Inform Cable Burial Risk Assessment. In Proceedings of the 4th International Symposium on Frontiers in Offshore Geotechnics, Austin, TX, USA, 28–31 August 2020. [Google Scholar]
- Aslkhalili, A.; Shiri, H.; Zendehboudi, S. Reliability assessment of drag embedment anchors in sand and the effect of idealized anchor geometry. Saf. Extrem. Environ. 2020, 2, 37–55. [Google Scholar] [CrossRef]
- O’Neill, M.; Randolph, M. Modelling drag anchors in a drum centrifuge. Int. J. Phys. Model. Geotech. 2001, 1, 29–41. [Google Scholar] [CrossRef]
- Liu, H.; Zhang, W.; Zhang, X.; Liu, C. Experimental investigation on the penetration mechanism and kinematic behavior of drag anchors. Appl. Ocean. Res. 2010, 32, 434–442. [Google Scholar] [CrossRef]
- Yan, S.; Guo, B.; Sun, L.; Guo, W.; Lei, Z. Analytical and experimental studies of dragging hall anchors through rock berm. Ocean. Eng. 2015, 108, 529–538. [Google Scholar] [CrossRef]
- Moore, E.; Haigh, S.K.; Eichhorn, G.N. Anchor penetration depth in sandy soils and its implications for cable burial. Ocean Eng. 2021, 235, 109411. [Google Scholar] [CrossRef]
- Davidson, C.; Brennan, A.; Brown, M.; Inglis, L.; Vasudevan, S. Out of Plane Loading of Drag Embedment Anchors for Floating Renewable Energy Technologies. In Proceedings of the 9th International SUT Offshore Site Investigation Geotechnics Conference Proceedings Innovative Geotechnologies for Energy Transition, London, UK, 12–14 September 2023; pp. 1241–1248. [Google Scholar] [CrossRef]
- Sharif, Y.U.; Brown, M.J.; Coombs, W.M.; Augarde, C.E.; Bird, R.; Carter, G.; Macdonald, C.; Johnson, K.R. Characterization of Anchor Penetration Behaviour for Cable Burial Risk Assessment. In Proceedings of the 9th International SUT OSIG Conference, London, UK, 12–14 September 2023. [Google Scholar]
- Sharif, Y.U.; Brown, M.J.; Knappett, J.A.; Davidson, C.; Bird, R.; Coombs, W.; Augarde, C.; Carter, G.; Macdonald, C.; Johnson, K. Comparison of 1 g and centrifuge modelling of drag anchors with subsurface wireless tracking. Int. J. Phys. Model. Geotech. 2025, 25, 102–114. [Google Scholar] [CrossRef]
- Røraas, H.; Hagen, Ø. Method for design, construction, and setting of very high capacity anchors. In Proceedings of the Offshore Technology Conference, Houston, TX, USA, 1–4 May 1989. [Google Scholar] [CrossRef]
- Heurlin, K.; Rességuier, S.; Melin, D.; Nilsen, K. Comparison between FEM analyses and full-scale tests of fluke anchor behavior in silty sand. In Frontiers in Offshore Geotechnics III; Meyer, V., Ed.; CRC Press: Leiden, The Netherlands, 2015; pp. 875–880. [Google Scholar] [CrossRef]
- Wang, D.; Bienen, B.; Nazem, M.; Tian, Y.; Zheng, J.; Pucker, T.; Randolph, M.F. Large deformation finite element analyses in geotechnical engineering. Comput. Geotech. 2015, 65, 104–114. [Google Scholar] [CrossRef]
- Grabe, J.; Qiu, G.; Wu, L. Numerical simulation of the penetration process of ship anchors in sand. Geotechnik 2015, 38, 36–45. [Google Scholar] [CrossRef]
- Li, P.D.; Liu, H.X.; Zhao, Y.B. Large deformation finite element analysis on the kinematic behavior of drag anchors in the seabed. Ocean. Eng. 2016, 34, 56–63. [Google Scholar]
- Zhao, Y.; Liu, H.; Li, P. An efficient approach to incorporate anchor line effects into the coupled Eulerian–Lagrangian analysis of comprehensive anchor behaviors. Appl. Ocean. Res. 2016, 59, 201–215. [Google Scholar] [CrossRef]
- Dao, D.A.; Grabe, J. Numerical assessment of ship anchor penetration depth in Baltic Sea Sand: Implications for subsea cable burial. Ocean. Eng. 2024, 314, 119674. [Google Scholar] [CrossRef]
- Wang, L.; Shen, K.; Li, L.; Guo, Z. Integrated analysis of drag embedment anchor installation. Ocean. Eng. 2014, 88, 149–163. [Google Scholar] [CrossRef]
- Zhang, W.; Zhou, Z.; Pradhan, D.L.; Wang, P.; Jin, H. Design considerations of drag anchors in cohesive soil for floating facilities in the South China sea. Mar. Struct. 2022, 81, 103101. [Google Scholar] [CrossRef]
- Chang, H.-C.; Noorizadegan, A.; Liu, Y.-H.; Ma, K.-T. A Study on Offshore Anchor Selection with a Focus on Torpedo Anchor Stability and Performance. J. Mar. Sci. Eng. 2024, 12, 1721. [Google Scholar] [CrossRef]
- Vanjakula, V.K.; Windt, C.; Adam, F.; Goseberg, N. Numerical Investigation on the Motion Dynamics of Submerged Gravity Anchors Exposed to Wave Action. J. Waterw. Port Coast. Ocean. Eng. 2024, 151, 04024023. [Google Scholar] [CrossRef]
- Martinez, R.; Arnau, S.; Scullion, C.; Collins, P.; Neilson, R.D.; Kapitaniak, M. Variable buoyancy anchor deployment analysis for floating wind applications using a Marine Simulator. Ocean. Eng. 2023, 285, 115417. [Google Scholar] [CrossRef]
- Lai, Y.; Xiong, S.; Tao, P.; Huang, C.; Zhu, Q.; Shu, S.; Chen, H. Experimental investigation and optimization of piggy-backed anchors in clay. Ocean. Eng. 2025, 333, 121513. [Google Scholar] [CrossRef]
- Nazem, M.; Sheng, D.; Carter, J.P.; Sloan, S.W. Arbitrary Lagrangian–Eulerian method for large-strain consolidation problems. Int. J. Numer. Anal. Methods Geomech. 2008, 32, 1023–1050. [Google Scholar] [CrossRef]
- Nazem, M.; Carter, J.P. Dynamic analysis of geotechnical problems by arbitrary Lagrangian-Eulerian method. In Proceedings of the 12th International Conference of International Association for Computer Methods and Advances in Geomechanics (IACMAG), Goa, India, 1–6 October 2008; pp. 229–235. [Google Scholar]
- Nazem, M.; Carter, J.P.; Airey, D.W. Arbitrary Lagrangian–Eulerian method for dynamic analysis of geotechnical problems. Comput. Geotech. 2009, 36, 1046–1060. [Google Scholar] [CrossRef]
- Tian, Y.; Randolph, M.F. A simple implementation of RITSS and its application in large deformation analysis. Comput. Geotech. 2014, 65, 230–242. [Google Scholar] [CrossRef]
- Ullah, S.N.; Hossain, M.S.; Hu, Y. A 3D RITSS approach for total stress and coupled-flow large deformation problems using ABAQUS. Comput. Geotech. 2018, 99, 203–215. [Google Scholar] [CrossRef]
- Robert McNeel & Associates. Rhino User’s Guide for Windows; Robert McNeel & Associates: Seattle, WA, USA, 2023. [Google Scholar]
- Altair Engineering Inc. HyperMesh Desktop Introduction; Altair Engineering Inc.: Troy, MI, USA, 2013. [Google Scholar]
- Sun, C.; Bransby, M.F.; Neubecker, S.R.; Randolph, M.F.; Feng, X.; Gourvenec, S. Numerical Investigations into Development of Seabed Trenching in Semitaut Moorings. J. Geotech. Geoenviron. Eng. 2020, 146, 04020098. [Google Scholar] [CrossRef]
- Sun, C.; Feng, X.; Bransby, M.F.; Neubecker, S.R.; Randolph, M.F.; Gourvenec, S. Numerical investigations of the effect of strain softening on the behaviour of embedded mooring chains. Appl. Ocean Res. 2019, 92, 101944. [Google Scholar] [CrossRef]
- Sun, C.; Feng, X.; Neubecker, S.R.; Bransby, M.F.; Gourvenec, S.; Randolph, M.F. Numerical Study of Mobilized Friction along Embedded Catenary Mooring Chains. J. Geotech. Geoenviron. Eng. 2019, 145, 04019081. [Google Scholar] [CrossRef]
- Taylor, R.N. Centrifuges in modelling: Principles and scale effects. In Geotechnical Centrifuge Technology; Taylor, R.N., Ed.; Talor & Francis: New York, NY, USA, 1995. [Google Scholar]
- O’Loughlin, C.; Neubecker, S.; Gaudin, C. Anchoring Systems: Anchor Types, Installation, and Design. In Encyclopedia of Maritime and Offshore Engineering; Carlton, J., Jukes, P., Choo, Y.S., Eds.; John Wiley & Sons: New York, NY, USA, 2018; pp. 1–20. [Google Scholar] [CrossRef]
Disclaimer/Publisher’s Note: The statements, opinions and data contained in all publications are solely those of the individual author(s) and contributor(s) and not of MDPI and/or the editor(s). MDPI and/or the editor(s) disclaim responsibility for any injury to people or property resulting from any ideas, methods, instructions or products referred to in the content. |
© 2025 by the authors. Licensee MDPI, Basel, Switzerland. This article is an open access article distributed under the terms and conditions of the Creative Commons Attribution (CC BY) license (https://creativecommons.org/licenses/by/4.0/).