Article

Study on the Effectiveness of Reinforcing Bar Insertion Work with a Circular Pipe

1
Department of Civil Engineering, Tokai University, 4 Chome-1-1 Kitakaname, Hiratsuka 259-1207, Kanagawa, Japan
2
Graduate School, Tokai University, 4 Chome-1-1 Kitakaname, Hiratsuka 259-1207, Kanagawa, Japan
*
Author to whom correspondence should be addressed.
Geotechnics 2025, 5(3), 55; https://doi.org/10.3390/geotechnics5030055
Submission received: 20 June 2025 / Revised: 30 July 2025 / Accepted: 7 August 2025 / Published: 9 August 2025

Abstract

It is an urgent issue for preventing slope failure caused by increasingly severe earthquakes and heavy rain. As a conventional construction method, reinforcing bar insertion work uses the tensile force of the core bar to integrate multiple core bars and pressure plates. Meanwhile, landslide deterrence piles are a construction method in which steel or concrete piles are constructed below the slope, and the rigidity of the piles is used to resist slope failure. In this study, these methods are combined to propose a reinforcing bar insertion work that uses pipes as a construction method. The pipes are not embedded in the immovable layer and are not connected to the reinforcing bar insertion work; therefore, the construction is expected to be simple. Two series of model experiments—a lift-up experiment and a water sprinkling experiment—were performed. Through the lift-up experiment, the effectiveness of the proposed method against static load was confirmed, and the evaluation formula of the load applied to the core bar was proposed. Through the water sprinkling experiment, the effectiveness against rainfall was confirmed, that is, the time until slope failure was extended by the proposed method.

1. Introduction

Development of simple and inexpensive slope reinforcement methods is an imminent requirement for preventing slope failures caused by increasingly severe earthquakes and heavy rain, commonly encountered in countries such as Japan, and it will help accelerate advances in slope countermeasures to tackle the aforementioned issues [1,2,3,4,5,6,7,8,9,10,11,12,13,14,15,16,17,18,19,20,21,22,23,24,25].
Figure 1 shows two existing construction methods (left and middle) along with a novel method proposed in this paper (right). The first of the existing construction methods, namely the reinforcing bar insertion method, uses the tensile force of the core bar to integrate multiple core bars and pressure plates into the soil, thereby increasing the stability of the slope. The provision of reduced spacing between the core bars (referred to as a “gap” here) is considered to prevent the soil from passing through the gap and increase the effectiveness of the countermeasure. In the second existing construction method, namely the landslide deterrence pile method, steel or concrete piles are constructed below the slope, with the rigidity of the piles being used to resist slope sliding [26,27,28,29]. Here, a larger pile diameter results in higher rigidity and a smaller gap, thereby increasing the effectiveness of the countermeasure. However, the cost in terms of construction and materials would increase as well.
Even though both the aforementioned methods are effective against slope failure and are widely applied, considering their limitations, the author proposes a reinforcing bar insertion method, which uses three pipes, as shown in Figure 1 (right). The pipes increase the apparent diameter of the core bar and reduce the gap, which is expected to prevent soil from passing through the gap. The pipes are simply placed around the core bar, and no grout or other materials are used to fix them in place. Furthermore, they are not embedded in the immovable layer or connected to the reinforcing bar insertion work. Therefore, since the pipes do not require excessive length and the connecting work to other components can be omitted, simplified and economical construction becomes possible, making the method potentially applicable to a wide range of slope structures [30,31].
The existing reinforcing bar insertion method and landslide deterrence piles method have been studied for many years and are highly developed in terms of structure, construction, maintenance, and so on. On the other hand, the proposed construction method is newly devised, and almost no previous research has been conducted on this method. Therefore, as the most fundamental consideration, the focus is placed on evaluating the effectiveness of the structure in terms of slope stability from a structural perspective.
A lift-up experiment was conducted, presented in Section 2. Through the lift-up experiment, the effectiveness of the proposed method against static load was examined for different pipe sizes. A reproduction analysis using the finite element method was conducted for the proposed structure in Section 3. Its applicability was examined by comparing the results with the experimental data. A water sprinkling experiment was conducted, presented in Section 4. Through the water sprinkling experiment, the effectiveness of the proposed method against rainfall was examined, namely the time taken for slope failure to occur was measured. Finally, Section 5 concludes this paper.

2. Lift-Up Experiment

2.1. Experimental Condition

2.1.1. Device and Materials

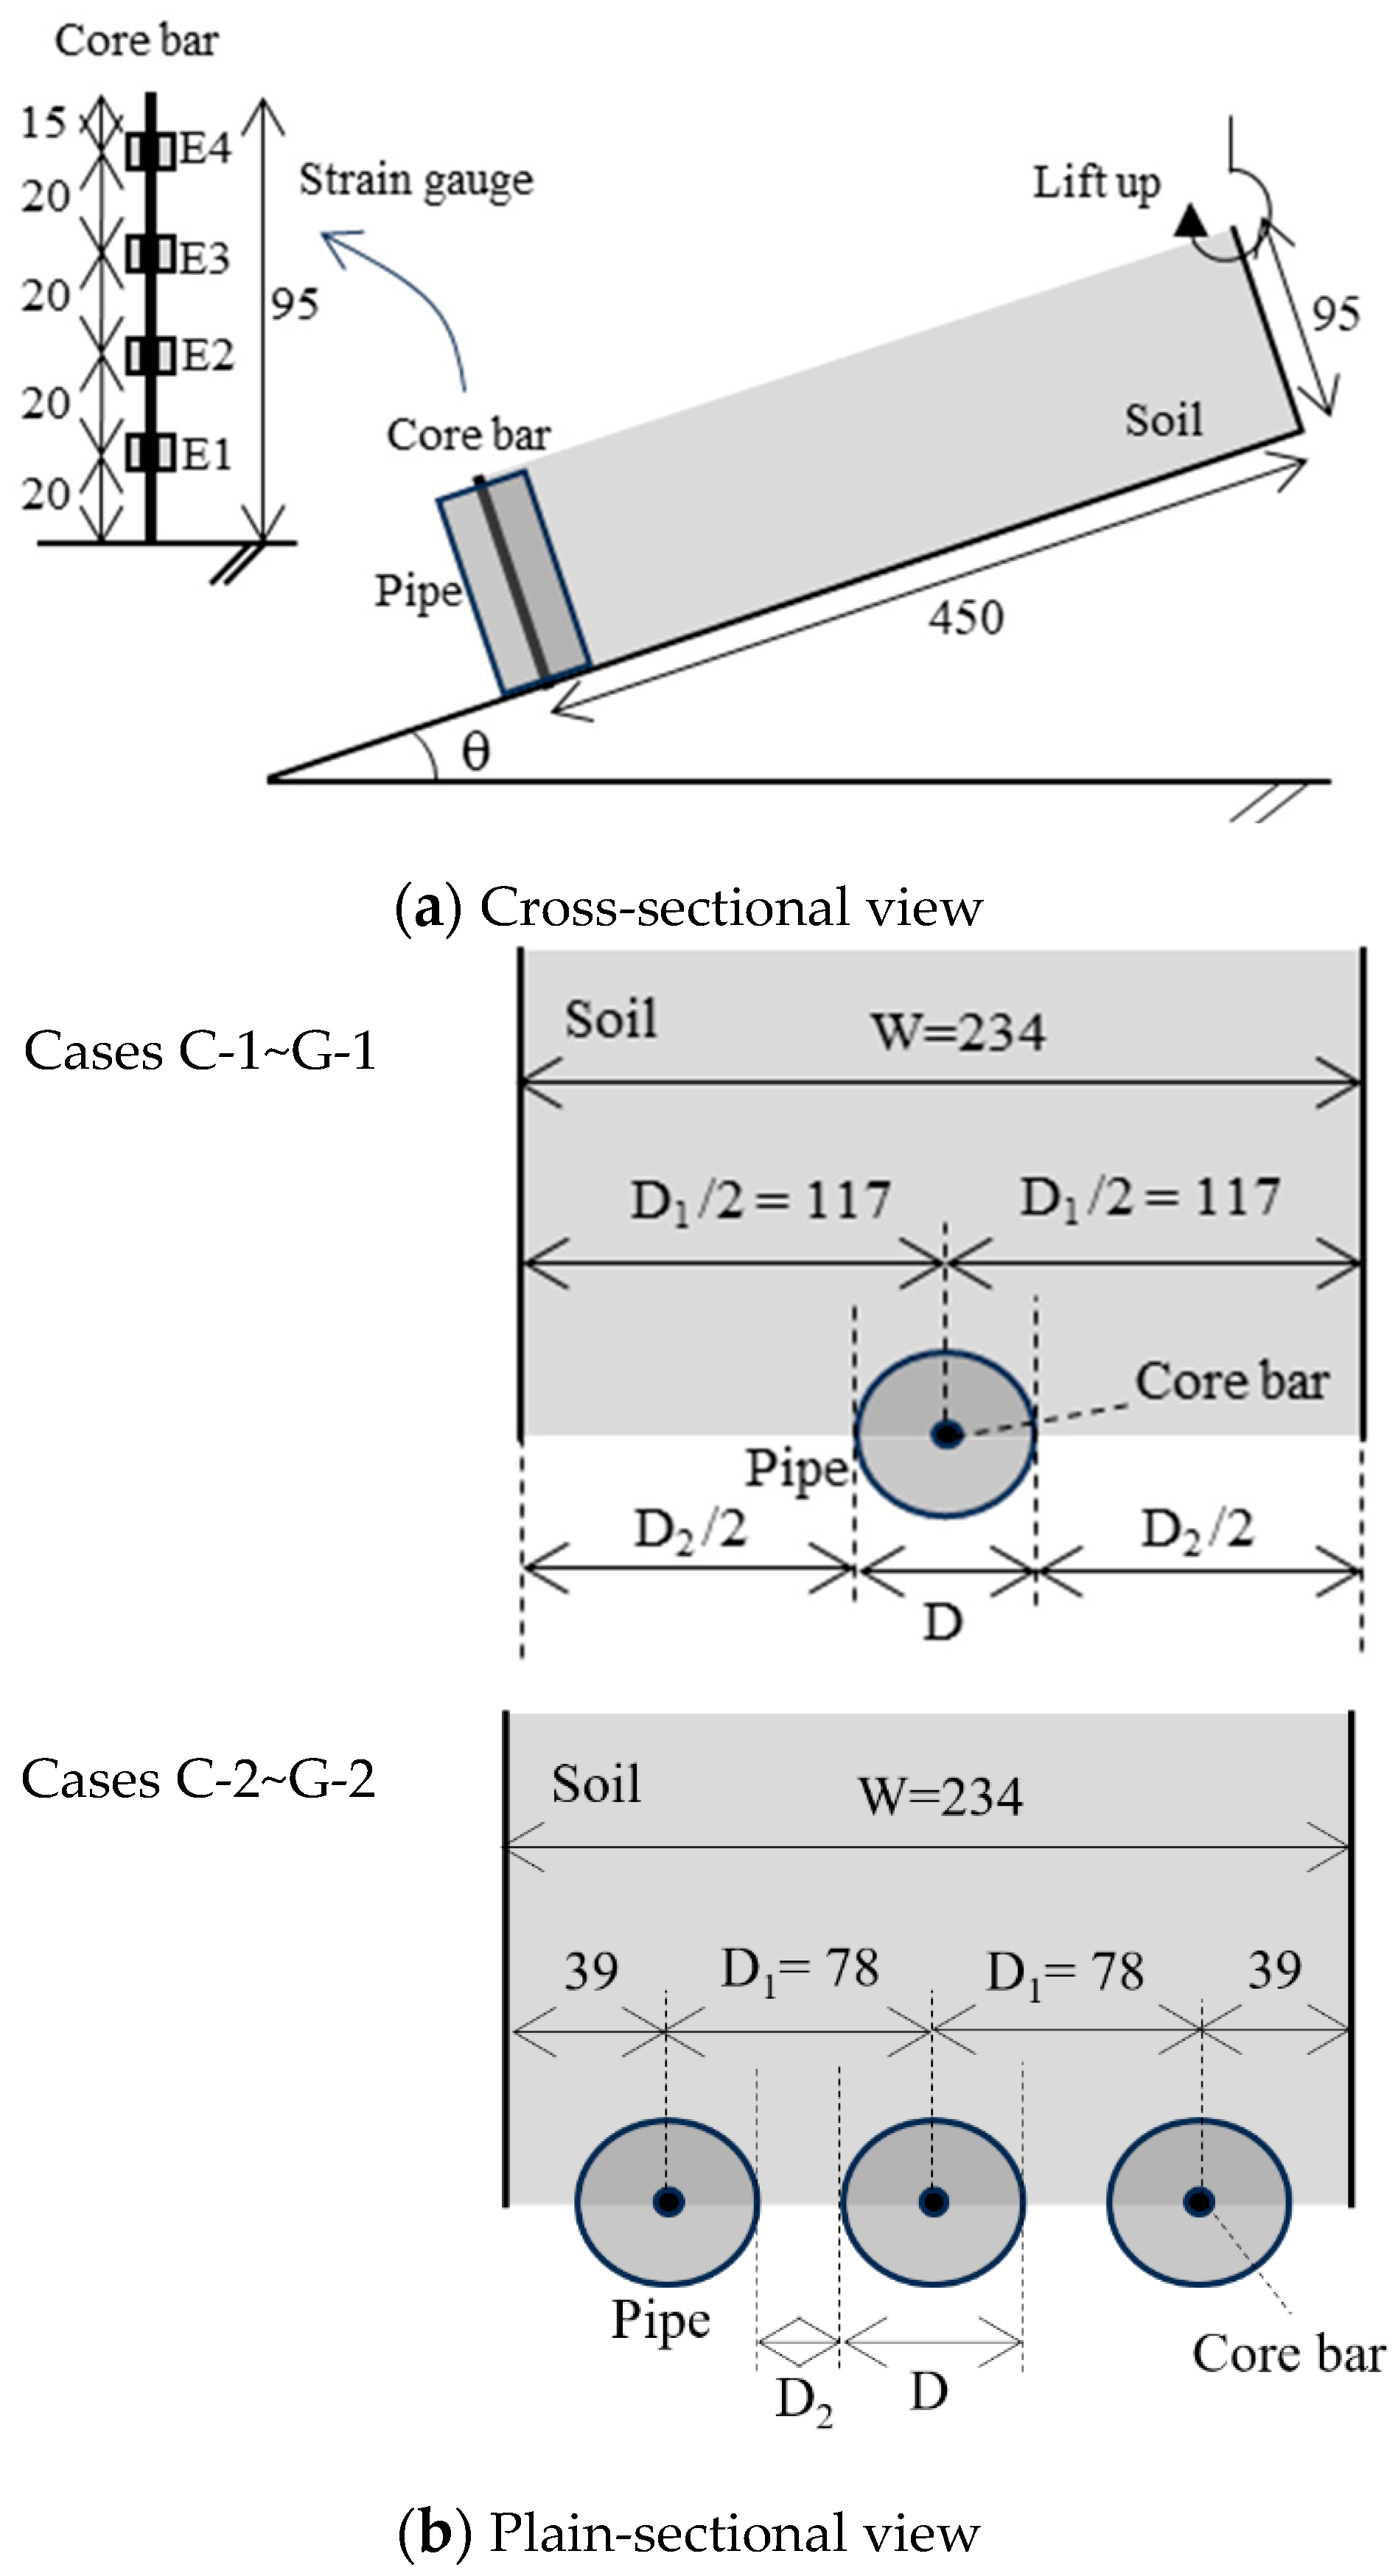
Figure 2a,b present the cross-sectional and plain-sectional views of the model experimental setup, along with relevant dimensions, respectively. The model was built to approximately 1/10 the actual scale, using a stainless-steel box in one gravity field. No.7 silica sand with a soil particle density of 2.63 g/cm3, a uniform coefficient of 2.1, and water content of 15% was used. The friction angle of 33° and cohesion of 15 kN/m2 were gained from a previously conducted direct shear test. The sandbox had a length, thickness (height), and width of 450, 95, and 234 mm, respectively. Stainless-steel bars with a length, thickness, and width of 100, 3, and 5 mm, respectively, were used as core bars. Circular acrylic pipes with a length of 100 mm and different diameters were used for each case.

2.1.2. Procedure

First, the core bars were fixed to the bottom of the box, and acrylic pipes were placed around the core bars as a countermeasure. For ease of construction, the pipes were not fixed to any part. Second, the sand was placed in a box with a unit weight per volume of 10.06 kN/m3. The unit weight per volume was controlled by placing a predetermined volume of moisture-adjusted sand. The sand was left uncompacted in a loose state to minimize the influence of lateral confinement from the side walls. The sand had a vertical wall at the same place as the core bars and the center of the acrylic pipes. The sand downside of the countermeasures, which should be a passive area, was omitted for easy experimental conditions. The inner pipes were filled with sand. Finally, the box was lifted to the point of the occurrence of slope failure. The strain data were measured at the center core bar at 20 mm (E1), 40 mm (E2), 60 mm (E3), and 80 mm (E4) from the bottom by 10° of the slope angle.

2.1.3. Experimental Cases

The experimental cases are listed in Table 1. No countermeasures were implemented in Case A. As shown in Figure 2b, a core bar was set at the center for Case B-1, and three core bars were set in a line for Case B-2. Pipes of different diameters (10–60 mm) were placed around the core bar in Cases C-1 to G-1. Three core bars with pipes of different diameters (10–60 mm) were set along a line for Cases C-2 to G-2. The ratio (D/D1) of the width of the countermeasures D to the center-to-center interval between countermeasures D1 is also listed in Table 1. Here, D1 is 234 mm in Cases B-1 to G-1, considering the symmetry of the sidewall.

2.2. Experimental Results

2.2.1. Slope Failure Angle

In all the cases, the slope was stable at up to 45° of the slope angle, and the soil detached from the upper wall at an angle of more than 45°. In Case A, the slope without the countermeasures led to an immediate failure upon detachment at 46°. From this result, it is expected to collapse at an angle of more than 46° by implementing the countermeasures in this slope.
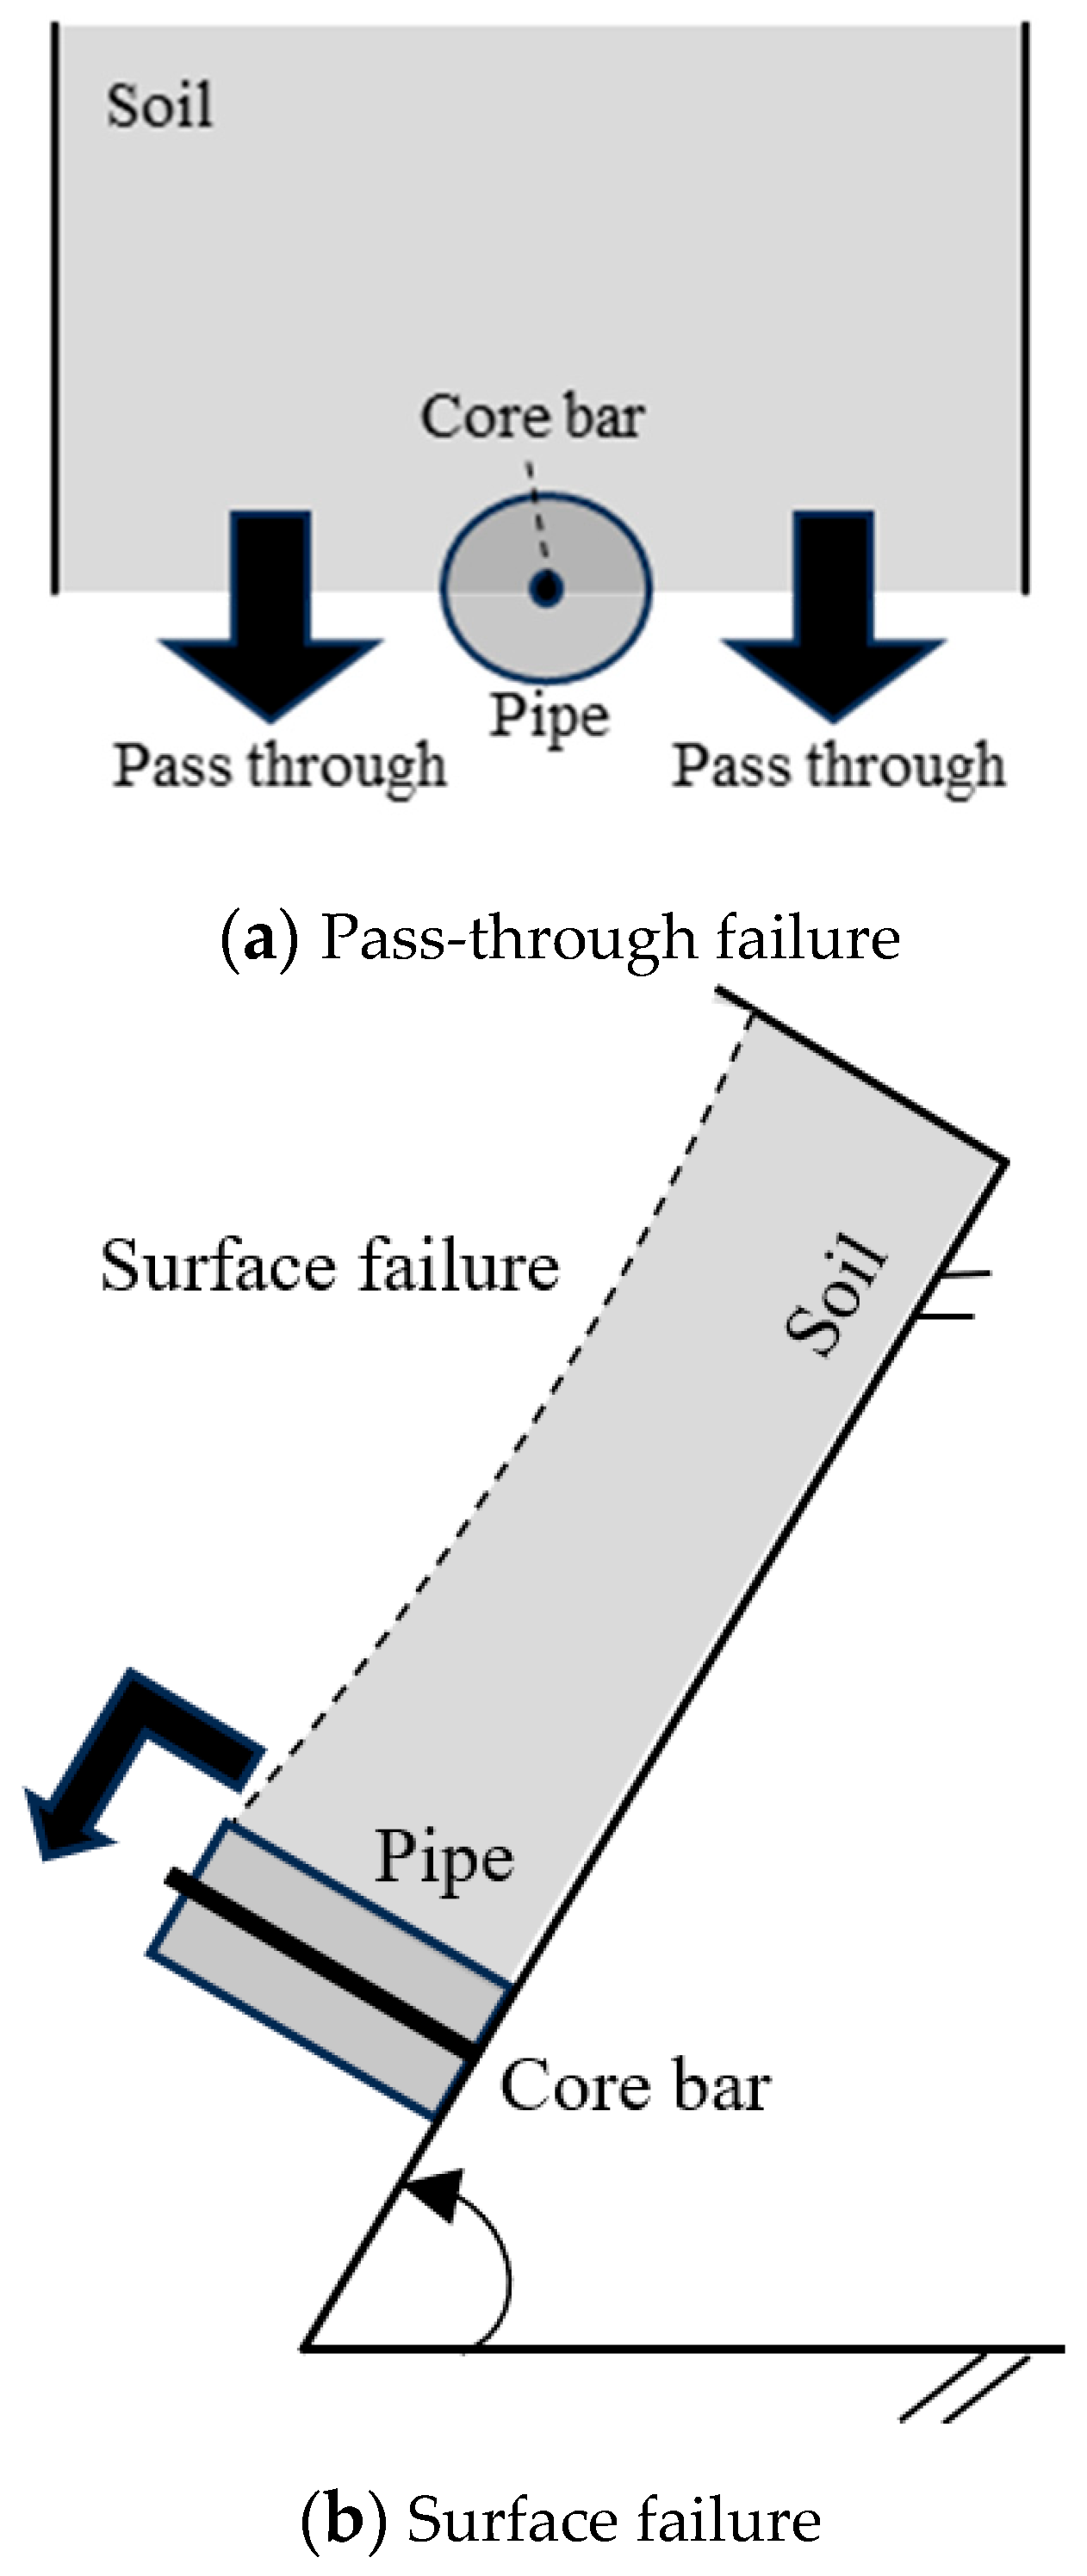
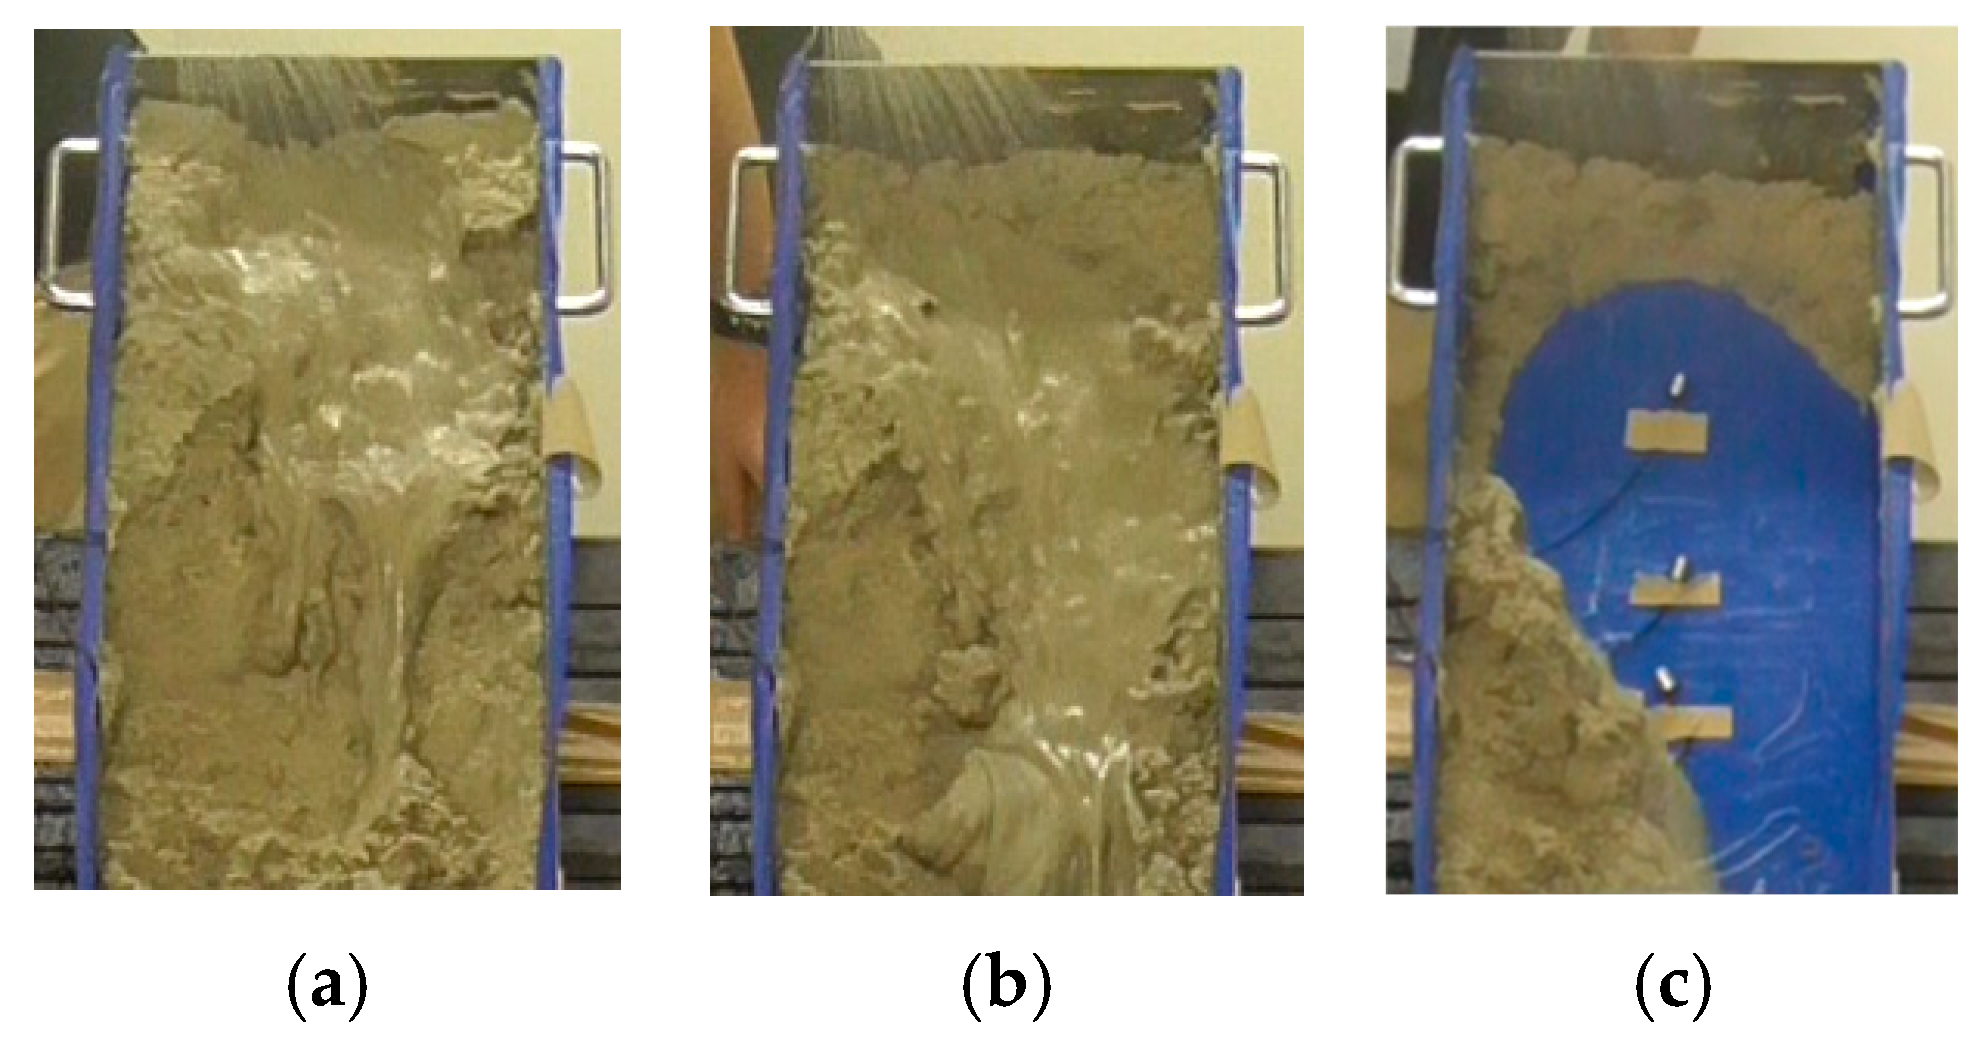
In Case B-1, the slope with a core bar and no pipe remained static for a while after the detachment. As the slope angle increased, the soil between the core bars (referred to as the “gap”) slipped partially. Finally, the slope slipped and passed between the core bar and sidewall at 53°. For Case C-1, the slope with a core bar and a pipe, a similar behavior was observed as in Case B-1. The slope slipped, and the soil passed through the gap at 60°, diagramed in Figure 3a. The acrylic pipe, even without being connected to any parts, was effective against slope failure. In Case D-1, the slope slipped, and the sand passed through the gap at 65°. The larger the pipe size, the more effectively sand was prevented from passing through the gap. Simultaneously, the surface soil failed and fell because the angle was considerably high, as is diagramed in Figure 3b. Two failure modes were observed simultaneously. For Cases E-1, F-1, and G-1, the surface soil failed and fell instead of passing through at angles of 65°, 66°, and 68°, respectively. As the pipe size increased, there was little gap for soil to pass through.
In Case B-2, the slope with three core bars and no pipe, the slope slipped and passed between the core bars at 64°. The greater the number of countermeasures, the more effectively the soil was prevented from passing through the gap, compared with Case B-1. In Cases C-2 to G-2, the slope with three core bars and pipes, the surface soil failed and fell because the gap was too small for the soil to pass through.
Based on the above results, the relationship between the ratio (D/D1) and the failure angle is shown in Figure 4. The solid and dotted lines indicate one countermeasure (Cases B-1 to G-1) and three countermeasures (Cases B-2 to G-2), respectively. The black plotlines indicate that the slope slipped between the countermeasures, while the white plotlines indicate that the surface sand failed and fell through. The gray plots indicate that the two failure modes occurred simultaneously. From Figure 4, the more the ratio (D/D1) became, the more the angle became. This indicates that, the larger the pipe size and the greater the number of countermeasures became, the more effectively the countermeasures prevent the slope from failure. The soil passed between the gaps at a D/D1 value of less than 0.085.

2.2.2. Bending Strain of the Core Bar

The bending strain of the core bar at E1 for Cases B-1 to G-1 and Cases B-2 to G-2 by the slope angle of 10°, as shown in Figure 5a,b, respectively. The experiment was conducted multiple times, and the error in bending strain remained within approximately 10%. The bending strain gradually increased up to an angle of 40°; however, the increase was considerably small. This is because, as the slope was static and had no failure, it did not apply its load to the countermeasures significantly. The bending strain increased from 40° to 50° in each case. This is because, as the slope slipped at 46° without countermeasures for Case A, the load was applied to the core bar owing to a slope of more than 46°. The bending strain increased up to the maximum angle in each case. The larger the pipe size, the greater the number of countermeasures, and the greater the maximum bending strain. This is because, as the soil slipped and fell through, more soil was retained behind the countermeasures. A large pipe is effective against slope failure; however, the burden on the core bar would also be large. The bending strain began to decrease after the maximum strain in each case except Case G-2. Although the soil failed and lost at a high angle in almost all cases, almost all of the soil remained behind the countermeasure for Case G-2. When comparing Figure 5a,b, the bending strain in three-countermeasure cases was smaller than that in the one-countermeasure cases at the same angle. This is because the lateral load was distributed into three bars.

3. Numerical Analysis

3.1. Analytical Condition

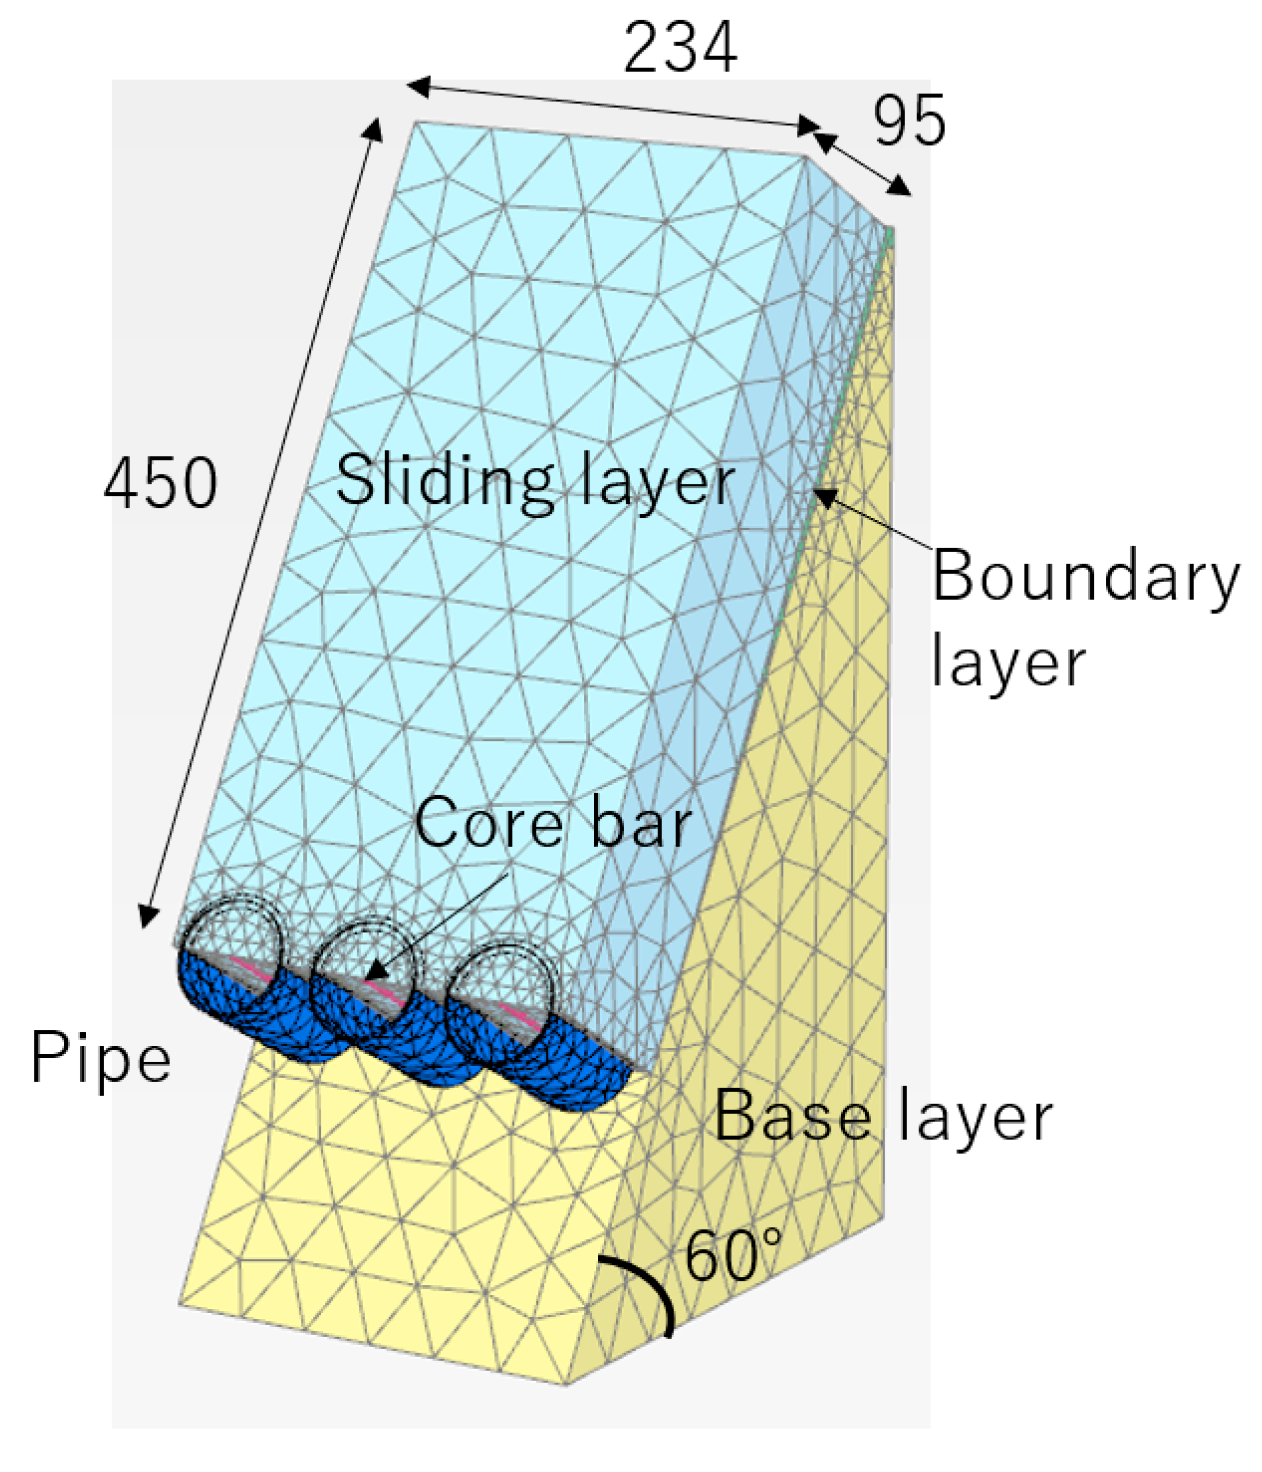
The reproduced analysis targeting the model experiments in the previous chapter utilized the finite element method “PLAXIS3D”. A model diagram of Case G-2, shown in Figure 6, is presented as a representative example of the analysis model, is a three-dimensional model tailored to the dimensions of the model experiments. The input parameters for the analysis (soil, reinforcement bars, and pipes) are listed in Table 2. These parameters were adjusted to match the conditions of the model experiments described in the previous chapter. The Young’s modulus, friction angle, and cohesion of the soil were determined from the results of preliminary direct shear tests. The model represents a structure in which soil placed on a slope inclined at 60 degrees is supported by vertically embedded reinforcement bars, which are surrounded by pipes. The subsurface in the model consists of three layers: a base layer, a sliding layer, and a boundary layer. The base layer is assigned extremely high stiffness and can be regarded as a rigid body. The sliding layer is 95 mm thick, the same as in the experiment. The boundary layer is thin and modeled with low stiffness to simulate slippage. The reinforcement bars are embedded into the base layer, providing conditions close to a fixed end. The pipes are simply placed around the reinforcement bars without a structural connection. The soil is modeled as a linear elastic material, and the Mohr–Coulomb failure criterion is applied. The structural components (reinforcement bars and pipes) are also modeled as linear elastic materials, and material yielding is not taken into account. Interface elements are defined between the pipes and the soil to simulate slippage and detachment.

3.2. Analytical Result

In Cases E-1, E-2, F-1, F-2, G-1 and G-2, the numerical analysis successfully converged. These cases had relatively large pipe diameters, and the slopes remained stable at a 60° inclination in the model experiments. Therefore, it is considered that the finite element analysis converged due to the inherent stability of the slope under these conditions. The depth distribution of bending the strain of the center core bar in analytical and experimental results is shown in Figure 7. In all of these cases, the reinforcement bars exhibited downward bending behavior at their top ends, almost quantitatively reproducing the experimental results. Since the elastic-perfectly plastic model itself is a simplified representation of soil behavior, it is expected that the analytical accuracy can be improved by adopting a more advanced constitutive model.
On the other hand, in the remaining cases (Cases A, B-1, B-2, C-1, C-2, D-1, and D-2), the analysis did not converge. These cases had smaller pipe diameters, and in the model experiments, the slopes tended to collapse or partially fail at a 60° inclination. Such large deformations associated with slope failure, even if only partial, could not be captured by the finite element analysis under the present conditions.
Although convergence poses a challenge when applying the finite element method to this type of structure, it has been confirmed that the method can yield accurate results when convergence is achieved.

4. Water Sprinkling Experiment

4.1. Experimental Condition

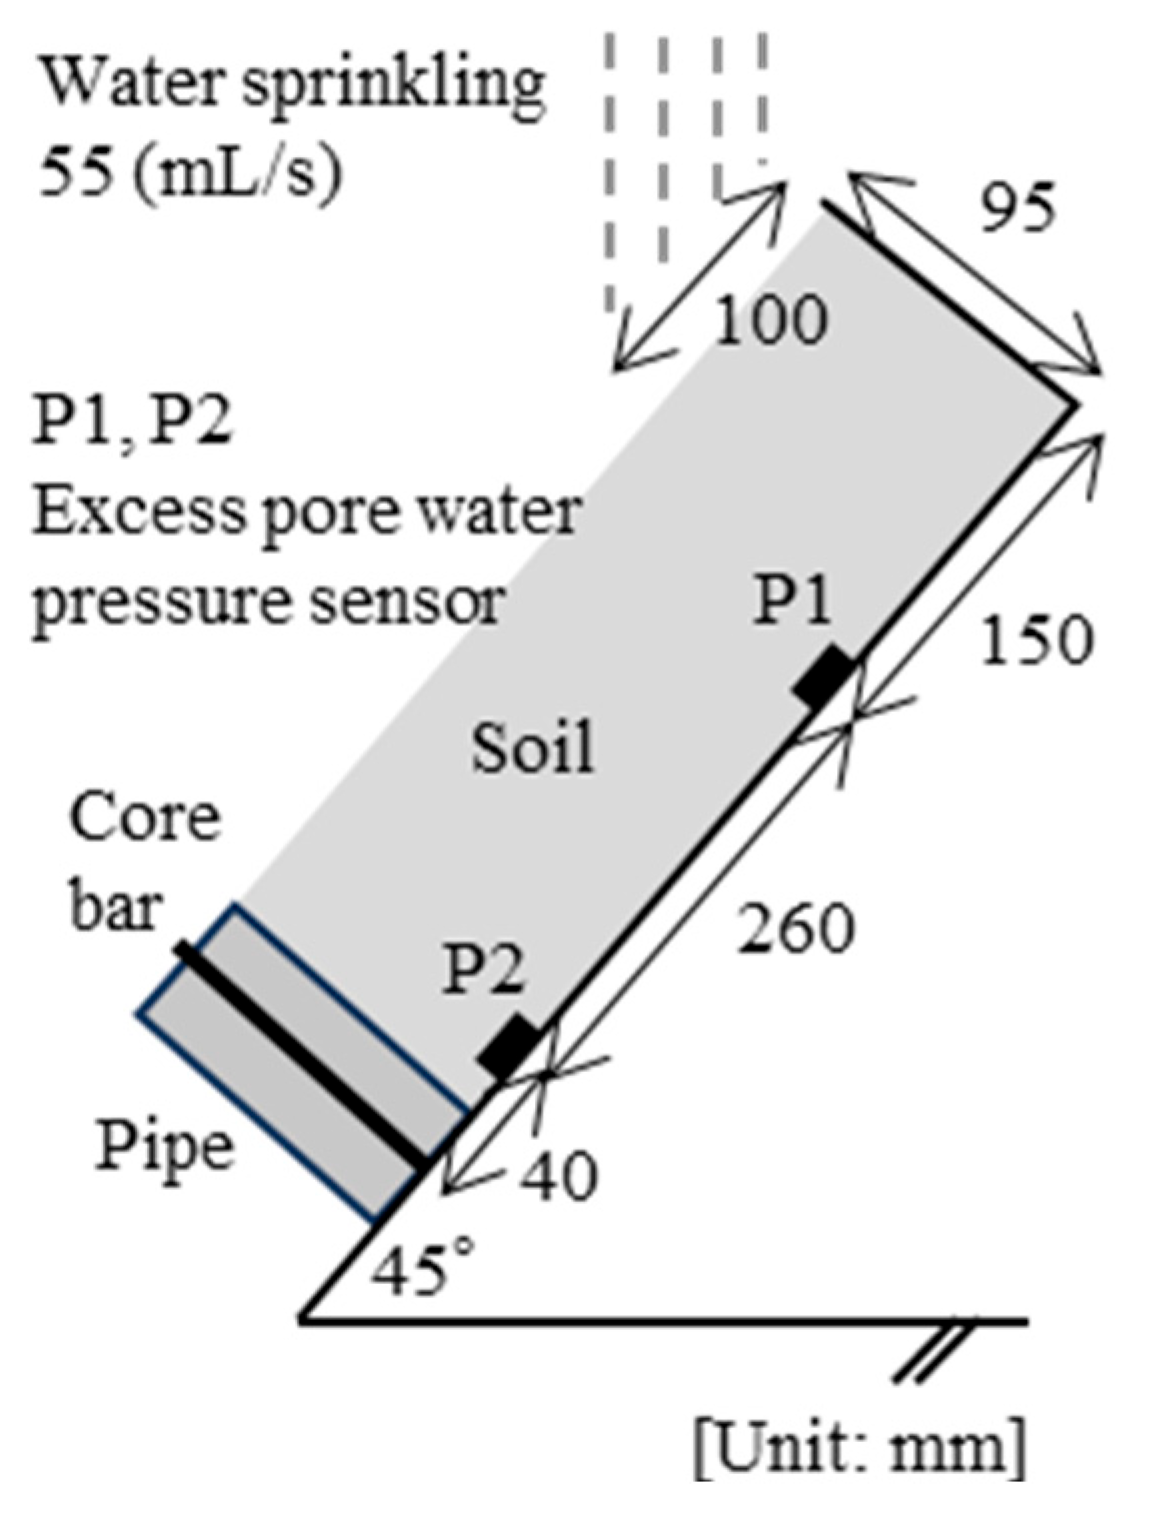
A series of water sprinkling experiments were performed to confirm the effectiveness of the countermeasures against rainfall. In this experiment, a stainless-steel box was fixed at an angle of 45°, as shown in Figure 8. Based on lift-up experiments, this angle was determined to be the maximum angle at which slope failure did not occur without countermeasures or rainfall conditions in the previous chapter. Water was sprinkled at a rate of 55 mL/s on a 100 mm area at the top. The applied water sprinkling rate was not set to replicate actual rainfall conditions. Therefore, the results obtained from this experiment are limited to qualitative confirmation of the observed phenomena.
The measurement parameters were time until failure, water volume, pore water pressure, and strain of the core bar. The positions of the excess pore water pressure sensors (P1 and P2) are shown in Figure 8, and strain sensors (E1, E2, E3, and E4) are shown in Figure 2a. The water pressure sensors were put in the center of the width of the box. Three representative cases are discussed in the following section.
  • Case A: no countermeasures.
  • Case D-1: single pipe with small diameter.
  • Case F-2: three pipes with large diameters.

4.2. Results for Representative Cases

4.2.1. No Countermeasure (Case A)

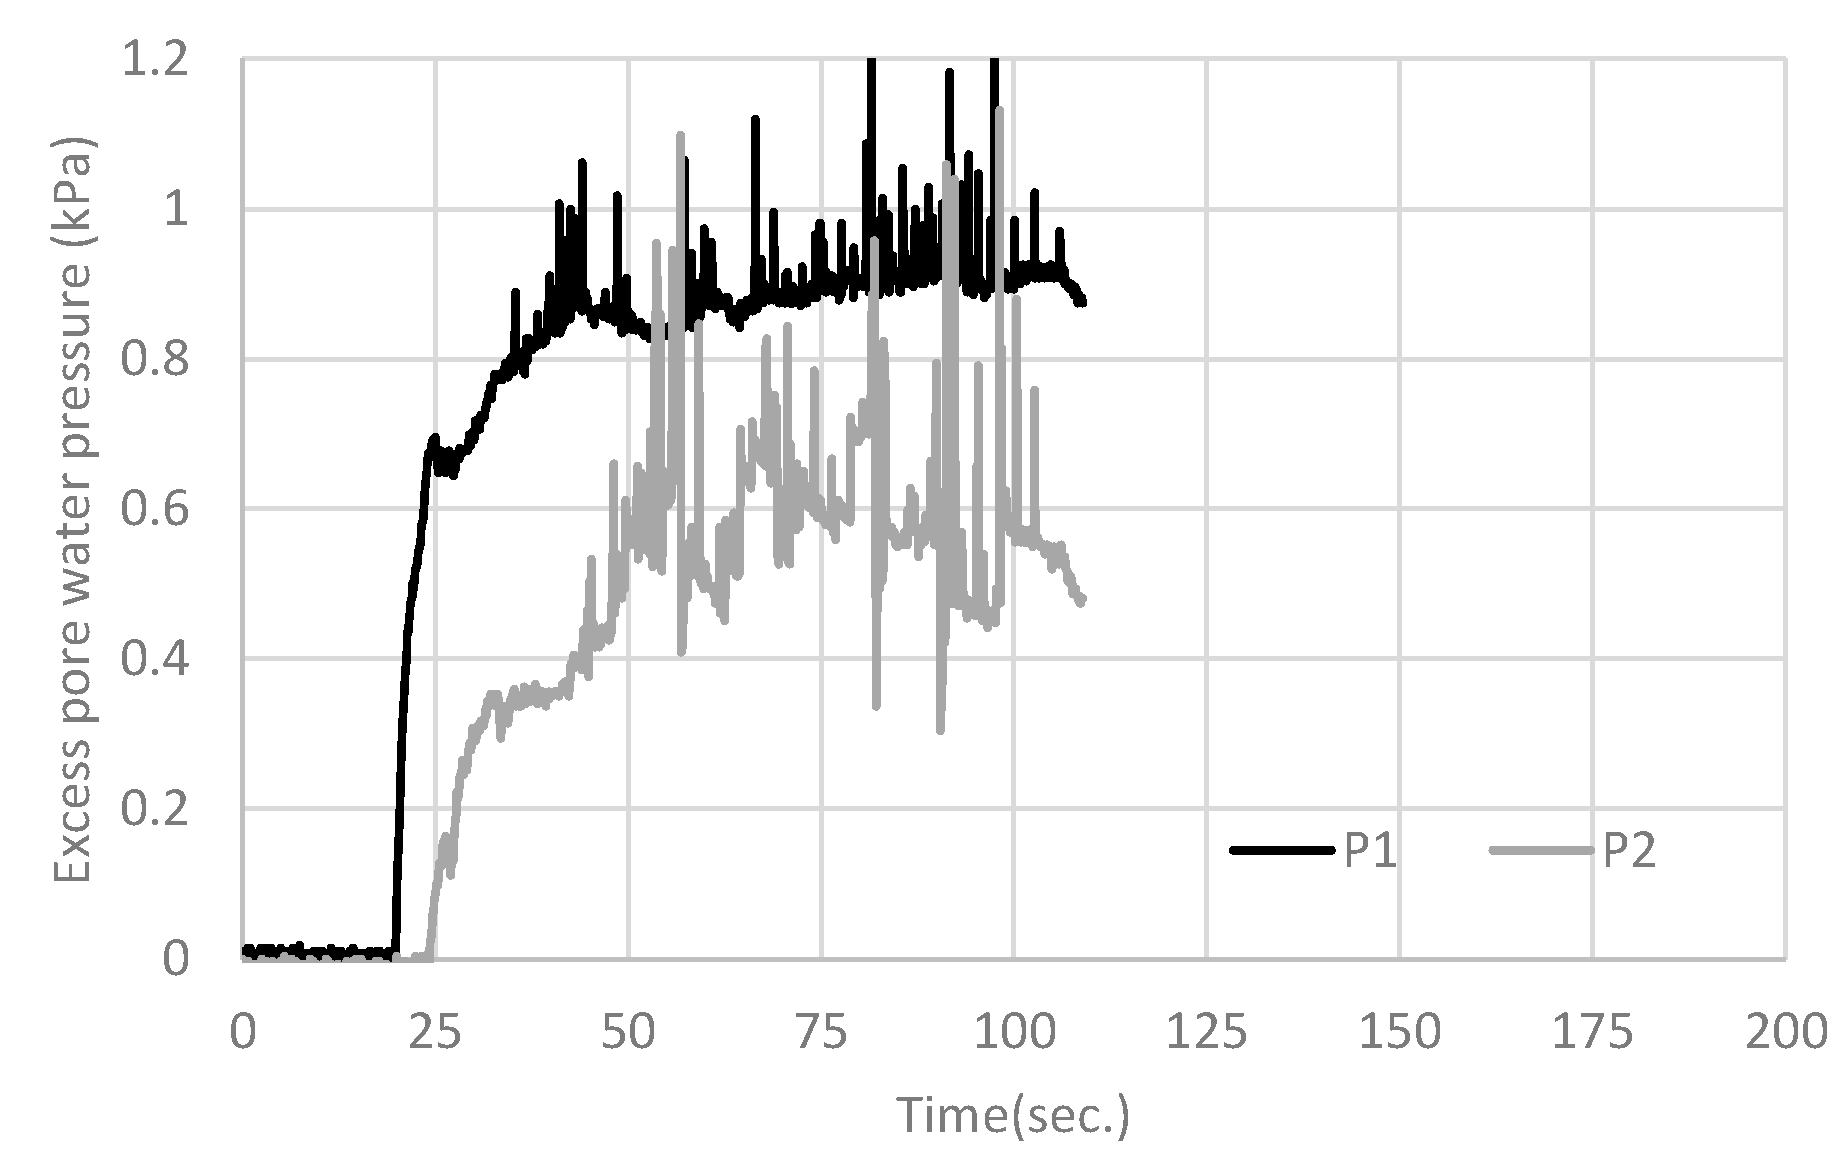
Figure 9 shows images of the time process of slope failure for Case A without countermeasures. From the beginning of the experiment, water flowed and eroded the soil surface, and the slope gradually lost its volume, as shown in Figure 9a. Figure 10 shows the time histories of the excess pore water pressures at P1 and P2, which increased drastically at 20 and 24 s, respectively. This result indicates that water reached the bottom and penetrated from P1 to P2. During penetration, the soil absorbed water and increased its weight. Simultaneously, the friction between the soil and the bottom of the box was reduced by water.
Therefore, the slope slipped as a clump at 50 s, as shown in Figure 9c. Through this experiment, “erosion” and “clump slip” were observed as the two main reasons for slope failure.

4.2.2. Single Pipe with Small Diameter (Case D-1)

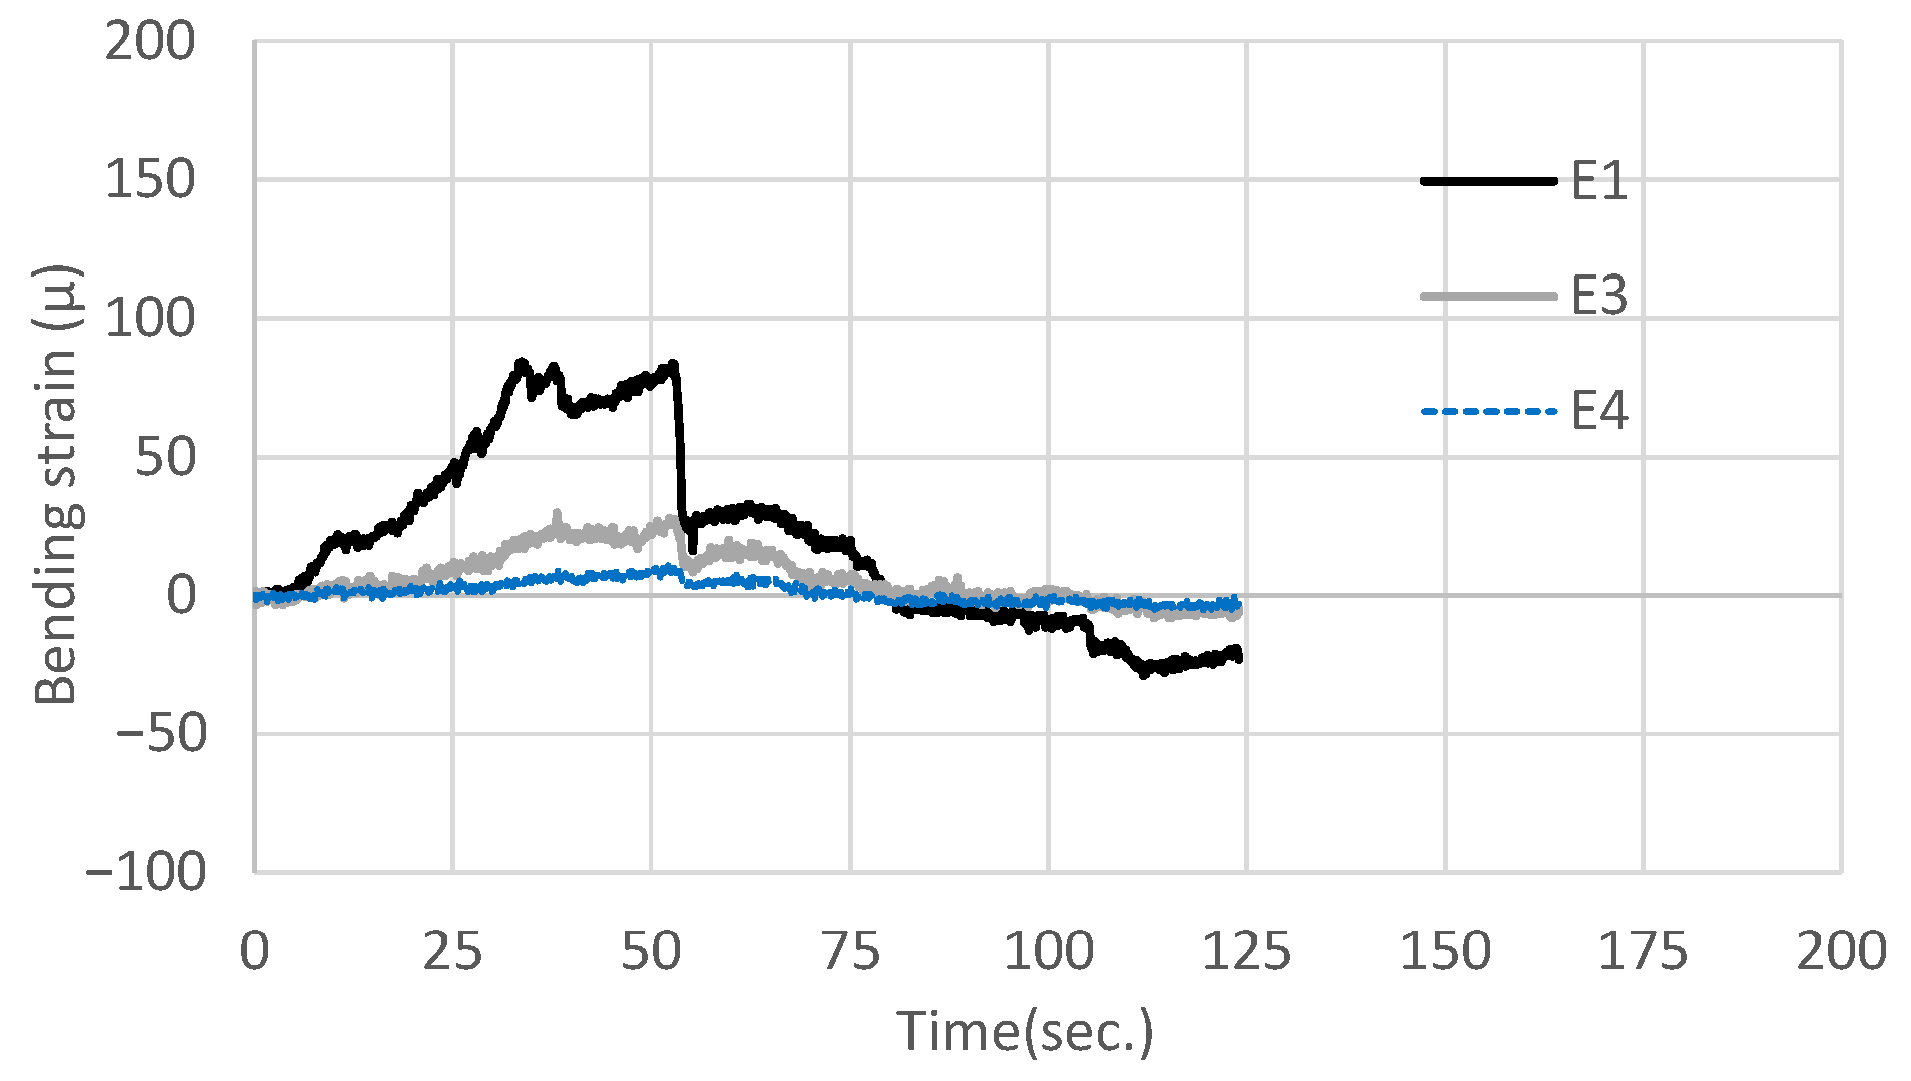
The results of Case D-1, which had a single pipe with a small diameter, are explained in this section. Figure 11 shows images of the slope failure time process. Similar to Case A, from the beginning of the experiment, water flowed and eroded the soil surface, as shown in Figure 11a. Figure 12 shows the time histories of the excess pore water pressure at P1 and P2, which indicates that water penetrated the bottom of the box from P1 to P2, similar to Case A. Figure 13 shows the time histories of the bending strain at E1, E3, and E4 (lack of data at E2). The bending strain increased with excess pore water pressure. These results indicate that the soil weight increased owing to water absorption and increased soil load applied to the core bar. Conversely, the bending strain decreased drastically from 52 s. This is because the soil clump slipped through the gap, as shown in Figure 11b. That is, there were sufficiently wide gaps for the soil clump to pass through because the diameter of the pipe was small. Subsequently, the bending strain decreased gradually because the soil was eroded and its weight was reduced. Finally, most of the slopes failed at 115 s, as shown in Figure 11c. As the time of slope failure was longer than that for Case A, the effectiveness of the countermeasure, even with small-diameter pipes, could be found. People can gain more time to evacuate by extending this time until failure.

4.2.3. Three Pipes with Large Diameter (Case F-2)

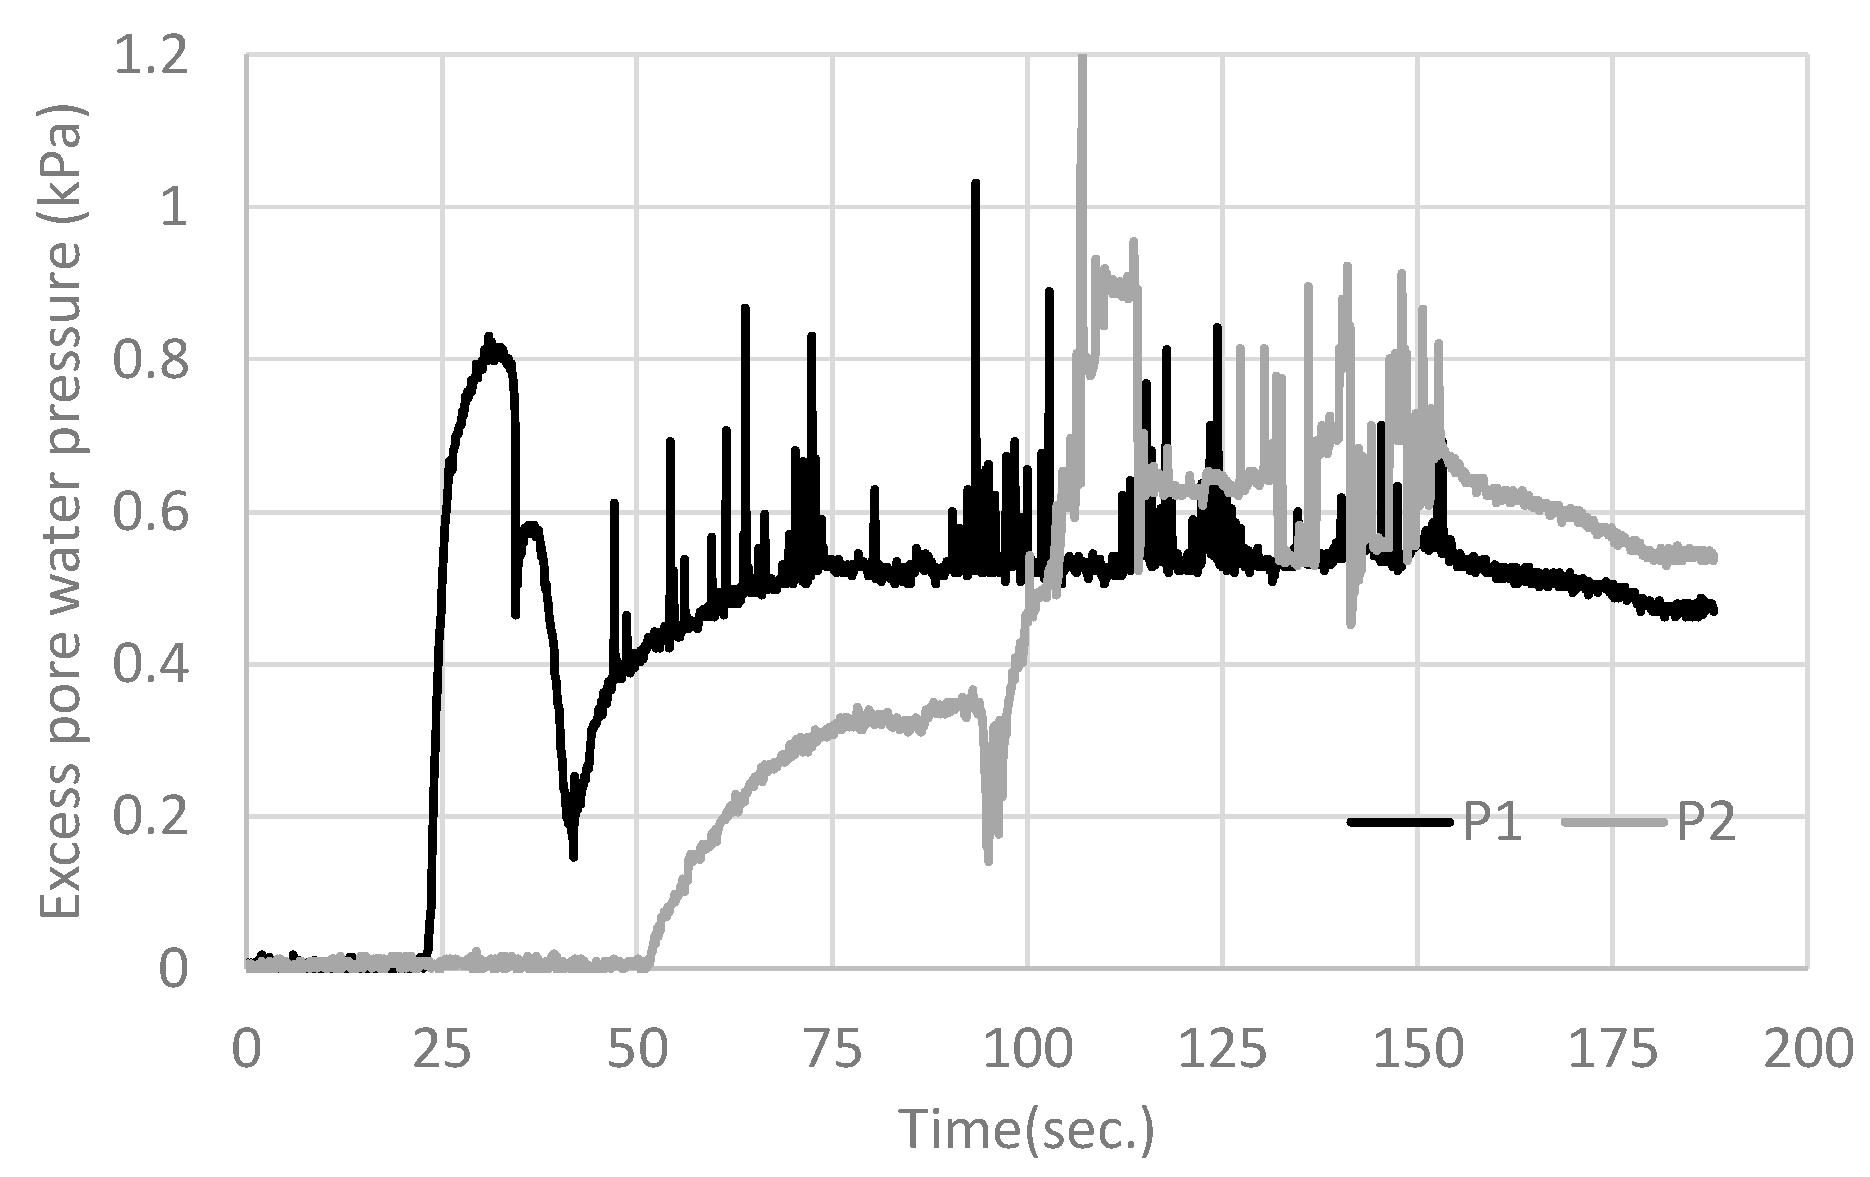
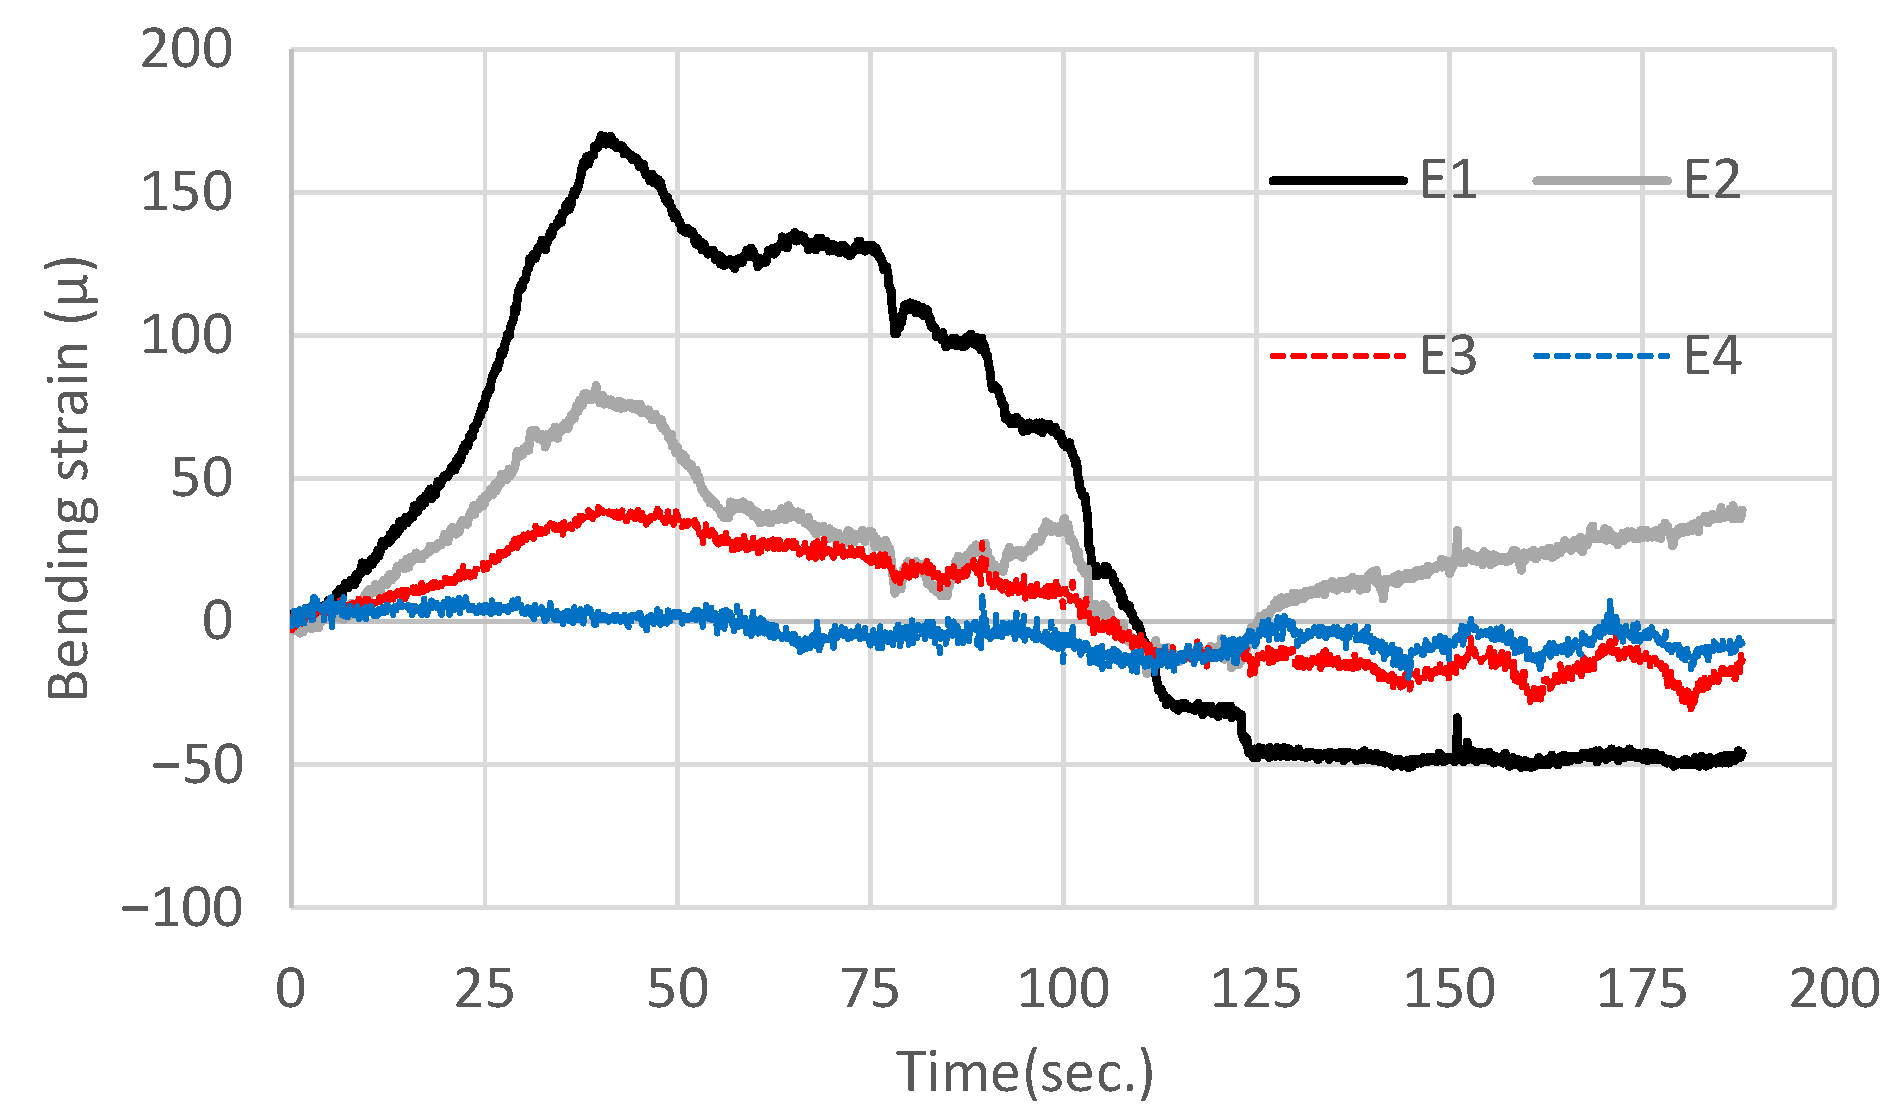
The results of Case F-2, which had three pipes with large diameters, are explained in this section. Figure 14 shows images of the slope failure time process. Similar to Case A, from the beginning of the experiment, water flowed and eroded the slope surface, as shown in Figure 14a. Figure 15 shows the time histories of the excess pore water pressure at P1 and P2, which indicates that water penetrated the bottom of the box from P1 to P2, similar to Case A. Figure 16 shows the time histories of the bending strains at E1, E2, E3, and E4. The bending strain increased up to 40 s because the load applied to the core bar increased. Conversely, the bending strain gradually decreased after 40 s. This was because the soil eroded and flowed out through the gaps, as shown in Figure 14b. The gaps were so small that the soil clump could not pass through, and the passing speed of the eroded soil was very high between the gaps. Finally, most of the slopes failed at 150 s, as shown in Figure 14c. The time until slope failure was the second longest among all the cases, indicating that the greater the number and diameter of pipes, the more effective the countermeasure.
However, when the high-speed flow of eroded soil can be seen between the gaps, people should be careful near the countermeasure.

4.3. Summarized Results

The failure time and water volume for all the cases are summarized in Figure 17. The horizontal axis represents the ratio D/D1, and the vertical axis represents the time and water volume until failure, depicted on a dual axis. Regarding the failure time, since the collapse progresses over several seconds, the margin of error was also indicated in Figure 17. As the pipe diameter and number increased, the time and water volume until failure increased.
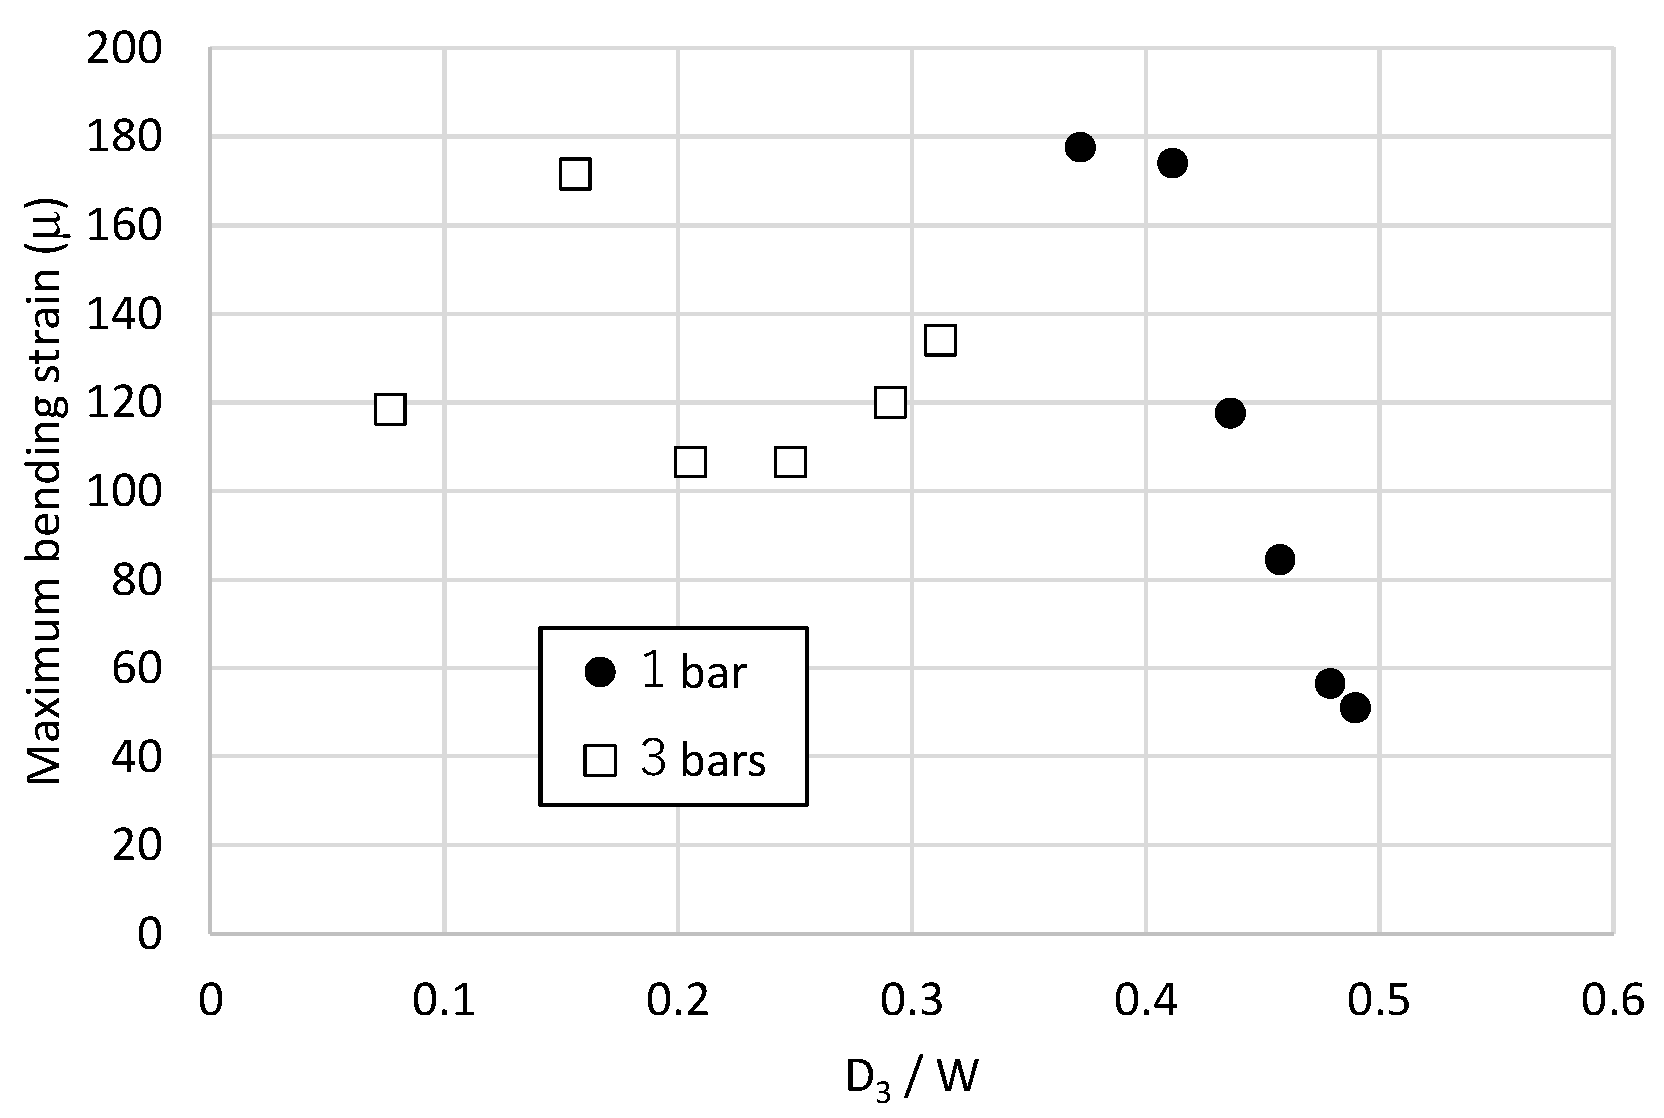
The maximum bending strains at E1 for all the cases (except for Case A) are summarized in Figure 18. Because E1 was closest to the bottom, the maximum bending strain could be measured. The horizontal axis represents the ratio D3/W, and the vertical axis represents the maximum bending strain at E1. The experiment was conducted multiple times, and the error in bending strain remained within approximately 10%.
In the case of a single countermeasure, the smaller the ratio D3/W, the greater the maximum strain. This is explained as follows. As it took time for the slope to fail for large-diameter pipe cases, a large soil clump was formed on the countermeasure. Additionally, the soil clump absorbed water and increased its weight.
In the case of three countermeasures, similar strains were measured (except for the Case F-2). This is explained as follows. The smaller the ratio D3/W becomes, the greater the maximum strain is expected to be. On the other hand, as the gap width was too small, the flow speed between the gaps was very high. Therefore, as the soil eroded and flowed out between the gaps, a soil clump did not form on the countermeasures. These parameters are set for the strain in the core bar.

5. Conclusions

We proposed reinforcing bar insertion work with a circular pipe as an anti-slope failure countermeasure. Two series of model experiments—a lift-up experiment and a water sprinkling experiment—were performed to confirm the effectiveness of the countermeasures against static load and rainfall, respectively. Several pipes of different diameters and numbers were used in the experiments. The following results were obtained:
(1)
In the lift-up experiment, the failure angle in the case of reinforcing bar insertion with a circular pipe was higher than that in the case of reinforcing bar insertion without a circular pipe. Additionally, the larger the pipe diameter and number of pipes, the more stable the slope at higher slope angles.
(2)
The larger the pipe diameter, the greater the load applied to the pipe and core bar. This is because a large-diameter pipe can support a wide range of soil on the pipe. The greater the number of pipes, the lower the load applied to the pipes and core bars. This is because the load is distributed to multiple pipes.
(3)
When the pipe diameter was small, the soil passed through the gaps. When the pipe diameter was large, surface failure was observed. When the pipe diameter was middle, both failure modes were observed.
(4)
Assuming that all the lateral loads acting on the pipes are transmitted to the core material, the existing load estimation formula yields results close to the lateral load calculated from the experimental results. This indicates that the maximum load applied to the core bar immediately before the soil pass-through could be estimated.
(5)
In the water sprinkling experiment, the larger the pipe diameter and the greater the number of pipes, the longer time it took for the slope to fail. This suggests that using more pipes with larger diameters could contribute to extending the time before a disaster occurs.
(6)
In the case of a single countermeasure, the smaller the maximum gap size, the more soil clump was formed on the countermeasure, and as a result, the greater the maximum strain of the core bar. In the case of the three countermeasures, because the gap was small, the soil eroded and flowed out gradually before forming a soil clump. There was a similar strain in the core bar regardless of the diameter of the pipes.
(7)
In this experiment, due to the use of a small-scale box under a gravitational field, the confining pressure acting on the sand differs from that of a full-scale slope. The ground material used was also a uniform type of sand, which does not represent the complexity of actual slopes. To address these discrepancies, full-scale experiments on real slopes will be conducted in future studies.

Author Contributions

Conceptualization, K.F.; methodology, K.F.; software, L.W.; validation, K.F.; formal analysis, K.F.; investigation, K.F.; resources, K.F.; data curation, L.W.; writing—original draft preparation, K.F.; writing—review and editing, K.F.; visualization, K.F.; supervision, K.F.; project administration, K.F.; funding acquisition, K.F. All authors have read and agreed to the published version of the manuscript.

Funding

This work was supported by Nippon Steel Metal Products Co., Ltd. and Nittoc Construction Co., Ltd., to whom we express our deep gratitude.

Acknowledgments

We would also like to extend our sincere thanks to Yoshiharu Takeuchi, a staff member at Tokai University, as well as students from the laboratory, for their significant assistance in conducting the experiments.

Conflicts of Interest

The authors declare no conflict of interest.

Abbreviations

Wwidth of the box
Dwidth of the countermeasures
D1center-to-center interval between countermeasures
D2gap between countermeasures
D3maximum gap between two countermeasures or between a countermeasure and sidewall
ccohesion
ϕangle of internal friction

References

  1. Sassa, K.; Fukuoka, H.; Scarascia-Mugnozza, G.; Evans, S. Earthquake-induced-landslides: Distribution, motion and mechanisms. J. Soil Found. 1996, 36, 53–64. [Google Scholar] [CrossRef]
  2. Uzuoka, R.; Sento, N.; Kazama, M.; Ueno, T. Landslides during the earthquakes on May 26 and July 26, 2003 in Miyagi, Japan. J. Soil Found. 2005, 45, 149–163. [Google Scholar] [CrossRef]
  3. Yamamoto, K.; Nagakawa, K.; Hira, M. Investigation of shallow landslide scars on Shirasu natural slopes from the viewpoint of forest ecology and geotechnical engineering. Jpn. Geotech. Soc. Spec. Publ. 2016, 2, 1035–1039. [Google Scholar] [CrossRef][Green Version]
  4. Alvioli, M.; Guzzetti, F.; Rossi, M. Scaling properties of rainfall-induced landslides predicted by a physically based model. Nat. Hazards Earth Syst. Sci. 2014, 14, 2903–2916. [Google Scholar] [CrossRef]
  5. Martelloni, G.; Bagnoli, F. Infiltration effects on a two-dimensional molecular dynamics model of landslides. Nat. Hazards Earth Syst. Sci. 2012, 12, 3755–3764. [Google Scholar] [CrossRef][Green Version]
  6. Rundeddu, E.; Lizárraga, J.J.; Buscarnera, G. Hybrid stochastic–mechanical modeling of precipitation thresholds for shallow landslide initiation. Landslides 2021, 18, 843–858. [Google Scholar] [CrossRef]
  7. Van Asch, T.W.J.; Malet, J.P.; Van Beek, L.P.H.; Amitrano, D. Techniques, advances, problems and issues in numerical modelling of landslide hazard. Bull. Société Géologique Fr. 2007, 178, 65–88. [Google Scholar] [CrossRef]
  8. Do, V.V.; The, V.T.; Tran, V.T.; Nguyen, V.D. Rainfall-Induced Soil Slope Failure: Stability Analysis and Probabilistic Assessment, Case Study in Sapa, Vietnam; CRC Press: Boca Raton, FL, USA, 2023. [Google Scholar]
  9. Guzzetti, F.; Peruccacci, S.; Rossi, M.; Stark, C.P. The rainfall intensity–duration control of shallow landslides and debris flows: An update. Landslides 2008, 5, 3–17. [Google Scholar] [CrossRef]
  10. Sato, T.; Okada, Y.; Uchida, T.; Wang, G. Sliding layer estimation of shallow landslides on volcanic slopes using electrical resistivity surveys. Geoenvironmental Disasters 2020, 7, 5. [Google Scholar]
  11. Tsai, Y.H.; Chiang, S.H. Modeling rainfall-induced shallow landslides for emergency response using a physically based method. Nat. Hazards 2018, 91, 745–766. [Google Scholar]
  12. Baum, R.L.; Savage, W.Z.; Godt, J.W. TRIGRS—A Fortran Program for Transient Rainfall Infiltration and Grid-Based Regional Slope-Stability Analysis (Open-File Report 02-424); US Geological Survey: Reston, VA, USA, 2002. [Google Scholar]
  13. Iverson, R.M. Landslide triggering by rain infiltration. Water Resour. Res. 2000, 36, 1897–1910. [Google Scholar] [CrossRef]
  14. Godt, J.W.; Baum, R.L.; Lu, N. Landsliding in partially saturated materials. Geophys. Res. Lett. 2009, 36, L02403. [Google Scholar] [CrossRef]
  15. Sidle, R.C.; Ochiai, H. Landslides: Processes, Prediction, and Land Use. In Water Resources Monograph Series; American Geophysical Union: Washington, DC, USA, 2006; Volume 18. [Google Scholar]
  16. Rosso, R.; Rulli, M.C.; Vannucchi, G. A physically based model for the hydrologic control on shallow landsliding. Water Resour. Res. 2006, 42, W06410. [Google Scholar] [CrossRef]
  17. Papa, M.N.; Medina, V.; Bateman, A. Shallow landslide hazard assessment using a physically based model in a Mediterranean basin. Nat. Hazards Earth Syst. Sci. 2013, 13, 1285–1297. [Google Scholar]
  18. Lu, N.; Godt, J.W. Hillslope Hydrology and Stability; Cambridge University Press: Cambridge, UK, 2013. [Google Scholar]
  19. Fan, X.; Scaringi, G.; Korup, O.; West, A.J. Earth and debris slides. Earth-Sci. Rev. 2019, 196, 102887. [Google Scholar]
  20. Acharya, G.; Cochrane, T.A.; Davies, T.R. Quantifying and mapping the effects of rainfall on shallow landslides in a GIS environment: A case study from Otago, New Zealand. Environ. Earth Sci. 2014, 71, 3907–3918. [Google Scholar]
  21. Greco, R.; Damiano, E.; Olivares, L. Hydrological modeling of shallow landslides triggered by rainfall. Nat. Hazards 2012, 61, 1273–1293. [Google Scholar]
  22. He, Y.; Wei, Y.; Zhang, Y. Spatiotemporal evolution and susceptibility analysis of shallow landslides triggered by heavy rainfall in Sichuan, China. Nat. Hazards 2024, 120, 479–504. [Google Scholar]
  23. Bogaard, T.A.; Greco, R. Landslide hydrology: From hydrology to pore pressure. WIREs Water 2016, 3, 439–459. [Google Scholar] [CrossRef]
  24. Capparelli, G.; Versace, P. Rainfall-triggered shallow landslides: A distributed hydrological-geotechnical model. Adv. Geosci. 2005, 2, 21–26. [Google Scholar]
  25. Chengtang, W.; Hao, W.; Weimin, Q.; Shuan, W.; Huan, T.; Kun, F. Behavior of pile-anchor reinforced landslides under varying water level, rainfall, and thrust load. Eng. Geol. 2023, 325, 107293. [Google Scholar]
  26. Fei, C.; Keizo, U. Numerical analysis of the stability of a slope reinforced with piles. J. Soil Found. 2000, 40, 73–84. [Google Scholar]
  27. Liu, S.; Luo, F.; Zhang, G. Centrifuge model tests on pile-reinforced slopes subjected to drawdown. J. Rock Mech. Geotech. Eng. 2020, 12, 1290–1300. [Google Scholar] [CrossRef]
  28. Xinli, H.; Dongzi, L.; Lifei, N.; Chang, L.; Xuan, W.; Ru, F. Development of soil-pile interaction and failure mechanism in a pile reinforced landslide. Eng. Geol. 2021, 294, 106389. [Google Scholar]
  29. Fujiwara, K. Small model test on reinforcing bar insertion work with a circular pipe. In Proceedings of the 12th Symposium on Sediment-Related Disasters, Niigata City, Japan, 30 October–1 November 2024; pp. 143–148. Available online: https://committees.jsce.or.jp/seibu_s01/node/77 (accessed on 19 June 2025).
  30. Majid, M.R.; Sarah, K.I. Optimal Plastic Analysis and Design of Pile Foundations Under Reliable Conditions. Period. Polytech. Civ. Eng. 2021, 65, 761–767. [Google Scholar] [CrossRef]
  31. Wang, L.; Fujiwara, K. Experimental study on reinforcement Insertion work using pipes during rainfall. Annu. Meet. Jpn. Soc. Civ. Eng. 2024, 79, III-334. [Google Scholar]
Figure 1. Existing (left and middle) and proposed (right) construction methods.
Geotechnics 05 00055 g001
Figure 2. View of the setup of a lift-up experiment (unit: mm).
Geotechnics 05 00055 g002
Figure 3. Depiction of failure modes.
Geotechnics 05 00055 g003
Figure 4. Relationship between D/D1 and failure angle.
Geotechnics 05 00055 g004
Figure 5. Relationship between failure angle and bending strain at E1.
Geotechnics 05 00055 g005aGeotechnics 05 00055 g005b
Figure 6. Model diagram of Case G-2 as an example of the analysis model (Unit: mm).
Geotechnics 05 00055 g006
Figure 7. The depth distribution of the bending strain of the core bar of analytical and experimental.
Geotechnics 05 00055 g007
Figure 8. View of setup of a water sprinkling experiment.
Geotechnics 05 00055 g008
Figure 9. Images of the time process of slope failure for Case A, (a) 10 s, (b) 30 s, (c) 50 s.
Geotechnics 05 00055 g009
Figure 10. Time histories of the excess pore water pressures for Case A.
Geotechnics 05 00055 g010
Figure 11. Images of the time process of slope failure for Case D-1, (a) 10 s, (b) 52 s, (c) 115 s.
Geotechnics 05 00055 g011
Figure 12. Time histories of the excess pore water pressures for Case D-1.
Geotechnics 05 00055 g012
Figure 13. Time histories of the bending strain for Case D-1.
Geotechnics 05 00055 g013
Figure 14. Images of the time process of slope failure for Case F-2, (a) 10 s, (b) 45 s, (c) 150 s.
Geotechnics 05 00055 g014
Figure 15. Time histories of the excess pore water pressures for Case F-2.
Geotechnics 05 00055 g015
Figure 16. Time histories of the bending strain for Case F-2.
Geotechnics 05 00055 g016
Figure 17. Summary of the failure time and water volume for all the cases.
Geotechnics 05 00055 g017
Figure 18. Summary of the maximum bending strain at E1 for all the cases.
Geotechnics 05 00055 g018
Table 1. Experimental cases.
CasesCountermeasureNumber ofDiameter ofD/D1
Core Barsa Pile (mm)
Case ANo countermeasureNoneNone0.00
Case B-1Reinforcement insertion work1 None
(Core width 5 mm)
0.02
Case B-23 0.06
Case C-1Reinforcement
insertion work
with pile
1 10.0 0.04
Case C-23 10.0 0.13
Case D-11 20.0 0.09
Case D-23 20.0 0.26
Case E-11 30.0 0.13
Case E-23 30.0 0.38
Case F-11 41.5 0.18
Case F-23 41.5 0.53
Case G-11 60.0 0.26
Case G-23 60.0 0.77
Table 2. Input parameters.
(a) Soil
Unit weight per volumeγ10.06kN/m3
Young’s ModulusE29,300 kN/m2
Poisson’s ratioν0.33-
Friction angleφ33degree
CohesionC15kN/m2
(b) Core bar
Unit weight per volumeγ79.3kN/m3
Young’s ModulusE1.93 × 108kN/m2
Poisson’s ration0.33-
Moment of inertia of areaI1.12 × 10−11m4
(c) Pipe
Unit weight per volumeγ12.00 kN/m3
Young’s ModulusE3.00 × 106kN/m2
Poisson’s ration0.33-
Thicknesst4.00 mm
(d) Interface
Spring modulus in
perpendicular direction
kn1000 kN/m2
Spring modulus in
shear direction
ks100 kN/m2
Disclaimer/Publisher’s Note: The statements, opinions and data contained in all publications are solely those of the individual author(s) and contributor(s) and not of MDPI and/or the editor(s). MDPI and/or the editor(s) disclaim responsibility for any injury to people or property resulting from any ideas, methods, instructions or products referred to in the content.