Abstract
This study proposes an advanced thermodynamic energy equation to accurately simulate the stress–dilatancy relationship in granular soils for both uncrushed and crushed sands. Traditional energy formulations primarily consider dissipation energy and often neglect the role of free energy. Recent developments have introduced free energy components to account for plastic energy contributions from dilation and particle crushing. However, significant discrepancies between theoretical predictions and experimental observations remain, largely due to the omission of complex mechanisms such as contact network rearrangement, force-chain buckling, grain rolling, rotation without slip, and particle crushing. To address these gaps, the proposed model incorporates dual exponential decay functions into the free energy framework. Rather than explicitly modeling each mechanism, this formulation aims to phenomenologically capture the interplay between fundamentally opposing thermodynamic forces arising from complex mechanisms during granular microstructure evolution. The model’s applicability is validated using the experimental results from both uncrushed silica sand and crushed calcareous sand. Through extensive comparison with over 100 drained triaxial tests on various sands, the proposed model shows substantial improvement in reproducing stress–dilatancy behavior. The average discrepancy between predicted and measured relationships is reduced to below 15%, compared to over 60% using conventional models. This enhanced energy equation provides a robust and practical tool for predicting granular soil behavior, supporting a wide range of geotechnical engineering applications.
1. Introduction
Shear-induced volume change, known as dilatancy, is a defining characteristic of granular soils that sets them apart from other engineering materials. This phenomenon was first identified by Reynolds (1885) [1]. Building on the concept that applied work is converted into frictional dissipation energy, Taylor (1948) [2] introduced a mathematical formulation for dilatancy during direct shear tests based on energy principles. Using similar energy formulations but different assumptions regarding frictional dissipation, various stress–dilatancy models were developed—for example, by Newland and Alley (1957) [3], Roscoe and Schofield (1963) [4], and Dafalias (2004) [5]. Another class of energy-based formulations was developed from the principle of the minimum energy ratio proposed by Rowe (1962) [6] and was later extended by de Josselin de Jong (1976) [7], Vermeer (1996) [8], Wan and Guo (1998) [9], and Guo (2009) [10], among others.
In these traditional approaches, a portion of the externally applied work is stored as elastic free energy, while the remainder, associated with plastic or inelastic deformation, is assumed to be fully dissipated through friction. The stress–dilatancy relationships derived from such an assumption often show discrepancies when compared with experimental observations, especially in dense sands and in the post-peak regime. As a result, empirical correction factors have been introduced by many researchers [11,12,13,14,15,16,17].
To address these discrepancies, Collins and his collaborators introduced a more general energy framework based on thermodynamics. In this framework, plastic free energy is also considered, allowing part of the plastic work to be stored within the system rather than being fully dissipated (Collins and Muhunthan (2003) [18], Collins (2005) [19], Collins et al. (2007) [20]). Plastic free energy is accumulated during compression and released during dilation, providing a potential explanation for discrepancies observed in traditional energy models that only account for frictional dissipation—and hence the frequent use of empirical correction factors.
Aside from plastic free energy, breakage energy plays a critical role in the behavior of crushed sand [21,22,23]. Particle crushing produces finer fragments that fill voids, enhance compaction, and generate new interparticle contacts and force chains, thereby altering the soil’s mechanical response.
The inclusion of plastic free energy accounting for mechanisms associated with dilation has been discussed in [24,25,26], and breakage energy has been explored in [21,22,23]. No existing models fully capture the combined interaction of these two mechanisms. Moreover, the response of granular soils is influenced by a multitude of additional micromechanical processes—such as contact network rearrangement, force-chain buckling, and grain rolling or rotation without slip—which remain challenging to quantify in a unified energy framework.
To further explore these complex mechanisms, discrete element method (DEM) simulations and micromechanical modeling have offered valuable insights into fabric evolution, contact network behavior, and energy dissipation at the particle scale [16,27,28,29]. However, quantifying stored and dissipated plastic free energy requires detailed knowledge of packing structure and interparticle properties, which are often too intricate for practical engineering applications.
In this study, we propose a dual exponential decay formulation to capture the evolution of both stored and released (i.e., positive and negative) plastic free energy. Rather than explicitly modeling each underlying mechanism, this approach provides a simple yet effective means of capturing the interactions between opposing energies arising from complex mechanisms during granular microstructure evolution.
This paper is organized as follows. First, the proposed energy equation is derived from the first law of thermodynamics. A brief review of existing stress–dilatancy models based on energy formulations is then presented. Next, the new model—incorporating dual exponential decay functions—is applied to uncrushed quartz and silica sands, and crushable calcareous and coral sands. Finally, model predictions are validated against experimental data, and the key behavioral features and governing parameters are systematically examined.
2. Energy Equation and First Law of Thermodynamics
The external work supplied to a granular assembly—such as mechanical or kinetic energy—is partially dissipated through friction and particle rearrangement. The rate of the applied work can be expressed as , where denotes the stress tensor and represents the strain rate tensor. According to the First and Second Laws of Thermodynamics, the Clausius–Duhem inequality can be formulated as shown by Lemaitre and Chaboche (1990) [30]:
The dissipation energy is defined as the mechanical work input, minus the rate of change in free energy , the thermal energy term , and the thermal dissipation , where is the absolute temperature, is the entropy, and denotes heat exchange. The Clausius–Duhem inequality ensures the thermodynamic admissibility of any process by requiring that the total dissipation be non-negative. Assuming that the thermal dissipation term is negligible compared to mechanical dissipation under slow processes, it can be omitted [31]. The Clausius–Duhem inequality then reduces to a more restrictive form.
Under isothermal conditions, the Clausius–Duhem inequality simplifies to . Accordingly, the externally applied work rate is equal to the sum of the rate of free energy storage and the dissipation energy .
The energy equation plays a critical role in modeling the stress–strain behavior of granular materials [9,13,32].
Dissipated energy typically refers to energy irreversibly lost from the system—such as heat generated by friction—that cannot be recovered to perform useful work. The rate of free energy is associated with particle rearrangement and changes in configuration. A positive value of indicates energy is stored within the system, while a negative value implies that energy is released and does not contribute to the applied work. The physical interpretation of plastic energy has been discussed in detail by Collins and Kelly (2002) [26] and Yang et al. (2018) [33]).
The total free energy can be decomposed into elastic and plastic components. Elastic free energy , associated with reversible interparticle deformation (e.g., spring-like contact forces), can be stored and fully recovered upon unloading. In contrast, plastic free energy is only partially dissipated, with the remaining portion stored within the system. This stored plastic energy may subsequently be released during dilation, for example. Hence, although plastic deformation is irreversible, the associated plastic free energy is partially recoverable.
The applied plastic work comprises two components: the dissipated energy and the plastic free energy, the latter of which may be either stored in or extracted from the system. For example, during volumetric contraction of soil under loading, the elastic portion of the applied work is stored as elastic free energy. The plastic portion is further divided—most of it is dissipated through friction, while a smaller fraction is stored within the system through non-dissipative particle rearrangement, thereby increasing the system’s potential energy. This stored plastic work contributes to the accumulation of plastic free energy, which may later be released during dilation.
The energy equation (Equation (3)) thus provides a foundational framework for deriving the plastic flow rule in kinematically hardening elastic–plastic models and underpins the stress–dilatancy relationship in soil mechanics.
3. Energy Equation and Stress–Dilatancy Relationship
Three types of energy equations are reviewed below.
3.1. Consider Only Friction Dissipation in Energy Equation
The first approach assumes that the plastic portion of the applied work is entirely converted into frictional dissipation.
Taylor (1948) [2] introduced his influential stress–dilatancy theory by analyzing energy dissipation in direct shear tests on Ottawa sand (see Figure 1). Taylor’s intuitive assumption is based on the interpretation of incremental work performed in a direct shear test.
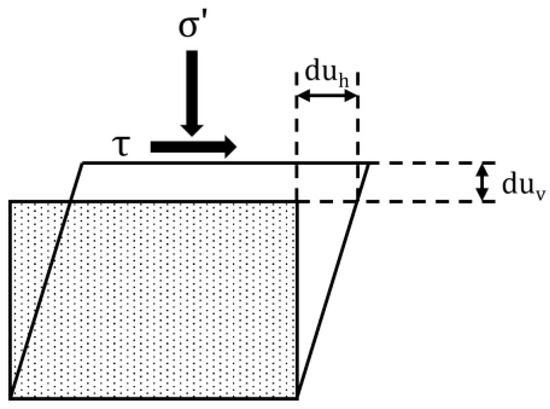
Figure 1.
Dilation of soil in a shear box.
In this expression, and are, respectively, the normal (effective compressive) and shear stresses, acting on planes parallel to the shear-plane, and and are, respectively, the relative horizontal and vertical displacements. The increment work is the amount of energy per unit area for the depth of the shear zone.
This approach assumes that free energy remains constant, nearly all the applied work is dissipated through frictional mechanisms (i.e., And the frictional dissipation is
This hypothesis assumed that is the mobilized friction angle when the vertical deformation becomes a steady state. By equating Equations (6) and (7), we may write the following stress–dilatancy relationship:
This recovers Taylor’s conceptual separation of shear strength into grain-to-grain frictional resistance and an additional resistance arising from grain interlocking and dilation. This interpretation is an attempt to make a plausible micromechanical interpretation of the strength of sand. In Taylor’s dilatancy equation, only the frictional dissipation term was considered.
A similar approach is used in the critical-state (or Cam-Clay) model [4,24,32,34,35]. Consider an assembly of grains undergoing plastic dilatant volumetric strain and shear strain when a set of mean effective stress and shear stress q is applied. Under the triaxial loading condition, the mean principal effective () and deviator (q) stresses can be formulated as and . In addition, the incremental general shear strain can be formulated as , . The plastic work is defined by
The superscript ‘p’ stands for plastic. The frictional dissipation function is given by where M is the slope of the critical-state line in the plane. Assuming that is solely equal to the frictional dissipation, then
It is noted that the applied work expression in Equation (10) does not consider the case of non-coaxiality between the principal stress and principal strain rate directions, which is an elusive feature that influences for the dilatancy behavior of sand [11,36]. The corresponding stress–dilatancy relationship is expressed as
It is noted that Reynolds dilatancy represents a strict kinematic coupling between shape and volume for assemblies of rigid and frictionless particles [37]. The energy equation is represented by .
The stress–dilatancy equation can be expressed as
Another class of stress–dilatancy relationship, based on the equation of the minimum energy ratio, was proposed by Rowe (1962) [6], Newland and Alley (1957) [3], de Joselin de Jong (1976) [7], and Wan and Guo (1998) [9], among others. Although Rowe’s dilatancy equation was not originally derived directly from thermodynamics, Guo (2009) [10] later demonstrated that it could be recovered under the assumption that the applied work equals frictional dissipation.
Rowe’s theory establishes a linear relationship between the stress ratio and the strain rate ratio (i.e., ). The constant depends on the material’s friction angle. Experimental data from Rowe (1962) [6] and others support this relationship in a limited range of , typically up to the peak stress ratio. However, in the post-peak regime, the link between and becomes more complex [8,38]. Moreover, the peak dilation rate usually occurs slightly before the peak stress ratio, though this effect is often subtle and difficult to detect experimentally.
The stress–dilatancy relationship in Equation (12) predicts a unit slope () and, while this approximation matches experimental data for loose and very loose sands [39], (Figure 2a), it overestimates the slope observed in dense sands [40]. Dense sands instead show a two-stage dilatancy response (Figure 2b): an initial, strongly dilative stage before peak stress (Stage 1) and a gentler, nearly linear post-peak stage (Stage 2). Since Equation (12) represents a single linear line, it cannot capture both stages. Conventionally, Equation (12) is interpreted as the linear line after peak stress because the linear relationship between and is more stable and better aligned with the model during this phase. Figure 2b shows that Equation (12) overpredicts the dilation in the post peak region, which is also supported by the observations in various studies [41,42,43,44].
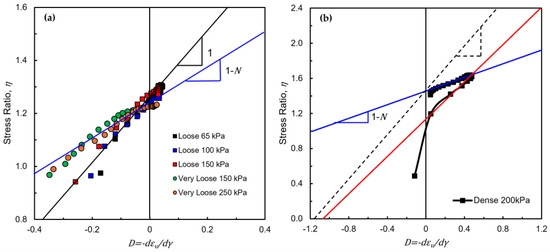
Figure 2.
Equation (12) compared with the measured results of (a) loose and (b) dense sand. Experimental data from Norris (1997) [39] and Yilmaz (2023) [40] Note: kPa is confining pressure.
To address this discrepancy, Nova (1982) [45] introduces a correction factor c to the dilatancy term (i.e., ). This factor varies with soil type—e.g., 0.5 for Ottawa sand [11], and 0.63–0.75 for Erksak sand [12]. Further refinements treat c as a function of , such as [18] and [14]. Similarly, correction factors have also been proposed for Rowe’s dilatancy equation (Alonso-Marroquin et al. (2005) [15] and Kruyt and Rothenburg (2006) [16], and Powrie et al. (2005) [17]).
Another approach introduces a void-ratio-dependent correction by replacing M with to account for the influence of the void ratio on dilatancy (Li and Dafalias (2000) [13]). Similar modifications have been applied to Rowe’s dilatancy equation by assuming is a function of the void ratio and the critical-state void ratio [46], effectively capturing the nonlinear behavior observed in dense sands. However, studies on loose and very loose sands (e.g., Been and Jefferies (2004) [12]) indicate that such corrections are not universally applicable.
More recently, a novel correction method has been proposed using fractional calculus. In this approach, dilatancy is expressed as a “fractional derivative” of the yield function, formulated from a Cam-Clay-type energy equation [47,48]. While this method reduces the observed discrepancy, it lacks clear physical interpretation and is therefore treated similarly to empirical correction factors.
3.2. Consider Plastic Free Energy in Energy Equation
The above-mentioned stress–dilatancy relationships are based on the hypothesis that plastic work consists only of frictional dissipation as shown in Equation (5). However, both acoustic emission experiments [39,49,50] and DEM simulations [16,41,51,52] indicate that plastic work contributes not solely to interparticle friction dissipation but also the rearrangement and contact evolution. Thus, it is necessary to account for the free energy in order to correctly model stress–dilatancy behavior. Thus, besides the frictional dissipation , an additional term of plastic free energy is added, i.e., . This contrasts with conventional elastoplastic theory, where free energy is typically associated only with elastic recoverable energy, .
In the following, three stress–dilatancy relationships derived by Collins and Kelly (2002) [26], Jefferies (1997) [24] and Chang and Deng (2022) [25] will be briefly described.
Collins and Kelly Model
To consider the term of plastic free energy, a form of energy equation was proposed by Collins and Kelly (2002) [26], in which the frictional dissipation is similar to that of the modified Cam-Clay model, and the free energy is assumed to be dependent on the plastic volume strain increment [19]. Thus, the energy equation is written as
where the stress parameter is the mean normal consolidation pressure, calculated from an elliptical yield locus given by
Collins and Hilder [53] showed that the form of the energy equation has a fundamental influence on constitutive equations, such as the yield function [18]. From Equation (13), Collins and Kelly (2002) [26] derived the resultant stress–dilatancy relationship, which was found to be identical to that of the modified Cam-Clay model [4].
Thus, the limitation of this model is the same as the classic modified Cam-Clay model.
Jefferies Model
Another energy equation that contains a free energy term was suggested by Jefferies (1997) [24] in the following form:
With Equation (16), the stress–dilatancy relationship can be derived as
or in the form
The parameter N is related to the correction factor proposed by Nova (1982) [45]. Jefferies proposed a typical value of = 0.25, indicating that a fraction of the applied plastic work contributes to free energy and not solely to dissipation. The N value significantly alters the stress–dilatancy characteristics. The comparisons of Equations (12) and (18) are shown in Figure 2, where Equation (18) gives a better prediction with the additional parameter N. However, Equation (18) is still a single linear line, which cannot describe the two-stage features of stress–dilatancy behavior for dense sand.
Chang and Deng Model
As shown by Chang and Deng (2022) [25], both the stress–dilatancy relationships (Equations (12) and (18)) exhibit discrepancies when compared to the experimental results. To reduce the discrepancies, Chang and Deng (2022) [25] developed a model with modified frictional dissipation energy,
which improved the performance. Although the empirical correction term β(γp) improves the performance of the Jefferies model, it still encounters discrepancies under certain soil conditions, particularly for widely graded granular soils or crushed sands. Although the empirical correction term β(γp) improves the performance of the Jefferies model, it still encounters discrepancies under certain soil conditions, particularly for widely graded granular soils or crushed sands.Nevertheless, the model still encounters discrepancies in some soil conditions, particularly widely graded granular soil or crushed sand.
3.3. Consider Crushing in Energy Equation
Besides the free energy associated with volume change due to rearrangement, breakage energy associated with particle crushing and the increase in particle surface area due to fragmentation have been considered in the energy equation by many investigators (e.g., Einav (2007) [21], Ueng (2000) [22], Sun (2016) [23], and Bai (2025) [54]). The energy balance under plastic deformation can be expressed as
where represents the breakage energy dissipation per unit volume. It is important to note that not all breaking energy is dissipated; a significant portion contributes to changes in the system’s free energy through the rearrangement of fragments and evolution of contact network.
The magnitude of is often analyzed in relation to the breakage index. In the study by Sun (2016) [23], the breakage energy consumption is assumed to be proportional to the total plastic work input. However, the model is limited in that it fails to capture the key features of the stress–dilatancy curves beyond the peak stress (see Figure 3). To have a better model, a proper free energy term and break energy term need to be applied. A suitable energy formulation remains a barrier.
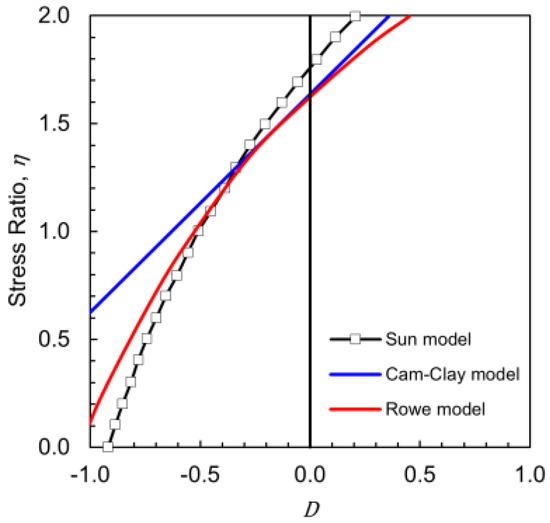
Figure 3.
Stress dilatancy data for crushed sand compared with Cam-Clay model, Rowe model, and Sun model (data from Sun (2016) [23]).
4. Proposed Energy Equation
In order to develop a suitable formulation for wider applications, we started with the form of the Jefferies model, which is simple and fundamentally valid by accounting for both dissipation and free energy. The correct form is assumed to be
where represents the discrepancies between the measured and predicted from Equation (18). To quantify the discrepancies , we analyzed experimental data (see Table 1) from triaxial tests on various sands under different confining stresses and densities. The method used to separate the elastic and plastic components of deformation during the tests is detailed in Appendix A.

Table 1.
Summary of experimental data used for verification.
Figure 4a shows the discrepancies for all tests listed in Table 1. The results show the discrepancy decay exponentially with shear strain. To study these curves separately, there are two basic patterns.
It is interesting to observe that the curve in Figure 5a resembles features of the Lennard–Jones potential commonly used for intermolecular potential, in which the two opposing forces are attraction and repulsion, whereas in the granular system, there are two antagonistic energies: stored and released energies.
This characteristic can be described by a dual exponential function.
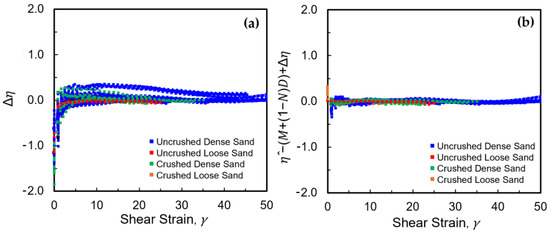
Figure 4.
(a) This discrepancy in between Equation (18) and the measured results. (b) The discrepancy in between Equation (21) and the measured results.
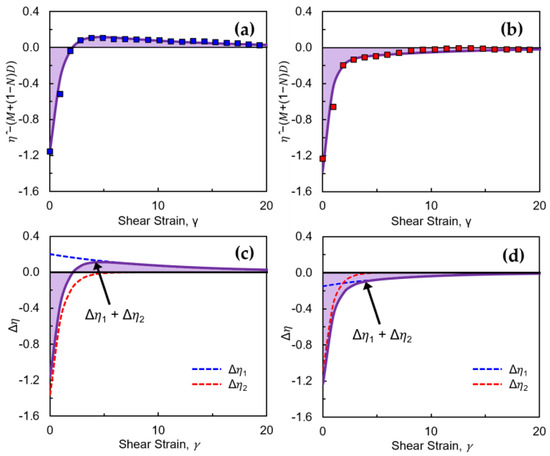
Figure 5.
(a) Curve pattern 1, (b) curve pattern 2, (c) curve pattern 1 ( with , (d) curve pattern 2 ( with .
Inspired by the similarity of the physical systems, we used the mathematical expression of a dual exponential function, , and
In Equation (22), is always negative, as shown in Figure 5c,d, whereas can be either positive or negative, also shown in Figure 5c,d. When is positive, the summation of represents the curve pattern of Figure 5a. On the other hand, when is positive, the summation of represents the curve pattern of Figure 5b. Therefore, the dual exponential function is effective in modeling complex interactions of mechanisms that generate two antagonistic energies.
The physical meaning of negative can be regarded as the energy release associated with the physical mechanism of interlock breakage during particle rearrangement, often accompanied by particle rolling or rotation.
In contrast, can be either positive or negative. A negative is associated with energy release due to force-chain buckling and with dilation. A positive is associated with the energy stored due to particle crushing and with contraction.
Here, we hypothesize , where is the value of at the phase transition state (i.e., = 0, see Figure 6). The value of can be either positive or negative, depending on the relative magnitude of and .
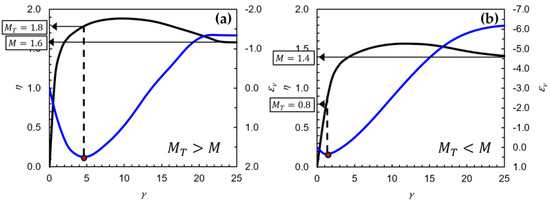
Figure 6.
(a) ; (b) .
From the boundary condition, at zero strain , . According to Equation (22), it leads to , which is associated with the rate of interlocking breaking at is the dilation at zero shear strain. At large strains , and vanish, recovering steady-state balance and ensuring consistency with boundary conditions. The exponent constants and represent the decay rates of and . Experimental data confirm that , reflecting the faster decay rate of (interlock breaking).
Multiplying Equation (22) by yields the following energy equation:
The dual exponential terms represent the stored or released energies associated with various physical mechanisms. The rate of stored or released energies is different, aligning with systems exhibiting multi-rate decay processes.
To validate the robustness of the proposed model across different soil types, the proposed energy equation was validated using over 100 triaxial test results on various sand types (Table 1). The results demonstrate excellent agreement between the predicted and experimental curves. Among these results, some typical examples are shown in Figure 7.
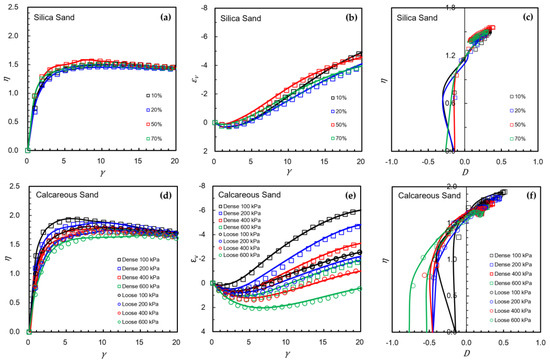
Figure 7.
Predicted - curves, - curves, and - curves using Equation (22). Note: The percentage in (a–c) is the fines content of the binary mixture [40], and the kPa in (d–f) is the confining pressure [57] for tests on Kish Island calcareous sand in dense and loose states.
Figure 7 shows the results for binary mixtures of silica sand (, [40]) and calcareous sand (dense and loose [57]). It demonstrates excellent agreement between the predicted and experimental curves. The predicted results are shown in the figure in solid lines. The predictions were generated from Equations (21) and (22). The curves are predicted from the measured volume strain data, and the volume strain curves are predicted from the measured .
To further validate the robustness of the proposed model, we reanalyzed the two types of sand in Figure 7 with four models, Cam-Clay, Jefferies, Chang, and Deng, and the proposed model, and compared the predicted results. The results are presented in Figure 8.
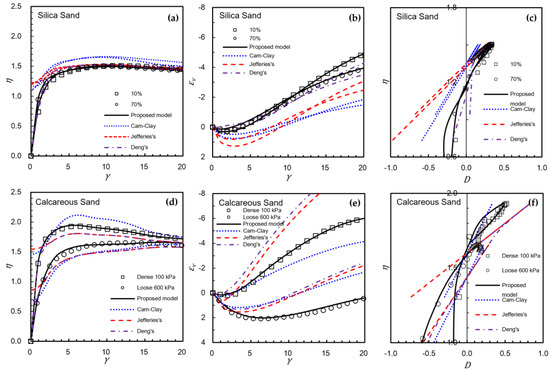
Figure 8.
Comparison of predicted - curves, - curves, and - curves using the Cam-Clay, Jefferies, Chang, and Deng models and the proposed model. Note: The percentage in (a–c) is the fines content of the binary mixture [40], and the kPa in (d–f) is the confining pressure [57] for tests on Kish Island calcareous sand in dense and loose states.
Figure 8 shows that, among these models, the predictions from the Cam-Clay and Jerries models showed the right trend but with an error of about 50–60%. The Chang and Deng model performs well for uncrushed silica sand (around 15% error) but performs poorly for calcareous sand (around 50–60% error), where significant particle crushing occurs during sharing. The prediction of the current proposed model gives around 10–15%, representing an acceptable level of prediction accuracy for geotechnical engineering applications. The discrepancy in between the prediction of the current model and measured results is shown in Figure 4.
The proposed model demonstrates an advantage over existing models for providing better predictions for both non-crushing and crushing granular soils.
5. Discussion
5.1. Up-Hook and Down-Hook
Examining the stress dilation curves in Figure 7, a distinct feature emerges for both uncrushed and crushed sands. After reaching the peak stress ratio, the curves for silica sands exhibit an upward hook, while those for calcareous sands show a downward trend. To analyze this feature more closely, Figure 9 presents the predicted and measured stress–dilatancy curves for four selected soils, with the corresponding model parameters listed in Table 2.
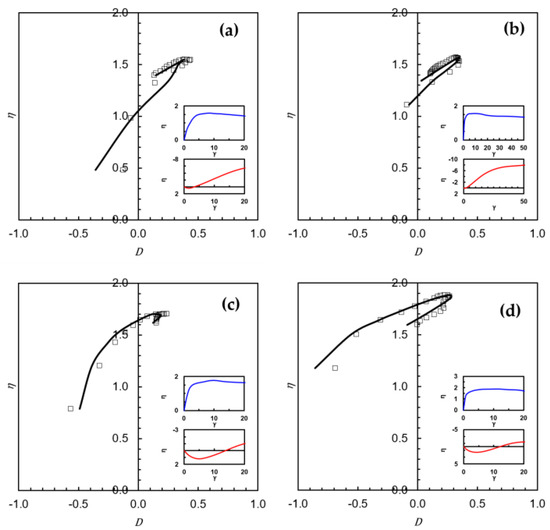
Figure 9.
(a) The results of uniform dense silica sand (Yilmaz 11.31 fc = 0, 200 kPa) [40], (b) the results of uniform dense silica sand (Yu Br = 0, 200 kPa) [55], (c) the results of loose calcareous sand (Hassanlourad, 400 kPa) [57], (d) the results of dense coral sand (Yao, 200 kPa) [56].
Table 2.
Parameters for the predictions in Figure 8.
According to Equation (21), the stress ratio can be decomposed into three components corresponding to different energy contributions: i.e., . Here, represents the friction dissipation, is the contribution from dilation work, and captures the strain-dependent energy decay.
For uncrushed silica or quartz sand (Figure 9a,b), , so the term is negative, implying a continuous decrease in with increasing shear strain, even beyond the peak stress point. The shape of in this case aligns with the curve shown in Figure 5d. Therefore, at the same dilation level (see Figure 9b for example), the reduction in (i.e., the magnitude of after the peak is less than before the peak due to the nature of decay. This leads to a higher η after the peak, forming an upward hook in the stress–dilatancy curve.
Physically, the negative indicates that free energy is being released from the system due to the breakdown of force chains carried through particle contacts within the packing structure under loading. This energy released weakens the packing structure, reducing coordination and the number of particle contacts.
In contrast, for crushed calcareous or coral sand (Figure 9c,d), , making positive. The shape of corresponds to Figure 5c. Initially, is negative but becomes positive at higher shear strains. In this case, contributes to an increase in . Therefore, at the same level (see Figure 9d), the increase in after the peak is smaller than before the peak, leading to a lower after the peak, producing a downward hook in the stress–dilatancy curve.
Crushing dissipates part of the energy through particle breakage, vibration, and heat, while a portion of the energy is converted into free energy through the rearrangement of fragments. As crushing broadens the particle size distribution, smaller particles fill voids, enhancing compaction and forming new contacts and force chains. This compaction yields a positive . However, it simultaneously reduces dilation , thereby lowering the dilation-related stress term —a competing mechanism that governs the stress–dilatancy response.
In view of the predicted behavior of crushed sands, it is reasonable to model the free energy from crushing using exponential decay functions, since most particle breakage and energy release occur in the early stages of loading, consistent with the observation in numerical simulations [58].
5.2. Model Parameters
The six parameters used in this energy-based equation ( have been determined from various types of samples under triaxial tests for validation. These parameters for both crushed and uncrushed sands are discussed here.
- (1)
- Frictional parameter (Figure 10a): Crushable sands (e.g., calcareous or coral) exhibit higher values of the frictional parameter compared to uncrushed sands (e.g., quartz or silica). This increase is primarily attributed to the angular particle shapes generated during crushing, which significantly enhance interparticle friction and resistance to sharing.
- (2)
- Dilation parameter (Figure 10b): The dilation parameter does not appear to be significantly influenced by particle crushing. Instead, its value is primarily governed by the initial density state of the soil. For dense sands, typically ranges from 0 to 0.6, reflecting a greater potential for dilation during shearing due to a tightly packed structure and stronger force chains. In contrast, for loose sands, generally ranges from 0 to 0.3, as the loosely arranged particles limit dilative behavior.
- (3)
- Decay of functions of and (Figure 10c): At , the magnitude of and =. The magnitude of is large than , and it also decays fast at . In Figure 10c, the red curve (marked 1) represents , which reflects energy release due to the loss of interlocking. Since interlocking deteriorates quickly during shearing, starts large and decays sharply.The blue curve (marked 2) corresponds to energy release from force-chain buckling and particle rearrangement (negative); this process decays much more gradually than . The blue curve (marked 3) represents energy from particle crushing. Because the rate of particle crushing is most significant at the early stage of shearing, the rate decays sooner compared to the blue curve (marked 2) and becomes negligible after the peak of stress.
- (4)
- Parameter (Figure 10d): The value of is typically positive for crushed sands and negative for uncrushed sands. Crushed sands tend to exhibit larger absolute values, indicating a more substantial deviation between the phase transition state and the critical state. This reflects the increased resistance mobilized in crushable soils due to particle fragmentation and angularity effects.
- (5)
- Decay rate ratio ( (Figure 10e): The ratio ( quantifies how much faster the interlocking degradation term decays compared to the rate of decay of the force chain or crushing . While the ratio can reach up to 20, it is generally higher for crushed sands, indicating a sharper and more immediate decay of in crushable soils. This suggests that the interlocking in crushable sands is less stable and more sensitive to shear-induced degradation.
- (6)
- Initial dilation parameter (Figure 10f): The parameter , which represents the initial rate of dilation at zero shear strain, appears to be not significantly affected by particle crushing. Instead, it is more strongly influenced by the confining stress and the initial relative density of the sand. As shown in Figure 10f, generally increases with increasing confining stress, regardless of whether the sand is crushed or uncrushed. This trend suggests that under higher confinement, the soil structure develops greater resistance to volumetric contraction, leading to more pronounced dilation upon shearing.
From the results, the frictional parameter shows a clear distinction between material types, ranging from 1.4 to 1.8 for crushed sands and 1.2 to 1.4 for uncrushed sands. The dilation parameter depends primarily on the density state, typically ranging from 0 to 0.6 in dense sands and 0 to 0.3 in loose sands. The phase transition state and critical state difference is generally positive in crushed sands (0 to 0.35) and negative in uncrushed sands (–0.2 to 0), reflecting the stronger structural changes caused by crushing. The decay rate ratio , which characterizes the relative rate of interlocking loss to force-chain break or crushing, can reach values up to 20, especially in crushable soils. Finally, the initial dilation parameter varies from 0 to –1.2, with the magnitude largely influenced by confining pressure rather than crushing behavior.
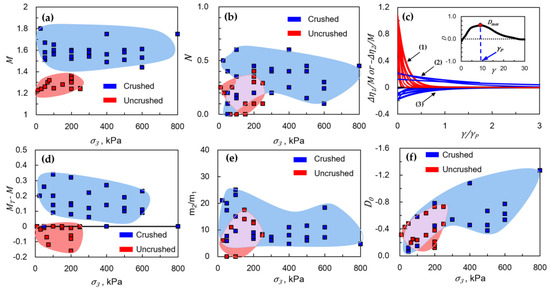
Figure 10.
Model parameter trends: (a) , (b) , (c) and (d) , (e) (f) .
5.3. Stress–Strain Curves Signatures
Figure 11a–c show the measured results for uncrushed sand, while Figure 11d–f show the measured results for crushed sand. The plots display the volume strain, stress ratio , and dilatancy with respect to shear strain.
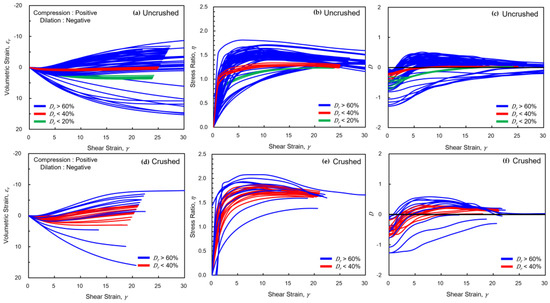
Figure 11.
(a–c) show the stress–strain, volume change, and dilatancy behavior of uncrushed sands [39,40,55]; (d–f) show the same for crushed sands [56,57].
With compression taken as positive and dilation as negative, crushed sands generally exhibit more contractive behavior, primarily due to finer particles filling voids created during crushing. In contrast, uncrushed sands display more pronounced dilation, reflecting their intact granular structure.
Regarding the stress ratio, crushed sands typically demonstrate higher peak strength than uncrushed sands. This is attributed to the angular particle shapes generated by crushing, which enhance interparticle friction. Additionally, the peak stress in crushed sands tends to occur at higher shear strains, and the post-peak softening is more gradual, resulting in a rounded curve. In comparison, uncrushed sands show a sharper peak followed by a steeper softening phase.
The dilatancy–strain curves exhibit patterns similar to the stress–strain response. For uncrushed sands, the dilatancy curve rises sharply and then drops rapidly post-peak. Crushed sands show a more subdued and smoother transition. This reflects a key difference in the mechanical response: uncrushed sands release stored energy more abruptly, while crushed sands dissipate energy more gradually due to microstructural rearrangements and fragment interlocking.
Drawing an analogy from physics, where force relates to the gradient of potential energy (), the relationship () suggests that dilatancy reflects the system’s mechanical potential landscape. Here, may be interpreted as a measure of stored mechanical potential, and as the driving stress ratio.
The distinct shapes of the stress–strain and dilatancy curves serve as signatures of sand behavior. These signatures provide a practical means of distinguishing between crushed and uncrushed sands, offering insights into their crushing history and microstructural evolution.
6. Summary and Conclusions
This study proposes an improved thermodynamic energy equation to describe the stress–dilatancy behavior of granular soils. Rather than explicitly modeling specific physical mechanisms, the proposed model utilized a dual exponential decay function to phenomenologically capture the interplay between two antagonistic energies that arise from complex mechanisms such as interlock degradation, force-chain buckling, and particle crushing during granular microstructure evolution.
The model was validated against over 100 drained triaxial tests conducted on a wide range of sand types, including silica, quartz, calcareous, and coral sands. Compared to conventional models such as the Cam-Clay and Jefferies models, and those by Chang and Deng—which showed prediction errors ranging from 50% to 80%—the proposed model consistently reduced errors to within 10–15%. It is also capable of capturing distinct behaviors such as the up-hook and down-hook patterns observed in both crushed and uncrushed sands, successfully replicating their peak and post-peak responses.
Experimental validation was carried out under monotonic drained triaxial loading for a sand size range from 0.096 to 2 mm. The current formulation is applicable to these conditions. Future research is needed to incorporate cyclic loading or complex stress paths for particles of different sizes and shapes. Nonetheless, the proposed model provides a physically grounded and practically applicable framework for modeling granular soil behavior. By integrating energy-based mechanisms, it offers new insight into stress–dilatancy relationships and supports the development of more advanced constitutive models in geotechnical engineering.
Author Contributions
Conceptualization, C.S.C.; Methodology, C.S.C.; Software, C.S.C. and J.C.; Validation, J.C.; Investigation, C.S.C.; Data curation, J.C.; Writing—original draft, C.S.C.; Writing—review & editing, J.C.; Visualization, J.C.; Supervision, C.S.C. All authors have read and agreed to the published version of the manuscript.
Funding
This research received no external funding.
Data Availability Statement
Publicly available datasets were analyzed in this study. This data can be found here: [doi:10.1061/(ASCE)GM.1943-5622.0000919, doi:10.1680/jgele.23.00117, Proc. 14th ICSMFE, 1997, Hamburg, doi:10.3208/sandf.48.107, doi:10.1016/j.compgeo.2023.105248].
Conflicts of Interest
The authors declare no conflicts of interest.
Appendix A. Elastic Component of the Strain
According to the elastoplastic theory, the total strain increment can be decomposed into elastic and plastic components. The elastic shear modulus of an assembly of particles is computed as follows, based on empirical relations derived from particle assemblies [59]:
where the value, and . The value for round sand and 2.79 for angular sand. is 160 for silica sand and Nevada sand, and 300 for Ottawa sand. The current void ratio is calculated from the initial void ratio and total volumetric strain , via the following relation: . The elastic bulk modulus can be computed by
A constant Poisson’s ratio is assumed throughout this study. The elastic shear and volume strains are obtained using the following relations:
Notably, coupling effects arise between elastic and plastic strains due to the dependence of stiffness parameters on evolving void ratio [60,61].
The total derivative of Equation (A3) yields
The second terms on the right-hand sides of Equations (A4) and (A5) are the elastic components that are directly influenced by plastic strain through modulus evolution—a couple effect absent in conventional elastoplastic models. The plastic strain increments, and , can be obtained by subtracting the calculated elastic strain increment from the measured total strain increment.
For a drained triaxial test on sand, the elastic strain increment is very small compared to the plastic strain increment. And only a portion of the elastic strain is coupled with the plastic strain. Therefore, the coupling effect can be considered negligible for estimating the plastic work, frictional dissipation, and plastic free energy under drained triaxial conditions. These elastic estimates, while simplified, serve to isolate plastic contributions to the energy balance equation, ensuring accurate evaluation of dissipation and recoverable energy components.
References
- Reynolds, O. LVII. On the Dilatancy of Media Composed of Rigid Particles in Contact. With Experimental Illustrations. Lond. Edinb. Dublin Philos. Mag. J. Sci. 1885, 20, 469–481. [Google Scholar] [CrossRef]
- Taylor, D.W. Fundamentals of Soil Mechanics; John Wiley & Sons Inc.: New York, NY, USA, 1948. [Google Scholar]
- Newland, P.L.; Allely, B.H. Volume Changes in Drained Taixial Tests on Granular Materials. Géotechnique 1957, 7, 17–34. [Google Scholar] [CrossRef]
- Roscoe, K.H.; Schofield, A.N.; Thurairajah, A. Yielding of Clays in States Wetter than Critical. Géotechnique 1963, 13, 211–240. [Google Scholar] [CrossRef]
- Dafalias, Y.F.; Manzari, M.T. Simple Plasticity Sand Model Accounting for Fabric Change Effects. J. Eng. Mech. 2004, 130, 622–634. [Google Scholar] [CrossRef]
- Rowe, P.W. The Stress-Dilatancy Relation for Static Equilibrium of an Assembly of Particles in Contact. Proc. R. Soc. Lond. Ser. A Math. Phys. Sci. 1962, 269, 500–527. [Google Scholar]
- De Josselin De Jong, G. Rowe’s Stress—Dilatancy Relation Based on Friction. Géotechnique 1976, 26, 527–534. [Google Scholar] [CrossRef]
- Schanz, T.; Vermeer, P.A. Angles of Friction and Dilatancy of Sand. Géotechnique 1996, 46, 145–151. [Google Scholar] [CrossRef]
- Wan, R.G.; Guo, P.J. A Simple Constitutive Model for Granular Soils: Modified Stress-Dilatancy Approach. Comput. Geotech. 1998, 22, 109–133. [Google Scholar] [CrossRef]
- Guo, P. Energy Approach Towards Stress-Dilatancy Formulation Based on Double Slip-Rotation Rate Concept. Soils Found. 2009, 49, 443–457. [Google Scholar] [CrossRef]
- Vardoulakis, I.; Georgopoulos, I.-O. The “Stress-Dilatancy” Hypothesis Revisited: Shear-Banding Related Instabilities. Soils Found. 2005, 45, 61–76. [Google Scholar] [CrossRef]
- Been, K.; Jefferies, M. Stress-Dilatancy in Very Loose Sand. Can. Geotech. J. 2004, 41, 972–989. [Google Scholar] [CrossRef]
- Li, X.S.; Dafalias, Y.F. Dilatancy for Cohesionless Soils. Géotechnique 2000, 50, 449–460. [Google Scholar] [CrossRef]
- Szypcio, Z. Stress-Dilatancy for Soils. Part I: The Frictional State Theory. Stud. Geotech. Mech. 2016, 38, 51–57. [Google Scholar] [CrossRef]
- Alonso-Marroquín, F.; Vardoulakis, I. Micromechanics of Shear Bands in Granular Media. In Powders and Grains; Balkema: Rotterdam, The Netherlands, 2005; pp. 701–704. [Google Scholar]
- Kruyt, N.P.; Rothenburg, L. Shear Strength, Dilatancy, Energy and Dissipation in Quasi-Static Deformation of Granular Materials. J. Stat. Mech. Theory Exp. 2006, 2006, P07021. [Google Scholar] [CrossRef]
- Powrie, W.; Ni, Q.; Harkness, R.M.; Zhang, X. Numerical Modelling of Plane Strain Tests on Sands Using a Particulate Approach. Géotechnique 2005, 55, 297–306. [Google Scholar] [CrossRef]
- Collins, I.F.; Muhunthan, B. On the Relationship between Stress–Dilatancy, Anisotropy, and Plastic Dissipation for Granular Materials. Géotechnique 2003, 53, 611–618. [Google Scholar] [CrossRef]
- Collins, I.F. The Concept of Stored Plastic Work or Frozen Elastic Energy in Soil Mechanics. Géotechnique 2005, 55, 373–382. [Google Scholar] [CrossRef]
- Collins, I.F.; Muhunthan, B.; Tai, A.T.T.; Pender, M.J. The Concept of a ‘Reynolds–Taylor State’ and the Mechanics of Sands. Géotechnique 2007, 57, 437–447. [Google Scholar] [CrossRef]
- Einav, I. Breakage Mechanics—Part I: Theory. J. Mech. Phys. Solids 2007, 55, 1274–1297. [Google Scholar] [CrossRef]
- Ueng, T.-S.; Chen, T.-J. Energy Aspects of Particle Breakage in Drained Shear of Sands. Géotechnique 2000, 50, 65–72. [Google Scholar] [CrossRef]
- Sun, Y.; Xiao, Y.; Ji, H. Dilation and Breakage Dissipation of Granular Soils Subjected to Monotonic Loading. Acta Mech. Sin. 2016, 32, 1065–1074. [Google Scholar] [CrossRef]
- Jefferies, M. Plastic Work and Isotropic Softening in Unloading. Géotechnique 1997, 47, 1037–1042. [Google Scholar] [CrossRef]
- Chang, C.S.; Deng, Y. Energy Equation and Stress–Dilatancy Relationship for Sand. Acta Geotech. 2022, 17, 2675–2696. [Google Scholar] [CrossRef]
- Collins, I.F.; Kelly, P.A. A Thermomechanical Analysis of a Family of Soil Models. Géotechnique 2002, 52, 507–518. [Google Scholar] [CrossRef]
- Wan, R.; Nicot, F.; Darve, F. Micromechanical Formulation of Stress Dilatancy as a Flow Rule in Plasticity of Granular Materials. J. Eng. Mech. 2010, 136, 589–598. [Google Scholar] [CrossRef]
- Hanley, K.J.; Huang, X.; O’Sullivan, C. Energy Dissipation in Soil Samples during Drained Triaxial Shearing. Géotechnique 2018, 68, 421–433. [Google Scholar] [CrossRef]
- Liu, Y.; Liu, X.; Ren, J. Effect of Particle Shape on Contact Network and Shear-Induced Anisotropy of Granular Assemblies: A DEM Perspective. J. Geotech. Geoenviron. Eng. 2024, 150, 04023142. [Google Scholar] [CrossRef]
- Lemaitre, J.; Chaboche, J.L. Mechanics of Solid Materials; Cambridge University Press: Cambridge, UK, 1990; ISBN 9780521328535. [Google Scholar]
- Houlsby, G.T.; Puzrin, A.M. A Thermomechanical Framework for Constitutive Models for Rate-Independent Dissipative Materials. Int. J. Plast. 2000, 16, 1017–1047. [Google Scholar] [CrossRef]
- Jefferies, M.G. Nor-Sand: A Simle Critical State Model for Sand. Géotechnique 1993, 43, 91–103. [Google Scholar] [CrossRef]
- Yang, H.; Sinha, S.K.; Feng, Y.; McCallen, D.B.; Jeremić, B. Energy Dissipation Analysis of Elastic–Plastic Materials. Comput. Methods Appl. Mech. Eng. 2018, 331, 309–326. [Google Scholar] [CrossRef]
- Schofield, A.N.; Wroth, C.P. Critical State Soil Mechanics; McGraw-Hill: Maidenhead, UK, 1968. [Google Scholar]
- Burland, J.B.; Roscoe, K.H. Local Strains and Pore Pressures in a Normally Consolidated Clay Layer During One-Dimensional Consolidation. Géotechnique 1969, 19, 335–356. [Google Scholar] [CrossRef]
- Gutierrez, M.; Wang, J. Non-Coaxial Version of Rowe’s Stress-Dilatancy Relation. Granul. Matter 2009, 11, 129–137. [Google Scholar] [CrossRef]
- Goddard, J.D.; Bashir, Y.M. On Reynolds Dilatancy. In Recent Developments in Structured Continua; Longman: New York, NY, USA, 1990; Volume 2, pp. 25–35. [Google Scholar]
- Vermeer, P.A.; de Borst, R. Non-Associated Plasticity for Soils, Concrete and Rock. HERON 1984, 29, 3. [Google Scholar]
- Norris, G.; Siddharthan, R.; Zafir, Z.; Madhu, R. Liquefaction and Residual Strength of Sands from Drained Triaxial Tests. J. Geotech. Geoenviron. Eng. 1997, 123, 220–228. [Google Scholar] [CrossRef]
- Yilmaz, Y.; Deng, Y.; Chang, C.S.; Gokce, A. Strength–Dilatancy and Critical State Behaviours of Binary Mixtures of Graded Sands Influenced by Particle Size Ratio and Fines Content. Géotechnique 2023, 73, 202–217. [Google Scholar] [CrossRef]
- Tordesillas, A.; Walsh, S.D.C. Analysis of Deformation and Localization in Thermomicromechanical Cosserat Models of Granular Media. In Powders and Grains 2005, Two Volume Set; CRC Press: Boca Raton, FL, USA, 2005; ISBN 978-0-429-10773-3. [Google Scholar]
- Chang, C.S.; Hicher, P.-Y. An Elasto-Plastic Model for Granular Materials with Microstructural Consideration. Int. J. Solids Struct. 2005, 42, 4258–4277. [Google Scholar] [CrossRef]
- Misra, A.; Chang, C.S. Effective Elastic Moduli of Heterogeneous Granular Solids. Int. J. Solids Struct. 1993, 30, 2547–2566. [Google Scholar] [CrossRef]
- Agnolin, I.; Jenkins, J.T.; Ragione, L.L. A Continuum Theory for a Random Array of Identical, Elastic, Frictional Disks. Mech. Mater. 2006, 38, 687–701. [Google Scholar] [CrossRef]
- Nova, R. A Constitutive Model under Monotonic and Cyclic Loading. In Soil Mechanics—Transient and Cyclic Loads; John Wiley & Sons Ltd.: New York, NY, USA, 1982; pp. 343–373. [Google Scholar]
- Wan, R.G.; Guo, P.J. A Pressure and Density Dependent Dilatancy Model for Granular Materials. Soils Found. 1999, 39, 1–11. [Google Scholar] [CrossRef]
- Sun, Y.; Sumelka, W.; Gao, Y.; Nimbalkar, S. Phenomenological Fractional Stress–Dilatancy Model for Granular Soil and Soil-Structure Interface under Monotonic and Cyclic Loads. Acta Geotech. 2021, 16, 3115–3132. [Google Scholar] [CrossRef]
- Wu, E.; Guo, W.; Li, N.; Jiang, P.; Wang, W.; Sun, Y. Stress-Fractional Modelling of Dilatancy Behavior under Monotonic Loading Based on a New Yield Surface of Coarse-Grained Soil. Int. J. Plast. 2025, 185, 104236. [Google Scholar] [CrossRef]
- Lin, W.; Liu, A.; Mao, W.; Koseki, J. Acoustic Emission Characteristics of a Dry Sandy Soil Subjected to Drained Triaxial Compression. Acta Geotech. 2020, 15, 2493–2506. [Google Scholar] [CrossRef]
- Smith, A.; Dixon, N. Acoustic Emission Behaviour of Dense Sands. Géotechnique 2019, 69, 1107–1122. [Google Scholar] [CrossRef]
- Roux, J.-N. Geometric Origin of Mechanical Properties of Granular Materials. Phys. Rev. E 2000, 61, 6802–6836. [Google Scholar] [CrossRef]
- Xiao, Y.; Liang, F.; Zhang, Z.; Wu, H.; Liu, H. Thermodynamic Constitutive Model for Granular Soils Considering Particle Shape Distribution. Comput. Geotech. 2023, 162, 105700. [Google Scholar] [CrossRef]
- Collins, I.F.; Hilder, T. A Theoretical Framework for Constructing Elastic/Plastic Constitutive Models of Triaxial Tests. Int. J. Numer. Anal. Methods Geomech. 2002, 26, 1313–1347. [Google Scholar] [CrossRef]
- Bai, B.; Zhang, B.; Chen, H.; Chen, P. A Novel Thermodynamic Constitutive Model of Coarse-Grained Soils Considering the Particle Breakage. Transp. Geotech. 2025, 50, 101462. [Google Scholar] [CrossRef]
- Yu, F. Particle Breakage and the Drained Shear Behavior of Sands. Int. J. Geomech. 2017, 17, 04017041. [Google Scholar] [CrossRef]
- Yao, T.; Cao, Z.; Li, W. On the Mechanical Behaviour of a Coral Silt from the South China Sea. Géotechnique 2024, 75, 698–711. [Google Scholar] [CrossRef]
- Hassanlourad, M.; Salehzadeh, H.; Shahnazari, H. Dilation and Particle Breakage Effects on the Shear Strength of Calcareous Sands Based on Energy Aspects. Int. J. Civ. Eng. 2008, 6, 108–119. [Google Scholar]
- Qi, Y.; Huang, J.J.; Chen, M.X. Energy Dissipation Characteristics of Crushable Granules under Dynamic Excitations. Chin. J. Theor. Appl. Mech. 2014, 47, 252–259. [Google Scholar]
- Hardin, B.O.; Drnevich, V.P. Shear Modulus and Damping in Soils: Design Equations and Curves. J. Soil Mech. Found. Div. 1972, 98, 667–692. [Google Scholar] [CrossRef]
- Collins, I.F.; Houlsby, G.T. Application of Thermomechanical Principles to the Modelling of Geotechnical Materials. Proc. Math. Phys. Eng. Sci. 1997, 453, 1975–2001. [Google Scholar] [CrossRef]
- Dewers, T.A.; Issen, K.A.; Holcomb, D.J.; Olsson, W.A.; Ingraham, M.D. Strain Localization and Elastic-Plastic Coupling during Deformation of Porous Sandstone. Int. J. Rock Mech. Min. Sci. 2017, 98, 167–180. [Google Scholar] [CrossRef]
Disclaimer/Publisher’s Note: The statements, opinions and data contained in all publications are solely those of the individual author(s) and contributor(s) and not of MDPI and/or the editor(s). MDPI and/or the editor(s) disclaim responsibility for any injury to people or property resulting from any ideas, methods, instructions or products referred to in the content. |
© 2025 by the authors. Licensee MDPI, Basel, Switzerland. This article is an open access article distributed under the terms and conditions of the Creative Commons Attribution (CC BY) license (https://creativecommons.org/licenses/by/4.0/).