Abstract
Understanding rockfall behavior is essential for accurately predicting hazards in both natural and engineered environments, yet prior research has predominantly focused on spherical rocks or single-impact scenarios, leaving critical gaps in highlighting the dynamics of non-spherical rocks and multiple impacts. This study addresses these shortcomings by investigating the influence of rock shape and release angle on motion, energy dissipation, and impact behavior. To achieve this, an innovative approach rooted in the Video-Assisted Rockfall Kinematics Analysis (VARKA) procedure was introduced, integrating a custom-designed apparatus, controlled experimental setups, and sophisticated data analysis techniques. Experiments utilizing a pendulum-based release system analyzed various scenarios involving different rock shapes and release angles. These tests provided comprehensive motion data for multiple impacts, including trajectories, translational and angular velocities, and the coefficient of restitution (COR). Results revealed that non-spherical rocks exhibited significantly more erratic trajectories and greater variability in COR values compared to spherical rocks. The experiments demonstrated that ellipsoidal and octahedral shapes had substantially higher variability in runout distances than spherical rocks. COR values for ellipsoidal shapes spanned a wide range, in contrast to the tighter clustering observed for spherical rocks. These findings highlight the pivotal influence of rock shape on lateral dispersion and energy dissipation, reinforcing the need for data-driven approaches to enhance and complement traditional physics-based predictive models.
1. Introduction
Rockfall events present significant hazards in both natural and engineered environments, posing risks to infrastructure, human safety, and natural landscapes. In the mining industry, rockfall incidents compromise worker safety and disrupt operations, resulting in substantial economic and social consequences. Incident reports from the National Institute for Occupational Safety and Health (NIOSH) highlight the prevalence and impact of these events, underscoring their persistent nature and the necessity for targeted interventions.
An analysis of incident data from the NIOSH since 2002 shows that falling rock is a significant contributor to mining-related injuries annually. These incidents highlight the persistent and critical nature of this hazard, with injuries from falling rock consistently ranking among the leading causes of harm in surface mining operations (Figure 1).
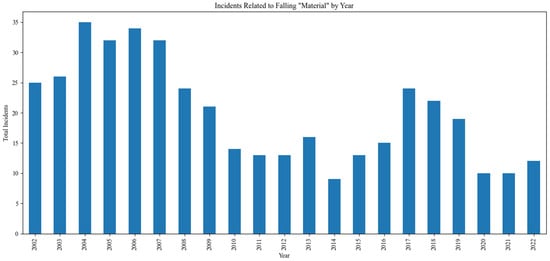
Figure 1.
Annual number of injuries attributed to falling, rolling, or sliding rock and falls of ground in surface mining operations per the NIOSH.
In recent years, the percentage of mining injuries caused by falling material has increased compared to the total number of recorded mining incidents (Figure 2). These findings emphasize the importance of prioritizing efforts to understand and mitigate rockfall hazards.
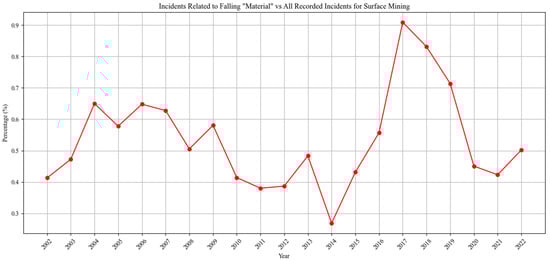
Figure 2.
Percentage of mining incidents caused by falling rock compared to total recorded mining incidents per the NIOSH.
The current study focuses on the factors influencing rockfall dynamics, including trajectory, velocity, and dispersion, as these are essential for effective hazard mitigation and risk management. In mining environments, where workers operate near unstable rock masses, accurately predicting the dynamics of rockfalls is critical for ensuring safety and operational continuity. Understanding how variables such as shape, release angles, and energy dissipation from multiple impacts influence rockfall behavior can enhance predictive models and guide more effective risk mitigation strategies.
Rockfall hazards are influenced by various factors, including geological structures, slope geometry, rock mass properties, and joint orientations. Among these, the shape of rock fragments, their release angles, and the energy dissipation during multiple impacts are particularly critical, as they significantly affect the trajectory, velocity, and dispersion of falling rocks. Investigating these factors is essential for developing accurate predictive models and effective risk mitigation strategies in environments such as surface mining operations, where workers are exposed to unstable rock masses [1]. Recognizing the importance of these variables, this study focuses on the most influential factors, rock shape, release angles, and energy dissipation, to deepen our understanding of rockfall behavior. By addressing these aspects in detail, the research lays the groundwork for advancing methodologies that can more accurately analyze and predict rockfall dynamics, ultimately contributing to improved safety and hazard management practices. This approach aligns with previous research emphasizing the need for the comprehensive analysis of rockfall mechanics to enhance hazard assessment and mitigation efforts.
This paper is structured as follows. First, a review of related research is presented, identifying knowledge gaps, and outlining the study’s aims and contributions. Section 2 describes the methodology, including apparatus design, sample preparation, and motion-tracking techniques. Section 3 presents the results, focusing on trajectories, velocities, the COR, and runout variability. Finally, Section 4 concludes with key findings, implications, and future research directions.
1.1. Review of Related Research
Rockfall research has advanced over the decades, driven by the critical need to understand the mechanics of these natural hazards and develop effective mitigation strategies. The extensive body of work in this field can be broadly classified into four interconnected approaches: experimental, numerical, theoretical, and data-driven. Each category offers a distinct perspective, collectively enhancing our understanding of rockfall dynamics, improving trajectory prediction, and informing hazard management. The progress made in these domains is presented in a cohesive narrative of the methodologies, findings, and their contributions to addressing the challenges posed by rockfalls.
1.1.1. Experimental Approach
Experimental studies have been instrumental in advancing the understanding of rockfall dynamics, offering critical insights into the factors that influence motion and impact behavior. Through a combination of laboratory experiments, field observations, and numerical simulations, this body of research has significantly contributed to the development of more accurate predictive models and effective hazard mitigation strategies.
Rock shape and size emerge as critical factors affecting trajectories and impact dynamics. Yan et al. (2020) employed a 3D physics-based model using shape descriptors like sphericity and convexity to simulate rockfall trajectories across varied terrains, capturing the nuances of contact mechanics and rigid body interactions [2]. Complementing this, Wong & Tang (2023) analyzed circular, elliptical, and cubic shapes to develop predictive models for single-impact events, while Nagendran & Ismail (2019) investigated the interplay between size, shape, and surface properties on bounce height and runout distances through laboratory experiments and simulations [3,4]. Shiyake et al. (2022) extended this work by applying 2D discrete element methods to angular polygonal particles, illustrating how corner sharpness and elongation affect motion and runout [5].
Substrate-focused studies have further elucidated impact dynamics. Zhu et al. (2021) used Particle Flow Code (PFC) simulations to show how gravel cushion parameters, such as thickness and particle size, mitigate impact forces [6]. Similarly, Wright et al. (2022) examined the influence of granular substrate grain size on projectile dynamics, demonstrating its effects on deflection angles and restitution coefficients [7]. Field investigations, such as those carried out by Volkwein et al. (2018), revealed the influence of block shape and starting position on runout distances and trajectories, while Pfeiffer (1989) provided real-world observations on rockfall behavior during the construction of Colorado’s Highway I-70 [8,9].
Release angles and rotational dynamics are also central to understanding rockfall motion. Ushiro & Tsutsui (2001) categorized rockfall behaviors into rolling and freefall through experiments on natural slopes, highlighting the impact of slope geography on motion [10]. Ji et al. (2021) introduced the impact posture coefficient to capture how rotational speed influences restitution coefficients, particularly for larger blocks [11]. Chau et al. (2002) explored the coefficient of restitution for spherical plaster boulders, finding correlations between slope angle and normal restitution coefficients, while Asteriou et al. (2012) demonstrated how block shape and hardness influence rebound angles and trajectory patterns using geological materials like marble and schist [12,13].
Innovative experimental techniques have enhanced precision in analyzing rockfall dynamics. High-speed cameras and custom apparatuses, as utilized by Bi et al. (2021) and Asteriou and Tsiambaos (2018), enabled the linking of initial velocities and slope angles to energy dissipation and trajectory changes [14,15]. Ge et al. (2024) integrated 3D point cloud reconstructions with Particle Image Velocimetry (PIV) to investigate sphericity and volume filling rates on velocity and runout [16]. Shadabfar et al. (2022) advanced the field by combining simulations, machine learning, and Bayesian models to examine the effects of rock size and shape on energy loss [17]. Krengel et al. (2024) added to this understanding by using 2D polygonal simulations and dice experiments to demonstrate the influence of particle shape and orientation on kinematics [18].
1.1.2. Numerical and Theoretical Approach
Numerical modeling and theoretical frameworks have significantly advanced the understanding of rockfall dynamics, providing sophisticated tools to simulate complex events and bridge theoretical insights with practical applications, which provides a robust foundation for developing more accurate simulations and effective hazard mitigation strategies.
Chen et al. (2022) introduced the Energy Tracking Method (ETM) to analyze energy interactions during rock-slope collisions, offering valuable insights into optimizing protective structures by examining energy shifts caused by restitution, friction, and fragmentation [19]. Francioni et al. (2020) complemented these efforts by integrating unmanned aerial vehicle (UAV) imagery and Discrete Fracture Network (DFN) modeling to incorporate fracture intensity into simulations, improving the realism of block volume distributions and advancing slope stability analysis [20].
Theoretical studies have further enriched numerical advancements by providing refined models of rockfall mechanics. T. Chen et al. (2023) utilized viscoelastic contact theory to predict collision dynamics and inform protective design parameters, focusing on time-history impact loads [21]. However, their reliance on spherical rock approximations underscored the limitations of such simplifications in representing real-world scenarios. Prades-Valls et al. (2022) expanded on this by exploring fragmentation effects and tracking individual fragments to demonstrate how energy and momentum transfer evolve during impacts, thus enhancing the realism of rockfall modeling [22].
1.1.3. Data-Driven Approach
Data-driven methods, particularly those utilizing machine learning and statistical analyses, have revolutionized rockfall research by offering powerful tools to detect hazards, predict trajectories, and assess risks comprehensively. Leveraging large datasets and advanced computational models, these approaches address the complexities of rockfall behavior with unprecedented precision and efficiency. Farmakis et al. (2022) applied deep learning models like PointNet and PointNet++ to detect slope deformations using five years of LiDAR data, achieving high accuracy but facing challenges in generalizing across varied terrains [23]. Building on this, Farmakis et al. (2023) employed 3D computer vision and deep learning to model rockfall susceptibility, successfully identifying source zones and simulating slope-scale hazards [24].
In open-pit mines, Senanayake et al. (2024) demonstrated the effectiveness of machine learning for hazard prediction by generating synthetic datasets of rockfall trajectories and employing probabilistic simulations, emphasizing the critical role of slope geometry in enhancing safety protocols [25]. Similarly, Fanos & Pradhan (2019) combined machine learning with GIS applications to identify rockfall source areas using ensemble models and Ant Colony Optimization, improving the precision of hazard assessments for shallow landslides and debris flows [26].
Machine learning has also been used to develop predictive models for runout distances. Huang et al. (2019) employed an improved K-nearest neighbor (KNN) algorithm in shaking table tests, linking block mass and shape to runout behavior and providing reliable tools for protective range estimations during earthquakes [27]. Meanwhile, Blanco et al. (2022) refined clustering algorithms and introduced new classification features for automated rockfall detection in Spain’s Montserrat Massif, achieving high precision in event identification [28].
Statistical analyses have complemented these data-driven techniques. Dussauge-Peisser et al. (2002) analyzed rockfall inventories across diverse geological settings, applying power–law distributions to rockfall volume patterns, thereby establishing a robust probabilistic framework for long-term risk assessment and hazard prediction [29].
Together, these data-driven approaches, integrating machine learning, GIS, and statistical tools, have enhanced predictive capabilities and hazard management in rockfall research. They offer transformative potential for proactive mitigation strategies and a deeper understanding of rockfall dynamics.
1.2. Knowledge Gap Analysis and Study Objectives
The existing body of rockfall research has advanced our understanding of rockfall dynamics and hazard prediction. However, several gaps remain, offering opportunities for further investigation. Experimental studies have traditionally focused on controlled environments, often emphasizing initial impact dynamics under simplified conditions. While these studies provide precision and control, they leave room to explore additional variables such as rock shape, release angle, and the cumulative effects of multiple impacts, factors that are essential for capturing the complexities of natural rockfalls.
Theoretical models, although effective in providing frameworks for predicting rockfall behavior, often rely on simplifying assumptions, such as spherical shapes and idealized slope geometries. These assumptions facilitate analytical solutions but fall short in accounting for the erratic behavior of irregular shapes and the influence of multi-impact scenarios. Similarly, numerical simulations have advanced to model increasingly complex dynamics but still require refinement to capture the full diversity of rock shapes, material properties, and impact interactions observed in real-world conditions.
Data-driven approaches, including machine learning and artificial intelligence, have emerged as promising tools for rockfall prediction, excelling in leveraging large datasets to identify rockfall-prone areas and predict runout distances. However, these methods often face challenges in adapting to diverse terrains or conditions beyond their training datasets and in providing the physical interpretability of the underlying rockfall mechanisms.
This study addresses these gaps by introducing Video-Assisted Rockfall Kinematics Analysis (VARKA), a novel experimental methodology designed to investigate the interplay between rock shape, release angle, and multi-impact dynamics. Using a custom-designed experimental setup, VARKA combines precise control mechanisms with advanced motion tracking to analyze the behavior of three distinct concrete rock shapes, spherical, ellipsoidal, and octahedral, tested at two release angles (15° and 30°). The innovative release mechanism ensures consistent initial conditions, while high-speed cameras capture detailed motion data, enabling the analysis of cumulative effects on metrics such as trajectory, velocities, runout distance, and the COR.
By systematically exploring the influence of non-spherical shapes and controlled initial conditions, this study provides valuable insights into the variability of rockfall trajectories and energy dissipation. Although conducted at a laboratory scale, the findings contribute to bridging the gap between controlled experimentation and real-world applications, enhancing predictive models, and supporting the design of more effective hazard mitigation measures.
2. Methodology
The flowchart in Figure 3 outlines the procedure developed by the University of Nevada, Reno (UNR) Mine Automation Lab to study the effects of rock shape and release angle on rockfall dynamics. This systematic approach, referred to as VARKA, has been developed through four phases, including problem definition, innovative test apparatus design, controlled experimentation, and data analysis, to simulate rockfall scenarios under laboratory conditions. The methodology focuses on understanding how variations in shape and release conditions affect rockfall motion, energy dissipation, and impact behavior.
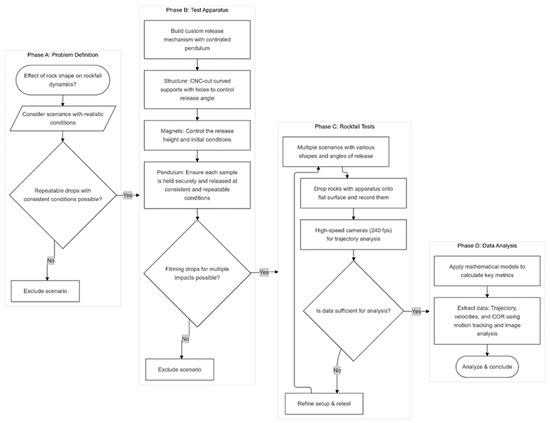
Figure 3.
Flowchart detailing the VARKA workflow for studying rockfall dynamics using a novel release system and motion analysis [30].
The process begins with Phase A, Problem Definition, where the research question is established: how do rock shape and release angle impact rockfall dynamics? Scenarios are considered with realistic conditions, and scenarios lacking repeatable, consistent testing conditions are excluded.
Phase B, the Test Apparatus, involves designing a custom apparatus to ensure controlled and repeatable rockfall experiments. A pendulum-based release mechanism is built with CNC-cut curved supports to control the release angle. Electromagnets allow for precise control of the release height and ensure consistent initial conditions. Adjustable configurations enable testing at predefined angles. Scenarios that cannot support high-quality, repeatable filming are excluded at this stage.
Phase C, the Rockfall Tests, includes experimental trials using various rock shapes and release angles. The tests are conducted on flat surfaces, with high-speed cameras (240 fps) recording trajectories and multiple impacts. Six combinations of rock shapes (spherical, ellipsoidal, and octahedral) and release angles (e.g., 15° and 30°) are tested. If the data collected is insufficient for analysis, the setup is refined and retested.
Finally, Phase D, Data Analysis, applies mathematical models and image processing techniques to the recorded video data. Key metrics such as trajectory, velocities (translational and angular), and the COR are extracted. This comprehensive analysis provides quantitative insights into the lateral dispersion, energy dissipation, and motion variability of the rockfall scenarios, answering the central research question and linking observed behaviors to the geometric and angular variables.
The structured approach ensures a thorough investigation into the dynamics of rockfall motion, leveraging innovative tools and a rigorous experimental design to produce meaningful insights.
2.1. Experimental Setup
The testing apparatus and experimental procedure employed in this study were developed with precision and functionality at their core, allowing researchers to explore rockfall dynamics under controlled conditions. The apparatus integrates custom-designed components to simulate rockfall events while maintaining repeatable initial conditions and enabling detailed motion tracking for subsequent analysis.
The core of the testing apparatus is the pendulum arm, a mechanism designed to control the release of rock samples with high precision. The pendulum arm incorporates an electromagnet that holds it securely in place before release, ensuring consistent initial heights for all experiments. The arm’s motion is restricted by a stop bar, which dictates the angle of release. This stop bar can be positioned at various predefined angles, thanks to CNC-machined curved wooden supports with holes drilled at 5-degree intervals. The precise placement of the stop bar enables fine-tuned control of the pendulum’s release conditions, a critical factor in replicating impact scenarios (Figure 4 and Figure 5).
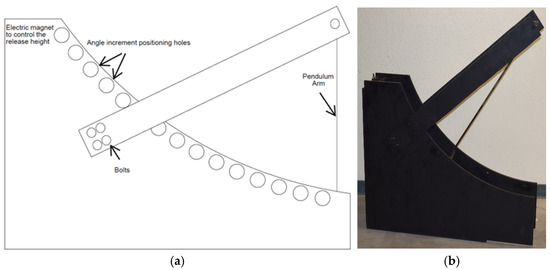
Figure 4.
(a) The measurements for the designed pendulum [7]. (b) The release pendulum.
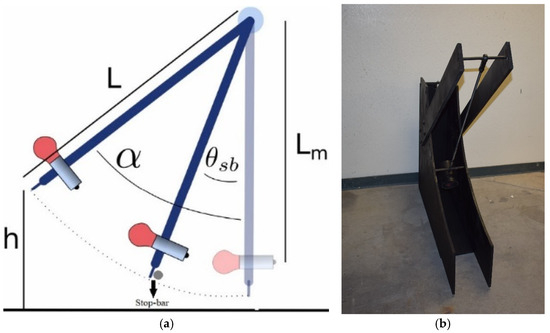
Figure 5.
(a) The schematics of the designed release system. (b) The release system.
Unique to this apparatus is the mechanism for holding and releasing the rock samples. A magnetized tube at the pendulum’s tip securely holds each rock until the pendulum reaches the stop bar during its swing. At this point, the rock is released, replicating the dynamic behavior of rockfalls with a controlled initial velocity and release angle. Table 1 details the properties of the release mechanism design demonstrated in Figure 4.

Table 1.
The release mechanism’s characteristics.
Concrete rock samples were prepared using 3D-printed molds (Figure 6) that ensured consistency in geometry and size. These molds allowed for the precise casting of three distinct shapes, capturing common geometries found in natural rockfall scenarios.
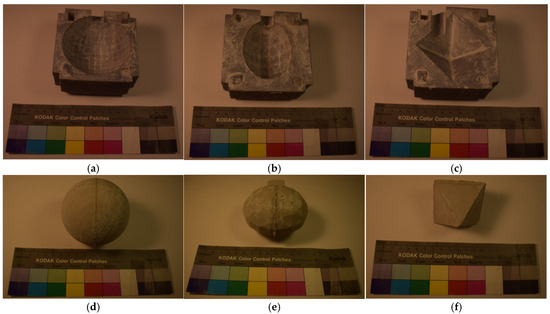
Figure 6.
(a–c) The 3D-printed molds for spherical, ellipsoidal, and octahedral rock shapes, respectively; (d–f) the corresponding concrete samples cast from the molds, used in the tests.
The preparation of the concrete mix and the resulting physical properties of the samples are summarized in Table 2, ensuring consistency across all tests.
Table 2.
The summary of the material properties used for sample preparation.
Table 3 also summarizes the dimensions and the average weight of the samples used in the experiments. For the spherical samples, the radius of the sample is listed while for the ellipsoidal, the three axes of the sample are measured, and finally, the octahedral is represented by its edge length.
Table 3.
The sample properties used in the experiments.
Finally, high-speed video recording was an integral part of the procedure. Two Sony Cyber-shot DSC-RX0 II cameras (Tokyo, Japan) were strategically positioned to record both front and side views of each test. The cameras operated at 240 frames per second, allowing for the detailed capture of the rocks’ trajectories and behaviors during impacts. This dual-view setup provided a comprehensive dataset, with the recordings analyzed to extract precise motion parameters. Motion tracking enabled the researchers to calculate translational and angular velocities, trajectory path lengths, and other critical metrics necessary for understanding the rockfall behavior.
2.2. Image Analysis and Motion Tracking
High-speed video recordings of rockfall experiments were analyzed using image processing and motion tracking techniques to understand the dynamics of rock motion, including trajectory, velocities, energy dissipation, and runout distances. This analysis relied on a structured methodology that integrates calibration, object detection, motion tracking, and detailed kinematic evaluation, ensuring accurate and repeatable results.
The high-speed video recordings, captured at 240 frames per second, were first divided into individual frames, each representing a time step of Δt = 1/240 s. Calibration was performed using a reference object of known size visible in the video frames, converting pixel-based measurements into real-world units. The calibration matrix transformed pixel coordinates (x, y) into physical coordinates (X, Y) using a scaling factor [31]:
where sx is the horizontal scaling factor. The vertical coordinate Y was calculated similarly, using a separate scaling factor sy. Moving objects were detected by subtracting a static background image from each video frame to highlight regions of motion. A thresholding step was applied to create a binary mask, isolating the moving regions. Noise in the binary image was reduced using median filtering, and object edges were refined using the Canny edge detector.
The centroids of detected objects, representing their centers of mass, were calculated from the binary mask. For instance, the horizontal centroid Cx was determined using the following equation [31]:
where xi represents the pixel positions in the horizontal direction, and M(xi,yi) is the binary mask value at each pixel. The same formula was applied for the vertical direction Cy. Tracking the centroids across successive frames allowed trajectories to be determined. Predictive filtering algorithms, such as the Kalman filter, were used to improve the robustness of the tracking, particularly when motion was erratic. The Kalman filter employed a prediction step and a correction step to refine the estimated positions of the centroids based on prior motion trends. From the tracked positions, kinematic parameters such as velocities and accelerations were extracted using standard physics equations [31].
The COR, along with lateral dispersion and runout distances, provided a detailed assessment of how rock shape and release angle influenced energy dissipation and travel behavior. Each test also included an analysis of multiple impacts, enabling the study of cumulative energy losses and trajectory changes over successive rebounds. Velocity vectors were overlaid on the trajectories to visualize changes in speed and direction during the motion. Path length measurements quantified the total distance traveled by each rock.
2.3. Equations Governing the Bouncing Behavior
The COR for rockfalls is a dimensionless parameter that quantifies the elastic properties of collisions between falling rocks and the surface they impact. Specifically, it measures the ratio of the relative velocity after the collision to the relative velocity before the collision. Mathematically, the normal COR is defined as follows [32]:
The vertical component of the rock’s velocity after an impact vfN and before an impact viN determines the COR, which indicates the proportion of kinetic energy retained or lost during impact. A COR value of 1 represents a perfectly elastic collision, while 0 indicates a perfectly inelastic collision. However, under certain conditions, such as specific impact angles or rock geometries, the COR can exceed 1 when the post-impact speed in one direction surpasses the pre-impact speed. Figure 7 shows changes in the normal velocity during impact for two identical, non-spherical, and eccentric impacts concerning mass and impact translational velocity (impulse). The only difference between the two is the impact angle (θi). The dashed lines show the change in vN from a negative value acting toward the slope at t = i to 0 at the impact, and then a positive velocity acting away from the slope at t = f [32].
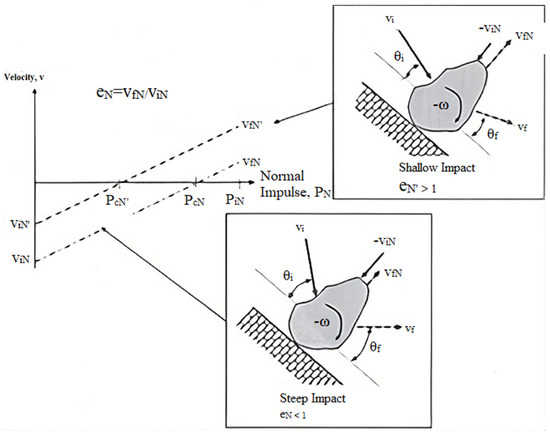
Figure 7.
The effect of impact angle on the normal COR [32].
Moreover, the erratic behavior of non-spherical concrete samples upon impact can be explained by examining how their shape influences force distributions, torques, and resulting motions. The force–momentum equation is described as where M is the mass of the sample, F and N are horizontal and vertical forces, and vx and vy are the respective velocities. These equations describe the forces’ effect on changes in horizontal and vertical velocities during impact. The torque–momentum equation, , links the forces and torques acting on the sample to its rotational motion. Here, Icm is the moment of inertia around the center of mass, and ω represents angular velocity, helping explain how the sample spins and changes orientation upon impact. The change in rotational kinetic energy is expressed as , showing how rotational energy varies with changes in linear and angular velocities. X and Y are shape-dependent parameters that influence these dynamics. The horizontal velocity after impact depends on the initial conditions and the sample’s shape, governed by . The term MXY, which accounts for interactions between shape parameters and impact dynamics, is zero for spherical shapes but is significant for non-spherical ones. This distinction introduces additional complexity in non-spherical samples, causing erratic bounce directions and velocities due to varied inclinations and impact angles [33].
Finally, the impact velocity and angle, crucial for analyzing the sample’s behavior, are determined using and where dz is the freefall distance and veject is the velocity at release [7].
By applying these equations, one can explain why non-spherical rocks behave unpredictably upon impact. Their shape causes varied force distributions and rotational dynamics, leading to complex, often non-intuitive results, including changes in direction and speed that are not observed in spherical rocks.
3. Results and Discussion
The following outlines the results obtained from the laboratory experiments aimed at understanding the influence of rock shape and release angle on rockfall dynamics. Key metrics analyzed include the measured trajectories, translational and angular velocities, runout distances, and lateral dispersions observed during the tests. Additionally, the CORs for the different rock shapes and angles are examined in detail. Qualitative observations are made regarding the distinct behaviors exhibited by ellipsoidal, octahedral, and spherical rocks, demonstrating how their shapes and release angles contribute to varying motion patterns and impact responses. To establish a foundation for the results, an overview of the relevant mathematical equations will first be presented.
3.1. Data Analysis
To capture the dynamics of each test, the experiments were recorded from both a front and side view, enabling a comprehensive analysis of the rock’s trajectory and behavior upon impact. The motion-tracking software “Tracker v. 6” (Figure 8) was employed to extract detailed data on the rocks’ trajectories, translational and angular velocities, runout distances, etc. [31].
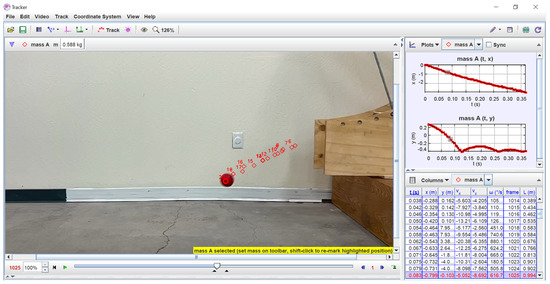
Figure 8.
Snapshot of the Tracker software during the analysis of one of the spherical samples at a release angle of 15° [31].
Two different release angles, 15° and 30°, were used to explore the effects of impact angle variation. For each rock shape and release angle, 25 trials were conducted, with data from these trials selected for detailed analysis. The experimental setup was consistent across all trials, with a controlled release mechanism ensuring the same impact angle and velocity. Nevertheless, data such as exact velocities and other measurements were obtained through video analysis to capture trial-specific variations.
3.2. Visualizing and Interpreting Rockfall Data
3.2.1. Trajectory Observations
By tracking the motion of each rock through video analysis, variations in trajectory were identified, highlighting the unpredictability observed, particularly for non-spherical shapes.
The figures below show the reconstructed trajectories from the lab-scale experiments, offering critical insight into how rock shape and release angle influence the variability and unpredictability of rockfall behavior. While other spatial metrics such as runout distance (x-axis) and lateral dispersion (z-axis) are analyzed in detail elsewhere in the study, these figures specifically focus on the temporal evolution of rebound behavior (y-axis) by using video frames as the horizontal axis. This approach allows for a clearer understanding of how each rock shape behaves dynamically upon and after impact. By analyzing side-view video footage of 25 drops for each of the three shapes at release angles of 15 (Figure 9) and 30 degrees (Figure 10), distinct patterns emerge in how each shape interacts with the surface upon impact. The plots illustrate the range and deviation of the trajectories over time, capturing key dynamics such as impact height, rebound behavior, and post-impact motion that are best represented in the time domain. Using frames instead of distance also avoids the need for additional data processing steps, which could introduce error, particularly for non-spherical shapes with complex rotational and translational dynamics.
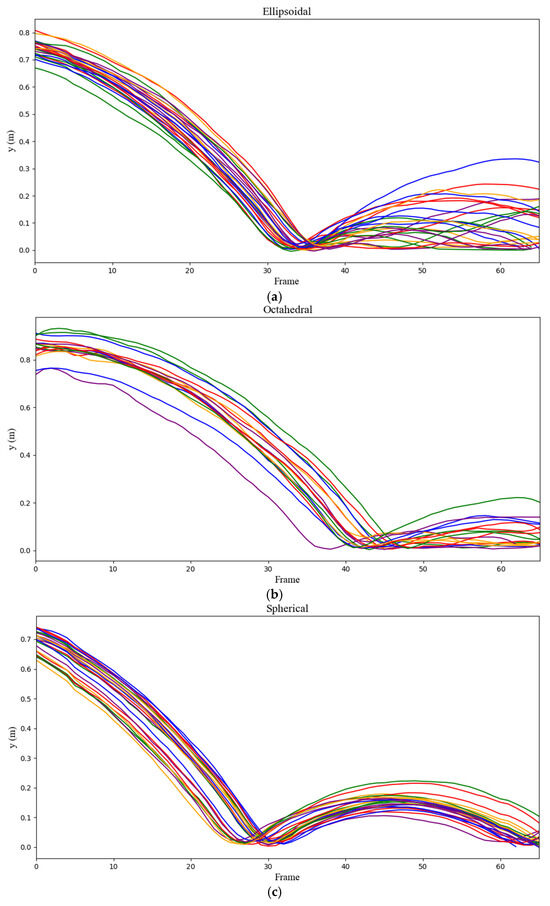
Figure 9.
The trajectories for (a) ellipsoidal, (b) octahedral, and (c) spherical rocks at the release angle of 15°.
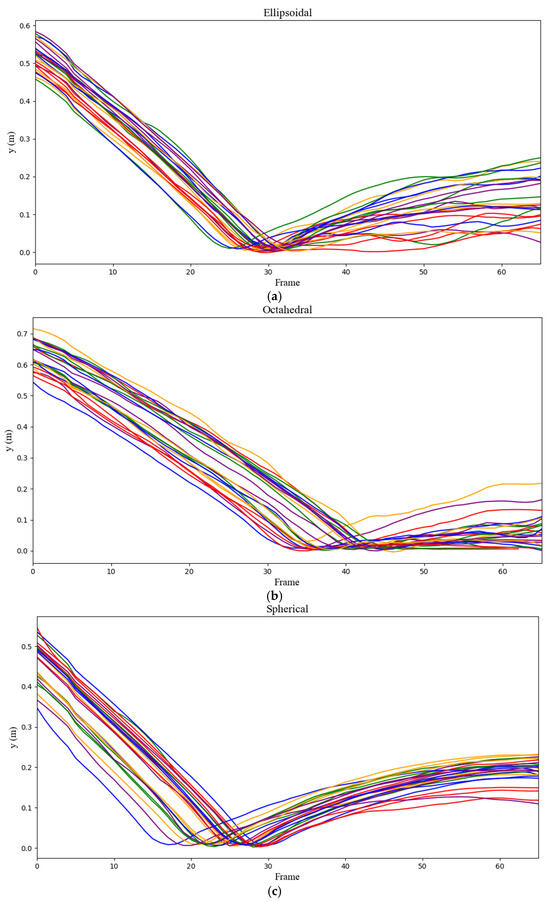
Figure 10.
The trajectories for (a) ellipsoidal, (b) octahedral, and (c) spherical rocks at the release angle of 30°.
The data reveal that shape has a significant impact on the consistency and predictability of the rock’s path, with certain shapes demonstrating greater variability in their landing positions. This approach highlights the deviations in trajectory, particularly focusing on how non-spherical shapes tend to exhibit more erratic movement, with larger variations in both translational and angular motion after impact. The six plots, grouped by shape and release angle, demonstrate the broad range of outcomes for each combination, emphasizing the unpredictability introduced by the geometry of the rocks.
While spherical rocks generally produce more consistent and predictable trajectories, ellipsoidal and octahedral shapes exhibit significantly more variation, particularly at the steeper 30-degree release angle. This analysis aims to explore how shape and release angle contribute to the variability and unpredictability of rockfall trajectories, rather than making direct comparisons between shapes. In the case of ellipsoidal rocks, slight oscillations sometimes appear in the recorded trajectories. These fluctuations are likely due to the challenges in tracking the center of mass as the rock rotates around its major or minor axis, which can momentarily shift the apparent path in the video analysis.
With non-spherical shapes exhibiting a wider spread of results, the notion that rock shape plays a significant role in influencing post-impact dynamics is reinforced.
3.2.2. Velocity Measurements
Building on the trajectory analysis, this Section delves into the kinematic properties of fallen rocks, focusing on the vertical component of translational velocity and angular velocity.
Both front-view and side-view video recordings were used to extract kinematic data. Translational velocity was determined by tracking the motion of the center of mass across frames, while angular velocity was measured using Tracker’s built-in protractor tool to assess rotational displacement over time. For each shape, the analysis aimed to capture variations in vertical motion and rotational speed after impact. The results highlight how these velocities differ across trials, illustrating the influence of rock geometry on energy distribution during rebound.
Interestingly, the non-spherical shapes, particularly at the 30-degree release angle, show a much wider spread in angular velocity compared to their spherical counterpart. This increased rotational variability is accompanied by noticeable differences in the vertical component of translational velocity, especially after the first impact. The ellipsoidal and octahedral shapes exhibit more erratic vertical velocity profiles, reflecting the complexity introduced by irregular geometries. Again, the key takeaway is not to draw direct comparisons between the shapes but to highlight the range and variability in velocity outcomes, driven by the combined effects of shape and release conditions.
Building on the trajectory analysis, this Section examines the kinematic properties of fallen rocks, specifically focusing on the vertical component of translational velocity and the angular velocity about the trajectory axis. These parameters were extracted from side-view video analysis, which captures rotation around the axis aligned with the direction of motion (y-axis in side-view). This component was selected due to its relevance to rebound behavior and its visibility in the experimental setup.
For the ellipsoidal samples, angular velocity fluctuates between topspin (negative values) and backspin (positive values), leading to a broad range in vertical translational velocity, from −2 m/s at impact to 1.5–2.5 m/s at rebound. This dual spin behavior contributes to the erratic rebound motion observed. Octahedral rocks exhibit a similar variation in spin, but with an even wider range of velocities, from −3 m/s at impact to −0.5 to 1 m/s at rebound, reflecting the irregularity of their shape and the unpredictability of their motion. In contrast, spherical samples show more consistent behavior, with mostly topspin and vertical velocities ranging from −2.5 m/s to 1 m/s, indicating a stable energy transfer during rebound (Figure 11).
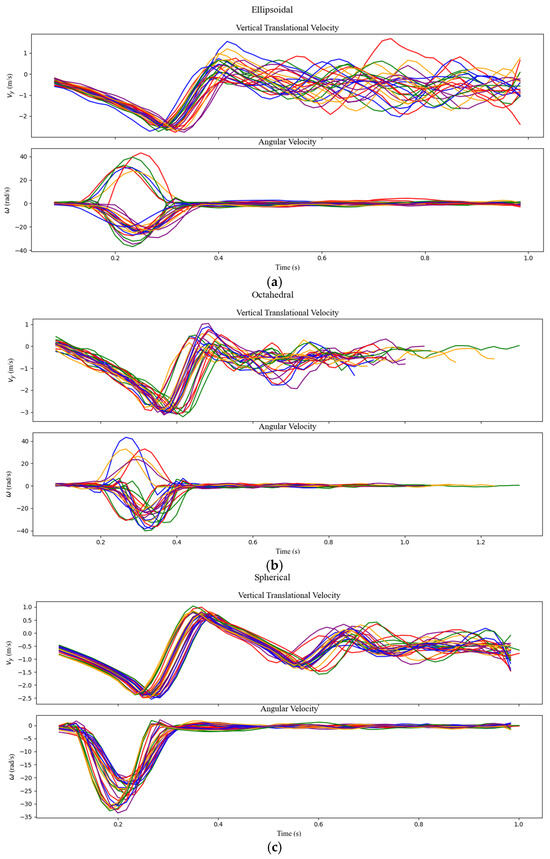
Figure 11.
Translation and angular velocity for (a) ellipsoidal, (b) octahedral, and (c) spherical rocks at the release angle of 15°.
At a 30° release angle, ellipsoidal samples consistently exhibit topspin, with vertical velocities ranging from −2.5 m/s at impact to −0.3 to 1 m/s at rebound. Octahedral samples display increased erratic behavior in both angular and translational velocities, while spherical samples maintain their consistent motion. Comparing 15° to 30°, the ellipsoidal samples show increased uniformity at steeper angles, octahedral rocks exhibit amplified unpredictability, and spherical samples continue to exhibit harmonious rebound behavior (Figure 12).
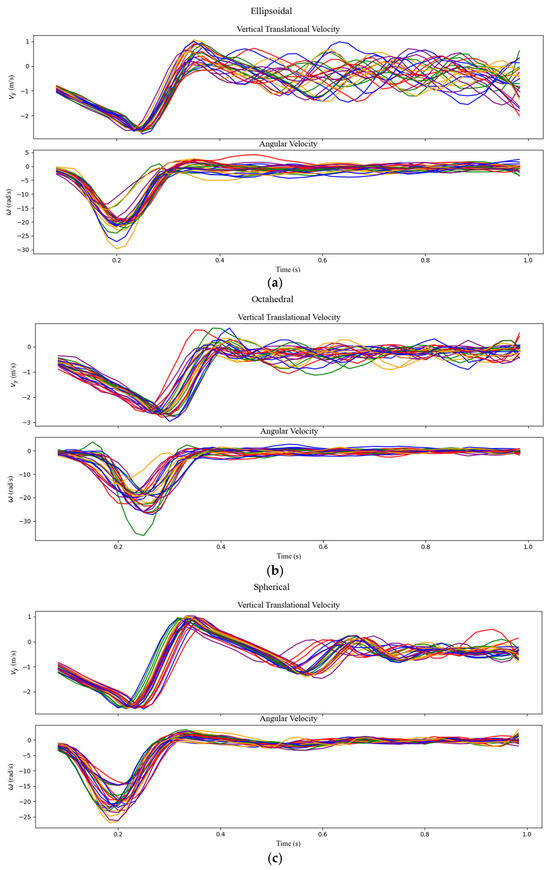
Figure 12.
Translation and angular velocity for (a) ellipsoidal, (b) octahedral, and (c) spherical rocks at the release angle of 30°.
3.2.3. Coefficient of Restitution
This Section uses violin plots (Figure 13 and Figure 14) to visualize and compare the distribution of normal COR values for the first and second impacts. The primary goal of these plots is to reveal how consistently each rock shape conserves energy upon impact. The violin plots not only show the central tendency but also the spread and variability of COR values. Spherical samples exhibit a narrow, tightly clustered distribution, indicating consistent rebound behavior. In contrast, the ellipsoidal and octahedral samples show much broader distributions, highlighting their irregular and less-predictable energy dissipation patterns. These differences underscore the influence of shape on impact dynamics.
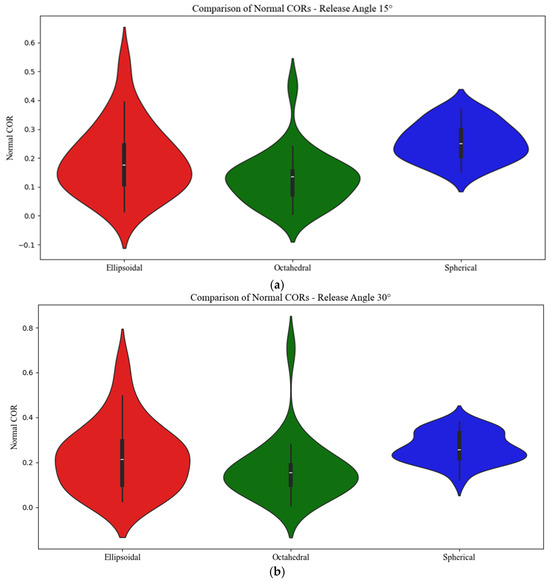
Figure 13.
The normal COR distribution during the first impact for different shapes at the release angles of (a) 15° and (b) 30°.
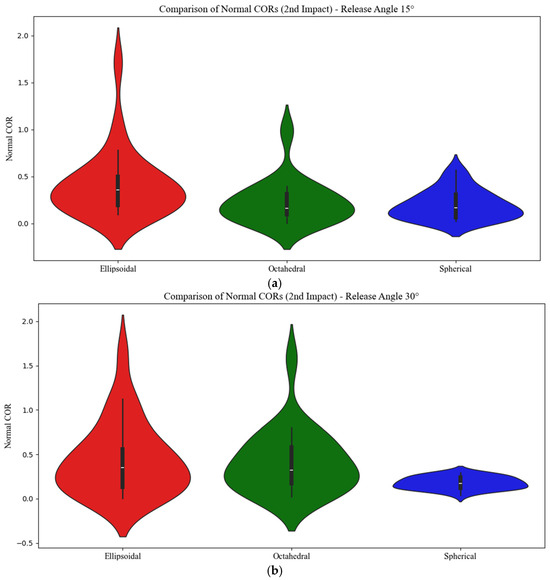
Figure 14.
The normal COR distribution during the second impact for different shapes at the release angles of (a) 15° and (b) 30°.
A notable observation for the ellipsoidal samples is that the normal COR values for the second impact sometimes exceed 1, indicating an energy transfer. This suggests that after the first impact, the translational velocity shifts from being predominantly horizontal to more vertical. Upon the second impact, a significant portion of this horizontal velocity is converted back into vertical velocity, causing the ellipsoidal rocks to rebound higher than expected. This phenomenon is particularly important when considering rockfall dynamics, as it could lead to unexpected jump heights after impacts, complicating protective measures in real-world scenarios.
For the third impacts (Figure 15) at the 15° release angle, not all samples experience a third impact, particularly the spherical ones, which often begin rolling after the second impact and do not rebound again. In contrast, nearly all ellipsoidal samples (where the point of contact, whether on a long face or an edge, significantly affects the outcome) and more than half of the octahedral samples do reach a third impact. Due to this uneven participation across shapes, a scatter plot is used to display the normal COR values. Developing a violin plot for the third impact would not be meaningful, as the limited number of samples, especially for the spherical shape, would not provide a reliable or representative distribution. This variability in impact conditions also leads to some ellipsoidal samples reversing their spin type after the first impact. At the 30° release angle, more octahedral and spherical samples reach the third impact compared to the 15° case, but the data remains incomplete across all shapes, so a scatter plot is again used instead of a violin plot.
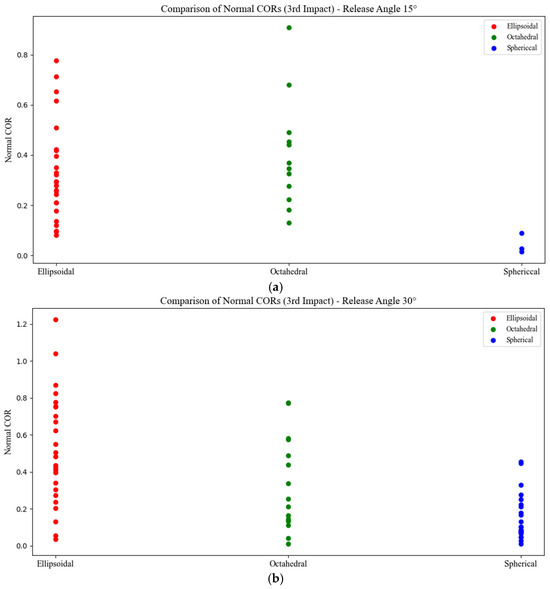
Figure 15.
The scatter plots showcasing the normal COR values after the third impact for different shapes at the release angles of (a) 15° and (b) 30°.
3.2.4. Runout Distance and Lateral Dispersion
The analysis also included a comparison of runout distances across the three rock shapes and two release angles. At a 15° release angle, ellipsoidal rocks exhibited relatively consistent runout distances, ranging from about 1.25 m to 1.54 m, with a mean of approximately 1.39 m and a standard deviation near 0.08 m. This apparent uniformity is likely due to their tendency to dissipate energy laterally, resulting in significant side-to-side motion rather than extended forward travel. In contrast, spherical rocks showed slightly more variability, with runout distances spanning from 0.71 m to 1.44 m, a mean of around 1.14 m, and a standard deviation of roughly 0.17 m, indicating more stable but less uniform forward motion. Octahedral rocks demonstrated the most erratic horizontal behavior, with distances ranging from 0.92 m to over 2.6 m, a mean close to 1.66 m, and a high standard deviation of approximately 0.43 m. This high variability suggests unstable impact dynamics and rolling behavior. When the release angle was increased to 30°, ellipsoidal rocks showed a significant reduction in mean runout distance, averaging around 0.56 m (range: 0.41 m to 0.77 m, standard deviation ≈ 0.08 m), while still maintaining low variability. This continued consistency likely reflects their lateral energy dispersion. Octahedral rocks, on the other hand, traveled farther on average, with a mean runout distance of about 0.79 m (range: 0.59 m to 0.94 m, standard deviation ≈ 0.10 m). Although still variable, their motion was less erratic than at the 15° angle, suggesting that the increased initial energy may contribute to slightly more stable behavior. In Figure 16, each test is plotted in ascending order of runout distance, with the vertical axis representing test IDs solely for indexing purposes, not to imply any influence of test repetition.
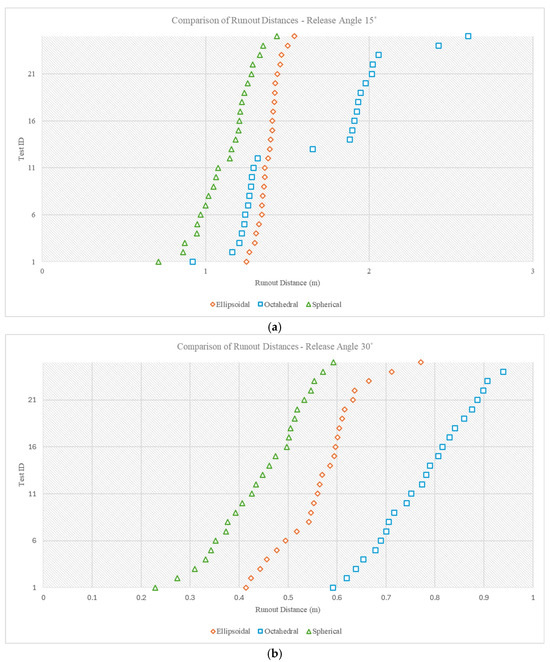
Figure 16.
The comparison of runout distances for different shapes at the release angles of (a) 15° and (b) 30°.
Spherical rocks exhibit the shortest runout distances, averaging around 0.45 m, with slightly higher variability (standard deviation ≈ 0.10 m), suggesting less efficient forward motion even at steeper release angles. Overall, increasing the release angle leads to shorter runout distances for all rock shapes. However, it also influences variability patterns, octahedral rocks become more stable, ellipsoidal rocks continue to show a preference for lateral dispersion, and spherical rocks maintain their short, scattered rollout behavior.
The evaluation of lateral dispersion provides important insights into how rock shape affects rockfall dynamics, with this metric serving as a key indicator of motion unpredictability. Defined as the deviation perpendicular to the main direction of fall, lateral dispersion highlights the chaotic behavior of non-spherical rocks. Their irregular geometries contribute to inconsistent movement patterns, resulting in significantly greater lateral spread compared to spherical samples. The accompanying graphs illustrate this scattered distribution, emphasizing the unpredictable nature of lateral motion in non-spherical shapes (Figure 17).
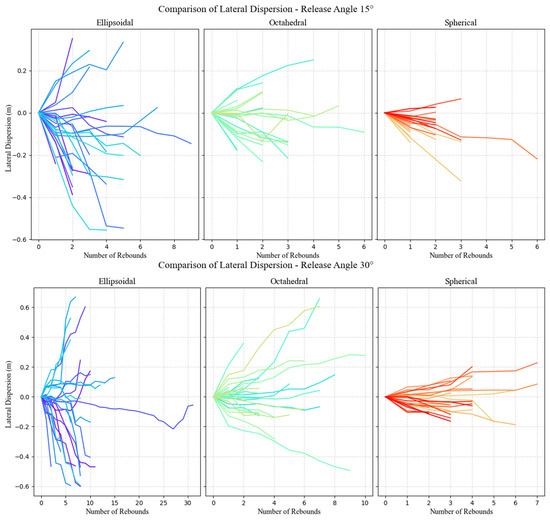
Figure 17.
The lateral dispersion shown by each shape at the two different release angles.
At a 30° release angle, ellipsoidal samples exhibited the greatest degree of scatter, with lateral dispersions ranging from −0.6 to 0.6 m. This broad spread highlights the inherent instability of the ellipsoidal shape upon impact, where even slight variations in contact points or rotational motion can produce significantly different outcomes. Octahedral samples also demonstrated chaotic tendencies, though their dispersion was somewhat less extreme compared to the ellipsoidal rocks.
In contrast, spherical samples maintained a far more consistent lateral trajectory, exhibiting minimal deviation from the primary fall direction. This stability reinforces the strong influence of shape on lateral dispersion, with more irregular geometries introducing greater unpredictability in post-impact motion. The pronounced difference in behavior between spherical and non-spherical shapes underscores how geometry dictates the extent of lateral spread following impact.
4. Conclusions
The analysis of rockfall dynamics is greatly advanced through the implementation of the Video-Assisted Rockfall Kinematics Analysis (VARKA) method. This approach systematically compares the motion of non-spherical rock shapes, specifically ellipsoidal and octahedral shapes, with that of spherical rocks under controlled laboratory conditions. By examining how shape and release angle influence motion behavior, energy loss, and trajectory variability, the study offers valuable insights into the complex dynamics of irregularly shaped rocks and addresses important gaps in current research.
One of the key contributions of this work is the comprehensive assessment of runout distances, angular velocities, and coefficients of restitution (CORs) across different rock geometries and release angles. Non-spherical rocks showed greater variability and unpredictability in their motion. For instance, at a 15° release angle, ellipsoidal rocks had a standard deviation in runout distance of about 0.35 m, while octahedral rocks exceeded 0.42 m. In comparison, spherical rocks exhibited more consistent behavior, with a standard deviation of approximately 0.17 m. At a steeper 30° release angle, ellipsoidal rocks still showed moderate variability (~0.09 m), whereas octahedral rocks displayed increased dispersion (~0.16 m). Spherical rocks remained the most stable, with minimal variation (~0.07 m) across both angles.
The COR analysis further emphasized the erratic nature of non-spherical shapes. Ellipsoidal rocks exhibited a wide range of restitution values, from 0.01 to 0.63, while octahedral rocks showed slightly less variation, with values reaching up to 0.7. In contrast, spherical rocks had a tightly clustered distribution around a mean COR of approximately 0.29 and a standard deviation of 0.1, reflecting their more predictable energy retention. Angular velocity data also highlighted the instability of irregular shapes. At a 15° release angle, ellipsoidal rocks showed angular velocities ranging from −2.0 to +2.5 rad/s, while octahedral rocks at 30° surpassed ±3 rad/s, underscoring the dynamic complexity introduced by non-spherical geometries.
These findings clearly demonstrate the significant impact of rock shape and release conditions on rockfall behavior. Non-spherical rocks consistently showed greater dispersion, erratic rebounds, fluctuating angular velocities, and less predictable trajectories than spherical ones. This underscores the importance of incorporating parameters such as angular velocity, runout variability, and energy restitution into predictive models to more accurately simulate the behavior of irregularly shaped rocks.
The study also highlights the sensitivity of rockfall dynamics to release angle. Irregular shapes exhibited marked changes in motion and angular velocity with increasing angles, revealing the intricate relationship between impact conditions and rotational behavior. This suggests that hazard assessments should consider a range of release scenarios to improve the reliability of predictive models and mitigation strategies.
In addition to the findings, the development of a novel release mechanism was instrumental in maintaining precise control over initial conditions. This setup enabled a thorough investigation of rotational dynamics, energy dissipation, and trajectory variability across multiple impacts, yielding data that can inform improved risk mitigation strategies and enhance rockfall modeling tools [34,35].
Future studies could expand on these results by incorporating additional factors that influence rockfall behavior, such as slope characteristics, real-world terrain features, and a wider variety of rock shapes, materials, and sizes [36]. Broadening the scope in these areas would support the creation of more generalized models that are adaptable to diverse geological settings. Furthermore, examining the effects of material damage, deformation, and fracturing during repeated impacts would provide deeper insights into scenarios where these phenomena are significant. Addressing these aspects would allow future research to refine predictive models, improve hazard assessments, and guide the design of more effective protective measures.
Author Contributions
Conceptualization, M.G. and J.S.; methodology, M.G.; validation, M.G. and J.S.; formal analysis, M.G.; investigation, M.G.; data curation, M.G.; writing—original draft preparation, M.G.; writing—review and editing, M.G. and A.M.-M.; visualization, M.G.; supervision, J.S. All authors have read and agreed to the published version of the manuscript.
Funding
This research was funded by National Institute of Occupational Health and Safety grant number 75D30119C06044.
Data Availability Statement
The data presented in this study are available on request from the corresponding author.
Conflicts of Interest
The authors declare no conflict of interest.
References
- Dorren, L.K.A. A review of rockfall mechanics and modelling approaches. Prog. Phys. Geogr. Earth Environ. 2003, 27, 69–87. [Google Scholar] [CrossRef]
- Yan, P.; Zhang, J.; Kong, X.; Fang, Q. Numerical simulation of rockfall trajectory with consideration of arbitrary shapes of falling rocks and terrain. Comput. Geotech. 2020, 122, 103511. [Google Scholar] [CrossRef]
- Wong, L.N.Y.; Tang, Z. Preliminary estimation of rock-fall lateral dispersion by laboratory test. J. Rock Mech. Geotech. Eng. 2023, 15, 3343–3351. [Google Scholar] [CrossRef]
- Nagendran, S.K.; Ismail, M.A.M. Analysis of Rockfall Hazards Based on the Effect of Rock Size and Shape. Int. J. Civ. Eng. 2019, 17, 1919–1929. [Google Scholar] [CrossRef]
- Shiyake, R.; Krengel, D.; Kikumoto, M. The effect of particle shape on rockfall events. In Proceedings of the 15th World Congress on Computational Mechanics and 8th Asian Pacific Congress on Computational Mechanics, Yokohama, Japan, 31 July–5 August 2022; Volume 1600. [Google Scholar] [CrossRef]
- Zhu, C.; He, M.; Yin, Q.; Zhang, X. Numerical simulation of rockfalls colliding with a gravel cushion with varying thicknesses and particle sizes. Geomech. Geophys. Geo-Energy Geo-Resour. 2021, 7, 11. [Google Scholar] [CrossRef]
- Wright, E.; Quillen, A.C.; Sánchez, P.; Schwartz, S.R.; Nakajima, M.; Askari, H.; Miklavcic, P. Ricochets on Asteroids II: Sensitivity of laboratory experiments of low velocity grazing impacts on substrate grain size. Icarus 2022, 376, 114868. [Google Scholar] [CrossRef]
- Volkwein, A.; Brügger, L.; Gees, F.; Gerber, W.; Krummenacher, B.; Kummer, P.; Lardon, J.; Sutter, T. Repetitive rockfall trajectory testing. Geosciences 2018, 8, 88. [Google Scholar] [CrossRef]
- Pfeiffer, T.J. Rockfall Hazard Analysis Using Computer Simulation of Rockfalls. Ph.D. Thesis, Colorado School of Mines, Golden, CO, USA, 1989. Available online: https://hdl.handle.net/11124/176374 (accessed on 20 November 2024).
- Ushiro, T.; Tsutsui, H. Movement of Rockfall and a Study on Its Prediction. In Proceedings of the International Symposium on Geotechnical & Environmental Challenges in Mountainous Terrain, Kathmandu, Nepal, 6–7 November 2001; pp. 366–375. [Google Scholar]
- Ji, Z.M.; Hu, S.M.; Chen, Z.J.; Niu, Q.H.; Wang, T.H.; Wu, F.Q. Laboratory investigation of the effect of the rotational speed on the coefficient of restitution. Eng. Geol. 2021, 292, 106196. [Google Scholar] [CrossRef]
- Chau, K.T.; Wong, R.H.C.; Wu, J.J. Coefficient of restitution and rotational motions of rockfall impacts. Int. J. Rock Mech. Min. Sci. 2002, 39, 69–77. [Google Scholar] [CrossRef]
- Asteriou, P.; Saroglou, H.; Tsiambaos, G. Geotechnical and kinematic parameters affecting the coefficients of restitution for rock fall analysis. Int. J. Rock Mech. Min. Sci. 2012, 54, 103–113. [Google Scholar] [CrossRef]
- Bi, R.; Li, S.; Liu, G.; Ren, J.; Song, Y. Investigating the Effect of Preimpact Energy Dissipation on Coefficient of Restitution regarding the Slope-Boulder Interaction. Adv. Civ. Eng. 2021, 2021, 9929119. [Google Scholar] [CrossRef]
- Asteriou, P.; Tsiambaos, G. Effect of impact velocity, block mass and hardness on the coefficients of restitution for rockfall analysis. Int. J. Rock Mech. Min. Sci. 2018, 106, 41–50. [Google Scholar] [CrossRef]
- Ge, Y.; Chen, W.; Ye, Y.; Tang, H. Experimental study on the influence of morphological parameters on kinematics of rockfall trajectory. Bull. Eng. Geol. Environ. 2024, 83, 324. [Google Scholar] [CrossRef]
- Shadabfar, M.; Mahsuli, M.; Zhang, Y.; Xue, Y.; Huang, H. Probabilistic data-driven framework for performance assessment of retaining walls against rockfalls. Probabilistic Eng. Mech. 2022, 70, 103339. [Google Scholar] [CrossRef]
- Krengel, D.; Shiyake, R.; Kikumoto, M. Effect of particle shape and initial orientation on the kinematics and runout behavior of rockfalls. Landslides 2024, 21, 1797–1809. [Google Scholar] [CrossRef]
- Chen, Z.; Xu, J.; Tang, X.; Yang, Y. Investigating the influence of collision property and fragmentation on rock fall with 3D ETM modelling. Arab. J. Geosci. 2022, 15, 508. [Google Scholar] [CrossRef]
- Francioni, M.; Antonaci, F.; Sciarra, N.; Robiati, C.; Coggan, J.; Stead, D.; Calamita, F. Application of unmanned aerial vehicle data and discrete fracture network models for improved rockfall simulations. Remote Sens. 2020, 12, 2053. [Google Scholar] [CrossRef]
- Chen, T.; Zhang, G.; Xiang, X. Research on rockfall impact process based on viscoelastic contact theory. Int. J. Impact Eng. 2023, 173, 104431. [Google Scholar] [CrossRef]
- Prades-Valls, A.; Corominas, J.; Lantada, N.; Matas, G.; Núñez-Andrés, M.A. Capturing rockfall kinematic and fragmentation parameters using high-speed camera system. Eng. Geol. 2022, 302, 106629. [Google Scholar] [CrossRef]
- Farmakis, I.; DiFrancesco, P.M.; Hutchinson, D.J.; Vlachopoulos, N. Rockfall detection using LiDAR and deep learning. Eng. Geol. 2022, 309, 106836. [Google Scholar] [CrossRef]
- Farmakis, I.; Hutchinson, D.J.; Vlachopoulos, N.; Westoby, M.; Lim, M. Slope-Scale Rockfall Susceptibility Modeling as a 3D Computer Vision Problem. Remote Sens. 2023, 15, 2712. [Google Scholar] [CrossRef]
- Senanayake, I.P.; Hartmann, P.; Giacomini, A.; Huang, J.; Thoeni, K. Prediction of rockfall hazard in open pit mines using a regression based machine learning model. Int. J. Rock Mech. Min. Sci. 2024, 177, 105727. [Google Scholar] [CrossRef]
- Fanos, A.M.; Pradhan, B. A Spatial Ensemble Model for Rockfall Source Identification from High Resolution LiDAR Data and GIS. IEEE Access 2019, 7, 74570–74585. [Google Scholar] [CrossRef]
- Huang, S.; Lyu, Y.; Peng, Y.; Huang, M. Analysis of Factors Influencing Rockfall Runout Distance and Prediction Model Based on an Improved KNN Algorithm. IEEE Access 2019, 7, 66739–66752. [Google Scholar] [CrossRef]
- Blanco, L.; García-Sellés, D.; Guinau, M.; Zoumpekas, T.; Puig, A.; Salamó, M.; Gratacós, O.; Muñoz, J.A.; Janeras, M.; Pedraza, O. Machine Learning-Based Rockfalls Detection with 3D Point Clouds, Example in the Montserrat Massif (Spain). Remote Sens. 2022, 14, 4306. [Google Scholar] [CrossRef]
- Dussauge-Peisser, C.; Helmstetter, A.; Grasso, J.R.; Hantz, D.; Desvarreux, P.; Jeannin, M.; Giraud, A. Probabilistic approach to rock fall hazard assessment: Potential of historical data analysis. Nat. Hazards Earth Syst. Sci. 2002, 2, 15–26. [Google Scholar] [CrossRef]
- Ghahramanieisalou, M.; Sattarvand, J. Rockfall Dynamics Prediction Using Data-Driven Approaches: A Lab-Scale Study. Geotechnics 2025, 5, 13. [Google Scholar] [CrossRef]
- Brown, D.; Hanson, R.; Christian, W. Tracker Video Analysis and Modeling Tool, Version 6.2.0; Computer Software. Available online: https://physlets.org/tracker/ (accessed on 14 December 2024).
- Wyllie, D.C. Rock Fall Engineering; CRC Press: Boca Raton, FL, USA, 2014. [Google Scholar] [CrossRef]
- Cross, R. Bounce of an oval shaped football. Sports Technol. 2010, 3, 168–180. [Google Scholar] [CrossRef]
- Ghahramanieisalou, M.; Sattarvand, J. Digital Twins and the Mining Industry. In Technologies in Mining; IntechOpen: London, UK, 2024. [Google Scholar] [CrossRef]
- Ghahramanieisalou, M.; Sattarvand, J. Applications of digital twin technology in productivity optimization of mining operations. In Applications for Computers and Operations Research in the Minerals Industries; Routledge: London, UK, 2023. [Google Scholar]
- Ghahramanieisalou, M.; Sattarvand, J.; Abbasi, B.; Peik, B.; Battulwar, R. Analysis of Rockfall Risk Using Image Analysis and Data-Driven Models. In Proceedings of the 58th U.S. Rock Mechanics/Geomechanics Symposium, Golden, CO, USA, 23–26 June 2024. [Google Scholar] [CrossRef]
Disclaimer/Publisher’s Note: The statements, opinions and data contained in all publications are solely those of the individual author(s) and contributor(s) and not of MDPI and/or the editor(s). MDPI and/or the editor(s) disclaim responsibility for any injury to people or property resulting from any ideas, methods, instructions or products referred to in the content. |
© 2025 by the authors. Licensee MDPI, Basel, Switzerland. This article is an open access article distributed under the terms and conditions of the Creative Commons Attribution (CC BY) license (https://creativecommons.org/licenses/by/4.0/).